Embed Size (px)
Citation preview

TechnicalReportOntheMineralResourcesandReservesof
theRiotintoCopperProject
LocatedinHuelvaProvince,Spain
PreparedFor
AtalayaMiningPlcRegistered Office 1, Lambousa Street
Nicosia 1095, Cyprus
Mine Office La Dehesa s/n
Minas de Riotinto, 21660 Huelva, Spain
By
AlanC.Noble,PEOreReservesEngineering12254ApplewoodKnollsDrive
Lakewood,CO80215303‐237‐8271
Inassociationwith
WilliamRose,P.E.
WLRConsulting,Inc.Lakewood,Colorado80232
303‐980‐8528
JayeTPickarts,P.E.Littleton,Colorado80128
303‐570‐3370
JuanJAnes,P.Eng40956St
Delta,BC,Canada,V4L1Z5778‐875‐3676
September2016
TechnicalReportontheMineralResourcesandReservesoftheRiotintoCopperProject
Pagei
OreReservesEngineering September2016
E R
O
1 EXECUTIVE SUMMARY ................................................................................................................... 1‐1 1.1 Project Overview and Introduction ............................................................................................ 1‐1 1.2 Property Description and Location ............................................................................................ 1‐1 1.3 Riotinto Copper Project Area ..................................................................................................... 1‐2 1.4 History ........................................................................................................................................ 1‐2 1.5 Geology and Reserves ................................................................................................................ 1‐3 1.6 Deposit Types ............................................................................................................................. 1‐5 1.7 Drilling and Exploration .............................................................................................................. 1‐5 1.8 Mineral Resource ....................................................................................................................... 1‐6 1.9 Mineral Reserves & Mining ........................................................................................................ 1‐7 1.10 Mineral Processing and Recovery Methods .............................................................................. 1‐8 1.11 Infrastructure ............................................................................................................................. 1‐9 1.12 Market Studies and Contracts .................................................................................................. 1‐10 1.13 Environmental Studies, Permitting, and Social or Community Impact .................................... 1‐10 1.14 Capital and Operating Costs ..................................................................................................... 1‐12 1.15 Life of Mine Capital Costs ........................................................................................................ 1‐12 1.16 Life of Mine Operating Costs .................................................................................................... 1‐14 1.17 Economic Analysis .................................................................................................................... 1‐14 1.18 Conclusions and Recommendations ........................................................................................ 1‐15
2 INTRODUCTION AND TERMS OF REFERENCE ............................................................................... 2‐16 2.1 Background Information and Terms of Reference .................................................................. 2‐16 2.2 Scope of Work .......................................................................................................................... 2‐17 2.3 Sources of Information and Data ............................................................................................. 2‐17 2.4 Definitions and Units of Measure ............................................................................................ 2‐17
3 RELIANCE ON OTHER EXPERTS ....................................................................................................... 3‐1 4 PROPERTY DESCRIPTION AND LOCATION ...................................................................................... 4‐1 4.1 Riotinto Copper Project Area ..................................................................................................... 4‐2 4.2 Land Position at Riotinto ............................................................................................................ 4‐2
5 ACCESSIBILITY, CLIMATE, LOCAL RESOURCES, INFRASTRUCTURE AND PHYSIOGRAPHY .............. 5‐1 5.1 Accessibility ................................................................................................................................ 5‐1 5.2 Climate and Physiography .......................................................................................................... 5‐1
5.2.1 Local Resources and Infrastructure ................................................................................... 5‐1 5.2.2 Physiography ...................................................................................................................... 5‐1
6 HISTORY ......................................................................................................................................... 6‐2 6.1 Mining Operations ..................................................................................................................... 6‐3
6.1.1 Cerro Colorado Mine .......................................................................................................... 6‐3 6.1.2 The Filón Norte & Filón Sur Areas (1874 ‐1973) ................................................................ 6‐5
7 GEOLOGICAL SETTING AND MINERALIZATION .............................................................................. 7‐1 7.1 Regional Geology ....................................................................................................................... 7‐1 7.2 Geology of the Riotinto Deposit ................................................................................................ 7‐2
7.2.1 Stratigraphy ........................................................................................................................ 7‐2 7.2.2 Structure ............................................................................................................................ 7‐2 7.2.3 Metamorphism .................................................................................................................. 7‐2
TechnicalReportontheMineralResourcesandReservesoftheRiotintoCopperProject
Pageii
OreReservesEngineering September2016
E R
O
7.2.4 Mineralization .................................................................................................................... 7‐2 8 DEPOSIT TYPES ............................................................................................................................... 8‐1 9 EXPLORATION ................................................................................................................................ 9‐1
9.1.1 Geophysics ......................................................................................................................... 9‐3 9.1.2 Northern Zone .................................................................................................................... 9‐5 9.1.3 Filon Sur (depth and west extension) ................................................................................ 9‐6 9.1.4 Filon Sur (east extension) and Masa Valle ......................................................................... 9‐6 9.1.5 San Antonio ........................................................................................................................ 9‐8 9.1.6 San Dionisio‐Atalaya .......................................................................................................... 9‐9
10 DRILLING ...................................................................................................................................... 10‐1 10.1 Resource Drilling ...................................................................................................................... 10‐1
10.1.1 Metallurgical Drilling Program ......................................................................................... 10‐3 10.1.2 Infill Program .................................................................................................................... 10‐5 10.1.3 Dehesa‐Lago ..................................................................................................................... 10‐6 10.1.4 Inferred Program .............................................................................................................. 10‐7 10.1.5 Argamasillas ..................................................................................................................... 10‐8 10.1.6 As, Sb Drilling Programs ................................................................................................... 10‐9 10.1.7 San Lucas ........................................................................................................................ 10‐10
10.2 Exploration Drilling ................................................................................................................. 10‐11 11 SAMPLE PREPARATION, ANALYSIS, AND MINERALIZATION ........................................................ 11‐1 11.1 Historical Drilling ...................................................................................................................... 11‐1 11.2 Atalaya Drilling ......................................................................................................................... 11‐1 11.3 Site Preparation ....................................................................................................................... 11‐1 11.4 Logging and Sampling Procedures ........................................................................................... 11‐1
11.4.1 RC Samples ....................................................................................................................... 11‐2 11.4.2 Core Samples .................................................................................................................... 11‐4 11.4.3 Labeling ............................................................................................................................ 11‐4
11.5 Density Measurements ............................................................................................................ 11‐4 11.6 QA/QC ...................................................................................................................................... 11‐5
11.6.1 QC charts .......................................................................................................................... 11‐5 11.6.2 RC Drilling Recovery Charts .............................................................................................. 11‐8
12 DATA VERIFICATION ..................................................................................................................... 12‐1 12.1 Drill Hole Assays ....................................................................................................................... 12‐1 12.2 Geologic Data ........................................................................................................................... 12‐1 12.3 Drill Hole Database .................................................................................................................. 12‐2 12.4 Density Data ............................................................................................................................. 12‐2 12.5 Topographic Data ..................................................................................................................... 12‐2
13 MINERAL PROCESSING AND METALLURGICAL TESTING .............................................................. 13‐3 13.1 Summary .................................................................................................................................. 13‐3 13.2 Comminution Energy Consumption ......................................................................................... 13‐3 13.3 Flotation Testwork ................................................................................................................... 13‐3 13.4 Concentrate Rheology Testing ................................................................................................. 13‐5 13.5 Concentrate Filtration .............................................................................................................. 13‐6 13.6 Tailings Testing ......................................................................................................................... 13‐6
14 MINERAL RESOURCE ESTIMATES ................................................................................................. 14‐1

TechnicalReportontheMineralResourcesandReservesoftheRiotintoCopperProject
Pageiii
OreReservesEngineering September2016
E R
O
14.1 Resource Block Model .............................................................................................................. 14‐1 14.2 Drill Hole Sample Database ...................................................................................................... 14‐1
14.2.1 Database Content ............................................................................................................ 14‐1 14.3 Bulk Density ............................................................................................................................. 14‐2
14.3.1 Density Studies ................................................................................................................. 14‐2 14.3.2 Resource Model Density .................................................................................................. 14‐3
14.4 Topographic Model .................................................................................................................. 14‐4 14.5 Mined‐out Model ..................................................................................................................... 14‐4 14.6 Geologic Model ........................................................................................................................ 14‐5
14.6.1 Acid Zone .......................................................................................................................... 14‐5 14.6.2 Basic Zone ........................................................................................................................ 14‐5 14.6.3 Unfolding .......................................................................................................................... 14‐5
14.7 Compositing ............................................................................................................................. 14‐6 14.8 Copper Grade‐Zone Models ..................................................................................................... 14‐6
14.8.1 Copper Grade Distributions ............................................................................................. 14‐6 14.9 Sulfur Grade Distribution ....................................................................................................... 14‐10 14.10 Variograms ............................................................................................................................. 14‐12 14.11 Grade Models ......................................................................................................................... 14‐20
14.11.1 Search Ellipse Parameters .......................................................................................... 14‐20 14.11.2 Copper Grade Estimation ........................................................................................... 14‐20
14.12 Resource Classification .......................................................................................................... 14‐23 14.13 Resource Summary ................................................................................................................ 14‐23 14.14 Discussion of Factors Affecting Resources ............................................................................. 14‐25
15 MINERAL RESERVE ESTIMATES .................................................................................................... 15‐1 15.1 Definitions ................................................................................................................................ 15‐1 15.2 Reserve Estimation Parameters ............................................................................................... 15‐2
15.2.1 Metallurgical Recoveries .................................................................................................. 15‐2 15.2.2 Royalties, Payables and Operating Costs ......................................................................... 15‐2 15.2.3 Overall Slope Angles......................................................................................................... 15‐3 15.2.4 Bulk Densities ................................................................................................................... 15‐3 15.2.5 Dilution and Ore Loss ....................................................................................................... 15‐3
15.3 Economic Pit Limit Analyses ..................................................................................................... 15‐3 15.3.1 Price Sensitivities ............................................................................................................. 15‐4 15.3.2 Operating Cost Sensitivities ............................................................................................. 15‐5 15.3.3 Present Value Optimized Case for Open Pit Design ......................................................... 15‐7
15.4 Open Pit Designs ...................................................................................................................... 15‐7 15.4.1 Design Parameters ........................................................................................................... 15‐7 15.4.2 Ultimate Pit ...................................................................................................................... 15‐9
15.5 Mineral Reserve Statement ..................................................................................................... 15‐9 15.5.1 Cutoff Grades ................................................................................................................... 15‐9 15.5.2 Mineral Reserve Estimate .............................................................................................. 15‐10 15.5.3 Sensitivity of Reserves to other Factors ......................................................................... 15‐12
16 MINING METHODS ....................................................................................................................... 16‐1 16.1 Mining Phase Designs .............................................................................................................. 16‐1
16.1.1 Phase Design Parameters................................................................................................. 16‐1

TechnicalReportontheMineralResourcesandReservesoftheRiotintoCopperProject
Pageiv
OreReservesEngineering September2016
E R
O
16.1.2 Internal Mining Phases..................................................................................................... 16‐2 16.1.3 Estimation of Contained Mineral Resources by Phase .................................................... 16‐6
16.2 Mine Production Schedule ....................................................................................................... 16‐6 16.2.1 Optimum Cutoff Grade Analysis ...................................................................................... 16‐6 16.2.2 Production Scheduling Parameters .................................................................................. 16‐8 16.2.3 Mine Production Schedule Summary .............................................................................. 16‐8 16.2.4 Projected Mine Life ........................................................................................................ 16‐10
16.3 Waste Rock Storage Facilities ................................................................................................ 16‐10 16.3.1 WRSF Design Parameters ............................................................................................... 16‐10 16.3.2 Ultimate WRSF Plan ....................................................................................................... 16‐11 16.3.3 WRSF Capacity Estimate ................................................................................................ 16‐12
16.4 Mining Equipment .................................................................................................................. 16‐13 16.5 Mining Personnel ................................................................................................................... 16‐14 16.6 Old Workings .......................................................................................................................... 16‐14
17 RECOVERY METHODS ................................................................................................................... 17‐1 17.1 Process Summary ..................................................................................................................... 17‐1 17.2 Riotinto Phase 1 ....................................................................................................................... 17‐3 17.3 Riotinto Phase 2 ....................................................................................................................... 17‐3 17.4 Process Description .................................................................................................................. 17‐4 17.5 Crushing ................................................................................................................................... 17‐4 17.6 Grinding .................................................................................................................................... 17‐5 17.7 Flotation ................................................................................................................................... 17‐5 17.8 Concentrate Thickening and Filtration..................................................................................... 17‐6 17.9 Production Data ....................................................................................................................... 17‐7 17.10 Control Philosophy ................................................................................................................. 17‐10 17.11 Production Support ................................................................................................................ 17‐11
17.11.1 Manpower .................................................................................................................. 17‐12 18 INFRASTRUCTURE ........................................................................................................................ 18‐1 18.1 Access by Road ......................................................................................................................... 18‐1 18.2 Electrical Supply ....................................................................................................................... 18‐1 18.3 Water Systems ......................................................................................................................... 18‐1 18.4 Tailings Management Facility .................................................................................................. 18‐2 18.5 Fire Protection ......................................................................................................................... 18‐5 18.6 Other Environmental Aspects .................................................................................................. 18‐5 18.7 Warehouses ............................................................................................................................. 18‐5 18.8 Maintenance Facilities ............................................................................................................. 18‐5 18.9 Rehabilitation Program ............................................................................................................ 18‐6 18.10 Expansion Program .................................................................................................................. 18‐6
19 MARKET STUDIES AND CONTRACTS ............................................................................................ 19‐1 19.1 Introduction ............................................................................................................................. 19‐1 19.2 Supply and Demand ................................................................................................................. 19‐1 19.3 Sales of Concentrates ............................................................................................................... 19‐1
20 ENVIRONMENTAL STUDIES, PERMITTING, SOCIAL AND COMMUNITY IMPACTS ........................ 20‐1 20.1 Environmental Status & Legacy ............................................................................................... 20‐1 20.2 Environmental Management System ...................................................................................... 20‐1
TechnicalReportontheMineralResourcesandReservesoftheRiotintoCopperProject
Pagev
OreReservesEngineering September2016
E R
O
20.3 Applicable Legislation .............................................................................................................. 20‐1 20.4 Environmental & Cultural Approvals ....................................................................................... 20‐2 20.5 Autorización Ambiental Unificada (AAU) ................................................................................. 20‐2 20.6 Monitoring ............................................................................................................................... 20‐3 20.7 Waste Rock Storage Facilities .................................................................................................. 20‐3 20.8 Tailings Management Facility .................................................................................................. 20‐5 20.9 Other Wastes ........................................................................................................................... 20‐5 20.10 Water Systems ......................................................................................................................... 20‐5 20.11 Air, Noise, and Vibration .......................................................................................................... 20‐6 20.12 Ecology ..................................................................................................................................... 20‐6 20.13 Cultural Heritage ...................................................................................................................... 20‐6 20.14 Final Restoration Plan (FRP) ..................................................................................................... 20‐7
20.14.1 Scope ............................................................................................................................ 20‐8 20.15 Reclamation plan ................................................................................................................... 20‐10 20.16 Health and Safety ................................................................................................................... 20‐11 20.17 Human Resources .................................................................................................................. 20‐12 20.18 Contracting and Training ........................................................................................................ 20‐13 20.19 Labor Relations ...................................................................................................................... 20‐13 20.20 Public Relations ...................................................................................................................... 20‐13
21 CAPITAL AND OPERATING COSTS ................................................................................................ 21‐1 21.1 Assumptions ............................................................................................................................. 21‐1 21.2 Life of Mine Production ........................................................................................................... 21‐2 21.3 Life of Mine Capital Costs ........................................................................................................ 21‐2 21.4 Life of Mine Operating Costs .................................................................................................... 21‐3 21.5 Taxes and Royalties .................................................................................................................. 21‐3
21.5.1 Royalties ........................................................................................................................... 21‐3 21.5.2 Taxes ................................................................................................................................ 21‐3
22 ECONOMIC ANALYSIS ................................................................................................................... 22‐1 22.1 Forecast Results and Sensitivities ............................................................................................ 22‐1
23 ADJACENT PROPERTIES ................................................................................................................ 23‐2 23.1 Other Deposits within the Riotinto Concession ....................................................................... 23‐2
23.1.1 San Dionisio Deposit ......................................................................................................... 23‐2 23.1.2 Filón Sur deposit .............................................................................................................. 23‐3 23.1.3 Planes‐San Antonio Deposit ............................................................................................. 23‐3
23.2 Adjacent Properties ................................................................................................................. 23‐4 24 OTHER RELEVANT DATA AND INFORMATION ............................................................................. 24‐1 25 INTERPRETATIONS AND CONCLUSIONS ....................................................................................... 25‐1 25.1 Resource Estimation ................................................................................................................ 25‐1
25.1.1 Resource Risks and Opportunities ................................................................................... 25‐1 25.2 Mining ...................................................................................................................................... 25‐1
25.2.1 Risks.................................................................................................................................. 25‐1 25.2.2 Opportunities ................................................................................................................... 25‐2
26 RECOMMENDATIONS................................................................................................................... 26‐1 27 REFERENCES ................................................................................................................................. 27‐1 28 QUALIFIED PERSONS .................................................................................................................... 28‐2

TechnicalReportontheMineralResourcesandReservesoftheRiotintoCopperProject
Pagevi
OreReservesEngineering September2016
E R
O
Figures
Figure 1.1 ‐ Mines in the Iberian pyrite belt (Atalaya 2016 from Google) .............................................. 1‐1 Figure 1.2 – Map of Regional Geology (IGME 2013) ............................................................................... 1‐4 Figure 4.1 – Mines in the Iberian pyrite belt (Atalaya 2016 from Google) .............................................. 4‐1 Figure 4.2 – Location and ownership of the Riotinto Copper Project (Atalaya, 2016) ........................... 4‐3 Figure 6.1 – Cerro Colorado mine (EMED 2012) ..................................................................................... 6‐4 Figure 6.2 ‐ Cerro Colorado Open Pit (EMED 2012) ................................................................................ 6‐5 Figure 7.1 – Map of Regional Geology .................................................................................................... 7‐1 Figure 7.2 – Stratigraphy of Riotinto ....................................................................................................... 7‐4 Figure 7.3 – Geological map of the Riotinto Deposit (IGME 2013) ......................................................... 7‐5 Figure 7.4 – Geological sections .............................................................................................................. 7‐1 Figure 7.5 – Schematic N‐S cross‐section through the Cerro Colorado deposit (EMED 2012) ................ 7‐4 Figure 9.1 ‐ Exploration and Drilling Activities (Atalaya 2016)................................................................ 9‐2 Figure 9.2 – Areas surveyed by Geophysics (AMT) ................................................................................ 9‐4 Figure 9.3 – AMT cross section 6 ............................................................................................................ 9‐5 Figure 9.4 – Section 71400E is the Filon Sur and Masa Valle ore zones ................................................ 9‐7 Figure 9.5 – San Antonio Deposit ............................................................................................................ 9‐8 Figure 10.1 – Resource Drilling Zones .................................................................................................. 10‐2 Figure 10.2 – The holes were located next to the main mineralized bodies. ....................................... 10‐4 Figure 10.3 – RC drilling grid ................................................................................................................. 10‐5 Figure 10.4 – Dehesa‐Lago ore zones ................................................................................................... 10‐6 Figure 10.5 – Inferred Drilling Targets .................................................................................................. 10‐7 Figure 10.6 – Argamasillas Program ..................................................................................................... 10‐8 Figure 10.7 ‐ As, Sb Drilling Program .................................................................................................... 10‐9 Figure 10.8 ‐ San Lucas Program ......................................................................................................... 10‐10 Figure 10.9 ‐ Exploration Drilling Locations ........................................................................................ 10‐12 Figure 11.1 – Sampling Flow Chart ........................................................................................................ 11‐3 Figure 11.2 ‐ Results for Standard ETR 072 Cu ...................................................................................... 11‐5 Figure 11.3 ‐ Results for Standard ETR 076 Cu ...................................................................................... 11‐6 Figure 11.4 ‐ Results for Standard ETR 078 CU ..................................................................................... 11‐6 Figure 11.5 ‐ Results for Standard ETR 68 Cu ........................................................................................ 11‐7 Figure 11.6 ‐ RC Recovery for Drill Holes RT244, RT245, and RT246 (Atalaya 2016) ........................... 11‐8 Figure 11.7 ‐ RC Recovery for Drill Holes RT247, RT248, and RT249 (Atalaya 2016) ........................... 11‐9 Figure 11.8 ‐ RC Recovery for Drill Holes RT250, RT251, and RT252 (Atalaya 2016) .......................... 11‐10 Figure 11.9 ‐ RC Recovery for Drill Holes RT253, RT254, and RT255 (Atalaya 2016) ......................... 11‐11 Figure 13.1 – Settling curves and final compacted solids for Atalaya Tailings (Golder 2015) .............. 13‐7 Figure 14.1 ‐ Correlation between Specific Gravity and Sulfur Grade – 2000 Data .............................. 14‐2 Figure 14.2 ‐ Correlation between Specific Gravity and Sulfur Grade – 2010 Data .............................. 14‐3 Figure 14.3 ‐ Lognormal probability and histogram plots of Cu grade in the Acid Zone ...................... 14‐8 Figure 14.4 ‐ Probability that a Composite is in the High‐Grade Population ........................................ 14‐9 Figure 14.5 ‐ Sulfur Grade Distribution in the Acid Zone .................................................................... 14‐11 Figure 14.6 ‐ Variograms for Acid‐Zone Cu Grade in ETRS Coordinates‐ All Data .............................. 14‐14 Figure 14.7 ‐ Variograms for Acid‐Zone Cu Grade in Unfolded Coordinates‐ All Data ....................... 14‐15 Figure 14.8 ‐ Variograms for Acid‐Zone Cu Grade in Unfolded Coordinates‐ High‐Grade Zone ........ 14‐16 Figure 14.9 ‐ Variograms for Acid‐Zone Cu Grade in Unfolded Coordinates‐ Mid‐Grade Zone ......... 14‐17
TechnicalReportontheMineralResourcesandReservesoftheRiotintoCopperProject
Pagevii
OreReservesEngineering September2016
E R
O
Figure 14.10 ‐ Variograms for Acid‐Zone Cu Grade in Unfolded Coordinates‐ Low‐Grade Zone ....... 14‐18 Figure 14.11 ‐ Variograms for Acid‐Zone Sulfur Grade in Unfolded Coordinates‐ No‐Grade Zones .. 14‐19 Figure 15.1 ‐ LG Price Sensitivity Tonnage and Cu Grade Curves ......................................................... 15‐5 Figure 15.2 ‐ LG Operating Cost Sensitivity Tonnage and Cu Grade Curves at $2.60/lb. Cu ................ 15‐6 Figure 15.3 ‐ Cerro Colorado Ultimate Pit Plan ..................................................................................... 15‐9 Figure 16.1 ‐ Mining Phase 1 ................................................................................................................. 16‐3 Figure 16.2 ‐ Mining Phase 2 ................................................................................................................. 16‐3 Figure 16.3 ‐ Mining Phase 3 ................................................................................................................. 16‐4 Figure 16.4 ‐ Mining Phase 4 ................................................................................................................. 16‐4 Figure 16.5 ‐ Mining Phase 5 (Filon Sur) ............................................................................................... 16‐5 Figure 16.6 ‐ Mining Phase 6 (Ultimate Pit) .......................................................................................... 16‐5 Figure 16.7 ‐ Optimum Cutoff Grade Analysis Results .......................................................................... 16‐7 Figure 16.8 ‐ Ultimate WRSF Plans ...................................................................................................... 16‐12 Figure 17.1 – Simplified Flowsheet (Atalaya 2016) ............................................................................... 17‐9 Figure 18.1 – Layout of tailings management facility ........................................................................... 18‐4 Figure 20.1 – Project Restoration Boundary ......................................................................................... 20‐9 Figure 22.1 ‐ Sensitivity Analyses .......................................................................................................... 22‐1 Figure 23.1 – Pozo Alfredo underground mine. .................................................................................... 23‐3 Figure 23.2 – S‐N cross‐section through the Planes‐San‐Antonio deposit ............................................. 23‐4 Figure 23.3 – Adjacent Properties ......................................................................................................... 23‐6

TechnicalReportontheMineralResourcesandReservesoftheRiotintoCopperProject
Pageviii
OreReservesEngineering September2016
E R
O
Tables
Table 1.1 ‐ Riotinto Project ‐ Resource Summary‐ .................................................................................. 1‐6 Table 1.2 ‐ Riotinto Project ‐ Resource Summary Using Multiple Cutoffs ‐ ............................................ 1‐7 Table 1.3 ‐ Mine Production Schedule .................................................................................................... 1‐8 Table 1.4 ‐ Mineral Reserve Estimate by Reserve Classification ............................................................. 1‐8 Table 1.5 – Life of Mine Production (total) ........................................................................................... 1‐12 Table 1.6 – Life of Mine Operating Costs .............................................................................................. 1‐14 Table 6.1 – Historical Production ‐ Filón Norte and Filón Sur mines (EMED, 2007) ............................... 6‐6 Table 7.1 – Riotinto Deposit Stratigraphic Units ..................................................................................... 7‐3 Table 9.1 – Best Drill Intercepts .............................................................................................................. 9‐6 Table 9.2 – Drill Intercepts over 0.25% Cu .............................................................................................. 9‐9 Table 10.1‐ Resource Drilling Summary EMED Technical Report February 2013 ................................ 10‐1 Table 10.2 ‐ Resource Drilling Summary Atalaya Mining 2014‐2016 .................................................. 10‐1 Table 10.3 – Resource Drilling for 2014‐2016 ...................................................................................... 10‐2 Table 10.4 – Exploration Drilling ......................................................................................................... 10‐11 Table 13.1 ‐ Concentrate Properties for two Atalaya mining Samples ................................................. 13‐5 Table 13.2 ‐ Plastic Viscosity and Yield Stress ....................................................................................... 13‐5 Table 13.3 ‐ Concentrate thickener parameters ................................................................................... 13‐5 Table 13.4 ‐ Campaign 1 Filtration Tests ............................................................................................... 13‐6 Table 13.5 ‐ Campaign 2 Filtration Tests ............................................................................................... 13‐6 Table 13.6 ‐ Atalaya Tailings Particle size distribution .......................................................................... 13‐7 Table 13.7 ‐ Geotechnical Parameters .................................................................................................. 13‐8 Table 14.1 ‐ Resource Model Size and Location Parameters ................................................................ 14‐1 Table 14.2 ‐ Summary of Drilling used for Resource Estimation .......................................................... 14‐2 Table 14.3 ‐ Grade‐Zone Parameters for Block Model and Composites ............................................. 14‐10 Table 14.4 ‐ Grade‐Zone NN Search Ellipses ....................................................................................... 14‐10 Table 14.5 ‐ Summary of Variogram Models ...................................................................................... 14‐13 Table 14.6 ‐ Search Ellipse Parameters ............................................................................................... 14‐20 Table 14.7 ‐ IDP Estimation Powers by Grade Zone ............................................................................ 14‐21 Table 14.8 ‐ Details of Reconciliations for IDP, OK, and NN Models ................................................... 14‐22 Table 14.9 ‐ Comparison of Unconstrained Measured and Indicated Resources ............................... 14‐23 Table 14.10 ‐ Resource Classification Parameters .............................................................................. 14‐23 Table 14.11 ‐ Riotinto Project ‐ Resource Summary‐ .......................................................................... 14‐24 Table 14.12 ‐ Riotinto Project ‐ Resource Summary Using Multiple Cutoffs ‐ .................................... 14‐25 Table 15.1 ‐ Ore Definition Parameters ................................................................................................ 15‐2 Table 15.2 ‐ Overall Slope Angles Used in Pit Limit Analyses ................................................................ 15‐3 Table 15.3 ‐Lerchs‐Grossmann Cu Price Sensitivity Analyses ............................................................... 15‐4 Table 15.4 ‐ LG Operating Cost Sensitivity Analyses at $2.60/lb. Cu .................................................... 15‐6 Table 15.5 ‐ Undiscounted and Discounted LG Results at $2.60/lb. Cu................................................ 15‐7 Table 15.6 ‐ Basic Pit Design Parameters .............................................................................................. 15‐8 Table 15.7 ‐ Pit Slope Design Parameters ............................................................................................. 15‐8 Table 15.8 ‐ Cutoff Grades by Year ..................................................................................................... 15‐10 Table 15.9 ‐ Proven Mineral Reserve Estimate ................................................................................... 15‐11 Table 15.10 ‐ Probable Mineral Reserve Estimate .............................................................................. 15‐11 Table 15.11 ‐ Combined Proven and Probable Mineral Reserve Estimate ......................................... 15‐12 Table 16.1 ‐ Basic Pit Design Parameters .............................................................................................. 16‐2 Table 16.2 ‐ Pit Slope Design Parameters ............................................................................................. 16‐2

TechnicalReportontheMineralResourcesandReservesoftheRiotintoCopperProject
Pageix
OreReservesEngineering September2016
E R
O
Table 16.3 ‐ Economic Parameters for Optimum Cutoff Grade Analysis .............................................. 16‐6 Table 16.4 ‐ Mill Feed Rates .................................................................................................................. 16‐8 Table 16.5 ‐ Mine Production Schedule Summary ................................................................................ 16‐9 Table 16.6 ‐ Ex‐Pit WRSF Design Parameters ...................................................................................... 16‐11 Table 16.7 ‐ Estimated WRSF Capacities ............................................................................................. 16‐13 Table 16.8 ‐ Primary Mining Fleet ....................................................................................................... 16‐13 Table 16.9 ‐ Auxiliary Mining Fleet ...................................................................................................... 16‐14 Table 16.10 ‐ Mining‐Related Personnel ............................................................................................. 16‐14 Table 17.1 – Summary of CCW and CCE Ore Characteristics (EMED 2013) .......................................... 17‐2 Table 17.2 – Expansion Design Criteria ................................................................................................. 17‐4 Table 17.3 ‐ YTD Production* ................................................................................................................ 17‐8 Table 17.4 – Process Plant Manpower ................................................................................................ 17‐12 Table 19.1 – Copper concentrate typical assay .................................................................................... 19‐2 Table 21.1 ‐ Assumptions ...................................................................................................................... 21‐1 Table 21.2 – Life of Mine Production (total) ......................................................................................... 21‐2 Table 21.3 – Capital Expenditure to Date, US$ ..................................................................................... 21‐2 Table 21.4 ‐ Life of Mine Operating Costs ............................................................................................. 21‐3 Table 22.1 – Cash Flow Forecast ........................................................................................................... 22‐2 Table 22.2 ‐ Key Performance Parameters ........................................................................................... 22‐1 Table 23.1 – Adjacent Properties .......................................................................................................... 23‐5
TechnicalReportontheMineralResourcesandReservesoftheRiotintoCopperProject
Page1‐1
OreReservesEngineering September2016
E R
O
1 EXECUTIVESUMMARY
1.1 ProjectOverviewandIntroductionAtalaya Mining Plc. is a European mining and development company producing copper concentrate from the Riotinto deposit in southern Spain. Following 18 months of refurbishment and commissioning, the processing plant is operating at the design capacity. An updated mineral reserves and resources estimate has been completed based on the mined surface of the open pit as of 30 April 2016 and a deposit model dated 3 May 2016.
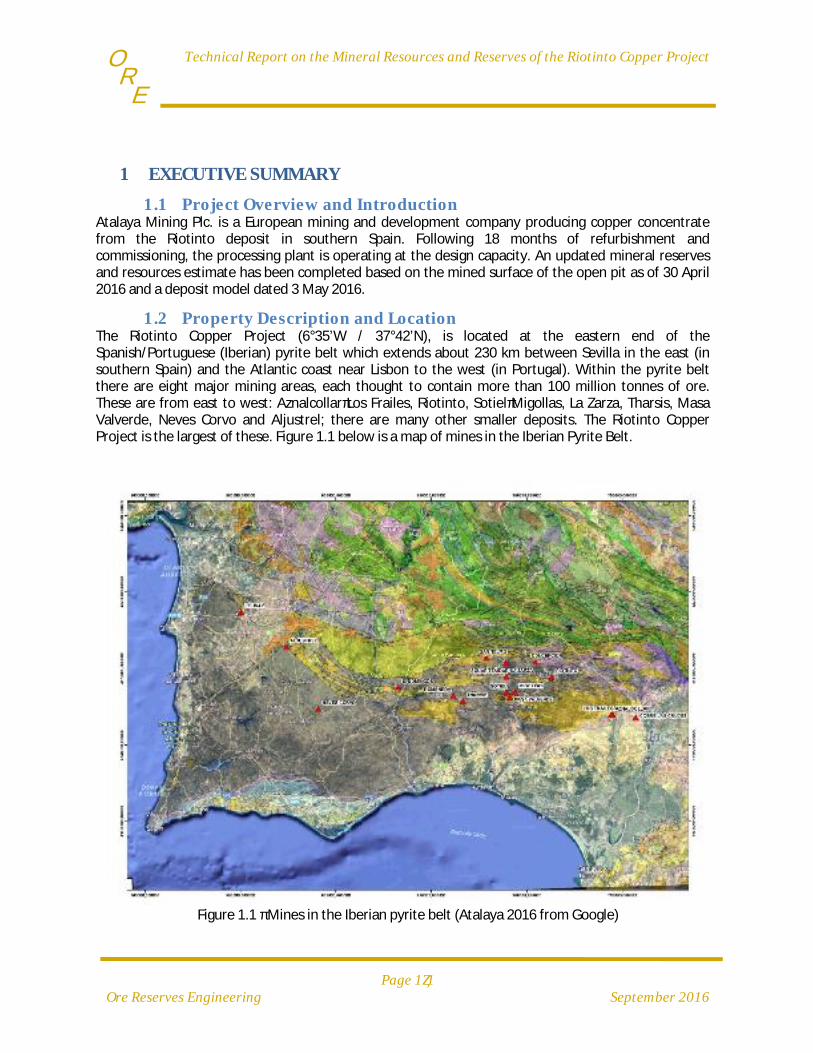
1.2 PropertyDescriptionandLocationThe Riotinto Copper Project (6°35’W / 37°42’N), is located at the eastern end of the Spanish/Portuguese (Iberian) pyrite belt which extends about 230 km between Sevilla in the east (in southern Spain) and the Atlantic coast near Lisbon to the west (in Portugal). Within the pyrite belt there are eight major mining areas, each thought to contain more than 100 million tonnes of ore. These are from east to west: Aznalcollar‐Los Frailes, Riotinto, Sotiel‐Migollas, La Zarza, Tharsis, Masa Valverde, Neves Corvo and Aljustrel; there are many other smaller deposits. The Riotinto Copper Project is the largest of these. Figure 1.1 below is a map of mines in the Iberian Pyrite Belt.
Figure 1.1 ‐ Mines in the Iberian pyrite belt (Atalaya 2016 from Google)
TechnicalReportontheMineralResourcesandReservesoftheRiotintoCopperProject
Page1‐2
OreReservesEngineering September2016
E R
O
In Spain, there are typically three different types of mining permits and concessions:
Exploration permits (Art. 40.2 Mining Law) granted for a period of 1 year, may be extended for a maximum of one more year. Research permits (Art. 45 Mining Law) granted for the period requested, which may not be more than 3 years and may be extended for a further 3 years. Operating concessions (Art. 62 Mining Law) also referred to as a Mining Permit, granted for a 30‐year period, and may be extended for equal periods up to a maximum of 90 years.
1.3 RiotintoCopperProjectAreaThe Riotinto copper mine was last operated in 2001 and restarted operations in 2015. Within the Riotinto mining district are five main orebodies: The San Dionisio, the Filon Sur, the Planes‐San Antonio, the Filon Norte, and the Cerro Colorado. They are believed to have once been a single, continuous mineralized zone 5 km long by 750 m wide and about 40 m thick, containing about 500 Mt of pyritic ore, but natural erosion and past mining activity has reduced this to about 250 Mt. In May 2007, EMED‐M was granted an option to acquire 51% of the Riotinto Copper Project assets located adjacent to the town of Minas de Riotinto, 65 km northwest of Sevilla in Andalucía, Spain. In 2001, the mine had been placed by the previous owners on a care‐and‐maintenance basis, due to the then‐prevailing low copper price of less than $1.00/lb. The main assets included the mineral rights within the main tenements covering an area of 20 km2. EMED‐M established its 51% owned subsidiary company EMED‐T to hold these assets. In October 2008, EMED‐M acquired the remaining 49% of EMED‐T from Mantesur Andevalo S.L. (MSA). The Riotinto Copper Project includes the Cerro Colorado copper‐pyrite deposit and open‐pit mining area, certain satellite deposits, the waste dumps, parts of the tailings and water facilities, the beneficiation plant and offices and other maintenance and general infrastructure. The Riotinto Copper Project area covers approximately 2,224 hectares as shown in Figure 1.2.
1.4 HistoryThe Riotinto Copper Project workings date back to at least 1,000 BC and have been operated by Phoenicians, Romans, British (Riotinto Company and RTZ), Americans (Freeport‐McMoRan) and finally, in the 1990s by the Spanish workers' co‐operative Minas de Riotinto (MRT). Since Roman times, more than 140 Mt of copper and silver ore has been mined from several open‐pit and underground mines. Before the arrival of the British miners in 1873, mining activity mainly consisted of underground mining in the Filón Sur area. Underground mining in the Filón Norte zone commenced in 1880 but was abandoned in 1894. From 1900 work focused on the open‐pit mining of the Salomón, Lago and Dehesa (Filón Norte) zones. In 1940 open‐stoping commenced in the Quebrantahuesos zone and continued until 1970. Mining then switched to the low‐grade sulfide stockwork ores of Cerro Colorado and production of gold and silver from the superficial gossan (oxide) cap.
TechnicalReportontheMineralResourcesandReservesoftheRiotintoCopperProject
Page1‐3
OreReservesEngineering September2016
E R
O
Between 1875 and 1976 a total of 128 Mt was mined from the massive sulfide ores. The copper concentrate was transported (70 km by rail) to the Huelva smelter. In 1977, Riotinto Patiño sold its shareholding in the mine to Spanish and English groups and Riotinto Minera SA (RTM) was founded. The Cerro Colorado workings were then expanded and the Alfredo shaft was modernized. A new processing plant was built in 1969 and extended in 1982‐1985 by the then operating Company Riotinto Minera SA. In 2004, the mineral rights and properties were acquired by Mantenimiento en General del Sur, Mantesur Andevalo SL (MSA), the management of which included former managers of MRT. MSA commenced restoration of the primary crushing and ore feed systems in anticipation of a restart but the group failed to secure the necessary approvals and the mine remained on care and maintenance. With no grid electric power available after 2004, work focused on monitoring the tailings dams, filing statutory reports and maintaining pumping to avoid effluent discharges and to protect the recent capital works from deterioration. In November 2006, the Australian companies, Oxiana Limited and Minotaur Exploration, entered into a memorandum of understanding with MSA, to invest in MRT. Both companies withdrew from the project in December 2006 and the project was then introduced to EMED‐M in which Oxiana is a founding shareholder. In October 2008, EMED‐M announced that it had completed the acquisition of EMED‐T, the owner of the Riotinto Copper Project, and, as a result of this acquisition, the Company was the sole owner. EMED received the mine permit and restoration plan approval in January 2015 and immediately commenced with construction and refurbishment operations. In October 2015, the shareholders approved of the name change to Atalaya Mining Plc.
1.5 GeologyandReservesThe Riotinto massive sulfide deposits occur in the Spanish side of Iberian Pyrite Belt (IPB), which is part of the South Portuguese Zone (SPZ) of the Iberian Massif. The Iberian Massif resulted from the collision of three continental blocks originated from the fragmentation of a Late Proterozoic mega‐continent (Murphy and Nance, 1991) in a series of plates: the SPZ, the OMZ, and the ensemble of the CIZ, West Asturian–Leonese (WALZ) and Cantabrian (CZ) zones (Fig. 1.2).
The IPB was formed as a series of marine basins that developed during the left‐lateral transcurrent faulting generated by the subduction and collision of Laurentia with Gondwana during the Variscan orogeny (Late Devonian−early Carboniferous; Silva et al., 1990; Oliveira, 1990). These basins were formed within the passive margin of Laurentia, now represented by the SPZ and adjacent to the collision suture. (A. Martin‐Izard et al. 2015). The oldest rocks in the IPB are a sequence of quartzite and shales (the Phyllite–Quartzite Group, also called PQ) of Devonian age, which are overlaid by a thick sequence of volcano sedimentary rocks, the Volcanic Sedimentary Complex (VSC), that host most of the mineralization of the IPB. The VSC is a highly variable unit, up to 1300 m thick of uppermost Devonian to Lower Carboniferous (ca. 356–349 Ma).

TechnicalReportontheMineralResourcesandReservesoftheRiotintoCopperProject
Page1‐4
OreReservesEngineering September2016
E R
O
Figure 1.2 – Map of Regional Geology (IGME 2013)
The VSC is formed by dacitic–rhyolitic dome complexes, basaltic lava flows, mafic sills, and thick pumice‐ and crystal‐rich felsic volcanoclastic units interbedded with detrital sedimentary rocks, mostly mudstone with some greywacke and sandstone. The depositional environment appears to be dominated by submarine mass‐flow tuffs as indicated by Schermerhorn (1971). The earliest Carboniferous (about 360 to 350 Ma) was a transitional period characterized by extension, forming different submarine basins and abundant bimodal volcanism causing the development of Volcanogenic Massive Sulfide (VMS) mineralization which were mainly hosted along the fracture zones limiting the different basins (Oliveira, 1990). Some of these basin‐forming faults were reactivated as thrusts during later Variscan shortening (Oliveira, 1990; Gumiel et al., 2010a). The IPB contains over 100 massive sulfide and stock work VMS deposits. Over 10 giant (world‐class) VMS deposits, each with more than 50 million metric tons (Mt) of ore, are hosted by volcanic rocks or
TechnicalReportontheMineralResourcesandReservesoftheRiotintoCopperProject
Page1‐5
OreReservesEngineering September2016
E R
O
associated shales, and were formed as exhalative ores in brine pools on the sea‐floor or as filled veins and replacement‐ style mineralization (e.g., Solomon et al., 2002; Tornos, 2006; Gumiel et al., 2010a). Riotinto is the largest deposit in the IPB and has been estimated to have held more than 500 Mt of massive pyrite, complex and stockwork types (Williams, 1934; Barriga, 1990; Boulter, 1993; Adamides, 2013).
1.6 DepositTypesAccording to the genetic, rock association and geodynamic setting, the Riotinto volcanic‐hosted pyrite‐chalcopyrite mineralization is classified as felsic siliciclastic of Kuroko type. It occurred as lenses of polymetallic massive sulfide that took place at the sea floor in a submarine volcanic environment during the earlier Carboniferous, some 350 Ma. As most significant VMS mining districts, the IPB is defined by deposit clusters formed within ocean rifts with volcanic centers. The clustering is attributed to a common heat source that caused large‐scale sub‐seafloor fluid convection systems.
1.7 DrillingandExplorationSince 2014 up to date Atalaya Mining has completed a comprehensive exploration program at the Riotinto project. Exploration has been carried out in two programs: i. Resource Drilling. Expansion drilling done into known ore zones to increase mineral resources
and reserves. ii. New Resource Exploration: Exploration done around the deposit in areas without known
mineral resources.
The drill hole database of Atalaya Mining is made up of two different sets of data: 1. The historical drilling database, which consisted of data compilation from historical drilling
performed for almost hundred years. These data were validated in 2008 and used for the Resource estimation published in the Technical Report NI43‐101, EMED (February 2013).
2. A new drilling program started in April 2014 (when the company was granted the mining rights) and that was completed in February 2016. This drilling campaign was carried out in the main pit at Cerro Colorado‐Salomon and its objective was to increase the Mineral Reserves over the 2012 figure of 123MT. The program included a total of 31,701m in holes.
Most of the 2014‐2016 resource drilling was reverse circulation (RC) except at Cerro Colorado West pit, where at depth drilling was carried out by a combination reverse circulation‐diamond drilling (RC‐DD). All the exploration targets of the resource drilling were hosted in the stockwork associated with the Northern Fault and related basins (Cerro Colorado, Salomon, Dehesa, Lago and Argamasilla). The exploration targets and drill designs varied depending on the zone, but in general they were designed following a review of the extensive historical data, the available block model resource data and geological interpretation. In parallel to the Resource Drilling, an exploration program to find new resources around the deposit commenced in January 2015 and is still in progress. The new exploration is being carried out over the entire Riotinto Concession, in areas outside of the mining plan, and mostly in potentially mineralized areas in which no mineral resources are presently defined. The comprehensive program included work as follows:

TechnicalReportontheMineralResourcesandReservesoftheRiotintoCopperProject
Page1‐6
OreReservesEngineering September2016
E R
O
Compilation of all historical geological and mineral data.
Detailed geological mapping of selected zones.
Compilation of all historical geophysical data.
Ground geophysical surveys over selected zones: MT and Gravimetric.
Diamond drilling.
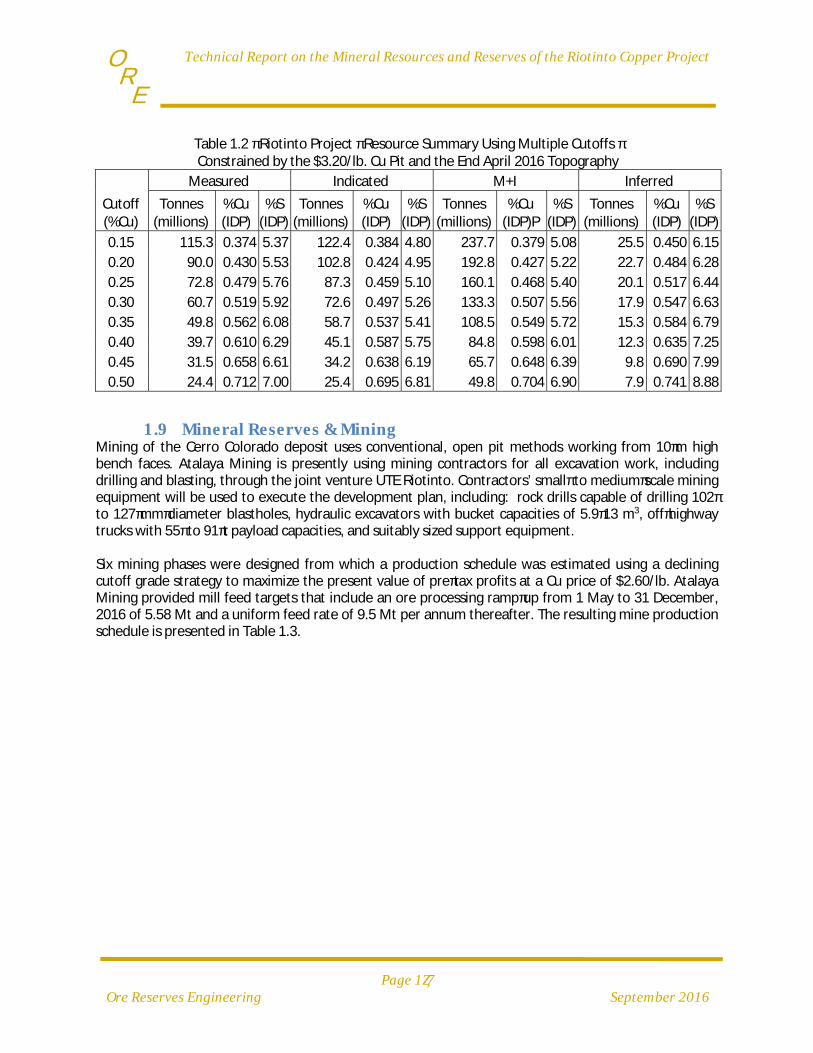
1.8 MineralResourceThe copper resource was summarized using a Lerchs‐Grossmann pit shell that was run to evaluate all resources, including inferred resources, using a copper price of $3.20/lb Cu. All other slope and economic parameters are the same as those used for design of the open pit for reserve estimation. The resulting pit shell is considered to have reasonable prospects for economic extraction, assuming that the inferred resource is converted to measured and indicated by drilling and that the copper price returns to previous levels that were substantially above $3.20/lb Cu. The resource estimate is summarized in Table 14.11 and Table 14.12.
Table 1.1 ‐ Riotinto Project ‐ Resource Summary‐ Constrained by the $3.20/lb. Cu Pit and the End April 2016 Topography
Resource Class/Zone Cutoff Tonnes
(millions)%Cu (IDP)
%S (IDP)
Measu
red
Acid Zone 0.2 67.8 0.46 6.27
Basic Zone 0.2 22.2 0.35 3.27
Total Measured 0.2 90.0 0.43 5.53 In
dicated
Acid Zone 0.2 81.8 0.45 5.54
Basic Zone 0.2 21.0 0.34 2.62
Total Indicated 0.2 102.8 0.42 4.95
Total M+I 0.2 192.8 0.43 5.22
Inferred
Acid Zone 0.2 20.1 0.49 6.69
Basic Zone 0.2 2.6 0.41 3.06
Total Inferred 0.2 22.7 0.48 6.28
TechnicalReportontheMineralResourcesandReservesoftheRiotintoCopperProject
Page1‐7
OreReservesEngineering September2016
E R
O
Table 1.2 ‐ Riotinto Project ‐ Resource Summary Using Multiple Cutoffs ‐ Constrained by the $3.20/lb. Cu Pit and the End April 2016 Topography
Cutoff (%Cu)
Measured Indicated M+I Inferred
Tonnes (millions)
%Cu (IDP)
%S (IDP)
Tonnes (millions)
%Cu (IDP)
%S (IDP)
Tonnes (millions)
%Cu (IDP)P
%S (IDP)
Tonnes (millions)
%Cu (IDP)
%S (IDP)
0.15 115.3 0.374 5.37 122.4 0.384 4.80 237.7 0.379 5.08 25.5 0.450 6.15
0.20 90.0 0.430 5.53 102.8 0.424 4.95 192.8 0.427 5.22 22.7 0.484 6.28
0.25 72.8 0.479 5.76 87.3 0.459 5.10 160.1 0.468 5.40 20.1 0.517 6.44
0.30 60.7 0.519 5.92 72.6 0.497 5.26 133.3 0.507 5.56 17.9 0.547 6.63
0.35 49.8 0.562 6.08 58.7 0.537 5.41 108.5 0.549 5.72 15.3 0.584 6.79
0.40 39.7 0.610 6.29 45.1 0.587 5.75 84.8 0.598 6.01 12.3 0.635 7.25
0.45 31.5 0.658 6.61 34.2 0.638 6.19 65.7 0.648 6.39 9.8 0.690 7.99
0.50 24.4 0.712 7.00 25.4 0.695 6.81 49.8 0.704 6.90 7.9 0.741 8.88
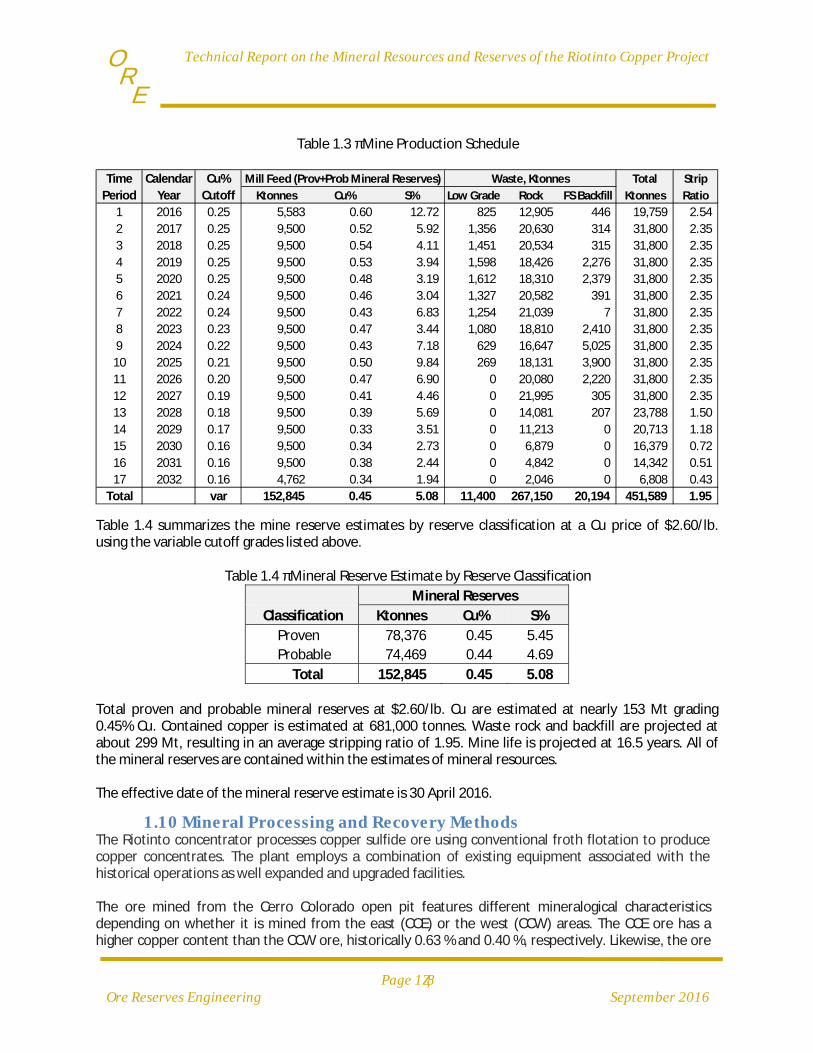
1.9 MineralReserves&MiningMining of the Cerro Colorado deposit uses conventional, open pit methods working from 10‐m high bench faces. Atalaya Mining is presently using mining contractors for all excavation work, including drilling and blasting, through the joint venture UTE Riotinto. Contractors’ small‐ to medium‐scale mining equipment will be used to execute the development plan, including: rock drills capable of drilling 102‐ to 127‐mm‐diameter blastholes, hydraulic excavators with bucket capacities of 5.9‐13 m3, off‐highway trucks with 55‐ to 91‐t payload capacities, and suitably sized support equipment. Six mining phases were designed from which a production schedule was estimated using a declining cutoff grade strategy to maximize the present value of pre‐tax profits at a Cu price of $2.60/lb. Atalaya Mining provided mill feed targets that include an ore processing ramp‐up from 1 May to 31 December, 2016 of 5.58 Mt and a uniform feed rate of 9.5 Mt per annum thereafter. The resulting mine production schedule is presented in Table 1.3.
TechnicalReportontheMineralResourcesandReservesoftheRiotintoCopperProject
Page1‐8
OreReservesEngineering September2016
E R
O
Table 1.3 ‐ Mine Production Schedule
Table 1.4 summarizes the mine reserve estimates by reserve classification at a Cu price of $2.60/lb. using the variable cutoff grades listed above.
Table 1.4 ‐ Mineral Reserve Estimate by Reserve Classification
Mineral Reserves
Classification Ktonnes Cu% S%
Proven 78,376 0.45 5.45
Probable 74,469 0.44 4.69
Total 152,845 0.45 5.08
Total proven and probable mineral reserves at $2.60/lb. Cu are estimated at nearly 153 Mt grading 0.45% Cu. Contained copper is estimated at 681,000 tonnes. Waste rock and backfill are projected at about 299 Mt, resulting in an average stripping ratio of 1.95. Mine life is projected at 16.5 years. All of the mineral reserves are contained within the estimates of mineral resources. The effective date of the mineral reserve estimate is 30 April 2016.
1.10 MineralProcessingandRecoveryMethodsThe Riotinto concentrator processes copper sulfide ore using conventional froth flotation to produce copper concentrates. The plant employs a combination of existing equipment associated with the historical operations as well expanded and upgraded facilities. The ore mined from the Cerro Colorado open pit features different mineralogical characteristics depending on whether it is mined from the east (CCE) or the west (CCW) areas. The CCE ore has a higher copper content than the CCW ore, historically 0.63 % and 0.40 %, respectively. Likewise, the ore
Time Calendar Cu% Mill Feed (Prov+Prob Mineral Reserves) Waste, Ktonnes Total Strip
Period Year Cutoff Ktonnes Cu% S% Low Grade Rock FS Backfill Ktonnes Ratio
1 2016 0.25 5,583 0.60 12.72 825 12,905 446 19,759 2.54
2 2017 0.25 9,500 0.52 5.92 1,356 20,630 314 31,800 2.35
3 2018 0.25 9,500 0.54 4.11 1,451 20,534 315 31,800 2.35
4 2019 0.25 9,500 0.53 3.94 1,598 18,426 2,276 31,800 2.35
5 2020 0.25 9,500 0.48 3.19 1,612 18,310 2,379 31,800 2.35
6 2021 0.24 9,500 0.46 3.04 1,327 20,582 391 31,800 2.35
7 2022 0.24 9,500 0.43 6.83 1,254 21,039 7 31,800 2.35
8 2023 0.23 9,500 0.47 3.44 1,080 18,810 2,410 31,800 2.35
9 2024 0.22 9,500 0.43 7.18 629 16,647 5,025 31,800 2.35
10 2025 0.21 9,500 0.50 9.84 269 18,131 3,900 31,800 2.35
11 2026 0.20 9,500 0.47 6.90 0 20,080 2,220 31,800 2.35
12 2027 0.19 9,500 0.41 4.46 0 21,995 305 31,800 2.35
13 2028 0.18 9,500 0.39 5.69 0 14,081 207 23,788 1.50
14 2029 0.17 9,500 0.33 3.51 0 11,213 0 20,713 1.18
15 2030 0.16 9,500 0.34 2.73 0 6,879 0 16,379 0.72
16 2031 0.16 9,500 0.38 2.44 0 4,842 0 14,342 0.51
17 2032 0.16 4,762 0.34 1.94 0 2,046 0 6,808 0.43
Total var 152,845 0.45 5.08 11,400 267,150 20,194 451,589 1.95

TechnicalReportontheMineralResourcesandReservesoftheRiotintoCopperProject
Page1‐9
OreReservesEngineering September2016
E R
O
from CCE has higher sulfur content at 12 %, versus 4 % from CCW basically because of pyrite content. Another difference between the two ore types is that ore from CCE has a higher content of penalty elements such as arsenic and antimony. Historically, the CCE ore recovered less copper than the CCW ore. This fact was confirmed during the phase 1 period of the Project.
The ore from CCE requires a finer primary grind than the ore from CCW to achieve the same metallurgical recovery. Also, the CCE ore requires less energy to obtain the same particle size as the ore from CCW.
Relatively coarse primary and secondary grinding, at a p80 of approximately 160 microns, is used to float the minerals containing chalcopyrite and pyrite to produce a rougher concentrate. This concentrate must then be re‐ground to a relatively fine grain size of around 40 to 20 microns in order to increase the concentrate grade.
Both ore types contain silver but ore from CCE has a higher silver content than ore from CCW. The silver content in the concentrates produced during phase 1 of the operation is between 62 and 150 g/t.
During 1995 until 2001 the Riotinto mine Concentrator Plant processed ore with similar characteristics to what is processed today. In that period of time a total of 23.9 Mt of ore at average 0.54% Cu were processed, which generated information that was used to develop the design criteria and start up plan for the current operation. The old concentrator initially processed 4.5 Mt/year of ore and an expansion made the concentrator reach a processing capacity of 7.3 Mt/y in 1997; a peak annual throughput of 9 Mt/y was achieved in 1998.
Metallurgical testwork results and current plant performance indicate that Riotinto ore is amenable to conventional crushing, grinding, froth flotation, dewatering and filtering processes. The ore for the current operation is mined from 5 different zones (CCW, Isla, Salomon, Lago and QUEB) with different but acceptable metallurgical performance variability when processing with conventional flotation machines and a mixture of ditiophosphate and thionocarbamate based chemistry at basic pH of over 10.5. The optimum target P80 in the flotation feed has been set to 160 microns as a compromise between copper recovery and throughput.
1.11 InfrastructureThe property is well‐connected for road transportation via a high quality national road system that was recently renovated. The site is located 75 km from the port and the industrial city of Huelva, and 88 km from the regional capital, Seville.
Copper concentrate is transported by road to the Huelva port where it is stored for ocean transport to various commercial destinations.
The incoming main substation of 132/6.3 kV has been fully reconditioned and updated. The main substation consists of one 132 kV, 1.3 km line that has been repaired and is currently operating from La Dehesa (ENDESA independent power supplier) using 3 outgoing lines on 3 main transformers.
Process water for the phase 1 stage was supplied from the Gossan Dam where it was pumped, at a rate of approximately 1,000 m3/h, into two steel tanks with capacities of 4,000 and 3,675 m3.
TechnicalReportontheMineralResourcesandReservesoftheRiotintoCopperProject
Page1‐10
OreReservesEngineering September2016
E R
O
The 9.5 Mt/y expansion project includes the installation of a new DN‐800 process water pipe and a new pumping system located at the Gossan Dam. Two new pumps that has a flow rate of 1,500m3/h each, will pump water to an intermediate storage tank, with a capacity of approximately 3,100 m3, and booster pumping system that pumps water to the process water tanks at a flow rate of 3,000 m3/h. Fresh water is supplied from the Campofrio Dam by three pumps with a flow rate of 250 m3/h each, two operating and one standby. Water is delivered through a HDPE DN‐355 PN‐16 pipe to the fresh water tank, ensuring supply at any stage in production. The plant fresh water storage tank has a capacity of 1,900 m3 and has been repaired along with all the valves and distribution systems associated with this system.
There are two large warehouses on the mine property along with an outdoor storage area. The locations for replacement parts and material deliveries have been separated and clearly defined. The warehouses feature sufficient shelving units to organize large‐size replacement parts and cabinets for small items. All warehouse shelving units are officially approved and newly‐installed. Two secure areas were prepared within the warehouses to store inflammable products to comply with APQ laws (chemical storage).
1.12 MarketStudiesandContractsAtalaya has been actively marketing the copper concentrate product to global consumers. Currently, 100% of the concentrate production is committed to three companies through offtake agreements for life of mine reserves that average:
Yanggu Xiangguang Copper Co. Ltd (XGC) – 49.12%
Urion Mining International (Trafigura) – 19.34%
Orion Mine Finance (Orion) – 31.54% Copper is an internationally traded commodity and prices are set through trading on the major metals exchanges: the London Metal Exchange (LME), the New York Commodity Exchange (COMEX) and the Shanghai Futures Exchange (SHFE). Copper prices on these exchanges generally reflect the worldwide balance of copper supply and demand, but are also influenced significantly by investment flows and currency exchange rates.
1.13 Environmental Studies, Permitting, and Social or CommunityImpact
Mining and mineral processing activities have been taking place at Riotinto for many years. With the exception of some parts of the Corta Atalaya Waste Dumps, no reclamation work has been conducted. As a result of this and the fact that much of the waste material has a high acid generating potential, the Riotinto project area is an environmentally degraded site with significant environmental legacy issues. The chief legacy issues, as is the case in many mine sites that host potentially high acid generating materials, is related to Acid Mine Drainage (AMD) and the mitigation and control in an environmentally, technically, and financially sustainable manner. Atalaya Mining’s environmental policy, environmental management system, and operating and final closure plans have been developed in order to address this, other legacy, and future issues in a sustainable manner.

TechnicalReportontheMineralResourcesandReservesoftheRiotintoCopperProject
Page1‐11
OreReservesEngineering September2016
E R
O
In June 2008 an international mining environmental consultant conducted an ISO 14001 environmental audit for the overall site (Thirtle, 2008a). This report produced recommendations for the implementation and improvements to infrastructure, procedures and practices to reflect European and World best available practices. Atalaya has been implementing some of the recommendations included in this audit and it is envisaged that all recommendations will be completed shortly after production begins. As a result of the audit and to commence on the implementation of the Atalaya environmental policy, a set of 17 Environmental Management Plans (EMP’s) (Thirtle, EMED Tartessus S.L.U. PRT Feasibility Study Report 2008b) to address known and potential environmental and community issues arising from operating a large mine in the proximity to urban areas have been developed. These plans, when fully implemented, will reflect global best industry practice and are based on the ISO 14001 system. As part of the Environmental Management System (EMS) these plans will be regularly checked to monitor performance and to ensure that Atalaya’s environmental targets and objectives are being met. They will also be regularly reviewed by management to ensure that the objectives of the EMS are being met and to make recommendations for continual improvement of the EMS. Continual improvement of the EMS will address three core dimensions related to the expansion, enrichment and upgrading of the EMS within Atalaya.
Final restoration is an integral part of the Riotinto Project and both the operating and final restoration plans (FRP) have been developed to make them compatible with each other and to ensure that the final restoration can be completed as soon as possible after the cessation of mining, processing and waste disposal operations. The objectives of Atalaya’s FRP are to:
Protect the environment, Minimize any long term negative environmental impacts of the project, Guarantee the chemical stability of waters discharging from Riotinto, Ensure that the physical stability of any soils is maintained, Recover any soils that will be disturbed during mining operations and reuse them
appropriately, Recover the natural vegetation in a manner that is compatible with the surrounding habitat, Reduce the contamination to external areas by dust or other emissions, Conserve and maintain the mining heritage in the Riotinto area and, Minimize social impacts as a result of the mine closure at the end of its life.
In accordance with current applicable legislation, Atalaya has submitted for approval an FRP as part of the project approvals process. The FRP (Eygema, 2012b) is submitted as part of the AAU to the Consejería de Medio Ambiente y Ordenación del Territorio for review and approval including a period of public consultation. After approval of the AAU, the FRP, with any amendments brought about as a result of the approvals process is submitted along with the final reclamation bonding deposits to the Consejeria de Economia, Innovacion, Ciencia y Empleo for final approval. Again this process includes a period of public consultation.
An Occupational Risk Prevention Plan was established in 2014 as a tool to integrate the company's risk prevention activities into the general management system. The Occupational Risk Prevention Plan was approved by the company management and was then assumed by the entire organizational structure, and is known by all workers.
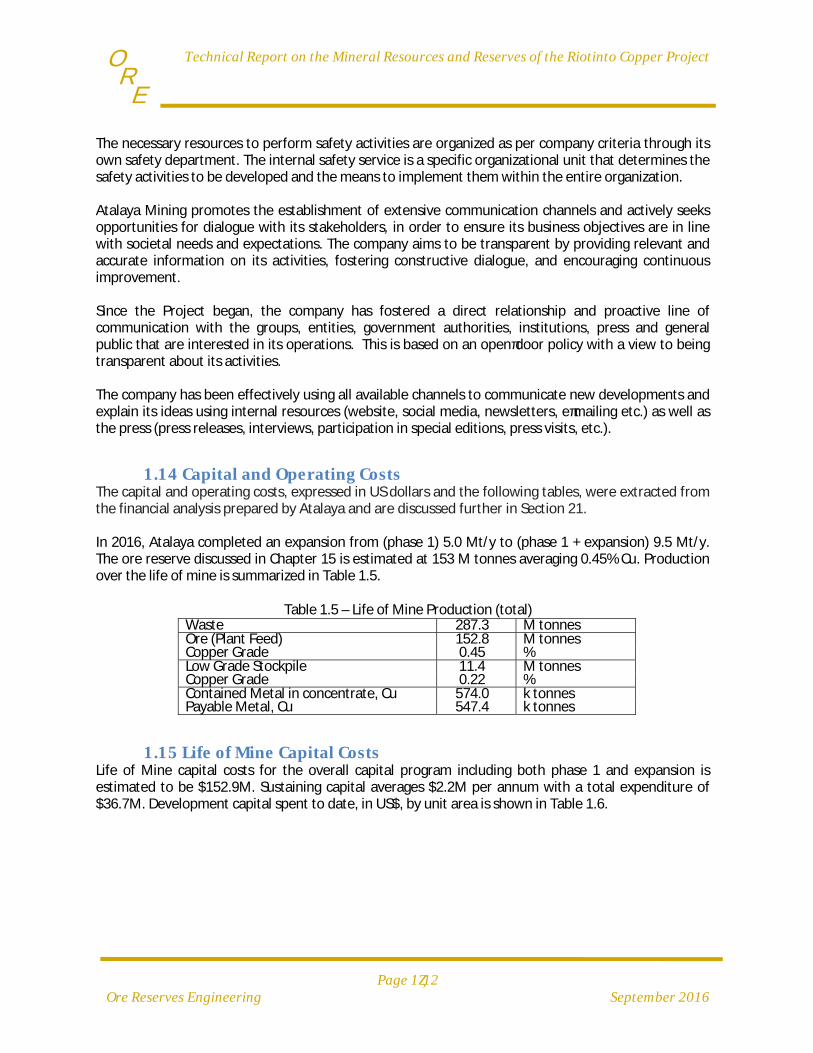
TechnicalReportontheMineralResourcesandReservesoftheRiotintoCopperProject
Page1‐12
OreReservesEngineering September2016
E R
O
The necessary resources to perform safety activities are organized as per company criteria through its own safety department. The internal safety service is a specific organizational unit that determines the safety activities to be developed and the means to implement them within the entire organization.
Atalaya Mining promotes the establishment of extensive communication channels and actively seeks opportunities for dialogue with its stakeholders, in order to ensure its business objectives are in line with societal needs and expectations. The company aims to be transparent by providing relevant and accurate information on its activities, fostering constructive dialogue, and encouraging continuous improvement.
Since the Project began, the company has fostered a direct relationship and proactive line of communication with the groups, entities, government authorities, institutions, press and general public that are interested in its operations. This is based on an open‐door policy with a view to being transparent about its activities. The company has been effectively using all available channels to communicate new developments and explain its ideas using internal resources (website, social media, newsletters, e‐mailing etc.) as well as the press (press releases, interviews, participation in special editions, press visits, etc.).
1.14 CapitalandOperatingCostsThe capital and operating costs, expressed in US dollars and the following tables, were extracted from the financial analysis prepared by Atalaya and are discussed further in Section 21. In 2016, Atalaya completed an expansion from (phase 1) 5.0 Mt/y to (phase 1 + expansion) 9.5 Mt/y. The ore reserve discussed in Chapter 15 is estimated at 153 M tonnes averaging 0.45% Cu. Production over the life of mine is summarized in Table 1.5.
Table 1.5 – Life of Mine Production (total) Waste 287.3 M tonnes Ore (Plant Feed) 152.8 M tonnes Copper Grade 0.45 %Low Grade Stockpile 11.4 M tonnes Copper Grade 0.22 %Contained Metal in concentrate, Cu 574.0 k tonnes Payable Metal, Cu 547.4 k tonnes
1.15 LifeofMineCapitalCostsLife of Mine capital costs for the overall capital program including both phase 1 and expansion is estimated to be $152.9M. Sustaining capital averages $2.2M per annum with a total expenditure of $36.7M. Development capital spent to date, in US$, by unit area is shown in Table 1.6.

TechnicalReportontheMineralResourcesandReservesoftheRiotintoCopperProject
Page1‐13
OreReservesEngineering September2016
E R
O
Table 1.6 – Capital Expenditure to Date, US$
OCCUPATIONAL HEALTH AND SAFETY 582.14 EXPLORATION AND GEOLOGY 2,234.39
MINING 4,030.34 PROCESSING 74,577.63
INFRASTRUCTURE 8,785.08 PROJECT MANAGEMENT 3,577.28
ENGINEERING 5,607.23 CONSTRUCTION MANAGEMENT 18,363.12
OWNERS COSTS 5,963.81 CONTINGENCY 1,726.75
G & A 16,882.12 CAPEX TOTAL 142,329.90
The estimated capital outlay for the phased development is USD$152.9 million of which US$124.1 million was spent in 2015. Additional capital requirements are shown below:
Sustaining Capital $36.7 M Total, life‐of‐mine Development Capital (2016) $28.8 M Total, including expansion
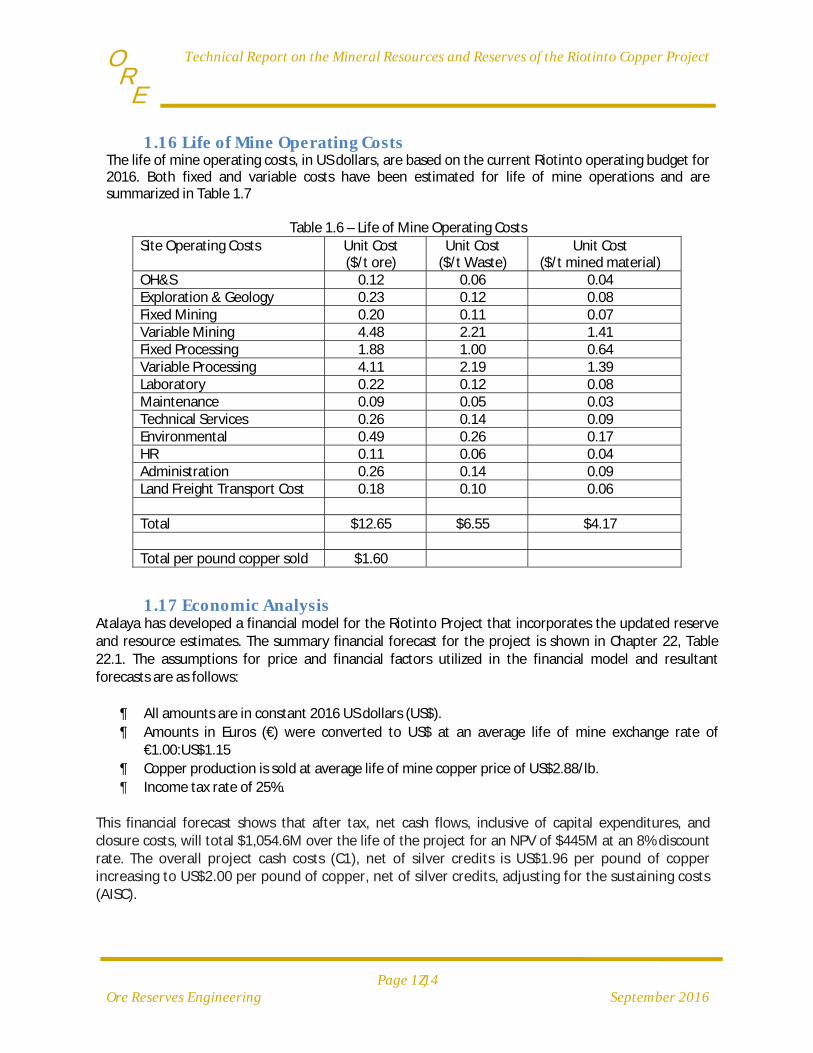
TechnicalReportontheMineralResourcesandReservesoftheRiotintoCopperProject
Page1‐14
OreReservesEngineering September2016
E R
O
1.16 LifeofMineOperatingCostsThe life of mine operating costs, in US dollars, are based on the current Riotinto operating budget for 2016. Both fixed and variable costs have been estimated for life of mine operations and are summarized in Table 1.7
Table 1.6 – Life of Mine Operating Costs Site Operating Costs Unit Cost
($/t ore)Unit Cost
($/t Waste)Unit Cost
($/t mined material)OH&S 0.12 0.06 0.04 Exploration & Geology 0.23 0.12 0.08 Fixed Mining 0.20 0.11 0.07 Variable Mining 4.48 2.21 1.41 Fixed Processing 1.88 1.00 0.64 Variable Processing 4.11 2.19 1.39 Laboratory 0.22 0.12 0.08 Maintenance 0.09 0.05 0.03 Technical Services 0.26 0.14 0.09 Environmental 0.49 0.26 0.17 HR 0.11 0.06 0.04 Administration 0.26 0.14 0.09 Land Freight Transport Cost 0.18 0.10 0.06 Total $12.65 $6.55 $4.17 Total per pound copper sold $1.60
1.17 EconomicAnalysisAtalaya has developed a financial model for the Riotinto Project that incorporates the updated reserve and resource estimates. The summary financial forecast for the project is shown in Chapter 22, Table 22.1. The assumptions for price and financial factors utilized in the financial model and resultant forecasts are as follows:
All amounts are in constant 2016 US dollars (US$).
Amounts in Euros (€) were converted to US$ at an average life of mine exchange rate of €1.00:US$1.15
Copper production is sold at average life of mine copper price of US$2.88/lb.
Income tax rate of 25%.
This financial forecast shows that after tax, net cash flows, inclusive of capital expenditures, and closure costs, will total $1,054.6M over the life of the project for an NPV of $445M at an 8% discount rate. The overall project cash costs (C1), net of silver credits is US$1.96 per pound of copper increasing to US$2.00 per pound of copper, net of silver credits, adjusting for the sustaining costs (AISC).
TechnicalReportontheMineralResourcesandReservesoftheRiotintoCopperProject
Page1‐15
OreReservesEngineering September2016
E R
O
1.18 ConclusionsandRecommendationsAtalaya Mining has successfully refurbished and expanded the Riotinto plant and infrastructure and is presently mining the Cerro Colorado open pit through the UTE Riotinto joint venture. Mineral reserves are estimated to provide a project life of greater than 16 years. In addition, Lerchs‐Grossman analysis of the mineral resource indicates that with a 15% increase in copper price, from the base case $2.60/lb to $3.00/lb, could increase the reserve tonnage by approximately 20%. While no major work programs are suggested, the recommendations that follow and that are further outlined in Chapter 26 are meant to improve operations and/or the economics of the Riotinto Project. Most of these can be evaluated by Atalaya Mining’s in‐house management and technical staff and do not require expenditures outside the normal operating and capital budgets.
Continue to instill a culture of safety and safe practices both at work and home. Make environmental compliance equal to safety and production.
Develop a trade‐off analysis to investigate possible capital expenditures versus operating cost
savings when switching from 102‐107 mm percussion drillings to down‐hole‐hammer (DHH) rigs. The DHH are used wherever significant tonnages from 10‐m‐high benches are used. Larger blasthole diameters allow wider spacing, require fewer holes and the related number of boosters and blasting accessories per shot, and thus lower operating costs for drilling and blasting. Labor costs could also be reduced.
Evaluate if 11Mt of low grade ore (at average 0.22% Cu) that would be stockpiled for the next 10
years can extend the mine life. A suitable place to stockpile this ore will be needed if this scenario is viable.
Develop additional infill drilling on both San Dionisio and San Antonio deposits to confirm
historical estimates as they could contain unmined resources. Also, develop additional infill drilling at the northern flank of the Atalaya pit as it contains host stockwork mineralization
Develop exploration drilling around the Filón Sur historical pit to assess if stockwork and massive
sulphide were unmined.
Continue to optimize processing operations in order to increase production rates and increase product quality.
Set up automatic sampling of final concentrate and extend a sample exchange program with
external laboratories to improve analytical reliability.
Continue to look for opportunities to improve operating costs. Set up a detailed program to monitor the higher cost/use consumables, such as reagents, mill steel, and energy.
Formalize a social and community development plan that incorporates both company and community issues. Need to develop a post mine use plan.

TechnicalReportontheMineralResourcesandReservesoftheRiotintoCopperProject
Page2‐16
OreReservesEngineering September2016
E R
O
2 INTRODUCTIONANDTERMSOFREFERENCE
2.1 BackgroundInformationandTermsofReferenceOre Reserves Engineering was contacted by Atalaya Mining in January 2016 and was requested to prepare an updated resource estimate for Atalaya’s Proyecto Riotinto mine in the Province of Huelva, Spain. This resource estimate was to be documented in an updated NI 43‐101 compliant report. Pursuant to accomplishing the above tasks, Mr. Alan C. Noble of Ore Reserves Engineering (ORE) along with Mr. Jaye T. Pickarts traveled to Spain in February 2106 and conducted a site visit over a period of five days. During the site visit, the following personal inspections were conducted: Mr. Noble:
1) Reviewed the overall project status and history with project personnel. 2) Reviewed the geologic interpretation with project geologic personnel. 3) Reviewed drilling methods and exploration with project geologic personnel. 4) Visited the core‐logging facility, inspected a representative selection of core, reviewed
geologic logging procedures. 5) Visited the open‐pit mine and reviewed operational procedures and grade control. 6) Discussed current methods for resource estimation with mine technical staff. 7) Visited the assay lab and reviewed sample preparation and assaying procedures.
Mr. Pickarts:
1) Reviewed the overall project status and history with project personnel. 2) Visited the plant and reviewed project plans for updating the plant and expanding
production. 3) Reviewed project infrastructure. 4) Reviewed marketing studies and contracts. 5) Reviewed operating cost, capital costs, and requirements for economic analysis. 6) Reviewed environmental permitting and compliance procedures. 7) Reviewed project safety procedures.
Mr. William Rose was not on the site visit and did not conduct a personal inspection of the property. The mine plans prepared by Mr. Rose were reviewed by Mr. Noble. Mr. Juan Jose Anes Rojas is an independent consultant contracted to Atalaya Mining to assist with the continuous improvement of the plant expansion. Mr. Rojas assisted in the collection and analysis of the metallurgical data and the preparation of Chapter 13, Mineral Processing and Metallurgical Testing. In addition, Mr. Anes Rojas assisted in the preparation of Chapter 17, Recovery Methods, and Chapter 21, Capital and Operating Costs. All of the above listed professionals are independent Qualified Persons according to the definitions of NI 43‐101 and have conducted this work as independent consulting engineers.
TechnicalReportontheMineralResourcesandReservesoftheRiotintoCopperProject
Page2‐17
OreReservesEngineering September2016
E R
O
2.2 ScopeofWorkThe scope of work for the project included:
1) Preparation of an updated resource estimate for copper. 2) Preparation of a complete open pit mine design including phasing, road access, annual
production schedule, waste dump design, and periodic mine progress maps. 3) Review of the plant facility, plant operations, and plans for improvement of plant
performance. 4) Review of environmental, safety, marketing, and costs. 5) Preparation of an updated NI 43‐101 compliant report to document the above.
2.3 SourcesofInformationandDataElectronic data files containing geologic interpretations, drill hole data, surface topography, and plant flowsheets were provided by project technical staff. Other data sources include a previous technical report, independent resource estimation reports, feasibility reports, and plant design documents.
2.4 DefinitionsandUnitsofMeasureUnits of measure in this report are SI Units including meters, kilometers, kilograms, metric tonnes, liters, etc., unless explicitly stated. Currency units are in U.S. dollars, and copper prices are in $US/pound copper (454 grams). This report has been prepared in accordance with Form 43‐101F1 Technical Report and the CIM Definition Standards for Mineral Resources and Mineral Reserves adopted by the CIM Council in April, 2011.

TechnicalReportontheMineralResourcesandReservesoftheRiotintoCopperProject
Page3‐1
OreReservesEngineering September2016
E R
O
3 RELIANCEONOTHEREXPERTSThe authors used their experience to determine if the information from previous reports was suitable for inclusion in this Technical Report. Except where noted, the author has relied upon the information provided by Atalaya as being accurate, reliable, and suitable for use in the report. This Report includes technical information, which required subsequent calculations to derive subtotals, totals, and weighted averages. Such calculations inherently involve a degree of rounding and consequently introduce a margin of error. Where these occur, the Consultants do not consider them to be material.

TechnicalReportontheMineralResourcesandReservesoftheRiotintoCopperProject
Page4‐1
OreReservesEngineering September2016
E R
O
4 PROPERTYDESCRIPTIONANDLOCATIONThe Riotinto Copper Project (6°35’W / 37°42’N), is located at the eastern end of the Spanish/Portuguese (Iberian) pyrite belt which extends about 230 km between Seville in the east (in southern Spain) and the Atlantic coast near Lisbon in the west (in Portugal). Within the pyrite belt there are eight major mining areas, each thought to contain more than 100 million tonnes of ore. These are from east to west: Aznalcollar‐Los Frailes, Riotinto, Sotiel‐Migollas, La Zarza, Tharsis, Masa Valverde, Neves Corvo and Aljustrel; there are many other smaller deposits. The Riotinto Copper Project is the largest of these. Figure 4.1 below is a map of mines in the Iberian Pyrite Belt.
Figure 4.1 – Mines in the Iberian pyrite belt (Atalaya 2016 from Google)
In Spain, there are typically three different types of mining permits and concessions:
Exploration permits (Art. 40.2 Mining Law) granted for a period of 1 year, may be extended for a maximum of one more year.
Research permits (Art. 45 Mining Law) granted for the period requested, which may not be more than 3 years, but may be extended for an additional 3 years.
Operating concessions (Art. 62 Mining Law) also referred to as a Mining Permit, granted for a 30‐year period, and may be extended for equal periods up to a maximum of 90 years.

TechnicalReportontheMineralResourcesandReservesoftheRiotintoCopperProject
Page4‐2
OreReservesEngineering September2016
E R
O
4.1 RiotintoCopperProjectAreaThe Riotinto copper mine was last operated in 2001 and restarted operations in 2015. Within the Riotinto mining district are five main orebodies: the San Dionisio, the Filon Sir, the Planes‐San Antonio, the Filon Norte, and the Cerro Colorado. They are believed to have once been a single, continuous mineralized zone 5 km long by 750 m wide and about 40 m thick, containing about 500 Mt of pyritic ore, but natural erosion and past mining activity has reduced this to about 250 Mt. In May 2007, EMED‐M was granted an option to acquire 51% of the Riotinto Copper Project assets located adjacent to the town of Minas de Riotinto, 65 km northwest of Seville in Andalucía, Spain. In 2001, the mine had been placed by the previous owners on a care‐and‐maintenance basis, due to the then‐prevailing low copper price of less than $1.00/lb. The main assets included the mineral rights within the main tenements covering an area of 20 km2. EMED‐M established its 51% owned subsidiary company EMED‐T to hold these assets. In October 2008, EMED‐M acquired the remaining 49% of EMED‐T from Mantesur Andevalo S.L. (MSA). In October 2015, the shareholders approved of the name change to Atalaya Mining Plc. The Riotinto Copper Project includes the Cerro Colorado copper‐pyrite deposit and open‐pit mining area, certain satellite deposits, the waste dumps, parts of the tailings and water facilities, the beneficiation plant and offices, and other maintenance and general infrastructure. The Riotinto Copper Project area covers approximately 2,224 hectares as shown in Figure 4.2.
4.2 LandPositionatRiotintoThe Riotinto mineral rights were sold by the Spanish Government to Riotinto Limited Company in perpetuity under the private property regime (Law of June 25, 1870, Act of December 26, 1870, Act of December 26, 1872 and Decree Law of February 14, 1873 to ratify the above, published in the Gaceta de Madrid on February 16, 1873). These historical mineral rights are attached to land plot 843 covering the whole of the municipality of the town of Minas de Riotinto, where the Riotinto Copper Project is located, Atalaya is now the sole owner of the mining rights. Figure 4.2 below shows the location and ownership of the Riotinto project.

TechnicalReportontheMineralResourcesandReservesoftheRiotintoCopperProject
Page4‐3
OreReservesEngineering September2016
E R
O
Figure 4.2 – Location and ownership of the Riotinto Copper Project (Atalaya, 2016)
Although there are a number of liens on the various land packages, the only one that is critical to the restart project is a lien held by the Tesoreria General de la Seguridad Social. In May 2010, EMED entered into an arrangement whereby Social Security would not exercise their lien in return for EMED repaying the total amount, owed by a former owner of the mine, over a period of 5 years. In August 2012, EMED acquired ownership of and options over all lands required for operations and potential expansion. This removed the possible need for expropriation of lands required for the restart. All land required for the project or for future expansion has been secured through acquisition or by options to purchase. In May 2009, EMED submitted a request to the Government for Administrative Standing, (pursuant to the provisions of Articles 95.2, 97.1 and the Second Transitional Provision of the current Mining Act) for the development of the Riotinto Copper Project. This Administrative Standing request was accompanied by supporting documentation (including relevant technical documentation) as well as contracts and title transfer deeds showing that EMED owned the mineral rights including: the registered land plot 843 (which incorporates the area of the Cerro Colorado pit), the facilities and the exclusive rights of operation and beneficiation of minerals from the soil and subsoil of the whole of the municipality of the town of Minas de Riotinto.

TechnicalReportontheMineralResourcesandReservesoftheRiotintoCopperProject
Page5‐1
OreReservesEngineering September2016
E R
O
5 ACCESSIBILITY,CLIMATE,LOCALRESOURCES, INFRASTRUCTUREANDPHYSIOGRAPHY
The Riotinto deposit is located in the Huelva Province of the Autonomous Community of Andalucía in Southern Spain, about 500 km south of Madrid, 65 km north‐west of Sevilla and 70 km north‐east of the port of Huelva. Seville (population 700,000) is the administrative center of the Andalucía region. The Autonomous Community of Andalucía is governed by the Junta de Andalucía, which is one of the historic Autonomous Communities of Spain, with a local parliament and president.
5.1 AccessibilityThere are many international flights that connect the provincial cities of Seville and Malaga with Madrid and other major cities in Europe and North America. There is a high‐speed train service linking the regional towns of Cordoba and Seville with the capital Madrid. The Riotinto Copper Project site is well serviced by paved highways to Aracena, Huelva and Seville. It is near the towns of Minas de Riotinto and Nerva as well as several nearby villages, which represent potential sources of labor, accommodation and general services.
5.2 ClimateandPhysiographyDue to the geographical location and varied topography, the climate in the Andalucía province is diverse, with a Continental Mediterranean climate in the inland areas and a Mediterranean climate along the coast. The average annual mean temperature is 18.7ºC, the daily temperature ranges from 3ºC in January to 40ºC in July and August. Average annual precipitation is 795 mm. Operations are possible all year around.
5.2.1 LocalResourcesandInfrastructureThe modern Riotinto mining complex dates back to 1873, when a group of British businessmen purchased the Riotinto mines from the Spanish Government and established the Riotinto Company Ltd. At its peak, there were some 14,000 workers, 150 km of railway track and a dedicated loading facility at the port of Huelva (70 km southwest of Riotinto), where copper and pyrite ore were loaded for export. The long‐established mining town of Minas de Riotinto (population c 5000) provides most of the facilities required for mineral exploration and mining activity, and all other facilities are available nearby. In 1970, a copper smelter and refinery were built next to the port of Huelva. In 1993 Freeport‐ McMoRan Copper & Gold Inc. acquired Riotinto Minera SA and decided to dispose of the mining operation to local interests and concentrate on the metallurgy part of the business (Atlantic Copper S.A) by investing more than €200M (about $260M at current exchange rates) to double Huelva's smelting and refining capacity.
5.2.2 PhysiographyThe Riotinto area consists of low, sparsely‐wooded, E‐W trending ridges, separated by wide valleys that support a semi‐rural population. The topographic relief is about 500 m from the valley to the highest ridge top.

TechnicalReportontheMineralResourcesandReservesoftheRiotintoCopperProject
Page6‐2
OreReservesEngineering September2016
E R
O
6 HISTORYThe Riotinto Copper Project workings date back to at least 1000 BC and have been operated by Phoenicians, Romans, British (Riotinto Company and RTZ), Americans (Freeport‐McMoRan) and finally, in the 1990s, the Spanish workers' co‐operative Minas de Riotinto (MRT). Since Roman times, more than 140 Mt of copper and silver ore has been mined from several open‐pit and underground mines. Before the arrival of the British miners in 1873, mining activity mainly consisted of underground mining in the Filón Sur area. Underground mining in the Filón Norte zone commenced in 1880 but was abandoned in 1894. From 1900 work focused on the open‐pit mining of the Salomón, Lago and Dehesa (Filón Norte) zones. In 1940 open‐stoping commenced in the Quebrantahuesos zone and continued until 1970. Mining then switched to the low‐grade sulfide stockwork ores of Cerro Colorado and production of gold and silver from the superficial gossan (oxide) cap. In 1954, the mines were taken over by the Spanish company, Compañia Española de Minas de Riotinto SA. In 1962 the Riotinto Company Limited merged with the Zinc Corporation to form the London‐based Riotinto Zinc Corporation (RTZ), which became a minority shareholder in the Riotinto copper mines. Minas de Riotinto SA operated the mines, modernized the facilities and improved working conditions. Over the years the operating company changed its name successively to Riotinto Patiño and then to Riotinto Minera. Between 1964 and 1967 an exploration campaign resulted in the discovery of the Cerro Colorado copper deposit. In 1969, the copper concentrator started up with a design capacity of 3 Mt/y. This was later expanded to reach the current nominal capacity of 10 Mt/y. In 1971, a gold leach plant commenced operation at a designed throughput of 1.5 Mt/y of oxidized (gossan) ores and was later expanded in increments to reach a design capacity of 6.0 Mt/y. The gold leach plant still exists but is not operational. Between 1875 and 1976 a total of 128 Mt was mined from the massive sulfide ores. The copper concentrate was transported (70 km by rail) to the Huelva smelter. In 1977, Riotinto Patiño sold its shareholding in the mine to Spanish and English groups and Riotinto Minera SA (RTM) was founded. The Cerro Colorado workings were then expanded and the Alfredo shaft was modernized. A new processing plant was built in 1969 and extended in 1982‐1985 by the then operating Company Riotinto Minera SA. Mining continued until 1987 when low copper prices forced the closure of the copper plant and a reduction of mining operations. Work at the Alfredo shaft ceased and the Cerro Colorado operation was restricted to the mining and treatment of gossans for gold and silver, at a rate of 190,000 t/month (2 Mt/y) of gossan material. All production was temporarily halted in 1990. In 1992 RTZ sold its shares in the mine to Freeport‐McMoRan Inc. and Minas de Riotinto SAL (MRT) was founded. In 1995, Freeport as the major shareholder in MRT decided to close the mine and focus investment in the smelter at Huelva.
TechnicalReportontheMineralResourcesandReservesoftheRiotintoCopperProject
Page6‐3
OreReservesEngineering September2016
E R
O
The mine was acquired by MRT and from 1995 MRT operated the mine as a workers’ cooperative comprising former senior management and the unions. Between 1995 and 2001 MRT mined 25 Mt of ore at an average grade of 0.57% Cu. During this period an annual production of 7.3 Mt was achieved in 1997; a peak annual throughput of 9 Mt/y was achieved in 1998. The mine was closed again in 2001 due to the low copper price. As a result of closure more than 400 workers were made redundant. Of these, over 300 were retired and 100 were placed by the Government onto temporary social welfare pending re‐employment. In 2004, the mineral rights and properties were acquired by Mantenimiento en General del Sur, Mantesur Andevalo SL (MSA), the management of which included former managers of MRT. MSA commenced restoration of the primary crushing and ore feed systems in anticipation of a restart but the group failed to secure the necessary approvals and the mine remained on care and maintenance. With no grid electric power available since 2004, work has focused on monitoring the tailings dams, filing statutory reports and maintaining pumping to avoid effluent discharges and to protect the recent capital works from deterioration. In November 2006, the Australian companies, Oxiana Limited and Minotaur Exploration, entered into a memorandum of understanding with MSA, to invest in MRT. Both companies withdrew from the project in December 2006 and the project was then introduced to EMED‐M in which Oxiana is a founding shareholder. In October 2008, EMED‐M announced that it had completed the acquisition of EMED‐T, the owner of the Riotinto Copper Project, and, as a result of this acquisition, the Company was the sole owner. EMED received the mine permit and restoration plan approval in January 2015 and immediately commenced with construction and refurbishment operations. In October 2015, the shareholders approved of the name change to Atalaya Mining Plc.
6.1 MiningOperationsIn the 1980s, there were four working mines, two open‐pit mines, Corta Atalaya and Cerro Colorado, and two underground mines, Pozo Alfredo (which together with Corta Atalaya, exploited the San Dionisio deposit) and the Planes ‐ San Antonio mine.
6.1.1 CerroColoradoMineThe latest mining operations were focused on the Cerro Colorado ‐ Salomon open pit and the adjacent San Lucas pit located near the treatment plant. The Cerro Colorado deposit contained one of the largest known concentrations of sulfides in the world. It has been estimated that there were originally about 500 Mt of massive sulfides (pyrite) of which about 20% were leached to form gossans. Cerro Colorado has the potential to increase in size by investigation of the adjacent ancient workings at Filón Sur, Filón Norte (Lago), Cerro Salomon, Planes/San‐Antonio and Quebrantahuesos. In the Cerro Colorado pit, altered, grey, felsic volcanics host a major pyrite‐chalcopyrite stockwork, part of which extends below the felsites into mafic volcanics. Alteration closest to the stockworks is chloritic passing to sericitic and silicic further away. Cerro Colorado was opened in 1967 to extract copper, gold and silver from the gossans for treatment through the concentrator's entirely separate copper and gold/silver recovery circuits. The mine was developed as an open pit, with a planned production potential of 39 Mt at 0.8% Cu and 18 Mt of gossan (oxide) ore averaging 2.4 g/t Au and 42 g/t Ag, that formed the top of Cerro Colorado. The pit is

TechnicalReportontheMineralResourcesandReservesoftheRiotintoCopperProject
Page6‐4
OreReservesEngineering September2016
E R
O
1,560 m long, 850 m wide and 230 m deep and covers an area of about 200 ha. The benches were 10 m high and the ramps 20 m wide. Production was 13 Mt/y, of which 3 Mt was copper ore, 1.5 Mt was gold‐silver ore and 8.5 Mt was waste‐rock and marginal ore with < 0.28% Cu. The Cerro Colorado ore was treated in a copper concentration plant with capacity of 10,000 t/day (3 Mt/y) and a gold‐silver concentration plant with a capacity of 4,500 t/day (1.5 Mt/y). Ore from the gossan was crushed in the same plant as the copper ore, in similar units, but separately. When MRT took over the mine in 1995 they elected to restart copper extraction from Cerro Colorado, starting at 4.5 Mt/y, and reduced the rate of processing the gossans to 2 Mt/y. Mining of the gossan ore ceased in 1998. Between 1995 and 2001, 23.9 Mt at 0.54% Cu was processed. Some 19 Mt was mined from Cerro Colorado West, with the remainder coming from Salomon (now known as Cerro Colorado East). Figure 6.1 is a photograph of the western part of the Cerro Colorado mine, looking south and Figure 6.2 shows the Cerro Colorado Pit in plan view.
Figure 6.1 – Cerro Colorado mine (EMED 2012)
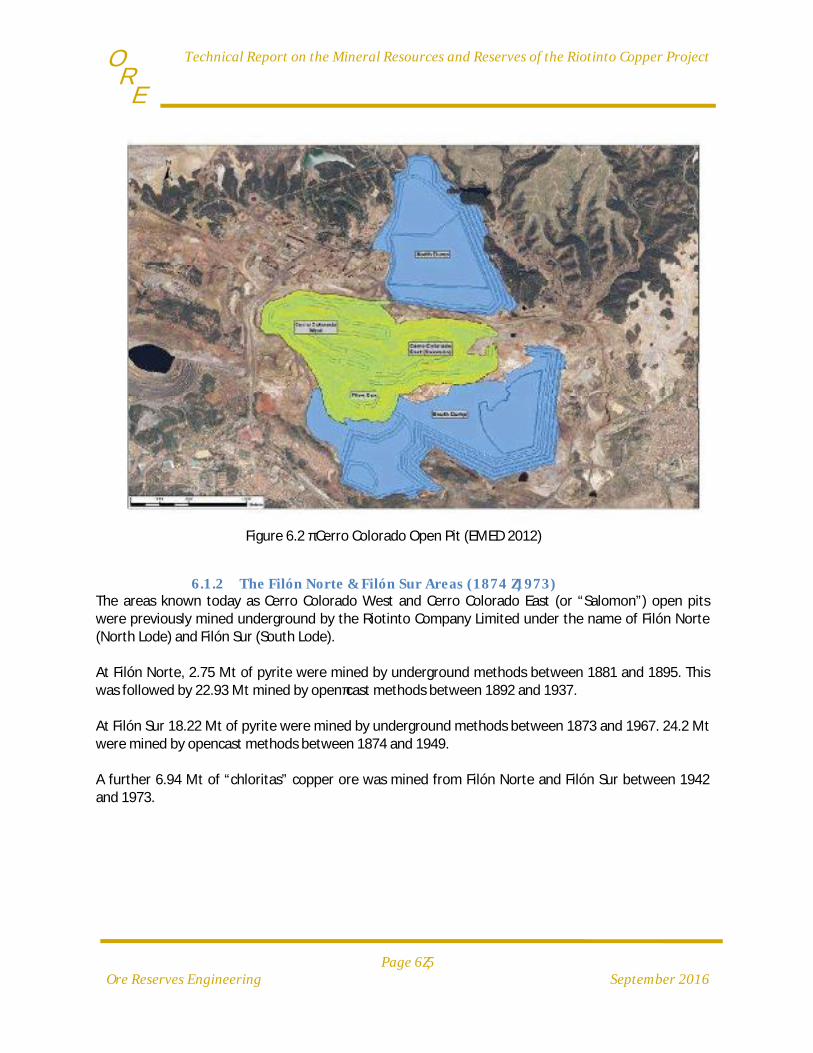
TechnicalReportontheMineralResourcesandReservesoftheRiotintoCopperProject
Page6‐5
OreReservesEngineering September2016
E R
O
Figure 6.2 ‐ Cerro Colorado Open Pit (EMED 2012)
6.1.2 TheFilónNorte&FilónSurAreas(1874‐1973)The areas known today as Cerro Colorado West and Cerro Colorado East (or “Salomon”) open pits were previously mined underground by the Riotinto Company Limited under the name of Filón Norte (North Lode) and Filón Sur (South Lode). At Filón Norte, 2.75 Mt of pyrite were mined by underground methods between 1881 and 1895. This was followed by 22.93 Mt mined by open‐cast methods between 1892 and 1937. At Filón Sur 18.22 Mt of pyrite were mined by underground methods between 1873 and 1967. 24.2 Mt were mined by opencast methods between 1874 and 1949. A further 6.94 Mt of “chloritas” copper ore was mined from Filón Norte and Filón Sur between 1942 and 1973.
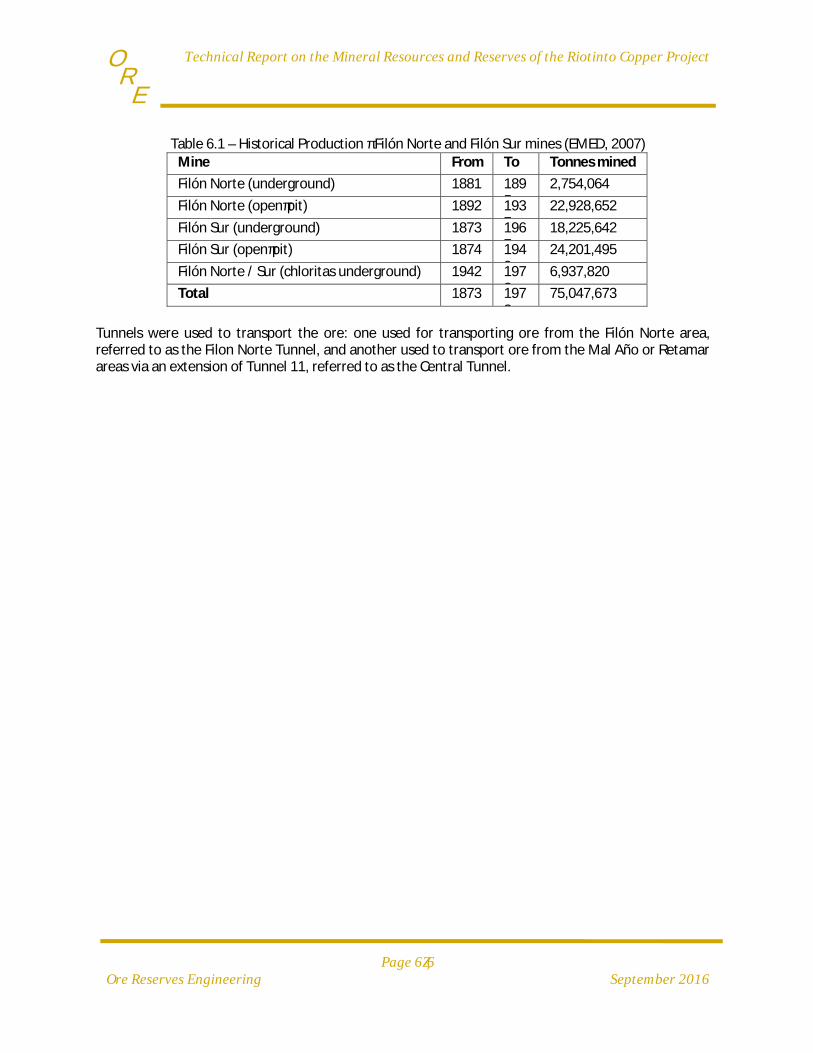
TechnicalReportontheMineralResourcesandReservesoftheRiotintoCopperProject
Page6‐6
OreReservesEngineering September2016
E R
O
Table 6.1 – Historical Production ‐ Filón Norte and Filón Sur mines (EMED, 2007) Mine From To Tonnes mined
Filón Norte (underground) 1881 1895
2,754,064
Filón Norte (open‐pit) 1892 1937
22,928,652
Filón Sur (underground) 1873 1967
18,225,642
Filón Sur (open‐pit) 1874 1949
24,201,495
Filón Norte / Sur (chloritas underground) 1942 1973
6,937,820
Total 1873 1973
75,047,673
Tunnels were used to transport the ore: one used for transporting ore from the Filón Norte area, referred to as the Filon Norte Tunnel, and another used to transport ore from the Mal Año or Retamar areas via an extension of Tunnel 11, referred to as the Central Tunnel.
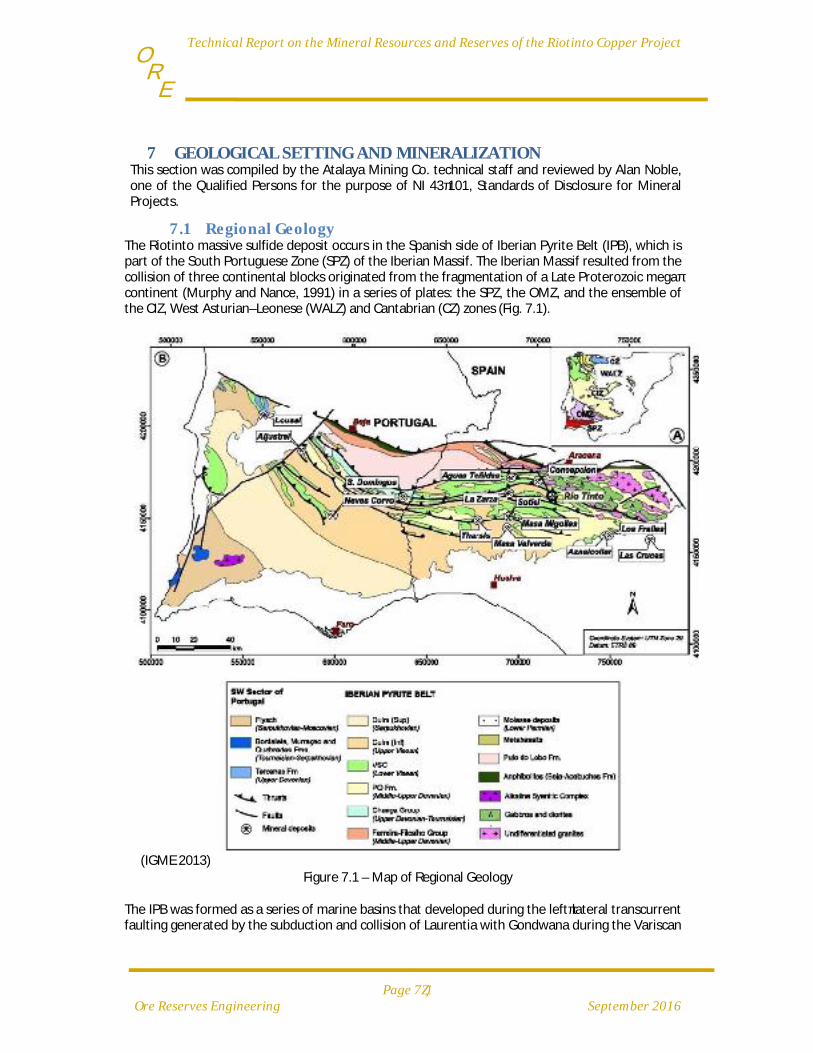
TechnicalReportontheMineralResourcesandReservesoftheRiotintoCopperProject
Page7‐1OreReservesEngineering September2016
E R
O
7 GEOLOGICALSETTINGANDMINERALIZATIONThis section was compiled by the Atalaya Mining Co. technical staff and reviewed by Alan Noble, one of the Qualified Persons for the purpose of NI 43‐101, Standards of Disclosure for Mineral Projects.
7.1 RegionalGeologyThe Riotinto massive sulfide deposit occurs in the Spanish side of Iberian Pyrite Belt (IPB), which is part of the South Portuguese Zone (SPZ) of the Iberian Massif. The Iberian Massif resulted from the collision of three continental blocks originated from the fragmentation of a Late Proterozoic mega‐continent (Murphy and Nance, 1991) in a series of plates: the SPZ, the OMZ, and the ensemble of the CIZ, West Asturian–Leonese (WALZ) and Cantabrian (CZ) zones (Fig. 7.1).
(IGME 2013)
Figure 7.1 – Map of Regional Geology
The IPB was formed as a series of marine basins that developed during the left‐lateral transcurrent faulting generated by the subduction and collision of Laurentia with Gondwana during the Variscan

TechnicalReportontheMineralResourcesandReservesoftheRiotintoCopperProject
Page7‐2OreReservesEngineering September2016
E R
O
orogeny (Late Devonian−early Carboniferous; Silva et al., 1990; Oliveira, 1990). These basins were formed within the passive margin of Laurentia, now represented by the SPZ and adjacent to the collision suture. (A. Martin‐Izard et al. 2015). The oldest rocks in the IPB are a sequence of quartzite and shales (the Phyllite–Quartzite Group, also called PQ) of Devonian age, which are overlaid by a thick sequence of volcano sedimentary rocks (the Volcanic Sedimentary Complex, VSC) that host most of the mineralization of the IPB. The VSC is a highly variable unit, up to 1300 m thick of uppermost Devonian to Lower Carboniferous (ca. 356–349 Ma). The VSC is formed by dacitic–rhyolitic dome complexes, basaltic lava flows, mafic sills, and thick pumice‐ and crystal‐rich felsic volcanoclastic units interbedded with detrital sedimentary rocks, mostly mudstone with some greywacke and sandstone. The depositional environment appears to be dominated by submarine mass‐flow tuffs as indicated by Schermerhorn (1971). The earliest Carboniferous (about 360 to 350Ma) was a transitional period characterized by extension forming different submarine basins and abundant bimodal volcanism causing the development of Volcanogenic Massive Sulfide (VMS) mineralization which were mainly hosted along the fracture zones limiting the different basins (Oliveira, 1990). Some of these basin‐forming faults were reactivated as thrusts during later Variscan shortening (Oliveira, 1990; Gumiel et al., 2010a). The IPB contains over 100 massive sulfide and stock work VMS deposits. Over 10 giant (world‐class) VMS deposits, with more than 50 million metric tons (Mt) of ore, are hosted by volcanic rocks or associated shales, and were formed as exhalative ores in brine pools on the sea‐floor or as filled veins and replacement style mineralization (e.g., Solomon et al., 2002; Tornos, 2006; Gumiel et al., 2010a). Riotinto is the largest deposit in the IPB and has been estimated to have held more than 500 Mt of massive pyrite, complex and stockwork types (Williams, 1934; Barriga, 1990; Boulter, 1993; Adamides, 2013).
7.2 GeologyoftheRiotintoDeposit
7.2.1 StratigraphyThe Riotinto deposit occurs on the Volcano‐Sedimentary Complex (VSC) of the IPB, which regionally is formed by a lower mafic volcanic unit composed of basaltic and spilitic pillow lavas and dolerite sills intercalated with bands of slate and chert of Lower Carboniferous, and an overlying felsic volcanic unit composed by rhyodacite lavas and pyroclastic rocks. Based on historical drilling at Riotinto and on available drill‐core logs compiled, the Exploration Department of Atalaya Mining has identified eight main litho‐stratigraphic units from the VSC. In chrono‐stratigraphic order from the bottom to the top, these units are as follows (Table 7.1):
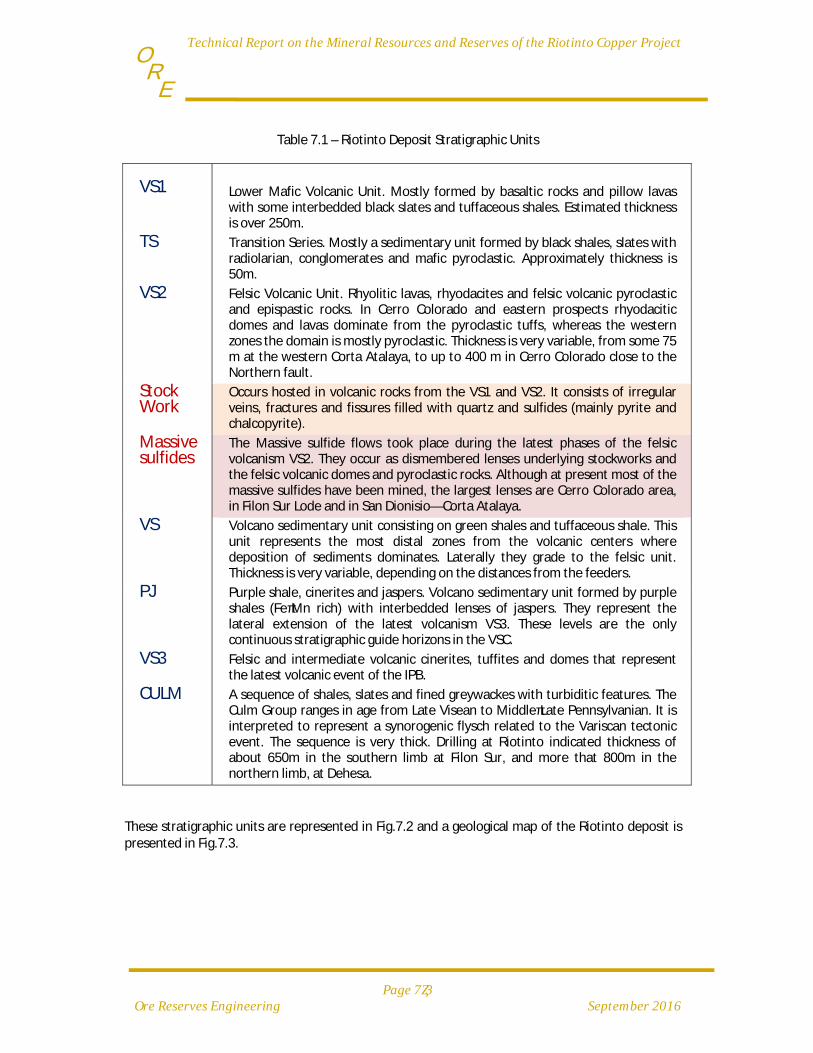
TechnicalReportontheMineralResourcesandReservesoftheRiotintoCopperProject
Page7‐3OreReservesEngineering September2016
E R
O
Table 7.1 – Riotinto Deposit Stratigraphic Units
VS1
Lower Mafic Volcanic Unit. Mostly formed by basaltic rocks and pillow lavas with some interbedded black slates and tuffaceous shales. Estimated thickness is over 250m.
TS Transition Series. Mostly a sedimentary unit formed by black shales, slates with radiolarian, conglomerates and mafic pyroclastic. Approximately thickness is 50m.
VS2 Felsic Volcanic Unit. Rhyolitic lavas, rhyodacites and felsic volcanic pyroclastic and epispastic rocks. In Cerro Colorado and eastern prospects rhyodacitic domes and lavas dominate from the pyroclastic tuffs, whereas the western zones the domain is mostly pyroclastic. Thickness is very variable, from some 75 m at the western Corta Atalaya, to up to 400 m in Cerro Colorado close to the Northern fault.
Stock Work
Occurs hosted in volcanic rocks from the VS1 and VS2. It consists of irregular veins, fractures and fissures filled with quartz and sulfides (mainly pyrite and chalcopyrite).
Massive sulfides
The Massive sulfide flows took place during the latest phases of the felsic volcanism VS2. They occur as dismembered lenses underlying stockworks and the felsic volcanic domes and pyroclastic rocks. Although at present most of the massive sulfides have been mined, the largest lenses are Cerro Colorado area, in Filon Sur Lode and in San Dionisio—Corta Atalaya.
VS Volcano sedimentary unit consisting on green shales and tuffaceous shale. This unit represents the most distal zones from the volcanic centers where deposition of sediments dominates. Laterally they grade to the felsic unit. Thickness is very variable, depending on the distances from the feeders.
PJ Purple shale, cinerites and jaspers. Volcano sedimentary unit formed by purple shales (Fe‐Mn rich) with interbedded lenses of jaspers. They represent the lateral extension of the latest volcanism VS3. These levels are the only continuous stratigraphic guide horizons in the VSC.
VS3 Felsic and intermediate volcanic cinerites, tuffites and domes that represent the latest volcanic event of the IPB.
CULM A sequence of shales, slates and fined greywackes with turbiditic features. The Culm Group ranges in age from Late Visean to Middle‐Late Pennsylvanian. It is interpreted to represent a synorogenic flysch related to the Variscan tectonic event. The sequence is very thick. Drilling at Riotinto indicated thickness of about 650m in the southern limb at Filon Sur, and more that 800m in the northern limb, at Dehesa.
These stratigraphic units are represented in Fig.7.2 and a geological map of the Riotinto deposit is presented in Fig.7.3.

TechnicalReportontheMineralResourcesandReservesoftheRiotintoCopperProject
Page7‐4OreReservesEngineering September2016
E R
O
(IGME 2013)
Figure 7.2 – Stratigraphy of Riotinto

TechnicalReportontheMineralResourcesandReservesoftheRiotintoCopperProject
Page7‐5OreReservesEngineering September2016
E R
O
Figure 7.3 – Geological map of the Riotinto Deposit (IGME 2013)
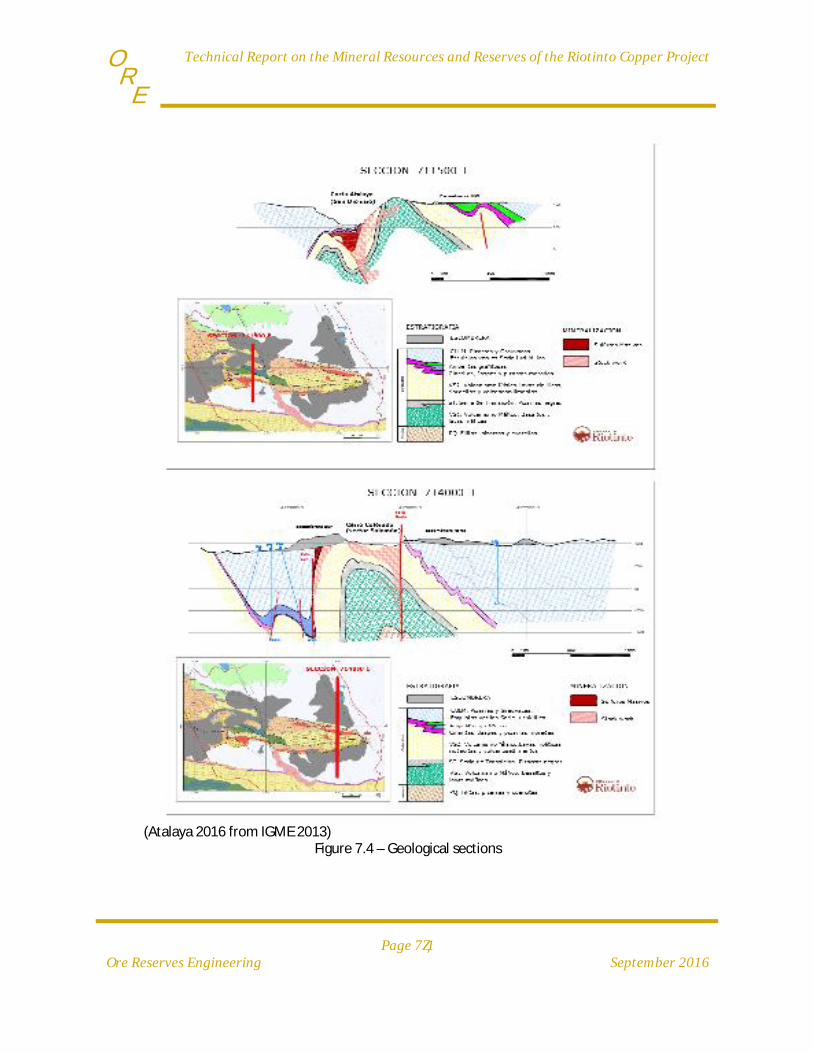
TechnicalReportontheMineralResourcesandReservesoftheRiotintoCopperProject
Page7‐1OreReservesEngineering September2016
E R
O
(Atalaya 2016 from IGME 2013)
Figure 7.4 – Geological sections
TechnicalReportontheMineralResourcesandReservesoftheRiotintoCopperProject
Page7‐2OreReservesEngineering September2016
E R
O
7.2.2 StructureThe Riotinto deposit was formed in an extensional tectonic setting associated with volcanism that took place in the late Devonian‐earlier Carboniferous period in an oceanic seafloor environment. After the extensional period, a compressional event took over during the Variscan‐Hercynian orogeny that formed the Iberian Massif. Riotinto is characterized by having a high intensity of Variscan deformation that generated S to SSW vergence folding structures. The Riotinto deposit forms an E‐W trending anticline, with the northern flank dipping approximately 50 degrees to the south and the southern flank near vertical. Another E‐W syncline fold occurs next to the anticline to the south, Figure 7. 4. Two major subparallel synsedimentary E‐W faults that occur approximately 1km apart at both flanks of the anticline are named Northern Fault and Southern Fault. The felsic volcanism and the deposition of the massive sulfides are closely associated to these two faults that represent the margins of the volcanic basin. The two faults were first activated during a distension period before the variscan orogeny, and they formed an extensional basin. A further tectonic movement of the faults caused a roll‐over anticline and the development of two sub‐basins: the northern basin (Cerro Colorado, Salomon and Dehesa) and the southern basin (Filon Sur, San Dionisio and Atalaya). These faults are also the two main structures that controlled the mineralization flows. Another synsedimentary fault has been identified within the main transtensional basin which has been named Intermediate Fault. This fault also controls the deposition of the felsic volcanic and the massive sulfides. This faulting system is highly affected by the variscan compression that changed the cinematic of the structures: so, the Southern Fault becoming a reverse fault that brings the felsic unit and massive sulfides over the shales from the Culm, and the Northern fault remain as a normal fault. The fault system and the anticline are crosscut by the NW‐SE trending Eduardo Fault zone, which dissects the whole body into two sectors. To the east: the Cerro Colorado and Filon Sur areas. To the west: San Dionisio‐Atalaya.
7.2.3 MetamorphismThe metamorphic grade in Riotinto is mostly of very low grade, normally prehnite‐pumpellyite facies. However, in the northern part of the IPB and near thrusts, deformation is more intense and the rocks are recrystallized within the greenschist facies (Munhá, 1990).
7.2.4 MineralizationMineralization is typical of the VMS deposits and occurs as stockwork and massive sulfides. Beside these, oxidation weathering of the primary mineralization has developed gossans and enrichment zones in places. The stockworks occur as irregular veins, fractures and fissures filled with quartz and sulfides. Two main types of stockworks are identified: 1) pyritic (20% S content) and 2) cupriferous (2% Cu content). The veins become thicker towards the surface. Close to the massive sulfides, most stockworks are made up of veins with lesser amounts of strongly replaced volcanic rocks.
TechnicalReportontheMineralResourcesandReservesoftheRiotintoCopperProject
Page7‐3OreReservesEngineering September2016
E R
O
In the Riotinto district mineralization, hydrothermal alteration and secondary replacement (i.e., silicification, chloritization, sericitization and sulfidization) often occur associated to some stock work zones, and along thin fractures and veins. The alteration zone is characterized by an inner core of chlorite alteration surrounded by an envelope of sericitic alteration, silicification, and pyrite and carbonate alteration. The copper‐rich mineralization is most closely associated with the chlorite altered zone. The massive sulfide consists on lenses of pyrite plus chalcopyrite emplaced on the marine basins surface as a result of black smoker flows. They occur overlaying the felsic volcanic and the stockworks. The primary sulfide mineralization consists mostly of pyrite, with minor chalcopyrite, sphalerite, tetrahedrite and sulfosalts of Sb and As. Chalcopyrite is the predominant copper mineral and mostly occurs within small fractures in the pyrite, on a lesser extent it occurs in isolation. The massive sulfide deposits are located as dismembered lenses along the axis and the flanks of the anticline close to the Northern and Southern Faults. The principal deposits are San Dionisio‐Atalaya, Filón Sur, Filón Norte (Cerro Colorado, Dehesa, Lago and Salomon). Nowadays, massive sulfides remain only at San Dionisio‐Atalaya. At Filon Sur and Filon Norte, all the massive sulfides were mined. In the core of the anticline at Cerro Colorado‐Salomon open pit, it is believed that the deposits originally formed an almost continuous lens of massive sulfides of about 5 km long, 750m wide and 40m thick, containing more than 500 million tonnes of sulfide mineralization. Well‐developed stockwork mineralization occurs in the volcanic rocks that underlay parts of the massive sulfide ore at all the zones from Filon Norte. Beside the stock work and the sulfides, secondary mineralization occurs in places. An important volume of sulfides in Cerro Colorado and minor amounts in Corta Atalaya have developed extensive gossans, which were exploited for gold from the sixties to the end of 1998. The oxidation gossan and the zone of supergene enrichment are characterized by the occurrence of the secondary minerals goethite‐limonite and chalcocite‐covellite respectively. Figure 7.5 shows a schematic N‐S cross section through the Cerro Colorado deposit.

TechnicalReportontheMineralResourcesandReservesoftheRiotintoCopperProject
Page7‐4OreReservesEngineering September2016
E R
O
Figure 7.5 – Schematic N‐S cross‐section through the Cerro Colorado deposit (EMED 2012)

TechnicalReportontheMineralResourcesandReservesoftheRiotintoCopperProject
Page8‐1OreReservesEngineering September2016
E R
O
8 DEPOSITTYPESThis section was compiled by the Atalaya Mining Co. technical staff and reviewed by Alan Noble, one of the Qualified Persons for the purpose of NI 43‐101, Standards of Disclosure for Mineral Projects. Riotinto is a typical Volcanogenic Massive Sulfide (VMS) deposit, which are formed in extensional tectonic settings of oceanic seafloor, including spreading ridges subductions zones and arc environments. According to the genetic, rock association and geodynamic setting, the Riotinto volcanic‐hosted pyrite‐chalcopyrite mineralization is classified as felsic siliciclastic of Kuroko type. It occurred as lenses of polymetallic massive sulfide that took place at the sea floor in a submarine volcanic environment during the earlier Carboniferous, some 350 Ma. As most significant VMS mining districts, the IPB is defined by deposit clusters formed within ocean rifts with volcanic centers. The clustering is attributed to a common heat source that caused large‐scale sub‐seafloor fluid convection systems. As with most VMS deposits, Riotinto has two morphological and genetic components:
A mound‐shaped to tabular strata bound body composed mainly of massive sulfides.
An underlying zone with development of a stockwork system of irregular veins filled by quartz and disseminated sulfides that represent the pipes of the volcanic feeders.
Furthermore, Riotinto as well as other VMS deposits, is characterized by extensive zones of hydrothermal alteration as a result of subvolcanic intrusions and fluid convection systems, which define zones of discordant alteration in the immediate footwall and hanging wall of the deposit.
TechnicalReportontheMineralResourcesandReservesoftheRiotintoCopperProject
Page9‐1OreReservesEngineering September2016
E R
O
9 EXPLORATIONThis section was compiled by the Atalaya Mining Co. technical staff and reviewed by Alan Noble, one of the Qualified Persons for the purpose of NI 43‐101, Standards of Disclosure for Mineral Projects. Since 2014, Atalaya Mining has completed a comprehensive exploration program at the Riotinto project, which has been developed in two programs:
i. Known Ore Zones Exploration. Expansion drilling has been performed on known ore zones to increase mineral resources and reserves trying to expand the mine production scenario over what is known to date.
ii. New Resource Exploration: Exploration performed around the current ore deposit in areas without known mineral resources.
A map showing the exploration activities is presented in the Figure 9.1.
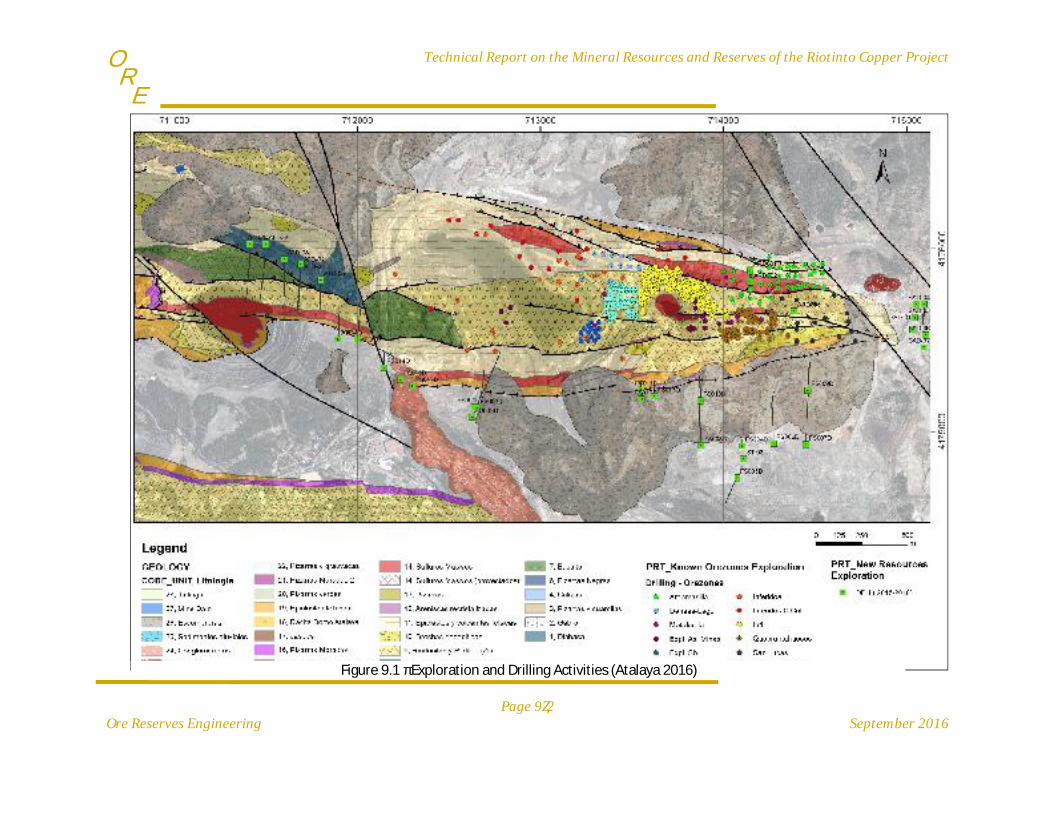
TechnicalReportontheMineralResourcesandReservesoftheRiotintoCopperProject
Page9‐2OreReservesEngineering September2016
E R
O
Figure 9.1 ‐ Exploration and Drilling Activities (Atalaya 2016)

TechnicalReportontheMineralResourcesandReservesoftheRiotintoCopperProject
Page9‐3OreReservesEngineering September2016
E R
O
In parallel to the Resource Drilling, an exploration program to find new resources around the current ore deposit commenced in January 2015 and is still in progress. The new exploration is being carried over the whole Riotinto Concession, in areas outside of the mining plan, where there is no defined mineral resource. The compressive program includes the following:
Compilation of all historical geological and mineral data.
Detailed geological mapping of selected zones.
Compilation of all historical geophysical data.
Ground geophysical surveys over selected zones: MT and Gravimetric.
Diamond drilling.
9.1.1 GeophysicsAtalaya Mining has compiled all the geophysical data from historical surveys carried out by different companies and programs in the IPB (Iberic Pyrite Belt) since 1980, including two regional gravimetric surveys (airborne), one magnetic survey (airborne) and a series of gravimetric and electromagnetic ground surveys. Also all available DTM, topographic and Landsat data has been compiled from diverse sources and databases. The geophysical data has been reprocessed and modeled in order to generate new exploration targets. In addition, Atalaya Mining has conducted a ground geophysical survey in 2015 covering the northern and the southern flanks of the Riotinto anticline. The survey included measurements of electrical resistivity by Audio‐Magnetotelluric (MT) and Gravimetric methods. The MT method is a passive ground electromagnetic technique that measures the resistivity and conductivity below surface. The MT data produced is still being processed. The Figure 9.2 shows the areas covered by geophysical surveys and Figure 9.3 shows one MT section from the Magnetotelluric profiles completed at the southern flank of the anticline, east of the Filon Sur zone.

TechnicalReportontheMineralResourcesandReservesoftheRiotintoCopperProject
Page9‐4OreReservesEngineering September2016
E R
O
(Atalaya 2016)
Figure 9.2 – Areas surveyed by Geophysics (AMT)
).
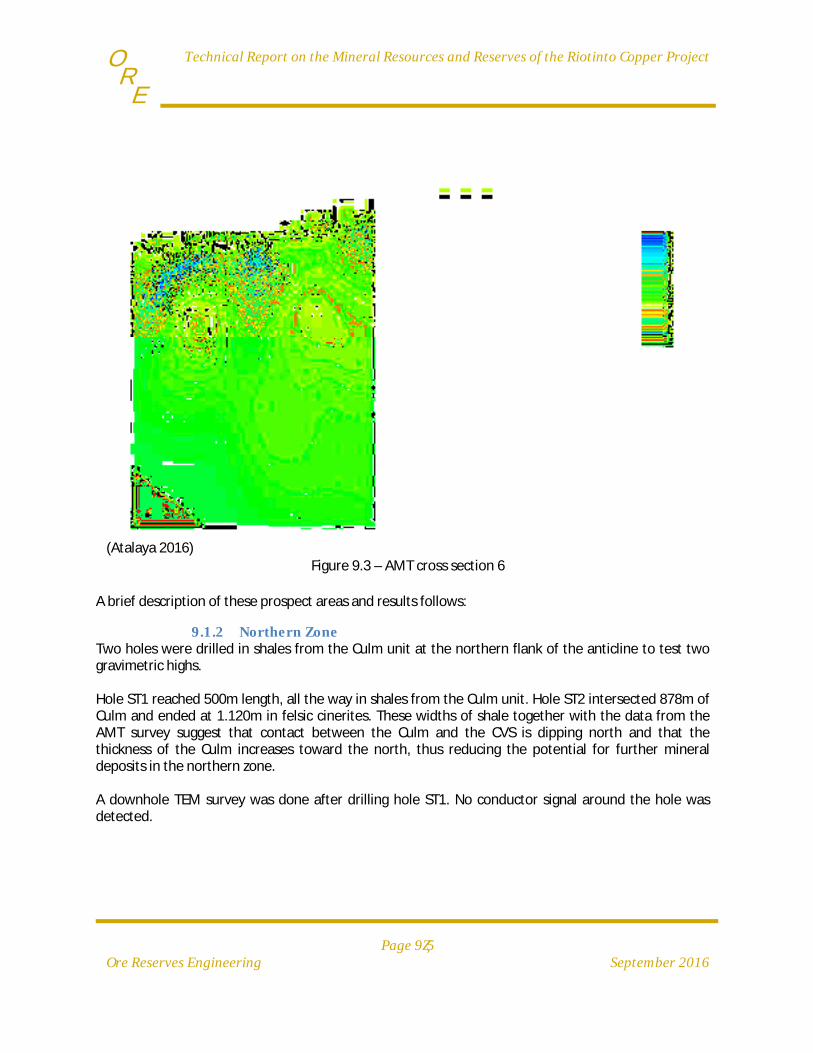
TechnicalReportontheMineralResourcesandReservesoftheRiotintoCopperProject
Page9‐5OreReservesEngineering September2016
E R
O
(Atalaya 2016)
Figure 9.3 – AMT cross section 6
A brief description of these prospect areas and results follows:
9.1.2 NorthernZoneTwo holes were drilled in shales from the Culm unit at the northern flank of the anticline to test two gravimetric highs. Hole ST1 reached 500m length, all the way in shales from the Culm unit. Hole ST2 intersected 878m of Culm and ended at 1.120m in felsic cinerites. These widths of shale together with the data from the AMT survey suggest that contact between the Culm and the CVS is dipping north and that the thickness of the Culm increases toward the north, thus reducing the potential for further mineral deposits in the northern zone. A downhole TEM survey was done after drilling hole ST1. No conductor signal around the hole was detected.
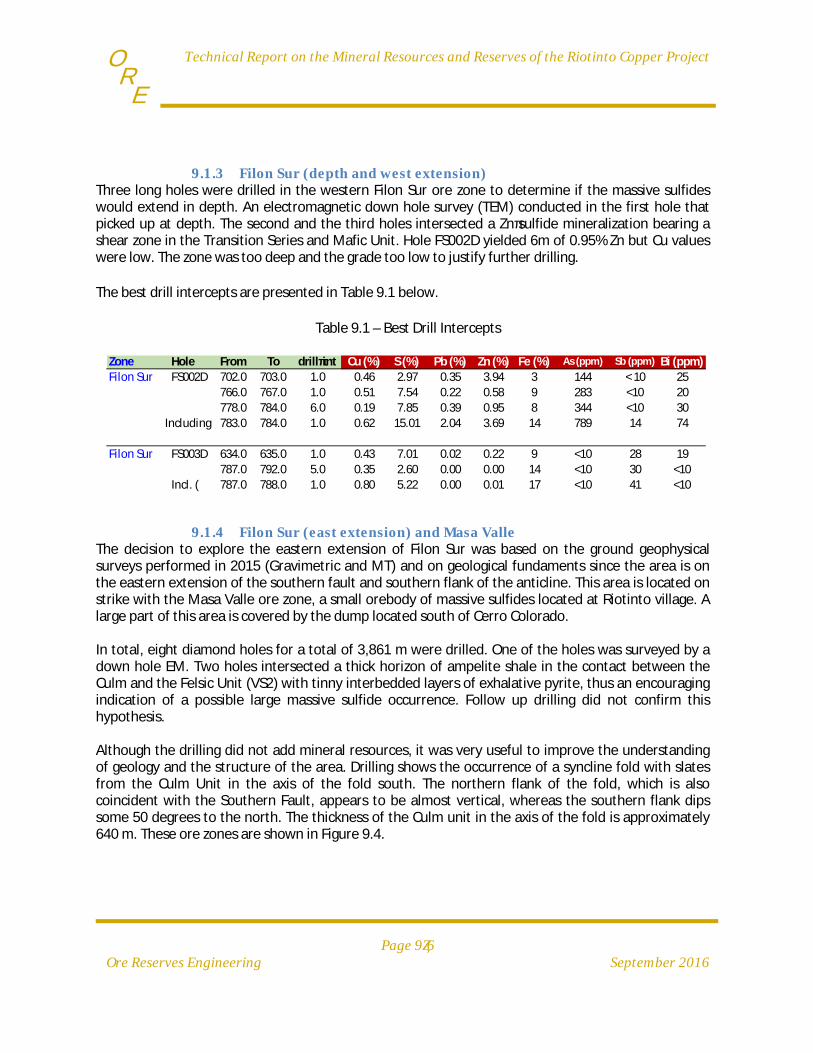
TechnicalReportontheMineralResourcesandReservesoftheRiotintoCopperProject
Page9‐6OreReservesEngineering September2016
E R
O
9.1.3 FilonSur(depthandwestextension)Three long holes were drilled in the western Filon Sur ore zone to determine if the massive sulfides would extend in depth. An electromagnetic down hole survey (TEM) conducted in the first hole that picked up at depth. The second and the third holes intersected a Zn‐sulfide mineralization bearing a shear zone in the Transition Series and Mafic Unit. Hole FS002D yielded 6m of 0.95% Zn but Cu values were low. The zone was too deep and the grade too low to justify further drilling. The best drill intercepts are presented in Table 9.1 below.
Table 9.1 – Best Drill Intercepts
9.1.4 FilonSur(eastextension)andMasaValleThe decision to explore the eastern extension of Filon Sur was based on the ground geophysical surveys performed in 2015 (Gravimetric and MT) and on geological fundaments since the area is on the eastern extension of the southern fault and southern flank of the anticline. This area is located on strike with the Masa Valle ore zone, a small orebody of massive sulfides located at Riotinto village. A large part of this area is covered by the dump located south of Cerro Colorado. In total, eight diamond holes for a total of 3,861 m were drilled. One of the holes was surveyed by a down hole EM. Two holes intersected a thick horizon of ampelite shale in the contact between the Culm and the Felsic Unit (VS2) with tinny interbedded layers of exhalative pyrite, thus an encouraging indication of a possible large massive sulfide occurrence. Follow up drilling did not confirm this hypothesis. Although the drilling did not add mineral resources, it was very useful to improve the understanding of geology and the structure of the area. Drilling shows the occurrence of a syncline fold with slates from the Culm Unit in the axis of the fold south. The northern flank of the fold, which is also coincident with the Southern Fault, appears to be almost vertical, whereas the southern flank dips some 50 degrees to the north. The thickness of the Culm unit in the axis of the fold is approximately 640 m. These ore zones are shown in Figure 9.4.
Zone Hole From To drill‐int Cu (%) S (%) Pb (%) Zn (%) Fe (%) As (ppm) Sb (ppm) Bi (ppm)
Filon Sur FS002D 702.0 703.0 1.0 0.46 2.97 0.35 3.94 3 144 < 10 25
766.0 767.0 1.0 0.51 7.54 0.22 0.58 9 283 <10 20
778.0 784.0 6.0 0.19 7.85 0.39 0.95 8 344 <10 30
Including 783.0 784.0 1.0 0.62 15.01 2.04 3.69 14 789 14 74
Filon Sur FS003D 634.0 635.0 1.0 0.43 7.01 0.02 0.22 9 <10 28 19
787.0 792.0 5.0 0.35 2.60 0.00 0.00 14 <10 30 <10
Incl. ( 787.0 788.0 1.0 0.80 5.22 0.00 0.01 17 <10 41 <10
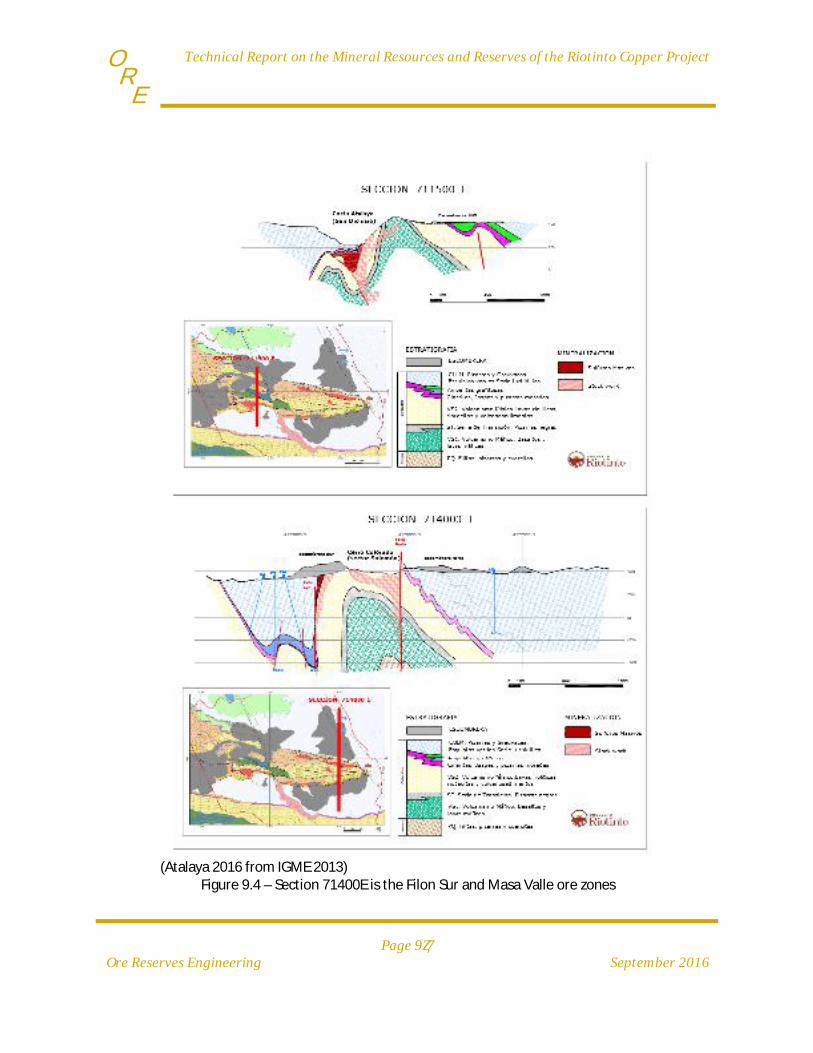
TechnicalReportontheMineralResourcesandReservesoftheRiotintoCopperProject
Page9‐7OreReservesEngineering September2016
E R
O
(Atalaya 2016 from IGME 2013)
Figure 9.4 – Section 71400E is the Filon Sur and Masa Valle ore zones

TechnicalReportontheMineralResourcesandReservesoftheRiotintoCopperProject
Page9‐8OreReservesEngineering September2016
E R
O
9.1.5 SanAntonioSan Antonio is a known deposit located at the eastern end of the Riotinto ore body. It represents the lateral‐east extension of the Planes deposit which was exploited by underground in the early part of the 20th century. Mineralization consists mostly of massive sulfides and lesser stockworks. A database compiled by EMED (now Atalaya mining) in 2011 contained information on 183 drill holes, 188 galleries and assays with 5,865 records for Cu, S, Pb and Zn. The deposit dips approximately 25 degrees to the East, and it occurs at depths between 120m to 200m, as shown on Figure 9.5. A small resource was estimated for this deposit in 2011, but that resource is not included in this current resource and reserve. This deposit is not yet exploited and has already two vertical shafts, a ramp and a series of underground galleries. At the present time, the legal situation splits the deposit in two properties: the western as part of the Riotinto Concession that belongs to Atalaya Mining, and the eastern area which is part of the Tejonera Concession which is at present time under application by Atalaya Mining, but not yet granted. The boundary between the two concessions is the Riotinto River.
(Atalaya 2016)
Figure 9.5 – San Antonio Deposit

TechnicalReportontheMineralResourcesandReservesoftheRiotintoCopperProject
Page9‐9OreReservesEngineering September2016
E R
O
In 2015, Atalaya Mining decided to perform limited drilling in the western part of the deposit, aiming to confirm grades and intercepts. Drilling included 8 diamond holes for 1,504 m. The orebody was intersected by most of the holes, however grades were a bit lower than expected. Drill intercepts over 0.25% Cu are as follows:
Table 9.2 – Drill Intercepts over 0.25% Cu
9.1.6 SanDionisio‐AtalayaSan Dioniso–Atalaya is one of the main Riotinto ore zones which was mined from the 60´s to the late 80´s but still contains unmined resources. According to the compiled historical data, mining was mostly focused on the massive sulfide ore, but the chlorite altered stockwork that is hosted on the northern flank over +100 m above sea level has not been mined out. The Atalaya Mining Exploration Department is currently undertaking a drilling program to evaluate these resources. Results from 4 diamond holes confirmed the occurrence of a subvertical chlorite altered stockwork zone overlaying the massive sulfides (already mined) in the northern flank of the orebody.
Zone Hole From To drill‐int Cu (%) S (%) Pb (%) Zn (%) Fe (%) As (ppm) Sb (ppm) Bi (ppm)
San Antonio SAD‐01 92.0 104.0 12.0 0.84 34.42 0.04 0.06 30 6632 277 118119.0 126.0 7.0 1.01 10.82 0.01 0.05 9 604 29 108132.0 133.0 1.0 0.32 6.28 0.04 0.30 5 455 28 15146.0 147.0 1.0 0.32 9.90 0.01 0.10 8 283 42 <10
San Antonio SAD‐02 143.0 148.0 5.0 0.58 13.17 0.02 0.13 10 2172 79 118159.0 162.0 3.0 0.80 12.50 0.01 0.07 9 620 37 46173.0 177.0 4.0 0.30 9.10 0.01 0.09 7 2032 21 87195.0 206.0 11.0 0.47 8.81 0.01 0.02 9 248 65 <10
San Antonio SAD‐03 134.0 135.0 1.0 0.44 15.48 0.05 0.04 39 415 309 12136.0 141.0 5.0 0.59 24.92 0.02 0.04 24 1569 182 56142.0 143.0 1.0 2.11 45.97 0.11 0.04 39 2253 313 186
San Antonio SAD‐03b 132 148 16 0.92 27.80 1.08 1.97 27.66 2289 219 607170 198 28 0.23 8.14 0.01 0.20 8.32 734 41 27
San Antonio SAD‐04 109 110 1 0.3 6.26 0.06 0.09 6.4 319 11 7123 124 1 0.2 3.83 0.00 0.05 3.41 302 12 9
San Antonio SAD‐05 81 88 7 0.53 9.90 0.04 0.03 10.01 1424 25 56
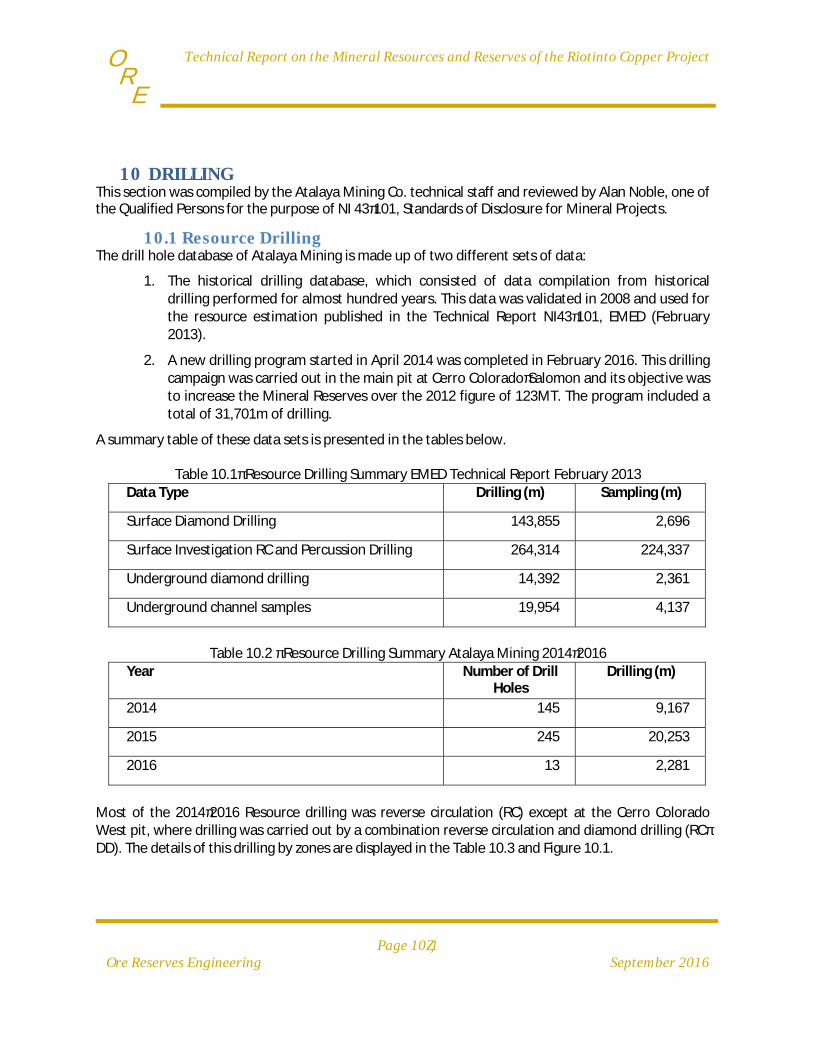
TechnicalReportontheMineralResourcesandReservesoftheRiotintoCopperProject
Page10‐1OreReservesEngineering September2016
E R
O
10 DRILLINGThis section was compiled by the Atalaya Mining Co. technical staff and reviewed by Alan Noble, one of the Qualified Persons for the purpose of NI 43‐101, Standards of Disclosure for Mineral Projects.
10.1 ResourceDrillingThe drill hole database of Atalaya Mining is made up of two different sets of data:
1. The historical drilling database, which consisted of data compilation from historical drilling performed for almost hundred years. This data was validated in 2008 and used for the resource estimation published in the Technical Report NI43‐101, EMED (February 2013).
2. A new drilling program started in April 2014 was completed in February 2016. This drilling campaign was carried out in the main pit at Cerro Colorado‐Salomon and its objective was to increase the Mineral Reserves over the 2012 figure of 123MT. The program included a total of 31,701m of drilling.
A summary table of these data sets is presented in the tables below.
Table 10.1‐ Resource Drilling Summary EMED Technical Report February 2013 Data Type Drilling (m) Sampling (m)
Surface Diamond Drilling 143,855 2,696
Surface Investigation RC and Percussion Drilling 264,314 224,337
Underground diamond drilling 14,392 2,361
Underground channel samples 19,954 4,137
Table 10.2 ‐ Resource Drilling Summary Atalaya Mining 2014‐2016
Year Number of Drill Holes
Drilling (m)
2014 145 9,167
2015 245 20,253
2016 13 2,281
Most of the 2014‐2016 Resource drilling was reverse circulation (RC) except at the Cerro Colorado West pit, where drilling was carried out by a combination reverse circulation and diamond drilling (RC‐DD). The details of this drilling by zones are displayed in the Table 10.3 and Figure 10.1.

TechnicalReportontheMineralResourcesandReservesoftheRiotintoCopperProject
Page10‐2OreReservesEngineering September2016
E R
O
Table 10.3 – Resource Drilling for 2014‐2016
Year. ZONE Type Average depth
Drill meters
2014. PROGRAMA METALURGIA RC 55 664
2014‐2015. PROGRAMA INFILL RC 57 7,026
2014. DEHESA LAGO RC 123 1,477
2015. PROGRAMA INFERIDOS RC 121 4,253
2015. ARGAMASILLA 1 RC 90 1,336
2015. PROGRAMA ZONA INTERMEDIA RC 40 2,600
2015. PROGRAMA QUEBRANTAHUESOS RC 45 2,626
2015. ARGAMASILLA 2 RC 90 1,803
2015. EXPLORACION ZONAS SB RC 62 879
2015. EXPLORACION CERRO SAN LUCAS RC 155 2,332
2015‐2016. REC. INFERIDOS. CERRO COLORADO W RC‐DD 312 5,935
2016. EXPLORACION MINA ZONAS As RC 50 770
Total: 31,701
(Atalaya 2016)
Figure 10.1 – Resource Drilling Zones
TechnicalReportontheMineralResourcesandReservesoftheRiotintoCopperProject
Page10‐3OreReservesEngineering September2016
E R
O
All the exploration targets of the resource drilling were remaining resources that were not mined and hosted in the stockwork associated with the Northern Fault and related basins (Cerro Colorado, Salomon, Dehesa, Lago and Argamasilla). The exploration targets and drill designs varied depending on the zone, but generally designed to follow a review of the extensive historical data, the available block model resource data, and geological interpretation. Statistical analysis was completed to define the sampling interval for the resource drilling. Based on this data, it was decided to set a sampling interval of 5 m for the reverse circulation drilling (RC). However, since the volume of material produced by the 5 m interval was so excessive, it was decided to sample every one meter and composite every 5 samples to make up the 5 m sample. The individual sampling length was 1 m for the diamond drilling but if the hole was part of the resource drilling program, as described above, then five samples of 1m were blended to obtain a composite for a 5 m sample.
10.1.1 MetallurgicalDrillingProgramThe metallurgical drilling program was developed upon request of the Atalaya Mining Metallurgical Department and it intended to collect samples for metallurgical testing. The location of this program is shown in Figure 10.2. A total of 12 holes located in Quebrantahuesos, Isla, Lago, and Salomon were drilled. The historical mining data indicated that the abundance of antimony, arsenic and bismuth in those areas associated with high sulfur content and caused a decrease in the Cu recovery in addition to an increase in penalty elements in the final ore concentrate. The program was conducted using a reverse circulation rig. The samples were collected every 1 meter, split and submitted to a specialized laboratory for the metallurgical testing. All of the holes were located next to the main mineralized bodies.

TechnicalReportontheMineralResourcesandReservesoftheRiotintoCopperProject
Page10‐4OreReservesEngineering September2016
E R
O
(Atalaya 2016)
Figure 10.2 – The holes were located next to the main mineralized bodies.
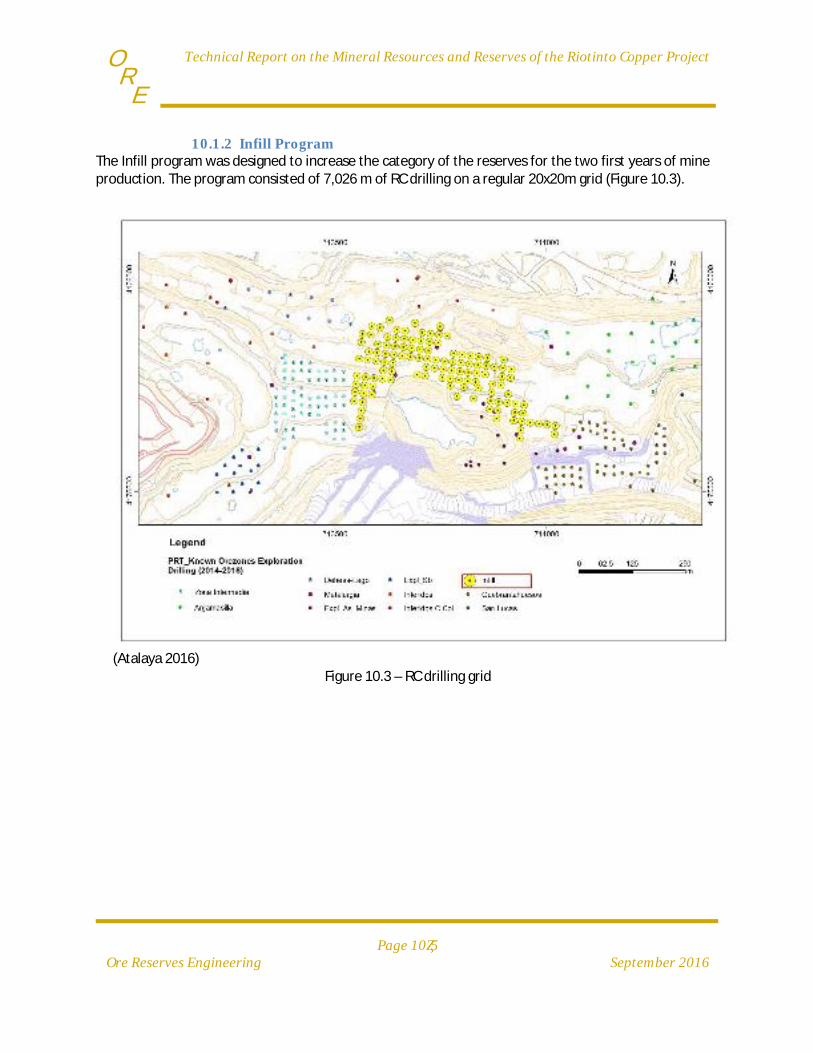
TechnicalReportontheMineralResourcesandReservesoftheRiotintoCopperProject
Page10‐5OreReservesEngineering September2016
E R
O
10.1.2 InfillProgramThe Infill program was designed to increase the category of the reserves for the two first years of mine production. The program consisted of 7,026 m of RC drilling on a regular 20x20m grid (Figure 10.3).
(Atalaya 2016)
Figure 10.3 – RC drilling grid
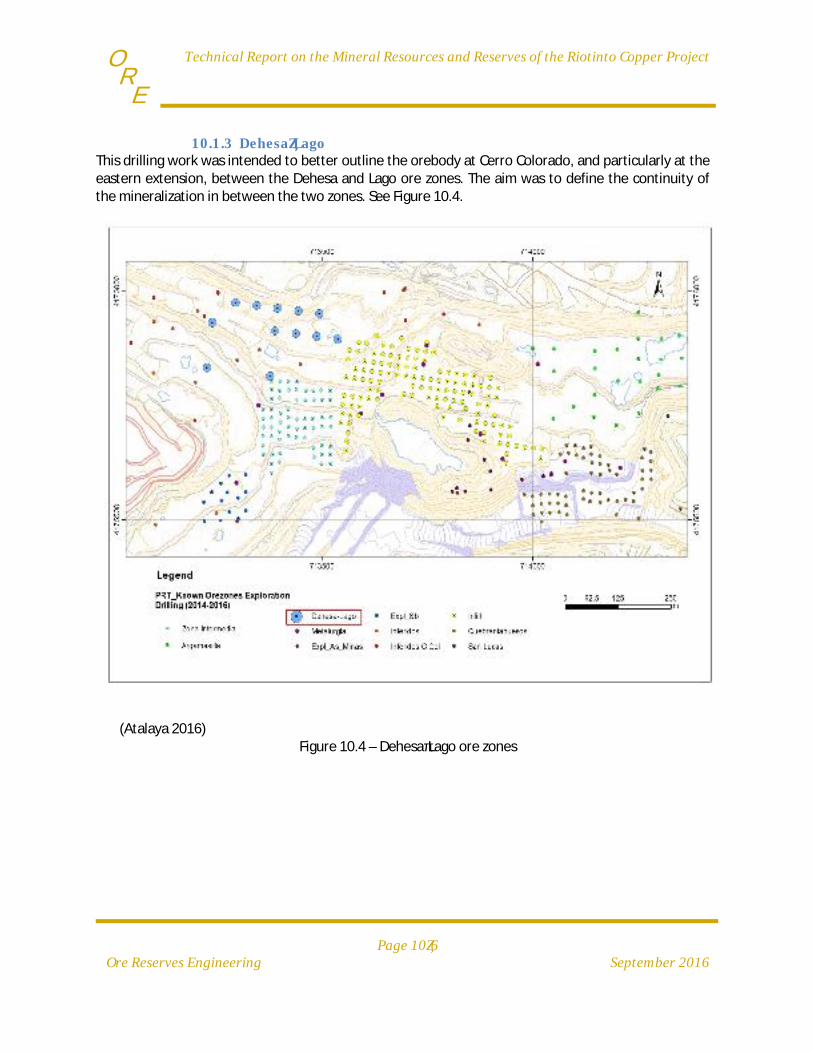
TechnicalReportontheMineralResourcesandReservesoftheRiotintoCopperProject
Page10‐6OreReservesEngineering September2016
E R
O
10.1.3 Dehesa‐LagoThis drilling work was intended to better outline the orebody at Cerro Colorado, and particularly at the eastern extension, between the Dehesa and Lago ore zones. The aim was to define the continuity of the mineralization in between the two zones. See Figure 10.4.
(Atalaya 2016)
Figure 10.4 – Dehesa‐Lago ore zones

TechnicalReportontheMineralResourcesandReservesoftheRiotintoCopperProject
Page10‐7OreReservesEngineering September2016
E R
O
10.1.4 InferredProgramThe Inferred program (Inferidos) was intended to increase the resource and to upgrade the category of resources from inferred‐indicated to proven or measured. The program was carried out in two phases:
First, over all zones that included RC holes up to 200 m depth, and
Second, specifically around the Cerro Colorado pit that consisted of a combination RC‐DD drilling with holes up to 450 m in length to explore deep zones with lack of information.
Figure 10.5 shows the inferred drilling targets.
(Atalaya 2016)
Figure 10.5 – Inferred Drilling Targets

TechnicalReportontheMineralResourcesandReservesoftheRiotintoCopperProject
Page10‐8OreReservesEngineering September2016
E R
O
10.1.5 ArgamasillasAt Argamasillas the drilling was also executed in two programs. See Figure 10.7
The first program was done at Argamasillas West (next to Lago), in an area mined using underground workings. The aim of that program was to confirm reserves within a small mining pit that Atalaya Mining specifically designed for such a zone.
The second program was executed in the southern part of Argamasillas, next to the San
Lucas hill and Quebrantahuesos zones. This area, whose geology was not well understood, had been explored in the past for gold.
(Atalaya 2016)
Figure 10.6 – Argamasillas Program
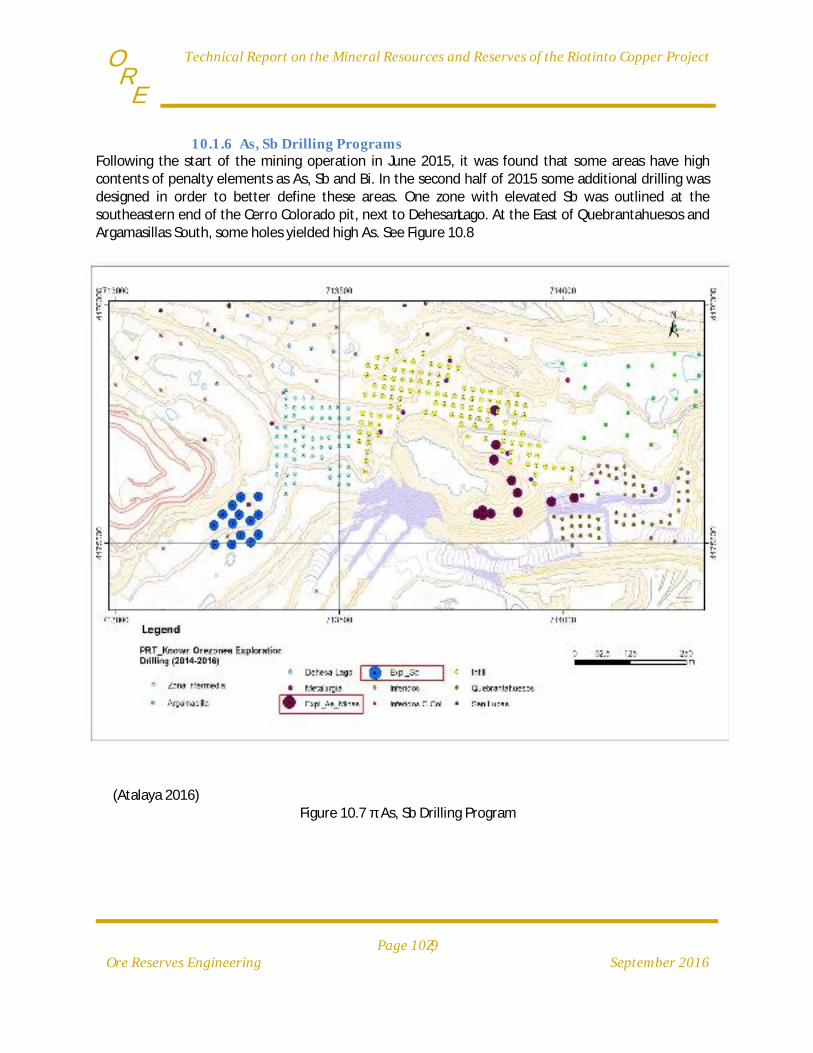
TechnicalReportontheMineralResourcesandReservesoftheRiotintoCopperProject
Page10‐9OreReservesEngineering September2016
E R
O
10.1.6 As,SbDrillingProgramsFollowing the start of the mining operation in June 2015, it was found that some areas have high contents of penalty elements as As, Sb and Bi. In the second half of 2015 some additional drilling was designed in order to better define these areas. One zone with elevated Sb was outlined at the southeastern end of the Cerro Colorado pit, next to Dehesa‐Lago. At the East of Quebrantahuesos and Argamasillas South, some holes yielded high As. See Figure 10.8
(Atalaya 2016) Figure 10.7 ‐ As, Sb Drilling Program

TechnicalReportontheMineralResourcesandReservesoftheRiotintoCopperProject
Page10‐10OreReservesEngineering September2016
E R
O
10.1.7 SanLucasAt San Lucas the drilling was actually exploration drilling (rather than resource drilling) since the zone had not been sufficiently covered by historical drilling and did not contain any resources. Drilling conducted in 2015 confirmed that this zone did not contain significant mineralization. See Figure 10.9.
(Atalaya 2016)
Figure 10.8 ‐ San Lucas Program

TechnicalReportontheMineralResourcesandReservesoftheRiotintoCopperProject
Page10‐11OreReservesEngineering September2016
E R
O
10.2 ExplorationDrillingFive prospective areas were selected for exploration drilling based on data compilation and the completed geophysical surveys. In total 25 diamond holes for 11,316m were completed in 2015, and January and February of 2016. These data are presented in Table 10.4 and Figure 10.5 below.
Table 10.4 – Exploration Drilling
Year. Hole Id (DDH) Hole length ZONE
2015. FS001 694.75 Filon Sur W
2015. FS002 991.30 Filon Sur W
2015. FS003 879.50 Filon Sur W
2015. FS004 804.70 Filon Sur E‐M. Valle
2015. FS005 528.50 Filon Sur E‐M. Valle
2015. FS006 431.90 Filon Sur E‐M. Valle
2015. FS007 451.35 Filon Sur E‐M. Valle
2015. FS008 391.7 Filon Sur E‐M. Valle
2015. ST3 784.9 Filon Sur E‐M. Valle
2015. ST1 500 Culm‐cementación
2015. ST2 1151.3 Culm‐Dehesa
2015. SAD01 182.15 SAN ANTONIO
2015. SAD02 209.55 SAN ANTONIO
2015. SAD03 142.95 SAN ANTONIO
2015. SAD03 bis 206.25 SAN ANTONIO
2015. SAD04 218.55 SAN ANTONIO
2015. SAD05 143.55 SAN ANTONIO
2015. SAD06 191.55 SAN ANTONIO
2015. SAD07 209.65 SAN ANTONIO
2015. ATD‐01 378.2 SAN DIONISIO
2016. ATD‐02 517.80 SAN DIONISIO
2016. ATD‐03 391.5 SAN DIONISIO
2016. ATD‐04 446.3 SAN DIONISIO
2016. FS09D 256.5 Filon Sur E‐M. Valle
2016. FS10D 211.6 Filon Sur E‐M. Valle
Total DDH meters : 11,316.00

TechnicalReportontheMineralResourcesandReservesoftheRiotintoCopperProject
Page10‐12OreReservesEngineering September2016
E R
O
Figure 10.9 ‐ Exploration Drilling Locations
(Atalaya 2016)

TechnicalReportontheMineralResourcesandReservesoftheRiotintoCopperProject
Page11‐1OreReservesEngineering September2016
E R
O
11 SAMPLEPREPARATION,ANALYSIS,ANDMINERALIZATIONThis section was compiled by the Atalaya Mining Co. technical staff and reviewed by Alan Noble, one of the Qualified Persons for the purpose of NI 43‐101, Standards of Disclosure for Mineral Projects.
11.1 HistoricalDrillingProcedures for the historical drilling, much of which was completed in the 1960’s, is not currently available. That drilling was performed by RTZ, a major mining company, and is believed to have been conducted using the best available industry standards at that time.
11.2 AtalayaDrillingAtalaya Mining has implemented a QA/QC program to ensure that the collection and analysis of all the drill samples is of high quality. The Project Geologist and the Exploration Manager are the persons responsible for implementing the protocol procedures and ensuring that the required QA/QC standards are accomplished. A flow chart of the drill sampling procedures is presented in Figure 11.1 at the end of this chapter.
11.3 SitePreparationThe geologist marks the drill hole location with a hand‐held GPS; if more accuracy is required, the surveyor marks the point with a differential GPS. The collar location is marked with a wooden peg and fluorescent paint. If the hole is inclined, the geologist marks the direction with tape and paint. Once the rig is positioned, the geologist fine‐tunes the drill rig position with the compass.
11.4 LoggingandSamplingProceduresAtalaya Mining has two appropriate forms for logging the data from the drill samples produced by RC and diamond drilling. For each drill sample the following data are recorded:
Location, includes the easting‐northing coordinates and the elevation.
Log, including lithology, alteration and other relevant information.
Date of sampling.
Weights, which are recorded twice; once from the bulk sample wet and a second weight after
oven drying.
Person responsible for collecting the samples (geologist, supervisor, assistant, etc.)
Elements analyzed, including; method used (AA, ICP, etc.), laboratory, etc.
Assay results.
RC chips are logged in an appropriate format that includes lithology, alteration, mineralization and other notable characteristics. Every sampled interval is stored in the chip trays and photographed; the picture shows clearly the sample numbers and interval of sampling.
TechnicalReportontheMineralResourcesandReservesoftheRiotintoCopperProject
Page11‐2OreReservesEngineering September2016
E R
O
Diamond core is logged using a more detailed geological form that includes lithology, stratigraphy, detailed structure, alteration, and mineralization. In addition to the geological logging, geotechnical features such as recovery and RQD are recorded in a separate form.
11.4.1 RCSamplesThe sampling interval for RC samples for the Resource Drilling program was established at 5 meters. However, since the volume of material produced by drilling 5 meters is excessive, it was decided to sample every meter and composite every 5 samples to make a 5m composite sample. The steps after the sample collection and before delivery to the lab are shown in the flow chart (Figure 11.1). A rifle splitter is directly connected to the cyclone of the rig to collect the bulk RC‐sample. In case the drilling occurs below the water table, the entire bulk sample is collected in a large polybag, dried for 24 hours, and then split. The bulk sample is weighed, oven‐dried and split again to reduce the volume and weight of each 1m sample to approximately 750‐1000 grams. Five 1m samples are mixed to create composite 5m sample.
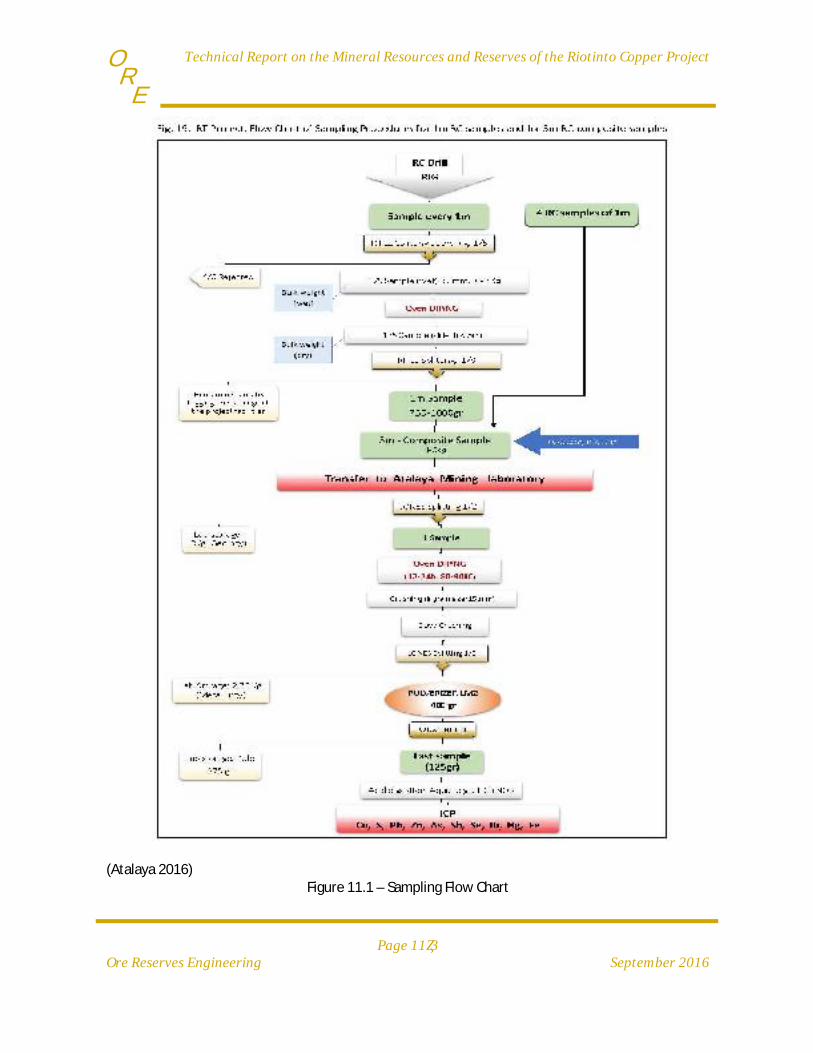
TechnicalReportontheMineralResourcesandReservesoftheRiotintoCopperProject
Page11‐3OreReservesEngineering September2016
E R
O
(Atalaya 2016)
Figure 11.1 – Sampling Flow Chart
TechnicalReportontheMineralResourcesandReservesoftheRiotintoCopperProject
Page11‐4OreReservesEngineering September2016
E R
O
11.4.2 CoreSamplesThe diamond core is collected from the drill rig by a trusted driller who is directly contracted by Atalaya Mining. The drilling is performed under the supervision of the Atalaya Mining geologist in charge. The core is placed by the driller in core boxes. Markers are placed in the core boxes clearly indicating the drill depth at the end of each drill run. Each box is identified using a permanent marker with a box number and from‐to depths. The core is transported to the core shed by two workers from the Atalaya Mining Exploration Departments using a pickup truck. A digital photograph is taken of each core box. The core is inspected and logged by the Atalaya Mining project geologist. The typical sampling length is 1 m but can vary according to lithological variation and program requirements. The drill core samples are split into two halves with one half placed in a new plastic bag along with a sample tag and the other half is placed back into the core box. The core half selected for sampling is crushed and split to get a 1m sample of approximately 750‐1000 grams. If the sample was from the resource drilling program, five samples of 1m each are mixed and spilt to generate a composite a 5m sample.
11.4.3 LabelingEach sample is labeled according to a code bar system following this scheme:
CODE 000 E CODE 000 AE CODE 000 EBIS
Where: CODE: is a code used to identify a zone or a specific program (RT, ETR, FS etc.).
000: is the number of the sample.
E: indicates the laboratory that the sample is being sent to for analysis.
AE: is the code that corresponds to the standard and/or the blank.
BIS: indicates that the sample is a repeat.
The drill samples are delivered to the Atalaya Mining laboratory within batches that usually represent individual holes.
11.5 DensityMeasurementsDensity Measurements (DM) are performed directly on core samples by weighing the core samples out of water, and then when suspended in water, using a calibrated high precision scale. The DM reading (g/cm3) of each sample is obtained by dividing the weight of the dry sample by the apparent weight of the wet sample.
The samples for DM determinations are selected by the Project Geologist. The DM is performed by a senior field assistant and supervised by the Project Geologist.
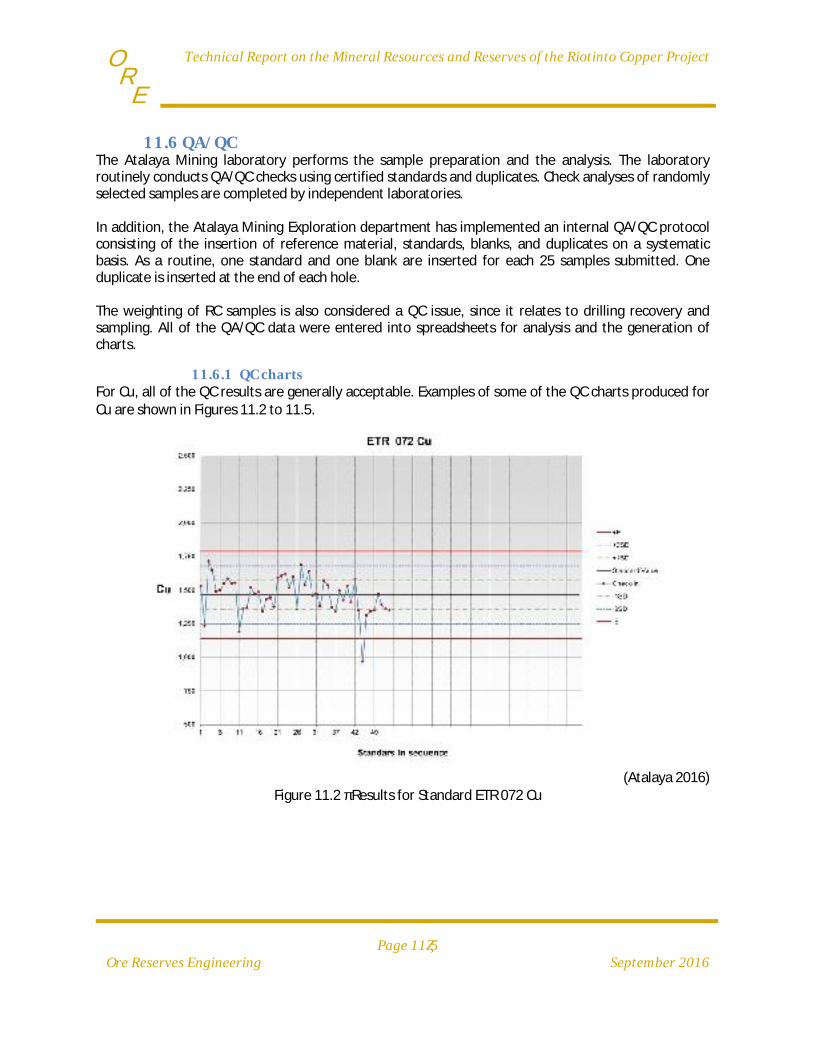
TechnicalReportontheMineralResourcesandReservesoftheRiotintoCopperProject
Page11‐5OreReservesEngineering September2016
E R
O
11.6 QA/QCThe Atalaya Mining laboratory performs the sample preparation and the analysis. The laboratory routinely conducts QA/QC checks using certified standards and duplicates. Check analyses of randomly selected samples are completed by independent laboratories. In addition, the Atalaya Mining Exploration department has implemented an internal QA/QC protocol consisting of the insertion of reference material, standards, blanks, and duplicates on a systematic basis. As a routine, one standard and one blank are inserted for each 25 samples submitted. One duplicate is inserted at the end of each hole. The weighting of RC samples is also considered a QC issue, since it relates to drilling recovery and sampling. All of the QA/QC data were entered into spreadsheets for analysis and the generation of charts.
11.6.1 QCchartsFor Cu, all of the QC results are generally acceptable. Examples of some of the QC charts produced for Cu are shown in Figures 11.2 to 11.5.
(Atalaya 2016) Figure 11.2 ‐ Results for Standard ETR 072 Cu

TechnicalReportontheMineralResourcesandReservesoftheRiotintoCopperProject
Page11‐6OreReservesEngineering September2016
E R
O
(Atalaya 2016) Figure 11.3 ‐ Results for Standard ETR 076 Cu
(Atalaya 2016) Figure 11.4 ‐ Results for Standard ETR 078 CU
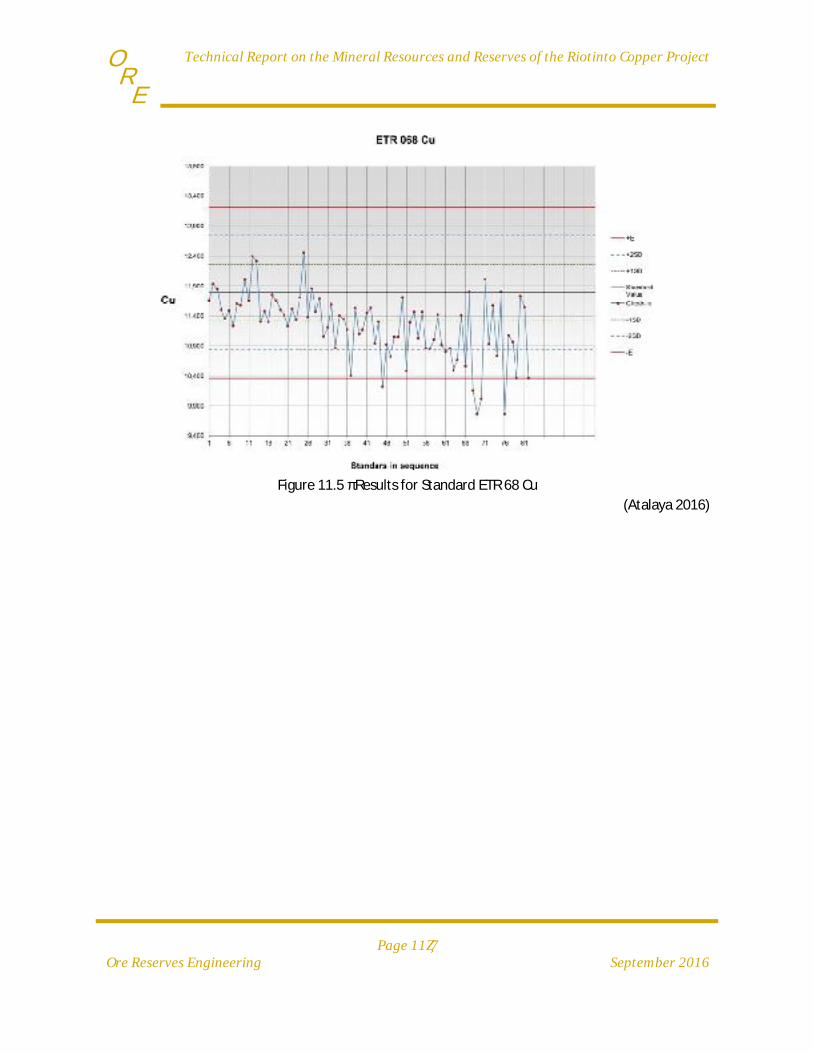
TechnicalReportontheMineralResourcesandReservesoftheRiotintoCopperProject
Page11‐7OreReservesEngineering September2016
E R
O
(Atalaya 2016)
Figure 11.5 ‐ Results for Standard ETR 68 Cu

TechnicalReportontheMineralResourcesandReservesoftheRiotintoCopperProject
Page11‐8OreReservesEngineering September2016
E R
O
11.6.2 RCDrillingRecoveryCharts
The recovery of the RC drilling was calculated for each hole using the weight of the bulk samples and the density of the samples which varies depending of on the sulfur content (S). The data were entered and processed into a spreadsheet, and the resulting recoveries were plotted as shown in Figure 11.6 to Figure 11.9. These charts indicate that the RC recovery is generally good‐to‐excellent, but that recovery frequently falls below 50% at the bottom of the holes. Since low RC recovery is an indicator of sampling problems, the cause of poor recovery should be examined and steps should be taken to improve recovery. It is noted that none of the regions of poor recovery in these charts are in areas that would significantly affect the resource estimate.
Figure 11.6 ‐ RC Recovery for Drill Holes RT244, RT245, and RT246 (Atalaya 2016)

TechnicalReportontheMineralResourcesandReservesoftheRiotintoCopperProject
Page11‐9OreReservesEngineering September2016
E R
O
Figure 11.7 ‐ RC Recovery for Drill Holes RT247, RT248, and RT249 (Atalaya 2016)
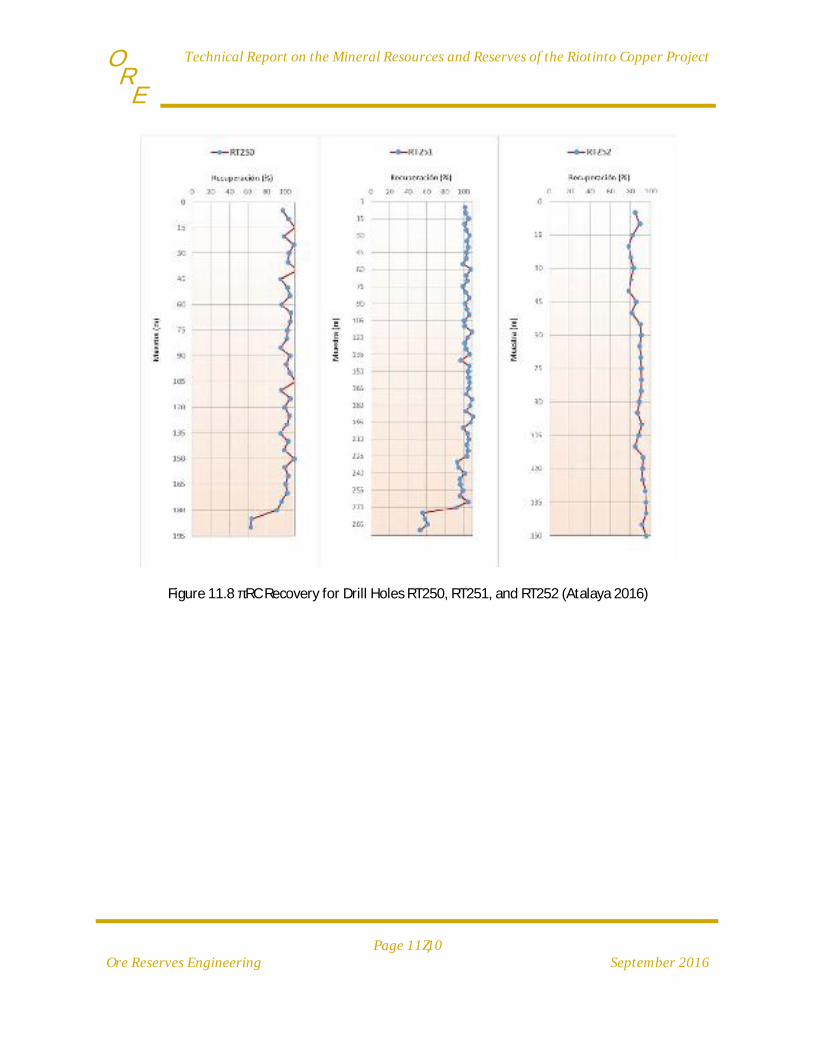
TechnicalReportontheMineralResourcesandReservesoftheRiotintoCopperProject
Page11‐10OreReservesEngineering September2016
E R
O
Figure 11.8 ‐ RC Recovery for Drill Holes RT250, RT251, and RT252 (Atalaya 2016)
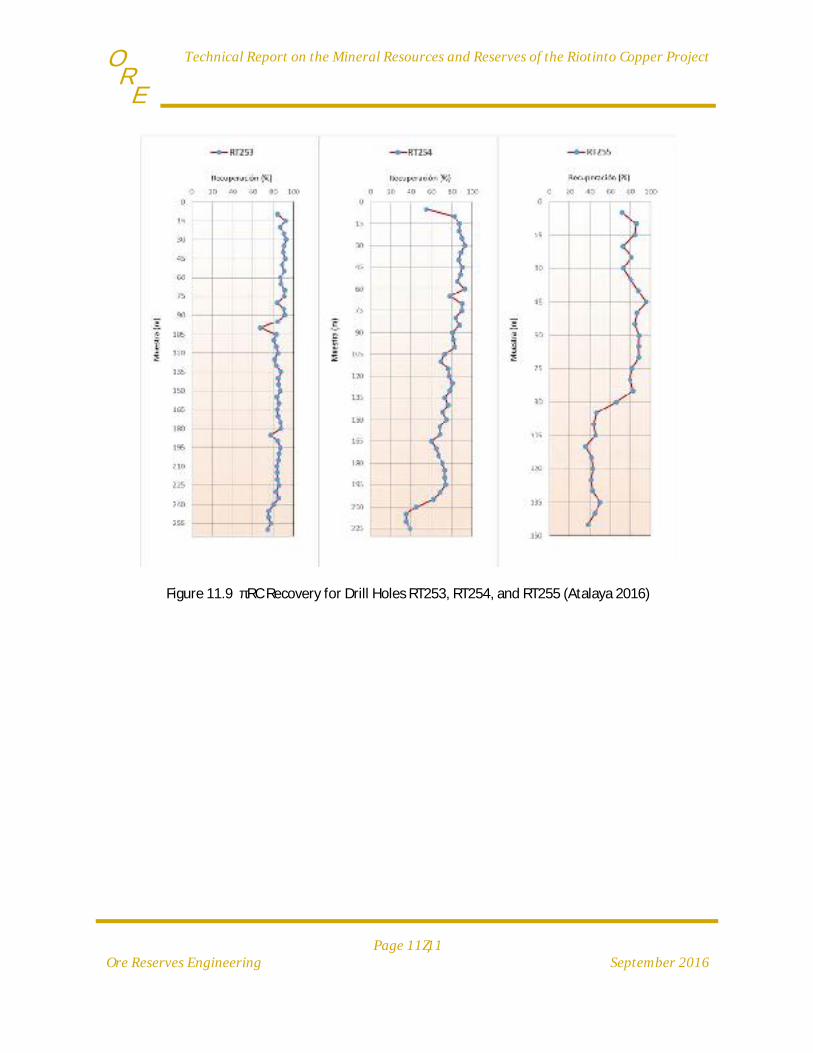
TechnicalReportontheMineralResourcesandReservesoftheRiotintoCopperProject
Page11‐11OreReservesEngineering September2016
E R
O
Figure 11.9 ‐ RC Recovery for Drill Holes RT253, RT254, and RT255 (Atalaya 2016)
TechnicalReportontheMineralResourcesandReservesoftheRiotintoCopperProject
Page12‐1OreReservesEngineering September2016
E R
O
12 DATAVERIFICATIONAlan Noble and Jaye Pickarts, both Qualified Persons for the purpose of NI 43‐101, Standards of Disclosure for Mineral Projects, reviewed and observed various data collection procedures and are of the opinion that they meet current industry standards and requirements. The Atalaya technical staff are very competent and consistently follow the procedures and protocols necessary to ensure that the data being collected is of the highest quality.
12.1 DrillHoleAssaysAs is typical with a restarted mining operation, much of the detailed information on assaying QA/QC was either not part of a standard procedure when the work was done, or has been lost over time. Nevertheless, there are some good indications that the assay data is suitable for resource information, as follows:
1. There is a very good reconciliation between the resource model and mill production for the period from 1995 to 2001. This reconciliation includes nearly 24 million tonnes of plant production. Estimated tonnage is 7% higher than the plant, grade is 2% lower, and contained copper metal is 5% higher. This level of accuracy would be impossible if there were significant problems with assays.
2. Blasthole assay data were paired with 10‐m drill hole composites that were within a 2.1‐m radius of the blastholes. There was no statistically significant difference between the copper grades of the pairs.
3. A small set of data (119 assays) from a 2010 study were available where historical core was reassayed at ALS laboratory. Copper grade at ALS averaged 9% lower than the original RTM historical copper grade, but the difference was less than 1% in the critical range from 0.15% Cu to 1% Cu. ALS sulfur grades averaged 34% higher than the RTM historical sulfur grades. It is unclear what caused this difference, but it is not regarded as critical for resource estimation, since it implies only that density and tonnage may be slightly higher if the ALS sulfur grades are correct.
4. Continued monitoring of the reconciliation, blasthole‐drill hole assay comparisons, and, if possible, reassaying of a larger quantity of historical core is recommended.
A tour of the Proyecto Riotinto assay lab was conducted during the site visit and sample preparation and assaying procedures were reviewed. While all laboratory procedures appear to meet or exceed industry standards, no comparison assays were available from external laboratories and is recommended that outside laboratory testing is added to the lab procedures.
12.2 GeologicDataThe geological data and interpretation were updated by project geologists in conjunction with Dr. Daniel Arias Prieto. The geologic model was reviewed and was determined to be reliable for resource and reserve estimation.

TechnicalReportontheMineralResourcesandReservesoftheRiotintoCopperProject
Page12‐2OreReservesEngineering September2016
E R
O
12.3 DrillHoleDatabaseThe drill‐hole database started with historical electronic data files from historical mining. The historical data were extensively checked in conjunction with AMC mining consultants. During this review process, drill‐hole location, down‐hole surveys, geologic logging, and assays were checked against the original paper documents. A number of minor errors were corrected in the electronic data, which is currently maintained in the RecMin resource estimation system. Data from newer drilling by EMED Tartessus/Atalaya are added using well established procedures that minimize data entry errors. The drill hole database is regarded as reliable for resource estimation.
12.4 DensityDataDensity is estimated from sulfur data using a formula established by Riotinto. More details on density estimation are discussed in Section 14. The use of sulfur grades to estimate density is regarded as reliable for resource estimation.
12.5 TopographicDataThe pre‐mining topography was provided by Riotinto as an AutoCAD drawing that contained topographic contours and other elevation data. The topographic interpretation is based on aerial photogrammetry with a flight date of April 2010, and was prepared by INVAR, S. L. of Sevilla, Spain. As mining has progressed, the mine survey department has conducted in‐pit surveys and has modified the topographic drawing to reflect the mining progress at the end of each month. End‐of‐month topographic data were provided for Jan 2016 and April 2016 for use in this report.
TechnicalReportontheMineralResourcesandReservesoftheRiotintoCopperProject
Page13‐3OreReservesEngineering September2016
E R
O
13 MINERALPROCESSINGANDMETALLURGICALTESTINGThis section was compiled by Atalaya Mining technical staff and reviewed by Jaye Pickarts and Juan Jose Anes Rojas, both are Qualified Persons for the purpose of NI 43‐101, Standards of Disclosure for Mineral Projects.
13.1 SummaryFrom 1995 to 2001 the Riotinto concentrator processed ore with similar characteristics to what is processed today. In that period of time a total of 23.9 Mt of ore at an average 0.54% Cu were processed, which generated information that was used to develop the design criteria and start up plan for the current operation. The old concentrator initially processed 4.5 Mt/y of ore and an expansion increased the concentrator processing capacity to 7.3 Mt/y in 1997; a peak annual throughput of 9 Mt/y was achieved in 1998. Metallurgical testwork results and current plant performance indicate that Riotinto ore is amenable to conventional crushing, grinding, froth flotation, dewatering and filtering processes. The ore for the current operation is mined from 5 different zones (CCW, Isla, Salomon, Lago and QUEB) with different but acceptable metallurgical performance variability when processing it with conventional flotation machines and a mixture of ditiophosphate and thionocarbamate based chemistry at basic pH of over 10.5. The optimum target P80 in the flotation feed has been set to 160 microns as a compromise between copper recovery and throughput.
13.2 ComminutionEnergyConsumption Specific energy consumption for different ores was gathered during the previous Riotinto mine’s operation and it was expected that the new ore to be milled would have similar energy requirements, an assumption that was confirmed after the current operation started. The overall plant energy consumption in the past, including crushing, grinding, flotation, filtering, water system and tailings, was at around 21 to 23 kWh/t. Historical data shows that about 78% of the unit energy consumption was drawn by the crushing and grinding stages, about 16.7 to 18.2 kWh/t. The 9.5 Mt/y projection considered a ball mill and rod mill work index between 14 and 16 kWh/t, a crushing work index of 12.5 to 13 kWh/t, and JK Simmet Axb values between 45 to 60. In general, the Riotinto project has a unit energy consumption that can be qualified as average in the copper ores industry with some maximum and minimum values of 11.3 and 19.8 kWh/t, which have been found to be present about 10% of the total time. The ore types that exhibit high energy consumption are handled using ore blending techniques at the mine and, hence, its impact on processing rate is minimized.
13.3 FlotationTestworkExtensive flotation optimization testwork was carried out on ore samples from the Riotinto mine during 2015. Five ore samples were tested (CCW, Isla, Salomon, Lago and QUEB). Portions of Isla, Salomon, Lago and QUEB were combined to form Composite 2, while ore from CCW formed Composite 1. Most of the flotation optimization testwork was done on Composite 2 and the best condition was used as a basis for the optimization testwork on Composite 1.
TechnicalReportontheMineralResourcesandReservesoftheRiotintoCopperProject
Page13‐4OreReservesEngineering September2016
E R
O
Tests were performed on the individual samples to develop particle size distributions, mineralogical analyses, grindabilty indices, and locked cycle flotation tests. The main objective of the flotation testwork was to optimize the flotation conditions for maximum copper recovery at concentrate grades greater than 20% Cu. Locked cycle testing of Composites 1 and 2 resulted in a Cu recovery between 85% to 90% at a concentrate grade between 22% and 26% Cu. In addition to these external tests, Atalaya Mining undertook a comprehensive series of metallurgical tests on its laboratories from October 2014 to August 2015. These tests confirmed the results obtained by the external laboratory and also confirmed historical data and metallurgical parameters used at the former processing plant. Additional flotation testwork is on‐going to maintain optimal conditions in the plant. Analysis of historical metallurgical performance and its comparison to current plant performance and current metallurgical testing confirms that the samples selected for metallurgical testing represent the ore body well. The current phase 1 has been producing copper concentrates since early August 2015 and has been operating on steady state at an equivalent processing rate of 4.8 Mt/y since November 2015. Metallurgical performance has been in line with the production indicated by historical records and with the testwork results. These results and the metallurgical testing have confirmed the decision of Atalaya Mining to process the Riotinto ore using froth flotation. Current knowledge of the open pit zones allows the processing of selected ore zones to maintain deleterious elements in concentrates as per agreements with clients. Metallurgical testing specifically designed to depress Fe and As has shown positive results. The design criteria and equipment specifications for the rehabilitated plant and for the expansion to 9.5 Mt/y are based on historical performance, laboratory and pilot plant test‐work, and computer simulations.
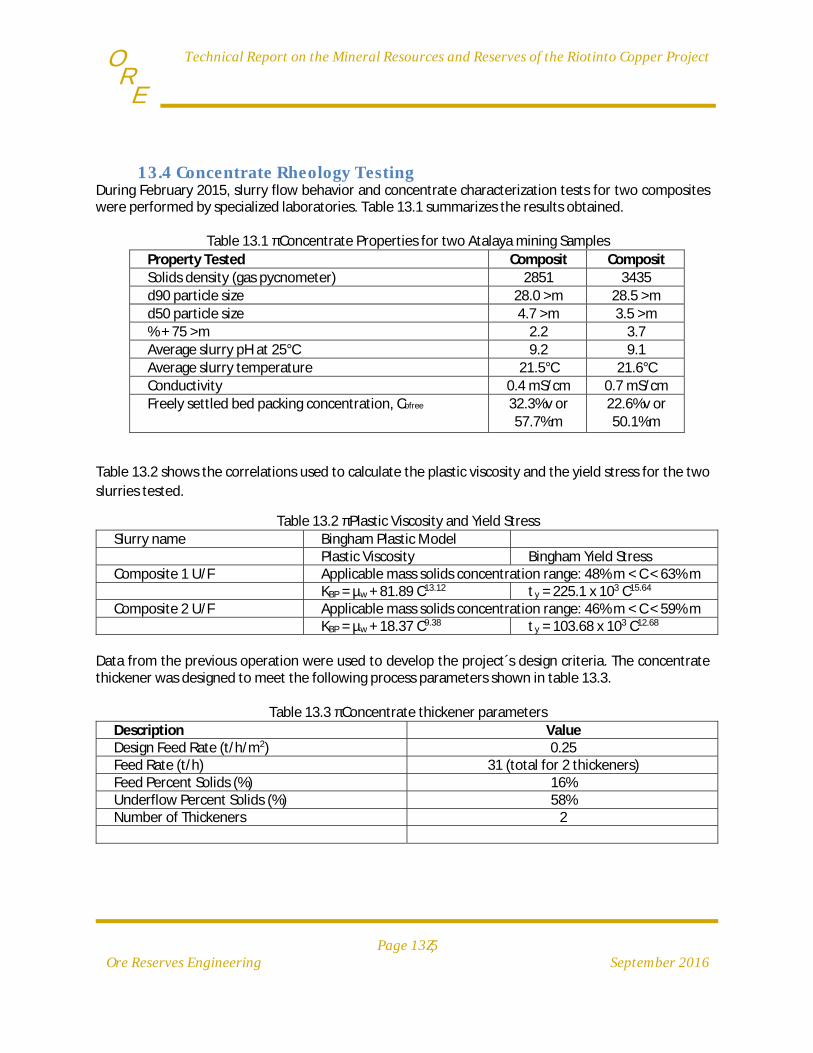
TechnicalReportontheMineralResourcesandReservesoftheRiotintoCopperProject
Page13‐5OreReservesEngineering September2016
E R
O
13.4 ConcentrateRheologyTestingDuring February 2015, slurry flow behavior and concentrate characterization tests for two composites were performed by specialized laboratories. Table 13.1 summarizes the results obtained.
Table 13.1 ‐ Concentrate Properties for two Atalaya mining Samples
Property Tested Composit CompositSolids density (gas pycnometer) 2851 3435 d90 particle size 28.0 μm 28.5 μmd50 particle size 4.7 μm 3.5 μm% + 75 μm 2.2 3.7 Average slurry pH at 25°C 9.2 9.1 Average slurry temperature 21.5°C 21.6°CConductivity 0.4 mS/cm 0.7 mS/cmFreely settled bed packing concentration, Cbfree 32.3%v or
57.7%m 22.6%v or 50.1%m
Table 13.2 shows the correlations used to calculate the plastic viscosity and the yield stress for the two
slurries tested.
Table 13.2 ‐ Plastic Viscosity and Yield Stress Slurry name Bingham Plastic Model Plastic Viscosity Bingham Yield Stress Composite 1 U/F Applicable mass solids concentration range: 48% m < C < 63% m KBP = µw + 81.89 C13.12 y = 225.1 x 10³ C15.64 Composite 2 U/F Applicable mass solids concentration range: 46% m < C < 59% m KBP = µw + 18.37 C9.38 y = 103.68 x 10³ C12.68
Data from the previous operation were used to develop the project´s design criteria. The concentrate thickener was designed to meet the following process parameters shown in table 13.3.
Table 13.3 ‐ Concentrate thickener parameters
Description Value Design Feed Rate (t/h/m2) 0.25 Feed Rate (t/h) 31 (total for 2 thickeners) Feed Percent Solids (%) 16% Underflow Percent Solids (%) 58% Number of Thickeners 2
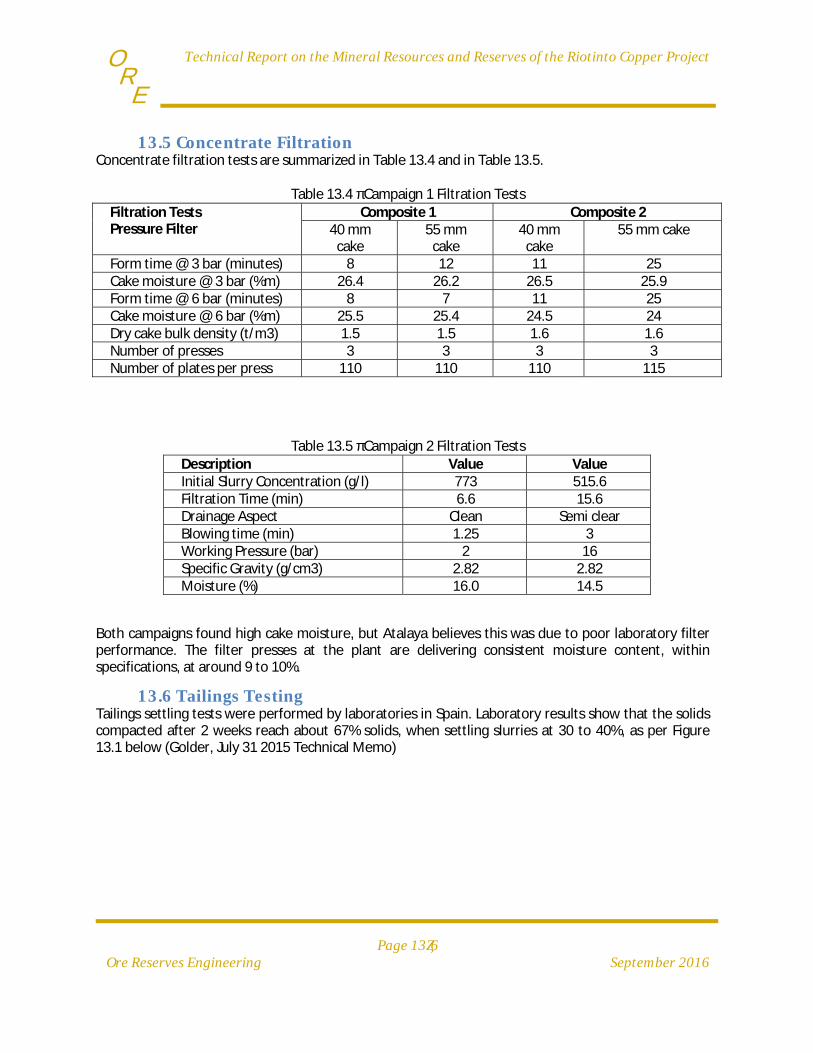
TechnicalReportontheMineralResourcesandReservesoftheRiotintoCopperProject
Page13‐6OreReservesEngineering September2016
E R
O
13.5 ConcentrateFiltrationConcentrate filtration tests are summarized in Table 13.4 and in Table 13.5.
Table 13.4 ‐ Campaign 1 Filtration Tests Filtration Tests Pressure Filter
Composite 1 Composite 2 40 mm cake
55 mm cake
40 mm cake
55 mm cake
Form time @ 3 bar (minutes) 8 12 11 25Cake moisture @ 3 bar (%m) 26.4 26.2 26.5 25.9Form time @ 6 bar (minutes) 8 7 11 25Cake moisture @ 6 bar (%m) 25.5 25.4 24.5 24Dry cake bulk density (t/m3) 1.5 1.5 1.6 1.6Number of presses 3 3 3 3Number of plates per press 110 110 110 115
Table 13.5 ‐ Campaign 2 Filtration Tests Description Value Value Initial Slurry Concentration (g/l) 773 515.6 Filtration Time (min) 6.6 15.6 Drainage Aspect Clean Semi clear Blowing time (min) 1.25 3 Working Pressure (bar) 2 16 Specific Gravity (g/cm3) 2.82 2.82 Moisture (%) 16.0 14.5
Both campaigns found high cake moisture, but Atalaya believes this was due to poor laboratory filter performance. The filter presses at the plant are delivering consistent moisture content, within specifications, at around 9 to 10%.
13.6 TailingsTestingTailings settling tests were performed by laboratories in Spain. Laboratory results show that the solids compacted after 2 weeks reach about 67% solids, when settling slurries at 30 to 40%, as per Figure 13.1 below (Golder, July 31 2015 Technical Memo)
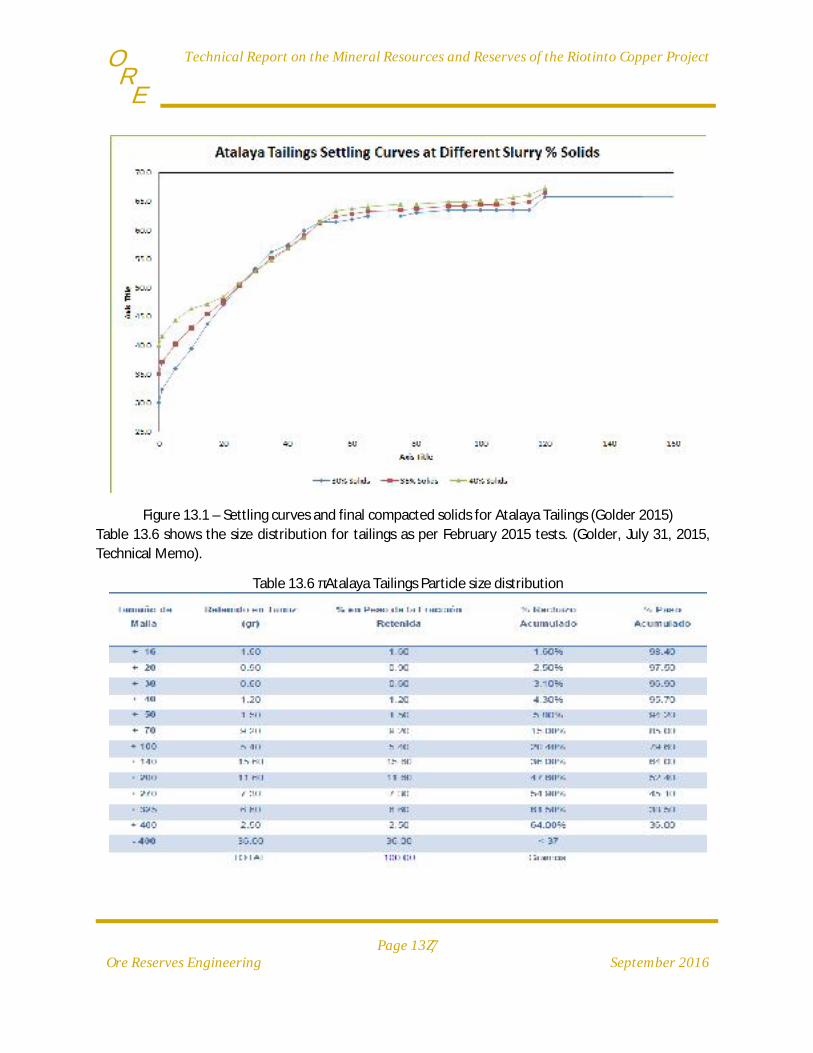
TechnicalReportontheMineralResourcesandReservesoftheRiotintoCopperProject
Page13‐7OreReservesEngineering September2016
E R
O
Figure 13.1 – Settling curves and final compacted solids for Atalaya Tailings (Golder 2015)
Table 13.6 shows the size distribution for tailings as per February 2015 tests. (Golder, July 31, 2015,
Technical Memo).
Table 13.6 ‐ Atalaya Tailings Particle size distribution
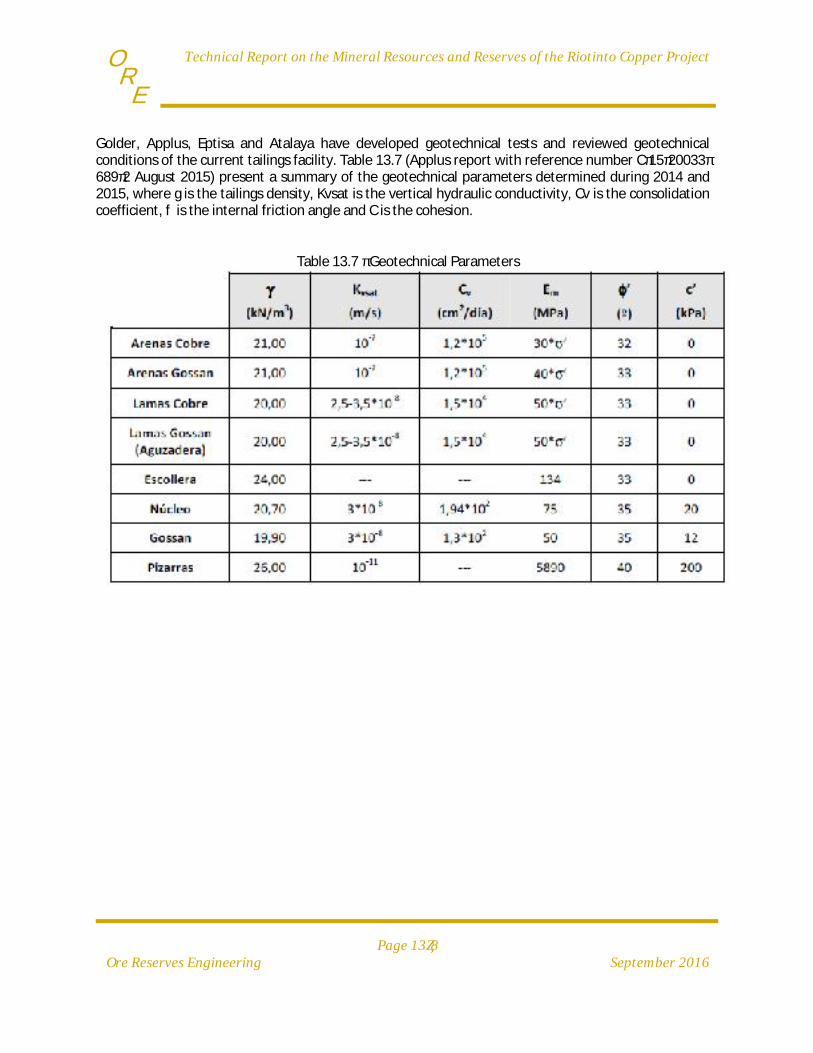
TechnicalReportontheMineralResourcesandReservesoftheRiotintoCopperProject
Page13‐8OreReservesEngineering September2016
E R
O
Golder, Applus, Eptisa and Atalaya have developed geotechnical tests and reviewed geotechnical conditions of the current tailings facility. Table 13.7 (Applus report with reference number C‐15‐20033‐689‐2 August 2015) present a summary of the geotechnical parameters determined during 2014 and 2015, where is the tailings density, Kvsat is the vertical hydraulic conductivity, Cv is the consolidation coefficient, is the internal friction angle and C is the cohesion.
Table 13.7 ‐ Geotechnical Parameters

TechnicalReportontheMineralResourcesandReservesoftheRiotintoCopperProject
Page13‐9OreReservesEngineering September2016
E R
O
Table 13.7 (Cont.) – Geotechnical Parameters

TechnicalReportontheMineralResourcesandReservesoftheRiotintoCopperProject
Page14‐1OreReservesEngineering September2016
E R
O
14 MINERALRESOURCEESTIMATESThis resource estimate was prepared by Alan C. Noble, P.E. of Ore Reserves Engineering, Lakewood, CO, USA. Mr. Noble is a qualified person for resource estimation based on having received a B.S. Degree in Mining Engineering from the Colorado School of Mines, registration as a Professional Engineer in the State of Colorado, USA, and over 46 years of experience with resource estimation on over 150 mineral deposits throughout the world. Mr. Noble is independent of Atalaya Mining and Proyecto Riotinto using all the tests of NI 43‐101.
14.1 ResourceBlockModelThe resource model was created as a three‐dimensional block model using Datamine Studio 3 software. The model block size is 10x10x10 meters, which is consistent with the mining bench height and the estimated selective mining unit. The horizontal extent of the model is defined to cover the Cerro Colorado mineral deposit, plus sufficient space outside the deposit to cover the ultimate pit. Resource model size and location parameters are shown in Table 14.1. Table 14.1 Key items included in the block model are the geologic model zones, flattened XYZ coordinates from Datamine unfolding, copper‐grade zone, Acid/Base zone codes, and resource classification codes. Grades were estimated using inverse‐distance‐power estimation for copper and sulfur. Density was estimated from sulfur grade using the mine’s sulfur grade estimation formula. In addition to the inverse distance estimates, values were estimated for copper and sulfur using Nearest‐Neighbor‐Assignment (NN) and Ordinary Kriging (OK). Other variables include a mined code to identify previously mined blocks, the Datamine search volume code, the number of samples used for estimation, the composite grid‐spacing parameter, and the resource classification code.
Table 14.1 ‐ Resource Model Size and Location Parameters
Minimum (ETRS meters)
Maximum (ETRS meters)
Cell Size
(meters)
Number Cells
Model Size
(meters)
Easting (X) 711,900 714,750 10 285 2850 Northing (Y) 4,174,900 4,176,500 10 160 1600 Elevation(Z) 0 550 10 55 550
14.2 DrillHoleSampleDatabase
14.2.1 DatabaseContentThe drill‐hole data were provided by Riotinto Project engineering and geology personnel as ASCII files containing assays, collar locations, down‐hole surveys, and geologic logging for all drilling in the resource area. Only those core holes and reverse‐circulation holes drilled from the surface were used for this estimate. Drilling used for the resource estimate is summarized in Table 14.2. Underground drill‐hole data, underground channel samples, and shallow, close‐spaced (investigatory) holes were available, but were not used for resource estimation because of concerns regarding the quality of those data.
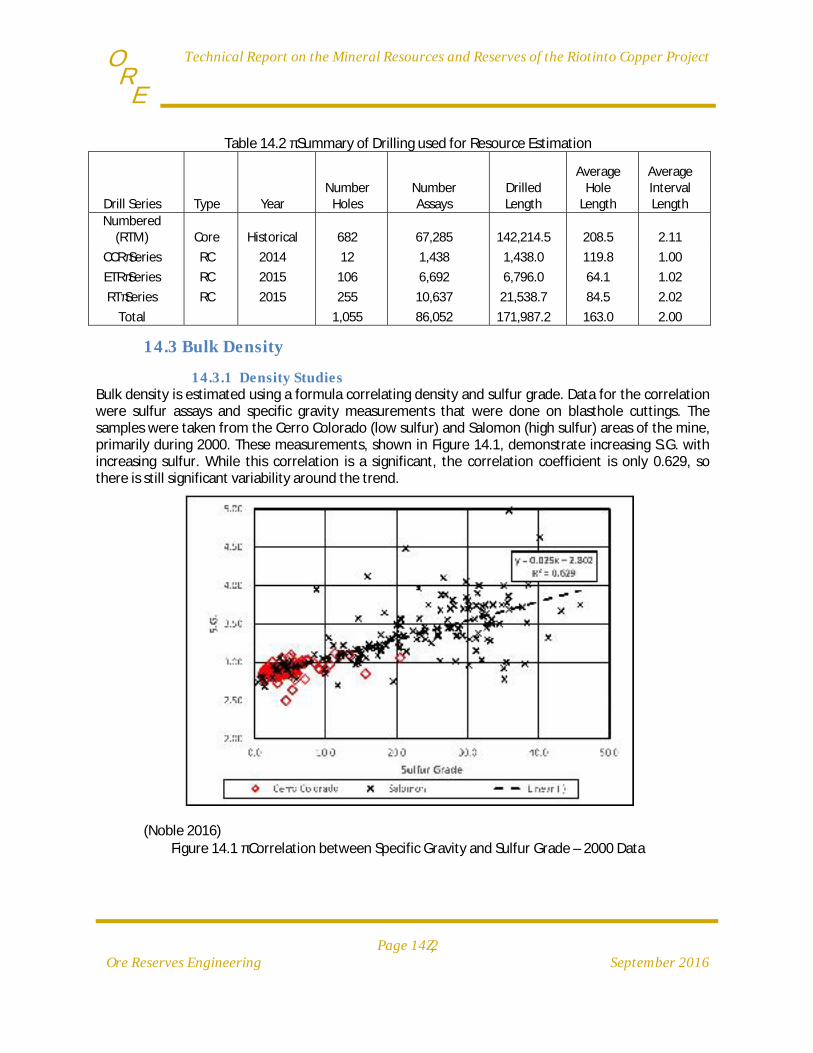
TechnicalReportontheMineralResourcesandReservesoftheRiotintoCopperProject
Page14‐2OreReservesEngineering September2016
E R
O
Table 14.2 ‐ Summary of Drilling used for Resource Estimation
Drill Series Type Year Number Holes
Number Assays
Drilled Length
Average Hole
Length
Average Interval Length
Numbered (RTM) Core Historical 682 67,285 142,214.5 208.5 2.11
CCR‐Series RC 2014 12 1,438 1,438.0 119.8 1.00
ETR‐Series RC 2015 106 6,692 6,796.0 64.1 1.02
RT‐Series RC 2015 255 10,637 21,538.7 84.5 2.02
Total 1,055 86,052 171,987.2 163.0 2.00
14.3 BulkDensity
14.3.1 DensityStudiesBulk density is estimated using a formula correlating density and sulfur grade. Data for the correlation were sulfur assays and specific gravity measurements that were done on blasthole cuttings. The samples were taken from the Cerro Colorado (low sulfur) and Salomon (high sulfur) areas of the mine, primarily during 2000. These measurements, shown in Figure 14.1, demonstrate increasing S.G. with increasing sulfur. While this correlation is a significant, the correlation coefficient is only 0.629, so there is still significant variability around the trend.
(Noble 2016)
Figure 14.1 ‐ Correlation between Specific Gravity and Sulfur Grade – 2000 Data

TechnicalReportontheMineralResourcesandReservesoftheRiotintoCopperProject
Page14‐3OreReservesEngineering September2016
E R
O
A second investigation of the correlation between specific gravity and sulfur grade was conducted in 2010 as part of a comparison between ALS check assays and historical Rio Tinto Mining assays. The results of this study, shown in Figure 14.2, show an excellent correlation between the ALS sulfur assays and the ALS measured specific gravity. These data also show an increasing relationship between S.G. and sulfur grade, but with much less scatter around the regression line and a much higher correlation coefficient of 0.845. The correlation is improved because the S.G. is measured on larger pieces of core compared to small pieces of blasthole cuttings in the 2000 study. Outliers shown as orange points on the chart were reported to be porous, weathered rock that is not representative of the copper resource. (Noble 2016)
Figure 14.2 ‐ Correlation between Specific Gravity and Sulfur Grade – 2010 Data
The Riotinto Project density formula is based on the year 2000 data with a slight discount on the constant from 2.8 to 2.7 to account for void space and fracturing in the in situ rock. Density = 2.7 + (0.025 x %S) The 2010 work suggests that the constant may be lower than indicated by the resource formula, but that the slope of the line may be steeper than the slope of the resource formula. Thus, low‐sulfur rock may be lighter than suggested by the Riotinto formula and high‐sulfur rock may be heavier. These differences are minor, however, and the effect on resources is negligible.
14.3.2 ResourceModelDensityThe Riotinto density formula and IDP sulfur estimates are used for estimation of block model density. A default sulfur grade of zero (0.0) is used for density estimation where there is insufficient sulfur data for an estimated sulfur grade. The default density in waste is thus set to 2.7 t/m3. Density in fill
TechnicalReportontheMineralResourcesandReservesoftheRiotintoCopperProject
Page14‐4OreReservesEngineering September2016
E R
O
material, particularly the backfilled Filon Sur open pit, is assigned a default density of 2.00 t/m3. Volumes mined‐out with underground stopes and other workings were assigned a density of 2.00 t/m3, which is equivalent to assuming that the underground openings have either caved, were backfilled during underground operations, or will be backfilled for safety during current open‐pit operations.
14.4 TopographicModelTopographic contour data were provided by Riotinto as AutoCAD drawing files containing topographic elevation contours, break lines, and various cultural features and buildings. These data are as follows:
1. Original Topo ‐ contains the pre‐mining topographic surface as of 26 April 2010. 2. End Jan 2016 – contains the modified topography including mining through the end of January
2016. 3. End April 2016 – contains the modified topography including mining through the end of April
2016. This is the basis for the resource and reserve estimates.
Triangulated digital terrain models (DTMs) were prepared from the original data as follows:
1. Local mine coordinates were translated to ETRS, if required. 2. Buildings, conveyor belts, and other features not related to the topographic surface were
removed from the data. 3. Intermediate contour intervals on 1‐m intervals were removed so that only the 5‐m contours
remained. 4. The topographic data were triangulated using the Datamine DTM creation tool. 5. The resulting DTM was cropped to the area 50 m outside the resource model limits.
14.5 Mined‐outModelMined‐out portions of the block model were defined as follows:
1. Underground Workings: 3D wireframe models were provided by Riotinto that define the volumes mined as underground workings by previous operators. These wireframes were used to create a block model of the mined‐out volume using 1x1x1‐m sub‐blocks in the 10x10x10‐m resource model prototype. The vertical extent of the 1x1x1‐m sub‐blocks was set to the exact height of the wireframe volumes to maintain maximum precision on the mined‐out block model.
2. Filon Sur Backfill: Contours of the mined‐out and backfilled surface of the Filon Sur open pit were provided by Riotinto to describe that volume. Those contours were converted to a DTM surface, and a block model was created in the 10x10x10‐m prototype that defined the volume between the April 2010 topography and the bottom of the Filon Sur pit. All of these blocks are defined as backfill.
3. 1996 to 2001 Mining: Strings defining the outlines of material mined for the period from 1996 to 2001 were available from work previously done by AMC Mining Consultants. These outlines were used to define blocks within the mined‐out perimeters by the year in which they were mined. Since the previous open‐pit mining was on 10 and 12‐m benches and the current model is on 10‐m benches, most of these mined blocks were defined as partial blocks on multiple 10‐m benches.
TechnicalReportontheMineralResourcesandReservesoftheRiotintoCopperProject
Page14‐5OreReservesEngineering September2016
E R
O
4. 2015 Mining: Current mining from July 2015 through the end of January 2016 was defined initially as the volume above the end Jan 2016 topography and below the April 2010 topography. Where the April 2010 topography was below the end Jan 2016 topography, those blocks were redefined as FILL. The 2015 mined code was used primarily for reconciliation with the end of Jan 2016 mine production, which is the latest mine production report that was available for this study.
5. End April 2016: Final resources and reserves are computed using the end of April 2016 mine topography as the reporting basis. The same procedure as the 2015 mining was used to define the additional blocks mined in February through April 2016.
14.6 GeologicModelThe geologic model was constructed to provide geologic control for grade estimation and to provide parameters for mine planning in the non‐ore‐bearing geologic units. A recent interpretation of the Cerro Colorado deposit had been completed by Dr. Daniel Arias in conjunction with Riotinto technical staff. Review of this interpretation showed that the current resource was confined to the Acid Unit with a smaller portion in the underlying Basic Volcanic Unit. Individual “ore zones” conforming to historical deposit designations also were interpreted by Dr. Arias, but were too tightly confined to assumed grade boundaries and were not used for resource estimation.
14.6.1 AcidZoneThe Acid Zone mineral envelope was constructed based on the Arias Acid Unit wireframe with the following modifications.
1. Cross‐sections were drawn on 25 m intervals rather than the 50 m spacing used in the original interpretation. Sections used the same S7W‐N7E orientation.
2. The section strings for revised interpretation were snapped to drill‐hole geologic contacts to provide better accuracy to the interpretation.
3. The portion of the Acid Zone north of the northern fault boundary did not have sufficient mineralized intersections for resource estimation and was removed from the envelope.
4. The revised interpretation was snapped to the top of the “Intermediate Unit”, which is a consistent marker horizon between the Acid and Basic units.
5. The revised interpretation was snapped to the bottom of gossan, sandy gossan, and leached material.
14.6.2 BasicZoneThe Basic Zone was defined by offsetting downward 120 m parallel to the footwall of the acid zone. Thus, the Basic Zone contains the mineralization in the Intermediate Unit, plus mineralization in the Basic Unit. This simplified model of the Basic Zone provides sufficient control for resource estimation. In addition, drilling in the Basic Zone is much more widely spaced than in the Acid Zone and it is a less important source of resources, so more detailed interpretation is not justified.
14.6.3 UnfoldingThe Datamine unfolding tool was used to flatten the anticlinal fold into a geometry that is as close as possible to the original shape of the deposit. The procedure for unfolding is as follows:
1. The bottom of the Acid Zone was used as the primary index surface (footwall) for unfolding the deposit. Footwall strings were defined using a 25‐m spacing between sections.
TechnicalReportontheMineralResourcesandReservesoftheRiotintoCopperProject
Page14‐6OreReservesEngineering September2016
E R
O
2. The bottom of the Acid Zone was expanded 300 m upwards, parallel to itself to define the index surface (hanging wall) for the top of the anticline. The expanded footwall is used rather than the top of the Acid Zone surface, because the top of the Acid Zone is an erosional surface that is not parallel to the trend of copper mineralization. In general, the 300‐m offset is sufficient to define the hanging wall surface, but there are some minor instances where mineralization does not appear to follow the anticlinal contours.
3. Tag strings were drawn between the footwall and the hanging wall to define the connection between the two surfaces. In general, the crest of the anticline was used as a reference for the tag strings. Tag strings also connected the ends of the footwall and hanging wall strings.
4. A final tag string was drawn to connect horizontally between the section strings. This string generally follows the crest of the anticline.
14.7 CompositingDrill hole assays were composited to 10‐m composites using the standard Datamine downhole compositing routine, COMPDH. Before compositing, drill holes were assigned DOMAIN codes based on the ACID and BASIC wireframe volumes. Composites outside of the wireframes were assigned a default “NOZN” zone code. Composites were then computed with the compositing routine set to compute nominal 10‐m composites that started and ended on DOMAIN boundaries. The resulting composites are as close to 10‐m long as possible, while using all of the assays within the defined zone intervals. Assays were composited using length‐weighted averages for this study. Density‐weighted averaging should be evaluated for future studies.
14.8 CopperGrade‐ZoneModels
14.8.1 CopperGradeDistributionsCopper grades were declustered for analysis of the grade distribution using the acid‐zone, nearest‐neighbor block model and only those blocks in the measured and indicated resource category. The resulting distribution of copper grade, presented in Figure 14.3 as lognormal cumulative probability and lognormal histogram plots, indicates that copper grade is composed of several lognormal populations. A set of four grade sub‐populations were fitted to the raw data using least square fitting on both the cumulative probability plot and on the histogram plot. The resulting distribution fit included the following component populations.
1. A spike at 0.01% Cu, which corresponds to assays rounded off to 0.010. Other rounding spikes are observed at 0.02% Cu and 0.05% Cu, but those were not modeled.
2. A low‐grade population averaging 0.062% Cu and containing about half of the total samples. This population is mostly waste, but contains a small fraction of ore‐grade material.
3. A high‐grade distribution averaging 0.466% Cu. This population is the primary source of ore grade mineralization, but also contains significant waste‐grade mineralization.
4. A very‐high‐grade distribution that averages over 4% Cu and is composed of high‐grade outliers. These high‐grade outliers are observed in both drill holes and blastholes and appear to result from narrow vein structures with limited vertical and lateral extent.
TechnicalReportontheMineralResourcesandReservesoftheRiotintoCopperProject
Page14‐7OreReservesEngineering September2016
E R
O
There is significant overlap between the low‐grade and the high‐grade distributions, such that it is very difficult to differentiate between low and high‐grade distributions based on grade alone. As shown in Figure 14.4, there is a significant probability that a Cu composite could be in either the low‐grade or high‐grade population in the grade range between 0.025% Cu to 0.5% Cu.

TechnicalReportontheMineralResourcesandReservesoftheRiotintoCopperProject
Page14‐8OreReservesEngineering September2016
E R
O
(Noble 2016)
Figure 14.3 ‐ Lognormal probability and histogram plots of Cu grade in the Acid Zone
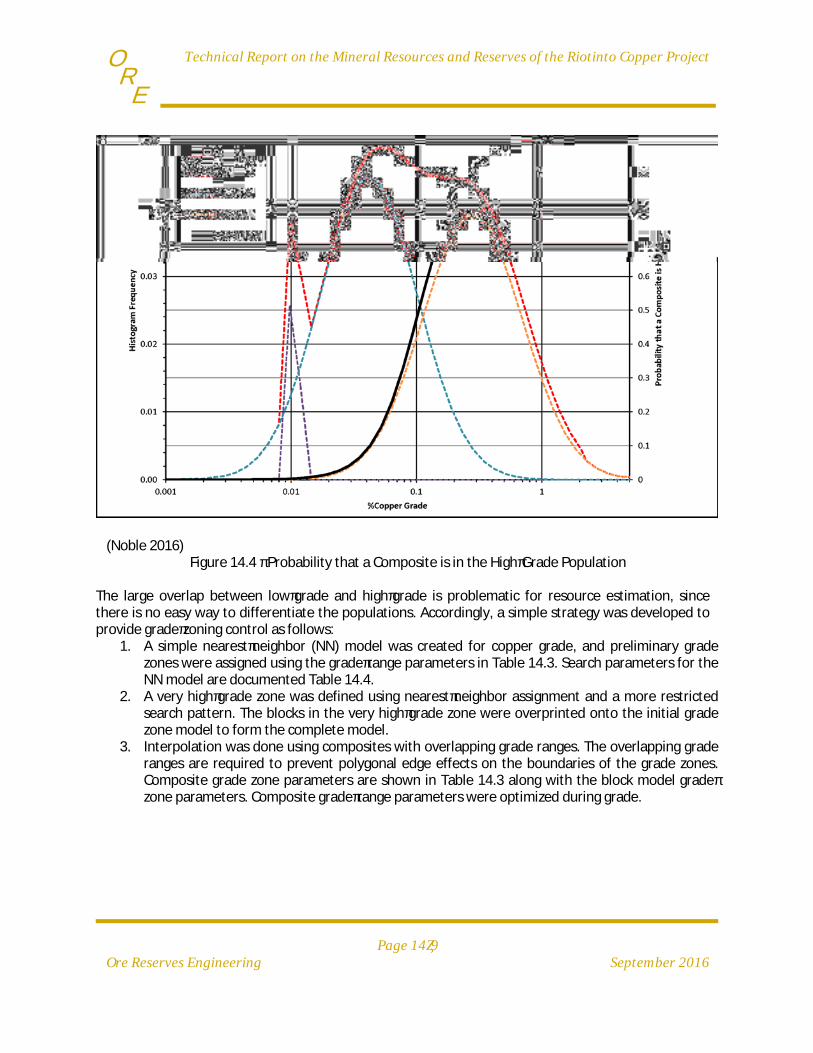
TechnicalReportontheMineralResourcesandReservesoftheRiotintoCopperProject
Page14‐9OreReservesEngineering September2016
E R
O
(Noble 2016)
Figure 14.4 ‐ Probability that a Composite is in the High‐Grade Population
The large overlap between low‐grade and high‐grade is problematic for resource estimation, since there is no easy way to differentiate the populations. Accordingly, a simple strategy was developed to provide grade‐zoning control as follows:
1. A simple nearest‐neighbor (NN) model was created for copper grade, and preliminary grade zones were assigned using the grade‐range parameters in Table 14.3. Search parameters for the NN model are documented Table 14.4.
2. A very high‐grade zone was defined using nearest‐neighbor assignment and a more restricted search pattern. The blocks in the very high‐grade zone were overprinted onto the initial grade zone model to form the complete model.
3. Interpolation was done using composites with overlapping grade ranges. The overlapping grade ranges are required to prevent polygonal edge effects on the boundaries of the grade zones. Composite grade zone parameters are shown in Table 14.3 along with the block model grade‐zone parameters. Composite grade‐range parameters were optimized during grade.
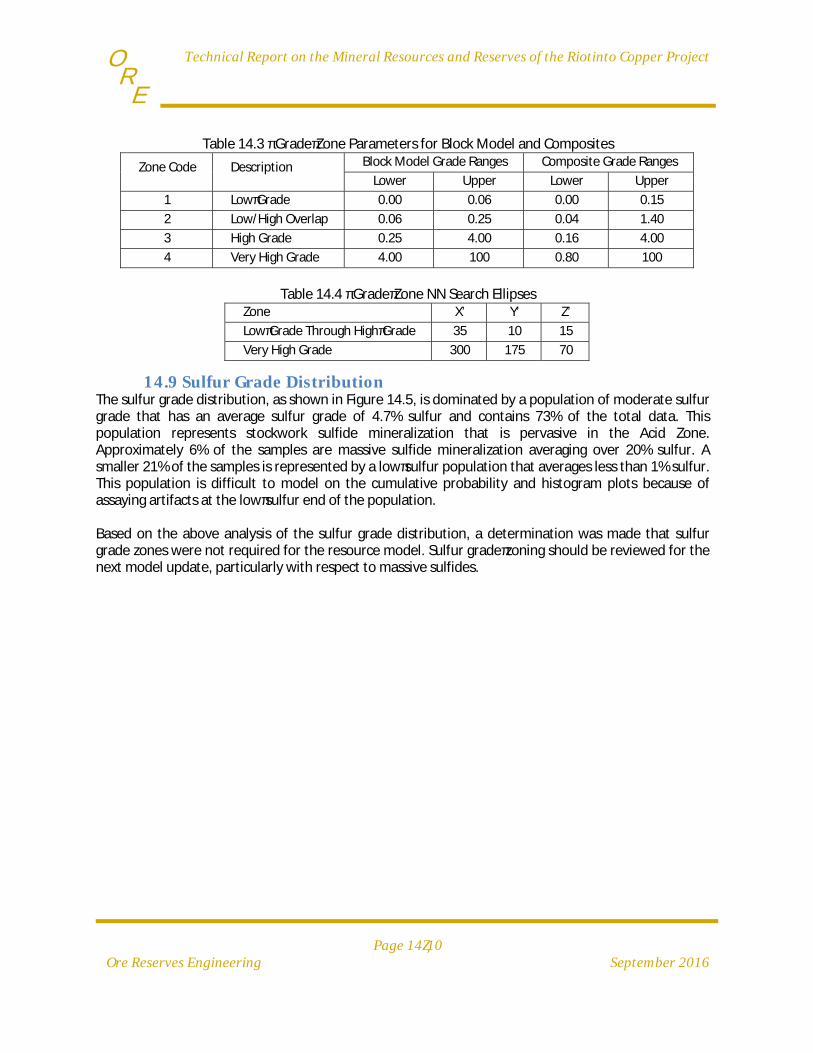
TechnicalReportontheMineralResourcesandReservesoftheRiotintoCopperProject
Page14‐10OreReservesEngineering September2016
E R
O
Table 14.3 ‐ Grade‐Zone Parameters for Block Model and Composites
Zone Code Description Block Model Grade Ranges Composite Grade Ranges
Lower Upper Lower Upper
1 Low‐Grade 0.00 0.06 0.00 0.15
2 Low/High Overlap 0.06 0.25 0.04 1.40
3 High Grade 0.25 4.00 0.16 4.00
4 Very High Grade 4.00 100 0.80 100
Table 14.4 ‐ Grade‐Zone NN Search Ellipses
Zone X’ Y’ Z’
Low‐Grade Through High‐Grade 35 10 15
Very High Grade 300 175 70
14.9 SulfurGradeDistributionThe sulfur grade distribution, as shown in Figure 14.5, is dominated by a population of moderate sulfur grade that has an average sulfur grade of 4.7% sulfur and contains 73% of the total data. This population represents stockwork sulfide mineralization that is pervasive in the Acid Zone. Approximately 6% of the samples are massive sulfide mineralization averaging over 20% sulfur. A smaller 21% of the samples is represented by a low‐sulfur population that averages less than 1% sulfur. This population is difficult to model on the cumulative probability and histogram plots because of assaying artifacts at the low‐sulfur end of the population. Based on the above analysis of the sulfur grade distribution, a determination was made that sulfur grade zones were not required for the resource model. Sulfur grade‐zoning should be reviewed for the next model update, particularly with respect to massive sulfides.

TechnicalReportontheMineralResourcesandReservesoftheRiotintoCopperProject
Page14‐11OreReservesEngineering September2016
E R
O
(Noble 2016)
Figure 14.5 ‐ Sulfur Grade Distribution in the Acid Zone
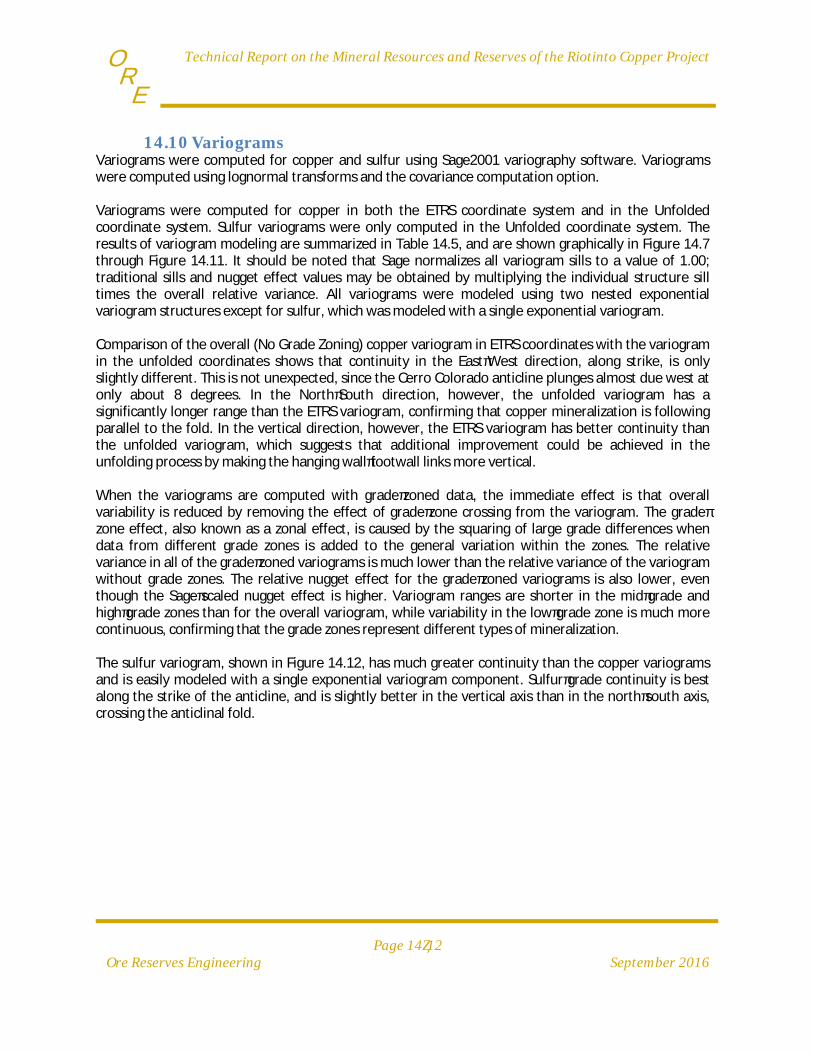
TechnicalReportontheMineralResourcesandReservesoftheRiotintoCopperProject
Page14‐12OreReservesEngineering September2016
E R
O
14.10 VariogramsVariograms were computed for copper and sulfur using Sage2001 variography software. Variograms were computed using lognormal transforms and the covariance computation option. Variograms were computed for copper in both the ETRS coordinate system and in the Unfolded coordinate system. Sulfur variograms were only computed in the Unfolded coordinate system. The results of variogram modeling are summarized in Table 14.5, and are shown graphically in Figure 14.7 through Figure 14.11. It should be noted that Sage normalizes all variogram sills to a value of 1.00; traditional sills and nugget effect values may be obtained by multiplying the individual structure sill times the overall relative variance. All variograms were modeled using two nested exponential variogram structures except for sulfur, which was modeled with a single exponential variogram. Comparison of the overall (No Grade Zoning) copper variogram in ETRS coordinates with the variogram in the unfolded coordinates shows that continuity in the East‐West direction, along strike, is only slightly different. This is not unexpected, since the Cerro Colorado anticline plunges almost due west at only about 8 degrees. In the North‐South direction, however, the unfolded variogram has a significantly longer range than the ETRS variogram, confirming that copper mineralization is following parallel to the fold. In the vertical direction, however, the ETRS variogram has better continuity than the unfolded variogram, which suggests that additional improvement could be achieved in the unfolding process by making the hanging wall‐footwall links more vertical. When the variograms are computed with grade‐zoned data, the immediate effect is that overall variability is reduced by removing the effect of grade‐zone crossing from the variogram. The grade‐zone effect, also known as a zonal effect, is caused by the squaring of large grade differences when data from different grade zones is added to the general variation within the zones. The relative variance in all of the grade‐zoned variograms is much lower than the relative variance of the variogram without grade zones. The relative nugget effect for the grade‐zoned variograms is also lower, even though the Sage‐scaled nugget effect is higher. Variogram ranges are shorter in the mid‐grade and high‐grade zones than for the overall variogram, while variability in the low‐grade zone is much more continuous, confirming that the grade zones represent different types of mineralization. The sulfur variogram, shown in Figure 14.12, has much greater continuity than the copper variograms and is easily modeled with a single exponential variogram component. Sulfur‐grade continuity is best along the strike of the anticline, and is slightly better in the vertical axis than in the north‐south axis, crossing the anticlinal fold.

TechnicalReportontheMineralResourcesandReservesoftheRiotintoCopperProject
Page14‐13OreReservesEngineering September2016
E R
O
Table 14.5 ‐ Summary of Variogram Models
XYZ Variogram
Copper Grade Range
Relative Variance
Relative Nugget
Sage Variograms Scaled to Sill = 1.00
Nugget
Exponential Structure 1 Exponential Structure 2
Cu Min Cu Max
Range (X')
Range (Y')
Range (Z') Sill
Range (X')
Range (Y')
Range (Z') Sill
ETRS Cu‐No Zones 0.001 100 6.909 0.691 0.10 35.4 9.9 31.0 0.619 202 81 413 0.281
Unfo
lded
Cu ‐ No Zones 0.001 100 6.909 0.691 0.10 27.4 27.5 34.7 0.668 259 133 112 0.1
Cu ‐ Low 0.001 0.14 1.118 0.224 0.20 10.0 22.0 20.0 0.45 132 75 125 0.35
Cu ‐ Mid 0.04 0.30 0.529 0.143 0.27 10.0 10.0 12.0 0.58 109 61 80 0.15
Cu ‐ High 0.25 4.00 0.807 0.283 0.35 10.0 10.0 23.0 0.38 110 61 32 0.27
Sulfur 0.01 100 3.993 0.399 0.10 303 143 185 0.9 ‐ ‐ ‐ ‐
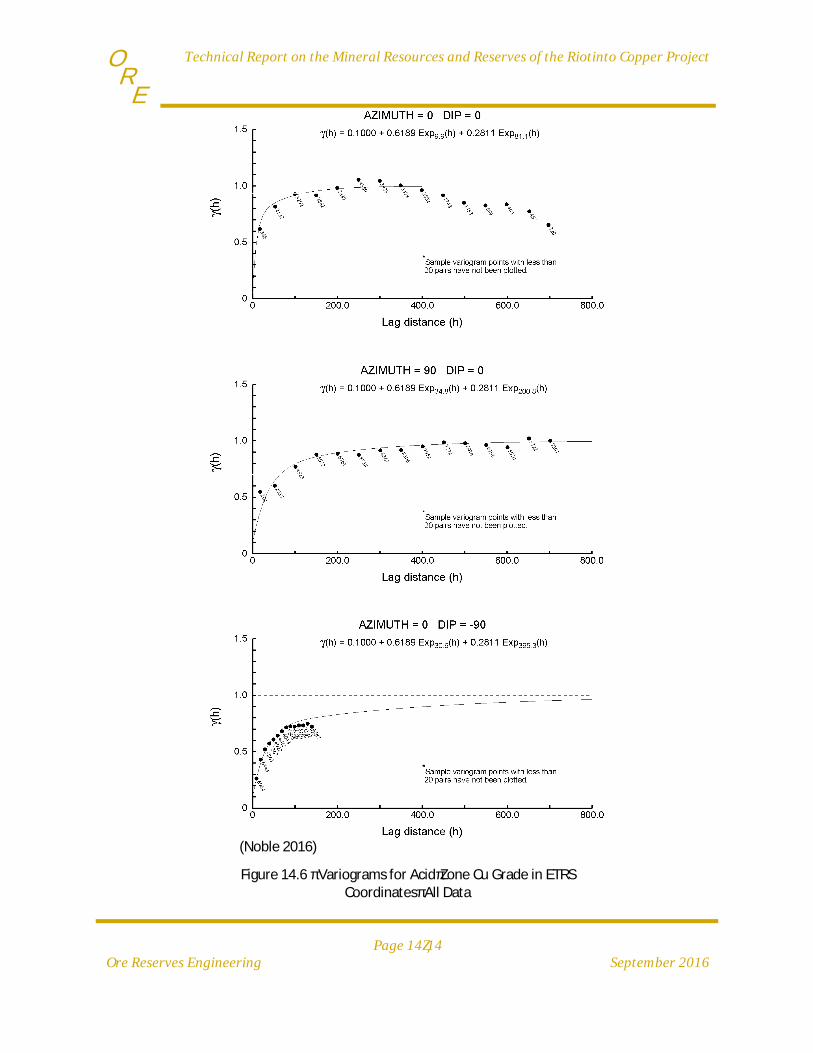
TechnicalReportontheMineralResourcesandReservesoftheRiotintoCopperProject
Page14‐14OreReservesEngineering September2016
E R
O
(Noble 2016)
Figure 14.6 ‐ Variograms for Acid‐Zone Cu Grade in ETRS Coordinates‐ All Data

TechnicalReportontheMineralResourcesandReservesoftheRiotintoCopperProject
Page14‐15OreReservesEngineering September2016
E R
O
(Noble 2016)
Figure 14.7 ‐ Variograms for Acid‐Zone Cu Grade in Unfolded Coordinates‐ All Data
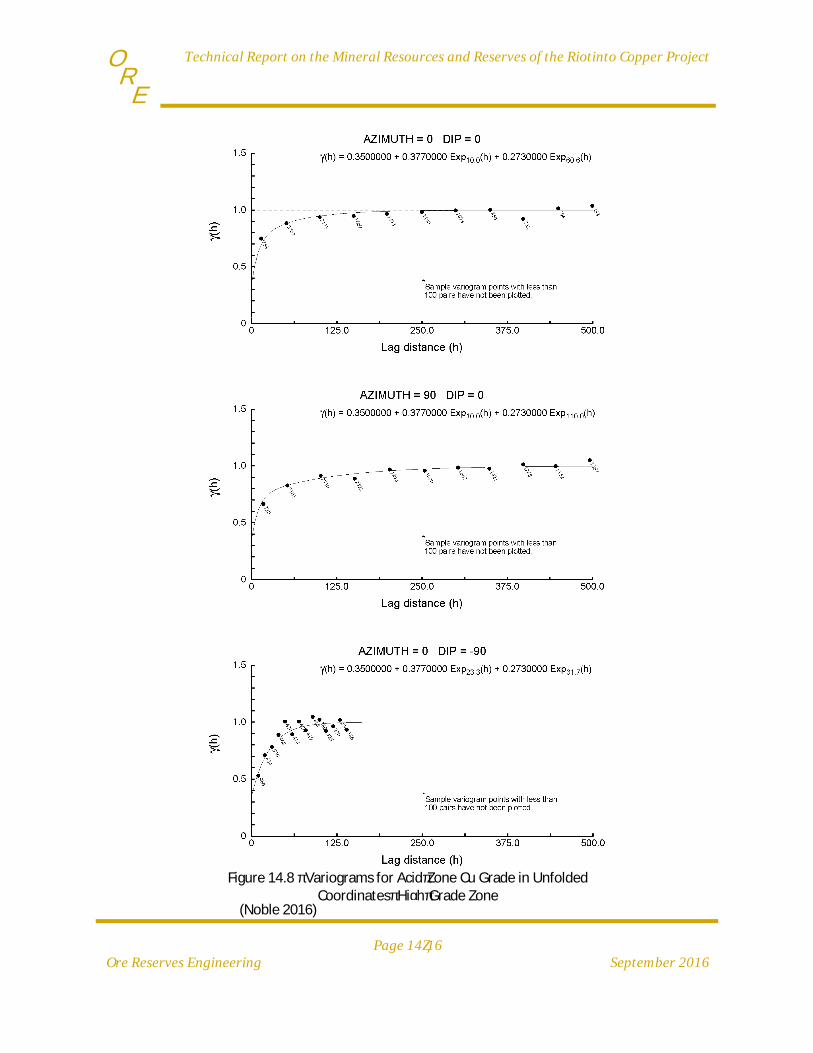
TechnicalReportontheMineralResourcesandReservesoftheRiotintoCopperProject
Page14‐16OreReservesEngineering September2016
E R
O
(Noble 2016)
Figure 14.8 ‐ Variograms for Acid‐Zone Cu Grade in Unfolded Coordinates‐ High‐Grade Zone

TechnicalReportontheMineralResourcesandReservesoftheRiotintoCopperProject
Page14‐17OreReservesEngineering September2016
E R
O
(Noble 2016)
Figure 14.9 ‐ Variograms for Acid‐Zone Cu Grade in Unfolded Coordinates‐ Mid‐Grade Zone

TechnicalReportontheMineralResourcesandReservesoftheRiotintoCopperProject
Page14‐18OreReservesEngineering September2016
E R
O
(Noble 2016)
Figure 14.10 ‐ Variograms for Acid‐Zone Cu Grade in Unfolded Coordinates‐ Low‐Grade Zone
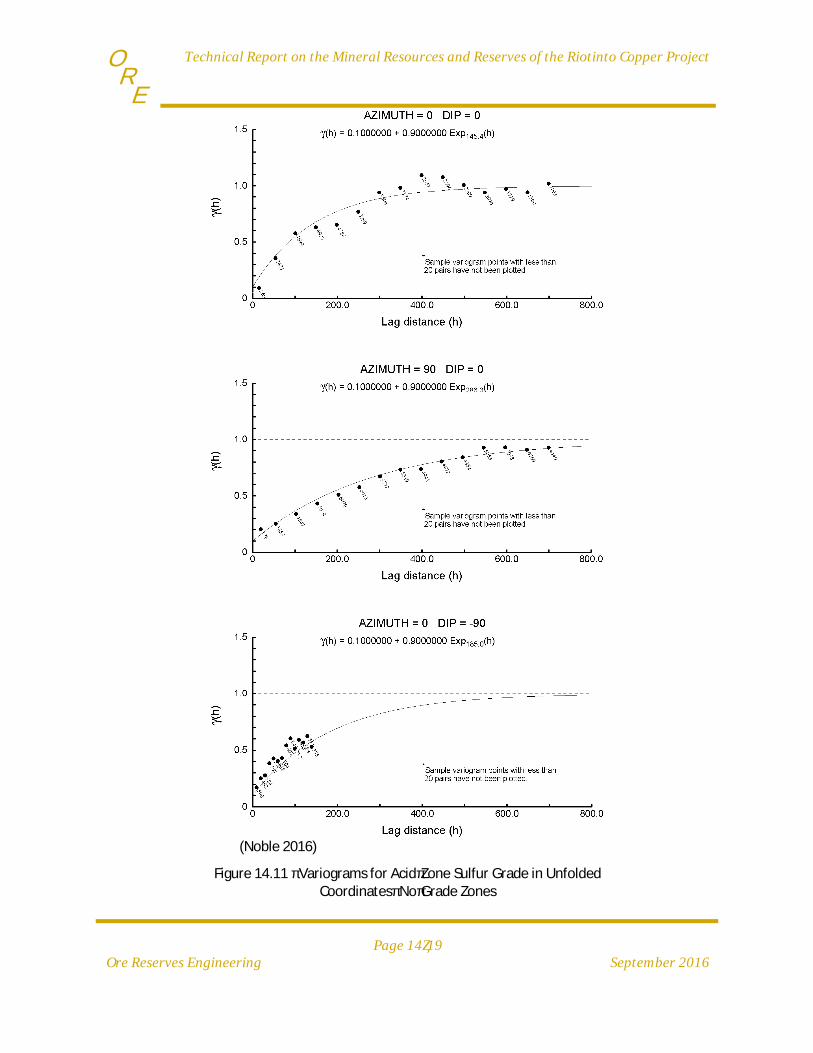
TechnicalReportontheMineralResourcesandReservesoftheRiotintoCopperProject
Page14‐19OreReservesEngineering September2016
E R
O
(Noble 2016)
Figure 14.11 ‐ Variograms for Acid‐Zone Sulfur Grade in Unfolded Coordinates‐ No‐Grade Zones
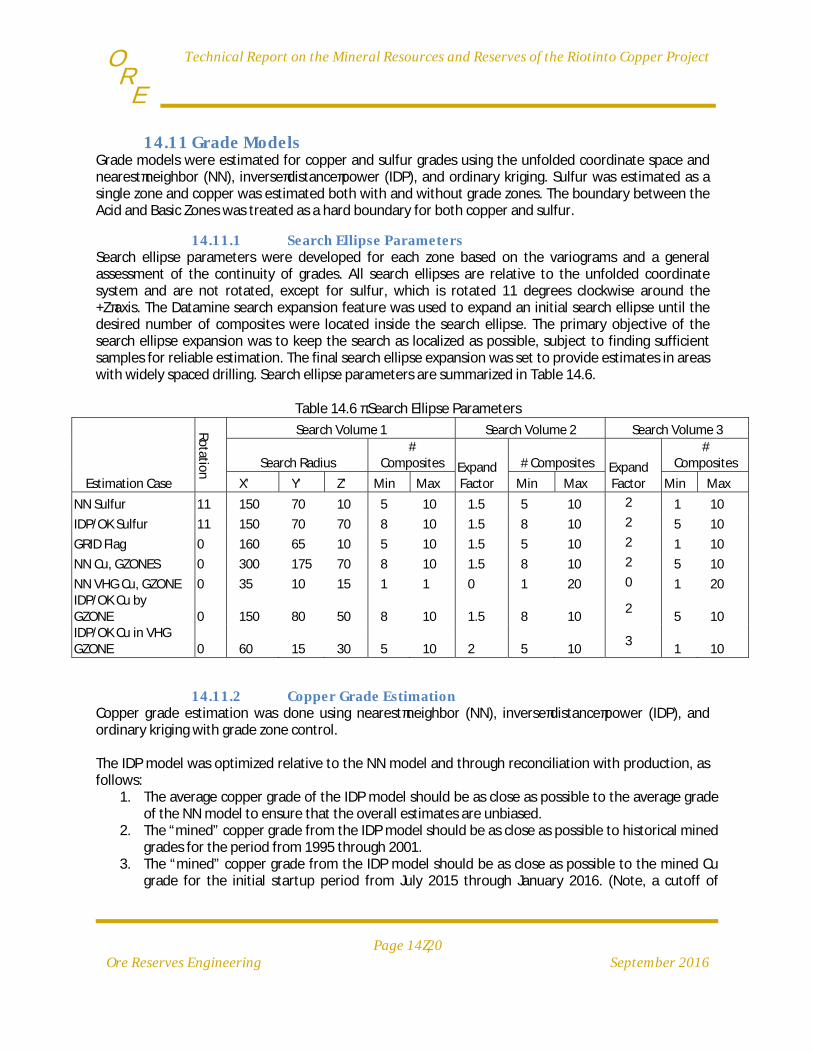
TechnicalReportontheMineralResourcesandReservesoftheRiotintoCopperProject
Page14‐20OreReservesEngineering September2016
E R
O
14.11 GradeModelsGrade models were estimated for copper and sulfur grades using the unfolded coordinate space and nearest‐neighbor (NN), inverse‐distance‐power (IDP), and ordinary kriging. Sulfur was estimated as a single zone and copper was estimated both with and without grade zones. The boundary between the Acid and Basic Zones was treated as a hard boundary for both copper and sulfur.
14.11.1 SearchEllipseParametersSearch ellipse parameters were developed for each zone based on the variograms and a general assessment of the continuity of grades. All search ellipses are relative to the unfolded coordinate system and are not rotated, except for sulfur, which is rotated 11 degrees clockwise around the +Z‐axis. The Datamine search expansion feature was used to expand an initial search ellipse until the desired number of composites were located inside the search ellipse. The primary objective of the search ellipse expansion was to keep the search as localized as possible, subject to finding sufficient samples for reliable estimation. The final search ellipse expansion was set to provide estimates in areas with widely spaced drilling. Search ellipse parameters are summarized in Table 14.6.
Table 14.6 ‐ Search Ellipse Parameters
Estimation Case
Rotatio
n
Search Volume 1 Search Volume 2 Search Volume 3
Search Radius #
Composites Expand Factor
# Composites Expand Factor
# Composites
X' Y' Z' Min Max Min Max Min Max
NN Sulfur 11 150 70 10 5 10 1.5 5 10 2 1 10
IDP/OK Sulfur 11 150 70 70 8 10 1.5 8 10 2 5 10
GRID Flag 0 160 65 10 5 10 1.5 5 10 2 1 10
NN Cu, GZONES 0 300 175 70 8 10 1.5 8 10 2 5 10
NN VHG Cu, GZONE 0 35 10 15 1 1 0 1 20 0 1 20 IDP/OK Cu by GZONE 0 150 80 50 8 10 1.5 8 10
2 5 10
IDP/OK Cu in VHG GZONE 0 60 15 30 5 10 2 5 10
3 1 10
14.11.2 CopperGradeEstimationCopper grade estimation was done using nearest‐neighbor (NN), inverse‐distance‐power (IDP), and ordinary kriging with grade zone control.
The IDP model was optimized relative to the NN model and through reconciliation with production, as follows:
1. The average copper grade of the IDP model should be as close as possible to the average grade of the NN model to ensure that the overall estimates are unbiased.
2. The “mined” copper grade from the IDP model should be as close as possible to historical mined grades for the period from 1995 through 2001.
3. The “mined” copper grade from the IDP model should be as close as possible to the mined Cu grade for the initial startup period from July 2015 through January 2016. (Note, a cutoff of

TechnicalReportontheMineralResourcesandReservesoftheRiotintoCopperProject
Page14‐21OreReservesEngineering September2016
E R
O
0.23% Cu rather than the actual 0.25% Cu was used for this reconciliation to account for excess dilution in current grade control practice.) The parameters were also adjusted to provide an overall grade distribution that matched the blasthole model grade distribution as closely as possible.
4. The optimized IDP powers are shown in Table 14.7. IDP anisotropies are the same as the search ellipse radii.
Table 14.7 ‐ IDP Estimation Powers by Grade Zone
Cu Grade Zone POWER
Low‐Grade 1.5
Mid‐Grade 2.0
High‐Grade 1.2
Very High‐Grade 1.0
The reconciliation comparison for the IDP, OK, and NN estimates in Table 14.8 shows that copper grade is very well estimated for the 1995‐2001 period with only a ‐2% error; tonnage is slightly overestimated with a +7% error; and total contained copper content is overestimated by 5%. In addition, the overall grade at 0.0% Cu cutoff is less than 2% higher than the NN grade, which confirms that the estimates are unbiased on an overall basis. The tonnage estimate is almost exact for the 2015 mining, but Cu grade is overestimated by 17% resulting in a 17% overestimation of contained metal. The reconciliation to 2015 production could be improved with greater restrictions to the Very‐High‐Grade Zone, however, that localized improvement comes with greater error in the 1995‐2001 period and bias in the overall grade at zero cutoff. In addition, errors of this magnitude are not atypical with respect to the 1995 to 2001 annual production and are likely just a typical estimation error in this high variability deposit. Comparing the OK model to the IDP model, the IDP model performs better than the OK model for every measure except for the 2015 copper grade. Even so, the greater tonnage for OK in 2015 results in a larger error in estimated contained copper. The measured and indicated IDP, OK, and NN resources are compared at multiple cutoff grades in Table 14.9.

TechnicalReportontheMineralResourcesandReservesoftheRiotintoCopperProject
Page14‐22OreReservesEngineering September2016
E R
O
Table 14.8 ‐ Details of Reconciliations for IDP, OK, and NN Models (Unconstrained Measured and Indicated Resource)
Reconciliation Detail ‐ IDP
Measured and Indicated Plant %Diff (Model‐Plant)/Plant
YEAR Cutoff Tonnes
(Millions) Cu_IDP S_IDP Tonnes
(Millions) %Cu Sulfur Tonnes Cu
Grade Tonnes Copper Sulfur
1995 0.25 1.737 0.479 3.87 1.297 0.490 33.9% ‐2.3% 30.9%
1996 0.28 6.041 0.518 4.04 5.147 0.470 17.4% 10.1% 29.3%
1997 0.28 7.421 0.485 3.38 7.102 0.490 4.5% ‐1.1% 3.3%
1998 0.30 7.137 0.538 7.08 6.579 0.610 8.5% ‐11.8% ‐4.3%
1999 0.30 0.079 0.564 22.26 0.117 0.560 ‐32.2% 0.8% ‐31.7%
2000 0.35 2.909 0.628 16.45 3.487 0.610 ‐16.6% 3.0% ‐14.1%
2001 0.35 0.269 0.747 13.25 0.136 0.590 97.9% 26.7% 150.7%
Total 1995‐2001 25.594 0.526 6.25 23.864 0.537 7.3% ‐2.1% 5.0%
2015 0.23 1.940 0.633 9.13 1.937 0.540 9.92 0.2% 17.2% 17.4% ‐8.0%
Reconciliation Detail ‐ OK
1995 0.25 1.901 0.462 3.80 1.297 0.490 46.6% ‐5.7% 38.2%
1996 0.28 6.473 0.490 3.93 5.147 0.470 25.8% 4.3% 31.1%
1997 0.28 7.985 0.459 3.27 7.102 0.490 12.4% ‐6.2% 5.4%
1998 0.30 7.501 0.518 6.59 6.579 0.610 14.0% ‐15.1% ‐3.2%
1999 0.30 0.100 0.537 20.19 0.117 0.560 ‐14.6% ‐4.1% ‐18.2%
2000 0.35 3.009 0.611 16.30 3.487 0.610 ‐13.7% 0.1% ‐13.6%
2001 0.35 0.293 0.699 12.34 0.136 0.590 114.8% 18.5% 154.6%
Total 1995‐2001 27.260 0.502 5.98 23.864 0.537 14.2% ‐6.5% 6.8%
2015 0.23 2.052 0.608 8.79 1.937 0.540 9.92 5.9% 12.6% 19.3% ‐
11.4%
Reconciliation Detail ‐ NN
1995 0.25 1.314 0.600 4.01 1.297 0.490 1.3% 22.5% 24.1%
1996 0.28 4.733 0.697 4.41 5.147 0.470 ‐8.0% 48.3% 36.4%
1997 0.28 5.635 0.646 3.64 7.102 0.490 ‐20.7% 31.8% 4.5%
1998 0.30 5.809 0.707 7.75 6.579 0.610 ‐11.7% 15.8% 2.3%
1999 0.30 0.070 0.749 18.90 0.117 0.560 ‐40.5% 33.8% ‐20.4%
2000 0.35 2.045 0.928 16.05 3.487 0.610 ‐41.4% 52.2% ‐10.8%
2001 0.35 0.203 1.393 14.07 0.136 0.590 49.3% 136.2% 252.5%
Total 1995‐2001 19.808 0.710 6.50 23.864 0.537 ‐17.0% 32.2% 9.7%
2015 0.23 1.442 0.914 10.44 1.937 0.540 9.92 ‐25.6% 69.3% 26.1% 5.3%

TechnicalReportontheMineralResourcesandReservesoftheRiotintoCopperProject
Page14‐23OreReservesEngineering September2016
E R
O
Table 14.9 ‐ Comparison of Unconstrained Measured and Indicated Resources Estimated by IDP, OK, and NN
Cutoff
IDP Model OK Model NN Model
Tonnes (Millions) %Cu %S
Tonnes (Millions) %Cu %S
Tonnes (Millions) %Cu %S
0.00 716.3 0.168 4.58 716.3 0.172 4.56 716.3 0.165 4.50
0.15 261.1 0.367 5.00 280.2 0.356 4.87 212.1 0.449 5.25
0.20 204.4 0.421 5.16 223.3 0.403 5.07 169.3 0.519 5.41
0.25 167.7 0.465 5.34 182.7 0.443 5.23 133.7 0.598 5.70
0.30 138.9 0.504 5.51 147.5 0.483 5.40 111.5 0.663 5.81
0.35 112.1 0.547 5.68 114.3 0.529 5.61 95.4 0.719 6.02
14.12 ResourceClassificationClassification of resources into measured, indicated, and inferred resource classes is based on drill‐hole spacing and the number of drill holes selected for estimation. Drill‐hole spacing is measured based on the kriging variance from a point‐kriging estimate using a “FLAG” variable that is set to 1.0 for composites with copper values and “absent” for composites with insufficient sampling to make a composite. A linear, zero‐nugget variogram with a slope of 0.5 is used for this kriging run. The kriging variance for block at the center of a 4‐point, square drill‐hole pattern is approximately equal to 28% of the drill‐hole spacing. If the block is outside the drilling pattern (extrapolated), the kriging variance is equal to the distance to the nearest drill hole. The resource classification parameters are summarized in Table 14.10.
Table 14.10 ‐ Resource Classification Parameters
Resource Class
Drill Hole Spacing (m)
Search Volume
Measured <=60 m SVOL<=1
Indicated >60 m to <100 m SVOL<=2
Inferred >100 m to <= 134 m
Unclassified >134 m or no estimate
14.13 ResourceSummaryThe copper resource was summarized using a Lerchs‐Grossmann pit shell that was run using a copper price of $3.20/lb. Cu and all resources including inferred resources. All other slope and economic parameters are the same as those used for design of the open pit for reserve estimation. The resulting pit shell is considered to have reasonable prospects for economic extraction, assuming that the inferred resource is converted to measured and indicated by drilling and that the copper price returns to previous levels that were substantially above $3.20/lb. Cu. The resource estimate is summarized in Table 14.11 and Table 14.12.
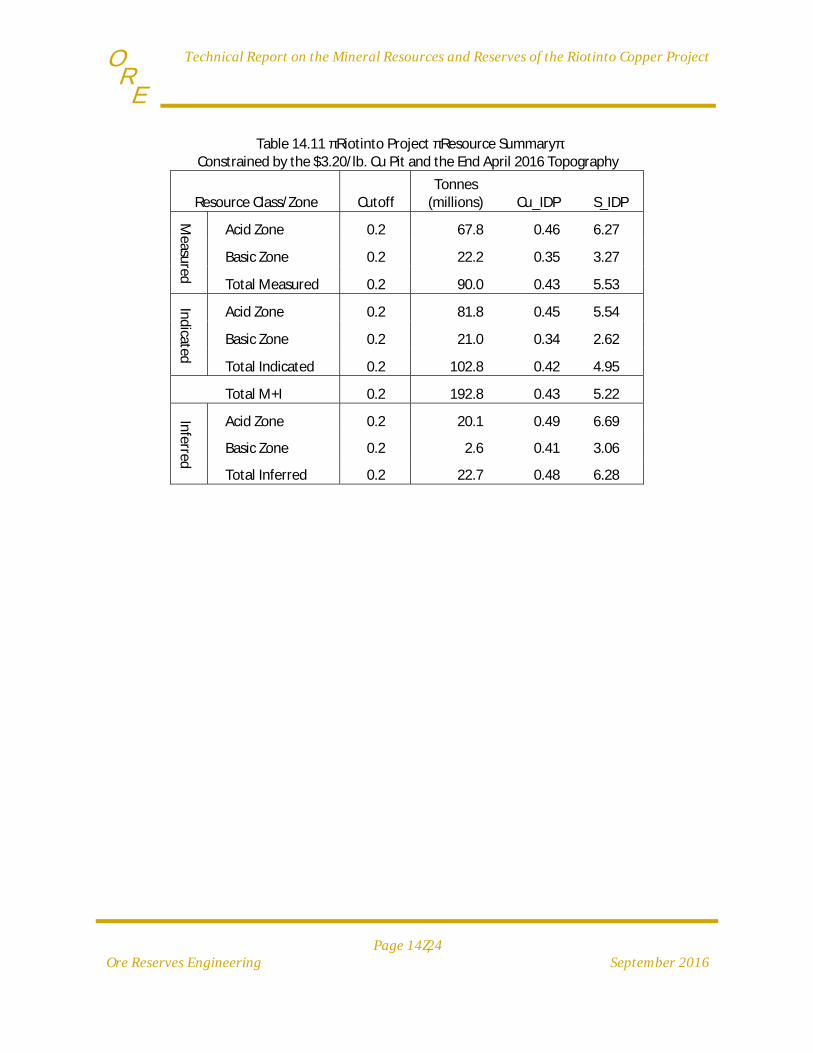
TechnicalReportontheMineralResourcesandReservesoftheRiotintoCopperProject
Page14‐24OreReservesEngineering September2016
E R
O
Table 14.11 ‐ Riotinto Project ‐ Resource Summary‐ Constrained by the $3.20/lb. Cu Pit and the End April 2016 Topography
Resource Class/Zone Cutoff Tonnes
(millions) Cu_IDP S_IDP
Measu
red
Acid Zone 0.2 67.8 0.46 6.27
Basic Zone 0.2 22.2 0.35 3.27
Total Measured 0.2 90.0 0.43 5.53
Indicated
Acid Zone 0.2 81.8 0.45 5.54
Basic Zone 0.2 21.0 0.34 2.62
Total Indicated 0.2 102.8 0.42 4.95
Total M+I 0.2 192.8 0.43 5.22
Inferred
Acid Zone 0.2 20.1 0.49 6.69
Basic Zone 0.2 2.6 0.41 3.06
Total Inferred 0.2 22.7 0.48 6.28
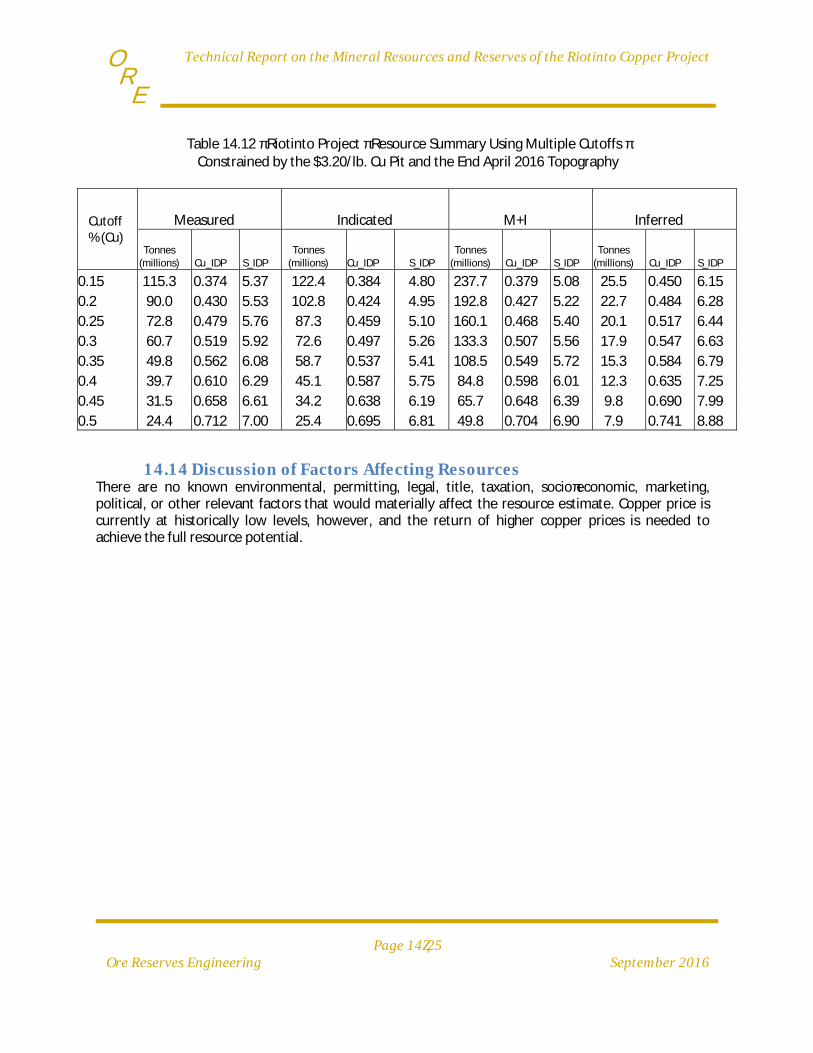
TechnicalReportontheMineralResourcesandReservesoftheRiotintoCopperProject
Page14‐25OreReservesEngineering September2016
E R
O
Table 14.12 ‐ Riotinto Project ‐ Resource Summary Using Multiple Cutoffs ‐ Constrained by the $3.20/lb. Cu Pit and the End April 2016 Topography
Cutoff % (Cu)
Measured Indicated M+I Inferred
Tonnes (millions) Cu_IDP S_IDP
Tonnes (millions) Cu_IDP S_IDP
Tonnes (millions) Cu_IDP S_IDP
Tonnes (millions) Cu_IDP S_IDP
0.15 115.3 0.374 5.37 122.4 0.384 4.80 237.7 0.379 5.08 25.5 0.450 6.15
0.2 90.0 0.430 5.53 102.8 0.424 4.95 192.8 0.427 5.22 22.7 0.484 6.28
0.25 72.8 0.479 5.76 87.3 0.459 5.10 160.1 0.468 5.40 20.1 0.517 6.44
0.3 60.7 0.519 5.92 72.6 0.497 5.26 133.3 0.507 5.56 17.9 0.547 6.63
0.35 49.8 0.562 6.08 58.7 0.537 5.41 108.5 0.549 5.72 15.3 0.584 6.79
0.4 39.7 0.610 6.29 45.1 0.587 5.75 84.8 0.598 6.01 12.3 0.635 7.25
0.45 31.5 0.658 6.61 34.2 0.638 6.19 65.7 0.648 6.39 9.8 0.690 7.99
0.5 24.4 0.712 7.00 25.4 0.695 6.81 49.8 0.704 6.90 7.9 0.741 8.88
14.14 DiscussionofFactorsAffectingResourcesThere are no known environmental, permitting, legal, title, taxation, socio‐economic, marketing, political, or other relevant factors that would materially affect the resource estimate. Copper price is currently at historically low levels, however, and the return of higher copper prices is needed to achieve the full resource potential.
TechnicalReportontheMineralResourcesandReservesoftheRiotintoCopperProject
Page15‐1OreReservesEngineering September2016
E R
O
15 MINERALRESERVEESTIMATESThe mineral reserve estimates are based on open pit development of the Cerro Colorado deposit and are derived from the same May 2016 deposit model that was used to estimate mineral resources as described in Section 14. Open pit mining progress through 30 April 2016 was incorporated into this model. A range of economic pit shells were generated using the Lerches‐Grossmann algorithm to help define the likely extents of the open pit and the most favorable development sequence. An optimized pit shell based on a copper price of $2.60/lb. was then used to guide the design of the open pit.
15.1 DefinitionsCanadian National Instrument 43‐101 (NI 43‐101) references the Canadian Institute of Mining, Metallurgy and Petroleum (CIM) Definition Standards on Mineral Resources and Mineral Reserves. The mineral reserve estimates reported in this section follow the CIM Definition Standards. The following definition is from those standards: A Mineral Reserve is the economically mineable part of a Measured or Indicated Mineral Resource demonstrated by at least a Preliminary Feasibility Study. This Study must include adequate information on mining, processing, metallurgical, economic, and other relevant factors that demonstrate, at the time of reporting, that economic extraction can be justified. A Mineral Reserve includes diluting materials and allowances for losses that may occur when the material is mined. Mineral reserve is subdivided to indicate the degree of certainty that can be attached to the estimate. For mineral reserve, the following definitions are from the CIM Definition Standards and are applicable to this report: A “Proven Mineral Reserve‟ is the economically mineable part of a Measured Mineral Resource demonstrated by at least a Preliminary Feasibility Study. This Study must include adequate information on mining, processing, metallurgical, economic, and other relevant factors that demonstrate, at the time of reporting, that economic extraction is justified. A “Probable Mineral Reserve‟ is the economically mineable part of an Indicated and, in some circumstances, a Measured Mineral Resource demonstrated by at least a Preliminary Feasibility Study. This Study must include adequate information on mining, processing, metallurgical, economic, and other relevant factors that demonstrate, at the time of reporting, that economic extraction can be justified. In this study, mineral reserve is defined as the measured and indicated mineral resource that would be extracted by the mine design and which can then be processed at a profit. All measured resources meeting that standard are herein classified as proven mineral reserves, while all indicated resources meeting that standard are classified as probable mineral reserves.

TechnicalReportontheMineralResourcesandReservesoftheRiotintoCopperProject
Page15‐2OreReservesEngineering September2016
E R
O
15.2 ReserveEstimationParameters
15.2.1 MetallurgicalRecoveriesHistorical ore processing data indicate that copper (Cu) recovery is reduced with higher sulfur (S) content. The following formula was applied when computing recoverable copper (RCu) grades for each interpolated block in the deposit model: If S% <= 15.128, Cu Recovery in % = ‐0.9998*S% + 90.125; If S% > 15.128, Cu Recovery = 75%.
Cu recoveries range from 75 to 90%. Sulfur grades for ore grade mineralization in the open pit average about 5.1%, resulting in an average copper recovery of 85%. No other metals contribute to revenues. All backfilled zones in the deposit model were treated as waste with no copper recovery.
15.2.2 Royalties,PayablesandOperatingCostsTable 15.1 lists the base economic parameters used in the pit limit analyses and cutoff grades, both internal and breakeven. All costs shown are in U.S. dollars. Conversions from Euro currency were based on a factor of US$1.12 per €1.00. Mining costs were provided by Atalaya Mining and are derived from the terms of the current contract mining agreements. Atalaya Mining also provided ore processing, maintenance, general/admin, and laboratory costs that are based on recent operating experience.
Table 15.1 ‐ Ore Definition Parameters
Item Unit Value
Base Cu price $/lb. Cu payable 2.60
Freight, smelting & refining (FSR) cost $/lb. Cu payable 0.44
Cu payable % 98.8
Royalties (NSR basis) % 0.00 Ore mining cost (contractor) $/t mined 1.23 Waste mining cost (contractor) $/t mined 1.50 Incremental haulage per 10‐m bench below 430 el $/t mined 0.0134Ore processing & maintenance cost $/t ore 5.89 General/admin & laboratory cost $/t ore 0.74
Internal NSR cutoff NSR $/t 6.36 Breakeven NSR cutoff at 320 mid el NSR $/t 8.01 Internal Cu cutoff % Cu 0.16 Breakeven Cu cutoff at 320 mid el % Cu 0.20 Internal RCu cutoff % RCu 0.14 Breakeven RCu cutoff at 320 mid el % RCu 0.17
NSR refers to Net Smelter Return. The FSR and on‐site operating costs were derived from Atalaya Mining’s historical figures and current contract mining terms. The internal cutoff grades include differential ore mining (i.e., ore mining less waste mining costs, which can result in a credit), plus ore processing, plant maintenance, and general/administration costs. The breakeven cutoff grades include

TechnicalReportontheMineralResourcesandReservesoftheRiotintoCopperProject
Page15‐3OreReservesEngineering September2016
E R
O
the full ore mining cost, plus ore processing, plant maintenance, and general/administration costs. The 320 elevation referenced by the breakeven cutoffs represents the approximate mean elevation of all tonnage mined in the planned open pit. Breakeven cutoffs increase with pit depth when using the incremental haulage costs. Cutoffs for Cu% values are based on an average recovery of 85%. Net revenue is computed by subtracting the FSR cost from the Cu price and then applying the metallurgical recovery and Cu payable factors to the result. No royalty or severance obligations are known at the time of this writing.
15.2.3 OverallSlopeAnglesBlocks in the deposit model were tagged with codes to control the overall slope angles (OSAs) used in the economic pit limit evaluations. The OSAs are derived from Atalaya Mining’s operating experience and inter‐ramp slope angle (IRA) recommendations from its geotechnical consultants and contain provisions for one to two 26‐m‐wide haul roads in the pit walls. Five zones were identified and are summarized in Table 15.2 below.
Table 15.2 ‐ Overall Slope Angles Used in Pit Limit Analyses Slope Code
Zone Description Pit Walls OSA, degrees
1 2 3 4 5
Fresh Rock, Acid LeachedFresh Felsic Rock Filon Sur, Rock Filon Sur, Backfill Weathered, to 20 m below topo
SE & S (az 90‐230)W, N & E (az 230‐90) SW quadrant SW quadrant All, near surface
46 44 45 33 30
15.2.4 BulkDensitiesIn the deposit model, each block contains values for rock tonnage, rock volume, fill tonnage, and fill volume. Most non‐air blocks are entirely rock, except for the Filon Sur backfill area and a few isolated blocks intersecting underground workings. The rock tonnages are based on interpolated bulk densities, which can reach up to 3.86 t/m3. All fill zones were assigned a bulk density of 2.00 t/m3. The average bulk material density, rock and fill, in the planned open pit is 2.75 t/m3.
15.2.5 DilutionandOreLossThe deposit model was carefully constructed to reflect the selectivity of anticipated mining equipment and adjusted through numerous trials to best reconcile with past production from the Cerro Colorado pit. Consequently, no additional provisions outside of the block model have been made for mining dilution and ore loss.
15.3 EconomicPitLimitAnalysesThe Lerchs‐Grossmann (LG) algorithm was used to analyze economic pit limits based on the recoveries and other parameters previously discussed. In all cases, only mineral resources classified as measured and indicated (M&I) were considered as potential ore; all inferred mineral resources were treated as waste.

TechnicalReportontheMineralResourcesandReservesoftheRiotintoCopperProject
Page15‐4OreReservesEngineering September2016
E R
O
15.3.1 PriceSensitivitiesThe sensitivities of economic pit limits to copper price were analyzed for a range of Cu prices from $1.00/lb. to $4.00/lb. in $0.25/lb. increments. A run was also made at the projected long‐term Cu price of $2.60/lb. Recoveries, payables, FSR costs, and operating costs are as described in Sections 15.2.1 and 15.2.2. Table 15‐3 summarizes the results of the LG price sensitivity evaluations. Figure 15.1 illustrates the corresponding tonnage and grade curves.
Table 15.3 ‐Lerchs‐Grossmann Cu Price Sensitivity Analyses
Price Ore Grade M&I Resources >= $6.36/t NSR Waste Total Strip
Cu $/lb. Ktonnes
NSR $/t Cu % S % Ktonnes Ktonnes Ratio
4.00 294,546 22.13 0.335 4.88 406,281 700,827 1.38
3.75 283,616 20.99 0.342 4.91 391,900 675,516 1.38
3.50 271,361 19.83 0.350 4.92 375,279 646,640 1.38
3.25 249,877 18.84 0.362 4.99 333,785 583,662 1.34
3.00 229,880 17.83 0.376 5.04 310,528 540,408 1.35
2.75 204,531 16.90 0.395 5.05 280,902 485,433 1.37
2.60 189,684 16.34 0.409 5.08 270,138 459,822 1.42
2.50 179,762 15.90 0.417 5.12 256,810 436,572 1.43
2.25 145,183 15.06 0.450 5.05 213,901 359,084 1.47
2.00 104,524 14.21 0.493 5.21 144,783 249,307 1.39
1.75 74,681 13.06 0.540 5.34 105,886 180,567 1.42
1.50 31,902 12.46 0.640 5.91 47,948 79,850 1.50
1.25 11,199 11.63 0.788 7.45 20,448 31,647 1.83
1.00 826 10.08 1.016 12.43 4,687 5,513 5.67
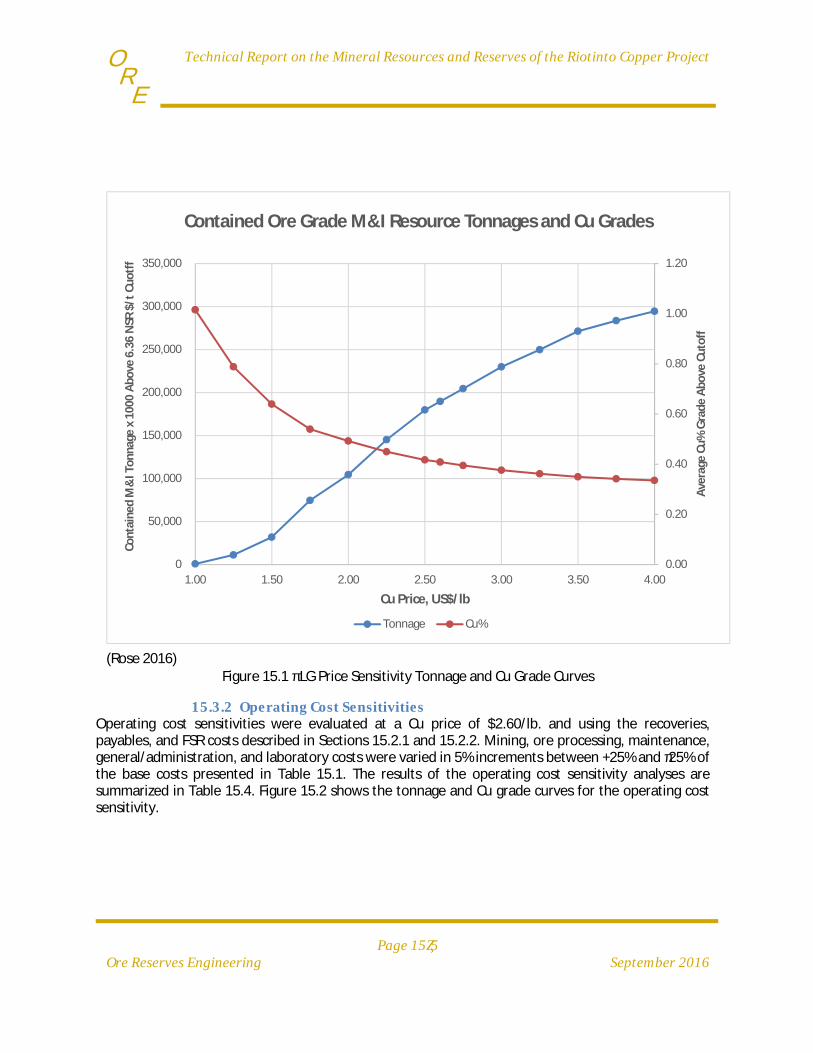
TechnicalReportontheMineralResourcesandReservesoftheRiotintoCopperProject
Page15‐5OreReservesEngineering September2016
E R
O
0.00
0.20
0.40
0.60
0.80
1.00
1.20
0
50,000
100,000
150,000
200,000
250,000
300,000
350,000
1.00 1.50 2.00 2.50 3.00 3.50 4.00
Ave
rage C
u% G
rade A
bove C
uto
ff
Conta
ined M
&I T
onnag
e x 1
000 A
bove 6
.36 N
SR $
/t C
uotf
f
Cu Price, US$/lb
Contained Ore Grade M&I Resource Tonnages and Cu Grades
Tonnage Cu%
(Rose 2016) Figure 15.1 ‐ LG Price Sensitivity Tonnage and Cu Grade Curves
15.3.2 OperatingCostSensitivitiesOperating cost sensitivities were evaluated at a Cu price of $2.60/lb. and using the recoveries, payables, and FSR costs described in Sections 15.2.1 and 15.2.2. Mining, ore processing, maintenance, general/administration, and laboratory costs were varied in 5% increments between +25% and ‐25% of the base costs presented in Table 15.1. The results of the operating cost sensitivity analyses are summarized in Table 15.4. Figure 15.2 shows the tonnage and Cu grade curves for the operating cost sensitivity.
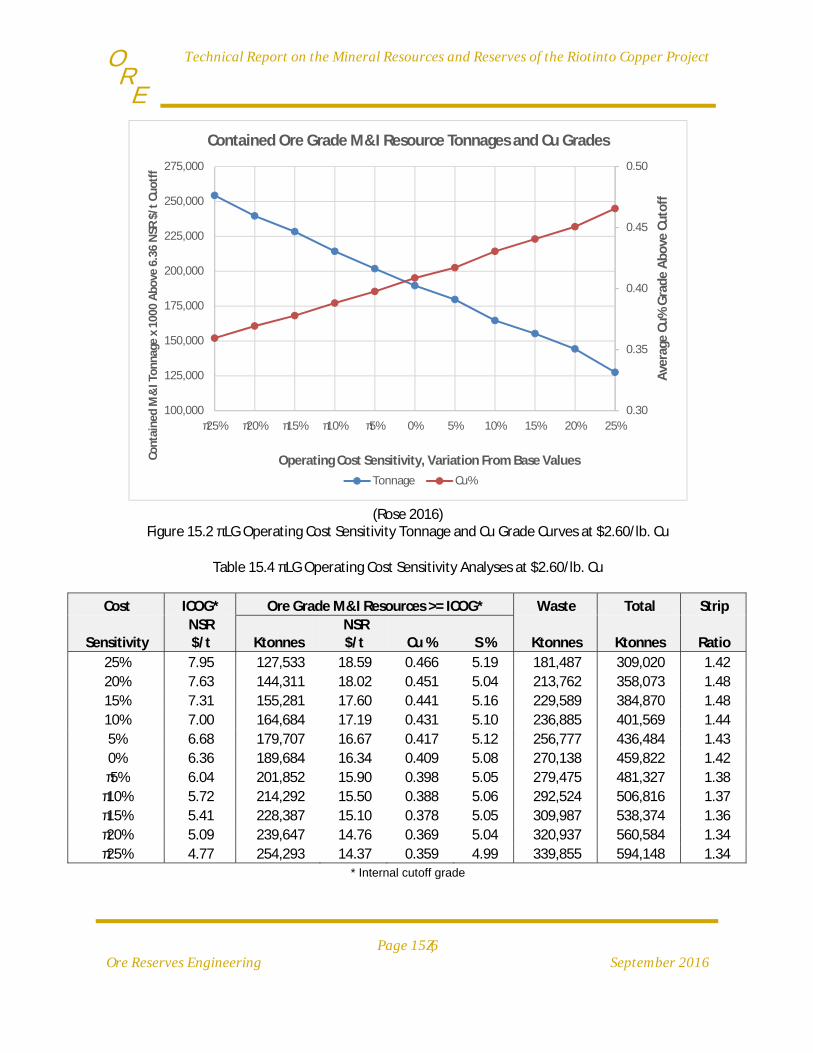
TechnicalReportontheMineralResourcesandReservesoftheRiotintoCopperProject
Page15‐6OreReservesEngineering September2016
E R
O
0.30
0.35
0.40
0.45
0.50
100,000
125,000
150,000
175,000
200,000
225,000
250,000
275,000
‐25% ‐20% ‐15% ‐10% ‐5% 0% 5% 10% 15% 20% 25%
Ave
rage C
u% G
rade A
bove C
uto
ff
Conta
ined M
&I T
onnag
e x 1
000 A
bove 6
.36 N
SR $
/t C
uotf
f
Operating Cost Sensitivity, Variation From Base Values
Contained Ore Grade M&I Resource Tonnages and Cu Grades
Tonnage Cu%
(Rose 2016) Figure 15.2 ‐ LG Operating Cost Sensitivity Tonnage and Cu Grade Curves at $2.60/lb. Cu
Table 15.4 ‐ LG Operating Cost Sensitivity Analyses at $2.60/lb. Cu
Cost ICOG* Ore Grade M&I Resources >= ICOG* Waste Total Strip
Sensitivity NSR $/t
Ktonnes
NSR $/t Cu % S % Ktonnes Ktonnes Ratio
25% 7.95 127,533 18.59 0.466 5.19 181,487 309,020 1.42
20% 7.63 144,311 18.02 0.451 5.04 213,762 358,073 1.48
15% 7.31 155,281 17.60 0.441 5.16 229,589 384,870 1.48
10% 7.00 164,684 17.19 0.431 5.10 236,885 401,569 1.44
5% 6.68 179,707 16.67 0.417 5.12 256,777 436,484 1.43
0% 6.36 189,684 16.34 0.409 5.08 270,138 459,822 1.42
‐5% 6.04 201,852 15.90 0.398 5.05 279,475 481,327 1.38
‐10% 5.72 214,292 15.50 0.388 5.06 292,524 506,816 1.37
‐15% 5.41 228,387 15.10 0.378 5.05 309,987 538,374 1.36
‐20% 5.09 239,647 14.76 0.369 5.04 320,937 560,584 1.34
‐25% 4.77 254,293 14.37 0.359 4.99 339,855 594,148 1.34 * Internal cutoff grade
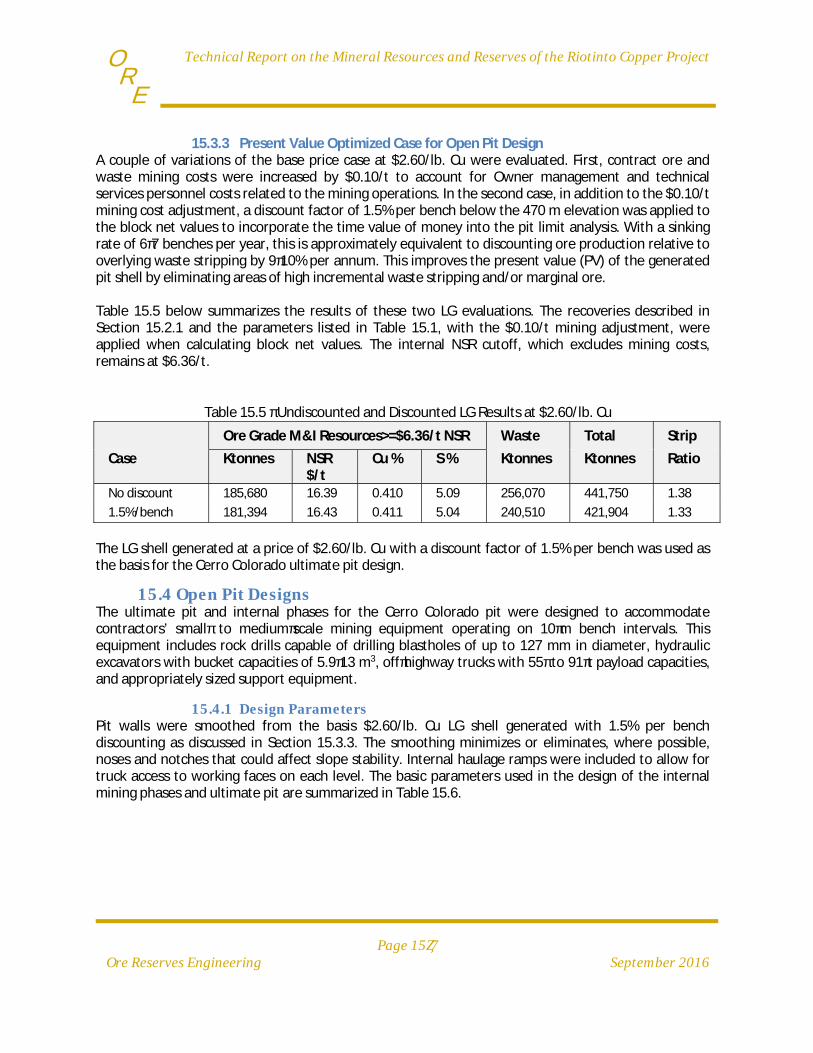
TechnicalReportontheMineralResourcesandReservesoftheRiotintoCopperProject
Page15‐7OreReservesEngineering September2016
E R
O
15.3.3 Present Value Optimized Case for Open Pit Design A couple of variations of the base price case at $2.60/lb. Cu were evaluated. First, contract ore and waste mining costs were increased by $0.10/t to account for Owner management and technical services personnel costs related to the mining operations. In the second case, in addition to the $0.10/t mining cost adjustment, a discount factor of 1.5% per bench below the 470 m elevation was applied to the block net values to incorporate the time value of money into the pit limit analysis. With a sinking rate of 6‐7 benches per year, this is approximately equivalent to discounting ore production relative to overlying waste stripping by 9‐10% per annum. This improves the present value (PV) of the generated pit shell by eliminating areas of high incremental waste stripping and/or marginal ore. Table 15.5 below summarizes the results of these two LG evaluations. The recoveries described in Section 15.2.1 and the parameters listed in Table 15.1, with the $0.10/t mining adjustment, were applied when calculating block net values. The internal NSR cutoff, which excludes mining costs, remains at $6.36/t.
Table 15.5 ‐ Undiscounted and Discounted LG Results at $2.60/lb. Cu
Ore Grade M&I Resources>=$6.36/t NSR Waste Total Strip
Case Ktonnes NSR $/t
Cu % S % Ktonnes Ktonnes Ratio
No discount 185,680 16.39 0.410 5.09 256,070 441,750 1.38
1.5%/bench 181,394 16.43 0.411 5.04 240,510 421,904 1.33
The LG shell generated at a price of $2.60/lb. Cu with a discount factor of 1.5% per bench was used as the basis for the Cerro Colorado ultimate pit design.
15.4 OpenPitDesignsThe ultimate pit and internal phases for the Cerro Colorado pit were designed to accommodate contractors’ small‐ to medium‐scale mining equipment operating on 10‐m bench intervals. This equipment includes rock drills capable of drilling blastholes of up to 127 mm in diameter, hydraulic excavators with bucket capacities of 5.9‐13 m3, off‐highway trucks with 55‐ to 91‐t payload capacities, and appropriately sized support equipment.
15.4.1 DesignParametersPit walls were smoothed from the basis $2.60/lb. Cu LG shell generated with 1.5% per bench discounting as discussed in Section 15.3.3. The smoothing minimizes or eliminates, where possible, noses and notches that could affect slope stability. Internal haulage ramps were included to allow for truck access to working faces on each level. The basic parameters used in the design of the internal mining phases and ultimate pit are summarized in Table 15.6.
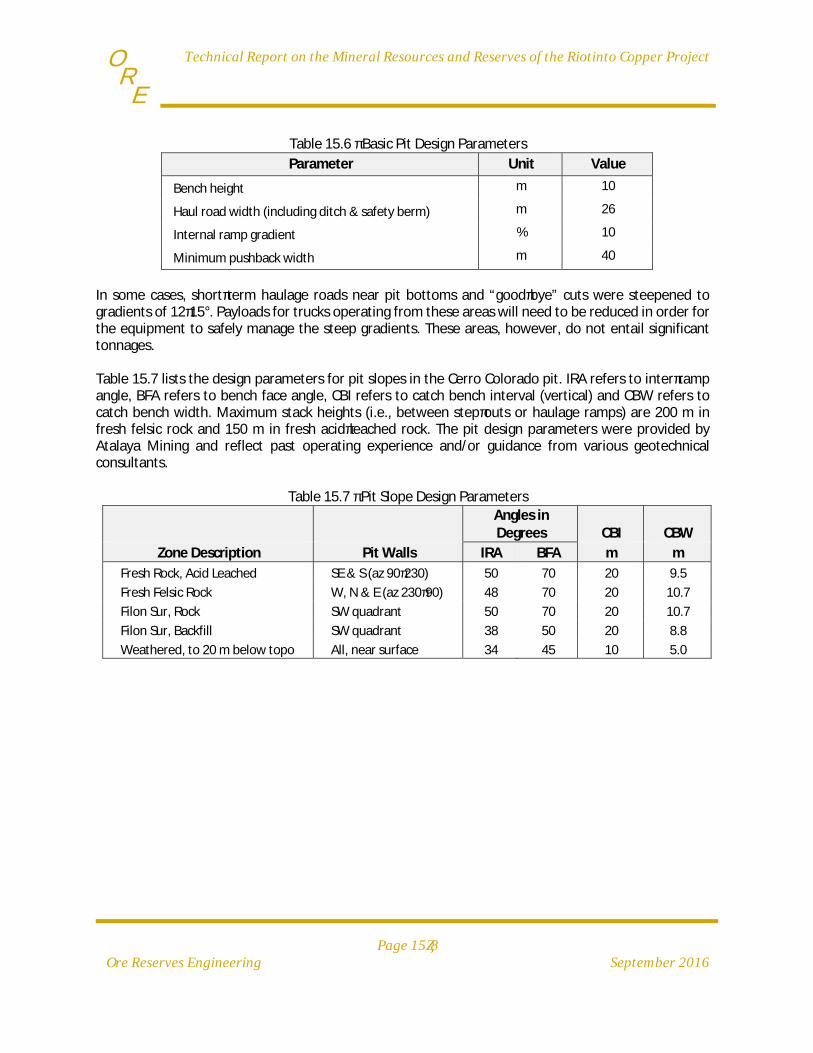
TechnicalReportontheMineralResourcesandReservesoftheRiotintoCopperProject
Page15‐8OreReservesEngineering September2016
E R
O
Table 15.6 ‐ Basic Pit Design Parameters Parameter Unit Value
Bench height m 10
Haul road width (including ditch & safety berm) m 26
Internal ramp gradient % 10
Minimum pushback width m 40
In some cases, short‐term haulage roads near pit bottoms and “good‐bye” cuts were steepened to gradients of 12‐15°. Payloads for trucks operating from these areas will need to be reduced in order for the equipment to safely manage the steep gradients. These areas, however, do not entail significant tonnages. Table 15.7 lists the design parameters for pit slopes in the Cerro Colorado pit. IRA refers to inter‐ramp angle, BFA refers to bench face angle, CBI refers to catch bench interval (vertical) and CBW refers to catch bench width. Maximum stack heights (i.e., between step‐outs or haulage ramps) are 200 m in fresh felsic rock and 150 m in fresh acid‐leached rock. The pit design parameters were provided by Atalaya Mining and reflect past operating experience and/or guidance from various geotechnical consultants.
Table 15.7 ‐ Pit Slope Design Parameters
Angles in Degrees CBI CBW
Zone Description Pit Walls IRA BFA m m
Fresh Rock, Acid Leached SE & S (az 90‐230) 50 70 20 9.5
Fresh Felsic Rock W, N & E (az 230‐90) 48 70 20 10.7
Filon Sur, Rock SW quadrant 50 70 20 10.7
Filon Sur, Backfill SW quadrant 38 50 20 8.8
Weathered, to 20 m below topo All, near surface 34 45 10 5.0
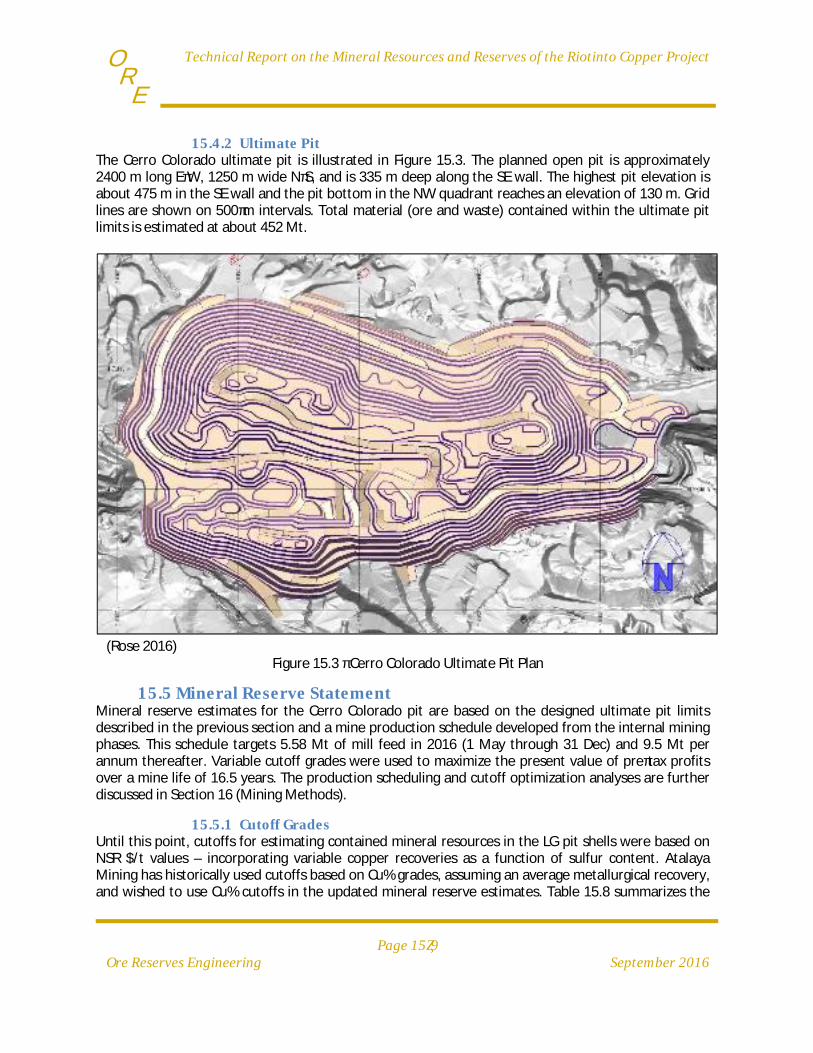
TechnicalReportontheMineralResourcesandReservesoftheRiotintoCopperProject
Page15‐9OreReservesEngineering September2016
E R
O
15.4.2 UltimatePitThe Cerro Colorado ultimate pit is illustrated in Figure 15.3. The planned open pit is approximately 2400 m long E‐W, 1250 m wide N‐S, and is 335 m deep along the SE wall. The highest pit elevation is about 475 m in the SE wall and the pit bottom in the NW quadrant reaches an elevation of 130 m. Grid lines are shown on 500‐m intervals. Total material (ore and waste) contained within the ultimate pit limits is estimated at about 452 Mt.
(Rose 2016) Figure 15.3 ‐ Cerro Colorado Ultimate Pit Plan
15.5 MineralReserveStatementMineral reserve estimates for the Cerro Colorado pit are based on the designed ultimate pit limits described in the previous section and a mine production schedule developed from the internal mining phases. This schedule targets 5.58 Mt of mill feed in 2016 (1 May through 31 Dec) and 9.5 Mt per annum thereafter. Variable cutoff grades were used to maximize the present value of pre‐tax profits over a mine life of 16.5 years. The production scheduling and cutoff optimization analyses are further discussed in Section 16 (Mining Methods).
15.5.1 CutoffGradesUntil this point, cutoffs for estimating contained mineral resources in the LG pit shells were based on NSR $/t values – incorporating variable copper recoveries as a function of sulfur content. Atalaya Mining has historically used cutoffs based on Cu% grades, assuming an average metallurgical recovery, and wished to use Cu% cutoffs in the updated mineral reserve estimates. Table 15.8 summarizes the

TechnicalReportontheMineralResourcesandReservesoftheRiotintoCopperProject
Page15‐10OreReservesEngineering September2016
E R
O
mill feed Cu% cutoffs used to develop the mine production schedule and the mineral reserve estimate. The calculated internal cutoff grade of 0.16% Cu (see Table 15.1) is used during the last three years of planned pit operations.
Table 15.8 ‐ Cutoff Grades by Year Time Cu% Time Cu%
Year Period Cutoff Year Period Cutoff
2016 1 0.25 2025 10 0.21
2017 2 0.25 2026 11 0.20
2018 3 0.25 2027 12 0.19
2019 4 0.25 2028 13 0.18
2020 5 0.25 2029 14 0.17
2021 6 0.24 2030 15 0.16
2022 7 0.24 2031 16 0.16
2023 8 0.23 2032 17 0.16
2024 9 0.22
15.5.2 MineralReserveEstimateMineral reserve is defined as the measured and indicated mineral resource that would be extracted by the mine design and can then be processed at a profit, which is estimated from the mine production schedule. All measured resources meeting that standard are classified as proven mineral reserves, while all indicated resources meeting that standard are classified as probable mineral reserves. All inferred resources and unclassified material are treated as waste. Tables 15.9 and 15.10 present the estimates of proven and probable mineral reserves, respectively, taken from the mine production schedule. Table 15.11 summarizes the estimates of combined proven plus probable mineral reserves, along with low grade, waste rock, and Filon Sur backfill materials.
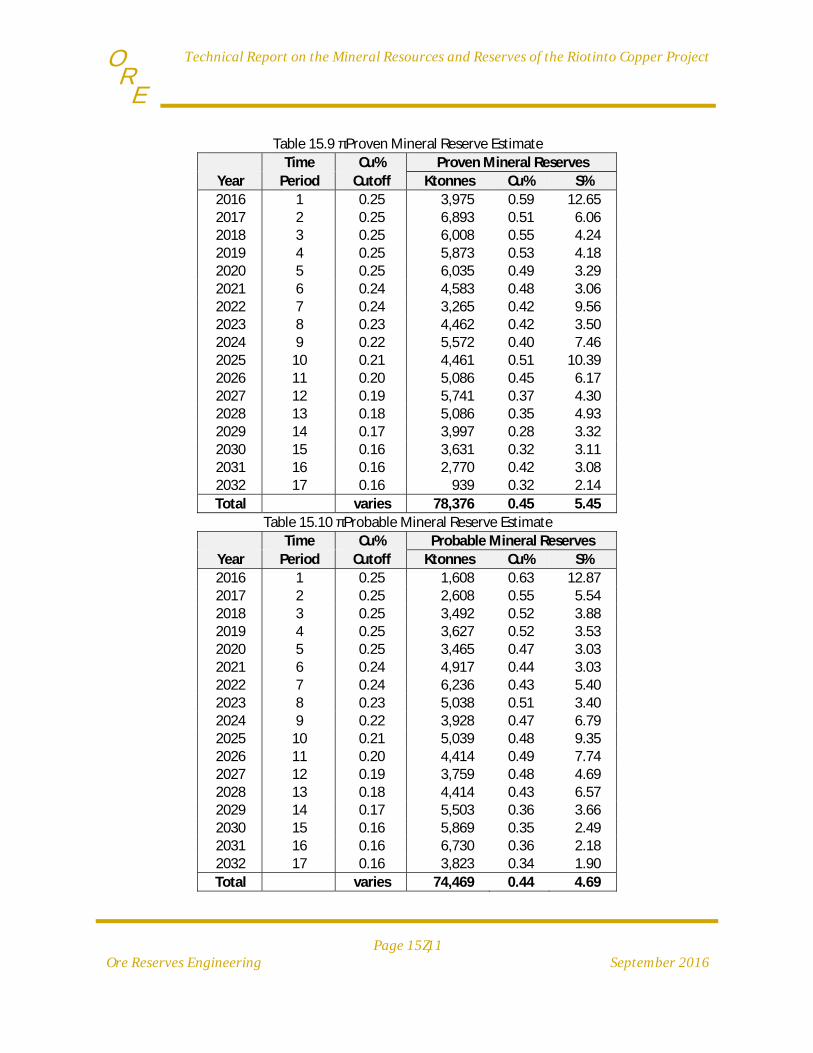
TechnicalReportontheMineralResourcesandReservesoftheRiotintoCopperProject
Page15‐11OreReservesEngineering September2016
E R
O
Table 15.9 ‐ Proven Mineral Reserve Estimate Time Cu% Proven Mineral Reserves
Year Period Cutoff Ktonnes Cu% S%
2016 1 0.25 3,975 0.59 12.65 2017 2 0.25 6,893 0.51 6.06 2018 3 0.25 6,008 0.55 4.24 2019 4 0.25 5,873 0.53 4.18 2020 5 0.25 6,035 0.49 3.29 2021 6 0.24 4,583 0.48 3.06 2022 7 0.24 3,265 0.42 9.56 2023 8 0.23 4,462 0.42 3.50 2024 9 0.22 5,572 0.40 7.46 2025 10 0.21 4,461 0.51 10.39 2026 11 0.20 5,086 0.45 6.17 2027 12 0.19 5,741 0.37 4.30 2028 13 0.18 5,086 0.35 4.93 2029 14 0.17 3,997 0.28 3.32 2030 15 0.16 3,631 0.32 3.11 2031 16 0.16 2,770 0.42 3.08 2032 17 0.16 939 0.32 2.14
Total varies 78,376 0.45 5.45
Table 15.10 ‐ Probable Mineral Reserve Estimate
Time Cu% Probable Mineral Reserves
Year Period Cutoff Ktonnes Cu% S%
2016 1 0.25 1,608 0.63 12.87 2017 2 0.25 2,608 0.55 5.54 2018 3 0.25 3,492 0.52 3.88 2019 4 0.25 3,627 0.52 3.53 2020 5 0.25 3,465 0.47 3.03 2021 6 0.24 4,917 0.44 3.03 2022 7 0.24 6,236 0.43 5.40 2023 8 0.23 5,038 0.51 3.40 2024 9 0.22 3,928 0.47 6.79 2025 10 0.21 5,039 0.48 9.35 2026 11 0.20 4,414 0.49 7.74 2027 12 0.19 3,759 0.48 4.69 2028 13 0.18 4,414 0.43 6.57 2029 14 0.17 5,503 0.36 3.66 2030 15 0.16 5,869 0.35 2.49 2031 16 0.16 6,730 0.36 2.18 2032 17 0.16 3,823 0.34 1.90
Total varies 74,469 0.44 4.69

TechnicalReportontheMineralResourcesandReservesoftheRiotintoCopperProject
Page15‐12OreReservesEngineering September2016
E R
O
Table 15.11 ‐ Combined Proven and Probable Mineral Reserve Estimate
Total proven and probable mineral reserves are estimated at nearly 153 Mt grading 0.45% Cu. Contained copper is estimated at 681,000 tonnes. Waste rock and backfill are projected at about 299 Mt, resulting in a stripping ratio of 1.95. All of the mineral reserves reported in Tables 15.9 15.10, and 15.11 are contained within the mineral resources reported in Section 14. The mineral reserve estimates in this report are effective as of 30 April 2016.
15.5.3 SensitivityofReservestootherFactorsPotential sensitivities of mineral reserves to variations in copper price and operating costs are indicated in Sections 15.3.1 and 15.3.2, respectively. Other potential risks to mineral reserves include a Roman settlement archeological site just outside the northern most extent of the Phase 1 pit wall and the existing location of national Highway A‐461 that limits the western extent of Phase 2. Mining Phase 1 was designed to avoid disturbance of a Roman archeological site, deferring mining in this area until Phase 4 stripping commences in 2021 (Year 6). Atalaya Mining has indicated that development of the site will be permitted once archeological surveys have been completed. An LG analysis restricting pit expansion into this site indicates that about 4‐5% of the mineral reserves would be at risk should the necessary development permit for this area be denied. Similarly, the design of Phase 2 was limited on the western side to avoid early relocation of Highway A‐461. This highway must be relocated outside the ultimate pit limits before Phase 5 stripping commences in 2022 (Year 7) to prevent interruptions in the mine production schedule. An engineered backfill of an eastern extension of the Atalaya open pit, totaling approximately 4 Mt, would provide a
Time Cu% Proven+Probable Mineral Reserves Waste, Ktonnes Total Strip
Year Period Cutoff Ktonnes Cu% S% LG+Rock FS Backfill Ktonnes Ratio
2016 1 0.25 5,583 0.60 12.72 13,730 446 19,759 2.54
2017 2 0.25 9,500 0.52 5.92 21,986 314 31,800 2.35
2018 3 0.25 9,500 0.54 4.11 21,985 315 31,800 2.35
2019 4 0.25 9,500 0.53 3.94 20,024 2,276 31,800 2.35
2020 5 0.25 9,500 0.48 3.19 19,922 2,379 31,800 2.35
2021 6 0.24 9,500 0.46 3.04 21,909 391 31,800 2.35
2022 7 0.24 9,500 0.43 6.83 22,293 7 31,800 2.35
2023 8 0.23 9,500 0.47 3.44 19,890 2,410 31,800 2.35
2024 9 0.22 9,500 0.43 7.18 17,276 5,025 31,800 2.35
2025 10 0.21 9,500 0.50 9.84 18,400 3,900 31,800 2.35
2026 11 0.20 9,500 0.47 6.90 20,080 2,220 31,800 2.35
2027 12 0.19 9,500 0.41 4.46 21,995 305 31,800 2.35
2028 13 0.18 9,500 0.39 5.69 14,081 207 23,788 1.50
2029 14 0.17 9,500 0.33 3.51 11,213 0 20,713 1.18
2030 15 0.16 9,500 0.34 2.73 6,879 0 16,379 0.72
2031 16 0.16 9,500 0.38 2.44 4,842 0 14,342 0.51
2032 17 0.16 4,762 0.34 1.94 2,046 0 6,808 0.43
Total var 152,845 0.45 5.08 278,550 20,194 451,589 1.95

TechnicalReportontheMineralResourcesandReservesoftheRiotintoCopperProject
Page15‐13OreReservesEngineering September2016
E R
O
new alignment for the highway that allows development of Phases 5 and 6. Atalaya Mining has indicated that the highway relocation can be achieved in a timely manner through standard engineering and permitting processes. An LG analysis was performed such that pit development could not encroach on the existing highway location, which indicated that about 7‐8% of the mineral reserves would be at risk if the highway relocation cannot be permitted. Standing water in the bottom of the Cerro Colorado pit must be removed prior to mining below these water levels. Excessive rainfall or unexpected groundwater inflows could possibly cause short‐ to medium‐term delays in the development of some areas, but is not expected to significantly impact the mineral reserve estimate. No other mining, metallurgical, infrastructure, or permitting factors are presently known that may materially affect the mineral reserve estimate.

TechnicalReportontheMineralResourcesandReservesoftheRiotintoCopperProject
Page16‐1OreReservesEngineering September2016
E R
O
16 MININGMETHODSMining has been conducted in the Riotinto area episodically since Roman times, and possibly earlier. The Riotinto Company (a British firm) gained mineral rights and surface ownership in 1874 and operated Riotinto Minera until it began divesting its interests in 1954. Operations in the Cerro Colorado open pit, which is the foundation of the Riotinto Project, began in 1968. The Riotinto mine properties were under the ownership of a local cooperative by the end of the 1990s. Mining activities ended at Cerro Colorado and other smaller operations in 2001 due to deteriorating economic conditions. Mining operations at the Riotinto Project site restarted in June 2015. The Cerro Colorado pit is completely open and in good condition, except for an accumulation of water in the lowest levels of the pit. Continued exploitation of the Cerro Colorado deposit will use conventional, open pit mining methods. Mining benches will be on 10‐m vertical intervals. Contractors’ small‐ to medium‐scale mining equipment will be used to execute the development plan, including: rock drills capable of drilling 102‐ to 127‐mm‐diameter blastholes, hydraulic excavators with bucket capacities of 5.9‐13 m3, off‐highway trucks with 55‐ to 91‐t payload capacities, and suitably sized support equipment. Atalaya Mining is presently using mining contractors for all excavation work, including drilling and blasting, through the joint venture UTE Riotinto. This joint venture includes the companies S&L, which handles earth moving, and Insersa, which is responsible for drilling and blasting. Both companies are significant and well‐financed contractors in Spain with extensive metal mining experience. Atalaya Mining is responsible for all grade control.
16.1 MiningPhaseDesignsThe ultimate pit and mining phase designs were created using Hexagon Mining’s MineSight® software package, which includes a three‐dimensional Lerchs‐Grossmann (LG) algorithm for pit optimization and extraction sequence analyses. The Cerro Colorado deposit block model was developed by O.R.E. in May 2016 for mineral resource estimates (see Section 14) using CAE’s Studio 3 software and then converted into a form readable by MineSight. Surface topography reflects mining progress as of 30 April 2016.
16.1.1 PhaseDesignParametersThe same metallurgical recoveries, Cu payables, operating costs, overall slope angles, and bulk densities used to evaluate the ultimate pit limits were also used in the analysis of the mining phase development sequence (see Sections 15.2.1, 15.2.2, 15.2.3, and 15.2.4). Similarly, no adjustments for mining dilution and ore loss were deemed necessary – outside of the provisions already incorporated in the development of the deposit block model.

TechnicalReportontheMineralResourcesandReservesoftheRiotintoCopperProject
Page16‐2OreReservesEngineering September2016
E R
O
The mining phase design parameters are the same as those used for the ultimate pit and are reproduced below for the reader’s convenience. Table 16.1 lists the basic design parameters and Table 16.2 presents the pit slopes and catch bench dimensions based on guidance from Atalaya Mining and its geotechnical consultants. IRA refers to inter‐ramp angle, BFA refers to bench face angle, CBI refers to catch bench interval (vertical) and CBW refers to catch bench width. Maximum stack heights (i.e., between step‐outs or haulage ramps) are 200 m in fresh felsic rock and 150 m in fresh acid‐leached rock.
Table 16.1 ‐ Basic Pit Design Parameters
Parameter Unit Value
Bench height m 10
Haul road width (including ditch & safety berm) m 26
Internal ramp gradient % 10
Minimum pushback width m 40
Table 16.2 ‐ Pit Slope Design Parameters
Angles in Degrees CBI CBW
Zone Description Pit Walls IRA BFA m m
Fresh Rock, Acid Leached SE & S (az 90‐230) 50 70 20 9.5
Fresh Felsic Rock W, N & E (az 230‐90) 48 70 20 10.7
Filon Sur, Rock SW quadrant 50 70 20 10.7
Filon Sur, Backfill SW quadrant 38 50 20 8.8
Weathered, to 20 m below topo All, near surface 34 45 10 5.0
16.1.2 InternalMiningPhasesThe LG price sensitivity analyses described in Section 15.3.1 provided guidance in the design of six internal mining phases. Phase 1 was derived from the $1.25‐1.50 Cu pit shells, Phase 2 from the $1.75 Cu shell along the north wall, Phases 3 and 4 from the $2.25‐2.60 Cu shells, and Phases 5 and 6 from the discounted $2.60 Cu shell. The intent is to mine the highest grade and lowest stripping ratio material in the initial phase and progress to the next best material in subsequent pushbacks, subject to working room and access considerations. Figures 16.1 through 16.6 illustrate the phase development sequence for the Cerro Colorado pit. Grid lines are shown on 500‐m intervals. The planned ultimate pit is approximately 2400 m long E‐W, 1250 m wide N‐S, and is 335 m deep along the SE wall. The highest pit elevation is about 475 m in the SE wall of Phase 3 and the pit bottom in Phase 6 in the NW quadrant reaches a minimum elevation of 130 m.

TechnicalReportontheMineralResourcesandReservesoftheRiotintoCopperProject
Page16‐3OreReservesEngineering September2016
E R
O
(Rose 2016) Figure 16.1 ‐ Mining Phase 1
(Rose 2016) Figure 16.2 ‐ Mining Phase 2

TechnicalReportontheMineralResourcesandReservesoftheRiotintoCopperProject
Page16‐4OreReservesEngineering September2016
E R
O
(Rose 2016)
Figure 16.3 ‐ Mining Phase 3
(Rose 2016) Figure 16.4 ‐ Mining Phase 4

TechnicalReportontheMineralResourcesandReservesoftheRiotintoCopperProject
Page16‐5OreReservesEngineering September2016
E R
O
(Rose 2016) Figure 16.5 ‐ Mining Phase 5 (Filon Sur)
(Rose 2016)
Figure 16.6 ‐ Mining Phase 6 (Ultimate Pit)
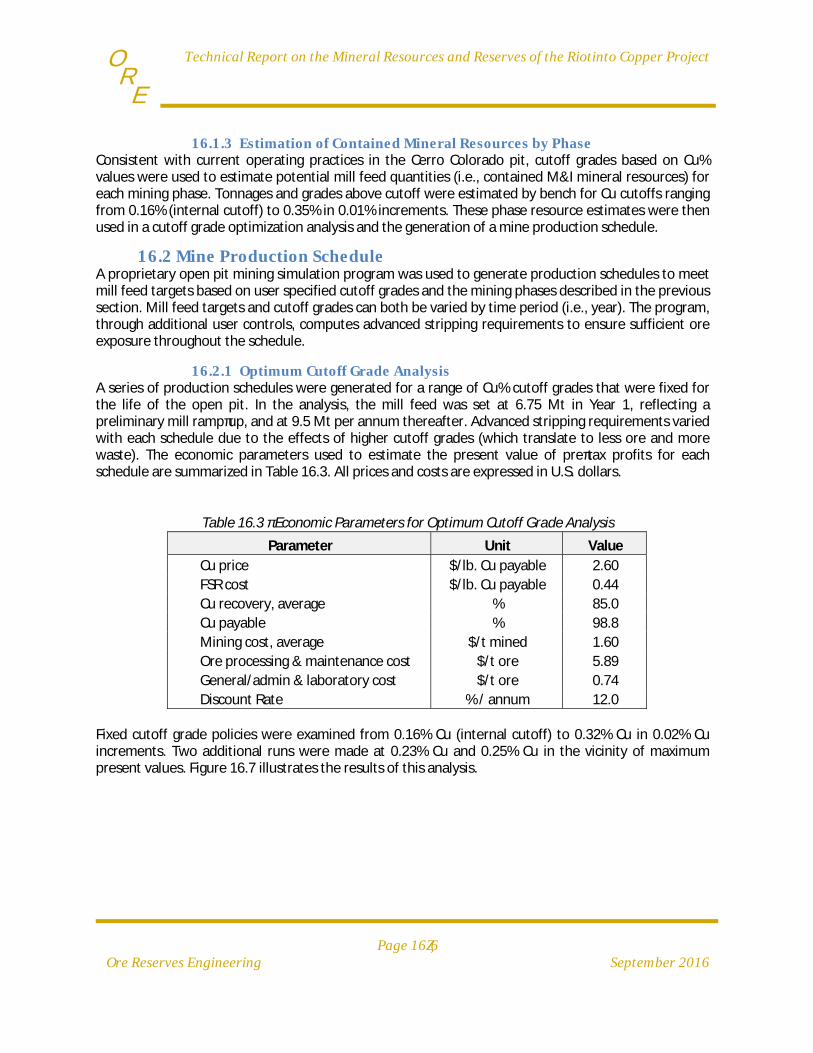
TechnicalReportontheMineralResourcesandReservesoftheRiotintoCopperProject
Page16‐6OreReservesEngineering September2016
E R
O
16.1.3 EstimationofContainedMineralResourcesbyPhaseConsistent with current operating practices in the Cerro Colorado pit, cutoff grades based on Cu% values were used to estimate potential mill feed quantities (i.e., contained M&I mineral resources) for each mining phase. Tonnages and grades above cutoff were estimated by bench for Cu cutoffs ranging from 0.16% (internal cutoff) to 0.35% in 0.01% increments. These phase resource estimates were then used in a cutoff grade optimization analysis and the generation of a mine production schedule.
16.2 MineProductionScheduleA proprietary open pit mining simulation program was used to generate production schedules to meet mill feed targets based on user specified cutoff grades and the mining phases described in the previous section. Mill feed targets and cutoff grades can both be varied by time period (i.e., year). The program, through additional user controls, computes advanced stripping requirements to ensure sufficient ore exposure throughout the schedule.
16.2.1 OptimumCutoffGradeAnalysisA series of production schedules were generated for a range of Cu% cutoff grades that were fixed for the life of the open pit. In the analysis, the mill feed was set at 6.75 Mt in Year 1, reflecting a preliminary mill ramp‐up, and at 9.5 Mt per annum thereafter. Advanced stripping requirements varied with each schedule due to the effects of higher cutoff grades (which translate to less ore and more waste). The economic parameters used to estimate the present value of pre‐tax profits for each schedule are summarized in Table 16.3. All prices and costs are expressed in U.S. dollars.
Table 16.3 ‐ Economic Parameters for Optimum Cutoff Grade Analysis
Parameter Unit Value
Cu price $/lb. Cu payable 2.60
FSR cost $/lb. Cu payable 0.44
Cu recovery, average % 85.0
Cu payable % 98.8
Mining cost, average $/t mined 1.60
Ore processing & maintenance cost $/t ore 5.89
General/admin & laboratory cost $/t ore 0.74
Discount Rate % / annum 12.0
Fixed cutoff grade policies were examined from 0.16% Cu (internal cutoff) to 0.32% Cu in 0.02% Cu increments. Two additional runs were made at 0.23% Cu and 0.25% Cu in the vicinity of maximum present values. Figure 16.7 illustrates the results of this analysis.

TechnicalReportontheMineralResourcesandReservesoftheRiotintoCopperProject
Page16‐7OreReservesEngineering September2016
E R
O
370,000
380,000
390,000
400,000
410,000
420,000
430,000
0.16 0.18 0.20 0.22 0.24 0.26 0.28 0.30 0.32
Pre
sent V
alue
of Pre‐t
ax P
rofits
, US$ x 1
000
Fixed Cutoff Grade, Cu %
(Rose 2016) Figure 16.7 ‐ Optimum Cutoff Grade Analysis Results
The above analysis indicates that fixed cutoffs in the range of 0.24‐0.25% Cu would generate the maximum present value of pre‐tax profits. The bulk of this present value is determined by the first few years of operation as discounting increasingly erodes the present values of profits in later years. Extensive experience on other projects has shown that a declining cutoff strategy, starting at the best fixed cutoff grade, can further improve present values by reducing waste stripping rates as cutoff grades decrease in later years. Exact mathematical optimizations are not guaranteed, but these declining cutoff schedules are practical solutions that achieve very similar results.
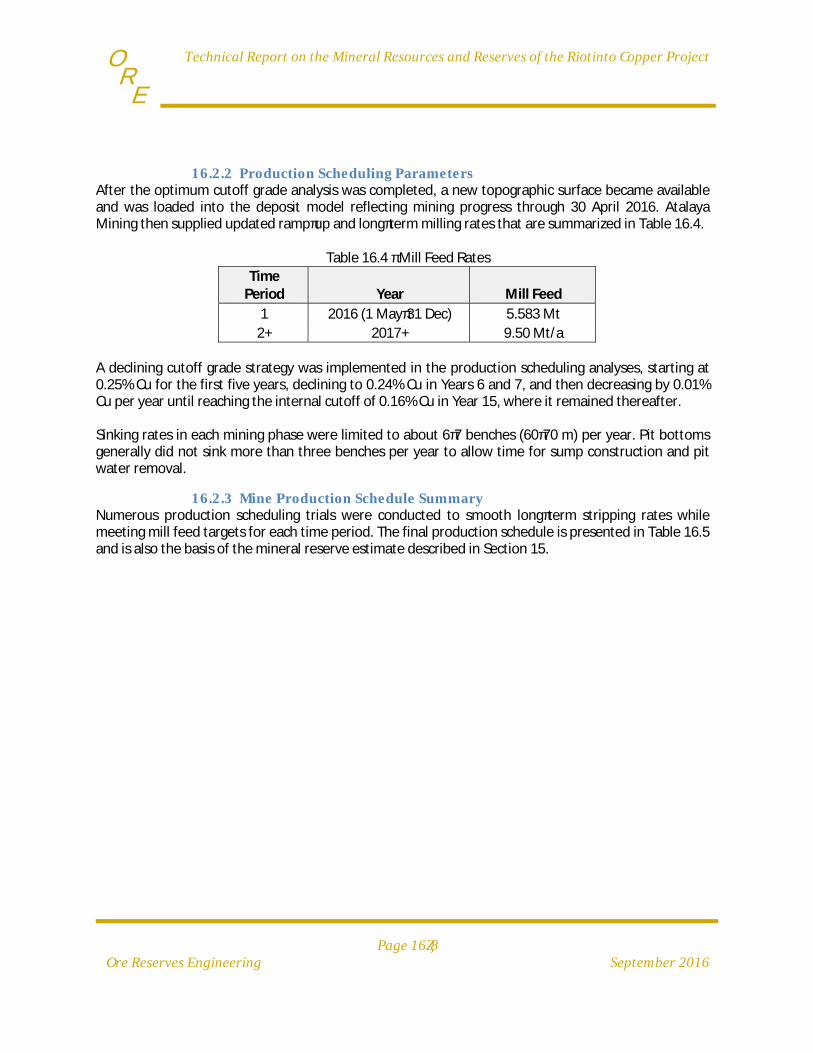
TechnicalReportontheMineralResourcesandReservesoftheRiotintoCopperProject
Page16‐8OreReservesEngineering September2016
E R
O
16.2.2 ProductionSchedulingParametersAfter the optimum cutoff grade analysis was completed, a new topographic surface became available and was loaded into the deposit model reflecting mining progress through 30 April 2016. Atalaya Mining then supplied updated ramp‐up and long‐term milling rates that are summarized in Table 16.4.
Table 16.4 ‐ Mill Feed Rates Time
Period Year Mill Feed
1 2016 (1 May‐31 Dec) 5.583 Mt
2+ 2017+ 9.50 Mt/a
A declining cutoff grade strategy was implemented in the production scheduling analyses, starting at 0.25% Cu for the first five years, declining to 0.24% Cu in Years 6 and 7, and then decreasing by 0.01% Cu per year until reaching the internal cutoff of 0.16% Cu in Year 15, where it remained thereafter. Sinking rates in each mining phase were limited to about 6‐7 benches (60‐70 m) per year. Pit bottoms generally did not sink more than three benches per year to allow time for sump construction and pit water removal.
16.2.3 MineProductionScheduleSummaryNumerous production scheduling trials were conducted to smooth long‐term stripping rates while meeting mill feed targets for each time period. The final production schedule is presented in Table 16.5 and is also the basis of the mineral reserve estimate described in Section 15.

TechnicalReportontheMineralResourcesandReservesoftheRiotintoCopperProject
Page16‐9OreReservesEngineering September2016
E R
O
Table 16.5 ‐ Mine Production Schedule Summary
The first mining phase, developed in 2016 (Year 1), largely extends prior mining areas and haul roads downward in the existing Cerro Colorado pit; consequently, little preproduction stripping is required and can be performed concurrently with pit bottom ore mining during 2016. Advanced stripping commences at the start of 2017 in Phase 2, at the end of 2017 in Phase 3, in 2021 in Phase 4, at the end of 2022 in Phase 5, and in 2025 in Phase 6. A uniform stripping rate of 22.3 Mt/a is estimated for 11 years, from 2017 through 2027, before declining when adequate ore exposure is reached in Phase 6. Mill head grades during the first five years of operation are projected to average just over 0.51% Cu, which is nearly 15% higher that the life‐of‐mine average. This is attributable to both the mining phase sequence and the cutoff grade policy. Total contained copper in the schedule’s mill feed is estimated at 681,000 tonnes. As of the end of May 2016, Atalaya Mining estimates that about 2.3 M m3 of water remains in the bottom of the Cerro Colorado pit at a surface elevation of 325 m and estimates that nearly 16 months will be needed to pump this acidic water to a treatment plant for its eventual reuse in the ore processing plant or discharge. At this pumping rate, Atalaya Mining projects that pit lake elevations will recede to 317 m by the end of 2016, 310 m by late May 2017, and be completely dewatered by mid‐September 2017. After this date, pit dewatering rates are projected to decline to 0.5 M m3 per year. The bottom bench of Phase 1 will reach the 330 m elevation by the end of 2016, well above the projected pit lake level of 317 m. Mining on the 310 m bench will commence by mid‐ to late May 2017
Time Calendar Cu% Mill Feed (Prov+Prob Mineral Reserves) Waste, Ktonnes Total Strip
Period Year Cutoff Ktonnes Cu% S% Low Grade Rock FS Backfill Ktonnes Ratio
1 2016 0.25 5,583 0.60 12.72 825 12,905 446 19,759 2.54
2 2017 0.25 9,500 0.52 5.92 1,356 20,630 314 31,800 2.35
3 2018 0.25 9,500 0.54 4.11 1,451 20,534 315 31,800 2.35
4 2019 0.25 9,500 0.53 3.94 1,598 18,426 2,276 31,800 2.35
5 2020 0.25 9,500 0.48 3.19 1,612 18,310 2,379 31,800 2.35
6 2021 0.24 9,500 0.46 3.04 1,327 20,582 391 31,800 2.35
7 2022 0.24 9,500 0.43 6.83 1,254 21,039 7 31,800 2.35
8 2023 0.23 9,500 0.47 3.44 1,080 18,810 2,410 31,800 2.35
9 2024 0.22 9,500 0.43 7.18 629 16,647 5,025 31,800 2.35
10 2025 0.21 9,500 0.50 9.84 269 18,131 3,900 31,800 2.35
11 2026 0.20 9,500 0.47 6.90 0 20,080 2,220 31,800 2.35
12 2027 0.19 9,500 0.41 4.46 0 21,995 305 31,800 2.35
13 2028 0.18 9,500 0.39 5.69 0 14,081 207 23,788 1.50
14 2029 0.17 9,500 0.33 3.51 0 11,213 0 20,713 1.18
15 2030 0.16 9,500 0.34 2.73 0 6,879 0 16,379 0.72
16 2031 0.16 9,500 0.38 2.44 0 4,842 0 14,342 0.51
17 2032 0.16 4,762 0.34 1.94 0 2,046 0 6,808 0.43
Total var 152,845 0.45 5.08 11,400 267,150 20,194 451,589 1.95
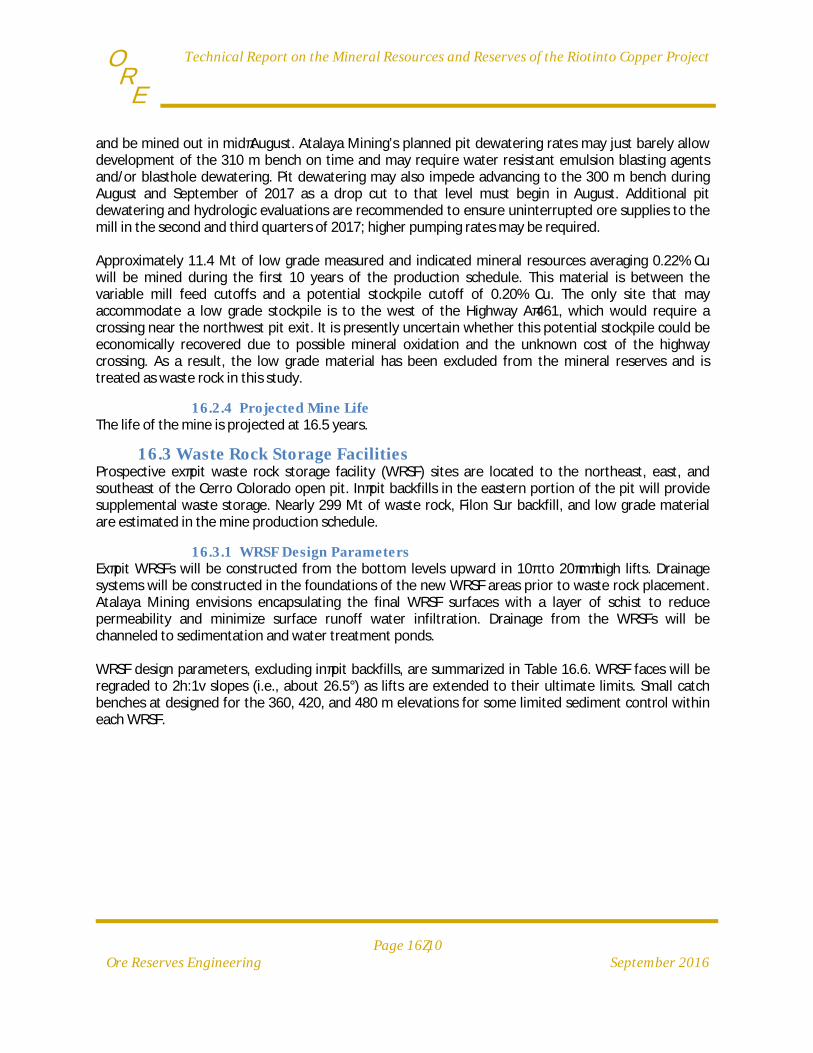
TechnicalReportontheMineralResourcesandReservesoftheRiotintoCopperProject
Page16‐10OreReservesEngineering September2016
E R
O
and be mined out in mid‐August. Atalaya Mining’s planned pit dewatering rates may just barely allow development of the 310 m bench on time and may require water resistant emulsion blasting agents and/or blasthole dewatering. Pit dewatering may also impede advancing to the 300 m bench during August and September of 2017 as a drop cut to that level must begin in August. Additional pit dewatering and hydrologic evaluations are recommended to ensure uninterrupted ore supplies to the mill in the second and third quarters of 2017; higher pumping rates may be required. Approximately 11.4 Mt of low grade measured and indicated mineral resources averaging 0.22% Cu will be mined during the first 10 years of the production schedule. This material is between the variable mill feed cutoffs and a potential stockpile cutoff of 0.20% Cu. The only site that may accommodate a low grade stockpile is to the west of the Highway A‐461, which would require a crossing near the northwest pit exit. It is presently uncertain whether this potential stockpile could be economically recovered due to possible mineral oxidation and the unknown cost of the highway crossing. As a result, the low grade material has been excluded from the mineral reserves and is treated as waste rock in this study.
16.2.4 ProjectedMineLifeThe life of the mine is projected at 16.5 years.
16.3 WasteRockStorageFacilitiesProspective ex‐pit waste rock storage facility (WRSF) sites are located to the northeast, east, and southeast of the Cerro Colorado open pit. In‐pit backfills in the eastern portion of the pit will provide supplemental waste storage. Nearly 299 Mt of waste rock, Filon Sur backfill, and low grade material are estimated in the mine production schedule.
16.3.1 WRSFDesignParametersEx‐pit WRSFs will be constructed from the bottom levels upward in 10‐ to 20‐m‐high lifts. Drainage systems will be constructed in the foundations of the new WRSF areas prior to waste rock placement. Atalaya Mining envisions encapsulating the final WRSF surfaces with a layer of schist to reduce permeability and minimize surface runoff water infiltration. Drainage from the WRSFs will be channeled to sedimentation and water treatment ponds. WRSF design parameters, excluding in‐pit backfills, are summarized in Table 16.6. WRSF faces will be regraded to 2h:1v slopes (i.e., about 26.5°) as lifts are extended to their ultimate limits. Small catch benches at designed for the 360, 420, and 480 m elevations for some limited sediment control within each WRSF.

TechnicalReportontheMineralResourcesandReservesoftheRiotintoCopperProject
Page16‐11OreReservesEngineering September2016
E R
O
Table 16.6 ‐ Ex‐Pit WRSF Design Parameters
Parameter Unit Value
Net swell factor % 35
WRSF average density t/m3 2.04
Lift height m 10‐20
Regraded slope face angle degrees 26.5
Maximum overall slope angle degrees 25
Catch bench vertical interval m 60
Catch bench width m 10
Haul road width m 30
Maximum road gradient % 10
The in‐pit backfills will be constructed from the 200, 250, 270, 300, 340, and 370 m elevations – connecting to haul roads on the south and east walls of the ultimate pit. No regrading of the dump faces, at a 37° angle of repose, is presently planned within the pit limits. The overall angle of the western backfill slope is approximately 28°.
16.3.2 UltimateWRSFPlanWaste rock will be placed into three locations: the main external WRSF around the northeast, east, and southeast sides of the Cerro Colorado pit; an in‐pit backfill area that becomes available after completion of mining Phase 4 in the last half of Year 12 (2027); and a backfill area in the eastern extension of the old Atalaya open pit that must be completed before the end of Year 7 (2022) for the relocation of Highway A‐461. The WRSF designs with respect to the ultimate pit are shown in Figure 16.8 and are highlighted in brown. Grid lines are on 500 m intervals. The main external WRSF forms an approximately 4 km long arc around the eastern half of the pit. The highest elevation is 520 m in the north area and the lowest is 325 m on the southeast toe. This WRSF has a surface area about 260 ha and a storage capacity of 120 M m3. The in‐pit backfill as shown in Figure 16.8 has a crest elevation of 370 m and a minimum toe elevation of about 200 m. The backfilled Phase 4 benches between the 140 and 200 m elevations are obscured. The storage capacity of the backfill is estimated at 26 M m3. The lift at a crest elevation 370 m could be easily expanded for additional storage capacity if needed. The surface area of the in‐pit backfill is about 40 ha.

TechnicalReportontheMineralResourcesandReservesoftheRiotintoCopperProject
Page16‐12OreReservesEngineering September2016
E R
O
The top elevations for the highway relocation backfill range between 436 and 445 m and the lowest toe elevation is 344 m. The length of the roadway platform is about 415 m and the width is 40 m. The graded slopes of this backfill are at 28°. The highway backfill has a storage capacity of nearly 2 M m3 and a surface area of just over 7 ha.
(Rose 2016) Figure 16.8 ‐ Ultimate WRSF Plans
16.3.3 WRSFCapacityEstimateThe estimated storage capacities for ex‐pit WRSFs and backfills are summarized in Table 16.7. An average density (net of swell) of 2.04 t/m3 was used to calculate tonnages. Total storage capacity is estimated at 302 Mt, just exceeding the required 299 Mt. As mentioned in Section 16.3.2, some additional storage capacity exists atop the in‐pit backfill if needed.
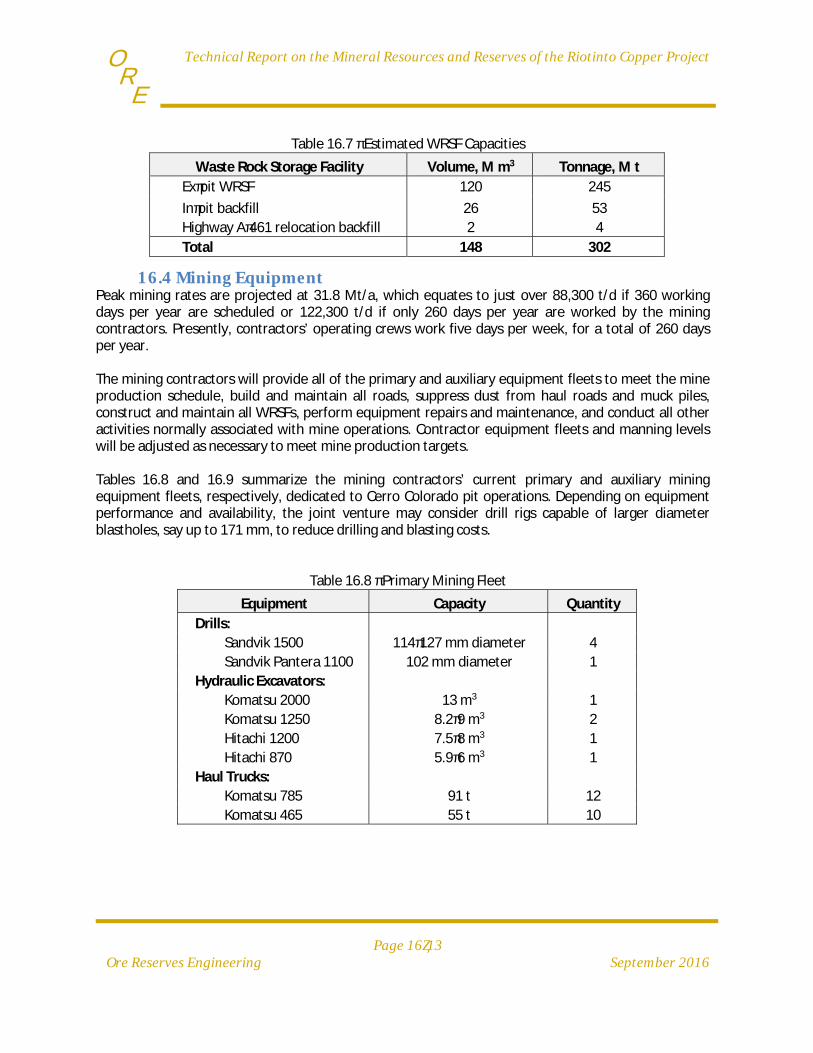
TechnicalReportontheMineralResourcesandReservesoftheRiotintoCopperProject
Page16‐13OreReservesEngineering September2016
E R
O
Table 16.7 ‐ Estimated WRSF Capacities
Waste Rock Storage Facility Volume, M m3 Tonnage, M t
Ex‐pit WRSF 120 245
In‐pit backfill 26 53
Highway A‐461 relocation backfill 2 4
Total 148 302
16.4 MiningEquipmentPeak mining rates are projected at 31.8 Mt/a, which equates to just over 88,300 t/d if 360 working days per year are scheduled or 122,300 t/d if only 260 days per year are worked by the mining contractors. Presently, contractors’ operating crews work five days per week, for a total of 260 days per year. The mining contractors will provide all of the primary and auxiliary equipment fleets to meet the mine production schedule, build and maintain all roads, suppress dust from haul roads and muck piles, construct and maintain all WRSFs, perform equipment repairs and maintenance, and conduct all other activities normally associated with mine operations. Contractor equipment fleets and manning levels will be adjusted as necessary to meet mine production targets. Tables 16.8 and 16.9 summarize the mining contractors’ current primary and auxiliary mining equipment fleets, respectively, dedicated to Cerro Colorado pit operations. Depending on equipment performance and availability, the joint venture may consider drill rigs capable of larger diameter blastholes, say up to 171 mm, to reduce drilling and blasting costs.
Table 16.8 ‐ Primary Mining Fleet
Equipment Capacity Quantity
Drills:
Sandvik 1500 114‐127 mm diameter 4
Sandvik Pantera 1100 102 mm diameter 1
Hydraulic Excavators:
Komatsu 2000 13 m3 1
Komatsu 1250 8.2‐9 m3 2
Hitachi 1200 7.5‐8 m3 1
Hitachi 870 5.9‐6 m3 1
Haul Trucks:
Komatsu 785 91 t 12
Komatsu 465 55 t 10

TechnicalReportontheMineralResourcesandReservesoftheRiotintoCopperProject
Page16‐14OreReservesEngineering September2016
E R
O
Table 16.9 ‐ Auxiliary Mining Fleet
Equipment Quantity
Caterpillar 824 wheel dozer 2
Caterpillar D8T track dozer 1
Caterpillar 345 hydraulic backhoe 1
Hitachi 210 hydraulic backhoe 1
Caterpillar 14 motor grader 2
Caterpillar 583 vibratory roller 1
Water truck 4
Volvo A40 articulated truck 2
Volvo A25 articulated truck 1
16.5 MiningPersonnelMining contractor personnel will be devoted to supervision and craft labor – i.e., mine operations and equipment maintenance. The work of Atalaya Mining’s mine department employees will be limited to contract management, safety and supervision tasks, and most technical services (engineering, geology, etc.). Table 16.10 summarizes the estimated levels of mining‐related personnel.
Table 16.10 ‐ Mining‐Related Personnel
Worker Type Quantity
Contractor supervision 20
Contractor craft labor 102
Subtotal contractor personnel 122
Owner (Atalaya Mining) personnel 15
Total mining personnel 137
16.6 OldWorkingsThere are old galleries and waste fill zones, as well as some other underground workings that were created by prior mining operations in the Cerro Colorado deposit. Although the locations of many of these workings are known, procedures will be developed to drill from operating benches of the pit to locate all voids left by previous operations. These old workings may be filled if necessary to insure the safety of proximate operations and personnel.
TechnicalReportontheMineralResourcesandReservesoftheRiotintoCopperProject
Page17‐1
OreReservesEngineering September2016
E R
O
17 RECOVERYMETHODS
17.1 ProcessSummary
The Riotinto concentrator processes copper sulfide ore using conventional froth flotation to produce copper concentrates. The plant employs a combination of existing equipment associated with the historical operations as well expanded and upgraded facilities. The ore mined from the Cerro Colorado open pit features different mineralogical characteristics depending on whether it is mined from the east (CCE) or the west (CCW) areas. The CCE ore has a higher copper content than the CCW ore, historically 0.63 % and 0.40 %, respectively. Likewise, the ore from CCE has higher sulfur content at 12 %, versus 4 % from CCW basically because of pyrite content. Another difference between the two ore types is that ore from CCE has a higher content of penalty elements such as arsenic and antimony. Historically, the CCE ore recovered less copper than the CCW ore. This fact was confirmed during the phase 1 period of the Project.
The ore from CCE requires a finer primary grind than the ore from CCW to achieve the same metallurgical recovery. Also, the CCE ore requires less energy to obtain the same particle size as the ore from CCW.
Relatively coarse primary and secondary grinding, at a P80 of approximately 160 microns, is used to float the minerals containing chalcopyrite and pyrite to produce a rougher concentrate. This concentrate must then be re‐ground to a relatively fine grain size of around 40 to 20 microns in order to increase the concentrate grade.
Both ore types contain silver but ore from CCE has a higher silver content than ore from CCW. The silver content in the concentrates produced during phase 1 of the operation is between 62 and 150 g/t.
The different properties of the ore are summarized in Table 17.1 below and are based on the historical plant operating records.

TechnicalReportontheMineralResourcesandReservesoftheRiotintoCopperProject
Page17‐2
OreReservesEngineering September2016
E R
O
Table 17.1 – Summary of CCW and CCE Ore Characteristics (EMED 2013)
Cerro Colorado Pit, Summary of Ores
Parameter CCW CCE
Mineralogy 6.5% FeS2, Pyrite 21% FeS2, Pyrite 1.2% CuFeS2,
Chalcopyrite1.8% CuFeS2, Chalcopyrite
0.2% ZnS, Sphalerite 0.3% ZnS, Sphalerite 91.9% Gangue 76% Gangue
Composition 4% S 12% S 0.4% Cu 0.63% Cu
0.13% Zn 0.19% Zn 0.4 gpt Ag 0.8 gpt Ag 205 ppm As 500 ppm As 20 ppm Sb 61 ppm Sb 11 ppm Bi 29 ppm Bi
Design data
Bond Work Hardness 16 kWh/t 14 kWh/t
SG, dry ore 3 3.5
Flotation Feed target 210 microns 160 microns Con Regrind P80 ~45 microns ~ 40 microns
Rougher Residence time for phase 1 ~23 mins ~24 mins
Rougher Residence time for phase 2 ~19 mins ~19 mins
Cu Recovery 87.0% 81.00%
Copper Con Grade ~ 23% Cu, (58 g/t Ag) ~ 21% Cu, (132 g/t Ag)
The Filon Sur Zone (FSUR) located in the Southwest area of Cerro Colorado is considered to be analogous to the CCW ore and requires the same processing parameters. The processing department staff consists of 79 people, 10 of whom work in management and supervisory positions and the balance occupy positions assigned to middle management and operating personnel. The concentrator is being managed through an ongoing improvement system which aims to maintain or improve the historical metallurgy results. The unitary operating costs have decreased since the start of phase 1 as the production rate has increased and also as a result of the economies of scale.

TechnicalReportontheMineralResourcesandReservesoftheRiotintoCopperProject
Page17‐3
OreReservesEngineering September2016
E R
O
The energy and water requirements for processing have been achieved without any problems for phase 1. The water, electricity and the consumables required to process 9.5 million tonnes of ore per year are shown in section 18.
17.2 RiotintoPhase1The existing concentrator, consisting of crushing, grinding, and flotation that was designed and built in the 1990’s, has been refurbished to process ores from the current mine operations. Atalaya Mining has been working since June 2014 with engineering firms that are specialized in detailed engineering, construction, and commissioning, to develop the phase 1 project of the Riotinto plant. Reconditioning of the existing equipment and infrastructure, as well as the installation of new equipment and systems for phase 1, was successfully completed on schedule in June 2015. The commissioning and ramp‐up of phase 1 was accomplished in seven months, reaching a nominal milling rate of 5 Mt/y in February 2016.
17.3 RiotintoPhase2The basic engineering design to increase the plant production rate from 5 Mt/y (phase 1) to 9.5 Mt/y (phase 2) began in March 2015. Similar to phase 1, engineering firms that are specialized in the design of processing plants, were hired for detailed engineering and construction. The phase 2 plant has been undergoing commissioning and ramp‐up since March 2016 and the target processing rate of 9.5 Mt/y is expected to be reached by year end 2016.
The phase 2 design criteria are shown in Table 17.2.

TechnicalReportontheMineralResourcesandReservesoftheRiotintoCopperProject
Page17‐4
OreReservesEngineering September2016
E R
O
Table 17.2 – Expansion Design Criteria
Criteria Unit Value Operating Days per year d 365Plant Utilization % 93Milling and Flotation Processing rate t/y 9,500,000Primary Crusher Transfer Size, 80% mm 160Secondary/Tertiary Crusher Transfer Size, 80% mm 22.5Primary/Secondary Milling Transfer Size, 80% µm 160Regrinding Transfer Size, 80% µm 40Crusher Work Index kWh/t 13Bond Rod Mill Work Index kWh/t 14‐16Bond Ball Mill Work Index kWh/t 14‐16JK Axb 45‐60Specific Energy Consumption in Grinding kWh/t 13.3‐13.5Rougher Flotation Stage residence time min 21‐23First Cleaner + Cleaner Scavenger residence time min 37Second Cleaner residence time min 38third Cleaner residence time min 32Concentrate Thickener Feed Rate t/h/m2 0.25Concentrate Plate Filters Area m2 60Final Tailings Density % 35‐38
17.4 ProcessDescriptionThe existing crushing plant equipment has been refurbished and some new equipment has been added in order to achieve the expansion production rate of 9.5 Mt/y.
The process features three crushing stages, two grinding stages, a rougher flotation circuit, one rougher concentrate re‐grinding stage, and a three stage cleaner circuit. The process ends with a thickening and filtering stage to obtain a final copper concentrate product. Figure 17.1 shows a simplified flow diagram.
17.5 CrushingThree stage crushing is used to produce a nominal minus 22 mm size feed to the grinding circuit. Run of mine ore, at a size of approximately 480 mm, is fed to a 60” x 89” gyratory crusher with a maximum capacity of 3,200 t/h, which reduces the ore to a minus 165 mm product and is stockpiled. This primary crushed ore is then fed to a secondary and tertiary crushing and screening circuit. New reclaim feeders and a new double deck primary screen have been added to increase the capacity of the primary crushing circuit.
TechnicalReportontheMineralResourcesandReservesoftheRiotintoCopperProject
Page17‐5
OreReservesEngineering September2016
E R
O
The crushed ore stockpile is reclaimed by four variable speed apron feeders, four fixed speed vibrating feeders and two conveyors. Each conveyor is fed by two variable speed apron feeders and two fixed speed vibrating feeders. The reclaimed crushed ore is screened using two double deck vibrating screens. The screen top deck oversize is fed to a 7‐ft standard secondary cone crusher while the screen bottom deck oversize is fed to three tertiary short head cone crushers to produce a nominal minus 22 mm ore that is conveyed to a fine ore stockpile.
The discharge from both secondary and tertiary cone crushers is fed to three single deck screens. The screen oversize is recycled to the tertiary cone crushers and the screen undersize is combined with the undersize from the double deck vibrating screens and conveyed to the fine ore stockpile.
The fine ore stockpile is reclaimed using eight belt feeders and two reclaim conveyors. Each reclaim conveyor is fed by two variable speed belt feeders and two fixed speed belt feeders. The reclaim conveyors discharge onto a mill feed conveyor that in turn feeds a primary ball mill operating in open circuit.
17.6 GrindingThe phase 1 grinding circuit operated one rod mill and two ball mills to process 5 Mt/y. The phase 2 expansion added a new 24’ x 24’ primary ball mill with a 7,600 kW motor in open circuit and a new 20’ x 30’ secondary ball mill, also equipped with a 7,600kW motor that is in closed circuit with new hydrocyclones. The phase 1 14’ x 20’ rod mill, equipped with an 1,840 kW motor, has been reconfigured to a ball mill, and is now operating in open circuit. Two existing 15.5’ x 21’ ball mills, equipped with 2,473 kW motors each, operate in a closed circuit with their respective hydrocyclones. The grinding circuit is expected to produce ground mineral slurry with a P80 of 210 µm when processing ore from Cerro Colorado West (CCW) and ground mineral slurry with a P80 of 160 µm when ore is fed from Cerro Colorado East (CCE). The cyclone overflow from the phase 1 grinding circuit and the expansion circuit are combined into a common conditioning distributor and fed into the rougher flotation circuits. Primary flotation reagents, consisting of a ditiophosphate and thionocarbamate based chemistry collector, frother and lime, are fed into the conditioning distributor. A secondary collector and zinc depressant can be added as needed. The cyclone overflow is sampled by an automatic sampler and is the mill head sample.
17.7 FlotationSimilar to the grinding and crushing circuits, all of the flotation equipment from phase 1 is being used in phase 2. This circuit has been expanded with new equipment to achieve the designed residence times and processing capacity. The flotation circuit receives the ground slurry, containing between 38‐40% solids by weight, from a conditioning tank, where it is then sent to a primary roughing circuit consisting of three new cylindrical cells measuring 100 m3 each (300 m3 total) operating in series. The tailings produced at the primary rougher circuit feed a distributor where the pulp is divided into four flows to feed the
TechnicalReportontheMineralResourcesandReservesoftheRiotintoCopperProject
Page17‐6
OreReservesEngineering September2016
E R
O
rougher scavenger circuit. This scavenger circuit consists of four flotation lines with 500 cubic feet (14 m3) flotation cells. The four lines of flotation cells are arranged in three parallel flotation lines, each one with 11 flotation cells, to reach a volume of 5,500 cubic feet (154 m3) per line, and a fourth 13‐cell flotation line that has a volume of 6,500 cubic feet (182 m3). These four flotation lines have a total useful volume of 22,700 cubic feet (644 m3). The tailings flowing out from this rougher scavenger stage is the final plant tailings and is sent to the tailings management system (TMS). The primary rougher concentrate and the rougher scavenger concentrate is sent to a collection box to feed the re‐grinding stage, which has two re‐grinding circuits. The first re‐grind mill is an existing 15.5' x 21' (4.75 m x 6.4 m) ball mill with a 2,473 kW motor that operates in a closed circuit with dedicated hydrocyclones. A second 12.5´ x 15´ (3.8 m x 4.6 m) regrind ball mill with an installed power of 920 kW, has been refurbished and operates in a closed circuit with separate dedicated hydrocyclones. The overflow from the two re‐grinding circuits is sent to the first cleaner circuit which consists of two new cylindrical cells with a capacity of 100 m3 each. Tailings from this stage feed the first cleaner scavenger circuit that consists of four flotation lines with eight flotation cells per line with a capacity of 300 cubic feet (8.5 m3) per line. The total first cleaner scavenger flotation circuit has a volume of 9,600 cubic feet (272 m3). The first cleaner scavenger tails are either fed back into the rougher scavenger circuit or re‐floated in a final scavenger flotation stage that consists of 10 existing cells measuring 500 cubic feet (14 m3) each, for a total volume of 5,000 cubic feet (140 m3). The concentrate from this final scavenger stage is pumped to the re‐grinding circuit where it is combined with first cleaner concentrate, rougher concentrate, and rougher scavenger concentrate. Tailings from this stage are sent to the TMS. The cleaner circuit consists of a second and a third cleaner flotation stage. The second cleaner stage consists of two existing flotation lines with 8 flotation cells each for a volume of 2400 cubic feet (68 m3) per line (total available volume of 4,800 cubic feet (136 m3)). The concentrate from the second cleaner flows to the third cleaner stage and tailings from this stage are re‐circulated back to the first cleaner stage. The third cleaner stage consists of two existing flotation lines with 7 flotation cells each, to make up a volume of 2,100 cubic feet (60 m3) per line (total available volume of 4,200 cubic feet (120 m3)). The concentrate from the third cleaner is the final plant concentrate. Tailings from this stage are re‐circulated back to the second cleaner stage.
17.8 ConcentrateThickeningandFiltrationThe final cleaner concentrate, at approximately 15% solids by weight, is pumped to two, 10 m diameter concentrate thickeners working in parallel, where the slurry is thickened to 55% solids by weight. Each thickener has underflow pumps to send the thickened concentrate to a filtering system that has two press filters with 52 plates each. The final copper concentrate product contains approximately 6%‐10% moisture. The filtered concentrate is transported to the
TechnicalReportontheMineralResourcesandReservesoftheRiotintoCopperProject
Page17‐7
OreReservesEngineering September2016
E R
O
concentrate storage building at site and will later be loaded onto trucks, weighed, and transported to the Port of Huelva.
17.9 ProductionDataThe Riotinto mine has been in continuous ramp up since August 2015 with the goal of achieving 5.0 Mt/y. Ramp up of phase 1 and construction activities for phase 2 started to overlap in September 2015 when the phase 2 engineering and construction started.
At the end of December 2015, the processing plant achieved an annualized throughput rate of 4.9Mt/y. In this same period the expansion Project reached 92% completion with final construction activities and tie‐ins to existing operations pending.
Riotinto declared commercial production in February 2016. Overall copper recoveries during Q1 2016 were consistently above 82% and concentrate specifications were within commercial terms. The Expansion Project, with an increase in production from 5 Mt/y to 9.5 Mt/y, was declared as “mechanically complete” the first week of May 2016, ahead of schedule and under budget. Copper production increased by 10% in Q2 2016 to 4,442 tonnes, compared with 4,048 tonnes in Q1 2016. During Q2 2016 1.3 million tonnes of ore were processed compared with 1.1 million tonnes during Q1 2016, representing a 15% increase. During Q2, the copper grade in final concentrate remained consistent, within design, achieving 21.54% Cu, while recoveries decreased to 79.80% due to the commissioning of the new flotation circuit. Recoveries are as per expectations and averaged over 84% in July 2016. The Riotinto concentrator has a world class equipment utilization time in the range of 95%. This is achieved because it has developed a proactive maintenance management system in this short period of time.
The project has a high lime consumption of 2.5 k/t which is due to the fact that the ore and natural water acidify the process water. Flocculant is used in the concentrate thickener only and its consumption is around 50 g/t. The overall plant specific energy consumption is in the range of 22 kWh/t of ore. About 78% of this energy is consumed in comminution (crushing and grinding) with grinding having an overall specific energy consumption of 15 kwh/t, which is very close to the design parameter. It is expected that nameplate capacity of 9.5Mt/y will be reached by year end. A summary of year‐to‐date production data is shown in Table 17.3
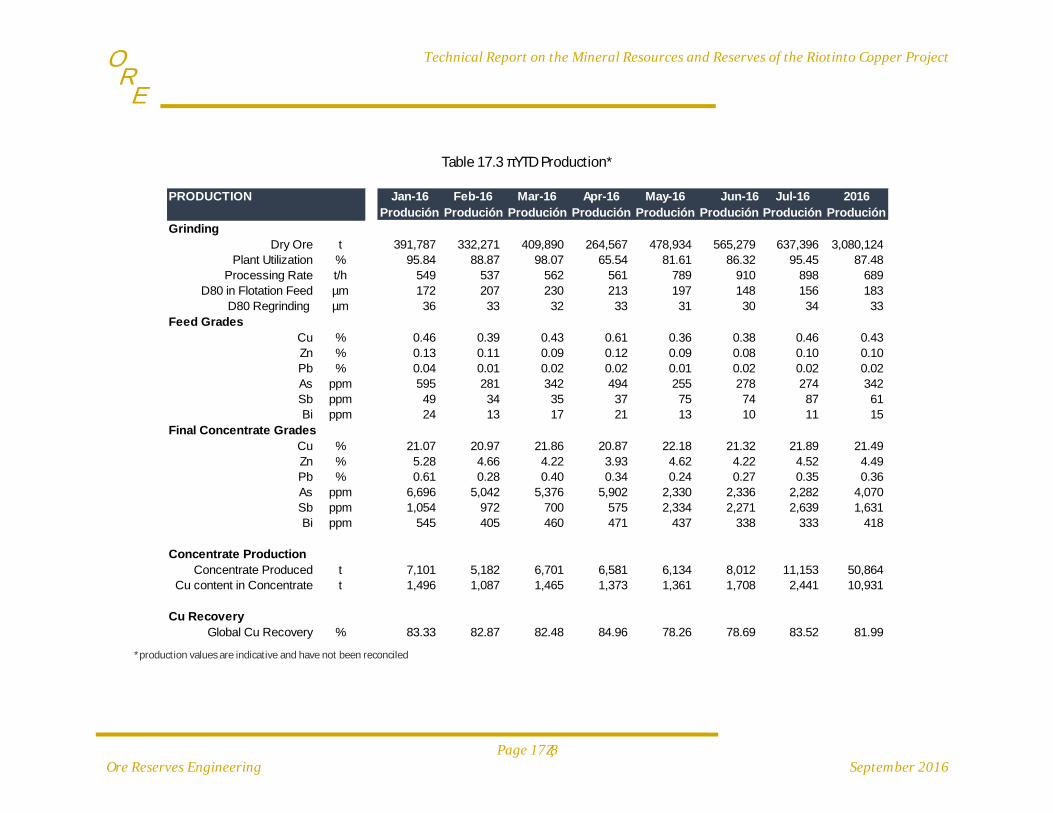
TechnicalReportontheMineralResourcesandReservesoftheRiotintoCopperProject
Page17‐8
OreReservesEngineering September2016
E R
O
Table 17.3 ‐ YTD Production*
*production values are indicative and have not been reconciled
PRODUCTION Jan-16 Feb-16 Mar-16 Apr-16 May-16 Jun-16 Jul-16 2016Produción Produción Produción Produción Produción Produción Produción Produción
GrindingDry Ore t 391,787 332,271 409,890 264,567 478,934 565,279 637,396 3,080,124
Plant Utilization % 95.84 88.87 98.07 65.54 81.61 86.32 95.45 87.48 Processing Rate t/h 549 537 562 561 789 910 898 689
D80 in Flotation Feed µm 172 207 230 213 197 148 156 183 D80 Regrinding µm 36 33 32 33 31 30 34 33
Feed GradesCu % 0.46 0.39 0.43 0.61 0.36 0.38 0.46 0.43 Zn % 0.13 0.11 0.09 0.12 0.09 0.08 0.10 0.10 Pb % 0.04 0.01 0.02 0.02 0.01 0.02 0.02 0.02 As ppm 595 281 342 494 255 278 274 342 Sb ppm 49 34 35 37 75 74 87 61 Bi ppm 24 13 17 21 13 10 11 15
Final Concentrate GradesCu % 21.07 20.97 21.86 20.87 22.18 21.32 21.89 21.49 Zn % 5.28 4.66 4.22 3.93 4.62 4.22 4.52 4.49 Pb % 0.61 0.28 0.40 0.34 0.24 0.27 0.35 0.36 As ppm 6,696 5,042 5,376 5,902 2,330 2,336 2,282 4,070 Sb ppm 1,054 972 700 575 2,334 2,271 2,639 1,631 Bi ppm 545 405 460 471 437 338 333 418
Concentrate ProductionConcentrate Produced t 7,101 5,182 6,701 6,581 6,134 8,012 11,153 50,864
Cu content in Concentrate t 1,496 1,087 1,465 1,373 1,361 1,708 2,441 10,931
Cu RecoveryGlobal Cu Recovery % 83.33 82.87 82.48 84.96 78.26 78.69 83.52 81.99
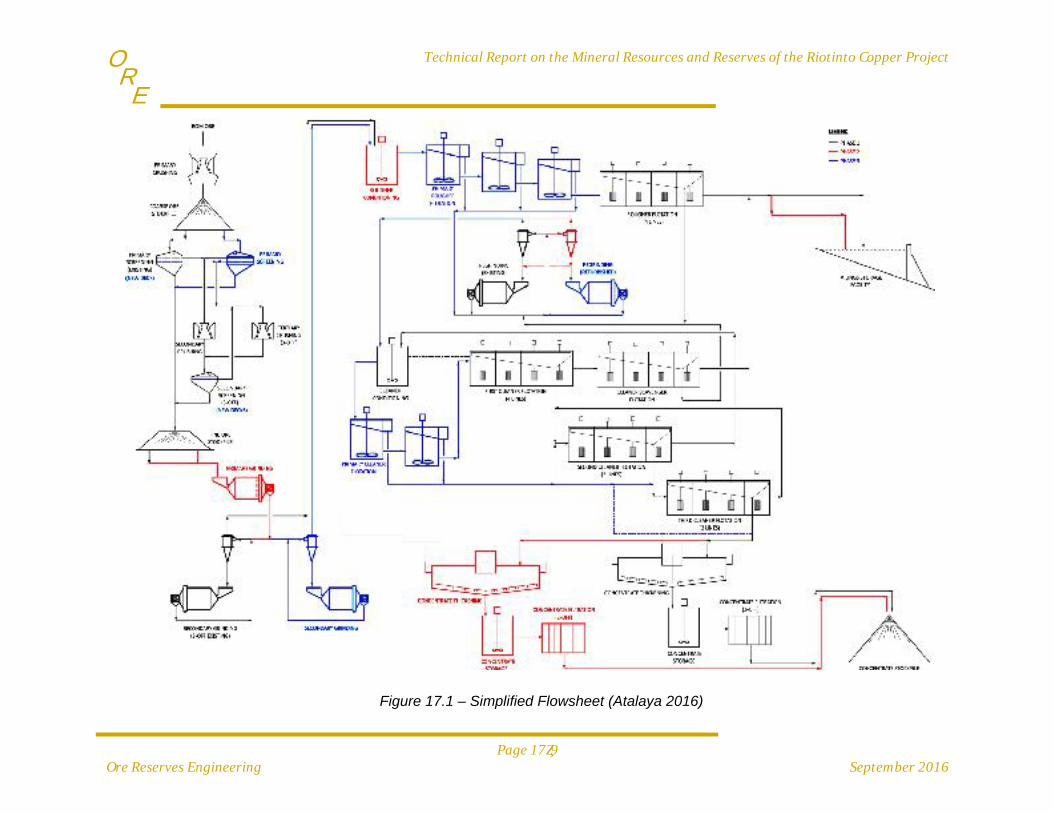
TechnicalReportontheMineralResourcesandReservesoftheRiotintoCopperProject
Page17‐9
OreReservesEngineering September2016
E R
O
Figure 17.1 – Simplified Flowsheet (Atalaya 2016)
TechnicalReportontheMineralResourcesandReservesoftheRiotintoCopperProject
Page17‐10
OreReservesEngineering September2016
E R
O
17.10 ControlPhilosophyA Process Control System (PCS) utilizing a Distributed Control System (DCS) was implemented to monitor and control the process at the Riotinto plant. This system is also used to ensure the safe operation of the plant as well as the protection of personnel, equipment and the environment. The system architecture contains 3 main PLCs; the first one controls the dry area (primary, secondary and tertiary crushing), another controls the phase 1 equipment and the third PLC controls the phase 2 equipment. These PLCs are receiving information from equipment in the field via profibus and optical link modules (OLMs). All this information is routed to the server room where 2 plant servers, a web server, and a historian server are located. The system is protected with firewalls. The information from the server room is routed via Ethernet to the control room where there are 2 WinCC Clients, the supervisory room engineering system and the video wall client computer. The engineering firm in charge of the detailed engineering of this project created a comprehensive Process Control Strategy in agreement with what is needed for a 26 kt/d plant. This philosophy was the base for installing equipment and for programing the process control computers. Proper training was provided to the personnel in charge of these activities. The crushing plant is monitored and controlled from a dedicated control room in close proximity to the primary crusher while the rest of the plant is monitored and controlled from a central control room or from dedicated equipment local control stations as per operator needs. All conveyor belts are fitted with emergency trip switches and low speed detection sensors. Belt drift switches and belt rip detectors are installed on long conveyors. Belt drift switches will alarm for a predetermined period and, if the alarm condition persists, will then trip the affected conveyor. Blocked chute detectors are installed on conveyor transfer chutes. Critical bins, ore stock piles and tanks are fitted with level indication and control. Where necessary, valves and variable speed drives are used to control levels in critical bins and tanks. The two thickener rake mechanisms are fitted with no‐motion and high torque detection devices. A HIGH torque switch activates an audible siren and flashing light. The rake mechanism will be tripped on activation of the associated HIGH‐HIGH torque alarm. Pressure gauges are installed on critical centrifugal pump discharge lines. Most slurry centrifugal pumps employ gland water seals. The gland water pressure is measured by gauges and controlled by valves on individual gland water lines to each pump. Centrifugal pumps with gland water seals are tripped on low grand water flow or/and pressure. Each spillage collection pump is fitted with a low level switch that will stop the respective pump on low sump level. Positive displacement pumps are equipped with pressure relief valves installed on the discharge lines. Pumps and feeders will generally be tripped on activation of a LOW‐LOW level alarm in the vessel they are withdrawing material from. Pumps and feeders are tripped on activation of a HIGH‐HIGH level alarm in the vessel they are transferring material to.

TechnicalReportontheMineralResourcesandReservesoftheRiotintoCopperProject
Page17‐11
OreReservesEngineering September2016
E R
O
Mill and conveyor motors have time delayed starts of approximately 10 seconds as well as audible warning sirens that are activated on start‐up. Electrically powered cranes and hoists are equipped with hand control keypads. A dedicated audible siren sounds when the respective crane or hoist is travelling. A level transmitter together with one or two level control valve(s) is installed at the end of each step along each flotation bank and on each flotation tank cell. The level transmitter and level control valve(s) are used to control the flotation cells pulp levels (froth depths). Each safety shower is fitted with a flow alarm that will activate an audible siren when flow to the shower is detected. This is done for safety reasons. Instrumentation and the control philosophy for the new phase 2 primary ball mill and the secondary ball mill together with the associated lubrication and grease systems was provided by the equipment supplier as part of the vendor package. Diverse control loops exist in crushing, grinding, flotation, thickening and filtration to protect equipment and to control the process A last generation on‐line analyzer system was installed to sample and determine on‐line metals concentrations to control the flotation circuit. This information is used to create dynamic copper recovery equations and concentrate mass pull equations for the operators to make decisions about process control. There is a plant sampling system that generates samples to measure and control shift performance. These samples are sent to the analytical lab on site from where shift data are sent to key personnel to have the shift by shift and daily metallurgical balance generated. Closed circuit television cameras were installed to monitor various critical locations throughout the plant, including several cameras in primary, secondary and tertiary crushing. Cameras are also located at several conveyor belts and transfer chutes in the grinding area.
17.11 ProductionSupportRiotinto has well‐equipped analytical and metallurgical laboratories on site. These laboratories are delivering daily results to the metallurgical and to the process team. State of the art equipment and well trained personnel deliver excellent results that go through routine quality controls to ensure accuracy and that all processes are performing with design specifications. Riotinto has a water supply system consisting of a fresh water make up system and a process water system, where water recovered from the tailings area is recirculated back to the concentrator. The technical services area operates the water system and the tailings management system. This group makes sure that the system is operated with higher than 99% availability and that, at the same time, operational information is gathered to comply with operation and legal standards as indicated in all the permits Atalaya Mining has been granted to operate the mine.

TechnicalReportontheMineralResourcesandReservesoftheRiotintoCopperProject
Page17‐12
OreReservesEngineering September2016
E R
O
Process water is a product of the thickened concentrate and of the tailings settling system. Water coming from the concentrate thickeners is returned to the flotation area, which is a short distance away. The process water ponds in the tailings management system have areas where pumps are located to pump process water back to the process water tank in the plant, prior to adjusting pH using lime milk. The plant has two air supply systems; one is a high pressure compressed air system located throughout the plant. The other system is a low pressure air system that mainly feeds the air needs of the rougher and cleaner flotation cells.
17.11.1 ManpowerThe plant team is headed by a Plant Superintendent and has 5 crews of operators and supervisors which work in 8 hours shifts. There are 2 operating crews off site every day taking their breaks or vacations. The analytical laboratory crew reports directly to the site General Manager. The concentrators also have a Metallurgy team with its own Superintendent. The maintenance team has millwrights and electricians working on all shifts, but most of the maintenance team work on day shift. The unitary operating costs have evolved downwards since the start of Phase 1 as the rate of treatment increases. The Process Plant Manpower is shown in Table 17.4.
Table 17.4 – Process Plant Manpower Description ManpowerPlant Manager 1Process Engineer 1Metallurgy Team 6Plant Operations Superintendent/Supervisor 2Concentrate shipment 5Operations Crew 79 Maintenance Manager 1Maintenance staff (Supervisors and millwrights)
57
Electrical and Instrumentation Staff 19
TechnicalReportontheMineralResourcesandReservesoftheRiotintoCopperProject
Page18‐1
OreReservesEngineering September2016
E R
O
18 INFRASTRUCTURE
18.1 AccessbyRoadThe property is well‐connected for road transportation via a high quality national road system that was recently renovated. The site is located 75 km from the port and the industrial city of Huelva, and 88 km from the regional capital, Seville. Copper concentrate is transported by road to the Huelva port where it is stored for ocean transport to various commercial destinations. A fleet of 10, 25‐tonne capacity trucks transport the concentrate three times per day. This fleet can be expanded to a maximum of 30 trucks to accommodate variability in production rates. A local company that specializes in this type of service has been contracted to transport the concentrate to the port. The project also uses other nearby ports such as Algeciras and Cadiz, and international airports in Seville, Madrid, and Faro.
18.2 ElectricalSupply The incoming main substation of 132/6.3 kV has been fully reconditioned and updated. The main substation consists of one 132 kV, 1.3 km line that has been repaired and is currently operating from La Dehesa (ENDESA independent power supplier) using 3 outgoing lines on 3 main transformers:
Transformer 1 with 26.7 MVA Transformer 2 with 20 MVA Transformer 3 with 20 MVA
These transformers have been completely repaired and checked with the corresponding electrical tests including a dielectric oil analysis as per the regulations. There is a condenser battery system to correct the power factor which has been repaired and updated with a capacity of 7.8 MVAr currently working at 0.99 cos φ in Phase 1. The goal is to work at 0.96 cos φ for the Expansion Phase (9.5 Mt/y). The 132 kV protective frames have been changed and designed for the current facility as well as all outlet protection cabins and apparatuses for distribution in 6.3 kV from Transformer 1 and 2. Several 6,300/400 V transformation centers hang from the main substation serving the different operating areas. Due to current PCB regulations, all transformers in the different mine operation areas and the motor control centers have been changed with latest generation protection and communication systems. Phase 1 production (5.0 Mt/y) utilizes Transformer 1 and requires 15 MW of power while an additional 24 MW (from both Transformer 1 and 2) is available for testing new equipment for the Expansion Phase. The expansion phase production (9.5 Mt/y) requires 31 MW of power. Transformers 1 and 2 at the main mine substation are in service and Transformer 3 has been repaired with all tests satisfactorily completed.
18.3 WaterSystemsProcess water is supplied from the Gossan Dam where it is pumped, at a rate of approximately 1,200 m3/h, into two steel tanks with capacities of 4,000 and 3,675 m3.

TechnicalReportontheMineralResourcesandReservesoftheRiotintoCopperProject
Page18‐2
OreReservesEngineering September2016
E R
O
The 9.5 Mt/y expansion project includes the installation of a new DN‐800 process water pipe and a new pumping system located at the Gossan Dam. Two new pumps, with a flow rate of 1,500m3/h each, will pump water to an intermediate storage tank that has a capacity of approximately 3,100 m3, and booster pumping system that pumps water to the process water tans at a flow rate of 3,000 m3/h. Fresh water, is supplied from the Campofrio Dam by three pumps with a flow rate of 250 m3/h each, two operating and one standby. Water is delivered through a HDPE DN‐355 PN‐16 pipe to the fresh water tank, ensuring supply at any stage in production. The fresh water storage tank has a capacity of 1,900 m3 and has been repaired along with all the valves and distribution systems to the plant. The distribution tanks are situated between the road and the current office block. Water is distributed to the entire operation via a pipeline system made of high density polyethylene as well as carbon steel. Before commissioning, the existing tanks were re‐conditioned with proper surface treatment, thicknesses were checked, and worn piping and valves replaced or repaired. Potable water is supplied by the utility company (GIASA) that manages the water system for the municipality of the Riotinto Mines. It is stored in a new 50 m3 poly tank located next to the fresh water and process water tanks, where it is distributed to the dining hall, changing rooms, contractor huts, and mine shops via polyethylene pipes. Acidic water, coming in from the Cerro Colorado pit drainage and waste heap leachates, is pumped through new piping and pumping systems to the new water treatment plant and onto the storage tank. Five Pachuca tanks from the old gold processing plant were rehabilitated for the new water treatment plant. In addition, one of the existing thickeners was rehabilitated, and new pumping equipment, pipelines, electrical wiring, and instrumentation were installed. All of the old non‐usable equipment were dismantled and removed. The water treatment plant has a capacity of 200 m3/h and the treated water is reused as process water.
18.4 TailingsManagementFacilityThe Tailings Management Facility (TMF) consists of three adjacent impoundments referred to as Cobre, Aguzadera and the Gossan facilities. The Cobre and Gossan facilities were first constructed in the early 1970’s to contain 70 Mt of tailings and later, the Aguzadera facility, was constructed in the late 1980’s, to provide a total of 86 Mt of tailings storage. Currently there are two tailings facilities in operation, the Cobre and the Aguzadera and both facilities have available storage capacity below the original design elevation of 381.8 m asl and 374.8 m asl respectively. The Gossan facility has been partly rehabilitated and acts as a contact water reservoir where the tailings water from the Cobre and Aguzadera is treated and pumped back to the plant site. The tailings facilities have been constructed from a starter dam comprising of a core of gossan. Gossan is mine waste material consisting of a variety of particle sizes ranging from boulders and gravels to sands and clayey silts, with an average maximum size of 200 mm to 400 mm. The facility has been
TechnicalReportontheMineralResourcesandReservesoftheRiotintoCopperProject
Page18‐3
OreReservesEngineering September2016
E R
O
raised by cyclone tailings using the upstream method. The coarse tailings (sands) are separated by cycloning and deposited as underflow to form the dam walls, while the overflow consisting of the fine tailings fraction (slimes) is deposited within the basin area. The ponded water is also located away from the dam walls. The dam walls are currently supported by a substantial downstream buttress consisting of rock fill/mine waste which has resulted in a substantial width of berm that is in some places in excess of 50m wide on the external walls. Stability assessments based on extensive geotechnical characterization and monitoring carried out by Eptisa shows a current safe and stable condition for the Cobre and Aguzadera dams. Typical factors of safety are between 1.5 and 1.7 for static and pseudo static stability analysis. Seismicity in the area is relatively low with a design base earthquake characterized by a peak ground acceleration of 0.07 g and a maximum credible earthquake characterized by a peak ground acceleration of 0.14 g. This follows the Spanish code NCSE‐02 for seismic design of structures. Dam instrumentation installed in the Cobre and Aguzadera includes survey monuments (34), inclinometers (6) and piezometers (35). Monitoring of the instrumentation is carried out by Atalaya Mining on a regular basis and the results indicate some vertical and lateral movements within the accuracy of the measurements. Four sections of the dams were observed with elevated phreatic levels (3.4 m bgs). A rock fill buttress with drainage has subsequently been constructed as discussed previously. The tailings management facility is shown in Figure 18.1.
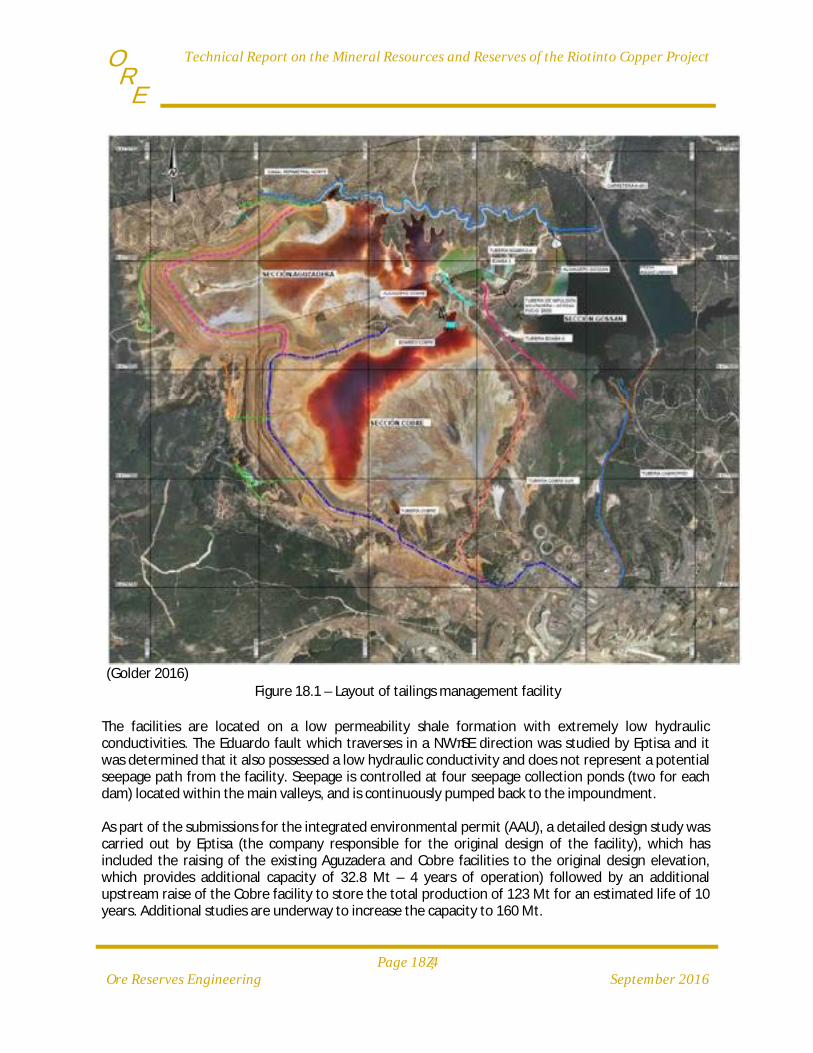
TechnicalReportontheMineralResourcesandReservesoftheRiotintoCopperProject
Page18‐4
OreReservesEngineering September2016
E R
O
(Golder 2016)
Figure 18.1 – Layout of tailings management facility
The facilities are located on a low permeability shale formation with extremely low hydraulic conductivities. The Eduardo fault which traverses in a NW‐SE direction was studied by Eptisa and it was determined that it also possessed a low hydraulic conductivity and does not represent a potential seepage path from the facility. Seepage is controlled at four seepage collection ponds (two for each dam) located within the main valleys, and is continuously pumped back to the impoundment. As part of the submissions for the integrated environmental permit (AAU), a detailed design study was carried out by Eptisa (the company responsible for the original design of the facility), which has included the raising of the existing Aguzadera and Cobre facilities to the original design elevation, which provides additional capacity of 32.8 Mt – 4 years of operation) followed by an additional upstream raise of the Cobre facility to store the total production of 123 Mt for an estimated life of 10 years. Additional studies are underway to increase the capacity to 160 Mt.
TechnicalReportontheMineralResourcesandReservesoftheRiotintoCopperProject
Page18‐5
OreReservesEngineering September2016
E R
O
18.5 FireProtectionThe fire protection system was completely renovated as required by the Spanish Royal Decree 1389/1997, of 5 September 1997, which approves the minimum provisions for protecting workers' health and safety at mines. A new detection, signage and alarm system, with direct communication to the control room, was installed for all electrical rooms, conveyor belts, and buildings. The system was equipped with automatic detectors, alarm push buttons, and optical and acoustic alarms. The new extinguishing systems include:
A complete pumping station dedicated to fire extinguishing including an electric pump, diesel and jockey pump to guarantee sufficient water flow. There is 350 m3 of reserve water in the system storage tank.
Automatic sprinklers for all systems in underground tunnels. Fire hydrants equipped with hoses for all conveyor belts in outdoor areas including optical
signage. HFC‐227ea gas extinguishing systems for all electrical rooms and the main substation,
including optical on/off signage. ABC and CO2 powder extinguishers located in all areas and plant buildings with the
corresponding optical signage to protect equipment, systems, and electric motors. An extinguishing hydrant system connected by buried HDPE lines, including connections,
cabinets and the necessary hoses.
18.6 OtherEnvironmentalAspectsRoofs and walls containing asbestos on industrial buildings and office buildings that were in poor condition were repaired or replaced with new corrosion‐resistant aluminum plates.
18.7 WarehousesThere are two large warehouses on the mine property along with an outdoor storage area. The locations for replacement parts and material deliveries have been separated and clearly defined. The warehouses feature sufficient shelving units to organize large‐size replacement parts and cabinets for small items. All warehouse shelving units are officially approved and newly‐installed. Two secure areas were prepared within the warehouses to store inflammable products to comply with APQ laws (chemical storage). The low voltage power and lighting system was replaced to comply with current laws on low voltage electrical systems. A computer control system was also installed for incoming and outgoing materials with 3 computer connections to the general administration system.
18.8 MaintenanceFacilitiesThe maintenance warehouse was re‐conditioned and rehabilitated. All of the necessary equipment, such as bridge cranes (20 t and 5 t), vertical drills, etc. was re‐certified as required by the Spanish Royal Decree 1215/1997, of 18 July establishing the minimum health and safety provisions for use by workers. All changing room, toilet and office facilities next to the mechanical / electrical repair shop as well as the main offices and facility access control were restored and modernized.
TechnicalReportontheMineralResourcesandReservesoftheRiotintoCopperProject
Page18‐6
OreReservesEngineering September2016
E R
O
18.9 RehabilitationProgramThe following rehabilitation activities were performed for commissioning of the processing plant: Equipment rehabilitation, including restoration, repair and certification as required by current laws for commissioning of the primary crusher, conveyor belts, secondary screens, tertiary screens, feeders, secondary crushers, tertiary crushers, mills, and flotation cells. Rehabilitation of buildings and facilities, including roofs and walls, reinforcement and consolidation of building structures such as fine ore storage, concentrate storage, filter house, water treatment plant, distribution pumps and water storage tanks, piping distribution systems, and lime preparation and storage plant. New equipment, including a primary screen, reagents warehouse and make‐up, lime preparation and storage plant, compressed air, concentrate thickeners, and filter presses. New systems, including: power distribution and supply systems, instrumentation and control systems, fire protection system, compressed air system, water pumping stations, distribution pipes, and dust collection system.
18.10 ExpansionProgramThis program includes the acquisition of new equipment and the expansion of facilities to increase processing capacity to 9.5 Mt/y. The newly installed equipment is discussed in Chapter 17, Recovery Methods.

TechnicalReportontheMineralResourcesandReservesoftheRiotintoCopperProject
Page19‐1
OreReservesEngineering September2016
E R
O
19 MARKETSTUDIESANDCONTRACTS
19.1 IntroductionAtalaya has been actively marketing the copper concentrate product to global consumers. Currently, 100% of the concentrate production is committed to three companies through offtake agreements for life of mine reserves that average: Yanggu Xiangguang Copper Co. Ltd (XGC) – 49.12%
Urion Mining International (Trafigura) – 19.34%
Orion Mine Finance (Orion) – 31.54%
Copper is an internationally traded commodity and prices are set through trading on the major metals exchanges: the London Metal Exchange (LME), the New York Commodity Exchange (COMEX) and the Shanghai Futures Exchange (SHFE). Copper prices on these exchanges generally reflect the worldwide balance of copper supply and demand, but are also influenced significantly by investment flows and currency exchange rates.
19.2 SupplyandDemandIt is expected that short term global supplies of Cu continue to be in a surplus in 2016 and that oversupply will continue to impact pricing for the remainder of the year. Estimates indicate that the growth in Cu demand projections should remain at 2.3% to 2.4% for the remainder of 2016 and into 2017. Copper prices are pressured by many years of surpluses and should trigger more short term cuts in production. These lower prices will also slow the growth of new projects and the re‐start of projects with lower copper grades. A deficit in copper supplies is likely to occur toward the end of the decade and will likely push copper pricing to peak levels early in the 2020’s. Estimates suggest that pricing forecasts for the next six years and long term are consistent with this this supply/demand projection. Prices should rise by an average of 2.9% through 2018 increasing 18% by the mid 2020’s. (World Bank 2016) Cu demand in the short term is forecast to remain soft due in part to the struggling economies in Brazil, Japan and Russia. Regional consumption ex‐China, however, will likely see some growth and is expected to exceed any increases in Chinese consumption by the end of the decade.
19.3 SalesofConcentratesThe typical copper concentrate specification is shown below in Table 19.1. This specification is based on the actual production by MRT SAL during the years 1996 to 2001. It is based on processing of both Cerro Colorado West (CCW) and Cerro Colorado East (CCE) ores.

TechnicalReportontheMineralResourcesandReservesoftheRiotintoCopperProject
Page19‐2
OreReservesEngineering September2016
E R
O
Table 19.1 – Copper concentrate typical assay
Element Unit Value
Cu % 20 ‐ 23
Pb % 0.5 ‐ 0.7
Zn % 4.6 ‐ 4.8
S % 36 ‐ 38
Fe % 30 ‐ 33
As ppm 1500 ‐ 4500
Sb ppm 1000 ‐ 2500
Bi ppm 200 ‐ 400
Se ppm 150 ‐ 300
Hg ppm 30 ‐ 60
SiO2 % 1.5 ‐ 5
Al203 % 0.6 ‐ 1
Co ppm 300 ‐ 500
Au ppm 0.7 ‐ 1.5
Ag ppm 100 ‐ 130
The mine plan contemplates mining both CCW and CCE ore concurrently, effectively creating a blend of the two in the produced concentrate. The Life‐of‐Mine (LOM) predicted grades of the concentrate for the initial two years and remaining LOM thereafter reflect a weighted average according to the ore contributions. The copper concentrate is a complex material containing elevated levels of some penalty elements including, mercury, antimony, arsenic and bismuth. These elements will limit the quantities of concentrates which can be taken by certain smelters. The concentrates from the mine have traditionally been delivered to the Atlantic Copper smelter in Huelva and other smelters within Europe.
TechnicalReportontheMineralResourcesandReservesoftheRiotintoCopperProject
Page20‐1
OreReservesEngineering September2016
E R
O
20 ENVIRONMENTALSTUDIES,PERMITTING,SOCIALANDCOMMUNITYIMPACTS
20.1 EnvironmentalStatus&LegacyMining and mineral processing activities have been taking place at Riotinto for many years. With the exception of some parts of the Corta Atalaya Waste Dumps, no reclamation work has been conducted. As a result of this and the fact that much of the waste material has a high acid generating potential, the Riotinto project area is an environmentally degraded site with significant environmental legacy issues. One of the main issues, as is the case in many mine sites that host potentially high acid generating materials, is related to Acid Mine Drainage (AMD) and the mitigation and control in an environmentally, technically, and financially sustainable manner. Atalaya Mining’s environmental policy, environmental management system, and operating and final closure plans have been developed in order to address this, other legacy, and future issues in a sustainable manner.
20.2 EnvironmentalManagementSystemIn June 2008, an international mining environmental consultant conducted an ISO 14001 environmental audit of the site and the planned operational areas (Thirtle, 2008a). This report produced recommendations for the implementation and improvements to infrastructure, and procedures and practices to reflect European and World Bank best available practices. Atalaya has been implementing some of the recommendations included in this audit and it is envisaged that all recommendations will be completed. As a result of the audit and to commence the implementation of the Atalaya environmental policy, a set of 17 Environmental Management Plans (EMP’s) (Thirtle, EMED Tartessus S.L.U. PRT Feasibility Study Report 2008b) have been developed to address known and potential environmental and community issues arising from operating a large mine in the proximity to urban areas. These plans, when fully implemented, will reflect global best industry practice and are based on the ISO 14001 system. As part of the Environmental Management System (EMS), these plans will be regularly checked in order to monitor performance and to ensure that Atalaya’s environmental targets and objectives are being met with regular compliance reviews by management. These reviews will also make recommendations for continual improvement of the EMS. Continual improvement of the EMS will address three core issues related to the expansion, enrichment, and upgrading of the EMS within Atalaya.
20.3 ApplicableLegislationAt the national level, the environment is administered by the Ministerio de Agricultura, Alimentación y Medio Ambiente. The Ministerio de Agricultura, Alimentación y Medio Ambiente is responsible for setting policy and enacting into legislation EU policy. At the regional level, the environment is administered by the Consejería de Medio Ambiente y Ordenación del Territorio. The Consejería de Medio Ambiente y Ordenación del Territorio is responsible for ensuring that national policy is implemented and also has auditing responsibilities. Additionally, the Consejería de Medio Ambiente y Ordenación del Territorio has authority to issue environmental permits. There are both generic and specific (Water, Air Quality, Biodiversity, Protected Spaces, Forests, Wastes & Dangerous Substances and, Restoration) national and regional environmental legislation applicable

TechnicalReportontheMineralResourcesandReservesoftheRiotintoCopperProject
Page20‐2
OreReservesEngineering September2016
E R
O
at Riotinto during refurbishment, operations, final restoration and post closure including the development of final restoration plans. A list of the general environmental laws is shown below. There are also many federal and regional laws regulating water and air quality, biodiversity, protected lands, forests, wastes and dangerous substances, and restoration. Generic Legislation
Order AAA / 1601 / 2012 26 June, which dictate instructions on the application in the Department of the law 27 / 2006 18 July, which regulate the rights of access to the information, of participation public and access to the justice in matter of environment.
Real Decree‐Law 17 / 2012 4 May, measures the environmental terms. Royal Decree 1494 / 2011 24 October, which regulates the Fund of carbon for a sustainable
economy. Law 6/2010 24 March, modification of the text revised law of evaluation of environmental
impacts of projects, approved by Royal Legislative Decree 1/2008 11 January. Royal Decree 2090 / 2008 22 December, which approves the regulation of partial development
of law 26/2007 October 23, environmental responsibility. Royal Legislative Decree 1/2008 11 January, which approves the revised text of the law on
evaluation of environmental impact of projects. Law 26/2007October 23, environmental responsibility. Royal Decree 509/2007 April 20, which approves the regulation for the development and
execution of law 16/2002 July 1, integrated pollution prevention and control. Royal Decree 508/2007 20 April, which regulates the provision of information on emissions of
the E‐PRTR regulation and the integrated environmental permits. Law 27/2006 18 July, which regulates the rights of access to information, public participation
and access to justice in environmental matters. Law 9/2006 28 April, on assessment of the effects of certain plans and programs on the
environment. Law 16/2002 July 1, integrated pollution prevention and control.
20.4 Environmental&CulturalApprovalsIn order to start the planned refurbishment, mining, processing and waste disposal activities, Atalaya has received the following approvals:
The Autorización Ambiental Unificada (AAU) or Unified Environmental Authorization, The Final Restoration Plan (FRP) and, Cultural approvals.
20.5 AutorizaciónAmbientalUnificada(AAU)The AAU is the main environmental process/approval that was completed prior to the start of the refurbishment, mining, processing and waste deposition activities. The AAU was approved by the Consejería de Medio Ambiente y Ordenación del Territorio of the Junta de Andalucía.
Applicable legislation with regards to the AAU is as follows:
Ley 7/2007, de 9 de julio, de Gestión Integrada de la Calidad Ambiental. Decreto 356/2010, de 3 de agosto, por el que se regula la autorización ambiental unificada.

TechnicalReportontheMineralResourcesandReservesoftheRiotintoCopperProject
Page20‐3
OreReservesEngineering September2016
E R
O
The AAU incorporated all relevant documentation required for a project of this type into a unified document for submission and regulatory approval. In the case of the Riotinto this includes the following:
An Environmental Impact Study. Reports from each of the municipalities affected by Riotinto (in this instance the municipalities
of Minas de Riotinto, Nerva and El Campillo) confirming that the Project is compatible with their respective urban plans.
An application for authorization to produce non‐mining hazardous wastes oil, tires etc. An application for authorization to discharge to the atmosphere including proposed measures
in order to meet discharge standards. A study on the dispersion and prevention of atmospheric contaminants (dust). A light contamination/prevention study. A noise contamination/prevention study. A study of impacts on Natural Spaces and Natura 2000. An application for authorization to discharge water to the public domain including proposed
measures in order to meet discharge standards. A study of the impacts on the protected species Erica and evalensis (a type of heath endemic
to the area) and bats. A final restoration plan. Plans for the management and final closure of waste storage facilities at Riotinto specifically
the waste dumps and the Tailings Storage Facilities (TSF).
Atalaya has submitted the relevant documentation and applications for processing and approval.
20.6 MonitoringAtalaya has developed a comprehensive monitoring program involving a combination of routine visual observations, physical inspections, sampling and analyses of air and water quality, and measurements of noise and vibration. The environmental staff has the responsibility of providing continual observation and compliance of environmental regulations. The entire mine workforce has a shared responsibility for environmental compliance and undergoes environmental training. A regular sampling program has been in place since 2008 to assess baseline conditions and monitor seepage from the tailings dam and existing waste dumps. The monitoring program will continually be updated to comply with any regulatory requirements and address operational changes.
20.7 WasteRockStorageFacilitiesThe waste rock storage facilities (WRSF) are described in detail in Chapter 16. In addition, there is old waste‐rock material deposited in several areas inside and outside the Atalaya lease areas. Some are specifically designated waste dumps, while others have been ‘temporarily’ stockpiled adjacent to t h e excavations.
Although some waste‐rock faces have been listed by Culture and Heritage as protected, they will be covered as part of the final restoration plan in order to meet environmental requirements. Current sampling and analysis show that drainage from these old dumps is potentially acidic and that could pond water seepage discharges during high rainfall to the Rio Tinto River. In a study to investigate the geochemical stability of the waste dumps, waste‐rock grab samples were analyzed to determine which areas of the existing dumps were responsible for acid seepage. Surprisingly, all samples had less than 2%S and some produced neutral paste pH.

TechnicalReportontheMineralResourcesandReservesoftheRiotintoCopperProject
Page20‐4
OreReservesEngineering September2016
E R
O
Prospective ex‐pit waste rock storage facility (WRSF) sites are located to the northeast, east, and southeast of the Cerro Colorado open pit. In‐pit backfills in the eastern portion of the pit will provide supplemental waste storage. Nearly 299 Mt of waste rock, Filon Sur backfill, and low grade material are estimated in the mine production schedule. Waste rock will be placed into three locations: the main external WRSF around the northeast, east, and southeast sides of the Cerro Colorado pit; an in‐pit backfill area that becomes available after completion of mining Phase 4 in the last half of Year 12 (2027); and a backfill area in the eastern extension of the old Atalaya open pit that must be completed before the end of Year 7 (2022) for the relocation of Highway A‐461. The combined capacity of the designed waste dumps provides enough storage space for planned operations. The new dumps are to be constructed using a bottom‐up method. An outer berm will contain the first 20 m lift that will be tipped progressively towards the berm. Subsequent lifts will be stepped back for a maximum overall slope of about 27o (2h:1v) and each lift face will be covered with suitable material after final contouring. In this way, each lift can be progressively rehabilitated. The final landform will have whatever topsoil is available spread to cover the slope to aid revegetation with mixed local species, reduce infiltration and prevent erosion. The original waste dump studies and design proposals required separation of waste materials by sulfur content, higher acid‐generating wastes being encapsulated with lower sulfur material to reduce acid mine drainage (AMD) impacts. The geochemical stability study included sampling the various geological units contributing to waste materials at the Rio Tinto Copper Project. The sulfur content and acid‐base accounting (ABA) analyses were used to identify rock types suitable for encapsulating material to aid mine waste scheduling. Sulfur content was therefore to be part of the pit grade‐control system. The design required a final cover and progressive revegetation. However, some changes have been required by the Spanish regulators, who preferred complete and continuous covering of the waste rock with suitable material rather than separation of waste rock by sulfur content and encapsulation. Subsequently, availability and volumes of suitable material have been identified and the costs factored in, including possible processing requirements for the capping. Some characterization studies and material testing have also been undertaken or are underway. Drainage channels are incorporated into the WRSF designs to reduce the amount of water that can infiltrate the dumps and minimize AMD. The Atalaya operational and end‐of‐mine plan for waste‐ dump drainage and toe seepage is for collection and treatment, and wetland remediation to raise water quality above that of the receiving waters, prior to discharge to the Rio Tinto. However, this is subject to on‐going debate (see below). Studies have looked at the long‐ term stability of the waste dump facilities and the development of suitable emergency management plans. Atalaya is in negotiations for rehabilitation of other old waste‐rock dumps at Riotinto, including those not covered by the mining rights area. This restoration commitment does not include any liabilities. The proposed restoration work will largely be composed of re‐contouring, covering and revegetation, which requires a slight modification to the overall restoration design and increase of the project footprint. However, this approach will result in an improved outcome after final site restoration at closure.
TechnicalReportontheMineralResourcesandReservesoftheRiotintoCopperProject
Page20‐5
OreReservesEngineering September2016
E R
O
20.8 TailingsManagementFacilityThe Tailings Management Facility (TMF), as previously described in Chapter 18, consists of three adjacent impoundments referred to as Cobre, Aguzadera and the Gossan facilities. The Cobre and Gossan facilities were first constructed in the early 1970’s to contain 70 Mt of tailings and later, the Aguzadera facility, was constructed in the late 1980’s, to provide a total of 86 Mt of tailings storage. Currently there are two tailings facilities in operation, the Cobre and the Aguzadera and both facilities have available storage capacity below the original design elevation of 381.8 m asl and 374.8 m asl respectively. The Gossan has been partly rehabilitated but acts as a contact water reservoir where the tailings water from the Cobre and Aguzadera is treated and pumped back to the plant site. All tailings water and catchment rainfall accumulating on the surface of the TMF, will be recycled back to the processing plant to reduce site water requirements, and keep water levels at the TMF to a minimum. Any seepage from the dam walls will be collected in the filtration ponds and pumped back to the tailings dam. A 50m minimum beach distance from the walls will be maintained during production. Manual breach points in the Cobre and Aguzadera walls will be maintained for use, upon receipt of the appropriate authorization, in the event of extreme emergency conditions, to prevent unplanned breaching of the TSF wall.
20.9 OtherWastesThe Atalaya Environmental Management system incorporates procedures and facilities for collecting, segregating, handling, and disposing or recycling all industrial and domestic waste materials. The system includes non‐hazardous waste such as paper, glass, aluminum, timber, and other construction materials. Specific bermed areas have been designated for the storage of recyclables. Procedures are also in place for tires, scrap metal and electrical equipment. There are also procedures for hazardous materials such as oils and grease, laboratory reagents and solvents, and all are covered by the appropriate EMP.
20.10 WaterSystemsThe water distribution was previously discussed in Chapter 18. The Rio Tinto Copper Project site is bounded to the east by the Rio Tinto River, which has been impacted by the long history of mining in the area, and the Rio Odiel to the west, where water quality is higher. Water demand will largely be supplied from within the mine site recirculation system, which will be supplemented with fresh water from the Campofrio reservoir, and the nearby Aguas Limpias water dam for potential shortfalls of water during the summer. The site has a small positive water balance, but various civil works will allow rainwater run‐off to be diverted and to increase storage on the site. All of the water systems are regulated by both regional and federal governmental agencies. The operational plans maximize water recycling throughout the mine site, returning all decanted tailings water and accumulated catchment rainwater to the processing plant. Fresh surface water that has not contacted exposed mine workings or waste material is diverted away from the site to either of the river systems. A perimeter channel surrounding the TSF is designed to collect all fresh surface run‐off. Emergency plans have been implemented and tested to divert as much water away from the TSF and other ponds as possible, with adequate pumping and alternative storage capacity, and an emergency discharge policy if the dam walls are threatened.

TechnicalReportontheMineralResourcesandReservesoftheRiotintoCopperProject
Page20‐6
OreReservesEngineering September2016
E R
O
Atalaya has assumed that waste‐dump seepage and in‐pit water is to be treated and recycled. The specific mine discharge requirements are defined in the permits, but Atalaya has taken a pragmatic approach to this problem by constructing a water‐treatment system, including dams, pumping and piping infrastructure and a water treatment plant.
20.11 Air,Noise,andVibrationAreas and activities of noise generation have been identified and are monitored, and noise reduction methods are implemented. Blasting, milling operations, and haulage, have a strict timing schedule to reduce the impact on residential neighbors. Areas of dust generation have also been identified and optimum monitoring locations and suppressant methods adopted in the relevant EMPs. These include strictly enforced speed limits for all unpaved haul and access roads, dust collars, spraying, and tree screen planting for suppression management. Blast vibration monitoring is included in the EMP and timing and operational practices are employed to reduce the impacts on close communities and residents. Monitoring and mitigation of blasting impacts have been incorporated into the mine operations contracts.
20.12 EcologyFauna, flora and habitats studies listed species occurring in the area, but recognized that it was impossible to determine what the original ecosystem was like, having been impacted by mining and human activity for millennia. It i s also acknowledged that the area is naturally acidic due to the underlying geology and mineralogy, and that the local ecosystem has evolved to suit the conditions that have been amplified by mining activities. These studies identified regional protected ecosystems and species, developed management plans, and summarized general conservation and rehabilitation procedures for the site. Issues of feral and introduced species were also addressed, with eucalyptus, Scandinavian pine and feral cats being the focus of study. Eucalyptus grows very well and rapidly in the area, and is an easy and often effective revegetation species for erosion control and visual, noise, and dust screening. But it often out‐competes indigenous trees and shrubs. Similarly, an aggressive and robust grass naturally colonize inhospitable locations on the site, including the surface of mine tailings and on waste rock material, out‐competing local species and potentially restricting diversity.
20.13 CulturalHeritageAny activity on site must be approved by the Department of Culture and Heritage. The Department holds a pragmatic view of the mine operation, understanding the balance between the sometimes conflicting heritage, environmental and operational requirements and have raised no significant issues. General requirements for the preservation of cultural heritage in the area have been set out, and include: Restriction of re‐vegetation of the old waste dumps to preserve certain historic vistas; Prior inspection and documentation of heritage items and authorization by the Department before any extension of the open‐pit and waste dumps; Preservation of the Roman ruins outside the planned mining area and next to the pit; Reassembly of the dismantled “Alfredo Mine” head frame; and Building a large‐scale model of the disused gold processing plant.

TechnicalReportontheMineralResourcesandReservesoftheRiotintoCopperProject
Page20‐7
OreReservesEngineering September2016
E R
O
There is an understanding with the Rio Tinto Mining Museum regarding the donation of any artifacts encountered during restart, refurbishment and operations. There is a historical and archaeological value of the area, with important examples of industrial and Victorian infrastructure, and evidence of medieval occupation going back through Roman, Carthaginian, and Phoenician times. Atalaya recognizes a responsibility and duty of care while operating at the Rio Tinto Copper Project. Comprehensive management plans for the protection of cultural heritage on and around the site have been implemented. Any activities affecting items listed in the Heritage Register require detailed documentation and prior authorization of the Department of Culture and Heritage. In addition, a 100 m fenced exclusion zone must be put in place around all conservation sites.
20.14 FinalRestorationPlan(FRP)Final restoration is an integral part of the Riotinto Project and both the operating and final restoration plans (FRP) have been developed to make them compatible with each other and to ensure that the final restoration can be completed as soon as possible after the cessation of mining, processing and waste disposal operations. The objectives of Atalaya’s FRP are to: Protect the environment, Minimize any long term negative environmental impacts of the project, Guarantee the chemical stability of waters discharging from the Riotinto, Ensure that the physical stability of any soils is maintained, Recover any soils that will be disturbed during mining operations and reuse them
appropriately, Recover the natural vegetation in a manner that is compatible with the surrounding habitat, Reduce the contamination to external areas by dust or other emissions, Conserve and maintain the mining heritage in the Riotinto area and, Minimize social impacts as a result of the mine closure at the end of its life.
In accordance with current applicable legislation, Atalaya has submitted for approval an FRP as part of the project approvals process. The FRP (Eygema, 2012b) is submitted as part of the AAU to the Consejería de Medio Ambiente y Ordenación del Territorio for review and approval including a period of public consultation. After approval of the AAU, the FRP, with any amendments brought about as a result of the approvals process is submitted along with the final reclamation bonding deposits to the Consejeria de Economia, Innovacion, Ciencia y Empleo for final approval. Again this process includes a period of public consultation. One year prior to the completion of mining, or tailings deposition activates, Atalaya must submit, for approval, an application for the authorization to abandon the mine, waste dumps, TSF, and site infrastructure. Currently these applications must be made to the Consejeria de Economia, Innovacion, Ciencia y Empleo for approval.

TechnicalReportontheMineralResourcesandReservesoftheRiotintoCopperProject
Page20‐8
OreReservesEngineering September2016
E R
O
20.14.1 ScopeThe Riotinto project boundary encompasses the following areas, as shown in Figure 20.1: Areas that will be disturbed as a result of the planned Project that Atalaya is responsible for
rehabilitating (for example the planned waste dumps). Areas already disturbed that are required for the planned Project that Atalaya is responsible
for rehabilitating (for example the TSF, plant area etc.). Areas already disturbed not required for the planned Project which Atalaya is responsible for
rehabilitating (for example the Marginal Waste Dump). Areas already disturbed not required for the planned Project and which Atalaya is not
responsible for rehabilitating (for example the eastern section of the Corta Atalaya Waste Dumps).
Areas already disturbed not required for the planned Project and a third party is responsible for rehabilitating (for example the western section of the Corta Atalaya Waste Dumps).
In addition to rehabilitating the areas that Atalaya is responsible for, as part of its commitments made to the Junta de Andalucía, Atalaya has opened negotiations with respect to rehabilitating some of those areas that they are not responsible for rehabilitating (for example the Corta Atalaya Waste Dumps).

TechnicalReportontheMineralResourcesandReservesoftheRiotintoCopperProject
Page20‐9
OreReservesEngineering September2016
E R
O
(EMED 2013)
Figure 20.1 – Project Restoration Boundary
Atalaya has not committed to rehabilitating areas that third parties are responsible for. Atalaya is in negotiations with third parties with respect to the costs associated with rehabilitating these areas. Although Atalaya has not committed to rehabilitating these areas, they have been included in the water management and final restoration plans. Atalaya’s FRP covers the following areas:
Cerro Colorado Open Pit, Corta Atalaya Open Pit, Cerro Colorado North and South Waste Dumps, Vacie Marginal and Filon Sur Waste Dumps, Corta Atalaya Waste Dumps, Plant site and general infrastructure, and The TSF.
TechnicalReportontheMineralResourcesandReservesoftheRiotintoCopperProject
Page20‐10
OreReservesEngineering September2016
E R
O
This FRP has been developed in order to ensure the preservation and promotion of cultural heritage, and minimize the social impact as a result of mine closure upon the completion of the planned project. The FRP is based on an initial 14.2‐year mine life and includes post closure monitoring and maintenance. It has been completed in accordance with current regulatory requirements and EU best available techniques for management and closure of waste disposal facilities (European Commission, 2009). This FRP will be updated before the end of the 4th year of mining to include the new 17‐year mine plan discussed in this report. Years 1 through 4 have already been approved.
20.15 ReclamationplanAtalaya will ensure that its approach to mine closure complies with the full regulatory requirements that are in force at the time of eventual closure. To this end, Atalaya has:
Adopted a policy of progressive rehabilitation of non‐operational areas of the site in order to reduce both environmental impacts and the costs associated with final closure.
Regularly review and revised the closure plans in accordance with changes to the regulatory framework and any changes to the LOM operating plan.
Consulted with the regulatory authorities and other stakeholders on matters relating to the post‐mining land‐use, conservation of valuable assets and preservation of the unique landscape of the area.
Made an appropriate financial commitment to ensure that sufficient funds are available to cover the expected cost of eventual closure and rehabilitation.
The key areas covered by the rec lamat ion plan are the Cerro Colorado and Corta Atalaya open pits, the waste dumps, the Corta Atalaya waste dumps, the TSF, the plant area and all associated infrastructure. Atalaya operations will leave the Cerro Colorado open pit in a geotechnically stable condition and no further measures are required post‐closure. The sealed pit will be allowed to become inundated through rainfall and run‐off, and will also take excess surface water and treated seepage from the tailings dam. Perimeter drains will divert uncontaminated surface runoff and water balances for the post closure pit have been modelled. The waste dumps will be constructed to ensure physical and geochemical stability, and minimize the effects of AMD. Progressive rehabilitation and revegetation during mining operations will reduce post‐closure requirements. Operational design and closure plans for the TSF ensure their physical stability, capacity to withstand extreme flood events, prevent the escape of seepage from site, and include capping and revegetation of the surface. Storm water diversion channels will prevent clean water from entering the TSF, and the only water entering the tailings dam post‐closure will be directly from rainwater. With natural evaporation rates, this will maintain sufficient freeboard on the walls. Rock armoring of the outer dam walls will increase strength and reduce erosion. Wherever possible, the FRP separates ‘fresh’ water from contact water, allowing fresh water to discharge off‐site, while any potentially contact run‐off will be redirected to the open pit. Seepage from both the TSF and waste dumps will be treated through appropriate systems to increase pH and reduce entrained metals before discharge to the river systems.
TechnicalReportontheMineralResourcesandReservesoftheRiotintoCopperProject
Page20‐11
OreReservesEngineering September2016
E R
O
Monitoring of the site post‐closure will concentrate on the tailings dams, general site water management, and maintenance. Dust monitoring below the tailings dams will continue until a suitable vegetation cover has been established. The progress of site revegetation will be monitored and maintenance continued until vegetation has been established. Provisions for this are included in the closure budget. With the exception of buildings and structures that have cultural or heritage values, all other buildings, structures and general infrastructure will be removed and disposed of appropriately. Structures remaining on site will be decontaminated and left in a physically stable condition. The plan also provides for the dismantling, removal or preservation of roads, foundations, structures and fittings as required, as well as industrial waste and rubbish dumps. Social and labor impacts have only been superficially addressed in the FRP, and work is still required to develop robust post‐mining sustainability for the area. On‐going studies and discussions with local communities are being undertaken throughout the operating life of the mine to investigate various possibilities in preparation for final closure. These include expanding tourism through mining history and archaeology, and diversification to recycling enterprises and agricultural developments. In Andalucía, there is a strong emphasis on maintaining the perceived historical and cultural aspects of the post‐closure landscape, with access to education and tourism. The management of neighboring restored mine sites has been previously undertaken by the Rio Tinto Foundation (RTF), funded by the Government, other mining operations and tourism income. In compliance with requirements of the Ministry of Culture and Heritage, post‐closure land‐use will be used primarily to maintain the areas of mining heritage for developing the tourism potential of the site. The plan provides for the physical and chemical stability of all land surfaces and structures remaining after closure, to protect visitors and adjacent communities. Geochemical stability is considered within the contexts of the legacy of past mining operations, the current and required water quality of the receiving environment, and current official regulations. The unique aquatic fauna and flora that have evolved in the low‐pH and high‐dissolved‐metal content of local rivers due to the mining history, are now protected by Ministry of Environment legislation. The Atalaya Project, with associated environmental management and final restoration plans, will leave the Riotinto Project area in a much better state.
20.16 HealthandSafetyOccupational risk prevention, as an activity that is performed within the company, is being included in the general management system, which includes all of the activities as well as all of the hierarchical levels with the implementation and application of an occupational risk prevention plan. An Occupational Risk Prevention Plan was established in 2014 as a tool to integrate the company's risk prevention activities into the general management system. The Occupational Risk Prevention Plan was approved by the company management and was then assumed by the entire organizational structure, and is known by all workers.
TechnicalReportontheMineralResourcesandReservesoftheRiotintoCopperProject
Page20‐12
OreReservesEngineering September2016
E R
O
The necessary resources to perform safety activities are organized as per company criteria through its own safety department. The internal safety service is a specific organizational unit that determines the safety activities to be developed and the means to implement them within the entire organization. For the purposes of determining the necessary capacities and skills to evaluate the risks and perform prevention activities, there are three specialty areas or prevention disciplines within the prevention service (workplace safety, industrial hygiene, and applied ergonomics and psycho‐sociology). They are implemented by experts with the appropriate skills for the required tasks, with an external occupational medicine service under contract. Prevention services offer guidance and support needed based on the types of risk, specifically design, implementation and application of a prevention plan that makes it possible to include prevention within the company; evaluate the risk factors that may affect the workers' safety and health; plan prevention activities and determine the priorities when adopting prevention measures and monitoring their efficiency; employee information and training; the provision of first aid (an infirmary and an ambulance are available on site) and emergency plans (coordination with fire‐fighters, police and the emergency 112 hotline); in addition to surveillance of employee health as related to the risks deriving from their jobs. The Safety and Health coordinator supervises different activities at the worksite, in particular when they may create risks classified as serious or very serious or when activities are performed at the worksite that are incompatible with each other due to the implications for workers' health and safety. The aim is also to balance risks that exist at the worksite, which may affect workers at the various companies, and the measures, applied for their prevention. In addition, necessary measures are adopted so that only the companies and personnel authorized may access the facilities. As a company with a prevention service, external audits and evaluations occur. These audits include a systematic analysis of how the initial and periodic risk assessments are done, an analysis of the results and verifications, when there are doubts. The type of prevention activities and their planning fit with the provisions of the general regulations as well as specific risk‐related regulations that are applicable, considering the results of assessments. Based on all of the above, the integration of prevention within the company's general management system in all activities as well as at all hierarchical levels is assessed with the implementation and application of the Occupational Risk Prevention Plan. The effectiveness of the prevention system in preventing, identifying, evaluating, correcting and controlling occupational risks in all phases of company activities is evaluated. The objective is to establish an integrated system based on OSHA 18001, which validates the management system.
20.17 HumanResourcesEmployment is one of the main drivers behind the support and promotion for re‐starting activities at the Riotinto mine. Unemployment is approximately 33% in Huelva, and more than 40% in the areas near the mine. The workforce needed for the project is approximately 520 people, approximately 308 of which will be Atalaya Mining employees and the remaining people will be contractors. The contractors include mining and service companies, which will all be under the management of Atalaya.
TechnicalReportontheMineralResourcesandReservesoftheRiotintoCopperProject
Page20‐13
OreReservesEngineering September2016
E R
O
The personnel needed to start up and operate at 9.5 Mt/y is currently covered, less a few exceptions. The breakdown is as follows: General and Administration 44 Technical personnel 50 Operational personnel 214 TOTAL 308
20.18 ContractingandTrainingAtalaya has developed policies and procedures related to selecting and hiring personnel. The objective of preferentially hiring personnel from the area near the Project is to guarantee that the local communities benefit from the economic activity. This objective has been developed through a collaboration program between the company and the 7 municipalities in the mining area. Local personnel currently represent 65% of the staff at this time. The technical and specialized personnel do not come from the area but rather have been selected from within other areas in Spain. However, it is worth noting that nearly 100% of the personnel are Spanish nationals. Emigration following the previous closure of the mines has caused a lack of specialists and qualified labor. This situation has been resolved by re‐attracting mining personnel to the area and with internal training. Thus, the most pressing training needs are mainly related to mine safety and machinery operation as well as specific training in different operational areas. At the same time, collaboration programs have been implemented with various educational institutions to foster internships within the company. Therefore, programs have been developed with post‐secondary centers and the University of Huelva on subjects related to the project, i.e. Electromechanics, Industrial Engineering, Chemistry, and Mine Engineering. Contractors require qualifications as established by the law.
20.19 LaborRelationsThe Spanish Workers' Statute establishes a law outlining minimum requirements in any sector in Spain. Company‐employee relations are governed by a collective bargaining agreement that will be sector‐related or internal to the company. Companies with more than 50 workers shall choose a "Works Council" which is the body that represents all workers at the company. Although union membership is not mandatory, it is likely most of the workers belong to one. The Spanish mining sector is strongly connected to the unions. Atalaya is currently governed by a Sector Agreement. A Works Council is expected to be elected by and from among the workers.
20.20 PublicRelationsAtalaya Mining promotes the establishment of extensive communication channels and actively seeks opportunities for dialogue with its stakeholders, in order to ensure its business objectives are in line with the needs found in society and societal expectations. The company aims to be transparent by providing relevant and accurate information on its activities, fostering constructive dialogue and encouraging continuous improvement.

TechnicalReportontheMineralResourcesandReservesoftheRiotintoCopperProject
Page20‐14
OreReservesEngineering September2016
E R
O
Since the Project began, the company has fostered a direct relationship and proactive line of communication with the groups, entities, government authorities, institutions, press and general public that are interested in its operations. This is based on an open‐door policy with a view to being transparent about its activities. Members of the organization have also participated in internal, public sector, technical and general events when there is an opportunity to communicate its values and explain its operations and activities. Moreover, it is a member of different business and social organizations with which it shares goals and which are used as a platform for its business and communication policies. Finally, the company has been effectively using all available channels to communicate new developments and explain its ideas using internal resources (website, social media, newsletters, e‐mailing etc.) as well as the press (press releases, interviews, participation in special editions, press visits, etc.). To this end, the hope is that this policy continues to be successful in earning a positive reputation for Atalaya Mining as an excellent and trustworthy mine operator that is integrated within its environment. This is based on maintaining excellent relations with the media and institutions which lead public opinion through transparency and proactivity, on the one hand; and, on the other, the availability of information and opening of direct communication channels with any member of the public through the extensive circulation of communication materials issued. Finally, Atalaya Mining has implemented social responsibility programs through its foundation in order to cover the company objectives beyond the business, leading to a positive reputation for the company.
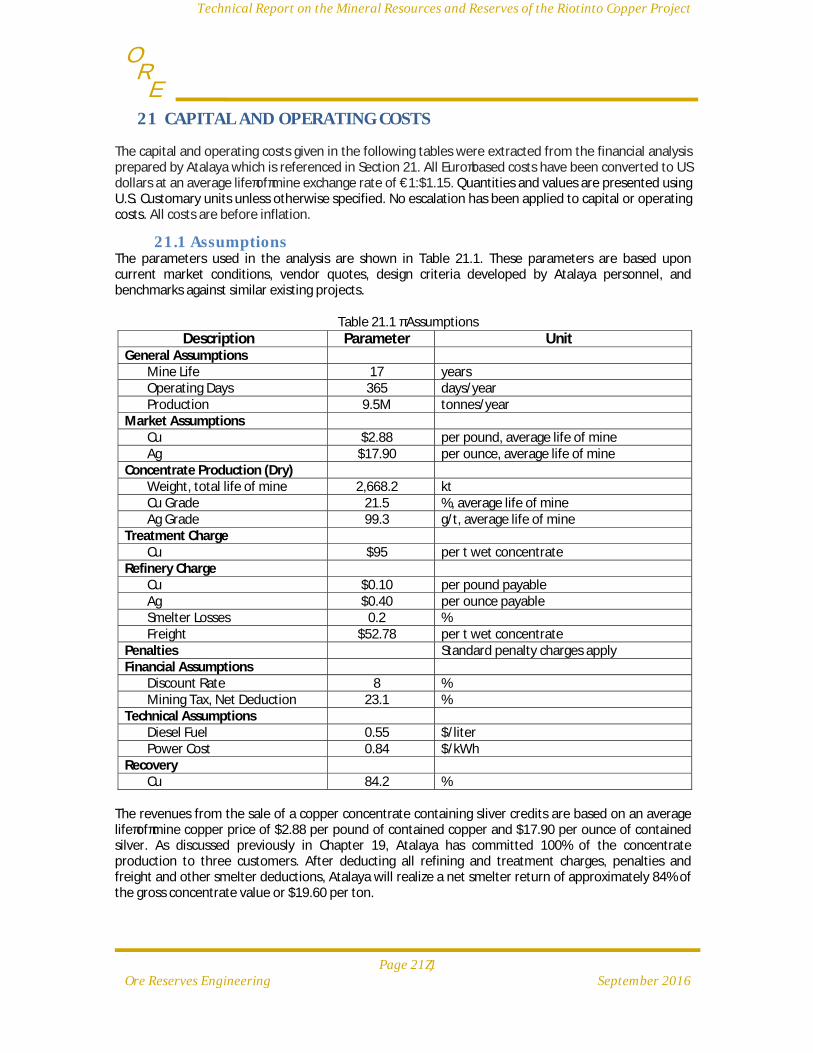
TechnicalReportontheMineralResourcesandReservesoftheRiotintoCopperProject
Page21‐1
OreReservesEngineering September2016
E R
O
21 CAPITALANDOPERATINGCOSTS
The capital and operating costs given in the following tables were extracted from the financial analysis prepared by Atalaya which is referenced in Section 21. All Euro‐based costs have been converted to US dollars at an average life‐of‐mine exchange rate of €1:$1.15. Quantities and values are presented using U.S. Customary units unless otherwise specified. No escalation has been applied to capital or operating costs. All costs are before inflation.
21.1 AssumptionsThe parameters used in the analysis are shown in Table 21.1. These parameters are based upon current market conditions, vendor quotes, design criteria developed by Atalaya personnel, and benchmarks against similar existing projects.
Table 21.1 ‐ Assumptions Description Parameter Unit
General Assumptions Mine Life 17 yearsOperating Days 365 days/yearProduction 9.5M tonnes/year
Market Assumptions Cu $2.88 per pound, average life of mine Ag $17.90 per ounce, average life of mine
Concentrate Production (Dry) Weight, total life of mine 2,668.2 ktCu Grade 21.5 %, average life of mineAg Grade 99.3 g/t, average life of mine
Treatment Charge Cu $95 per t wet concentrate
Refinery Charge Cu $0.10 per pound payableAg $0.40 per ounce payableSmelter Losses 0.2 %Freight $52.78 per t wet concentrate
Penalties Standard penalty charges apply Financial Assumptions
Discount Rate 8 %Mining Tax, Net Deduction 23.1 %
Technical Assumptions Diesel Fuel 0.55 $/literPower Cost 0.84 $/kWh
Recovery Cu 84.2 %
The revenues from the sale of a copper concentrate containing sliver credits are based on an average life‐of‐mine copper price of $2.88 per pound of contained copper and $17.90 per ounce of contained silver. As discussed previously in Chapter 19, Atalaya has committed 100% of the concentrate production to three customers. After deducting all refining and treatment charges, penalties and freight and other smelter deductions, Atalaya will realize a net smelter return of approximately 84% of the gross concentrate value or $19.60 per ton.

TechnicalReportontheMineralResourcesandReservesoftheRiotintoCopperProject
Page21‐2
OreReservesEngineering September2016
E R
O
21.2 LifeofMineProductionIn 2016, Atalaya completed an expansion from (phase 1) 5.0 Mt/y to (phase 1 + expansion) 9.5 Mt/y. The ore reserve discussed in Chapter 15 is estimated at 153 M tonnes averaging 0.45% Cu. Production over the life of mine is summarized in Table 21.2
Table 21.2 – Life of Mine Production (total) Waste 287.3 M tonnesOre 152.8 M tonnes
Grade Cu 0.45 %Low Grade Stockpile 11.4 M tonnes
Grade Cu 0.22 %Contained Metal in concentrate, Cu 574.0 k tonnesPayable Metal, Cu 547.4 k tonnes
21.3 LifeofMineCapitalCostsLife of Mine capital costs for the overall capital program including both phase 1 and expansion are estimated to be $152.9M. Sustaining capital averages $2.2M per annum with a total expenditure of $36.7M. Development capital spent to date, in US$, by unit area is shown in Table 21.3.
Table 21.3 – Capital Expenditure to Date, US$ OCCUPATIONAL HEALTH AND SAFETY 582.14
EXPLORATION AND GEOLOGY 2,234.39MINING 4,030.34
PROCESSING 74,577.63INFRASTRUCTURE 8,785.08
PROJECT MANAGEMENT 3,577.28ENGINEERING 5,607.23
CONSTRUCTION MANAGEMENT 18,363.12OWNERS COSTS 5,963.81CONTINGENCY 1,726.75
G & A 16,882.12CAPEX TOTAL 142,329.90
The estimated capital outlay for the phased development is USD$152.9 million of which US$124.1 million was spent in 2015. Additional capital requirements are shown below:
Sustaining Capital $36.7 M Total, life‐of‐mineDevelopment Capital (2016) $28.8 M Total, including expansion
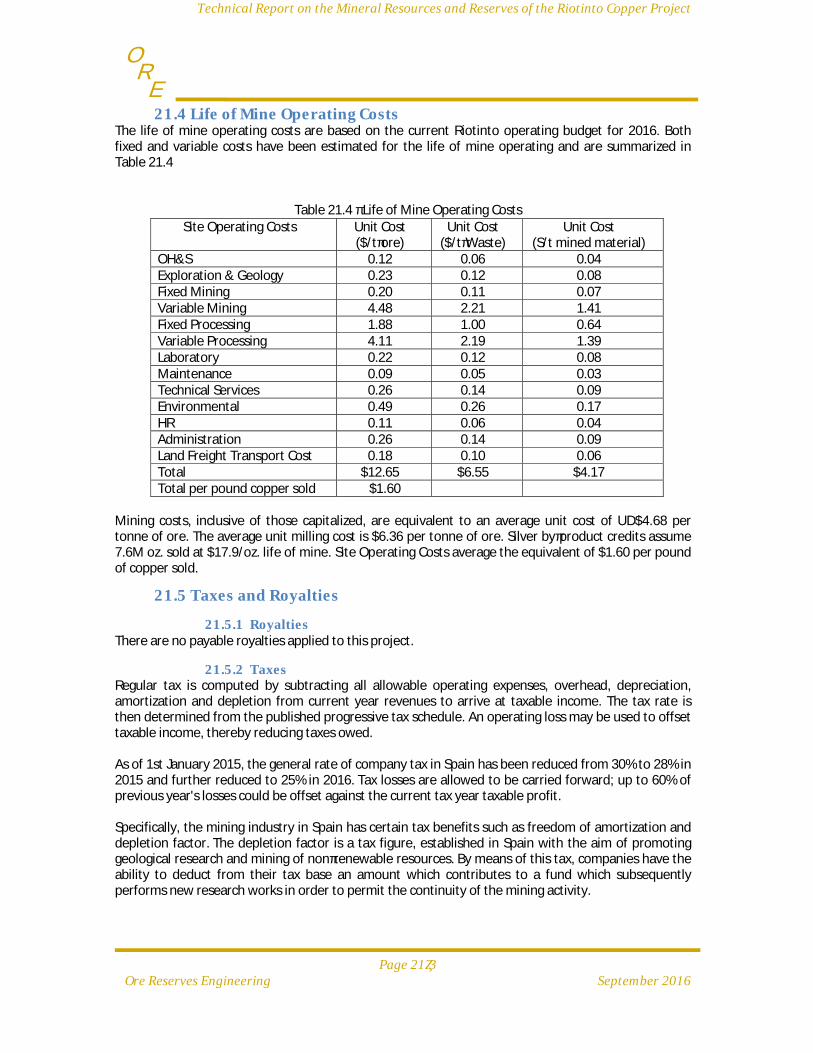
TechnicalReportontheMineralResourcesandReservesoftheRiotintoCopperProject
Page21‐3
OreReservesEngineering September2016
E R
O
21.4 LifeofMineOperatingCostsThe life of mine operating costs are based on the current Riotinto operating budget for 2016. Both fixed and variable costs have been estimated for the life of mine operating and are summarized in Table 21.4
Table 21.4 ‐ Life of Mine Operating Costs Site Operating Costs Unit Cost
($/t‐ore)Unit Cost
($/t‐Waste)Unit Cost
(S/t mined material) OH&S 0.12 0.06 0.04 Exploration & Geology 0.23 0.12 0.08 Fixed Mining 0.20 0.11 0.07 Variable Mining 4.48 2.21 1.41 Fixed Processing 1.88 1.00 0.64 Variable Processing 4.11 2.19 1.39 Laboratory 0.22 0.12 0.08 Maintenance 0.09 0.05 0.03 Technical Services 0.26 0.14 0.09 Environmental 0.49 0.26 0.17 HR 0.11 0.06 0.04 Administration 0.26 0.14 0.09 Land Freight Transport Cost 0.18 0.10 0.06 Total $12.65 $6.55 $4.17 Total per pound copper sold $1.60
Mining costs, inclusive of those capitalized, are equivalent to an average unit cost of UD$4.68 per tonne of ore. The average unit milling cost is $6.36 per tonne of ore. Silver by‐product credits assume 7.6M oz. sold at $17.9/oz. life of mine. Site Operating Costs average the equivalent of $1.60 per pound of copper sold.
21.5 TaxesandRoyalties
21.5.1 RoyaltiesThere are no payable royalties applied to this project.
21.5.2 TaxesRegular tax is computed by subtracting all allowable operating expenses, overhead, depreciation, amortization and depletion from current year revenues to arrive at taxable income. The tax rate is then determined from the published progressive tax schedule. An operating loss may be used to offset taxable income, thereby reducing taxes owed. As of 1st January 2015, the general rate of company tax in Spain has been reduced from 30% to 28% in 2015 and further reduced to 25% in 2016. Tax losses are allowed to be carried forward; up to 60% of previous year's losses could be offset against the current tax year taxable profit. Specifically, the mining industry in Spain has certain tax benefits such as freedom of amortization and depletion factor. The depletion factor is a tax figure, established in Spain with the aim of promoting geological research and mining of non‐renewable resources. By means of this tax, companies have the ability to deduct from their tax base an amount which contributes to a fund which subsequently performs new research works in order to permit the continuity of the mining activity.
TechnicalReportontheMineralResourcesandReservesoftheRiotintoCopperProject
Page22‐1
OreReservesEngineering September2016
E R
O
22 ECONOMICANALYSIS
Atalaya has developed a financial model for the Riotinto Project that incorporates the updated reserve and resources. On the basis of the latest update of that model, the summary financial forecast for the project is shown in Table 22.1 below. The assumptions for price and financial factors utilized in the financial model and resultant forecasts are as follows:
All amounts are in constant 2016 US dollars (US$).
Amounts in Euros (€) were converted to US$ at an average life of mine exchange rate of €1.00:US$1.14
Copper production is sold at average life of mine copper price of US$2.88/lb.
Income tax rate of 25%.
This financial forecast shows that after tax, net cash flows, inclusive of capital expenditures, and closure costs, will total $1,054.6M over the life of the project for an NPV of $445M at an 8% discount rate. The overall project cash costs (C1), net of silver credits is US$1.96 per pound of copper increasing to US$2.00 per pound of copper, net of silver credits, adjusting for the sustaining costs (AISC).
TechnicalReportontheMineralResourcesandReservesoftheRiotintoCopperProject
Page22‐2
OreReservesEngineering September2016
E R
O
Table 22.1 – Cash Flow Forecast
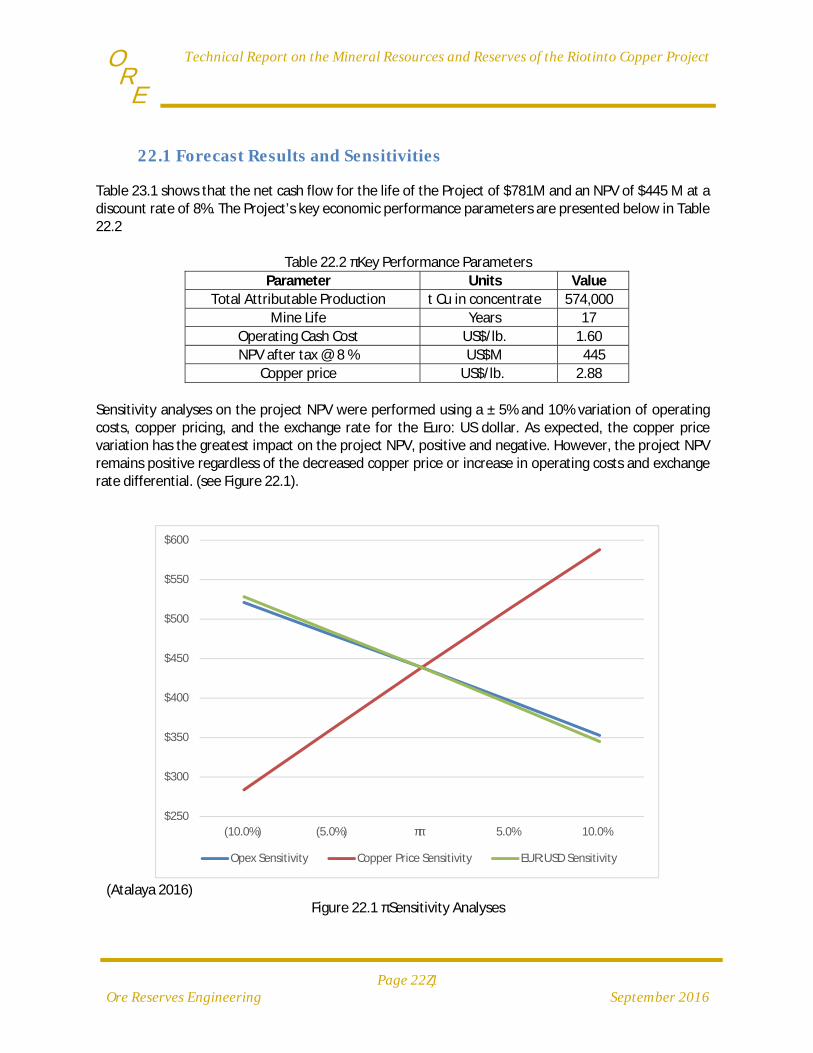
TechnicalReportontheMineralResourcesandReservesoftheRiotintoCopperProject
Page22‐1
OreReservesEngineering September2016
E R
O
22.1 ForecastResultsandSensitivities
Table 23.1 shows that the net cash flow for the life of the Project of $781M and an NPV of $445 M at a discount rate of 8%. The Project’s key economic performance parameters are presented below in Table 22.2
Table 22.2 ‐ Key Performance Parameters
Parameter Units Value
Total Attributable Production t Cu in concentrate 574,000
Mine Life Years 17
Operating Cash Cost US$/lb. 1.60
NPV after tax @ 8 % US$M 445
Copper price US$/lb. 2.88
Sensitivity analyses on the project NPV were performed using a ± 5% and 10% variation of operating costs, copper pricing, and the exchange rate for the Euro: US dollar. As expected, the copper price variation has the greatest impact on the project NPV, positive and negative. However, the project NPV remains positive regardless of the decreased copper price or increase in operating costs and exchange rate differential. (see Figure 22.1).
(Atalaya 2016)
Figure 22.1 ‐ Sensitivity Analyses
$250
$300
$350
$400
$450
$500
$550
$600
(10.0%) (5.0%) ‐‐ 5.0% 10.0%
Opex Sensitivity Copper Price Sensitivity EUR:USD Sensitivity
TechnicalReportontheMineralResourcesandReservesoftheRiotintoCopperProject
Page23‐2
OreReservesEngineering September2016
E R
O
23 ADJACENTPROPERTIES
23.1 OtherDepositswithintheRiotintoConcessionThere are mineral deposits other than the Cerro Colorado deposit within the Riotinto Concession area. Atalaya Mining has completed a thorough data review and has identified exploration potential for mineralization, recoverable by open‐pit and underground mining methods, in four locations:
San Dionisio Filón Sur From Planes to San Antonio The Southern waste dump.
23.1.1 SanDionisioDepositThe San Dionisio deposit, located about 1 km west of the Cerro Colorado pit, was exploited by the Corta Atalaya open‐pit and the Pozo Alfredo underground mine, which worked two different types of mineralization. The San Dionisio deposit occurs as a massive sulfide lens within the core of a syncline with a copper‐rich stockwork zone along the eastern (footwall) portion of the syncline (the Alfredo Cloritas Zone). The San Dionisio massive sulfide was mined for sulfur by underground and open‐pit methods from the late 1800s until 1992; and of the Alfredo Cloritas was mined for copper by underground methods until 1986. From 1977 until 1986, Riotinto Minas SA (RTMSA) undertook considerable exploration drilling (1,080 underground drill holes) and feasibility studies for bulk mining both the massive sulfides and the Alfredo Chlorites by underground methods at a combined rate of 1.2 Mt/y. That work was discontinued in 1986 due to the prevailing low metal prices. Corta Atalaya was one of the largest open‐pit mines in Europe at 1,200 m long, 906 m wide and 330 m deep. The Corta Atalaya open‐pit was started in 1907 to mine the upper stratiform massive sulfides (pyrite) part of the San Dionisio orebody, which is 1200 m long and 50 to 60 m thick. As mined, the ore contained 48% S and 0.8% Cu. Marginal grade material averaging 0.15 to 0.25% Cu was leached to produce some 1,500 to 2,500 t/y Cu, as well as 4 t/y Au and 50 t/y Ag from dump material and the gossans, with the latter containing about 90 Mt at 0.85g/t Au and 45 to 50 g/t Ag. At the deepest level of the pit, a connecting tunnel and access ramp led to the workings of the Pozo Alfredo underground mine, which mined the underlying stockwork part of the San Dionisio deposit that extends for a distance of 600 to 700 m in an east‐west direction, is 200 m thick and 600 m deep. Annual production from Pozo Alfredo was about 250,000 t of ore material at an average grade of 1.35% Cu. Primary crushing, to less than 200 mm, was carried out in the same crushing plant as the ore from Corta Atalaya, but was processed by a separate circuit in the plant. Both open‐pit and underground copper ore were treated in a single concentrator. The underground mine was closed in 1987. This deposit is shown in Figure 23.1

TechnicalReportontheMineralResourcesandReservesoftheRiotintoCopperProject
Page23‐3
OreReservesEngineering September2016
E R
O
(Atalaya 2016)
Figure 23.1 – Pozo Alfredo underground mine.
23.1.2 FilónSurdepositThe Filón Sur massive sulfide was mined for sulfur by both underground and open‐cut methods. Underground production from 1873 to 1967 was 18.2 Mt of ore and open‐cut production between 1874 and 1949 was 24.2 Mt of ore. As all of this material was mined for sulfur; the base‐metal and precious‐metal contents were not systematically recorded. As the Filón Sur pit is developed, un‐mined portions of the Filón Sur Massive sulfide will become exposed. Atalaya Mining is evaluating whether to carry out investigation of the Filón Sur massive sulfide deposit in conjunction with the proposed Cerro Colorado pit expansion in the Filón Sur Area.
23.1.3 Planes‐SanAntonioDepositThe Planes‐San Antonio Deposit is located at the eastern end of Cerro Salomon (CCE). The Planes mine was worked intermittently from Roman times up to 1950, when mining became uneconomic. In1962, a geophysical survey and exploratory drilling program located an extension of the mineralization 600 m to the east of Planes, which was named San Antonio.
The Planes vein‐stockwork mineralization appears to have been a feeder pipe underlying the layered (stratiform) pyrite of the San Antonio deposit that was precipitated on the sea‐bed. The brecciation of the colloform pyrite, the presence of slumping structures and the re‐deposited pyrite material in the San Antonio deposit, all point to intra‐formational erosion and transport of a large part of the massive stratiform sulfides for several hundred meters from the top of the source feeder pipe at Planes down the side of the volcano into a depression on the sea‐bed. The San Antonio massive sulfide deposit is shallow (150m to 300m below surface), lenticular in shape, dipping to the east at 30 degrees and is 250m in length and 20m thick. Exploration of this deposit was

TechnicalReportontheMineralResourcesandReservesoftheRiotintoCopperProject
Page23‐4
OreReservesEngineering September2016
E R
O
undertaken in the mid‐1960s to the mid‐1970s by the sinking of a shaft, the development of 2 levels from this shaft and the drilling of 183 underground drill holes. Other than exploratory development, no mining has been carried out on this deposit. Figure 23.2 is an S‐N drill cross section through the western side of the Planes‐San Antonio deposit.
(Atalaya 2016)
Figure 23.2 – S‐N cross‐section through the Planes‐San‐Antonio deposit
23.2 AdjacentPropertiesBeside the Riotinto permit which is an Exploitation Concession (CE), Atalaya Mining owns other Exploitation Concession and Exploration Permits (PI) near the Riotinto Project area. The status of the CET is currently under ownership change. These are presented in Table 23.1 below.

TechnicalReportontheMineralResourcesandReservesoftheRiotintoCopperProject
Page23‐5
OreReservesEngineering September2016
E R
O
Table 23.1 – Adjacent Properties Name Type Situation
Proyecto Riotinto CE Active
Peña del Hierro CE Under ownership change
Chaparrita CE Under ownership change
Grupo Riotinto CE Under ownership change
Corralejos CE Under ownership change
Chaparrita CE Under ownership change
Poderosa CE Under ownership change
El Villar PI Active
Valle Redondo PI Active
Socavón PI Under application
There are 3 major deposits nearby the Atalaya Mining properties. These are Aguas Teñidas, Magdalena and Concepcion, which belongs to MATSA (Trafigura). The locations of these and the Atalaya Mining Properties are presented in Figure 23.3 below.
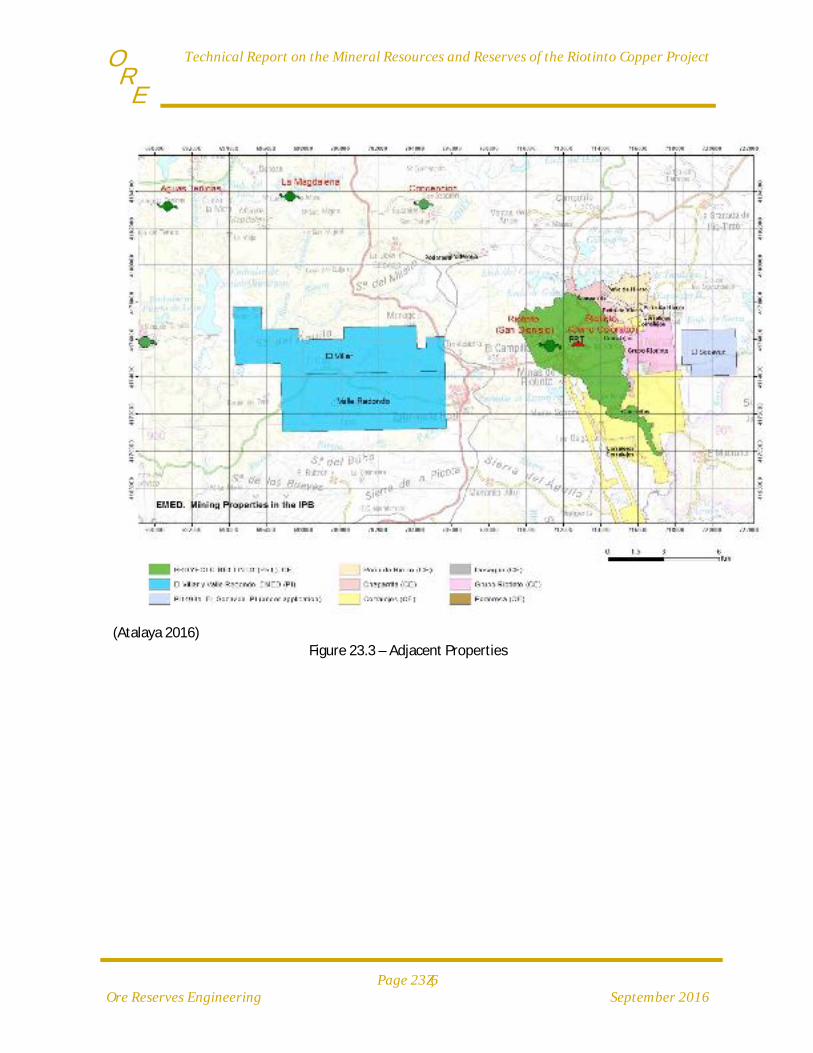
TechnicalReportontheMineralResourcesandReservesoftheRiotintoCopperProject
Page23‐6
OreReservesEngineering September2016
E R
O
(Atalaya 2016)
Figure 23.3 – Adjacent Properties

TechnicalReportontheMineralResourcesandReservesoftheRiotintoCopperProject
Page24‐1
OreReservesEngineering September2016
E R
O
24 OTHERRELEVANTDATAANDINFORMATION
Atalaya Mining plc (AIM:ATYM, TSX:AYM) announced its unaudited quarterly and interim results for the three and six months to June 30 2016, together with the unaudited, condensed interim consolidated financial statements on September 7, 2016 The complete unaudited, condensed half yearly financial statements are available under the Company’s profile on SEDAR at www.sedar.com and on the Company’s website at www.atalayamining.com.
TechnicalReportontheMineralResourcesandReservesoftheRiotintoCopperProject
Page25‐1
OreReservesEngineering September2016
E R
O
25 INTERPRETATIONSANDCONCLUSIONS
25.1 ResourceEstimationThe three most significant factors for estimation of the Cerro Colorado resource are high variability of copper grades, highly overlapping zones of low and higher‐grade mineralization, and folding of the deposit into a plunging anticlinal shape. The effect of the overlapping grade zones is minimized by assigning grade‐zone codes to resource model blocks. Many years of mining on the Riotinto Project have established that a significant copper resource is present and can be extracted by open‐pit mining methods. This conclusion has been confirmed by current mining during 2015 and 2016. Riotinto copper mineralization, however, has high variability, much more like a gold deposit. While the high variability does not preclude estimating the overall resource with a level of accuracy suitable for measured and indicated resource, the mine is likely to experience annual differences in copper grade that are as much as 15% higher or lower than the predicted grade.
25.1.1 ResourceRisksandOpportunitiesThe primary resource risk, therefore, is that the mine must always be prepared for annual production that is significantly worse or better than planned production. The high variability of copper grade also means that grade control practice must by of the highest quality to minimize dilution and maximize extraction of ore. The primary resource opportunity is that significant blocks of inferred mineralization are included inside the ultimate pit. If those blocks of inferred mineralization are upgraded to measured and indicated resource, the proven and probable reserve would automatically increase and waste mining would decrease by the tonnage upgrade from inferred. In addition, small blocks of resource are present outside the northern and southern fault boundaries of the mineralized zone, where resources are not estimated because of lack of drilling. Previous mining has demonstrated that mineralization is present outside the fault limits, which could increase ore tonnage slightly.
25.2 MiningThe exploitation plan for the Riotinto Project utilizes conventional truck and excavator open pit mining methods for the Cerro Colorado deposit. A declining cutoff strategy, ranging from 0.25 to 0.16% Cu, will be employed to maximize the present value of the mining schedule based on a target ore processing rate of 9.5 Mt/a. At a Cu price of $2.60/lb., total proven and probable mineral reserves are estimated at nearly 153 Mt grading 0.45% Cu and containing about 681,000 tonnes of Cu metal. Waste rock, including backfill in old workings, totals about 299 Mt for an average stripping ratio of 1.95. The mine’s life is estimated at 16.5 years.
25.2.1 RisksTypical of many base metal projects, mineral reserves at Cerro Colorado are sensitive to commodity prices and operating costs. A Lerchs‐Grossmann (LG) analysis of economic pit limits, see Section 15.3.2, indicates that lowering the Cu price nearly 14% from $2.60/lb. to $2.25/lb. would lower the amount of potentially economic measured and indicated (M&I) resources by over 23% in terms of tonnes above an internal cutoff. Similarly, a 15% increase in operating costs would reduce economic M&I resource tonnages by about 18%.
TechnicalReportontheMineralResourcesandReservesoftheRiotintoCopperProject
Page25‐2
OreReservesEngineering September2016
E R
O
A Roman archeological site located immediately north of mining phase 1 could potentially reduce mineral reserves by 4‐5% should Atalaya Mining be denied permission to develop the site. This would impact phase 4, stripping for which is scheduled to commence in 2021 (Year 6). Atalaya Mining plans to conduct an archeological survey and does not anticipate any problems with securing the necessary permits. National Highway A‐461 presently lies along the western edge of the Cerro Colorado pit and potentially impacts the development of phases 5 and 6; initial stripping in these phases is scheduled for 2022 and 2025, respectively. One possible realignment of this road would traverse a 4 Mt backfill of an eastern extension of the old Atalaya open pit. There are engineering and permitting processes that must be completed prior to moving the highway and Atalaya Mining believes permission can be obtained in a timely manner. Failure to relocate the highway would likely reduce mineral reserves by 7‐8%, based on an LG study in which mining that disturbs the existing highway corridor was prohibited. Atalaya Mining’s current pit dewatering rates may impact mill feed in the second and third quarters of 2017 under the proposed mine production schedule. The anticipated receding water levels will be very close to the bottom working levels of phase 1 in May through September. Mineral reserves should not be affected in the long term, but short term delays in mill feed could affect cash flows – deferring revenue and slightly lowering present values. The current tailings management facility has the capacity to store 123 Mt of tailings for an estimated life of 10 years. Based on the current reserve presented in this report, the quantity of tailings generated will increase to approximately 152.2Mt leaving the TMF 20% short of the required capacity. Atalaya is currently conducting additional studies to increase this capacity to 160 Mt.
25.2.2 OpportunitiesHigher commodity prices could increase mineral reserves through both lower cutoff grades and potentially larger pit limits. An LG analysis indicates that a 15% increase in Cu price, from $2.60/lb. to $3.00/lb., could increase mineral reserve tonnages above an internal cutoff by 21%. In‐fill drilling could convert inferred mineral resources to a higher classification. Approximately 10.9 Mt of inferred mineral resources grading 0.54% Cu above declining cutoffs are presently estimated and treated as waste within the designed ultimate pit. It should be remembered, however, that inferred mineral resources are too speculative geologically to have economic considerations applied to them that would enable them to be categorized as mineral reserves. There is no certainty that inferred mineral resources will be upgraded to a higher classification.

TechnicalReportontheMineralResourcesandReservesoftheRiotintoCopperProject
Page26‐1
OreReservesEngineering September2016
E R
O
26 RECOMMENDATIONSAtalaya Mining has successfully refurbished and expanded the Riotinto plant and infrastructure and is presently mining the Cerro Colorado open pit through the UTE Riotinto joint venture. Mineral reserves are estimated to provide a project life of greater than 16 years. In addition, Lerchs‐Grossman analysis of the mineral resource indicates that with a 15% increase in copper price, from the base case $2.60/lb to $3.00/lb, could increase the reserve tonnage by approximately 20%. While no major work programs are suggested, the recommendations that follow and that are further outlined in Chapter 26 are meant to improve operations and/or the economics of the Riotinto Project. Most of these can be evaluated by Atalaya Mining’s in‐house management and technical staff and do not require expenditures outside the normal operating and capital budgets. Pit bottom sinking rates in mining phase 1 may catch up with the receding water levels from pit
dewatering in the second and third quarters of 2017. Higher pumping rates should be investigated to avoid possible interruptions in mill feed during this time period.
The mine has historically used cutoff grades based on Cu% assuming an average metallurgical recovery. With data supporting some correlation of Cu recoveries to sulfur content, Atalaya Mining should consider, at a minimum, switching cutoffs to a recoverable copper (RCu) basis. Additional investigation of this correlation is warranted, including examining the effect of rock types and other characteristics that may help refine the understanding of metallurgical recoveries. Furthermore, arsenic and antimony should be included in grade control assaying, if possible, as both metals have significant concentrations in the Cerro Colorado deposit that can trigger higher treatment charges and/or reduced payables at the smelter. A net smelter return (NSR) cutoff is recommended, which could account for both variable Cu recoveries and charges associated with deleterious metals.
The percussion drills presently used by the mining contractors are capable of blasthole diameters of 102 to 127 mm. These diameters are small for blasting significant tonnages from 10‐m‐high benches, where down‐hole‐hammer (DHH) rigs capable of 171 to 191 mm holes would typically be used. Larger blasthole diameters allow wider spacing, require fewer holes and the related number of boosters and blasting accessories per shot, and thus lower operating costs for drilling and blasting. Labor costs could also be reduced. The mining contractors may not presently own any suitable DHH blasthole rigs, so a trade‐off analysis is recommended to investigate possible capital expenditures versus operating cost savings.
The mine production schedule indicates that over 11 Mt of low grade measured and indicated mineral resources averaging 0.22% Cu could be stockpiled during the next 10 years of operations. While this material is treated as waste in this study, low grade ore could add another year to the project’s ore processing life if a suitable stockpile site can be developed. The likely areas lie to the west of Highway A‐461, which would require a crossing near the northwest pit exit. An evaluation should be conducted to determine if the processing value of this material at the end of mining (in 2032), accounting for possible reduced recoveries due to ore oxidation, exceeds the costs of: constructing the highway crossing, the site preparation, and the reclamation of low grade ore from the stockpile.

TechnicalReportontheMineralResourcesandReservesoftheRiotintoCopperProject
Page26‐2
OreReservesEngineering September2016
E R
O
Inferred resources should be converted to measured and/or indicated classifications with minor additional drilling. Approximately 10.9 Mt of inferred mineral resources grading 0.54% Cu above declining cutoffs are presently estimated and treated as waste within the designed ultimate pit. It should be remembered, however, that inferred mineral resources are too speculative geologically to have economic considerations applied to them that would enable them to be categorized as mineral reserves. There is no certainty that inferred mineral resources will be upgraded to a higher classification. The estimated cost to complete this drilling is US$840k.
Additional infill drilling on both San Dionisio and San Antonio polymetallic deposits should confirm historical estimates. These deposits were previously discussed in Chapter 9. San Dioniso is one of the main Riotinto ore zones which was mined from the 1960´s to the late 1980´s but still contains unmined resources. According to the compiled historical data, mining was mostly focused on the massive sulfide ore, but the chlorite altered stockwork that is hosted on the northern flank over +100 m above sea level has not been mined out. The Atalaya Mining Exploration Department should continue with a drilling program to evaluate the resources in the San Antonio deposit. Results from 4 diamond holes confirmed the occurrence of a subvertical chlorite altered stockwork zone overlaying the massive sulfides (already mined) in the northern flank of the orebody. The estimation of total resources determined by EMED in 2011, using a Cu cut‐off of 0.5% Cu, is 10.6 Mt at 1.34% Cu. This deposit is not yet exploited and has already two vertical shafts, a ramp and a series of underground galleries. Estimated cost of US$605k to complete this program.
Exploration drilling around the Filon Sur historical pit may prove stockwork and massive sulfide ore were unmined. Estimated cost of US$370k to complete this program.
The norther flank of the Atalaya pit is known to host stockwork mineralization which requires further infill drilling. Estimated cost of US$302k to complete this program.
Continue to optimize processing operations in order to increase production rates and increase product quality. This can be accomplished by conducting debottleneck analysis to increase throughput and installing added flexibility in production lines. Install the ability/flexibility to dedicate a grinding line with a flotation train so that various ore types and reagents can be independently evaluated.
A study should be undertaken to correlate the crusher head analysis with the mine blast holes and understand the lag between the mine assay and the primary mill head analysis.
Set up automatic sampling of final concentrate and extend a sample exchange program with
external laboratories to improve analytical reliability.
Continue to look for opportunities to improve operating costs. Set up a detailed program to monitor the higher cost/use consumables, such and reagents, mill steel, and energy.
Formalize a social and community development plan that incorporates both company and community issues. Need to develop a post mine use plan.

TechnicalReportontheMineralResourcesandReservesoftheRiotintoCopperProject
Page26‐3
OreReservesEngineering September2016
E R
O
Continue to Instill a culture of safety and safe practices both at work and home. Make environmental compliance equal to safety and production.
Additional costs to complete these recommendations total $2,117k for exploration and development
drilling outside of the normal operating and capital budgets.
TechnicalReportontheMineralResourcesandReservesoftheRiotintoCopperProject
Page27‐1
OreReservesEngineering September2016
E R
O
27 REFERENCES
Feasibility Study Report, EMED Mining Limited, EMED Tartessus S.L.U. Proyecto Rio Tinto, October 2013 Amended and Restated NI43‐101 Technical Report on Reopening the Rio Tinto Copper Mine, Huelva Province, Spain, Behre Dolbear International Ltd., 17 November 2010 NI43‐101 Technical Report on EMED’s Rio Tinto Copper Project, Huelva Province, Spain. Behre Dolbear International Ltd., February 2013 Technical Memorandum ‐ TMF Management Facility Section for the current NI43‐101 Report, Golder Associates, Santiago, Chile. 1 April, 2016 Presentation – “El gigante se pone en forma”, Proyecto de reapertura de la mina de Riotinto, EMED Tartessus, October 2015 Process Control Philosophy – Doc. No. SP0584‐0000‐1D0‐002 Rev 1, Riotinto Expansion Project, SENET, 28 August, 2015 Riotinto Copper Project Resource Reserve Review, EMED Tartessus SLU, AMC Mining Consultants (Canada) Ltd., 16 June 2015 Introduccion General Del Proceso Rev 0, Proyecto Riotinto, EMED Tartessus, 11 August 2015 Informes Técnicos IGME Nº8, Characterization of Geological structures from Gravity and Magnetic data of Riotinto, Iberian Pyrite Belt (Huelva, Spain), 2013 Atalaya Department of Geology 2016, geological figures
TechnicalReportontheMineralResourcesandReservesoftheRiotintoCopperProject
Page28‐2
OreReservesEngineering September2016
E R
O
28 QUALIFIEDPERSONSThe Consultants preparing this Technical Report are specialists in the fields of geology, mineral resource and reserve estimation and classification, environmental engineering, permitting, metallurgical testing, mineral processing design, capital and operating cost estimation, and mineral economics. None of the Consultants employed in the preparation of this report has any beneficial interest in Atalaya. The results of this Technical Report are not dependent on any prior agreements regarding the conclusions that are reached. There are also no undisclosed agreements concerning any future business between the Consultants and Atalaya. The following Consultants, by virtue of their education, experience and professional associations, are considered Qualified Persons (QP) as defined by the NI 43‐101 standards and are members in good standing of the appropriate professional institutions.

TechnicalReportontheMineralResourcesandReservesoftheRiotintoCopperProject
Page28‐3
OreReservesEngineering September2016
E R
O
CERTIFICATE OF AUTHOR
Alan C Noble, P.E. Ore Reserves Engineering 12254 Applewood Knolls Drive Lakewood, Colorado 80215
Telephone: +1 303 237 8271 Email: [email protected]
I, Alan C Noble, do hereby certify that:
I am a self‐employed Mining Engineer working as Ore Reserves Engineering at 12254 Applewood Knolls Drive, Lakewood, Colorado 80215 and have carried out this assignment as overall author/reviewer.
1. This certificate applies to the Technical Report titled “Technical Report on the Mineral Resources and Reserves of the Riotinto Copper Project, Located in Huelva Province, Spain (the “Technical Report”), and dated September, 2016 for Atalaya Mining Plc.
2. I graduated from the Colorado School of Mines in Golden, Colorado with a Bachelor of Science Degree in Mineral Engineering in 1970.
3. I am a Registered Professional Engineer in the State of Colorado, USA, PE26122
4. I have practiced my profession as a mining engineer continuously since 1970, for a total of 46 years. During that time, I worked on mineral resource estimates and mine planning for over 156 mineral deposits.
5. I have read the definition of “Qualified Person” set out in National Instrument 43‐101 (“NI 43‐101”) and certify that by reason of my education, registration as a professional engineer, and past relevant work experience, I fulfill the requirements to be a “Qualified Person” for the purposes of NI 43‐101.
6. I am responsible for the overall review of the report and for preparation of Chapters 7 through and 13 of the Technical Report. I prepared the mineral resource estimate that is the subject of Chapter 14. In addition, I reviewed and approved the mine planning and design work in Chapters 15 and 16.
7. I have visited the property from February 19 through February 26, 2016.
8. I have had no prior involvement with the property that is the subject of the Technical Report.
9. I am independent of the issuer, Atalaya Mining Plc, applying all of the tests of Section 1.5 of NI 43‐101.
10. I have read NI 43‐101 and Form 43‐101F1, and Chapters 7 through 16 of the Technical Report have been prepared in compliance with the instrument and form.
11. At the effective date of the Technical Report, to the best of my information, knowledge and belief, Chapters 7 through 16 of the Technical Report contain all scientific and technical information that is required to be disclosed to make the Technical Report not misleading.
I consent of the filing of the Technical Report with any Canadian stock exchange and consent other securities regulatory authority and any publication by them for regulatory purposes of the technical report.
Dated this 27th day of September 2016. “Signed and Sealed, Alan C. Noble, P.E.” Alan C. Noble, P.E. 26122
TechnicalReportontheMineralResourcesandReservesoftheRiotintoCopperProject
Page28‐4
OreReservesEngineering September2016
E R
O
CERTIFICATE OF AUTHOR
WILLIAM L. ROSE, P.E.
I, William L. Rose, P.E., do hereby certify that:
I am the Principal Mining Engineer of:
WLR Consulting, Inc. 9386 West Iowa Avenue Lakewood, Colorado 80232‐6441, USA
1. I graduated from the Colorado School of Mines with a Bachelor of Science degree in Mining Engineering in 1977.
2. I am a Registered Professional Engineer in the State of Colorado (No. 19296), a Registered Professional Engineer in the State of Arizona (No. 15055) and a Registered Member of the Society for Mining, Metallurgy and Exploration, Inc. (No. 2762350RM) (all in good standing).
3. I have practiced my profession as a mining engineer continuously for 39 years since my graduation from college. I have been involved in open pit mine operations in both management and engineering positions, and have extensive experience in mine design and planning. I have conducted estimations of mineral resources and reserves, mine production schedules, equipment and workforce requirements, and capital and operating costs for numerous projects in North, Central and South America, Europe, Africa and Asia.
4. I have read the definition of “qualified person” set out in National Instrument 43‐101 (“NI 43‐101”) and certify that by reason of my education, affiliation with a professional association (as defined in NI 43‐101) and past relevant work experience, I fulfill the requirements to be a “qualified person” for the purposes of NI 43‐101.
5. I am responsible for the preparation of Item 15 and portions of Item 16 (subsections 16.1, 16.2, and 16.3) of the technical report titled “Technical Report on the Mineral Resources and Reserves of the Riotinto Copper Project, Located in Huelva Province, Spain (the “Technical Report”), and dated September __, 2016 for Atalaya Mining Plc.
6. I have not visited the subject property. My work on this project was performed under the direction of Alan C. Nobel, P.E., who has stated that he has visited the subject property.
7. I have had no prior involvement with the property that is the subject of the Technical Report.
8. As of the effective date of the Technical Report, to the best of my knowledge, information and belief, Item 15 and portions of Item 16 (subsections 16.1, 16.2, and 16.3) of the Technical Report contain all scientific and technical information that is required to be disclosed to make the Technical Report not misleading.
9. I am independent of the issuer, Atalaya Mining Plc, applying all of the tests in Section 1.5 of NI 43‐101.
10. I have read NI 43‐101 and Form 43‐101F1, and the Technical Report has been prepared in compliance with that instrument and form.
Dated this 27th day of September 2016. Original signed and sealed by
Signed, William L. Rose, P.E. 19296
TechnicalReportontheMineralResourcesandReservesoftheRiotintoCopperProject
Page28‐5
OreReservesEngineering September2016
E R
O
CERTIFICATE OF QUALIFIED PERSON
Jaye T Pickarts, P.E. 9792 West Unser Avenue Littleton, Colorado 80128 Telephone: 303 570 3370 Email: [email protected] I, Jaye T Pickarts, do hereby certify that: I am a self‐employed Metallurgical and Environmental Engineer, 9792 West Unser Avenue, Littleton, Colorado 80128 1. This certificate applies to the Technical Report titled “Technical Report on the Mineral Resources and Reserves
of the Riotinto Copper Project, Located in Huelva Province, Spain (the “Technical Report”), dated September, 2016 for Atalaya Mining Plc.
2. I graduated from the Montana College of Mineral Science and Technology, Butte, Montana, with a Bachelor of Science Degree in Mineral Processing Engineering in 1982.
3. I am a Licensed Professional Engineer in the State of Colorado, USA, PE37268, State of Wyoming, USA, PE13891 and the State of Nevada, USA, PE020893. In addition, I am a Registered Member of the Society for Mining, Metallurgy, and Exploration (SME) No. 2543360 and a Qualified Person member of the Mining and Metallurgical Society of America (MMSA).
4. I have practiced my profession continuously since 1982, and have been involved in mineral processing, and metallurgical and environmental engineering for a total of 34 years.
5. I have read the definition of “Qualified Person” set out in National Instrument 43‐101 (“NI 43‐101”) and certify that by reason of my education, registration as a professional engineer, affiliation with a professional association (as defined in NI 43‐101) and past relevant work experience, I fulfill the requirements to be a “Qualified Person” for the purposes of NI 43‐101.
6. I am responsible for the preparation of Chapters 1, 2, 3, 4, 5, 6, 17, 18, 19, 20, 21, 22, 24, 25, 26, and 27 of the Technical Report.
7. I have visited the property from February 19 through February 26, 2016.
8. I have not had prior involvement with the property that is the subject of the Technical Report.
9. I am independent of the issuer as described in Section 1.5 of NI 43‐101.
10. I have read NI 43‐101 and Form 43‐101F1, and Chapters 1, 2, 3, 4, 5, 6, 17, 18, 19, 20, 21, 22, 24, 25, 26, and 27 of the Technical Report have been prepared in compliance with the instrument and form.
11. At the effective date of the Technical Report, to the best of my information, knowledge and belief, Chapters 1, 2, 3, 4, 5, 6, 17, 18, 19, 20, 21, 22, 24, 25, 26, and 27 of the Technical Report contains all scientific and technical information that is required to be disclosed to make the Technical Report not misleading.
Dated this 27th day of September 2016. “Signed and Sealed, Jaye T. Pickarts, P.E. Jaye T. Pickarts, P.E. 37268/13891/020893
TechnicalReportontheMineralResourcesandReservesoftheRiotintoCopperProject
Page28‐6
OreReservesEngineering September2016
E R
O
CERTIFICATE OF QUALIFIED PERSON Juan J Anes, B.Sc., M.Sc., P.Eng. 409 56 St Delta, BC, Canada, V4L 1Z5 Telephone : 778 875 3676 Email: [email protected] I, Juan J. Anes, do hereby certify that: I am a self‐employed Metallurgical Engineer and Founder and Director of EM2PO, with address 409 56 St., Delta, BC, Canada, V4L 1 Z5 1. This certificate applies to the Technical Report titled “Technical Report on the Mineral Resources and
Reserves of the Riotinto Copper Project, Located in Huelva Province, Spain (the “Technical Report”), dated September, 2016 for Atalaya Mining Plc.
2. I am a graduate of the Universidad de Atacama University, located in Copiapo, Atacama, Chile with a Bachelor Degree in Engineering Sciences in 1996 and a Master Degree in Metallurgy in 2001.
3. I am a Licensed Professional Engineer in the Province of Ontario, Canada, License 100118632. In addition, I am a Registered Member of the Society for Mining, Metallurgy, and Exploration (SME) No. 04179444.
4. I have practiced my profession continuously since 1992, and have been involved in Mineral Processing and Metallurgical engineering for a total of 24 years.
5. I have read the definition of “Qualified Person” set out in National Instrument 43‐101 (“NI 43‐101”) and certify that by reason of my education, registration as a professional engineer, affiliation with a professional association (as defined in NI 43‐101) and past relevant work experience, I fulfill the requirements to be a “Qualified Person” for the purposes of NI 43‐101.
6. I am responsible for the collection and analysis of the metallurgical data and the preparation of Chapter 13, Mineral Processing and Metallurgical Testing. In addition, I assisted in the preparation of Chapter 17, Recovery Methods, and Chapter 21, Capital and Operating Costs.
7. I have visited the property several times in 2015 and 2016 and worked together with the rest of the QP’s mentioned herein preparing this technical report on site from February 19 through February 26, 2016. My most recent visit to the property was July 31st, 2016.
8. I am an independent consultant contracted to Atalaya Mining to assist with the continuous improvement of the plant expansion and I have not had prior involvement with the property that is the subject of the Technical Report.
9. I am independent of the issuer as described in Section 1.5 of NI 43‐101.
10. I have read NI 43‐101 and Form 43‐101F1, and I can indicate that Chapters 13 and 17 of the Technical Report have been prepared in compliance with the instrument and form.
11. At the effective date of the Technical Report, to the best of my information, knowledge and belief, Chapters 13 and 17 of the Technical Report contains all scientific and technical information that is required to be disclosed to make the Technical Report not misleading.
Dated this 27th day of September 2016. “Signed and Sealed, Juan J. Anes, P.Eng Juan J. Anes, P.Eng. 100118632/04179444