Embed Size (px)
Citation preview
December 2016
1
Technical Report
September 2017
MONTHLY MOBILE QOS REPORT
Comparative Quality of Service Report for
Mobile Networks
May 2017
2
Contents
1. Glossary of Terms .............................................................................................................................. 4
2. Key Performance Indicators (KPIs) ............................................................................................. 4
3. KPIs & Threshold Used in Report ................................................................................................. 6
4. Findings 1: 2G Networks................................................................................................................. 7
5. Findings 2: Graphs .......................................................................................................................... 10
6. Findings 3: CELL Outages ............................................................................................................. 12
7. Findings 4: Percentage Change in Traffic ................................................................................ 12
7.1. Voice Traffic ................................................................................................................................. 12
7.2. Data Traffic ................................................................................................................................... 13
8. Number of Cells Deployed ............................................................................................................. 13
9. Geographic Coverage By Networks ............................................................................................ 14
9.1. Geographic Coverage Maps ...................................................................................................... 14
10. Recommendations ....................................................................................................................... 18
11. Appendix 1 – Regional KPIs Per Network ............................................................................ 19
May 2017
3
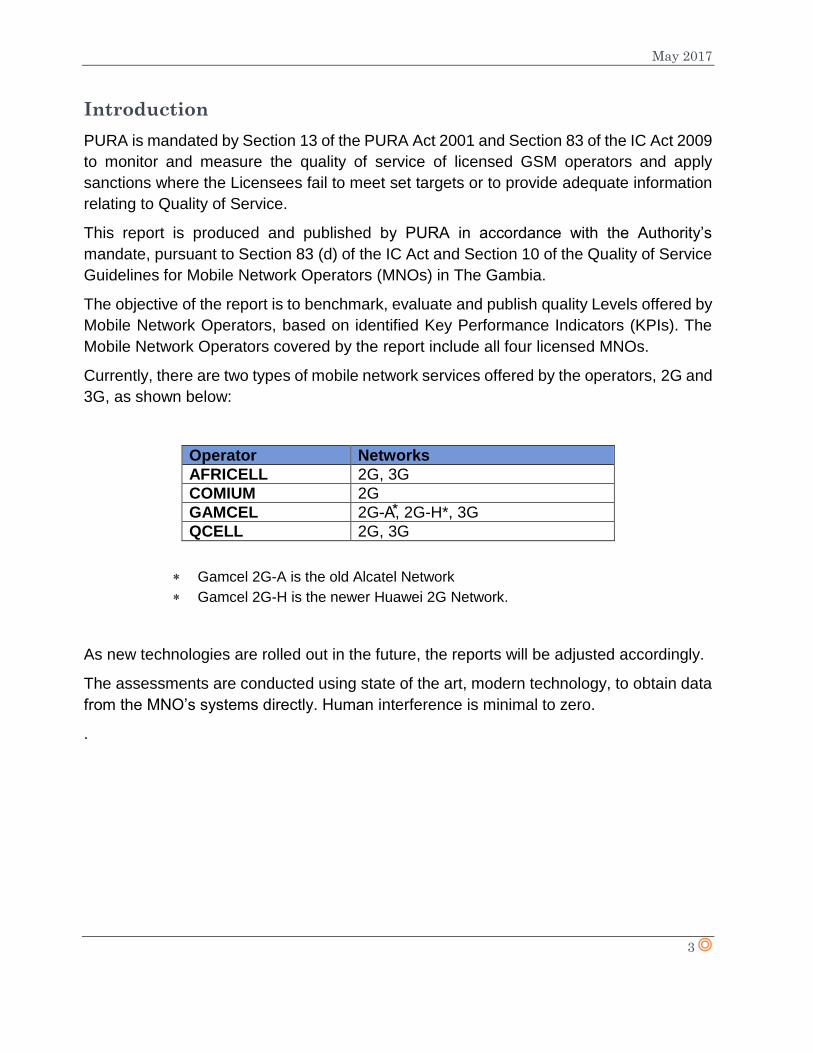
Introduction
PURA is mandated by Section 13 of the PURA Act 2001 and Section 83 of the IC Act 2009
to monitor and measure the quality of service of licensed GSM operators and apply
sanctions where the Licensees fail to meet set targets or to provide adequate information
relating to Quality of Service.
This report is produced and published by PURA in accordance with the Authority’s
mandate, pursuant to Section 83 (d) of the IC Act and Section 10 of the Quality of Service
Guidelines for Mobile Network Operators (MNOs) in The Gambia.
The objective of the report is to benchmark, evaluate and publish quality Levels offered by
Mobile Network Operators, based on identified Key Performance Indicators (KPIs). The
Mobile Network Operators covered by the report include all four licensed MNOs.
Currently, there are two types of mobile network services offered by the operators, 2G and
3G, as shown below:
Operator Networks
AFRICELL 2G, 3G
COMIUM 2G
GAMCEL 2G-A,⃰ 2G-H*, 3G
QCELL 2G, 3G
Gamcel 2G-A is the old Alcatel Network
Gamcel 2G-H is the newer Huawei 2G Network.
As new technologies are rolled out in the future, the reports will be adjusted accordingly.
The assessments are conducted using state of the art, modern technology, to obtain data
from the MNO’s systems directly. Human interference is minimal to zero.
.
May 2017
4
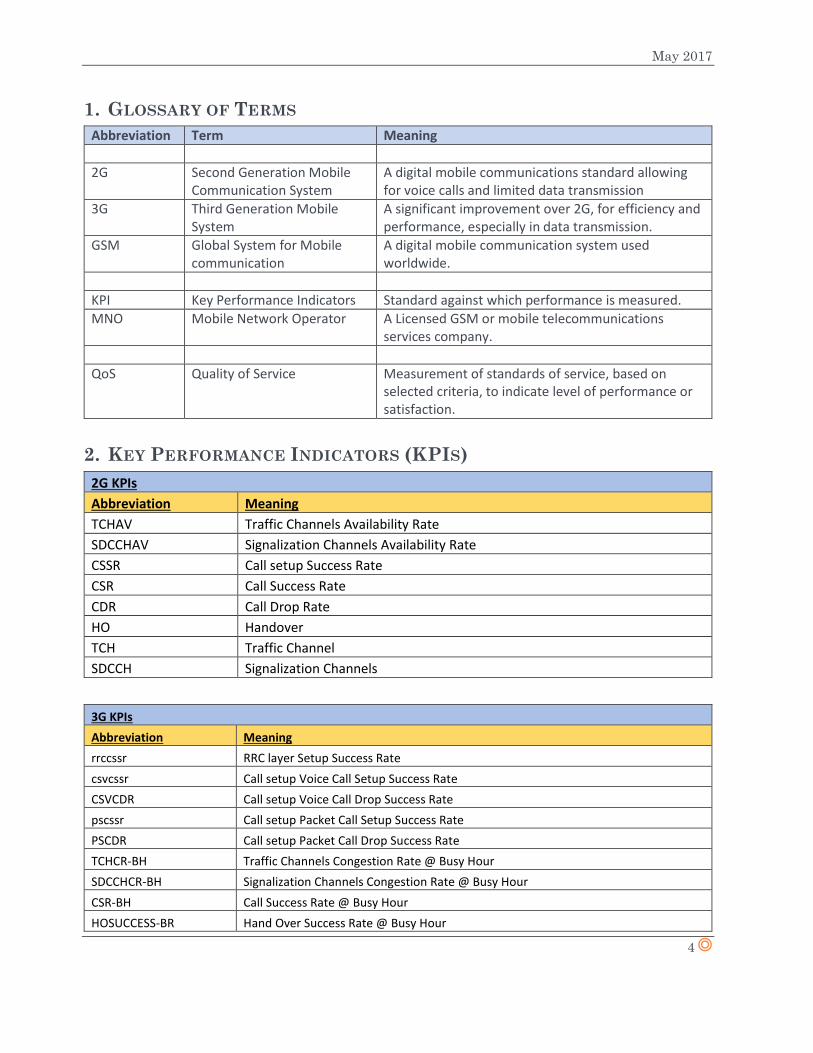
1. GLOSSARY OF TERMS
Abbreviation Term Meaning
2G Second Generation Mobile Communication System
A digital mobile communications standard allowing for voice calls and limited data transmission
3G Third Generation Mobile System
A significant improvement over 2G, for efficiency and performance, especially in data transmission.
GSM Global System for Mobile communication
A digital mobile communication system used worldwide.
KPI Key Performance Indicators Standard against which performance is measured.
MNO Mobile Network Operator A Licensed GSM or mobile telecommunications services company.
QoS Quality of Service Measurement of standards of service, based on selected criteria, to indicate level of performance or satisfaction.
2. KEY PERFORMANCE INDICATORS (KPIS)
2G KPIs
Abbreviation Meaning
TCHAV Traffic Channels Availability Rate
SDCCHAV Signalization Channels Availability Rate
CSSR Call setup Success Rate
CSR Call Success Rate
CDR Call Drop Rate
HO Handover
TCH Traffic Channel
SDCCH Signalization Channels
3G KPIs
Abbreviation Meaning
rrccssr RRC layer Setup Success Rate
csvcssr Call setup Voice Call Setup Success Rate
CSVCDR Call setup Voice Call Drop Success Rate
pscssr Call setup Packet Call Setup Success Rate
PSCDR Call setup Packet Call Drop Success Rate
TCHCR-BH Traffic Channels Congestion Rate @ Busy Hour
SDCCHCR-BH Signalization Channels Congestion Rate @ Busy Hour
CSR-BH Call Success Rate @ Busy Hour
HOSUCCESS-BR Hand Over Success Rate @ Busy Hour
May 2017
5
CS RAB SSR Setup Success rate for a radio access resources (bearer) on the circuit switch (voice communication)
PS RAB SSR Setup Success rate for a radio access resources (bearer) on the Packet switch (data communication)
RRC Call Setup Success Rate the global Success rate of obtaining a connection session to the RRC layer
RRC Call Setup Success Rate @ BH at busy hour Success rate of obtaining a connection session to the RRC layer
CS voice Call Setup Success Rate the global Success rate of obtaining a calling channel for voice communication
CS voice Call Setup Success Rate @ BH at busy hour Success rate of obtaining a calling channel for voice communication
CS voice Call Drop Rate the probability of a voice call drop after initiated
CS voice Call Drop Rate @ BH the probability of a voice call drop after initiated at busy hour
CS HO 3G to 2G the Handover Success rate for swapping a communication from the 3G network to the 2G one
CS HO 3G to 2G @ BH the Handover Success rate for swapping a communication from the 3G network to the 2G one at busy hour
HSDPA Debit the global average throughput
HSDPA Debit @ BH the average throughput at busy hour
CS Data Call Setup Success Rate the global call setup Success rate of a data section on the circuit switch (GPRS)
CS Data Call Setup Success Rate @ BH at busy hour call setup Success rate of a data section on the circuit switch (GPRS)
PS Call Setup Success Rate the global call setup Success rate of a data section on the Packet switch
PS Call Setup Success Rate @ BH at busy hour call setup Success rate of a data section on the Packet switch
CS Data Call Drop Rate the global call drop rate in the circuit switch (voice)
CS Data Call Drop Rate @ BH at busy hour call drop rate in the circuit switch (voice)
PS Call Drop Rate the global call drop rate in the Packet switch
PS Call Drop Rate @ BH at busy hour call drop rate in the Packet switch
PS HO 3G to 2G the global handover Success rate from Packet switch to edge
PS HO 3G to 2G @ BH at busy hour handover Success rate from Packet switch to edge
Soft HO Success Rate Global handover Success rate on soft mode (make-before-break)
Soft HO Success Rate @ BH At busy hour handover Success rate on soft mode (make-before-break)
CS Rab Setup Success Rate
Global setup Success rate for a radio access resources (bearer) on the circuit switch (voice communication)
CS Rab Setup Success Rate @ BH
At busy hour setup Success rate for a radio access resources (bearer) on the circuit switch (voice communication)
PS Rab Setup Success Rate
Global setup Success rate for a radio access resources (bearer) on the Packet switch (data communication)
PS Rab Setup Success Rate @ BH
At busy hour setup Success rate for a radio access resources (bearer) on the Packet switch (data communication)
May 2017
6
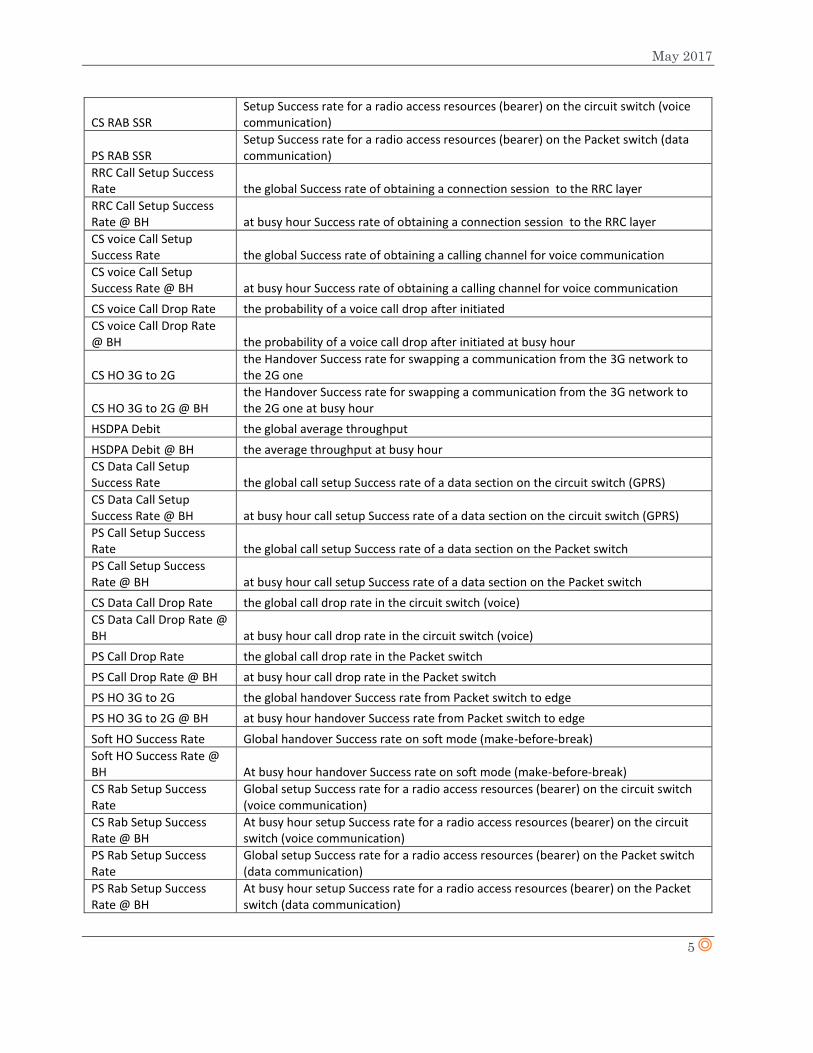
3. KPIS & THRESHOLD USED IN REPORT
2G KPIS & THRESHOLDS
Item# KPI Compliance Threshold
1 TCH Availability @ Busy Hour ≥ 95%
2 SDDCCH Availability @ BH ≥ 95%
3 CSSR @ BH ≥ 95%
4 CSR @ BH ≥ 95%
5 TCH Congestion Rate @ BH ≤ 2%
6 TCH Drop Rate @ BH ≤ 2%
7 SDCCH Congestion Rate @ BH ≤ 2%
8 SDCCH Drop Rate @ BH ≤ 2%
9 Call Drop Rate @ BH ≤ 2%
10 HO Success Rate @ BH ≥ 95%
11 Data Availability Rate =100%
3G KPIS & THRESHOLDS
Item# KPI Compliance Threshold
1 RRC Call Success Rate @ BH ≥ 95%
2 CS RAB Setup Success Rate @ BH ≥ 95%
3 PS RAB Setup Success Rate @ BH ≥ 95%
4 CS Voice Call Setup Success @ BH ≥ 95%
5 CS Data Call Setup Success Rate @ BH ≥ 95%
6 PS Call Setup Success Rate @ BH ≥ 95%
7 CS Voice Call Drop Rate @ BH ≤ 2%
8 CS Data Call Drop Rate @ BH ≤ 2%
9 PS Call Drop Rate @ BH ≤ 2%
10 Soft HO Success Rate @ BH ≥ 95%
11 CS321InterRatHoSR ≥ 95%
12 PS321InterRatHoSR ≥ 95%
13 Data Availability Rate 100%
May 2017
7
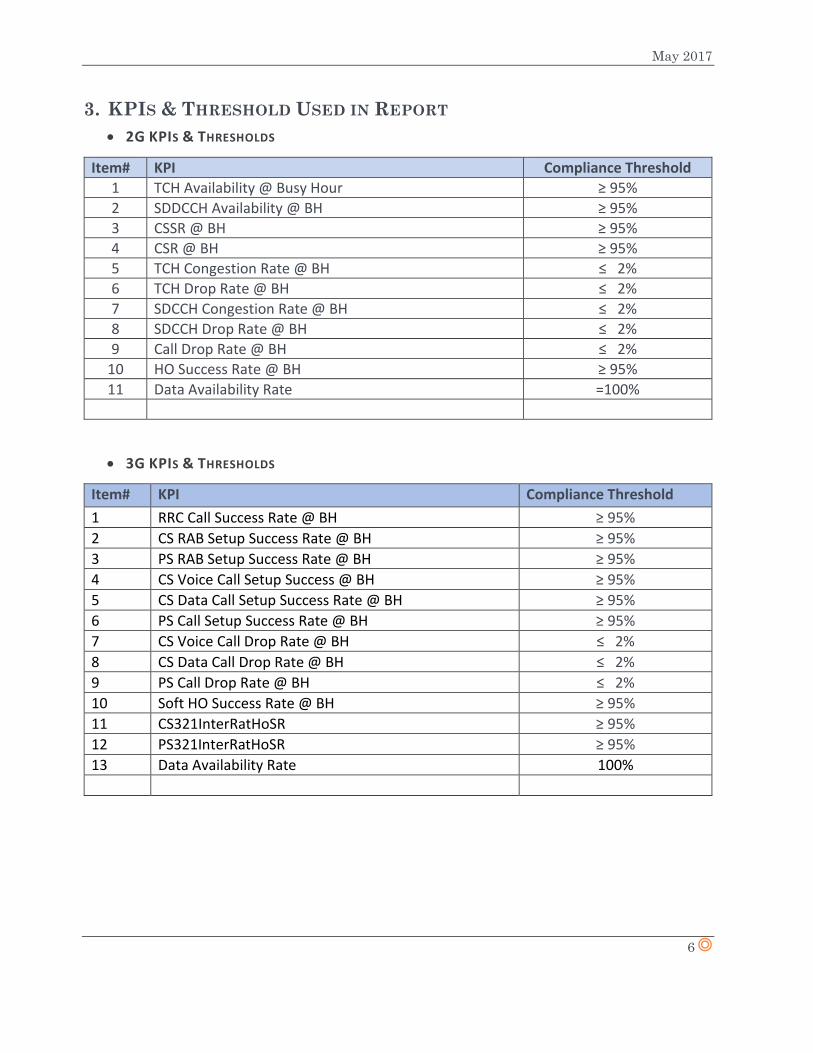
4. FINDINGS 1: 2G NETWORKS
4.1. COUNTRYWIDE 2G QOS KPIS - @ BUSY HOUR
No KPI Thres-hold %
AFRICELL 2G
COMIUM 2G
GAMCEL 2G-A
GAMCEL 2G-H
GAMCEL 2G A & H
Qcell 2G
1 TCH Availability ≥ 95% 99.37 98.62 47.68 98.44 73.06 97.38
2 SDCCH Availability ≥ 95% 99.47 97.93 66.90 98.92 82.91 97.83
3 CSSR ≥ 95% 95.10 93.22 91.21 95.85 93.53 91.85
4 CSR ≥ 95% 94.25 90.60 87.32 95.10 91.21 90.66
5 HO Success ≥ 95% 98.43 94.97 77.63 97.64 87.64 94.17
6 TCH Congestion ≤ 2% 0.18 0.93 0.05 0.08 0.07 2.22
7 TCH Drop Rate ≤ 2% 4.88 6.75 0.28 4.53 2.41 8.15
8 SDCCH Congestion ≤ 2% 0.13 1.44 0.33 0.03 0.18 2.22
9 SDCCH Drop Rate ≤ 2% 0.44 1.29 1.93 0.60 1.27 1.03
10 Call Drop Rate ≤ 2% 0.89 2.82 3.53 0.77 2.15 1.29
Number of Cells 475 272 78 241 319 448
Offline Cells 9 0 10 27 37 32
AFRICELL 2G
During the month of September 2017, the AFRICELL 2G network had the following reported:
Compliance rate of 8/10. The network failed on CSR and TCH Drop Rate. Out of 475 Cells deployed at end of September 2017, 9 Cells reported
downtimes during the month, which were not reported to the Authority as required in the Fault Reporting Guidelines
COMIUM 2G
Compliance rate of 5/10. The network failed on CSSR, CSR, HO Success, TCH Drop Rate and Call Drop
Rates. 272 Cells deployed at end of September 2017 Zero (0) Cells reported downtimes during the month.
May 2017
8
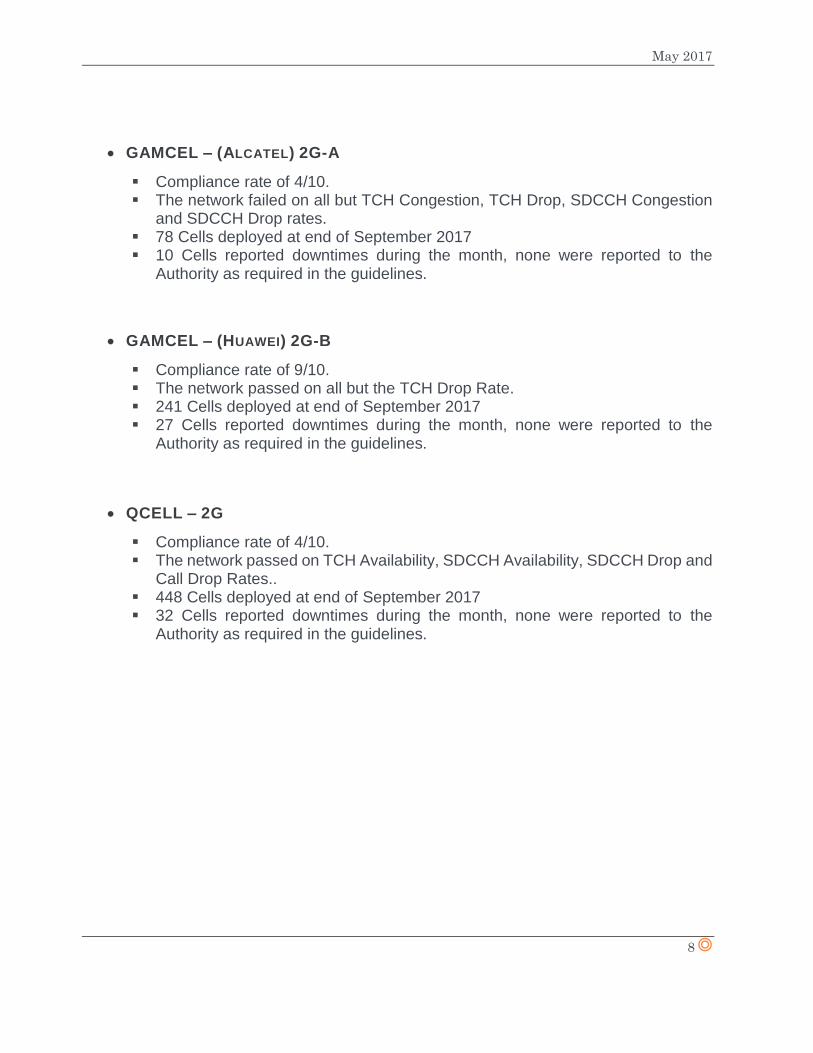
GAMCEL – (ALCATEL) 2G-A
Compliance rate of 4/10. The network failed on all but TCH Congestion, TCH Drop, SDCCH Congestion
and SDCCH Drop rates. 78 Cells deployed at end of September 2017 10 Cells reported downtimes during the month, none were reported to the
Authority as required in the guidelines.
GAMCEL – (HUAWEI) 2G-B
Compliance rate of 9/10. The network passed on all but the TCH Drop Rate. 241 Cells deployed at end of September 2017 27 Cells reported downtimes during the month, none were reported to the
Authority as required in the guidelines.
QCELL – 2G
Compliance rate of 4/10. The network passed on TCH Availability, SDCCH Availability, SDCCH Drop and
Call Drop Rates.. 448 Cells deployed at end of September 2017 32 Cells reported downtimes during the month, none were reported to the
Authority as required in the guidelines.
May 2017
9
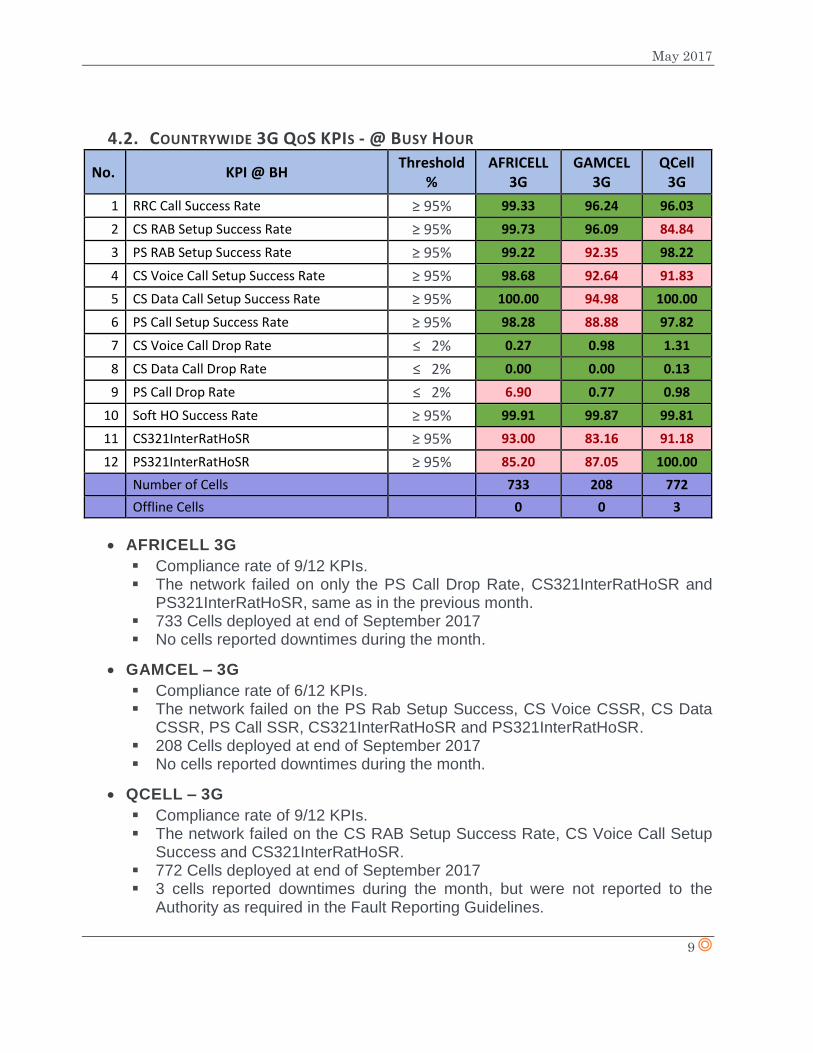
4.2. COUNTRYWIDE 3G QOS KPIS - @ BUSY HOUR
No. KPI @ BH Threshold
% AFRICELL
3G GAMCEL
3G QCell
3G
1 RRC Call Success Rate ≥ 95% 99.33 96.24 96.03
2 CS RAB Setup Success Rate ≥ 95% 99.73 96.09 84.84
3 PS RAB Setup Success Rate ≥ 95% 99.22 92.35 98.22
4 CS Voice Call Setup Success Rate ≥ 95% 98.68 92.64 91.83
5 CS Data Call Setup Success Rate ≥ 95% 100.00 94.98 100.00
6 PS Call Setup Success Rate ≥ 95% 98.28 88.88 97.82
7 CS Voice Call Drop Rate ≤ 2% 0.27 0.98 1.31
8 CS Data Call Drop Rate ≤ 2% 0.00 0.00 0.13
9 PS Call Drop Rate ≤ 2% 6.90 0.77 0.98
10 Soft HO Success Rate ≥ 95% 99.91 99.87 99.81
11 CS321InterRatHoSR ≥ 95% 93.00 83.16 91.18
12 PS321InterRatHoSR ≥ 95% 85.20 87.05 100.00
Number of Cells 733 208 772
Offline Cells 0 0 3
AFRICELL 3G
Compliance rate of 9/12 KPIs. The network failed on only the PS Call Drop Rate, CS321InterRatHoSR and
PS321InterRatHoSR, same as in the previous month. 733 Cells deployed at end of September 2017 No cells reported downtimes during the month.
GAMCEL – 3G
Compliance rate of 6/12 KPIs. The network failed on the PS Rab Setup Success, CS Voice CSSR, CS Data
CSSR, PS Call SSR, CS321InterRatHoSR and PS321InterRatHoSR. 208 Cells deployed at end of September 2017 No cells reported downtimes during the month.
QCELL – 3G
Compliance rate of 9/12 KPIs. The network failed on the CS RAB Setup Success Rate, CS Voice Call Setup
Success and CS321InterRatHoSR. 772 Cells deployed at end of September 2017 3 cells reported downtimes during the month, but were not reported to the
Authority as required in the Fault Reporting Guidelines.
May 2017
10
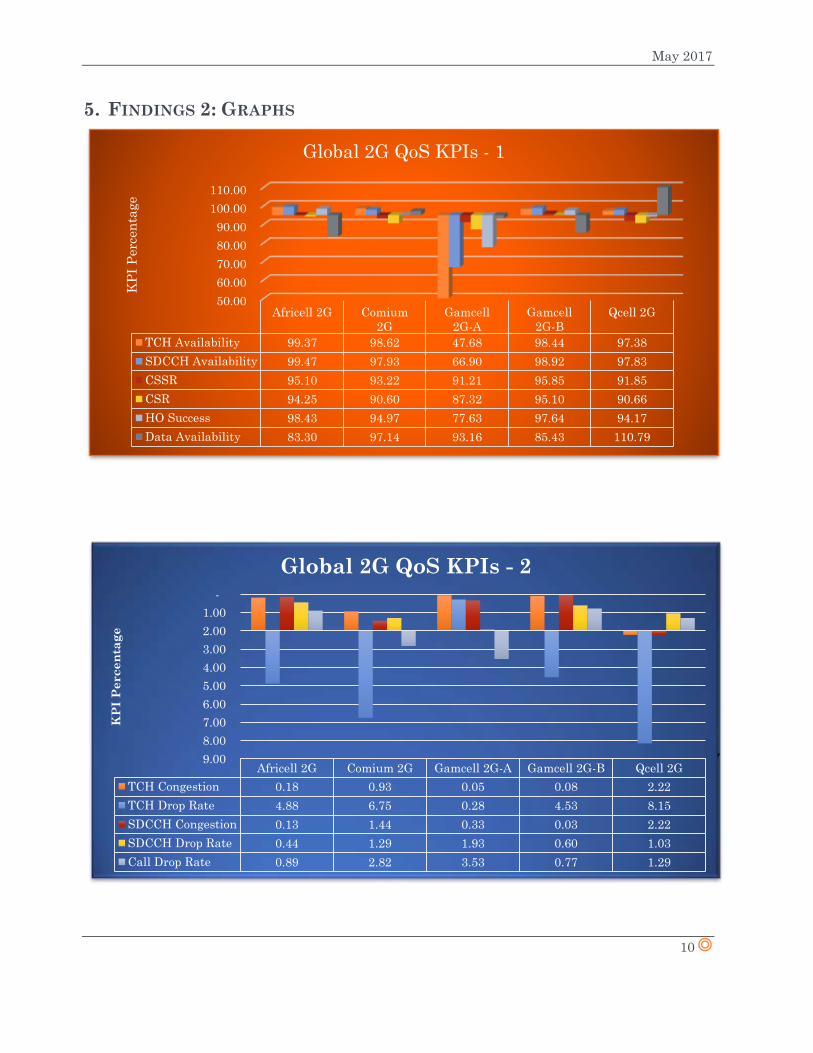
5. FINDINGS 2: GRAPHS
50.00
60.00
70.00
80.00
90.00
100.00
110.00
Africell 2G Comium
2G
Gamcell
2G-A
Gamcell
2G-B
Qcell 2G
TCH Availability 99.37 98.62 47.68 98.44 97.38
SDCCH Availability 99.47 97.93 66.90 98.92 97.83
CSSR 95.10 93.22 91.21 95.85 91.85
CSR 94.25 90.60 87.32 95.10 90.66
HO Success 98.43 94.97 77.63 97.64 94.17
Data Availability 83.30 97.14 93.16 85.43 110.79
KP
I P
erc
en
tage
Global 2G QoS KPIs - 1
Africell 2G Comium 2G Gamcell 2G-A Gamcell 2G-B Qcell 2G
TCH Congestion 0.18 0.93 0.05 0.08 2.22
TCH Drop Rate 4.88 6.75 0.28 4.53 8.15
SDCCH Congestion 0.13 1.44 0.33 0.03 2.22
SDCCH Drop Rate 0.44 1.29 1.93 0.60 1.03
Call Drop Rate 0.89 2.82 3.53 0.77 1.29
-
1.00
2.00
3.00
4.00
5.00
6.00
7.00
8.00
9.00
KP
I P
ercen
tag
e
Global 2G QoS KPIs - 2
Threshold
May 2017
11
RRC
Call
Success
Rate
CS
RAB
Setup
Success
Rate
PS
RAB
Setup
Success
Rate
CS
Voice
Call
Setup
Success
CS
Data
Call
Setup
Success
Rate
PS Call
Setup
Success
Rate
Soft
HO
Success
Rate
CS321I
nterRat
HoSR
PS321I
nterRat
HoSR
Data
Availab
ility
Rate
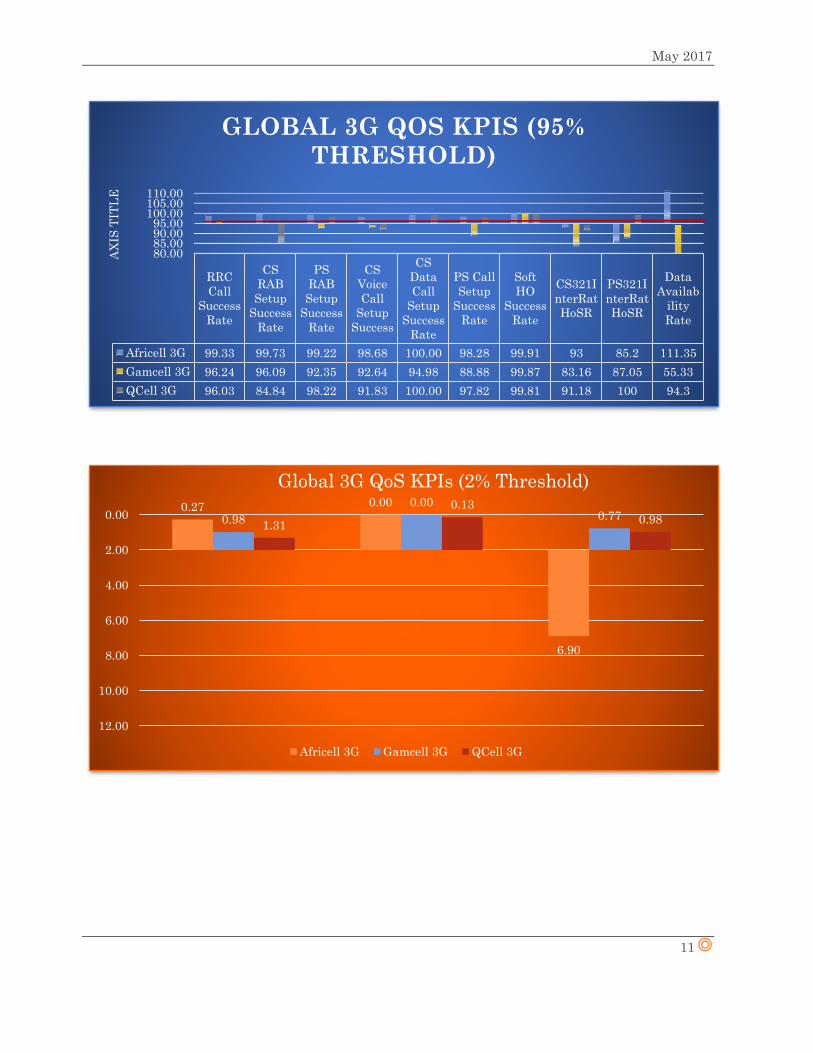
Africell 3G 99.33 99.73 99.22 98.68 100.00 98.28 99.91 93 85.2 111.35
Gamcell 3G 96.24 96.09 92.35 92.64 94.98 88.88 99.87 83.16 87.05 55.33
QCell 3G 96.03 84.84 98.22 91.83 100.00 97.82 99.81 91.18 100 94.3
80.0085.0090.0095.00
100.00105.00110.00
AX
IS T
ITL
E
GLOBAL 3G QOS KPIS (95%
THRESHOLD)
0.27 0.00
6.90
0.98
0.000.77
1.31
0.13
0.980.00
2.00
4.00
6.00
8.00
10.00
12.00
Global 3G QoS KPIs (2% Threshold)
Africell 3G Gamcell 3G QCell 3G
May 2017
12
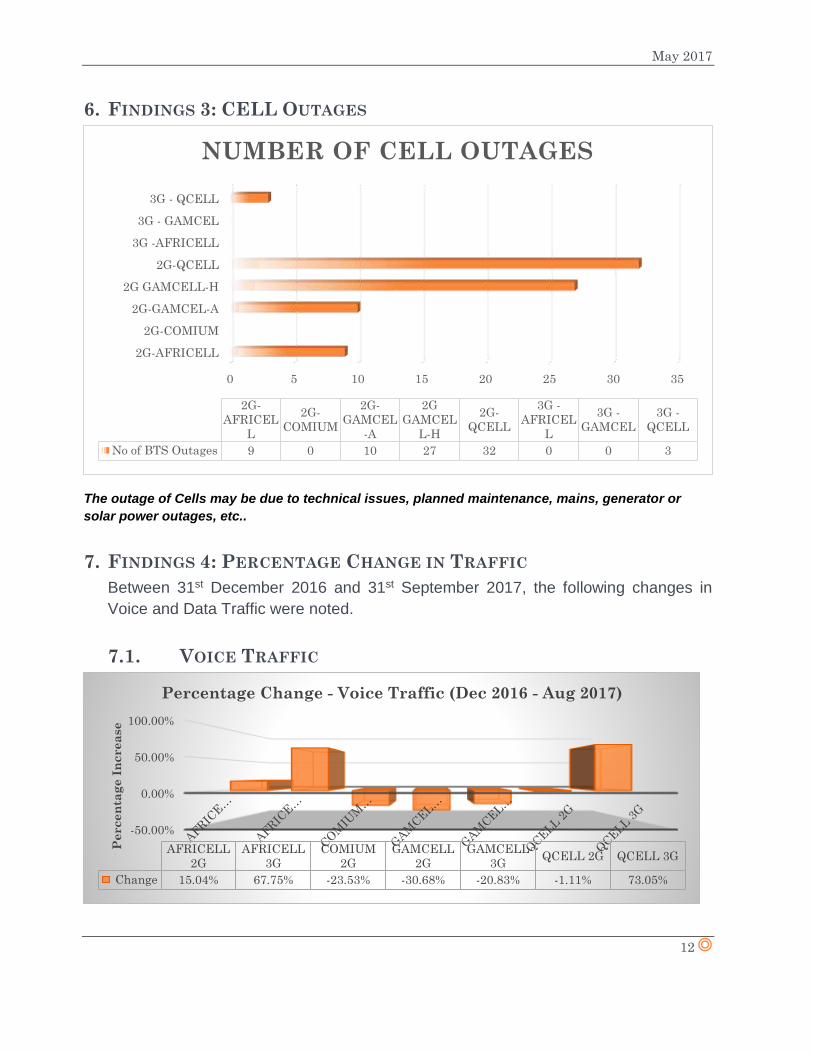
6. FINDINGS 3: CELL OUTAGES
The outage of Cells may be due to technical issues, planned maintenance, mains, generator or
solar power outages, etc..
7. FINDINGS 4: PERCENTAGE CHANGE IN TRAFFIC
Between 31st December 2016 and 31st September 2017, the following changes in
Voice and Data Traffic were noted.
7.1. VOICE TRAFFIC
0 5 10 15 20 25 30 35
2G-AFRICELL
2G-COMIUM
2G-GAMCEL-A
2G GAMCELL-H
2G-QCELL
3G -AFRICELL
3G - GAMCEL
3G - QCELL
2G-
AFRICEL
L
2G-
COMIUM
2G-
GAMCEL
-A
2G
GAMCEL
L-H
2G-
QCELL
3G -
AFRICEL
L
3G -
GAMCEL
3G -
QCELL
No of BTS Outages 9 0 10 27 32 0 0 3
NUMBER OF CELL OUTAGES
-50.00%
0.00%
50.00%
100.00%
Pe
rce
nta
ge
In
cre
ase
AFRICELL
2G
AFRICELL
3G
COMIUM
2G
GAMCELL
2G
GAMCELL
3GQCELL 2G QCELL 3G
Change 15.04% 67.75% -23.53% -30.68% -20.83% -1.11% 73.05%
Percentage Change - Voice Traffic (Dec 2016 - Aug 2017)
May 2017
13
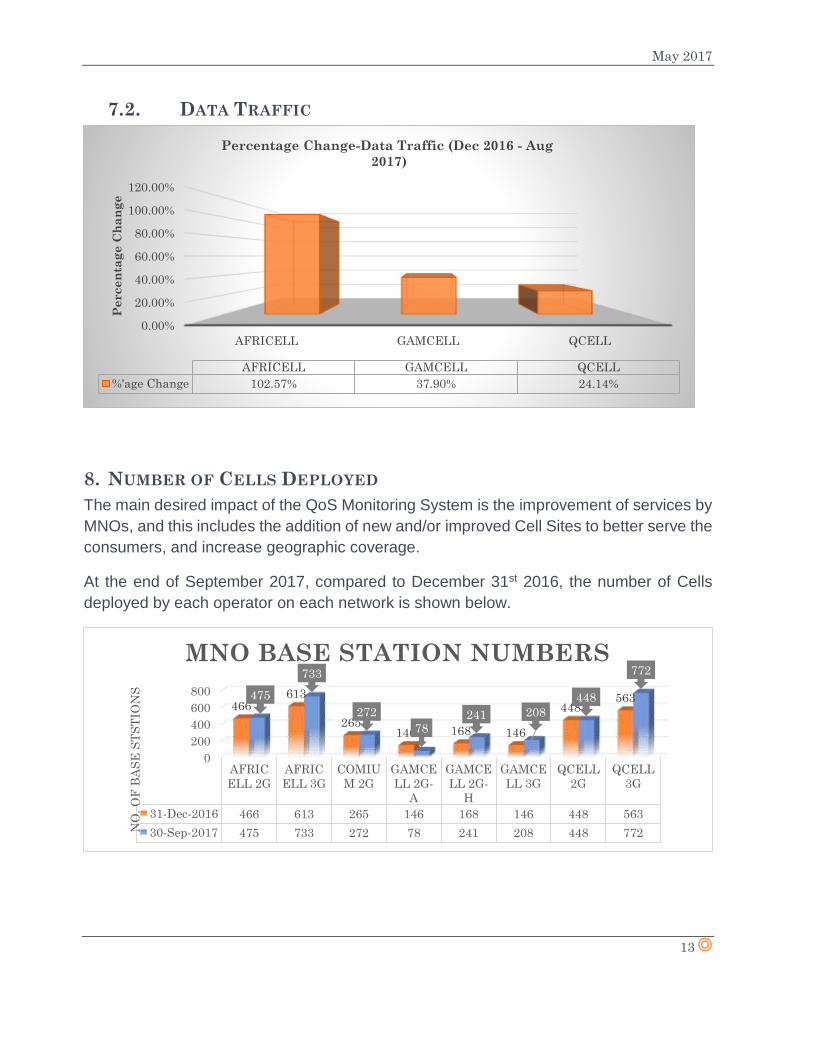
7.2. DATA TRAFFIC
8. NUMBER OF CELLS DEPLOYED
The main desired impact of the QoS Monitoring System is the improvement of services by
MNOs, and this includes the addition of new and/or improved Cell Sites to better serve the
consumers, and increase geographic coverage.
At the end of September 2017, compared to December 31st 2016, the number of Cells
deployed by each operator on each network is shown below.
0.00%
20.00%
40.00%
60.00%
80.00%
100.00%
120.00%
AFRICELL GAMCELL QCELL
Percen
tag
e C
ha
ng
e
AFRICELL GAMCELL QCELL
%'age Change 102.57% 37.90% 24.14%
Percentage Change-Data Traffic (Dec 2016 - Aug
2017)
0
200
400
600
800
AFRIC
ELL 2G
AFRIC
ELL 3G
COMIU
M 2G
GAMCE
LL 2G-
A
GAMCE
LL 2G-
H
GAMCE
LL 3G
QCELL
2G
QCELL
3G
31-Dec-2016 466 613 265 146 168 146 448 563
30-Sep-2017 475 733 272 78 241 208 448 772
466613
265146 168 146
448563475
733
272
78241 208
448
772
NO
. O
F B
AS
E S
TS
TIO
NS
MNO BASE STATION NUMBERS
May 2017
14
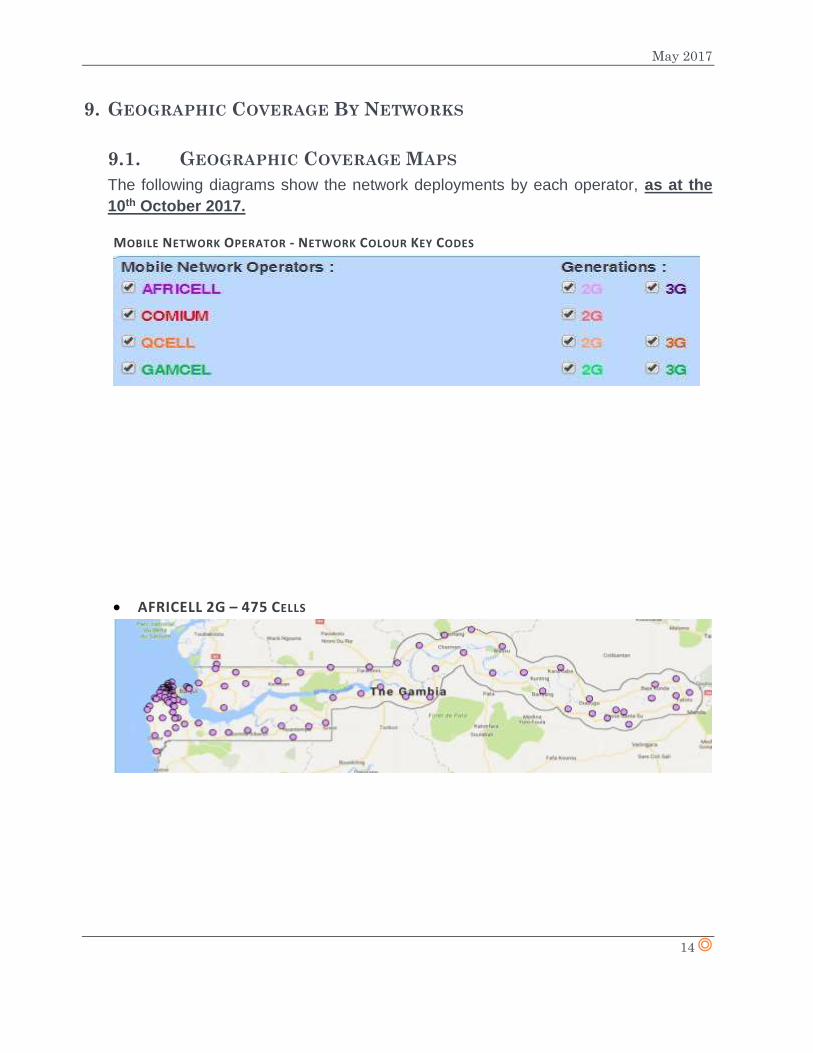
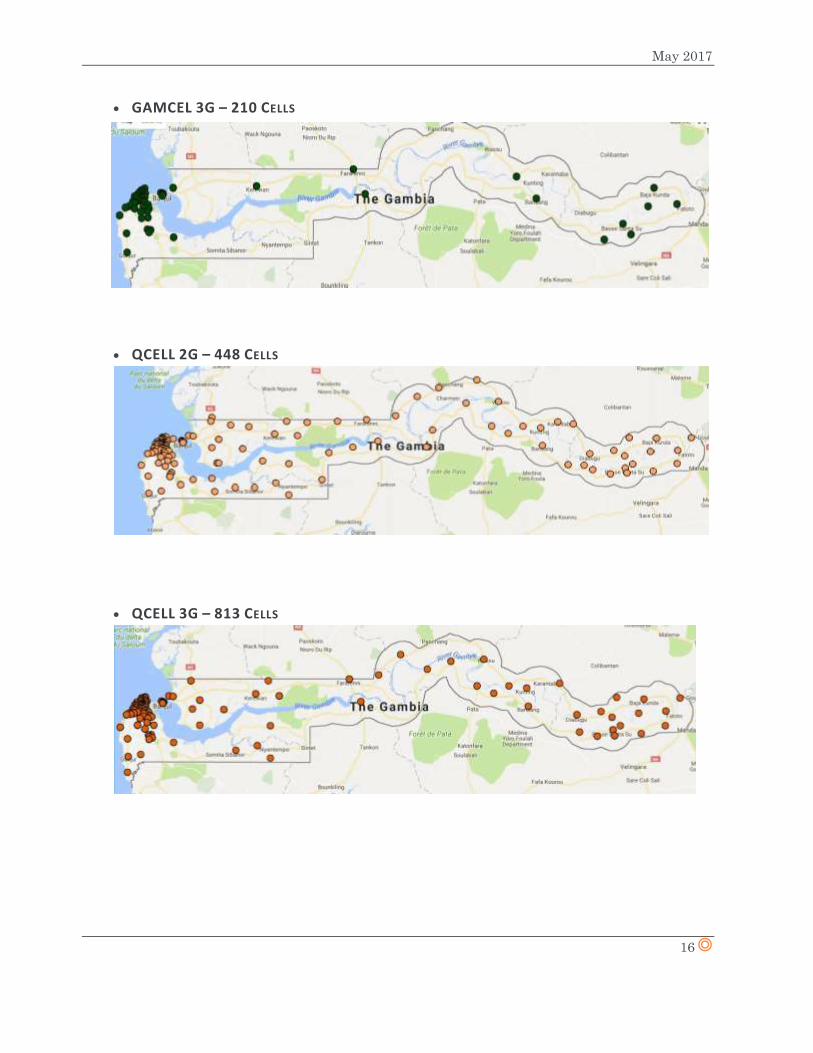
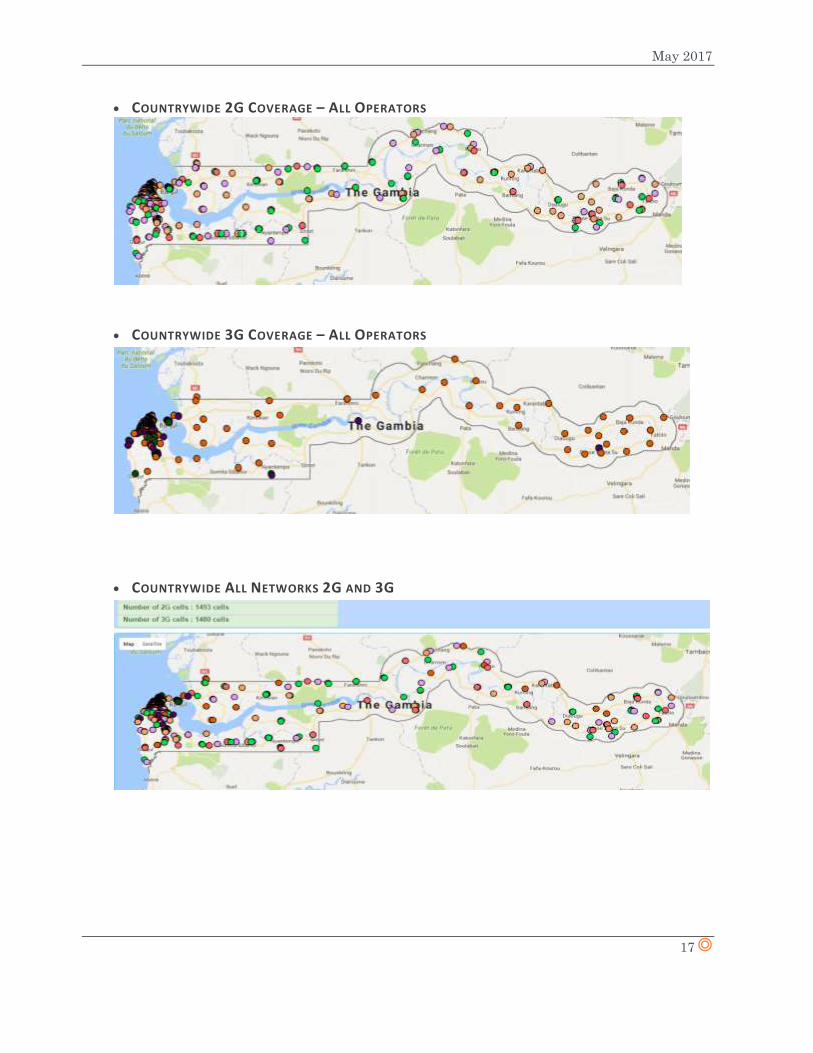
9. GEOGRAPHIC COVERAGE BY NETWORKS
9.1. GEOGRAPHIC COVERAGE MAPS
The following diagrams show the network deployments by each operator, as at the
10th October 2017.
MOBILE NETWORK OPERATOR - NETWORK COLOUR KEY CODES
AFRICELL 2G – 475 CELLS
May 2017
15
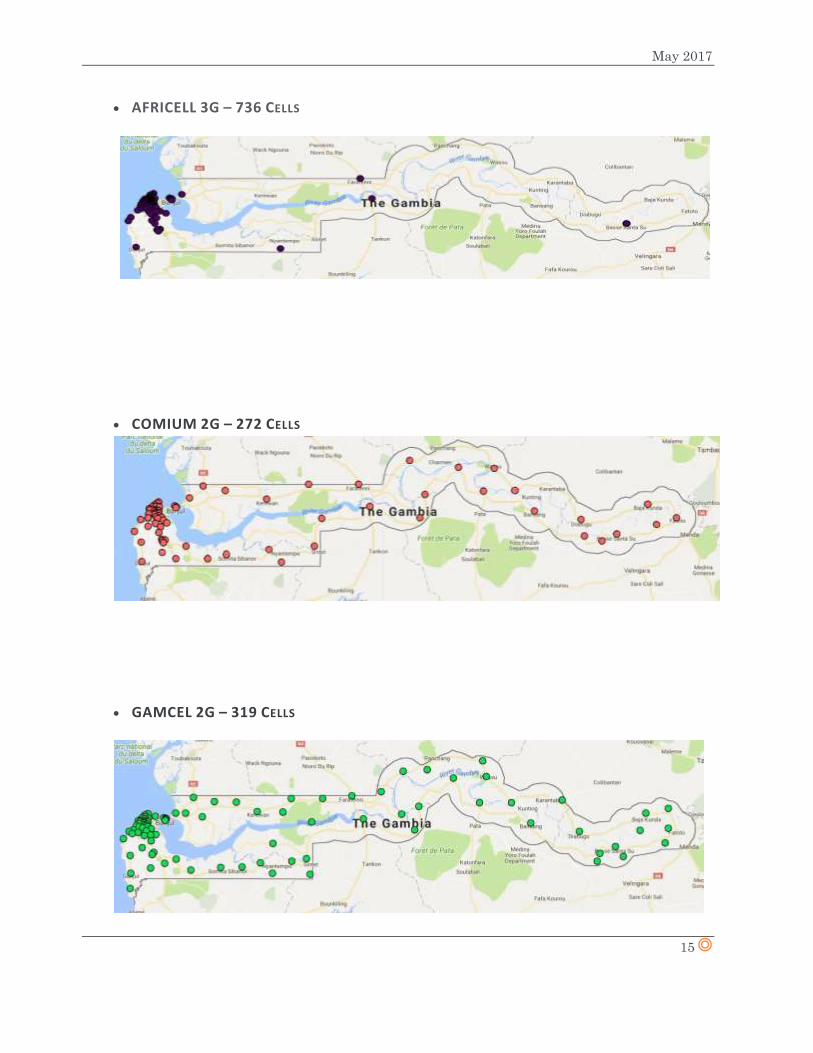
AFRICELL 3G – 736 CELLS
COMIUM 2G – 272 CELLS
GAMCEL 2G – 319 CELLS
May 2017
16
GAMCEL 3G – 210 CELLS
QCELL 2G – 448 CELLS
QCELL 3G – 813 CELLS
May 2017
17
COUNTRYWIDE 2G COVERAGE – ALL OPERATORS
COUNTRYWIDE 3G COVERAGE – ALL OPERATORS
COUNTRYWIDE ALL NETWORKS 2G AND 3G
May 2017
18
10. RECOMMENDATIONS
1.1. Contents from this technical report will be used and put in an appropriate
format for publication.
1.2. As agreed with all Mobile Network Operators, they should ensure that faults
are reported to the Authority, by email, in line with the fault reporting
Guidelines. Planned maintenance or other offline periods should be
reported prior to the event(s).
1.3. All new Cells should be reported to the Authority in writing, prior to putting
them in service, as indicated in the QoS Guidelines.
1.4. Requests for QoS information or updates should be fulfilled as a matter of
priority, on or before the stated deadline in the request.
1.5. Data / information shall be provided to the Authority promptly and
consistently in prescribed standards. Deviation from the standards may be
considered non-compliance.
1.6. NO changes shall be made on the approved counters for the LPI Data
without the express consent of the Authority. Such requests for approval
must be in writing or by email. Non-compliance in this issue shall be
considered serious a breach and will attract immediate regulatory action.
1.7. With effect from September 2017, the monthly comparative performance
reports, along with other pertinent analyses and reports may be published
on the PURA website as deemed necessary by the Authority.
April 2017
19
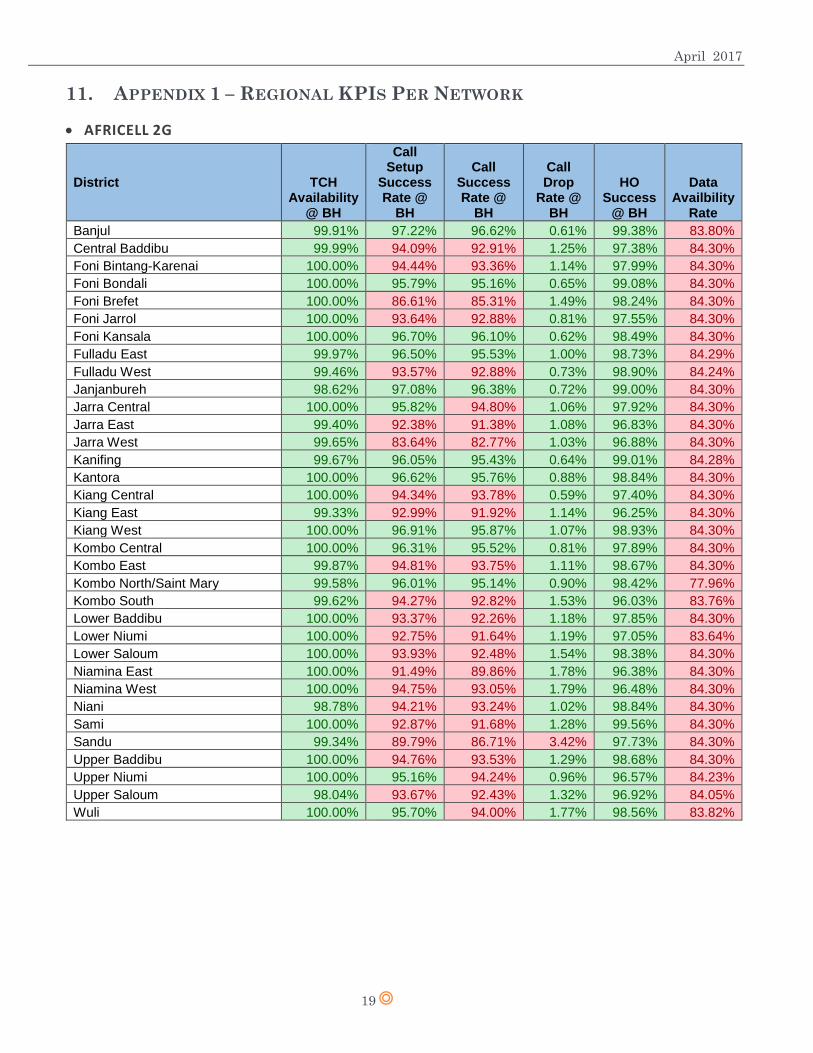
11. APPENDIX 1 – REGIONAL KPIS PER NETWORK
AFRICELL 2G
District TCH Availability
@ BH
Call Setup
Success Rate @
BH
Call Success Rate @
BH
Call Drop
Rate @ BH
HO Success
@ BH
Data Availbility
Rate
Banjul 99.91% 97.22% 96.62% 0.61% 99.38% 83.80%
Central Baddibu 99.99% 94.09% 92.91% 1.25% 97.38% 84.30%
Foni Bintang-Karenai 100.00% 94.44% 93.36% 1.14% 97.99% 84.30%
Foni Bondali 100.00% 95.79% 95.16% 0.65% 99.08% 84.30%
Foni Brefet 100.00% 86.61% 85.31% 1.49% 98.24% 84.30%
Foni Jarrol 100.00% 93.64% 92.88% 0.81% 97.55% 84.30%
Foni Kansala 100.00% 96.70% 96.10% 0.62% 98.49% 84.30%
Fulladu East 99.97% 96.50% 95.53% 1.00% 98.73% 84.29%
Fulladu West 99.46% 93.57% 92.88% 0.73% 98.90% 84.24%
Janjanbureh 98.62% 97.08% 96.38% 0.72% 99.00% 84.30%
Jarra Central 100.00% 95.82% 94.80% 1.06% 97.92% 84.30%
Jarra East 99.40% 92.38% 91.38% 1.08% 96.83% 84.30%
Jarra West 99.65% 83.64% 82.77% 1.03% 96.88% 84.30%
Kanifing 99.67% 96.05% 95.43% 0.64% 99.01% 84.28%
Kantora 100.00% 96.62% 95.76% 0.88% 98.84% 84.30%
Kiang Central 100.00% 94.34% 93.78% 0.59% 97.40% 84.30%
Kiang East 99.33% 92.99% 91.92% 1.14% 96.25% 84.30%
Kiang West 100.00% 96.91% 95.87% 1.07% 98.93% 84.30%
Kombo Central 100.00% 96.31% 95.52% 0.81% 97.89% 84.30%
Kombo East 99.87% 94.81% 93.75% 1.11% 98.67% 84.30%
Kombo North/Saint Mary 99.58% 96.01% 95.14% 0.90% 98.42% 77.96%
Kombo South 99.62% 94.27% 92.82% 1.53% 96.03% 83.76%
Lower Baddibu 100.00% 93.37% 92.26% 1.18% 97.85% 84.30%
Lower Niumi 100.00% 92.75% 91.64% 1.19% 97.05% 83.64%
Lower Saloum 100.00% 93.93% 92.48% 1.54% 98.38% 84.30%
Niamina East 100.00% 91.49% 89.86% 1.78% 96.38% 84.30%
Niamina West 100.00% 94.75% 93.05% 1.79% 96.48% 84.30%
Niani 98.78% 94.21% 93.24% 1.02% 98.84% 84.30%
Sami 100.00% 92.87% 91.68% 1.28% 99.56% 84.30%
Sandu 99.34% 89.79% 86.71% 3.42% 97.73% 84.30%
Upper Baddibu 100.00% 94.76% 93.53% 1.29% 98.68% 84.30%
Upper Niumi 100.00% 95.16% 94.24% 0.96% 96.57% 84.23%
Upper Saloum 98.04% 93.67% 92.43% 1.32% 96.92% 84.05%
Wuli 100.00% 95.70% 94.00% 1.77% 98.56% 83.82%
April 2017
20
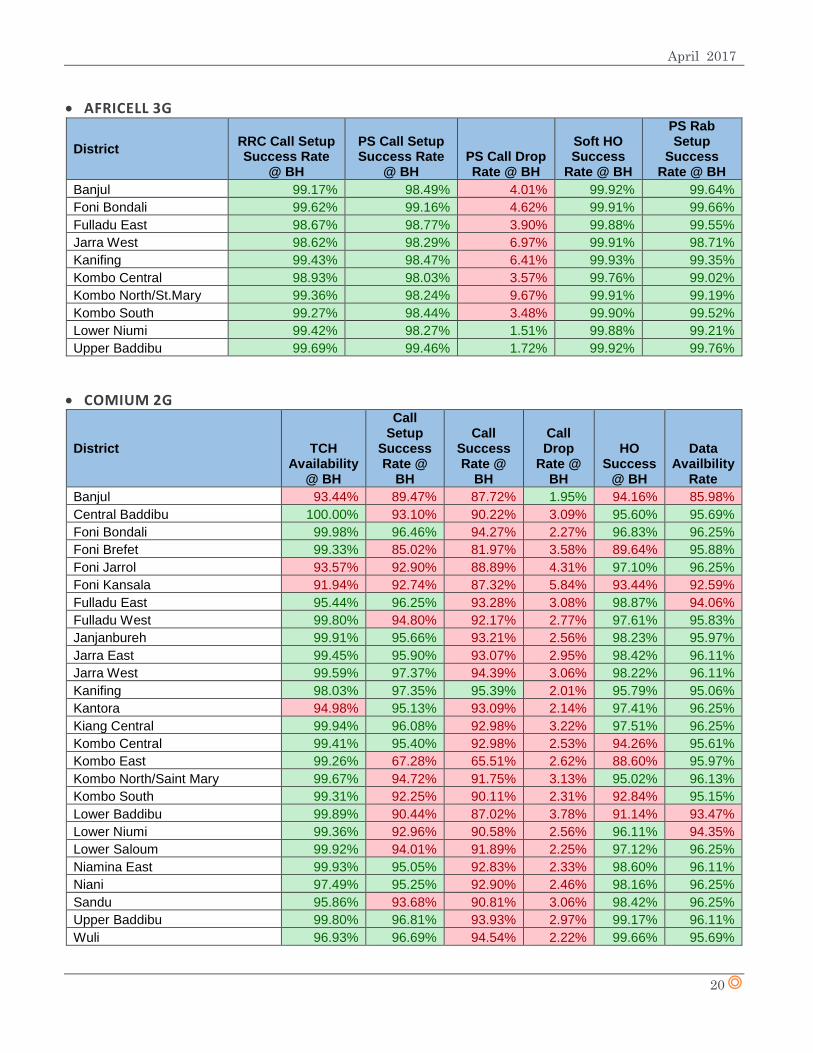
AFRICELL 3G
District RRC Call Setup Success Rate
@ BH
PS Call Setup Success Rate
@ BH PS Call Drop Rate @ BH
Soft HO Success
Rate @ BH
PS Rab Setup
Success Rate @ BH
Banjul 99.17% 98.49% 4.01% 99.92% 99.64%
Foni Bondali 99.62% 99.16% 4.62% 99.91% 99.66%
Fulladu East 98.67% 98.77% 3.90% 99.88% 99.55%
Jarra West 98.62% 98.29% 6.97% 99.91% 98.71%
Kanifing 99.43% 98.47% 6.41% 99.93% 99.35%
Kombo Central 98.93% 98.03% 3.57% 99.76% 99.02%
Kombo North/St.Mary 99.36% 98.24% 9.67% 99.91% 99.19%
Kombo South 99.27% 98.44% 3.48% 99.90% 99.52%
Lower Niumi 99.42% 98.27% 1.51% 99.88% 99.21%
Upper Baddibu 99.69% 99.46% 1.72% 99.92% 99.76%
COMIUM 2G
District TCH Availability
@ BH
Call Setup
Success Rate @
BH
Call Success Rate @
BH
Call Drop
Rate @ BH
HO Success
@ BH
Data Availbility
Rate
Banjul 93.44% 89.47% 87.72% 1.95% 94.16% 85.98%
Central Baddibu 100.00% 93.10% 90.22% 3.09% 95.60% 95.69%
Foni Bondali 99.98% 96.46% 94.27% 2.27% 96.83% 96.25%
Foni Brefet 99.33% 85.02% 81.97% 3.58% 89.64% 95.88%
Foni Jarrol 93.57% 92.90% 88.89% 4.31% 97.10% 96.25%
Foni Kansala 91.94% 92.74% 87.32% 5.84% 93.44% 92.59%
Fulladu East 95.44% 96.25% 93.28% 3.08% 98.87% 94.06%
Fulladu West 99.80% 94.80% 92.17% 2.77% 97.61% 95.83%
Janjanbureh 99.91% 95.66% 93.21% 2.56% 98.23% 95.97%
Jarra East 99.45% 95.90% 93.07% 2.95% 98.42% 96.11%
Jarra West 99.59% 97.37% 94.39% 3.06% 98.22% 96.11%
Kanifing 98.03% 97.35% 95.39% 2.01% 95.79% 95.06%
Kantora 94.98% 95.13% 93.09% 2.14% 97.41% 96.25%
Kiang Central 99.94% 96.08% 92.98% 3.22% 97.51% 96.25%
Kombo Central 99.41% 95.40% 92.98% 2.53% 94.26% 95.61%
Kombo East 99.26% 67.28% 65.51% 2.62% 88.60% 95.97%
Kombo North/Saint Mary 99.67% 94.72% 91.75% 3.13% 95.02% 96.13%
Kombo South 99.31% 92.25% 90.11% 2.31% 92.84% 95.15%
Lower Baddibu 99.89% 90.44% 87.02% 3.78% 91.14% 93.47%
Lower Niumi 99.36% 92.96% 90.58% 2.56% 96.11% 94.35%
Lower Saloum 99.92% 94.01% 91.89% 2.25% 97.12% 96.25%
Niamina East 99.93% 95.05% 92.83% 2.33% 98.60% 96.11%
Niani 97.49% 95.25% 92.90% 2.46% 98.16% 96.25%
Sandu 95.86% 93.68% 90.81% 3.06% 98.42% 96.25%
Upper Baddibu 99.80% 96.81% 93.93% 2.97% 99.17% 96.11%
Wuli 96.93% 96.69% 94.54% 2.22% 99.66% 95.69%
April 2017
21
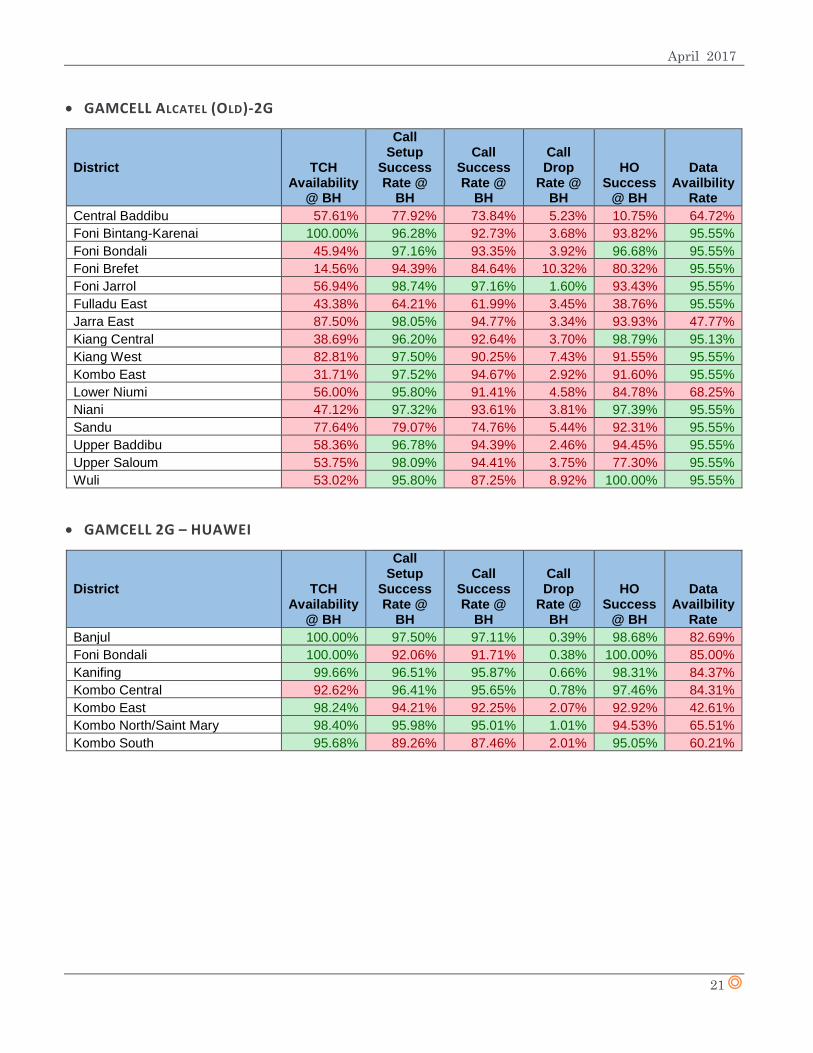
GAMCELL ALCATEL (OLD)-2G
District TCH Availability
@ BH
Call Setup
Success Rate @
BH
Call Success Rate @
BH
Call Drop
Rate @ BH
HO Success
@ BH
Data Availbility
Rate
Central Baddibu 57.61% 77.92% 73.84% 5.23% 10.75% 64.72%
Foni Bintang-Karenai 100.00% 96.28% 92.73% 3.68% 93.82% 95.55%
Foni Bondali 45.94% 97.16% 93.35% 3.92% 96.68% 95.55%
Foni Brefet 14.56% 94.39% 84.64% 10.32% 80.32% 95.55%
Foni Jarrol 56.94% 98.74% 97.16% 1.60% 93.43% 95.55%
Fulladu East 43.38% 64.21% 61.99% 3.45% 38.76% 95.55%
Jarra East 87.50% 98.05% 94.77% 3.34% 93.93% 47.77%
Kiang Central 38.69% 96.20% 92.64% 3.70% 98.79% 95.13%
Kiang West 82.81% 97.50% 90.25% 7.43% 91.55% 95.55%
Kombo East 31.71% 97.52% 94.67% 2.92% 91.60% 95.55%
Lower Niumi 56.00% 95.80% 91.41% 4.58% 84.78% 68.25%
Niani 47.12% 97.32% 93.61% 3.81% 97.39% 95.55%
Sandu 77.64% 79.07% 74.76% 5.44% 92.31% 95.55%
Upper Baddibu 58.36% 96.78% 94.39% 2.46% 94.45% 95.55%
Upper Saloum 53.75% 98.09% 94.41% 3.75% 77.30% 95.55%
Wuli 53.02% 95.80% 87.25% 8.92% 100.00% 95.55%
GAMCELL 2G – HUAWEI
District TCH Availability
@ BH
Call Setup
Success Rate @
BH
Call Success Rate @
BH
Call Drop
Rate @ BH
HO Success
@ BH
Data Availbility
Rate
Banjul 100.00% 97.50% 97.11% 0.39% 98.68% 82.69%
Foni Bondali 100.00% 92.06% 91.71% 0.38% 100.00% 85.00%
Kanifing 99.66% 96.51% 95.87% 0.66% 98.31% 84.37%
Kombo Central 92.62% 96.41% 95.65% 0.78% 97.46% 84.31%
Kombo East 98.24% 94.21% 92.25% 2.07% 92.92% 42.61%
Kombo North/Saint Mary 98.40% 95.98% 95.01% 1.01% 94.53% 65.51%
Kombo South 95.68% 89.26% 87.46% 2.01% 95.05% 60.21%
April 2017
22
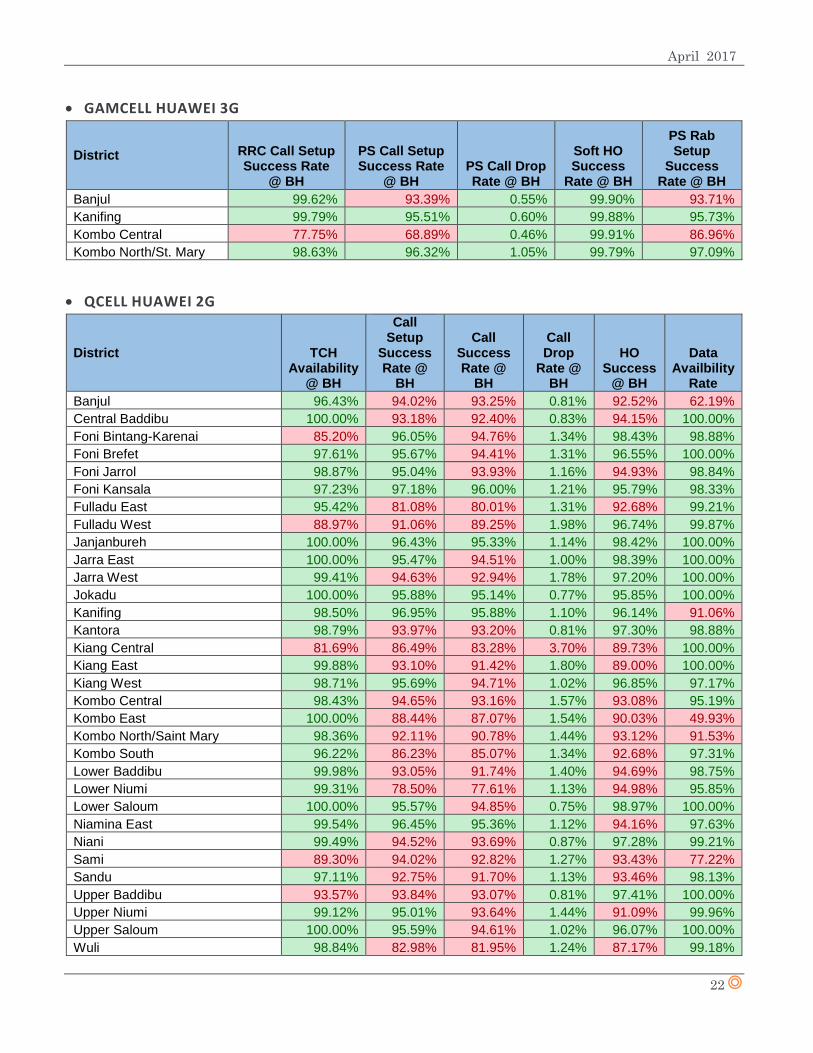
GAMCELL HUAWEI 3G
District RRC Call Setup Success Rate
@ BH
PS Call Setup Success Rate
@ BH PS Call Drop Rate @ BH
Soft HO Success
Rate @ BH
PS Rab Setup
Success Rate @ BH
Banjul 99.62% 93.39% 0.55% 99.90% 93.71%
Kanifing 99.79% 95.51% 0.60% 99.88% 95.73%
Kombo Central 77.75% 68.89% 0.46% 99.91% 86.96%
Kombo North/St. Mary 98.63% 96.32% 1.05% 99.79% 97.09%
QCELL HUAWEI 2G
District TCH Availability
@ BH
Call Setup
Success Rate @
BH
Call Success Rate @
BH
Call Drop
Rate @ BH
HO Success
@ BH
Data Availbility
Rate
Banjul 96.43% 94.02% 93.25% 0.81% 92.52% 62.19%
Central Baddibu 100.00% 93.18% 92.40% 0.83% 94.15% 100.00%
Foni Bintang-Karenai 85.20% 96.05% 94.76% 1.34% 98.43% 98.88%
Foni Brefet 97.61% 95.67% 94.41% 1.31% 96.55% 100.00%
Foni Jarrol 98.87% 95.04% 93.93% 1.16% 94.93% 98.84%
Foni Kansala 97.23% 97.18% 96.00% 1.21% 95.79% 98.33%
Fulladu East 95.42% 81.08% 80.01% 1.31% 92.68% 99.21%
Fulladu West 88.97% 91.06% 89.25% 1.98% 96.74% 99.87%
Janjanbureh 100.00% 96.43% 95.33% 1.14% 98.42% 100.00%
Jarra East 100.00% 95.47% 94.51% 1.00% 98.39% 100.00%
Jarra West 99.41% 94.63% 92.94% 1.78% 97.20% 100.00%
Jokadu 100.00% 95.88% 95.14% 0.77% 95.85% 100.00%
Kanifing 98.50% 96.95% 95.88% 1.10% 96.14% 91.06%
Kantora 98.79% 93.97% 93.20% 0.81% 97.30% 98.88%
Kiang Central 81.69% 86.49% 83.28% 3.70% 89.73% 100.00%
Kiang East 99.88% 93.10% 91.42% 1.80% 89.00% 100.00%
Kiang West 98.71% 95.69% 94.71% 1.02% 96.85% 97.17%
Kombo Central 98.43% 94.65% 93.16% 1.57% 93.08% 95.19%
Kombo East 100.00% 88.44% 87.07% 1.54% 90.03% 49.93%
Kombo North/Saint Mary 98.36% 92.11% 90.78% 1.44% 93.12% 91.53%
Kombo South 96.22% 86.23% 85.07% 1.34% 92.68% 97.31%
Lower Baddibu 99.98% 93.05% 91.74% 1.40% 94.69% 98.75%
Lower Niumi 99.31% 78.50% 77.61% 1.13% 94.98% 95.85%
Lower Saloum 100.00% 95.57% 94.85% 0.75% 98.97% 100.00%
Niamina East 99.54% 96.45% 95.36% 1.12% 94.16% 97.63%
Niani 99.49% 94.52% 93.69% 0.87% 97.28% 99.21%
Sami 89.30% 94.02% 92.82% 1.27% 93.43% 77.22%
Sandu 97.11% 92.75% 91.70% 1.13% 93.46% 98.13%
Upper Baddibu 93.57% 93.84% 93.07% 0.81% 97.41% 100.00%
Upper Niumi 99.12% 95.01% 93.64% 1.44% 91.09% 99.96%
Upper Saloum 100.00% 95.59% 94.61% 1.02% 96.07% 100.00%
Wuli 98.84% 82.98% 81.95% 1.24% 87.17% 99.18%
April 2017
23
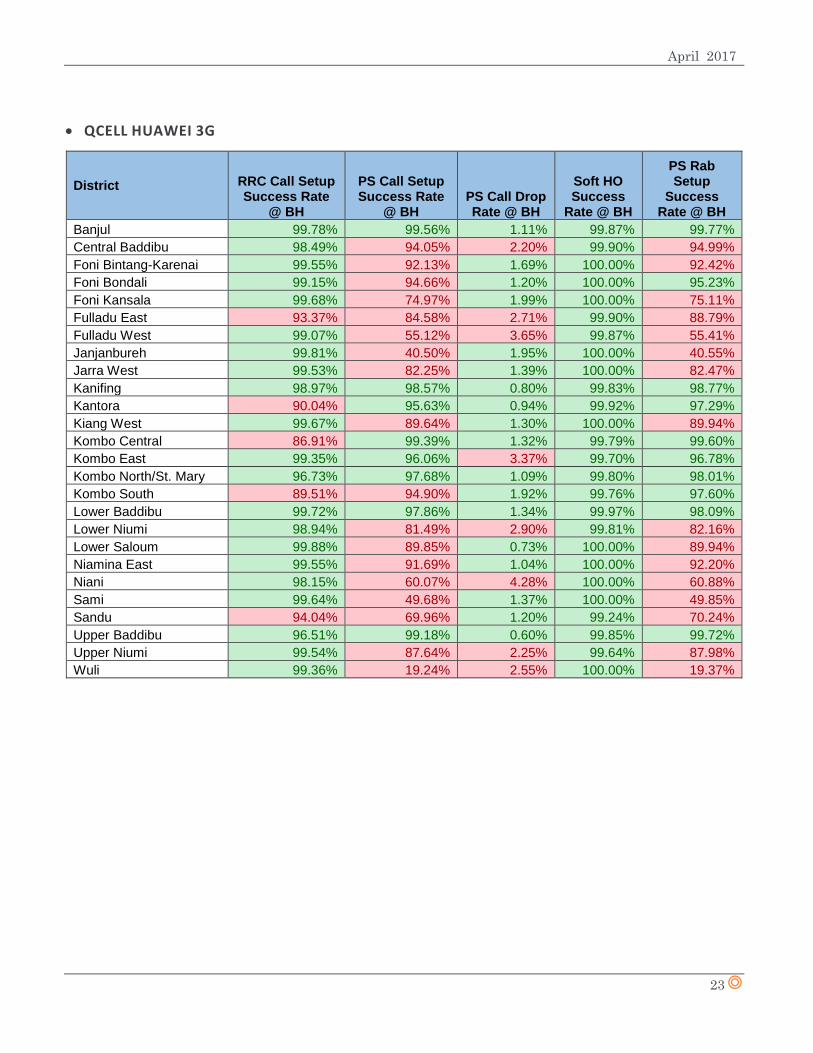
QCELL HUAWEI 3G
District RRC Call Setup Success Rate
@ BH
PS Call Setup Success Rate
@ BH PS Call Drop Rate @ BH
Soft HO Success
Rate @ BH
PS Rab Setup
Success Rate @ BH
Banjul 99.78% 99.56% 1.11% 99.87% 99.77%
Central Baddibu 98.49% 94.05% 2.20% 99.90% 94.99%
Foni Bintang-Karenai 99.55% 92.13% 1.69% 100.00% 92.42%
Foni Bondali 99.15% 94.66% 1.20% 100.00% 95.23%
Foni Kansala 99.68% 74.97% 1.99% 100.00% 75.11%
Fulladu East 93.37% 84.58% 2.71% 99.90% 88.79%
Fulladu West 99.07% 55.12% 3.65% 99.87% 55.41%
Janjanbureh 99.81% 40.50% 1.95% 100.00% 40.55%
Jarra West 99.53% 82.25% 1.39% 100.00% 82.47%
Kanifing 98.97% 98.57% 0.80% 99.83% 98.77%
Kantora 90.04% 95.63% 0.94% 99.92% 97.29%
Kiang West 99.67% 89.64% 1.30% 100.00% 89.94%
Kombo Central 86.91% 99.39% 1.32% 99.79% 99.60%
Kombo East 99.35% 96.06% 3.37% 99.70% 96.78%
Kombo North/St. Mary 96.73% 97.68% 1.09% 99.80% 98.01%
Kombo South 89.51% 94.90% 1.92% 99.76% 97.60%
Lower Baddibu 99.72% 97.86% 1.34% 99.97% 98.09%
Lower Niumi 98.94% 81.49% 2.90% 99.81% 82.16%
Lower Saloum 99.88% 89.85% 0.73% 100.00% 89.94%
Niamina East 99.55% 91.69% 1.04% 100.00% 92.20%
Niani 98.15% 60.07% 4.28% 100.00% 60.88%
Sami 99.64% 49.68% 1.37% 100.00% 49.85%
Sandu 94.04% 69.96% 1.20% 99.24% 70.24%
Upper Baddibu 96.51% 99.18% 0.60% 99.85% 99.72%
Upper Niumi 99.54% 87.64% 2.25% 99.64% 87.98%
Wuli 99.36% 19.24% 2.55% 100.00% 19.37%