Embed Size (px)
Citation preview

Technical Review of Stocks CIO Wealth Management Research 2 December 2014
Peter Lee, Chief Technical [email protected]
+1-212-713-8888, ext.01
This report provides technical analysis on stocks that, we believe, are of a wide interest. This list is not a template forthe construction of your personal portfolio. You should discuss investment decisions with your Financial Advisor. For more information about this report, see Description and Methodology in the Appendix. We would like to thank Venkat Badri, an employee of Cognizant Group, for his assistance in preparing this research report. Cognizant staff provides research support services to UBS.
This report has been prepared by UBS Financial Services Inc. (UBS FS). Analyst certification and required disclosuresbegin on page 30. UBS does and seeks to do business with companies covered in its research reports. As a result,investors should be aware that the firm may have a conflict of interest that could affect the objectivity of this report.Investors should consider this report as only a single factor in making their investment decision.

Table of Contents Ticker Name PageAAPL APPLE 4ABBV ABBVIE INC 4ABT ABBOTT LABORATORIES 5ACN ACCENTURE 5ADSK AUTODESK 6AET AETNA INC 6AMAT APPLIED MATERIALS INC 7AMP AMERIPRISE FINANCIAL INC 7 APC ANADARKO PETROLEUM CORP 8AXP AMERICAN EXPRESS 8BA BOEING 9CE CELANESE CORP 9CL COLGATE-PALMOLIVE CO 10CMCSA COMCAST CORP 10CNC CENTENE 11CSCO CISCO SYSTEMS INC 11EMC EMC CORP/MA 12EMR EMERSON ELECTRIC 12ESRX EXPRESS SCRIPTS HOLDING CO 13GE GENERAL ELECTRIC CO 13GOOGL GOOGLE INC 14HAL HALLIBURTON 14INTC INTEL CORP 15IVZ INVESCO 15JPM JPMORGAN CHASE & CO 16KRFT KRAFT FOODS GROUP INC 16LRCX LAM RESEARCH CORP 17M MACY'S INC 17MAR MARRIOTT 18MDLZ MONDELEZ INTERNATIONAL INC 18MDT MEDTRONIC INC 19MET METLIFE 19MRK MERCK & CO 20MSFT MICROSOFT INC 20NKE NIKE INC 21QCOM QUALCOMM INC 21SBAC SBA COMMUNICATIONS 22SBUX STARBUCKS 22SLB SCHLUMBERGER LTD 23SNDK SANDISK CORP 23SO SOUTHERN CO 24TXN TEXAS INSTRUMENTS INC 24UNP UNION PACIFIC CORP 25UPS UNITED PARCEL SERVICE 25UTX UNITED TECHNOLOGIES CORP 26VMW VMWARE INC 26
Technical Review of Stocks
UBS CIO WM Research 2 December 2014 2

Changes since last report Additions Name Ticker Centene CNC Marriott MAR MetLife MET Starbucks SBUX Deletions
Technical Rating Changes Name Ticker Old New Anadarko Petroleum APC Bullish Neutral
The last update on these stocks was published on 31 October 2014. Going forward, our previously published rating for deleted stocks should not be relied upon. Apache (APA), Coca-Cola (KO) and Travelers Cos. Inc. (TRV) will be reviewed in the next edition of Technical Review of Stocks.
Technical Review of Stocks
UBS CIO WM Research 2 December 2014 3

Apple Inc (AAPL)
2010 2011 2012 2013 2014
2020
4040
6060
8080
100100
120120
Price 10-Week Moving Average 30-Week Moving Average
Source: FactSet, UBS CIO WMR as of 28 November 2014 Support levels Resistance levels
First Second Third First Second Third 107-108 99.96-101.27 95.18-96.14 129 135-136 146-147
Technical rating Bullish Sector Technology
Last Sale Price $118.93
Rationale: AAPL has recovered from its 2012-2013 sharp decline (45.38%), trading above its Sep 2012/2014 highs (100.72/103.74). The recent surge above the extension of its 2009 uptrend (88) and above the top of a 1-plus year uptrend channel suggest next upside targets to 129 (near term), 135-136, intermediate term and 146-147, longer term. Initial support is at 107-108 or near the Nov '14 lows, top of 1-plus year uptrend channel and the 10-week ma. Secondary support is also available along the 10/21/14 gap up, Sep 2012 highs and 30-week ma at 99.96-101.27.
AbbVie Inc (ABBV)
Jan '13 Mar '13 May '13 Jul '13 Sep '13 Nov '13 Jan '14 Mar '14 May '14 Jul '14 Sep '14 Nov '143030
3535
4040
4545
5050
5555
6060
6565
7070
Source: FactSet, UBS CIO WMR as of 28 November 2014 Support levels Resistance levels
First Second Third First Second Third 65.50-65.75 60-61.31 54.59-55.02 72-73 76 80-81
Technical rating Bullish Sector Healthcare
Last Sale Price $69.20
Rationale: Recent solid breakout above the top of its 2013 uptrend channel during Oct 2014 suggests higher prices. Since the height of this channel (between 52 and 62) is 10-points this suggests next targets to 72-73, near term, 76, medium term and 80-81, longer term. An oversold condition is likely to develop near the low-70s. Failure to clear this supply zone can lead to a pullback to initial support at 65.5-65.75 or the 11/21/14 gap up and then the low-60s.
Technical Review of Stocks
UBS CIO WM Research 2 December 2014 4

Abbott Laboratories (ABT)
2010 2011 2012 2013 20142020
2525
3030
3535
4040
4545
Price 10-Week Moving Average 30-Week Moving Average
Source: FactSet, UBS CIO WMR as of 28 November 2014 Support levels Resistance levels
First Second Third First Second Third 42-43 40.75-41.75 38-39.25 46-47 51-52 57-58
Technical rating Bullish Sector Health Care
Last Sale Price $44.51
Rationale: For the past 4 years or so this Healthcare name has retained a bullish uptrend channel now rising near 38and 46-47. A smaller but equally important uptrend channel is also visible since 2011 between 39.25 and 45.5. The recent correction during Sep-Oct 2014 probed this key support zone near 39.25 as the bulls defended this key level. Infact, the recent surge above its 10- /30- week moving averages signals another test of the top of its uptrend channels near 45-45.5/46-47. Initial support lies at 42-43 or 10- /30- week ma and then 40.75-41.75 or the 10/21/14 gap up.
Accenture PLC (ACN)
2010 2011 2012 2013 2014
2020
3030
4040
5050
6060
7070
8080
9090
Price 10-Week Moving Average 30-Week Moving Average
Source: FactSet, UBS CIO WMR as of 28 November 2014 Support levels Resistance levels
First Second Third First Second Third 83.16 77-79 74-75 90-90.50 94 98-100
Technical rating Neutral Sector Technology
Last Sale Price $86.33
Rationale: An uptrend formation over the past 5-plus years as well as a 2-year ascending triangle is rapidly converging. The above technical developments warn of an impending inflection point. A convincing surge above the mid-to-high 80s might attract fresh bullish interests in the stock. Targets as high as the low-to-mid 90s are possible, medium term. However, a convincing break below key support at 77-79 coinciding with the 2010/2012 uptrend as well the Aug '14 lows may signal the start of a deeper correction towards the mid-70s and possibly as low as the high-60s.
Technical Review of Stocks
UBS CIO WM Research 2 December 2014 5

Autodesk (ADSK)
2010 2011 2012 2013 20142020
2525
3030
3535
4040
4545
5050
5555
6060
6565
Price 10-Week Moving Average 30-Week Moving Average
Source: FactSet, UBS CIO WMR as of 28 November 2014 Support levels Resistance levels
First Second Third First Second Third 57.59-58.75 51.84-52.69 48.23-49.61 66-66.50 72-73 81-82
Technical rating Bullish Sector Technology
Last Sale Price $62
Rationale: Despite increased volatility over the near-term, we maintain an intermediate term bullish stance on ADSK as a breakout of a four-year symmetrical triangle pattern last year above 42.5 still renders upside to the mid-60s (medium term), 72-73 (intermediate term), and to 81-82, longer term. A solid recovery from its Oct '14 low, a positive outside month pattern also on Oct '14 and an upside gap on 11/21/14 favor the bulls. Although higher prices are likely, we still recommend raising initial support to 57.59-58.75 or the recent Oct/Nov breakout and then 51.84-52.69. .
Aetna Inc (AET)
2010 2011 2012 2013 2014
3030
4040
5050
6060
7070
8080
9090
Price 10-Week Moving Average 30-Week Moving Average
Source: FactSet, UBS CIO WMR as of 28 November 2014 Support levels Resistance levels
First Second Third First Second Third 85-86 81-82 74.81-76.11 93-95 100 105-106
Technical rating Bullish Sector Healthcare
Last Sale Price $87.24
Rationale: Trading above the top of a 4+ year uptrend channel in the high-50s renders upside targets to the low tomid-90s (near term), 100 (medium) and then to 105-106 (longer term). The sharp rally over the past year has led to an overbought condition. Failure to convincingly surpass the top of the 2012 uptrend channel along 93-95 may triggeranother consolidation back to initial support near 85-86 or the recent Nov '14 breakout. Secondary support is also visi-ble near the bottom of its 2012 uptrend channel as well as the 10-wk and 30-wk moving averages in the low-80s.
Technical Review of Stocks
UBS CIO WM Research 2 December 2014 6

Applied Materials Inc (AMAT)
2010 2011 2012 2013 201488
1010
1212
1414
1616
1818
2020
2222
2424
Price 10-Week Moving Average 30-Week Moving Average
Source: FactSet, UBS CIO WMR as of 28 November 2014 Support levels Resistance levels
First Second Third First Second Third 22-23 20.5-21.5 18.27-18.63 25.94 27.95 29.55
Technical rating Bullish Sector Technology
Last Sale Price $24.05
Rationale: The Semiconductor sector (SOX) has rallied sharply, nearly 97% from its Nov '12 low and 34% from its Feb '14 low. However, SOX has also suffered a dramatic 17.3% correction during Sep-Oct '14. Nonetheless, a successful test of its 10+ year breakout bodes well for the resumption of uptrend. AMAT has also fallen 20.6% from its Jul/Aug '14 highs and have briefly broken its Nov 2012 uptrend channel (20) falling to a low of 18.63 before bouncing back strongly. A solid recovery above its Jul/Aug '14 highs suggests upside targets to 25.94 or the Nov 2003 high and then the high-20s.
Ameriprise Financial Inc (AMP)
2010 2011 2012 2013 20142020
4040
6060
8080
100100
120120
140140
Price 10-Week Moving Average 30-Week Moving Average
Source: FactSet, UBS CIO WMR as of 28 November 2014 Support levels Resistance levels
First Second Third First Second Third 121.5-124.5 114-116 105-107 137-137.50 143-144 150-152
Technical rating Bullish Sector Financials
Last Sale Price $131.77
Rationale: Two prior multi-year breakouts in Jan ‘13 above 63 and a 6-year symmetrical triangle breakout renders up-side targets to 137-137.50 (near term) and then to 143-144 (intermediate term). Recent failure to clear above the topof its 2009 uptrend channel (132-133) coupled with a negative outside week (8/1/14) have led to correction that slight-ly broke its 2012 uptrend but managed to maintain a higher low (105.41) above its Feb/Apr/May '14 lows (100.94-101.67). A solid recovery in Oct '14 now allows for a retest of crucial resistance along the top of its 2009 uptrend.
Technical Review of Stocks
UBS CIO WM Research 2 December 2014 7

Anadarko Petroleum Corp (APC)
2010 2011 2012 2013 20143030
4040
5050
6060
7070
8080
9090
100100
110110
Price 10-Week Moving Average 30-Week Moving Average
Source: FactSet, UBS CIO WMR as of 28 November 2014 Support levels Resistance levels
First Second Third First Second Third 73.60 65.82 56.42 82.28-87.80 96 101-104.5
Technical rating Neutral Sector Energy
Last Sale Price $79.15
Rationale: We recommend downgrading APC to Neutral to bring this Energy name in line with the weak Energy sec-tor. The strong selling during Aug-Oct '14 has not only led to a 32.3% decline, but also has broken a number of key supports. A large downside gap on 11/28/14 weakened the absolute and relative (versus S&P 500) trends. While we believe the downside could be limited from here, lack of relative leadership and lack of visibility makes this stock still vulnerable for further selling. Initial support is 73.60 (Dec '13 low). Initial supply is 82.28-87.80 (Nov '14 gap down).
American Express (AXP)
2010 2011 2012 2013 2014
3030
4040
5050
6060
7070
8080
9090
100100
Price 10-Week Moving Average 30-Week Moving Average
Source: FactSet, UBS CIO WMR as of 28 November 2014 Support levels Resistance levels
First Second Third First Second Third 88-90 83-85 76.5-78.5 94-96.24 100-101 109-110
Technical rating Bullish Sector Financials
Last Sale Price $92.42
Rationale: Despite the strong selling during Sep-Oct '14 this leadership Financial name continues to trade above key support at 76.5-78.5 or the top of its 2010 uptrend channel breakout as well as above the extension of its 2000/2007trend (not shown). A large multi-year breakout above its 2007 high (not shown - 65.89) coupled with a subsequent breakout above the top of its 5 year uptrend channel (67-68) earlier last year render upside targets to the mid-90s(near term), 109-110 (medium term) and 120-122 (longer term). Initial support is at 88-90 or near 10- /30- week ma.
Technical Review of Stocks
UBS CIO WM Research 2 December 2014 8

Boeing (BA)
2010 2011 2012 2013 20144040
6060
8080
100100
120120
140140
Price 10-Week Moving Average 30-Week Moving Average
Source: FactSet, UBS CIO WMR as of 28 November 2014 Support levels Resistance levels
First Second Third First Second Third 130 123-124 115-116 136-138.39 142-144.37 150
Technical rating Bullish Sector Industrials
Last Sale Price $134.36
Rationale: A breakout of a multi-year accumulation pattern above 107 early last year still suggests higher prices, over time as a 79-point basing pattern breakout renders a target to the mid-150s, intermediate term and then to the mid-180s, longer term. However, a negative outside week on 1/24/14 accompanied by a negative outside month on Jan '14and a large downside gap (132-136) on 1/28/14 have led to a 1-year consolidation as depicted by a declining trend channel between 115-116 and 136-139. A breakout above 139 signals the next rally and below 115 the next decline.
Celanese Corp (CE)
2010 2011 2012 2013 2014
2525
3030
3535
4040
4545
5050
5555
6060
6565
Price 10-Week Moving Average 30-Week Moving Average
Source: FactSet, UBS CIO WMR as of 28 November 2014 Support levels Resistance levels
First Second Third First Second Third 55.5-56.5 48.78-49.60 44-45.5 62.5-63 65.5-66.5 71-73
Technical rating Bullish Sector Materials
Last Sale Price $60.07
Rationale: We maintain an intermediate-to-longer term favorable technical outlook on this cyclical name based on its technical base breakouts above the low-50s late last year and above the high-50s this year. The 2011/12 and 2009 tri-angle breakouts render upside targets to the low-70s (intermediate term) and then to mid-80s (longer term). However, failure to move above key resistance at 65.5-66.5 coupled with a negative outside week (7/11/14) led to consolidation. That said, an impressive bounce from Oct '14 lows (49.42) can trigger a retest of key resistance along 65.5-66.5.
Technical Review of Stocks
UBS CIO WM Research 2 December 2014 9

Colgate Palmolive Co (CL)
2010 2011 2012 2013 2014
3535
4040
4545
5050
5555
6060
6565
7070
Price 10-Week Moving Average 30-Week Moving Average
Source: FactSet, UBS CIO WMR as of 28 November 2014 Support levels Resistance levels
First Second Third First Second Third 66-67 62.5-63 59.75 73-75 77-78 82-82.50
Technical rating Bullish Sector Cons. Staples
Last Sale Price $69.59
Rationale: Defensive sectors including Healthcare, Utilities and Consumer Staples have outperformed SPX this year. This Consumer Staples stock also suffered a correction during Jun-Aug '14 but held up well during the broad market correction in Sep-Oct '14. A solid bounce from Jul/Oct '14 lows not only recovered almost all of its Jul/Oct '14 losses but also lead to a positive outside monthly reversal by the end of Oct '14. A convincing move above 70.11 negates the Jul '14 negative outside month allowing for a retest of the top of the 2010 uptrend channel near the mid-70s.
Comcast Corp. Cl A (CMCSA)
2010 2011 2012 2013 2014
1515
2020
2525
3030
3535
4040
4545
5050
5555
6060
Price 10-Week Moving Average 30-Week Moving Average
Source: FactSet, UBS CIO WMR as of 28 November 2014 Support levels Resistance levels
First Second Third First Second Third 54-55 49.33-50.23 47.74 61 64 68-68.5
Technical rating Bullish Sector Cons. Disc.
Last Sale Price $57.04
Rationale: There remain wide dispersions across the Consumer Discretionary sector. Although CMCSA has completed a 12-year accumulation pattern breakout in 2012/13 above the low-30s/low-50s, it has been erratic this year as the channel breakout above the top of its 2011 uptrend channel (53-54) earlier in the year did not follow through. A nega-tive outside week on 8/1/14 has led to a brief break of the Oct 2011 uptrend and the10-/30-wk ma at 54-55. However, the ability to maintain above key moving averages coupled with a breakout above 57.49 confirms the next rally.
Technical Review of Stocks
UBS CIO WM Research 2 December 2014 10

Centene (CNC)
2010 2011 2012 2013 2014
2020
3030
4040
5050
6060
7070
8080
9090
100100
Price 10-Week Moving Average 30-Week Moving Average
Source: FactSet, UBS CIO WMR as of 28 November 2014 Support levels Resistance levels
First Second Third First Second Third 94.90 89-90 83-84 102-103 106.5 110-112.5
Technical rating Bullish Sector Healthcare
Last Sale Price $98.77
Rationale: We initiate CNC with a Bullish outlook. The long-term trend starting from 2001 lows (not shown) remains bullish. In addition, a breakout of multi-year accumulation pattern above 37.91 in 2011 and above 50.98 in mid-2013 suggest high prices, intermediate to longer term. Favorable moving averages, confirmed breakouts of the 2010/2012 up-trend channels, positive outside months during Apr/Oct '14 and superior relative performance of the stock versus S&P 500 further reaffirm a bullish trend. Initial support lies at 94.90 or near the Oct '14 high. 102-103 offers initial resistance.
Cisco Systems Inc (CSCO)
2010 2011 2012 2013 20141212
1414
1616
1818
2020
2222
2424
2626
2828
Price 10-Week Moving Average 30-Week Moving Average
Source: FactSet, UBS CIO WMR as of 28 November 2014 Support levels Resistance levels
First Second Third First Second Third 26.08 24.88 22.5 29.39 31-32 34.24
Technical rating Neutral Sector Technology
Last Sale Price $27.64
Rationale: Although we are encouraged by a breakout of Fan formation as evident by 3 downtrend breakouts in late 2011, early 2013 and late 2014 CSCO still needs to breakout above the 2004 highs at 29.39 convincingly. A move above 29.39 would negate concerns due to a complex multi-year head and shoulder pattern. In the meantime, additional con-solidation between 22.5 and 29.5 can lead to the next sustainable major bull rally. Initial support lies near 26.08 or near the Jul '14 highs. To the upside initial supply lies along 29.39 or 2004 highs. Above this 34.24 is secondary resistance.
Technical Review of Stocks
UBS CIO WM Research 2 December 2014 11

EMC Corp (EMC)
2010 2011 2012 2013 20141414
1616
1818
2020
2222
2424
2626
2828
3030
3232
Price 10-Week Moving Average 30-Week Moving Average
Source: FactSet, UBS CIO WMR as of 28 November 2014 Support levels Resistance levels
First Second Third First Second Third 28.50-29 26-26.50 23-23.50 32-33 36-37 41-42
Technical rating Bullish Sector Technology
Last Sale Price $30.35
Rationale: A symmetrical triangle breakout in Mar '14 at 26-26.5 and a gap up breakout in 7/21/14 reaffirms the start of a sustainable intermediate term recovery. The 10-point technical base breakout renders upside targets to 32-33(medium term), 36-37 (intermediate) and 41-42 (longer term). However, a negative outside day on 9/22/14 has trig-gered a consolidation that alleviated an overbought condition. The subsequent filling of the Jul '14 gap up (27.06-27.76) and successful test of the extension of the triangle breakout and Apr ‘14 uptrend signal the next rally.
Emerson Electric (EMR)
2010 2011 2012 2013 2014
3535
4040
4545
5050
5555
6060
6565
7070
Price 10-Week Moving Average 30-Week Moving Average
Source: FactSet, UBS CIO WMR as of 28 November 2014 Support levels Resistance levels
First Second Third First Second Third 60.5-61 57-58 53-54 65.5-66 69-71 76-76.5
Technical rating Bullish Sector Industrials
Last Sale Price $63.75
Rationale: Although EMR has maintained its previous major technical breakout above 59-60 it has struggled to set new all times. Nonetheless, the large symmetrical triangle breakout still renders upside targets to 69-71 (near term),76-76.50 (medium), 82-84 (longer term). However, a correction during Sep-Oct '14 has resulted in a pullback that ap-pears to have successfully found support near 57-58 or the extension of the triangle and the 50% retracement from 2012-2013 rally. That said, 11/28/14 negative outside week warns of further technical base before higher prices.
Technical Review of Stocks
UBS CIO WM Research 2 December 2014 12

Express Scripts Holding Co (ESRX)
2010 2011 2012 2013 2014
4040
5050
6060
7070
8080
Price 10-Week Moving Average 30-Week Moving Average
Source: FactSet, UBS CIO WMR as of 28 November 2014 Support levels Resistance levels
First Second Third First Second Third 80-80.50 76 +/- 1 71-72 88-89 94 99-100
Technical rating Bullish Sector HealthCare
Last Sale Price $83.15
Rationale: The sharp selloff earlier in the year in momentum stocks has temporarily hurt ESRX. However, a solid rally from Oct '14 lows not only led to a recovery of all of its losses in the year, but also resulted in a breakout above Mar '14 highs (79.37). In addition, a positive outside month pattern during Oct '14 bodes well for higher prices. A convinc-ing move above the 5+ year uptrend channel along the low-to-mid 80s can ignite the next rally. Initial support lies along 80-80.50 corresponding to the 11/21/14 gap up and the top of 2013 uptrend channel.
General Electric Co (GE)
2010 2011 2012 2013 2014
1414
1616
1818
2020
2222
2424
2626
2828
Price 10-Week Moving Average 30-Week Moving Average
Source: FactSet, UBS CIO WMR as of 28 November 2014 Support levels Resistance levels
First Second Third First Second Third 23.69-24.32 22.50-23 21.11-21.5 27.53-28.09 29 33.5-34
Technical rating Bullish Sector Industrials
Last Sale Price $26.49
Rationale: The 2000 downtrend breakout above 26.5 during Nov ‘13 confirms a major trend reversal and a sustaina-ble recovery. However, on a near-to-intermediate term basis there is formidable resistance at 28-29 coinciding with the top of the 2009 uptrend channel, Jan '14 negative outside month and the 61.8% retracement from 2007-2009 de-cline. Failure of this stock to clear convincingly above the high-20s can triggered a correction back to 24-25 or to the extension of the 2000 downtrend breakout, 2012 uptrend and 2009 uptrend can help reassert its primary uptrend.
Technical Review of Stocks
UBS CIO WM Research 2 December 2014 13

Google Inc (GOOGL)
2010 2011 2012 2013 2014
200200
250250
300300
350350
400400
450450
500500
550550
600600
Price 10-Week Moving Average 30-Week Moving Average
Source: FactSet, UBS CIO WMR as of 28 November 2014 Support levels Resistance levels
First Second Third First Second Third 511-518 487-495 447-467/422 568-577 605-615 624-635
Technical rating Bullish Sector Technology
Last Sale Price $549.08
Rationale: After a strong rally from 2012-2013 to a record high of 615.04 in Feb ’14 GOOGL appears to have slowed. A lower high (i.e., July ’14 high (595.65) is lower than its Feb ’14 high (615.04)) and failure of GOOGL to reassert itself above the extension of its 1-year uptrend channel (598) may be hinting of a more muted trading range between 511-518 and 605-615. Despite the lacklustre returns a 1-year technical base of nearly 104 point suggests a breakout above 605-615 renders targets to as high 709-719, over time. Below 511-518 warns of the start of a deeper correction.
Halliburton (HAL)
2010 2011 2012 2013 2014
2020
3030
4040
5050
6060
7070
Price 10-Week Moving Average 30-Week Moving Average
Source: FactSet, UBS CIO WMR as of 28 November 2014 Support levels Resistance levels
First Second Third First Second Third 40.12 36.77-37.62 32.82-33.74 44.37-47.12 51.78-53.69 58
Technical rating Neutral Sector Energy
Last Sale Price $42.20
Rationale: A breakout above the high-50s early in the year 2014 hints of a major breakout. However, the sharp down-turn in WTI Crude and Energy sector appear to have negated this major breakout. A 43% decline from Jul '14 highs, gap downs (11/17/14 and 11/28/14), death cross sell signal and the relative underperformance of the stock versus S&P 500 warns of selling pressure. In the meantime a wide trading range between low-40s and high-50s is now likely. This technical base may help to stabilize the strong selling pressure. Initial supply lies at 44.37-47.12 or 11/28/14 gap down.
Technical Review of Stocks
UBS CIO WM Research 2 December 2014 14

Intel Corp (INTC)
2010 2011 2012 2013 2014
2020
2525
3030
3535
Price 10-Week Moving Average 30-Week Moving Average
Source: FactSet, UBS WMR as of 28 November 2014 Support levels Resistance levels
First Second Third First Second Third 32.40-33 29.65 27 +/- 0.5 38.59-40 43-43.50 46
Technical rating Bullish Sector Technology
Last Sale Price $37.25
Rationale: The Semiconductor Index (SOX) has confirmed a multi-year breakout above its respective 2004/2006/2007 highs during Feb '14. INTC has finally caught up to its peers with a key breakout above multi-year resistance along 29-29.5 in Jun '14. This breakout confirms a 2005 head/shoulders bottom pattern and renders upside to mid-40s (longer term). Despite the near-term volatility, the stock found key support near 29.65 or the Oct '14 low or prior breakout levels before witnessing a solid bounce. Initial support lies at 32.40-33 or near the Nov '14 low and 30-week ma.
Invesco (IVZ)
2010 2011 2012 2013 2014
1515
2020
2525
3030
3535
4040
Price 10-Week Moving Average 30-Week Moving Average
Source: FactSet, UBS CIO WMR as of 28 November 2014 Support levels Resistance levels
First Second Third First Second Third 38 +/- 1 34.40 31.73 41.48 44-44.50 47
Technical rating Bullish Sector Financials
Last Sale Price $40.36
Rationale: We maintain our technical bullish view on IVZ. The long-term bullish trend starting from 2008/09 lows re-mains intact. With a move above 32.25 or 2007 highs, IVZ not only recovered all of its losses during subprime crisis by early 2013, but also completed a multi-year accumulation technical base breakout. A retest of its all-time highs near the low-60s is still possible, longer-term. Favorable relative in relationship to SPX and rising 10/30-wk moving averages also support our bullish technical stance. Initial support now lies near 38 +/- 1 or near the 10- /30- week ma.
Technical Review of Stocks
UBS CIO WM Research 2 December 2014 15

JPMorgan Chase & Co (JPM)
2010 2011 2012 2013 2014
3030
3535
4040
4545
5050
5555
6060
Price 10-Week Moving Average 30-Week Moving Average
Source: FactSet, UBS CIO WMR as of 28 November 2014 Support levels Resistance levels
First Second Third First Second Third 57-58.5 54 +/- 1 50-51 62 67-68 72-72.50
Technical rating Neutral Sector Financials
Last Sale Price $60.16
Rationale: In Jan '13 a large symmetrical triangle pattern breakout above the mid-40s signals the start of a bull rally. This breakout subsequently led to a rather steep uptrend channel, which soon reversed direction via the violation of the bottom of the 1-year uptrend channel during late-2013. In due course, a negative outside month in Jan '14 coupled with downside gaps on 4/11/14 and 5/5/14 prompted a consolidation. The erratic signals from the moving average crossovers now suggests a trading range between the mid-50s and the mid-60s and hence a tactical Neutral outlook.
Kraft Foods Group (KRFT)
Oct '12 Dec '12 Feb '13 Apr '13 Jun '13 Aug '13 Oct '13 Dec '13 Feb '14 Apr '14 Jun '14 Aug '14 Oct '14
4545
5050
5555
6060
Price 10-Week Moving Average 30-Week Moving Average
Source: FactSet, UBS CIO WMR as of 28 November 2014 Support levels Resistance levels
First Second Third First Second Third 55.14 53.33-53.63 50.54 61-62 67 72
Technical rating Neutral Sector Cons. Staples
Last Sale Price $60.17
Rationale: Although this Consumer Staples name has only been trading since Sep 2012 the prevailing trend remains favorable. The 7/26/13 negative outside week and the failure to convincing breakout above the high 50s have led to a trading range between low-to-mid 50s and high-50s. Nonetheless, a Feb ’14 positive outside month as well as a posi-tive outside week pattern on 3/7/14 hint of an impending breakout. However, a 7/11/14 negative outside and the Jul'14 negative outside month pattern and weak relative strength (vs SPX) suggest further technical base is needed.
Technical Review of Stocks
UBS CIO WM Research 2 December 2014 16

Lam Research Corp (LRCX)
2010 2011 2012 2013 2014
3030
4040
5050
6060
7070
8080
Price 10-Week Moving Average 30-Week Moving Average
Source: FactSet, UBS CIO WMR as of 28 November 2014 Support levels Resistance levels
First Second Third First Second Third 75-77 70-71 65-67 87 90-91 94
Technical rating Bullish Sector Technology
Last Sale Price $82.64
Rationale: We remain bullish on LRCX primarily due to a breakout above a large basing pattern dating back to 2000. A positive outside month on Apr ‘13, an upside gap breakout in Apr/Jul ’13 and favorable relative strengths against SPX and SOX helped this stock complete a 28-point basing pattern (shown above). This recent breakout suggests in-termediate targets into the high-80s. We recommend raising initial support to 75-77 or close to the Sep '14 highs, Oct '14 gap up, Nov '14 lows and the 10-week ma. Initial supply is at 87 and then to the low-to-mid 90s, over time.
Macy’s Inc (M)
2010 2011 2012 2013 2014
2020
3030
4040
5050
6060
Price 10-Week Moving Average 30-Week Moving Average
Source: FactSet, UBS CIO WMR as of 28 November 2014 Support levels Resistance levels
First Second Third First Second Third 58-60 54.82 47.3-50 67.25 72-72.50 78
Technical rating Bullish Sector Cons. Disc.
Last Sale Price $64.91
Rationale: A breakout of a multi-year accumulation pattern above the 2007 highs or 46.52 in mid-2013 reaffirms our technical bullish stance. Over the intermediate term, an upside gap on 11/13/13 and positive outside month patterns in Oct ’13, Feb '14 and Aug '14 should are all bullish conditions. On the other hand, 8/15/14 negative outside week pat-tern hints of a consolidation. Near-term we see a trading range develop between mid-50s and low-to-mid 60s. In the meantime we recommend raising initial support to as high as 58-60 or the 10- /30- week ma and then mid-50s.
Technical Review of Stocks
UBS CIO WM Research 2 December 2014 17

Marriott (MAR)
2010 2011 2012 2013 20142020
3030
4040
5050
6060
7070
8080
Price 10-Week Moving Average 30-Week Moving Average
Source: FactSet, UBS CIO WMR as of 28 November 2014 Support levels Resistance levels
First Second Third First Second Third 73-74 65 +/- 1 59.61 81-81.50 85-86 90-91
Technical rating Bullish Sector Consumer Disc.
Last Sale Price $78.79
Rationale: We initiate MAR with an intermediate term technical Bullish outlook based on the 7-plus year accumulation pattern breakout above 48.48 earlier in the year. The 37 point basing pattern suggests an upside target of the mid-to-high 80s over the intermediate term. In addition, the Feb/Oct '14 positive outside month patterns, rising key movingaverages and favorable relative strength versus S&P 500 Index support our bullish technical views. Initial support is visi-ble along 73-74 or near the Sep '14 highs and Nov '14 lows. On the upside, the low-to-mid 80s is key initial supply.
Mondelez International Inc (MDLZ)
2010 2011 2012 2013 2014
2020
2525
3030
3535
4040
Price 10-Week Moving Average 30-Week Moving Average
Source: FactSet, UBS CIO WMR as of 28 November 2014
Support levels Resistance levels
First Second Third First Second Third 36 +/- 0.50 32 +/- 0.25 28-28.5 39.54 44 47-47.50
Technical rating Neutral Sector Cons. Staples
Last Sale Price $39.20
Rationale: A key breakout in Mar ‘13 above an 11-year technical base supports our longer-term bullish outlook. How-ever from a near-to-intermediate term perspective this Food and Beverage company shares appears to be overbought and in need of a consolidation. The 19.5% correction during Jul-Oct '14 has led to a temporary bree3ch of its 10-wk/30-wk ma and slight break of the top of its 2009 uptrend channel. However, the ability to maintain the bottom of the uptrend channel and a quick reversal above key moving averages suggest a retest of prior Jul '14 highs at 39.54.
Technical Review of Stocks
UBS CIO WM Research 2 December 2014 18

Medtronic Inc. (MDT)
2010 2011 2012 2013 2014
3030
3535
4040
4545
5050
5555
6060
6565
7070
7575
Price 10-Week Moving Average 30-Week Moving Average
Source: FactSet, UBS CIO WMR as of 28 November 2014 Support levels Resistance levels
First Second Third First Second Third 68 +/- 1 60 +/- 1 55 +/- 1 77-78 82 87-87.50
Technical rating Bullish Sector HealthCare
Last Sale Price $73.87
Rationale: A pending merger/acquisition deal will likely influence the stock price, near term. Nonetheless, we retain a bullish technical outlook based on its favorable uptrend and relative strength. This Healthcare name has confirmed a major breakout above its 2000/2006 highs at 60-62 in Jan/Apr ‘14. The ability of this stock to stay above its previous(2000) all-time highs would reinforce the bullish uptrend. The negation of the Apr '14 negative outside month as well as positive outside months during Aug/Oct '14 favor higher prices over the intermediate to longer term perspectives.
MetLife (MET)
2010 2011 2012 2013 2014
2525
3030
3535
4040
4545
5050
5555
6060
Price 10-Week Moving Average 30-Week Moving Average
Source: FactSet, UBS CIO WMR as of 28 November 2014 Support levels Resistance levels
First Second Third First Second Third 53.25-53.50 49-51 45.52-46.15 56.60-57.57 65.50 71.23
Technical rating Neutral Sector Financials
Last Sale Price $55.61
Rationale: We initiate MetLife with a technical Neutral outlook. Although the long-term trend starting from the 2009 lows remains bullish, the stock appears to be consolidating over the near-to-intermediate term. This is confirmed by the flat trends from the 10-wk as well and the 30-wk moving averages as well as a rising wedge pattern. Nonetheless, we are impressed by the stock's recovery during Oct '14 and the 11/21/14 positive outside week pattern. A convincing move above the high-50s would negate the wedge pattern and signals the continuation of the recovery phase.
Technical Review of Stocks
UBS CIO WM Research 2 December 2014 19

Merck & Co (MRK)
2010 2011 2012 2013 2014
3030
3535
4040
4545
5050
5555
6060
Price 10-Week Moving Average 30-Week Moving Average
Source: FactSet, UBS CIO WMR as of 28 November 2014 Support levels Resistance levels
First Second Third First Second Third 57-58 52.49-54.10 44.62-47.61 61-62 66-68 71-72
Technical rating Bullish Sector Healthcare
Last Sale Price $60.40
Rationale: In 2013, this Pharmaceutical name has broken out of a major 2000/2007 downtrend (not shown) along the low-40s. This action confirms the start of an intermediate term turnaround. However, MRK is facing major resistance near the low-60s or close to 2007/2008 highs. The relative strength as it relates to the S&P 500 Index continues to lag the market ever since the 2000/2007 downtrend. Nonetheless, the Nov ’13 positive outside month pattern, the largeJan ’14 upside gap and the Aug '14 positive outside month pattern favor an impending breakout in the near future.
Microsoft Inc. (MSFT)
2010 2011 2012 2013 2014
2525
3030
3535
4040
4545
5050
Price 10-Week Moving Average 30-Week Moving Average
Source: FactSet, UBS CIO WMR as of 28 November 2014 Support levels Resistance levels
First Second Third First Second Third 42.10-42.21 37-38.50 34-35 50.05 54.50-55 58-59
Technical rating Bullish Sector Technology
Last Sale Price $47.81
Rationale: MSFT has managed to finally clear above its neckline resistance along 37-38 in 2013. The completion of this large 13-plus year Head and Shoulders bottom pattern suggests 21-points or upside targets to as high as 58-59, longer term. In the near-term, relative outperformance of the stock versus SPX Index can extend the rally to the 76.4%retracement as well as the channel breakout projection near 50. Key initial support resides at 42.10-42.21 or near the Aug/Oct '14 lows. Secondary support lies at 37-38.5 or the Nov ’13 highs/May ’14 lows.
Technical Review of Stocks
UBS CIO WM Research 2 December 2014 20

Nike Inc. Cl B (NKE)
2010 2011 2012 2013 2014
3030
4040
5050
6060
7070
8080
9090
100100
Price 10-Week Moving Average 30-Week Moving Average
Source: FactSet, UBS CIO WMR as of 28 November 2014 Support levels Resistance levels
First Second Third First Second Third 91-93 83.85 75 +/- 2 100 +/- 2 110 +/- 2 116-116.50
Technical rating Bullish Sector C. Discretionary
Last Sale Price $99.29
Rationale: We maintain a technical bullish stance on NKE due to the strong breakout above 2009 uptrend channeland the positive outside month patterns in Feb '14 and Aug '14. However, the 12/13/13, 3/21/14 and 8/1/14 negative outside weeks as the recent sharp rally suggest an overbought condition developing. Nonetheless, a recent gap up on 9/26/14 as well as a subsequent positive outside week formation also during Sep '14 has ignited another rally. Initial support now moves up to 91-93 or the 10-wk ma and Sep '14 highs and then 83.25-83.85 or 30-wk ma and Oct low.
Qualcomm Inc (QCOM)
2010 2011 2012 2013 2014
3030
4040
5050
6060
7070
8080
Price 10-Week Moving Average 30-Week Moving Average
Source: FactSet, UBS CIO WMR as of 28 November 2014 Support levels Resistance levels
First Second Third First Second Third 67.67 65 +/- 0.5 59-60 78.53 81.97 88-89
Technical rating Neutral Sector Technology
Last Sale Price $72.90
Rationale: We retain a neutral technical stance on QCOM. The primary trend from 2002 lows remains favorable. However, the stock paints a mixed picture over the near-to-intermediate term horizon. A gap down on 7/24/14 soon led to a negative outside month pattern by July ’14. Nonetheless, the Oct '14 positive outside month pattern keeps the longer-term constructive. Another gap down on 11/6/14 needs to be monitored closely as this warns of selling pres-sure. Given the mixed outlook, we can expect a trading range to develop between the high-60s and the high-70s.
Technical Review of Stocks
UBS CIO WM Research 2 December 2014 21

SBA Communications (SBAC)
2010 2011 2012 2013 20142020
4040
6060
8080
100100
120120
Price 10-Week Moving Average 30-Week Moving Average
Source: FactSet, UBS CIO WMR as of 28 November 2014 Support levels Resistance levels
First Second Third First Second Third 116.05 108.73 103.83 127-127.50 135-136 142-142.5
Technical rating Bullish Sector Telecom
Last Sale Price $121.67
Rationale: We maintain a technical bullish stance on SBAC as a multi-year breakout above the high-50s in mid-2012 suggests higher prices. This 57-point technical base suggests a technical target to the high 120s, intermediate-term. More recently, the Oct '14 positive outside month pattern reaffirm the bulls are in control of this stock. Also the strongrelative strength of this stock as it relates to the S&P 500 index indicates a leadership name. Initial support lies near 116.05 or the Oct '14 high. To the upside, Initial supply is 127-127.50 and then above this to mid-130s.
Starbucks Corp. (SBUX)
2010 2011 2012 2013 2014
2020
3030
4040
5050
6060
7070
8080
Price 10-Week Moving Average 30-Week Moving Average
Source: FactSet, UBS CIO WMR as of 28 November 2014 Support levels Resistance levels
First Second Third First Second Third 75 +/- 1 70 +/- 1 66.30 82.50 89-90 93-94
Technical rating Bullish Sector C. Discretionary
Last Sale Price $81.21
Rationale: The bullish trend from the 2008-09 lows continues to support higher prices over time. In addition, a multi-year breakout above the 2006 highs in late-2011 reaffirms an uptrend. An overbought condition has led a 1-year cor-rection. However, the ability of this stock to bounce from its Feb/Apr ‘14 lows (high 60s) is technically constructive as this signals an impending symmetrical triangle pattern between the high-60s/low-70s and high-70s. A convincing moveabove 82.50 renders next upside to the high-80s over the intermediate term. Initial supply lies near 10-/ 30- week ma.
Technical Review of Stocks
UBS CIO WM Research 2 December 2014 22

Schlumberger Ltd (SLB)
2010 2011 2012 2013 2014
5050
6060
7070
8080
9090
100100
110110
120120
Price 10-Week Moving Average 30-Week Moving Average
Source: FactSet, UBS CIO WMR as of 28 November 2014 Support levels Resistance levels
First Second Third First Second Third 80-83.25 76-77 66.85-69 86.68-92.30 100.54 112
Technical rating Neutral Sector Energy
Last Sale Price $85.95
Rationale: This influential Oil Service name has a tendency to lead major turns in both the Energy sector/WTI Crude Oil. Earlier, a breakout of the top of its 5-year triangle pattern in the low-to-mid 90s led to superior performance of stock on both an absolute and relative basis before finding resistance at 118.76 or the Jul '14 highs. However a 27.6% decline from Jul '14 highs paints a weak picture on a near-to-intermediate term basis. Deteriorating relative strength (vs SPX) and negative outside weeks on 11/14/14 and 11/28/14 warns of further volatility possibly to the mid-70s.
SanDisk Corp (SNDK)
2010 2011 2012 2013 2014
2020
4040
6060
8080
100100
Price 10-Week Moving Average 30-Week Moving Average
Source: FactSet, UBS CIO WMR as of 28 November 2014 Support levels Resistance levels
First Second Third First Second Third 96-97 91.07-93.5 80.26 108-109 117-117.50 125-126
Technical rating Bullish Sector Technology
Last Sale Price $103.46
Rationale: Despite of a gap down on 7/17/14 and a negative outside July ’14 month pattern, we maintain a technical bullish outlook on SNDK. A convincing move above its previous all-time highs near 84.81 or the 2000 highs is positive. In addition, 11/14/14 positive outside week pattern, constructive relative strength trends, and improved risk-reward profile strengthen our bullish technical views. A convincing move above 108.77 or the recent Jul '14 all-time highs ren-ders the stock at uncharted territory thereby attracting new trading and investment interests.
Technical Review of Stocks
UBS CIO WM Research 2 December 2014 23

Southern Co. (SO)
2010 2011 2012 2013 2014
3030
3535
4040
4545
5050
Price 10-Week Moving Average 30-Week Moving Average
Source: FactSet, UBS CIO WMR as of 28 November 2014 Support levels Resistance levels
First Second Third First Second Third 45.5-46.5 40-42 35.5-36.5 47.69-48.74 52.5-53 54.50-55
Technical rating Bearish Sector Utilities
Last Sale Price $47.43
Rationale: We retain a technically bearish view on SO. A breakdown below 2009 uptrend line and the longer-term relative underperformance of the stock to SPX reaffirm our negative outlook. Negative outside week patterns on 5/2/14, 7/4/14, 8/1/14, 9/12/14 and 10/31/14 warn of further volatility. Although the stock could sustain technical oversold rallies we expect that it will likely struggle nears its formidable resistance along 47.69-48.74 or the 2009 up-trend. Initial support moves up to 45.5-46.5 or the recent mid-Oct/Nov '14 lows and then near the low-40 s (40-42).
Texas Instruments Incorporated (TXN)
2010 2011 2012 2013 20142020
2525
3030
3535
4040
4545
5050
5555
Price 10-Week Moving Average 30-Week Moving Average
Source: FactSet, UBS CIO WMR as of 28 November 2014 Support levels Resistance levels
First Second Third First Second Third 48-49 44.50-45 40-41.50 55-56 60-61 65-66
Technical rating Bullish Sector Technology
Last Sale Price $54.42
Rationale: TXN completed a major breakout above 40 or the 2007 highs as well as neckline resistance along a large 2002 head/shoulders bottom pattern (not shown). In addition, the surge above the low-to-mid 30s solidifies a 4 year symmetrical triangle breakout. Also, the Oct '14 positive outside month pattern as well as improving relative strength against SPX reaffirms the bulls are in control, at least from an intermediate term perspective. Based on the above near-term positive developments, we raise initial support to 48-49 or near the Apr/Jul/Sep '14 highs and 10-/ 30- week ma.
Technical Review of Stocks
UBS CIO WM Research 2 December 2014 24

Union Pacific Corp (UNP)
2010 2011 2012 2013 20142020
4040
6060
8080
100100
120120
Price 10-Week Moving Average 30-Week Moving Average
Source: FactSet, UBS CIO WMR as of 28 November 2014 Support levels Resistance levels
First Second Third First Second Third 115 +/- 1 110 +/- 1 105 +/- 1 127-128 134-135 141-142
Technical rating Bullish Sector Industrials
Last Sale Price $116.77
Rationale: We maintain a technical bullish outlook on UNP as a convincing higher highs pattern keeps investors active in the Transportation name. A positive outside month formation on Aug '14 and Oct '14 further reaffirms the bulls arein control. To protect near term gains, we recommend raising initial support to 115 +/- 1 or to the Nov '14 lows, 10-week ma and the extension of the 2010 uptrend broadening formation. Secondary support also moves up to 110 +/ -1 coinciding with the Sep '14 highs and the 10/23/14 gap up as well as the top of the 2012 channel.
United Parcel Service (UPS)
2010 2011 2012 2013 20145050
6060
7070
8080
9090
100100
110110
Price 10-Week Moving Average 30-Week Moving Average
Source: FactSet, UBS CIO WMR as of 28 November 2014 Support levels Resistance levels
First Second Third First Second Third 102 +/- 2 93.19-94.05 89 114-115 120-121 128-128.5
Technical rating Bullish Sector Industrials
Last Sale Price $109.92
Rationale: We maintain a bullish stance on this Air Freight name. A convincing surge above the 2004 high (prior all-time highs - 89.11) or multi-year accumulation pattern drives our long-term bullish outlook. Although the 01/03/14, 10/10/14 negative outside week patterns led to a consolidation; a solid rally from Oct '14 low allows for the continua-tion of the primary uptrend. The recent Oct '14 positive outside month pattern, a successful breakout above 108-109can extend the rally to new all-time highs. Initial support is 102 +/- 2 or the Sep '14 high and the 10/31/14 gap up.
Technical Review of Stocks
UBS CIO WM Research 2 December 2014 25

United Technologies Corp (UTX)
2010 2011 2012 2013 2014
6060
7070
8080
9090
100100
110110
120120
Price 10-Week Moving Average 30-Week Moving Average
Source: FactSet, UBS CIO WMR as of 28 November 2014 Support levels Resistance levels
First Second Third First Second Third 100 +/- 3 90 +/- 2 82.50-83 110 +/- 3 120 +/- 1 128
Technical rating Neutral Sector Industrials
Last Sale Price $110.08
Rationale: Although the longer-term trend remains bullish, the July ’14 breakdown of 2012 uptrend warns of a deep-er correction. The rolling over of the 10-week and 30-week moving averages also confirms a death cross technical sell signal. Nonetheless, the 11/21/14 positive outside week pattern hints of a technical recovery. Initial support resides at 100 +/- 3 or near the Aug/Oct '14 lows. To the upside, initial resistance lies at 110 +/- 3 or the 2012 uptrend channel breakdown as well as the Aug/Sep '14 highs and the 30 week ma.
VMware Inc (VMW)
2010 2011 2012 2013 20143030
4040
5050
6060
7070
8080
9090
100100
110110
120120
Price 10-Week Moving Average 30-Week Moving Average
Source: FactSet, UBS CIO WMR as of 28 November 2014 Support levels Resistance levels
First Second Third First Second Third 80-82.11 74-75 70 88-90 95-97.50 103.86
Technical rating Bearish Sector Technology
Last Sale Price $87.96
Rationale: We retain our technical bearish outlook on VMW based primarily on the following negative developments: a Fan formation breakdown, a complex head and shoulders top breakdown in the low-80s, increased in volatility via downside gaps during Mar ’14 and Apr ‘14, a large downside gap on 4/23/14 and a negative outside month in Apr'14. Also, recent failure to convincingly clear above the extension of the third fan line near 100-105 led to a recent cor-rection. Initial support is 80-82 or the Oct/Nov '14 lows. Initial supply lies near 88-90 or the Jan/ Apr '14 lows.
Technical Review of Stocks
UBS CIO WM Research 2 December 2014 26

Statement of Risk Stock market returns are difficult to forecast because of fluctuations in the economy, investor psychology, geo-political conditions and other important variables.
Appendix Technical Research Rating DefinitionsRating Corresponding
Rating Category
Definition and criteria
Bullish Buy Well-defined, reliable uptrend, an increase in the rate of change (or strong momentum) and confirming technical indicators
NeutralHold Trading range trend, a flat rate of change and confirming technical indicators
Bearish Sell Negative or weakened trend, momentum and confirming technical indicators
N/A Not enough historical data to make an evaluation
Description and Methodology This report provides technical analysis on a dynamic list of stocks that, we believe, are of a wide interest. Please note that technical views are highly variable and will change with market conditions. Accordingly, these ratings are only valid as of the publication date. Because CIO WMR equity sector analysts and WMR technical analysts employ different analytical methodologies, technical recommendations are, at times, contradictory to fundamental recommendations for the same security. For the latest company ratings by WMR sector analysts, please refer to the most recent equity sector research reports, located in the Equity Section on the Online Services Research website. For more background on the content of this report, please see Technical Analysis Research Primer, 18 February 2010.
Technical Review of Stocks
UBS CIO WM Research 2 December 2014 27

Appendix
Term / Abbreviation Description / Definition
% +or- Moving Average (DMA)
The percentage above or below the moving average (see Moving Average) is used to help measure an overbought or oversold condi-tion and is a component of risk management. It is calculated by taking the difference between the group price and its 30-week mov-ing average (see below), and then dividing by the 30-week moving average times 100.
30-Week Moving Average
Also known as the 30-week line or 150-day line), this is one of the most popular and respected moving average indicators (see Mov-ing Average) in technical circles. It is calculated by totaling the latest 30 weekly (usually Friday closing) prices and dividing by 30 to arrive at the average. Each week, the most recent week’s figure is added to the total, and the price level from 30 weeks ago is sub-tracted – hence the term “moving.” Please note that a breakout above or breakdown below this line does not, in and of itself, con-stitute a buy or sell signal.
Adjusted Relative Strength (ARS)
Number gives a 50% weighting to the 1-month relative strength, 30% to the 3-month, and 20% to the 6-month numbers to arrive at a single weighted number.
Base A chart pattern marking a period of accumulation following a downtrend. The larger the base, the greater the upside potential fol-lowing its completion. A base can take many forms.
Beta A measure of volatility of a security as it relates to the market as a whole. Beta is often calculated using regression analysis. A beta is basically the tendency of a security’s returns to respond to swings in the market. A beta of 1 indicates that the security’s price will move with the market. A beta of less than 1 means the security will be less volatile than the market. A beta of greater than 1 implies that the security’s price will be more volatile than the market.
Blow off stage to a major rally
This is often the last stage of a speculative bubble to a major rally. The blow off phase tends to be steep, but short-lived that often affords little opportunity for investors/traders to exit their positions. As price of a security or an asset advanced to an unsustainable level via a parabolic uptrend this give rise to the bursting of the speculative bubble resulting a quick and dramatic decline as inves-tors/traders try to exit the market/security at the same time.
Breakdown A technical term indicating a downside resolution of a chart pattern. Its significance is determined by the same factors governing a breakout.
Breakout A technical term indicating an upside resolution of a chart pattern. Breakouts can take many forms, and their degree of importance is determined by the significance of the chart pattern which preceded it.
Broadening Top For-mation
The Broadening top is a rare technical formation that resembles an inverted triangle pattern. It is formed by price swings that are increasingly widening and expanding volume. The most common of these broadening top patterns are the three ascending peaks and two descending troughs. The combination of wide price swings and increasing volume often convey an increasingly volatile and emo-tional market that's basically out of control. This pattern is often associated with market tops rather than market bottoms. The con-firmation of the Broadening top occurs when the price violates the second of these two troughs.
Channel
A chart pattern comprised of two parallel trend lines, which form a trading band. Channels take the form of uptrend, downtrend and horizontal.
Death Cross The opposite of a golden cross, this is a crossover on the chart resulting from a security’s shorter-term moving average falling below its longer-term moving average. Technicians often see this as a bearish technical sign indicating the market has turned negative on the security.
Downtrend Line
A trend line connecting successively lower peaks for a stock (or market). Its technical significance is determined by the same factors governing an uptrend line.
Fan reversal pattern The fan formation is a technical pattern that is based on the use of multiple trend lines to denote a major trend reversal. The fan pattern gets its name as it basically resembles a “fan”. It should have a minimum of three trend lines (uptrends or downtrends). The break out/break down of the third downtrend/uptrend often completes the fan pattern and signals the start of a major trend reversal. The starting point of these trend lines should come from a significant peak or a significant trough.
Fibonacci Retrace-ment Level
A technical analysis term used to describe potential areas of support (price stops declining) or resistance (price stops rising) on the charts. After a strong rally or decline there is a tendency for a security to retrace a certain portion of its prior move (up or down). Fibonacci retracements use horizontal lines to indicate areas of support or resistance at the key Fibonacci levels before continuing in the original direction. These levels are computed by taking the two extreme points and then dividing the vertical distance by the key Fibonacci ratios of 23.6%, 38.2%, 50%, 61.8% and 100%.
FSR Forecast Stock Return is defined as expected percentage price appreciation plus gross dividend yield over the next 12 months.
Gap
An open space in a chart created when a stock (or market) opens either higher than its highest level attained during the prior session (referred to as a gap up or an upside chart gap) or lower than its lowest level reached during the prior day (called a gap down or a downside chart gap). Some gaps are caused by events and should be ignored: ex-dividend gaps, new share issues, and expiration of futures contracts.
Golden Cross A crossover on the chart that involves a security’s shorter-term moving average (such as the 50-day moving average) crossing above its longer-term moving average (such as the 150-day or 200-day moving average). Technicians often interpret this crossing of two moving averages as a bullish technical sign that suggests the market has turned in favour of the security.
Technical Review of Stocks
UBS CIO WM Research 2 December 2014 28
Appendix
Term / Abbreviation Description / Definition
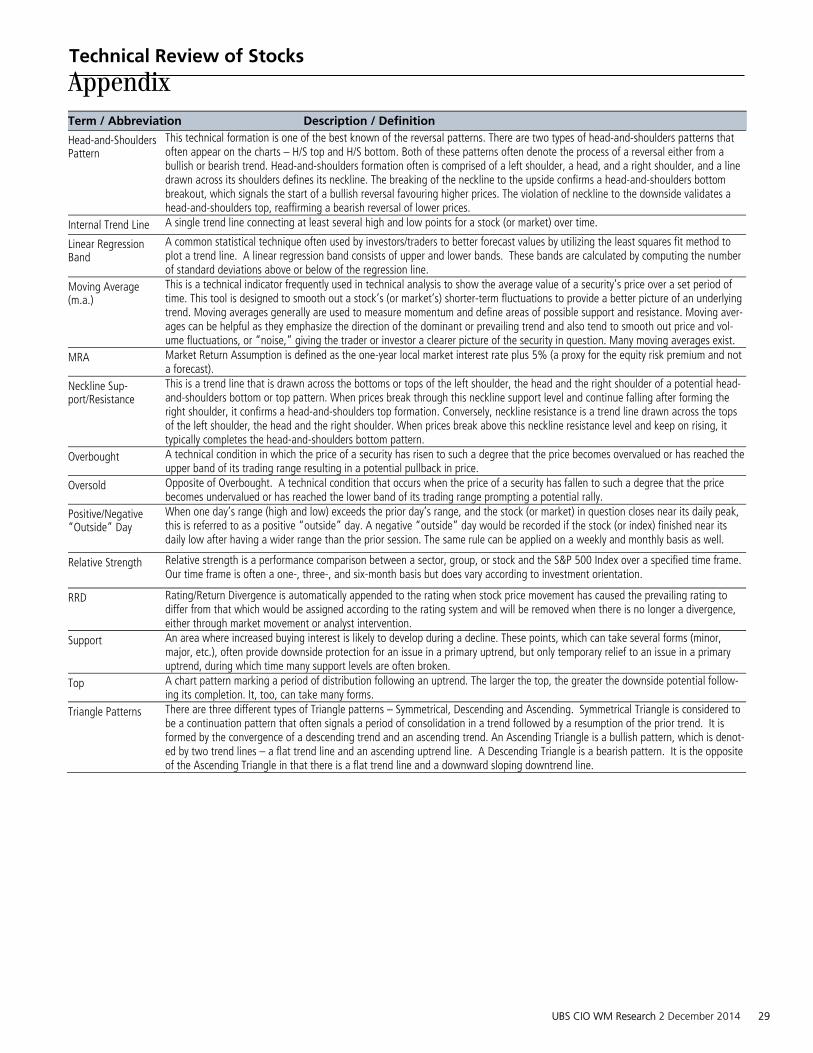
Head-and-Shoulders Pattern
This technical formation is one of the best known of the reversal patterns. There are two types of head-and-shoulders patterns that often appear on the charts – H/S top and H/S bottom. Both of these patterns often denote the process of a reversal either from a bullish or bearish trend. Head-and-shoulders formation often is comprised of a left shoulder, a head, and a right shoulder, and a line drawn across its shoulders defines its neckline. The breaking of the neckline to the upside confirms a head-and-shoulders bottom breakout, which signals the start of a bullish reversal favouring higher prices. The violation of neckline to the downside validates a head-and-shoulders top, reaffirming a bearish reversal of lower prices.
Internal Trend Line A single trend line connecting at least several high and low points for a stock (or market) over time.
Linear Regression Band
A common statistical technique often used by investors/traders to better forecast values by utilizing the least squares fit method to plot a trend line. A linear regression band consists of upper and lower bands. These bands are calculated by computing the number of standard deviations above or below of the regression line.
Moving Average (m.a.)
This is a technical indicator frequently used in technical analysis to show the average value of a security’s price over a set period of time. This tool is designed to smooth out a stock’s (or market’s) shorter-term fluctuations to provide a better picture of an underlying trend. Moving averages generally are used to measure momentum and define areas of possible support and resistance. Moving aver-ages can be helpful as they emphasize the direction of the dominant or prevailing trend and also tend to smooth out price and vol-ume fluctuations, or “noise,” giving the trader or investor a clearer picture of the security in question. Many moving averages exist.
MRA Market Return Assumption is defined as the one-year local market interest rate plus 5% (a proxy for the equity risk premium and not a forecast).
Neckline Sup-port/Resistance
This is a trend line that is drawn across the bottoms or tops of the left shoulder, the head and the right shoulder of a potential head-and-shoulders bottom or top pattern. When prices break through this neckline support level and continue falling after forming the right shoulder, it confirms a head-and-shoulders top formation. Conversely, neckline resistance is a trend line drawn across the tops of the left shoulder, the head and the right shoulder. When prices break above this neckline resistance level and keep on rising, it typically completes the head-and-shoulders bottom pattern.
Overbought A technical condition in which the price of a security has risen to such a degree that the price becomes overvalued or has reached the upper band of its trading range resulting in a potential pullback in price.
Oversold Opposite of Overbought. A technical condition that occurs when the price of a security has fallen to such a degree that the price becomes undervalued or has reached the lower band of its trading range prompting a potential rally.
Positive/Negative “Outside” Day
When one day’s range (high and low) exceeds the prior day’s range, and the stock (or market) in question closes near its daily peak, this is referred to as a positive “outside” day. A negative “outside” day would be recorded if the stock (or index) finished near its daily low after having a wider range than the prior session. The same rule can be applied on a weekly and monthly basis as well.
Relative Strength
Relative strength is a performance comparison between a sector, group, or stock and the S&P 500 Index over a specified time frame. Our time frame is often a one-, three-, and six-month basis but does vary according to investment orientation.
RRD Rating/Return Divergence is automatically appended to the rating when stock price movement has caused the prevailing rating to differ from that which would be assigned according to the rating system and will be removed when there is no longer a divergence, either through market movement or analyst intervention.
Support An area where increased buying interest is likely to develop during a decline. These points, which can take several forms (minor, major, etc.), often provide downside protection for an issue in a primary uptrend, but only temporary relief to an issue in a primary uptrend, during which time many support levels are often broken.
Top A chart pattern marking a period of distribution following an uptrend. The larger the top, the greater the downside potential follow-ing its completion. It, too, can take many forms.
Triangle Patterns There are three different types of Triangle patterns – Symmetrical, Descending and Ascending. Symmetrical Triangle is considered to be a continuation pattern that often signals a period of consolidation in a trend followed by a resumption of the prior trend. It is formed by the convergence of a descending trend and an ascending trend. An Ascending Triangle is a bullish pattern, which is denot-ed by two trend lines – a flat trend line and an ascending uptrend line. A Descending Triangle is a bearish pattern. It is the opposite of the Ascending Triangle in that there is a flat trend line and a downward sloping downtrend line.
Technical Review of Stocks
UBS CIO WM Research 2 December 2014 29

Appendix
Statement of RiskStock market returns are difficult to forecast because of fluctuations in the economy, investor psychology, geopoliticalconditions and other important variables.
Analyst certificationEach research analyst primarily responsible for the content of this research report, in whole or in part, certifies that withrespect to each security or issuer that the analyst covered in this report: (1) all of the views expressed accurately reflect hisor her personal views about those securities or issuers; and (2) no part of his or her compensation was, is, or will be, directlyor indirectly, related to the specific recommendations or views expressed by that research analyst in the research report.
Required Disclosures
For a complete set of required disclosures relating to the companies that are the subject of this report, please mail arequest to UBS CIO Wealth Management Research Business Management, 1285 Avenue of the Americas, 20th Floor,Avenue of the Americas, New York, NY 10019.
Disclosures (2 December 2014)Abbott Laboratories 2, 5, 6, 7, 8, 10, 11, AbbVie 2, 5, 6, 10, 11, Accenture Plc 7, 8, 10, Aetna Inc. 2, 4, 5, 6, 7, 8, 10, 11,13, 14; American Express 2, 4, 6, 7, 8, 10, 11, 13, Ameriprise Financial 2, 4, 6, 10, 11, 12, 13, Anadarko Petroleum 2,5, 6, 7, 8, 10, 11, 13, 14; Apple Inc. 5, 7, 8, 10, 11, Applied Materials Inc. 7, 8, 10, Boeing Co. 2, 7, 8, 10, 12, CelaneseCorp. 5, 10, 11, Centene Corp. 6, 10, Cisco Systems Inc. 2, 4, 7, 8, 10, 11, 12, 13, Colgate-Palmolive Co. 2, 6, 7, 8, 10,13, 14; Comcast Corp. (Cl A) 2, 10, 12, 13, 14; Emerson Electric Co. 2, 5, 6, 10, 11, Express Scripts Inc. 2, 7, 8, 10, 13,14; General Electric Co. 1, 4, 5, 6, 7, 8, 10, 11, 12, 13, Google Inc. 2, 4, 5, 7, 8, 10, 11, 13, 14; Halliburton 7, 8, 10, 13,Intel Corp. 4, 5, 7, 8, 10, 11, 12, Invesco 3, 4, 5, 6, 7, 8, 10, 11, JPMorgan 2, 4, 5, 6, 7, 8, 10, 11, 13, 14; Kraft FoodsGroup Inc. 2, 5, 10, 11, LAM Research Corp. 10, Macy's Inc. 10, Marriott International Inc. 7, 8, 10, Medtronic Inc. 2, 4,5, 6, 7, 8, 10, 11, 13, 14; Merck and Co Inc 2, 4, 5, 7, 8, 10, 11, 12, 13, MetLife 2, 4, 5, 6, 7, 8, 10, 11, 13, 14; MicrosoftCorp. 2, 4, 5, 6, 7, 8, 10, 11, 13, Mondelez International 2, 6, 7, 8, 9, 10, 13, 14; Nike Inc. 10, QUALCOMM Inc 4, 7,8, 10, 11, Sandisk 10, SBA Communications Corp. 10, Schlumberger 7, 8, 10, Southern Company 2, 7, 8, 10, 13, 14;Starbucks Corp. 5, 10, 11, Texas Instruments Inc. 7, 8, 10, Union Pacific 7, 8, 10, United Parcel Service Inc. 4, 5, 6, 7, 8,10, 11, 13, United Technologies Corp. 7, 8, 10, 12, VMware, Inc 7, 8, 10,
1. UBS Limited is acting as co-advisor to Banco Santander on its acquisition of General Electric's Nordic Banking Business2. This company/entity is, or within the past 12 months has been, a client of UBS Securities LLC, and investment bankingservices are being, or have been, provided.3. UBS AG, its affiliates or subsidiaries beneficially owned 1% or more of a class of this company's common equitysecurities as of last month's end (or the prior month's end if this report is dated less than 10 days after the most recentmonth's end).4. This company/entity is, or within the past 12 months has been, a client of UBS Securities LLC, and non-investmentbanking securities-related services are being, or have been, provided.5. This company/entity is, or within the past 12 months has been, a client of UBS Securities LLC, and non-securities servicesare being, or have been, provided.6. UBS AG, its affiliates or subsidiaries expect to receive or intend to seek compensation for investment banking servicesfrom this company/entity within the next three months.7. This company/entity is, or within the past 12 months has been, a client of UBS Financial Services Inc, and non-investmentbanking securities-related services are being, or have been, provided.8. Within the past 12 months, UBS Financial Services Inc has received compensation for products and services other thaninvestment banking services from this company.9. UBS is acting as exclusive financial adviser to Mondelez International, Inc. on its announced acquisition of a majoritystake in Kinh Do Corporation.10. UBS Securities LLC makes a market in the securities and/or ADRs of this company.11. Within the past 12 months, UBS Securities LLC has received compensation for products and services other thaninvestment banking services from this company/entity.12. The equity analyst covering this company, a member of his or her team, or one of their household members has along common stock position in this company.13. Within the past 12 months, UBS AG, its affiliates or subsidiaries has received compensation for investment bankingservices from this company/entity.14. UBS AG, its affiliates or subsidiaries has acted as manager/co-manager in the underwriting or placement of securitiesof this company/entity or one of its affiliates within the past 12 months.
Technical Review of Stocks
UBS CIO WM Research 2 December 2014 30
Appendix
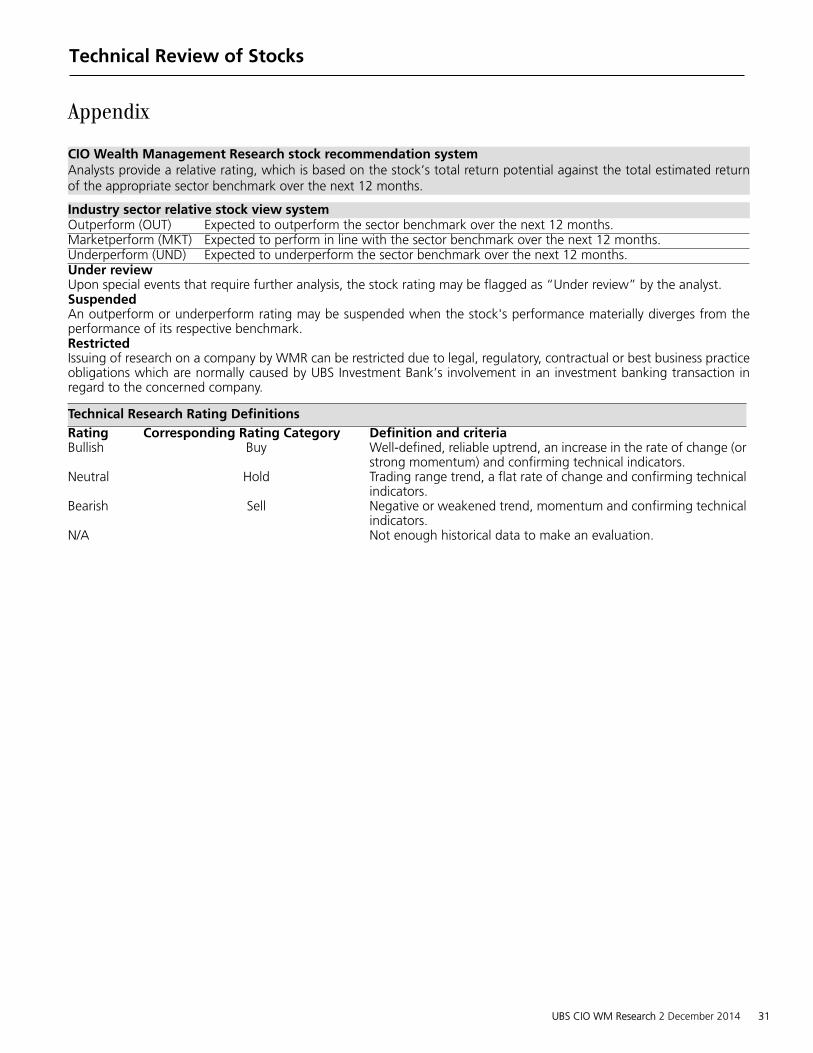
CIO Wealth Management Research stock recommendation systemAnalysts provide a relative rating, which is based on the stock’s total return potential against the total estimated returnof the appropriate sector benchmark over the next 12 months.
Industry sector relative stock view systemOutperform (OUT) Expected to outperform the sector benchmark over the next 12 months.Marketperform (MKT) Expected to perform in line with the sector benchmark over the next 12 months.Underperform (UND) Expected to underperform the sector benchmark over the next 12 months.Under reviewUpon special events that require further analysis, the stock rating may be flagged as “Under review” by the analyst.SuspendedAn outperform or underperform rating may be suspended when the stock's performance materially diverges from theperformance of its respective benchmark.RestrictedIssuing of research on a company by WMR can be restricted due to legal, regulatory, contractual or best business practiceobligations which are normally caused by UBS Investment Bank’s involvement in an investment banking transaction inregard to the concerned company.
Technical Research Rating DefinitionsRating Corresponding Rating Category Definition and criteriaBullish Buy Well-defined, reliable uptrend, an increase in the rate of change (or
strong momentum) and confirming technical indicators.Neutral Hold Trading range trend, a flat rate of change and confirming technical
indicators.Bearish Sell Negative or weakened trend, momentum and confirming technical
indicators.N/A Not enough historical data to make an evaluation.
Technical Review of Stocks
UBS CIO WM Research 2 December 2014 31

Appendix
Disclaimer
In certain countries UBS AG is referred to as UBS SA. This publication is for our clients’ information only and is not intended as an offer, ora solicitation of an offer, to buy or sell any investment or other specific product. It does not constitute a personal recommendation or takeinto account the particular investment objectives, financial situation and needs of any specific recipient. We recommend that recipients takefinancial and/or tax advice as to the implications of investing in any of the products mentioned herein. We do not provide tax advice. The analysiscontained herein is based on numerous assumptions. Different assumptions could result in materially different results. Other than disclosuresrelating to UBS AG, its subsidiaries and affiliates, all information expressed in this document were obtained from sources believed to be reliableand in good faith, but no representation or warranty, express or implied, is made as to its accuracy or completeness. All information and opinionsare current only as of the date of this report, and are subject to change without notice. This publication is not intended to be a completestatement or summary of the securities, markets or developments referred to in the report. Opinions may differ or be contrary to those expressedby other business areas or groups of UBS AG, its subsidiaries and affiliates. Chief Investment Office (CIO) Wealth Management (WM)Research is published by UBS Wealth Management and UBS Wealth Management Americas, Business Divisions of UBS AG (UBS) or an affiliatethereof. CIO WM Research reports published outside the US are branded as Chief Investment Office WM. UBS Investment Research is writtenby UBS Investment Bank. Except for economic forecasts, the research process of CIO WMR is independent of UBS Investment Research. Asa consequence research methodologies applied and assumptions made by CIO WMR and UBS Investment Research may differ, for example,in terms of investment horizon, model assumptions, and valuation methods. Therefore investment recommendations independently providedby the two UBS research organizations can be different. The analyst(s) responsible for the preparation of this report may interact with tradingdesk personnel, sales personnel and other constituencies for the purpose of gathering, synthesizing and interpreting market information. Thecompensation of the analyst(s) who prepared this report is determined exclusively by research management and senior management (notincluding investment banking). Analyst compensation is not based on investment banking revenues, however, compensation may relate to therevenues of UBS as a whole, of which investment banking, sales and trading are a part.UBS AG, its affiliates, subsidiaries and employees may trade as principal and buy and sell securities identified herein. At any time, investmentdecisions (including whether to buy, sell or hold securities) made by UBS AG, its affiliates, subsidiaries and employees may differ from or becontrary to the opinions expressed in UBS research publications. Some investments may not be readily realizable since the market in the securitiesis illiquid and therefore valuing the investment and identifying the risk to which you are exposed may be difficult to quantify. UBS relies oninformation barriers to control the flow of information contained in one or more areas within UBS, into other areas, units, groups or affiliates ofUBS. Some investments may be subject to sudden and large falls in value and on realization you may receive back less than you invested or maybe required to pay more. Changes in foreign currency exchange rates may have an adverse effect on the price, value or income of an investment.Past performance of an investment is not a guide to its future performance. Additional information will be made available upon request. Thisreport is for distribution only under such circumstances as may be permitted by applicable law. The securities described herein may not beeligible for sale in all jurisdictions or to all categories of investors. Distributed to US persons by UBS Financial Services Inc., a subsidiary of UBS AG.UBS Securities LLC is a subsidiary of UBS AG and an affiliate of UBS Financial Services Inc. UBS Financial Services Inc. accepts responsibility forthe content of a report prepared by a non-US affiliate when it distributes reports to US persons. All transactions by a US person in the securitiesmentioned in this report should be effected through a US-registered broker dealer affiliated with UBS, and not through a non-US affiliate. Thecontents of this report have not been and will not be approved by any securities or investment authority in the United States or elsewhere.Version as per May 2014.UBS specifically prohibits the redistribution or reproduction of this material in whole or in part without the prior written permission of UBS andUBS accepts no liability whatsoever for the actions of third parties in this respect.© UBS 2014. The key symboland UBS are among the registered and unregistered trademarks of UBS. All rightsreserved.
Technical Review of Stocks
UBS CIO WM Research 2 December 2014 32