Embed Size (px)
Citation preview
Technical UpdateDetection / Quantitation and PBMS
Richard Burrows
STL
ACIL Mid-Winter Meeting, February 2006
ACIL objectives
Technically reliable detection and quantitation procedures that are: Reasonably straightforward to perform Implemented widely through replacement
of the MDL and ML procedures at 40CFR Part 136 Appendix B
www.epa.gov/waterscience/methods/det
D/Q FACA
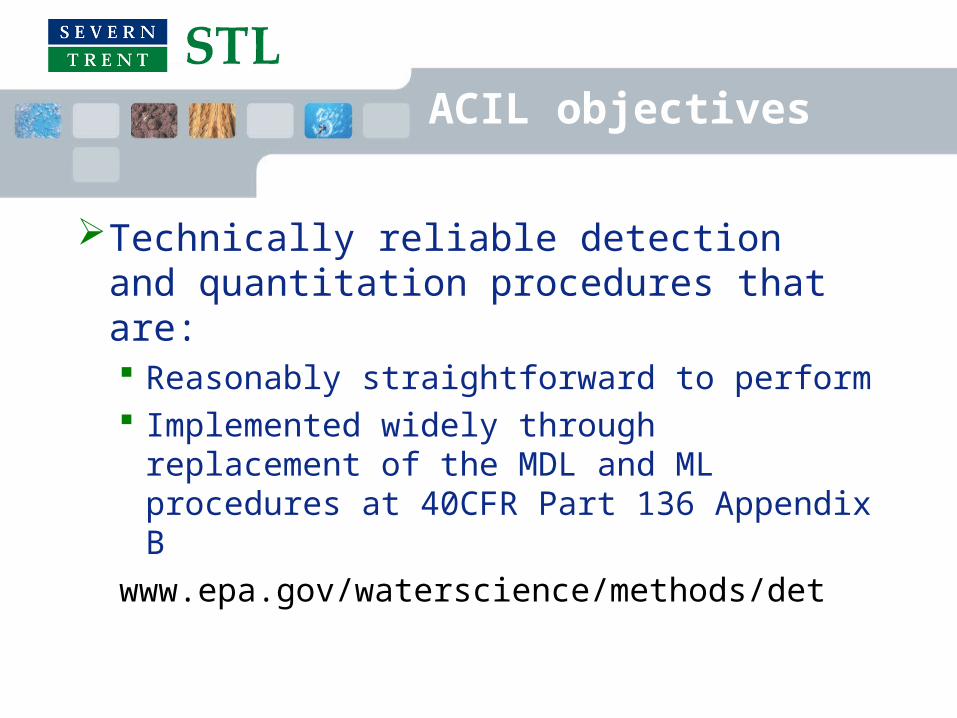
PeopleLab GroupRichard Burrows (STL)Steve Bonde (Batelle)Nan Thomey (Environmental Chemistry Inc)Cary Jackson (Hach Instruments)
State GroupBob Avery, Michigan DEQTimothy Fitzpatrick, Florida DEPThomas Mugan Wisconsin DNRDave Akers Colorado DEP
Industry GroupJohn Phillips, FordLarry LaFleur, NCASIRoger Claff, APIDavid Pilar, Exelon Power
EnvironmentalistsRichard Rediske, Michael MurrayBarry Sulkin
People
Wastewater treatment groupDavid KimboroughChris Hornback, National Association of Clean Water AgenciesJames Pletl, Hampton Road Sanitation DistrictZonetta English, Louisville and Jefferson County Metrepolitan Sewer District
Technical Workgroup
LabsRichard BurrowsSteve BondeStatesCliff Kirchmer, Washington State Dept of EcologyTim FitzpatrickIndustryJohn PhillipsLarry LaFleur
Treatment plantsJim PletlKen OsbornEnvironmentalistsRichard RediskeDavid Rocke, UC DavisFederalBill Foreman, USGSBill Ingersoll, Navy
Multi lab / Multi concentration procedures
IDE / IQE ASTM Procedures
LCMRL Drinking Water
Hubaux Vos
Single lab procedures
Detection ACIL procedure Consensus group procedure MDL Osborn
Single Lab procedures
Quantitation ML MRL Extension of ACIL procedure?
Single lab procedures
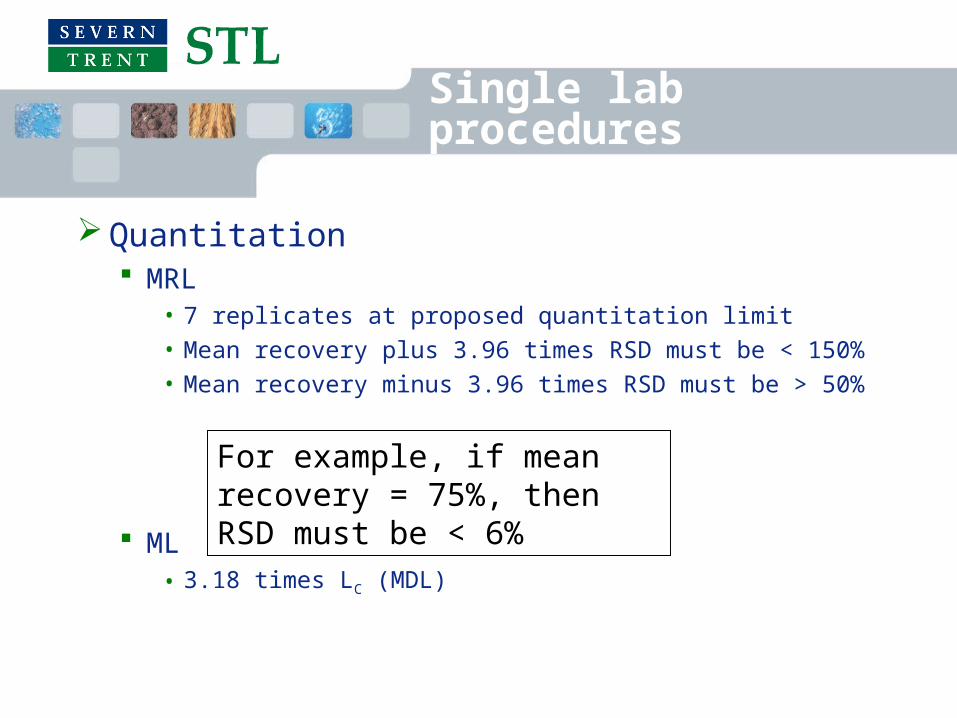
Quantitation MRL
• 7 replicates at proposed quantitation limit• Mean recovery plus 3.96 times RSD must be < 150%• Mean recovery minus 3.96 times RSD must be > 50%
ML• 3.18 times LC (MDL)
For example, if mean recovery = 75%, then RSD must be < 6%
Definitions
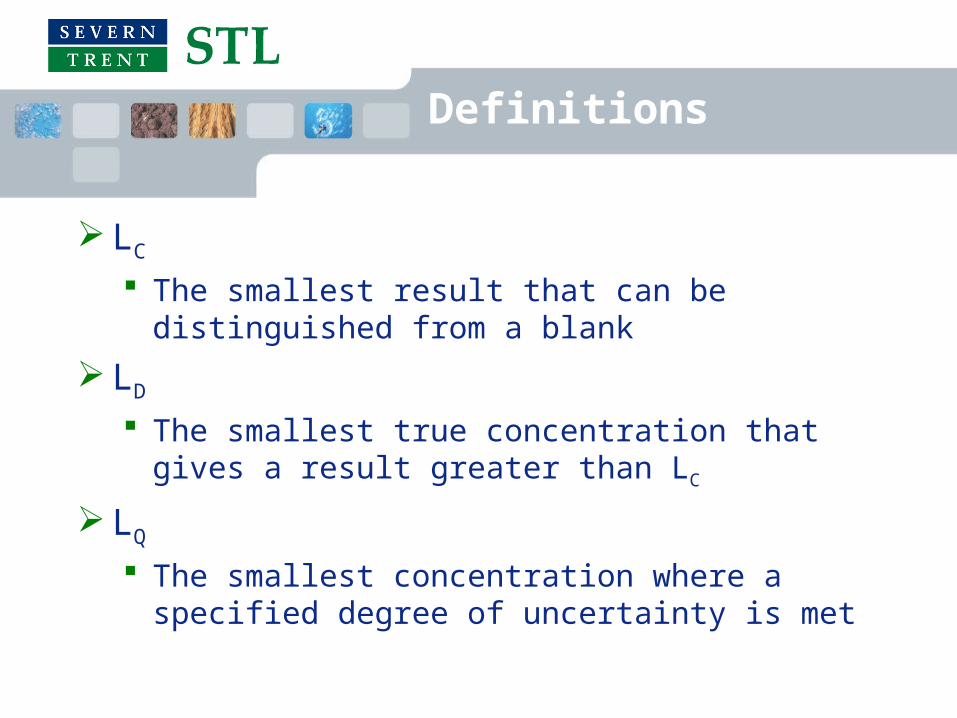
LC
The smallest result that can be distinguished from a blank
LD
The smallest true concentration that gives a result greater than LC
LQ
The smallest concentration where a specified degree of uncertainty is met
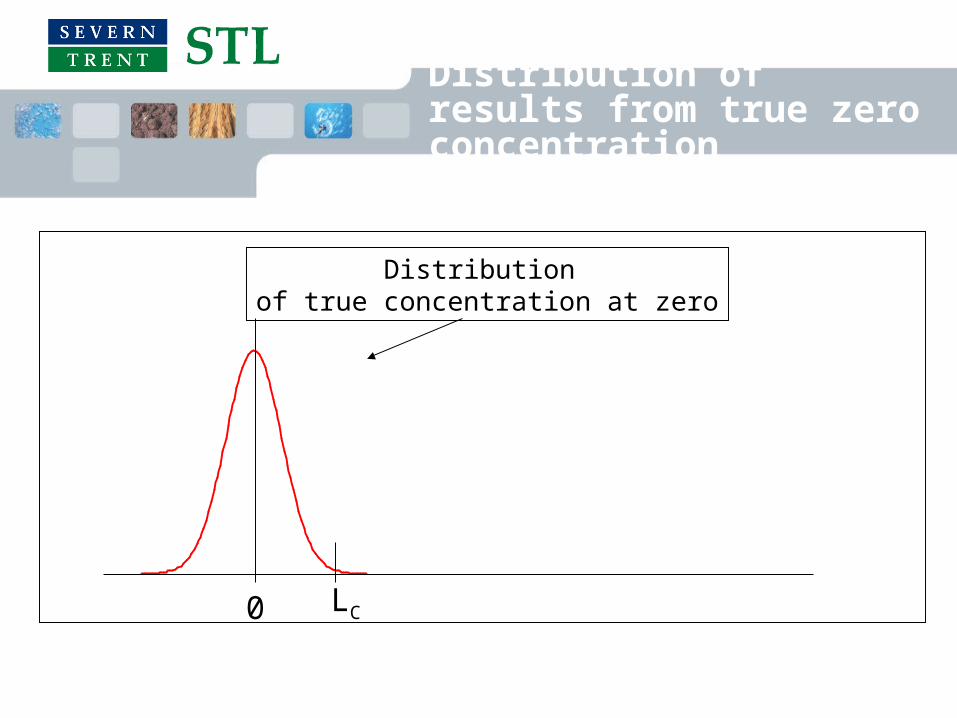
Distribution of results from true zero concentration
LC
Distribution of true concentration at zero
0
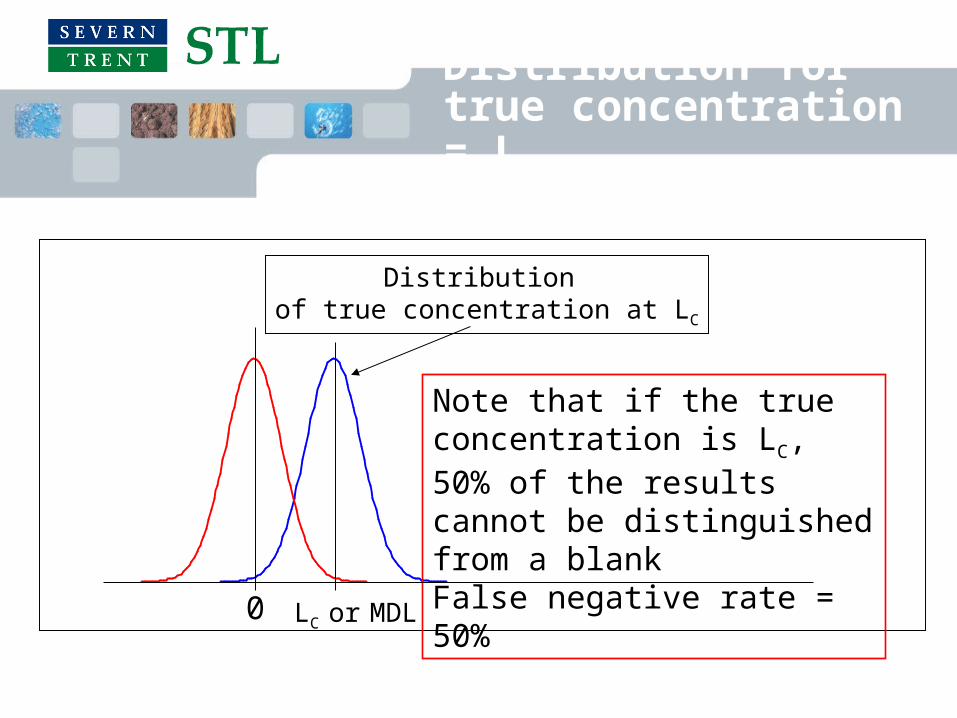
Distribution for true concentration = LC
0 LC or MDL
Distribution of true concentration at LC
Note that if the true concentration is LC, 50% of the results cannot be distinguished from a blankFalse negative rate = 50%
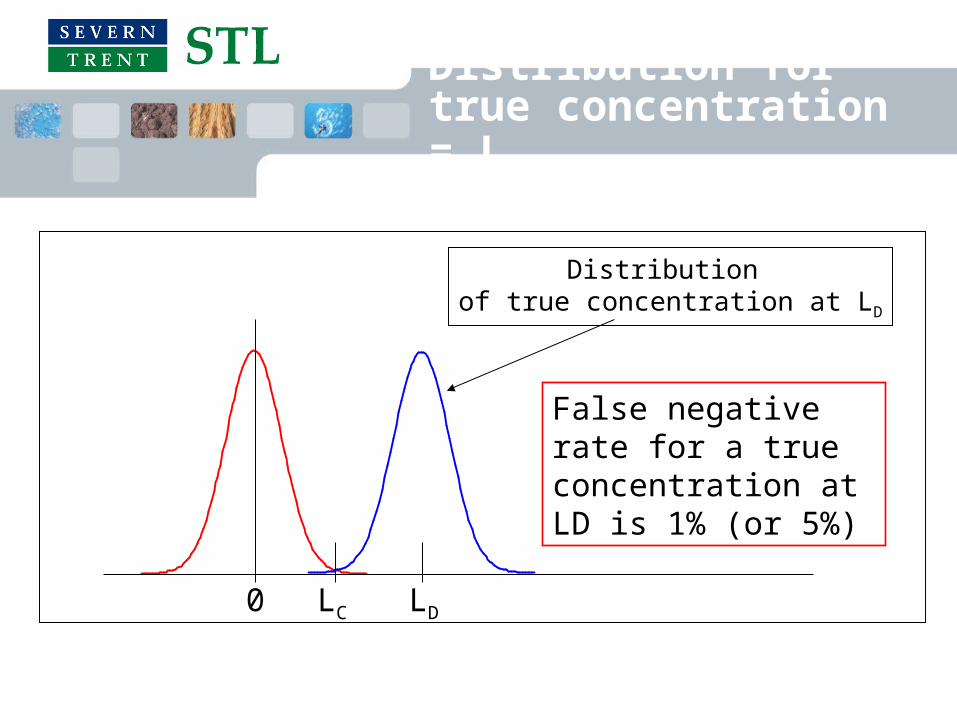
Distribution for true concentration = LD
0 LC
Distribution of true concentration at LD
LD
False negative rate for a true concentration at LD is 1% (or 5%)
Controversies
Is LD needed? In theory, LD is the concentration for which
1% false negatives are observed It can be statistically predicted, but requires
assumptions regarding qualitative identification criteria, constant variance, spike recovery, normal distribution, etc.
We do not use LD now (MDL = LC)
Controversies
Is LD needed? LD is very difficult to demonstrate,
especially for multi analyte methods A large number of spikes at concentrations
very close to LD would be needed
Controversies
Is LD needed? If LD is not used then we report values
between LQ and LC as estimated
If LD is used, we do the same!
What should the non detect value be? <LQ, LD, <LC, something else?
What is “Quantitative”?
Above low calibration standard?Multiple of detection limit?Better than some defined value of
precision and accuracy?Above low standard and demonstrate
detection capability?
Low calibration standard
Pros i. Very simple, no additional work ii. In line with some statements from OSW
Cons i. Very weak technically – some analytes can be calibrated at much lower levels than they can be prepared and analyzed, and very large error (100% or more) in the low point of the calibration has minimal effect on the correlation coefficient.
ii. Will be strongly opposed by industry, and probably Office of Water as well
Some multiple of Lc (eg 3.18)
Pros i. Simple ii. Same as the MDL/ML relationship
Cons i. For some censored tests such as GC/MS, may be below the detectable threshold ii. Will be strongly opposed by industry
Level at which some specified degree of precision and accuracy can be demonstrated
Pros i. Strongest technically ii. Will be supported by industry and the drinking water contingent
Cons i. Hardest to implement – who decides what level of precision and accuracy is acceptable, same criteria cannot be used for all analytes.
ii. Requires a lot of low level spikes to develop the statistics
Combo approach
Low calibration standard plus at least 3X LC plus periodic (eg once per quarter) demonstration of capability with a single LQ level spike extracted analyzed on all instruments
Pros i. Compromise approach, hopefully would satisfy the most people. ii. Reasonably strong technically iii. Reasonably easy to implement
Cons i. Probably will still be opposed by industry ii. More complex than options 1 or 2
Extension of ACIL Detection Limit procedure?
Replace spikes used to determine LD with spikes used to determine LQ
Should be ongoing, not one time or every year
Provides a measure of variance at the quantitation limit that can also be used to meet uncertainty requirements
Frequency? Level?
Controversies
What is LC for a “censored” method? We do not observe results for blanks, so
the level below which 99% of blank results fall is meaningless
Current activities
Collection and evaluation of existing data Uncensored methods, LC
• A considerable volume of data has been collected, from commercial, state and wastewater treatment plant labs
• In general initial assessment seems to indicate that the ACIL and Consensus group procedure work well i.e., the number of blanks above the calculated LC is in the region of 1%
Current activities
Collection and evaluation of existing data LD, LQ and censored methods
• Much less data available because low level spikes are needed.
• PT data may help, at least for LQ
Next steps
Design and perform a pilot study Evaluate procedures for performance and
usability Next meetings, March 28-29 and June 28-
29
PBMS
PBMS
New interest at the agency, driven from the highest levels Office of Water proposes restating their
“Streamlining” proposal
Streamlining
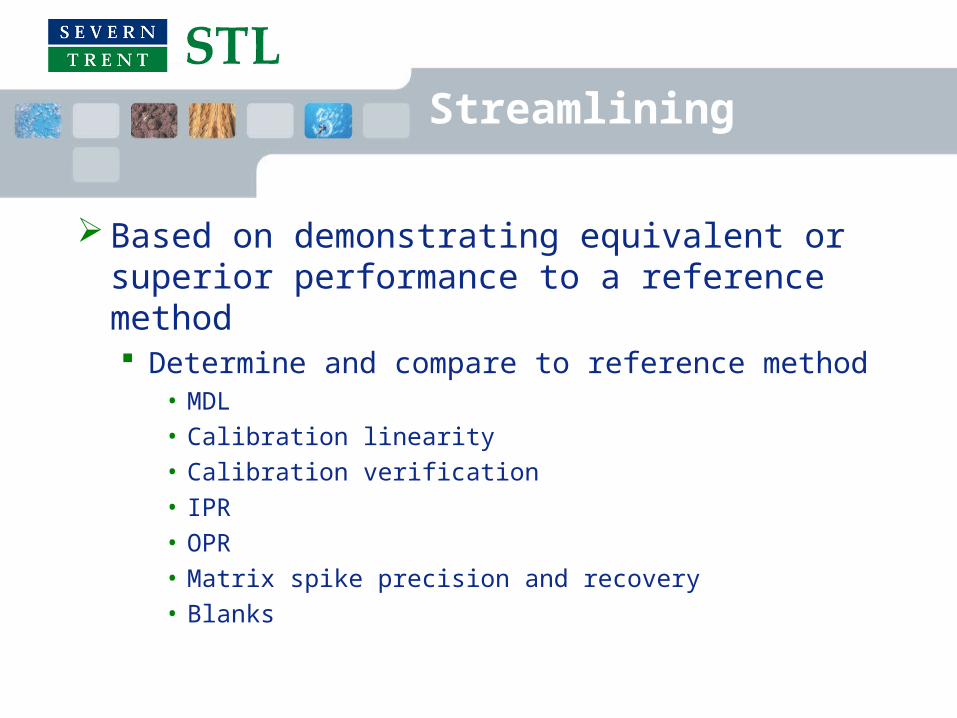
Based on demonstrating equivalent or superior performance to a reference method Determine and compare to reference method
• MDL• Calibration linearity• Calibration verification• IPR• OPR• Matrix spike precision and recovery• Blanks
Streamlining Tiers
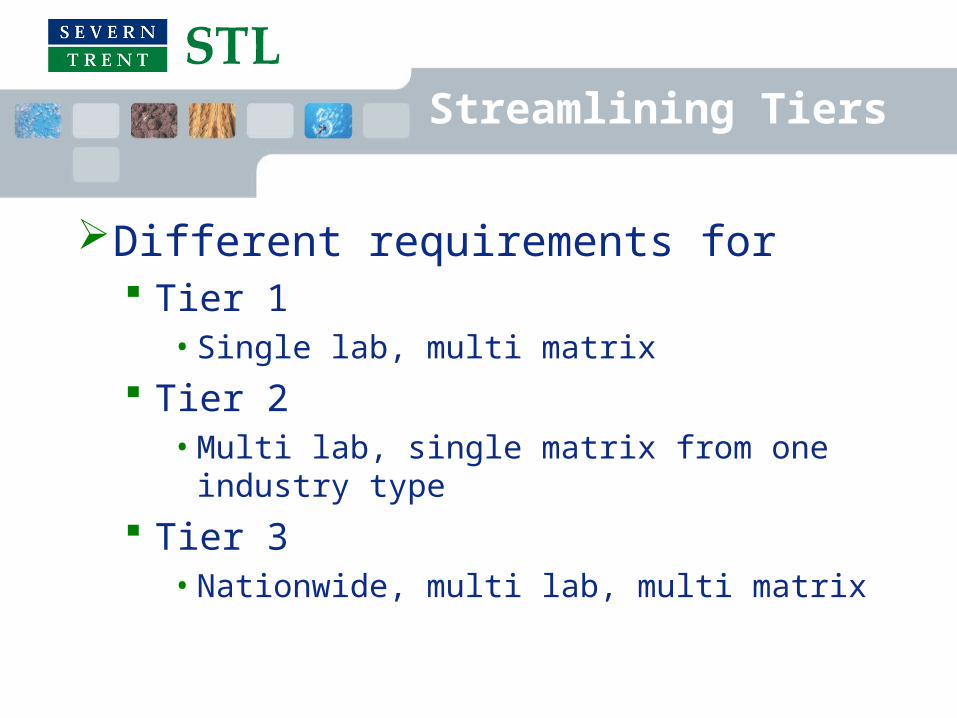
Different requirements for Tier 1
• Single lab, multi matrix
Tier 2• Multi lab, single matrix from one industry type
Tier 3• Nationwide, multi lab, multi matrix
Problems with “Streamlining”
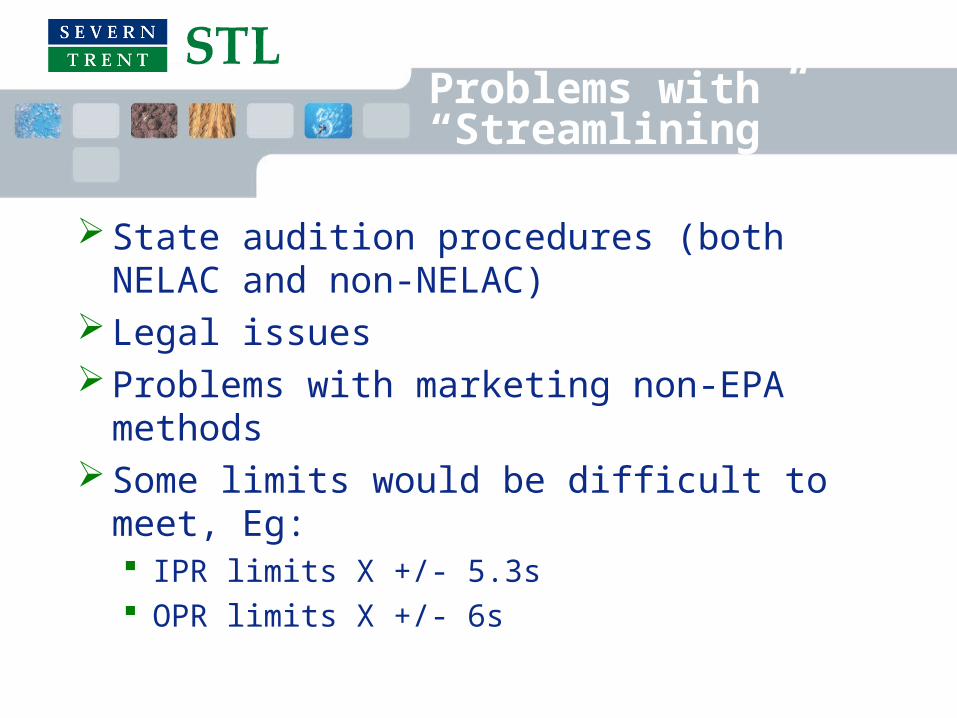
State audition procedures (both NELAC and non-NELAC)
Legal issues Problems with marketing non-EPA methods Some limits would be difficult to meet, Eg:
IPR limits X +/- 5.3s OPR limits X +/- 6s
An alternative
Remove all possible method details from EPA methods
A detailed procedure could still be developed and published (ES&T, Anal. Chem) but would not be in regulation
Control the performance of the analytical technique for the analyte through QC criteria.
Perchlorate example
EPA has developed 5 new methods for perchlorate, all have some prescriptive details and are not consistent with each other.
Total 169 pages – one analyte
PBMS perchlorate method
Perchlorate is determined by LC/MS/MS or IC/MS/MS. Mass 83 is used for quantitation and mass 85 for confirmation. In the absence of interferences, single stage mass spectrometry may be used, in which case use mass 99 for quantitation and 101 for confirmation. 18O labeled perchlorate is used as an internal standard. Aqueous samples may be analyzed directly or following clean up on solid phase columns. Solid samples are extracted using an aqueous leach. Identification of perchlorate requires peaks for the quantitation and qualifier ions to maximize within one scan, and within 0.1 minutes of the labeled perchlorate internal standard.In the absence of project specific quality control requirements the following must be used:

Questions?