Embed Size (px)
Citation preview
Industrial and Corporate Change, pp. 1 of 58
doi:10.1093/icc/dtn005
Technological capabilities and late
shakeouts: industrial dynamics in
the advanced gas turbine industry,
1987–2002
Anna Bergek, Fredrik Tell, Christian Berggren and Jim Watson
This article focuses on technological discontinuities and late shakeouts in mature
industries. The empirical case is combined cycle gas turbine technology in the
power generation industry, where two of four main incumbents (GE, ABB,
Siemens, and Westinghouse) exited the industry after several years of competition.
We show that the vast differences in firm performance are strongly related to
variation in technological capabilities, such as sourcing and integration of
knowledge from related industries and after-launch problem solving. The findings
from this case may also be of general interest for studies of dynamics in other
mature, complex industries.
1. Introduction
Students of strategy and business history have suggested that many important
industries as they mature become increasingly oligopolistic (Chandler, 1977, 1990;
Lazonick, 1991). Such findings are paralleled in the industry life cycle literature,
where initial phases of competition among many (small) firms are followed by
“shakeouts” after which a few surviving firms compete mainly on cost and focus
shifts from radical product innovation to incremental product changes and process
development (Cooper and Schendel, 1976; Abernathy and Utterback, 1978; Tushman
and Anderson, 1986; Klepper, 1996).
The main interest in this literature is to understand early phases in industrial
evolution and the determinants of which firms that will survive into more “mature”
phases. The ex post situation following shakeout has been much less researched.
However, there are important cases where mature industries, after a period of
incremental technical change and cost-based competition, enter a late phase of
technological discontinuities and “late shakeouts.” According to Davies (1997), this
new phase of technological competition is characterized by a rapid launch of new
� The Author 2008. Published by Oxford University Press on behalf of Associazione ICC. All rights reserved.
Industrial and Corporate Change Advance Access published March 1, 2008
product generations and technologies by incumbent firms rather than new entrants.
As noted by Klepper (1997), however, we know much less about these dynamics of
mature industries.
On a more general level, it has been pointed out that in spite of similar
contingencies there may be room for a variety of corporate strategies within such
industries (Bonaccorsi et al., 1996). Further, differences in firm capabilities are likely
to play a decisive role for competitive outcomes (Dosi and Malerba, 1996; Jacobides
and Winter, 2005). A key suggestion in this article is that late dynamics and
shakeouts in mature industries to significant degree can be explained by differences
in technological capabilities.
To investigate this hypothesis, the article presents a comparative study of four
firms in a mature, important, old, complex, and technologically advanced capital
goods industry: the power generation segment of the heavy electrical engineering
industry. After a period of transformation and restructuring in the 1980s, this
industry—previously characterized by national champions—consolidated around a
few internationally operating corporations. In North America, General Electric was
the industry leader, with Westinghouse as a distant second. In Europe, a cross-border
merger between Swiss BBC and Swedish ASEA created ABB that aspired to be an
electro-technical world leader and threatened the traditionally dominant position of
Siemens (Belanger et al., 1999; Tell, 2000). Other important firms in the heavy
electro-technical industry, such as Anglo-French GEC Alsthom and Japanese
Mitsubishi, licensed key generation technologies from the American leaders. It was
generally assumed that after this sweeping restructuring and consolidation,
competition between the survivors would enter a more stable and predictable
period. Actual developments, however, turned out to be very different.
The electro-technical giants faced a dual challenge: severe price competition in
newly deregulated and privatized markets combined with a sudden increase of
technological change in a core business, power generation. Whereas investments in
nuclear energy had virtually ceased and coal-fired boilers long ago had reached their
limits of thermal efficiency and economy of scale, another technology suddenly took
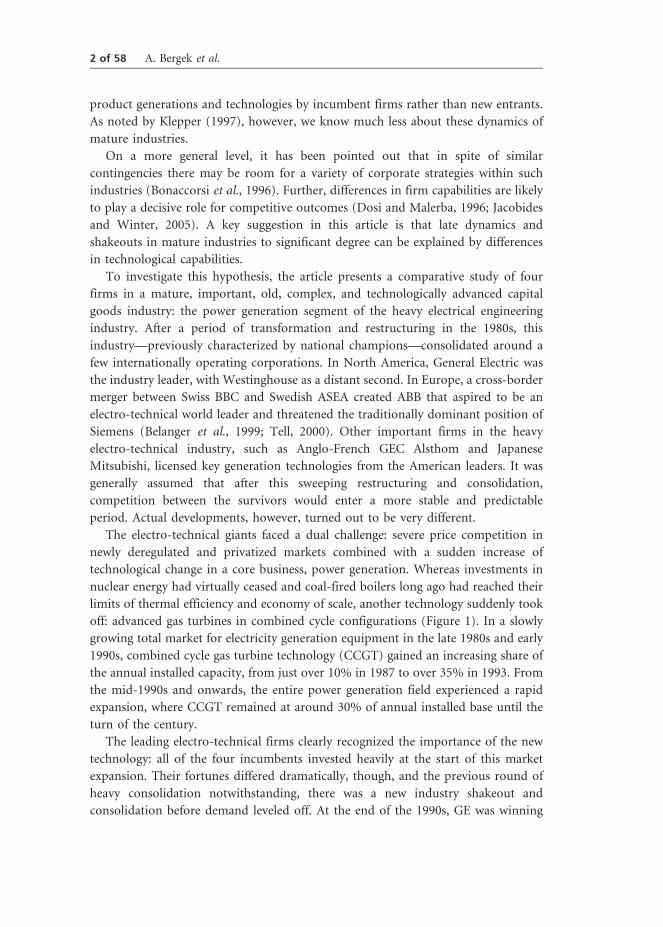
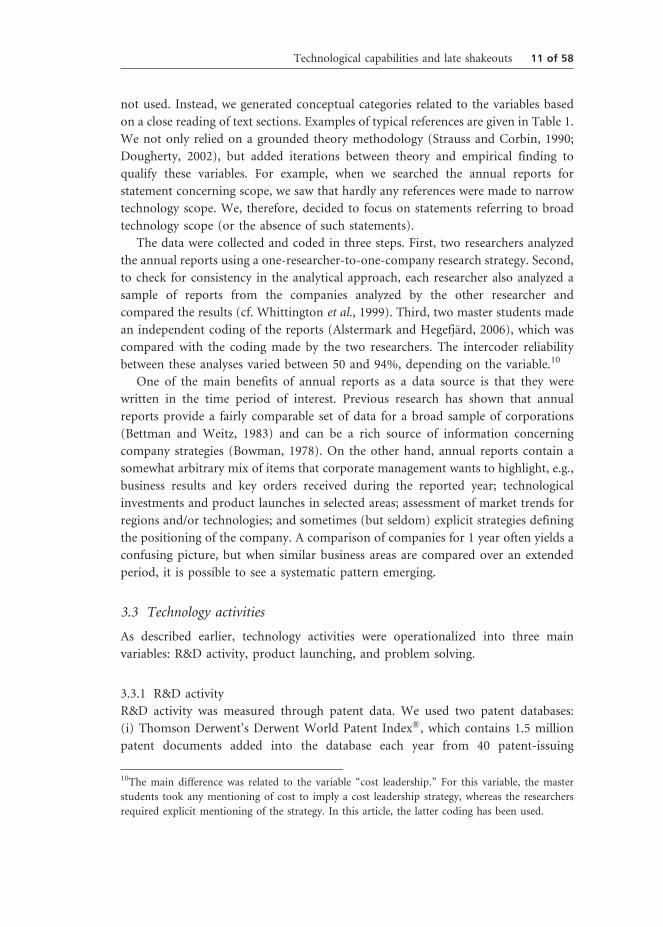
off: advanced gas turbines in combined cycle configurations (Figure 1). In a slowly
growing total market for electricity generation equipment in the late 1980s and early
1990s, combined cycle gas turbine technology (CCGT) gained an increasing share of
the annual installed capacity, from just over 10% in 1987 to over 35% in 1993. From
the mid-1990s and onwards, the entire power generation field experienced a rapid
expansion, where CCGT remained at around 30% of annual installed base until the
turn of the century.
The leading electro-technical firms clearly recognized the importance of the new
technology: all of the four incumbents invested heavily at the start of this market
expansion. Their fortunes differed dramatically, though, and the previous round of
heavy consolidation notwithstanding, there was a new industry shakeout and
consolidation before demand leveled off. At the end of the 1990s, GE was winning
2 of 58 A. Bergek et al.

and Siemens came out as a strong number two, whereas both ABB and Westinghouse
exited the industry by selling their power generation businesses (to Alstom and
Siemens, respectively).
This article analyzes the competitive outcomes in mature, complex systems-
oriented industries facing technological change. The empirical focus is on explaining
the dramatically different outcome of the “CCGT-race” for the incumbents at the
starting line. Why did only two (GE and Siemens) of the original quartet survive, and
why these two? More specifically, the aim of this article is to analyze the role of
technological capabilities in explaining “late shakeouts.”
In the next section, we discuss theories on industry life cycles and present an
operationalization of the concept of technological capabilities, followed by a
methodology section describing our data sources. In Section 4, we describe the
dynamics of the CCGT industry, including product launches and competitive
outcomes, with a focus on the period of 1987–2002. In Section 5, we describe the
technological capabilities of four incumbent firms. Section 6 provides an analysis of
these capabilities in relation to competitive outcomes. Finally, Section 7 discusses the
findings and relates them to previous literature.
2. Shakeout in mature capital goods industries: successivediscontinuities and technological capabilities
2.1 Industry life cycles and early stage shakeouts
In a Schumpeterian vein, it has been hypothesized in the industry life cycle literature
that innovation creates discontinuous change, altering the conditions under which
firms compete, changing relative positions among firms and causing entry as well as
exit (cf. Abernathy and Utterback, 1978; Cooper and Smith, 1992; Utterback and
Market development 1970-2002
0
20 000
40 000
60 000
80 000
100 000
1970
1972
1974
1976
1979
1981
1983
1985
1987
1989
1991
1993
1995
1997
1999
2001
MW
(ye
arly
)
0
50 000
100 000
150 000
200 000
250 000
300 000
350 000
400 000
450 000
MW
(cu
mul
ativ
e)
Market orders (yearly) Cumulative orders
Figure 1 CCGT market development 1970–2002 (total market orders in MW).
Technological capabilities and late shakeouts 3 of 58
Suarez, 1993; Christensen, 1997), before the rate of change of market shares declines
and the leadership pattern stabilizes, leaving the industry with an oligopolistic
structure (Klepper, 1996, 2002).1
Particular attention has been given to the causes of so-called shakeouts, i.e., short
time periods where a large number of the competing firms exit the industry, leaving a
few remaining industrial leaders.2 Shakeouts occurring in early phases of the industry
life cycle have been quite well described, and several alternative explanations have
been put forward: (i) the emergence of a dominant design (Abernathy and Utterback,
1978; Tushman and Anderson, 1986; Utterback and Suarez, 1993), (ii) successive
“technology shocks” (Jovanovic and MacDonald, 1994) or “secondary dis-
continuities” (Olleros, 1986), and (iii) dynamic returns to R&D (favoring old and
large firms) (Klepper 1996; Klepper and Simons, 2005). However, as noted by Klepper
(1997) we know much less about the dynamics of mature industry life cycle stages:
“The PLC (product life cycle) does a good job of describing the stages of
industry evolution through the formative eras of many industries. But
after the number of firms stabilizes and firm market shares settle down,
there appear to be fairly regular developments that are not captured by
the PLC . . . [An] unpredicted facet of the mature phase is that many
products appear to experience a sharp rise in innovation in this stage.
This was reflected in the list of product and process innovations in autos
and more generally in the patent counts by Gort and Klepper.” (Klepper,
1997, pp. 174–175)
In particular, we have noted the lack of studies describing mature industries
characterized by continued technological dynamics, not only in terms of process
innovation (as suggested by Abernathy and Utterback (1978)) but also of successive
product discontinuities, and subjected to shakeouts in later phases, i.e., a long time
after initial shakeouts have occurred. In this study, we will investigate such a mature
sector: the electro-technical industry.
2.2 Late phase industry dynamics: complex product systems and successivetechnological discontinuities
Traditionally, industries have been defined on the basis of their main product, i.e., an
industry consists of firms producing close substitutes (Porter, 1980). However, firms
1This pattern has been shown to hold for industries such as automotives, typewriters, tires,
televisions, and penicillin (cf. Klepper, 1997; Klepper and Simons, 2005).
2Klepper (1997) provides the following definition of a shakeout: “[. . .] for a product to be deemed
as experiencing a shakeout, the fall in the number of firms had to be pronounced (at least 30% from
the peak) and sustained (not rising subsequently to 90% of the peak)” (p. 165). Not all industries
experience such shakeouts in an early phase. Exceptions include diapers (Elzinga and Mills, 1996),
petrochemicals (Arora, 1997), and turboprop aircraft engines (Bonaccorsi and Giuri, 2000).
4 of 58 A. Bergek et al.
in the electro-technical industry tend to be highly diversified. We have, therefore,
opted to focus our analysis on one particular product within the broader electro-
technical industry: advanced CCGT. This product is complex and not perfectly
standardized. Previous research has indicated that the generic model of industry-
technology evolution seems to be less useful in understanding the life cycle of such
complex product systems (CoPS), in comparison to mass produced consumer goods
(Davies, 1997; Hobday, 1998).3
CoPS may be characterized as products with high unit costs and degree of
customization, several alternative architectures and deep systems (Hobday, 1998;
Magnusson et al., 2005). In CoPS industries, successive innovations play an
important part in industry evolution: as the overall architecture—or dominant
design—of a CoPS is settled, several new product generations occur within the
architecture through the continuous introduction of changes in system components
and subsystems (Teece, 1986; Davies, 1997). As noted by Hobday (1998): “In some
cases, innovation proceeds long after the delivery of the product, as new features are
added and systems are upgraded and modified” (p. 700).4 Thus, in contrast to some
generic models, the emergence of a dominant design or standard does not signal a
decrease in the rate of technical development.5
As pointed out by Davies (1997), CoPS industries such as the electro-technical one
normally exhibit a relatively stable firm structure, with few exits and entries, partly
due to high entry barriers such as installed base, network externalities, and
technological interdependencies. Competition in the mature stage of such industries
is not necessarily characterized by cost-based fights over market shares until new
entrants challenge, and eventually defeat, incumbent firms by introducing
technological discontinuities. It may, instead be a matter of technological competition
between industry incumbents, resulting in the success of some and the relative failure
of others, and thus to a new industry consolidation based on technological
capabilities. Here, the CoPS literature has emphasized that the development,
manufacturing, and sales of CoPS require both breadth and depth in underlying
knowledge bases (Prencipe, 2000; Wang and von Tunzelmann, 2000; Magnusson
et al., 2005). It has also highlighted the importance of system integration capabilities,
i.e., the ability to integrate the product system and the subsystems and components it
entails (Henderson and Clark, 1990; Prencipe et al., 2003).
3Other examples of CoPS include telecommunication exchanges, aircraft engines, high-speed trains,
and flight simulators.
4This corresponds to the abovementioned observations of “secondary discontinuities” (Olleros,
1986), or “sub-discontinuities” (Ehrnberg, 1995) throughout the product life cycle (cf. also Cooper
and Smith, 1992).
5Sustained rapid technological change after the emergence of a dominant design is not restricted to
CoPS, but has also been a feature in industries such as cardiac pacemakers (Hidefjall, 1997) and
wind turbines (Bergek and Jacobsson, 2003).
Technological capabilities and late shakeouts 5 of 58
Thus, similar to the analyses provided by Klepper and his colleagues, survival rates
in industry evolution are here perceived as determined by the technological
capabilities of firms. However, although Klepper’s conclusion that old and large
firms have better chances of survival than new and small entrants may be helpful in
the study of early life cycle phases, it cannot help us to understand the outcome of
competition between a small number of industry incumbents who are all old and
large. The case of advanced gas turbines and CCGT, thus, provides an interesting
opportunity to better understand the role of technological capabilities for compe-
tition in a mature cohort of a few well-established firms. Rather than studying “the
making of an oligopoly” (Klepper and Simons, 2000), we examine “the industrial
dynamics of an oligopoly,” with particular focus on differences between industry
incumbents in terms of their technological capabilities.
While the literature on dynamics in CoPS industries does provide an alternative
view of industry evolution than traditionally envisaged in product life cycle models,
it is complemented by this study in two main ways. First, hardly any CoPS studies
systematically investigate competitive outcomes on industry level relating to the
impact of secondary discontinuities. For instance, in his series of articles using
in-depth studies of the aircraft jet engine industry, Andrea Prencipe has primarily
focused on the evolution of the CoPS in itself (i.e., the aircraft engine) and the
implications for firm capabilities, systems integration, and the boundaries of the firm
(Prencipe, 1997, 2000; Brusoni et al., 2001; Lazonick and Prencipe, 2005), rather than
the continuous battle for market shares between the main competitors GE, Pratt &
Whitney, and Rolls Royce. By incorporating time-series data on market shares and
exit and relating this to the introduction of new product generations, this article
seeks to remedy this shortcoming in the extant CoPS literature.
Second, with respect to system integration the CoPS literature has mainly focused
the vertical organization of CoPS industries, distinguishing between vertically
integrated firms, loosely coupled networks of suppliers orchestrated by a systems
integrator, and market contracting (Brusoni et al., 2001; Dosi et al., 2003; Prencipe,
2003).6 In contrast to this approach, we focus the underlying knowledge needed to
develop CoPS—in this case the CCGT and the advanced gas turbine—and
investigate how firms source and integrate this knowledge. This implies a broader
perspective, since we neither predefine whether knowledge is sourced from external
or internal sources, nor whether external knowledge sources are found within the
vertical supply chain or in related industries.
6In general, it has been argued that the more modular the underlying technology, the more scope for
outsourcing, using “market for technologies” (Sanchez and Mahoney, 1996; Arora et al., 2001).
Brusoni et al. (2001) extend this argument by arguing that whether systems integration is decoupled
(market exchange), loosely coupled (networks), or tightly coupled (vertical integration) depends on
the predictability of product interdependencies and the rate of change in component technologies.
6 of 58 A. Bergek et al.
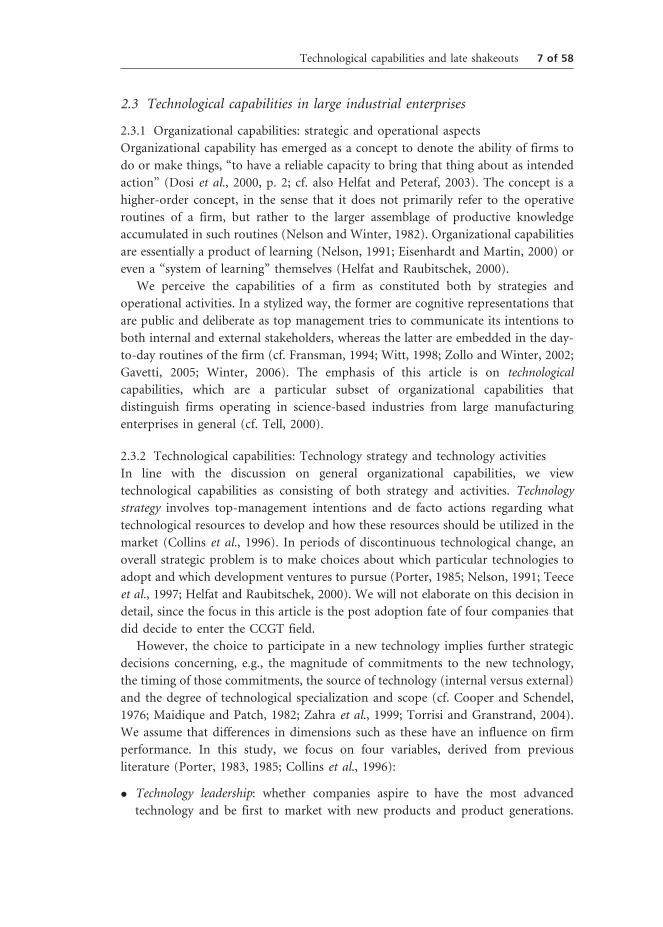
2.3 Technological capabilities in large industrial enterprises
2.3.1 Organizational capabilities: strategic and operational aspects
Organizational capability has emerged as a concept to denote the ability of firms to
do or make things, “to have a reliable capacity to bring that thing about as intended
action” (Dosi et al., 2000, p. 2; cf. also Helfat and Peteraf, 2003). The concept is a
higher-order concept, in the sense that it does not primarily refer to the operative
routines of a firm, but rather to the larger assemblage of productive knowledge
accumulated in such routines (Nelson and Winter, 1982). Organizational capabilities
are essentially a product of learning (Nelson, 1991; Eisenhardt and Martin, 2000) or
even a “system of learning” themselves (Helfat and Raubitschek, 2000).
We perceive the capabilities of a firm as constituted both by strategies and
operational activities. In a stylized way, the former are cognitive representations that
are public and deliberate as top management tries to communicate its intentions to
both internal and external stakeholders, whereas the latter are embedded in the day-
to-day routines of the firm (cf. Fransman, 1994; Witt, 1998; Zollo and Winter, 2002;
Gavetti, 2005; Winter, 2006). The emphasis of this article is on technological
capabilities, which are a particular subset of organizational capabilities that
distinguish firms operating in science-based industries from large manufacturing
enterprises in general (cf. Tell, 2000).
2.3.2 Technological capabilities: Technology strategy and technology activities
In line with the discussion on general organizational capabilities, we view
technological capabilities as consisting of both strategy and activities. Technology
strategy involves top-management intentions and de facto actions regarding what
technological resources to develop and how these resources should be utilized in the
market (Collins et al., 1996). In periods of discontinuous technological change, an
overall strategic problem is to make choices about which particular technologies to
adopt and which development ventures to pursue (Porter, 1985; Nelson, 1991; Teece
et al., 1997; Helfat and Raubitschek, 2000). We will not elaborate on this decision in
detail, since the focus in this article is the post adoption fate of four companies that
did decide to enter the CCGT field.
However, the choice to participate in a new technology implies further strategic
decisions concerning, e.g., the magnitude of commitments to the new technology,
the timing of those commitments, the source of technology (internal versus external)
and the degree of technological specialization and scope (cf. Cooper and Schendel,
1976; Maidique and Patch, 1982; Zahra et al., 1999; Torrisi and Granstrand, 2004).
We assume that differences in dimensions such as these have an influence on firm
performance. In this study, we focus on four variables, derived from previous
literature (Porter, 1983, 1985; Collins et al., 1996):
� Technology leadership: whether companies aspire to have the most advanced
technology and be first to market with new products and product generations.
Technological capabilities and late shakeouts 7 of 58
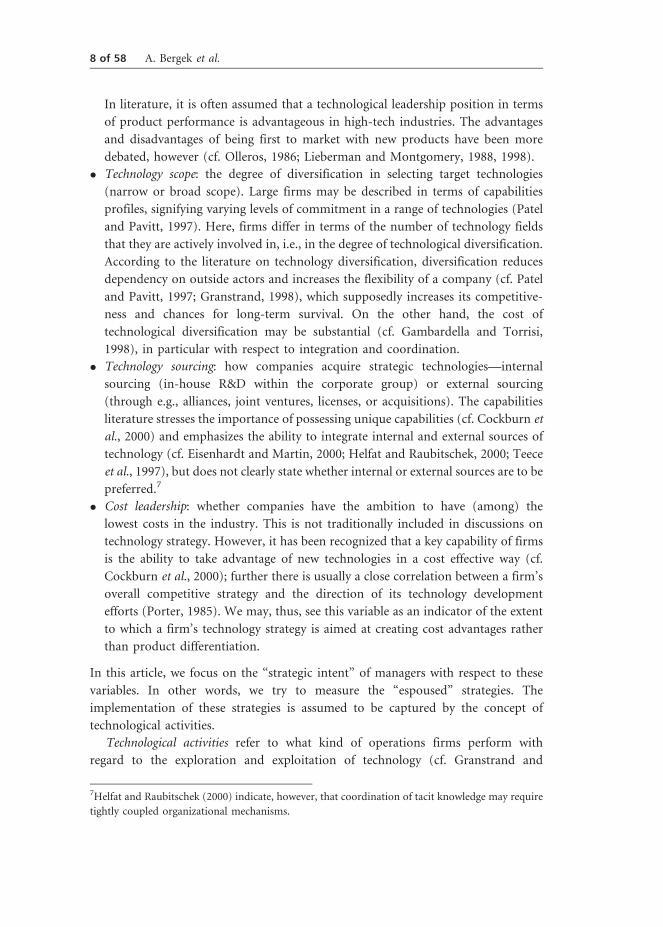
In literature, it is often assumed that a technological leadership position in terms
of product performance is advantageous in high-tech industries. The advantages
and disadvantages of being first to market with new products have been more
debated, however (cf. Olleros, 1986; Lieberman and Montgomery, 1988, 1998).
� Technology scope: the degree of diversification in selecting target technologies
(narrow or broad scope). Large firms may be described in terms of capabilities
profiles, signifying varying levels of commitment in a range of technologies (Patel
and Pavitt, 1997). Here, firms differ in terms of the number of technology fields
that they are actively involved in, i.e., in the degree of technological diversification.
According to the literature on technology diversification, diversification reduces
dependency on outside actors and increases the flexibility of a company (cf. Patel
and Pavitt, 1997; Granstrand, 1998), which supposedly increases its competitive-
ness and chances for long-term survival. On the other hand, the cost of
technological diversification may be substantial (cf. Gambardella and Torrisi,
1998), in particular with respect to integration and coordination.
� Technology sourcing: how companies acquire strategic technologies—internal
sourcing (in-house R&D within the corporate group) or external sourcing
(through e.g., alliances, joint ventures, licenses, or acquisitions). The capabilities
literature stresses the importance of possessing unique capabilities (cf. Cockburn et
al., 2000) and emphasizes the ability to integrate internal and external sources of
technology (cf. Eisenhardt and Martin, 2000; Helfat and Raubitschek, 2000; Teece
et al., 1997), but does not clearly state whether internal or external sources are to be
preferred.7
� Cost leadership: whether companies have the ambition to have (among) the
lowest costs in the industry. This is not traditionally included in discussions on
technology strategy. However, it has been recognized that a key capability of firms
is the ability to take advantage of new technologies in a cost effective way (cf.
Cockburn et al., 2000); further there is usually a close correlation between a firm’s
overall competitive strategy and the direction of its technology development
efforts (Porter, 1985). We may, thus, see this variable as an indicator of the extent
to which a firm’s technology strategy is aimed at creating cost advantages rather
than product differentiation.
In this article, we focus on the “strategic intent” of managers with respect to these
variables. In other words, we try to measure the “espoused” strategies. The
implementation of these strategies is assumed to be captured by the concept of
technological activities.
Technological activities refer to what kind of operations firms perform with
regard to the exploration and exploitation of technology (cf. Granstrand and
7Helfat and Raubitschek (2000) indicate, however, that coordination of tacit knowledge may require
tightly coupled organizational mechanisms.
8 of 58 A. Bergek et al.
Sjolander, 1990; Tell, 2000). In particular, we are interested in search-oriented
activities undertaken by the firm in order to obtain new technological knowledge.
These include, but are not restricted to, the day-to-day activities of engineers in
research labs as well as the activities by production engineers involved in making
a new product ready for manufacture. Indeed, as shown by Kline and Rosenberg
(1986), technological activities may take place in various parts of the company’s
value chain including the interfaces between the company and external actors
(e.g., suppliers and customers).
In particular, the literature highlights the ability to develop and/or introduce new
products and processes (cf. Teece et al., 1997; Cockburn et al., 2000; Eisenhardt and
Martin, 2000). In addition, Helfat and Raubitschek (2000) emphasize the ability to
learn from previous mistakes. We interpret this as an ability to identify and solve
problems experienced by the firm and the users of its products. In line with this
discussion, we operationalize the concept of technology activities in terms of three
variables: R&D activity, product launching, and problem-solving activity.
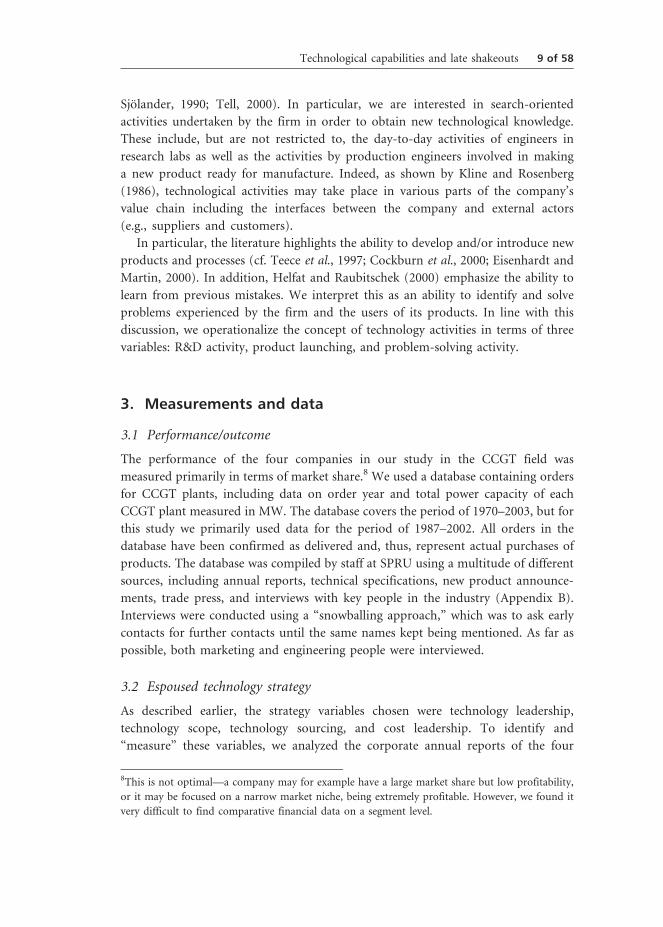
3. Measurements and data
3.1 Performance/outcome
The performance of the four companies in our study in the CCGT field was
measured primarily in terms of market share.8 We used a database containing orders
for CCGT plants, including data on order year and total power capacity of each
CCGT plant measured in MW. The database covers the period of 1970–2003, but for
this study we primarily used data for the period of 1987–2002. All orders in the
database have been confirmed as delivered and, thus, represent actual purchases of
products. The database was compiled by staff at SPRU using a multitude of different
sources, including annual reports, technical specifications, new product announce-
ments, trade press, and interviews with key people in the industry (Appendix B).
Interviews were conducted using a “snowballing approach,” which was to ask early
contacts for further contacts until the same names kept being mentioned. As far as
possible, both marketing and engineering people were interviewed.
3.2 Espoused technology strategy
As described earlier, the strategy variables chosen were technology leadership,
technology scope, technology sourcing, and cost leadership. To identify and
“measure” these variables, we analyzed the corporate annual reports of the four
8This is not optimal—a company may for example have a large market share but low profitability,
or it may be focused on a narrow market niche, being extremely profitable. However, we found it
very difficult to find comparative financial data on a segment level.
Technological capabilities and late shakeouts 9 of 58
companies in the studied period (1987–2002).9 For the technology sourcing variable,
we also used other published material, such as reports about joint ventures and
alliances in trade press journals. In line with the aim of the article, we focused on
references to the business segment denoted power generation (or similar).
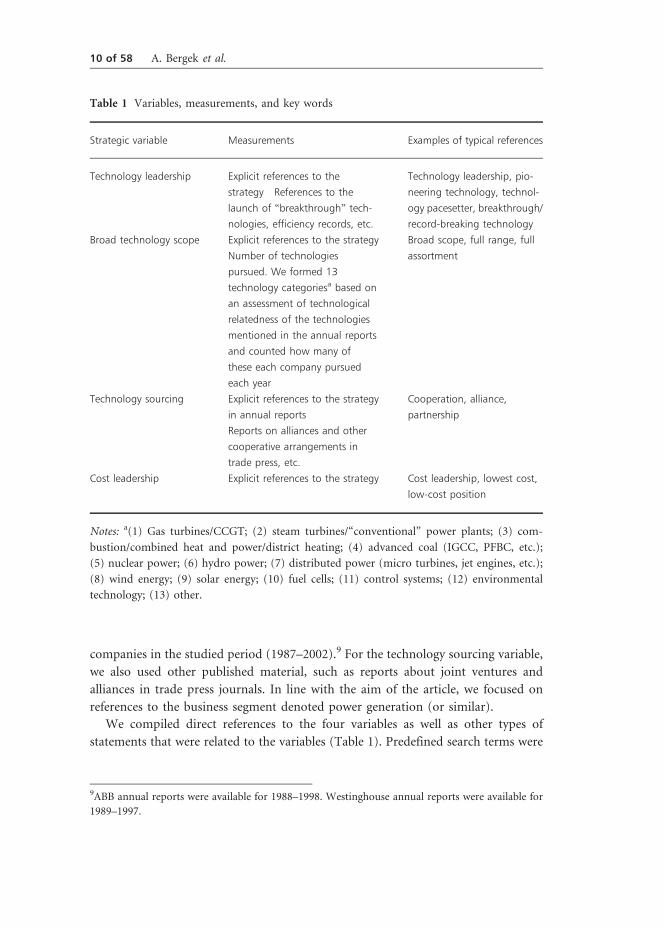
We compiled direct references to the four variables as well as other types of
statements that were related to the variables (Table 1). Predefined search terms were
Table 1 Variables, measurements, and key words
Strategic variable Measurements Examples of typical references
Technology leadership Explicit references to the
strategy References to the
launch of “breakthrough” tech-
nologies, efficiency records, etc.
Technology leadership, pio-
neering technology, technol-
ogy pacesetter, breakthrough/
record-breaking technology
Broad technology scope Explicit references to the strategy
Number of technologies
pursued. We formed 13
technology categoriesa based on
an assessment of technological
relatedness of the technologies
mentioned in the annual reports
and counted how many of
these each company pursued
each year
Broad scope, full range, full
assortment
Technology sourcing Explicit references to the strategy
in annual reports
Reports on alliances and other
cooperative arrangements in
trade press, etc.
Cooperation, alliance,
partnership
Cost leadership Explicit references to the strategy Cost leadership, lowest cost,
low-cost position
Notes: a(1) Gas turbines/CCGT; (2) steam turbines/“conventional” power plants; (3) com-
bustion/combined heat and power/district heating; (4) advanced coal (IGCC, PFBC, etc.);
(5) nuclear power; (6) hydro power; (7) distributed power (micro turbines, jet engines, etc.);
(8) wind energy; (9) solar energy; (10) fuel cells; (11) control systems; (12) environmental
technology; (13) other.
9ABB annual reports were available for 1988–1998. Westinghouse annual reports were available for
1989–1997.
10 of 58 A. Bergek et al.
not used. Instead, we generated conceptual categories related to the variables based
on a close reading of text sections. Examples of typical references are given in Table 1.
We not only relied on a grounded theory methodology (Strauss and Corbin, 1990;
Dougherty, 2002), but added iterations between theory and empirical finding to
qualify these variables. For example, when we searched the annual reports for
statement concerning scope, we saw that hardly any references were made to narrow
technology scope. We, therefore, decided to focus on statements referring to broad
technology scope (or the absence of such statements).
The data were collected and coded in three steps. First, two researchers analyzed
the annual reports using a one-researcher-to-one-company research strategy. Second,
to check for consistency in the analytical approach, each researcher also analyzed a
sample of reports from the companies analyzed by the other researcher and
compared the results (cf. Whittington et al., 1999). Third, two master students made
an independent coding of the reports (Alstermark and Hegefjard, 2006), which was
compared with the coding made by the two researchers. The intercoder reliability
between these analyses varied between 50 and 94%, depending on the variable.10
One of the main benefits of annual reports as a data source is that they were
written in the time period of interest. Previous research has shown that annual
reports provide a fairly comparable set of data for a broad sample of corporations
(Bettman and Weitz, 1983) and can be a rich source of information concerning
company strategies (Bowman, 1978). On the other hand, annual reports contain a
somewhat arbitrary mix of items that corporate management wants to highlight, e.g.,
business results and key orders received during the reported year; technological
investments and product launches in selected areas; assessment of market trends for
regions and/or technologies; and sometimes (but seldom) explicit strategies defining
the positioning of the company. A comparison of companies for 1 year often yields a
confusing picture, but when similar business areas are compared over an extended
period, it is possible to see a systematic pattern emerging.
3.3 Technology activities
As described earlier, technology activities were operationalized into three main
variables: R&D activity, product launching, and problem solving.
3.3.1 R&D activity
R&D activity was measured through patent data. We used two patent databases:
(i) Thomson Derwent’s Derwent World Patent Index�, which contains 1.5 million
patent documents added into the database each year from 40 patent-issuing
10The main difference was related to the variable “cost leadership.” For this variable, the master
students took any mentioning of cost to imply a cost leadership strategy, whereas the researchers
required explicit mentioning of the strategy. In this article, the latter coding has been used.
Technological capabilities and late shakeouts 11 of 58
authorities,11 and (ii) a database, compiled at Linkoping University from
information supplied by the web site of the US Patent and Trademark Office
(USPTO). This contains all granted patents applied for by GE, ABB, Siemens, and
Westinghouse and their subsidiaries in 1986–2000 in a selection of patent classes.
The general advantages and disadvantages of patent data have been discussed
extensively elsewhere (Patel and Pavitt, 1991; Holmen and Jacobsson, 1997; Le Bas
and Sierra, 2002; Hagedoorn and Cloodt, 2003). Here, we will focus on the particular
characteristics and methodological problems of this study.
A first methodological problem concerns the well-known variation in the
propensity to patent between (i) technological fields and (ii) different firms (Patel
and Pavitt, 1991). Since this is an intra-sector study, the main question with regards
to (i) is whether the propensity to patent in the CCGT industry is high enough for
patents to be a good indicator of R&D activity. Although empirical studies of the
propensity to patent in the CCGT industry is lacking, several studies have shown that
the propensity to patent is high in the broader electrical equipment industry of which
power generation and CCGT are part. For example, in a study by Scherer (1983) it
had the highest propensity to patent of all industries in the sample, and Mansfield
(1986) found that over 80% of the patentable inventions in this industry were indeed
patented. When we consider that CCGT is a science-based industry, which generally
tends to imply that patents are an important means of appropriation (Pavitt, 1984),
it seems reasonable to assume that the propensity to patent in the CCGT field is as
high as in the rest of the electrical equipment industry. We, therefore, conclude that
patents are a relevant indicator of R&D activity in this industry.12
With regards to (ii), differences in the propensity to patent are usually assumed to
be especially large between firms with different countries of origin. In particular, it
may be argued that our use of US patent data may result in an over-estimation of the
patenting activities of GE and Westinghouse in comparison with ABB and Siemens.
This concerns primarily the use of the Linkoping University database, since the
Derwent World Patent Index� covers many different patent offices all over the world.
However, in a previous study we concluded that there was no substantial US bias in
our dataset.13
11The patents obtained from this database were applied for in the period of 1973–2002. In the
analysis, we primarily use patents applied for in the period of 1987–2002. For more information
about Thomson Derwent’s Derwent World Patent Index�, please visit http://www.thomsonder
went.com/products/patentresearch/dwpi/.
12Of course, some inventions may not be patentable. In the case of CCGT, control and safety
systems may have some non-patentable features.
13In that study, we calculated the “GE-to-ABB ratio” of our dataset and compared it to ratios
derived from searches on company names in the European Patent Office (EPO) database, Patent
abstracts Japan and the USPTO 1988–1998. The ratio of our dataset was lower than the ratios of
12 of 58 A. Bergek et al.
A second problem concerns the identification of relevant patents/patent classes
related to CCGT. Patent class titles are often difficult to interpret and, above all, are
not clearly related to products. In addition, CCGT comprises many different
technological areas, which makes it even more difficult to identify relevant patents.
We have used five different search strategies in order to capture the four companies’
patenting activity in the CCGT field:
1. First, we used the search term “combined cycle” in the Thomson Derwent
database, in order to capture the architectural or systemic aspects of CCGT.14
This search resulted in 92 patent records. A scrutiny of these patents showed that
they concerned relevant technological fields.15
2. As a second step, we identified the main USPTO patent classes that the patents
from the first search were assigned to and searched our own database for patents
in these classes. We identified four important subclasses of USPTO class 60
(Power plants) (Appendix A) and found 118 patents in these classes.
3. For the third search, we used the Derwent manual code “gas turbine engine,”
which according to industry experts contained CCGT-relevant patents. This
search resulted in 151 patent records.
4. Fourth, we identified the main USPTO patent classes related to the patents
identified in step 3 (Appendix A) and made a search in our database for patents
in these classes, resulting in 1938 patents.
5. Fifth, we searched our database for patents in a selection of classes that according
to industry experts are related to gas turbines (Appendix A).16 This search
resulted in 1745 patents.
USPTO and Patent abstracts Japan and, in fact, showed the closest correspondence to the EPO
ratio, where we would expect an ABB bias (Bergek et al., forthcoming).
14Since we assumed that there is not natural correspondence between the patent class structure and
system integration aspects, we attempted to capture these aspects through a key word search.
15Some of the patents were related to other combined cycle technologies, such as IGCC and PFBC,
but since these include some common components, e.g., gas turbines, we have nevertheless included
them in our dataset.
16Industry specialists at ABB aided us in the identification of patent classes related to CCGT. We
provided three specialists—the current patent manager of ABB Corporate Research, a gas turbine
specialist and the former patent manager of one of ABB’s subsidiaries—with descriptions of patent
classes and patent data (including inventor names) and asked them to identify relevant patents and/
or classes. Based primarily on inventor names, these experts were able to pinpoint patents and
patent classes related to gas turbine technology and other CCGT-relevant technologies. We then
selected those that matched the classes identified in the Thomson searches.
Technological capabilities and late shakeouts 13 of 58
We then created three patent categories containing patents related to the same
USPTO classes. When duplicate records had been removed, roughly 3700 patents
remained.
3.3.2 Product launching
Product launching refers to the introduction of new product generations. We used a
database containing all announcements of new products in the CCGT area, compiled
by staff at SPRU using a number of different sources (see above). The data include
date of announcement and main technical specifications concerning the new
product, such as rated power and thermal efficiency. It should be noted that all new
turbines launched by the four firms were received successfully in the market in the
period studied, except for GE’s 9H turbine, which had only received a few orders
in 2002.
3.3.3 Problem solving
Problem solving refers to how companies handled failed products. It is difficult
to measure since little public data are available. Available information include
announcements—in annual reports and trade press—of problems, reports of costs
associated with those problems, descriptions of problem-solving activities, and
announcements of the final solution of problems. Interviews with industry
representatives provided additional information. These “fragments” were used to
illustrate differences in terms of openness about problems (whether it was
announced publicly or not) and time between first problem and problem solved,
but strict comparisons were not possible.
3.4 Limitations
We identify a number of limitations of the study:
1. Due primarily to space limitations, we have not included an analysis of different
geographical markets. It should, however, be noted that no company had
privileged access to certain geographical markets. All companies received orders
from all main geographical markets, except for Westinghouse that only competed
in the European market through its licensee Mitsubishi.17
2. Since, we only use patents as an indicator of technological activity, we have not
estimated the relative economic value of different patents. In accordance with
Le Bas and Sierra (2002), we consider an uneven economic value of patents to be
an inevitable feature of technological activities characterized by uncertainty and
learning, and expect similar variations in the distribution of value of patenting
across firms and countries.
17We have also searched the market order database for differences with regards to product-market
segments, but have not found any relevant basis for segmentation.
14 of 58 A. Bergek et al.
3. This study has been conducted on the segment and product level, since we believe
this is where most competition takes place. There is also a shortage of studies on
these levels in the literature. Inevitably, there is a risk that such a study fails to
capture corporate effects on segment capabilities and performance. For instance,
we have not systematically studied effects of corporate strategy (Bowman and
Helfat, 2001), corporate financing (O’Sullivan, 2006), or cross-segment financial
flows on the performance of ABB, GE, Siemens, and Westinghouse in CCGT.
4. Industry dynamics in CCGT: a high-odds technological race
The story of CCGT has a long prehistory, dating back to the technological
discontinuity occurring when advanced gas turbines and CCGT were introduced in
the 1940s and late 1960s, respectively.18
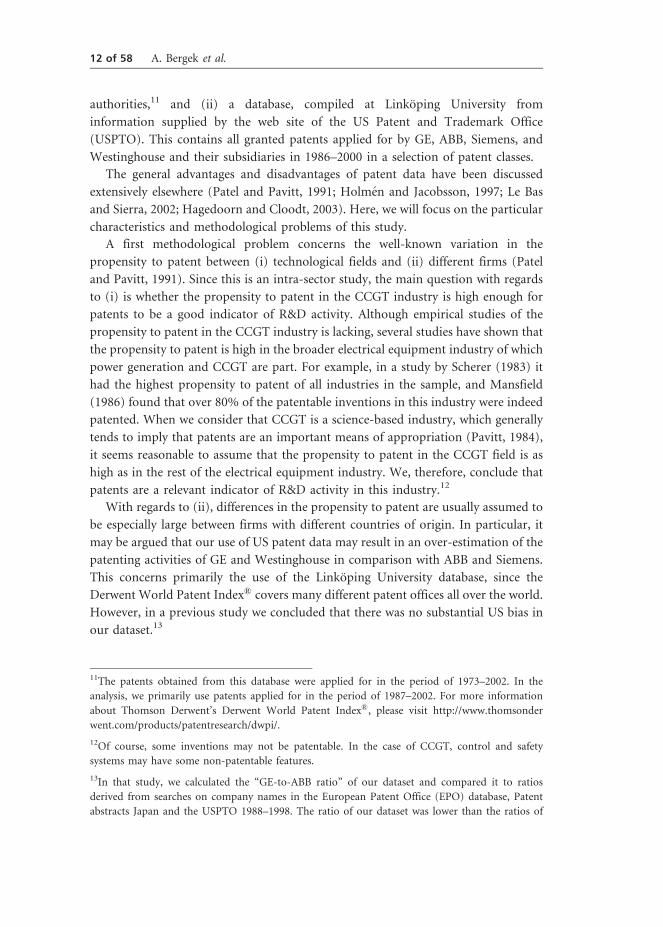
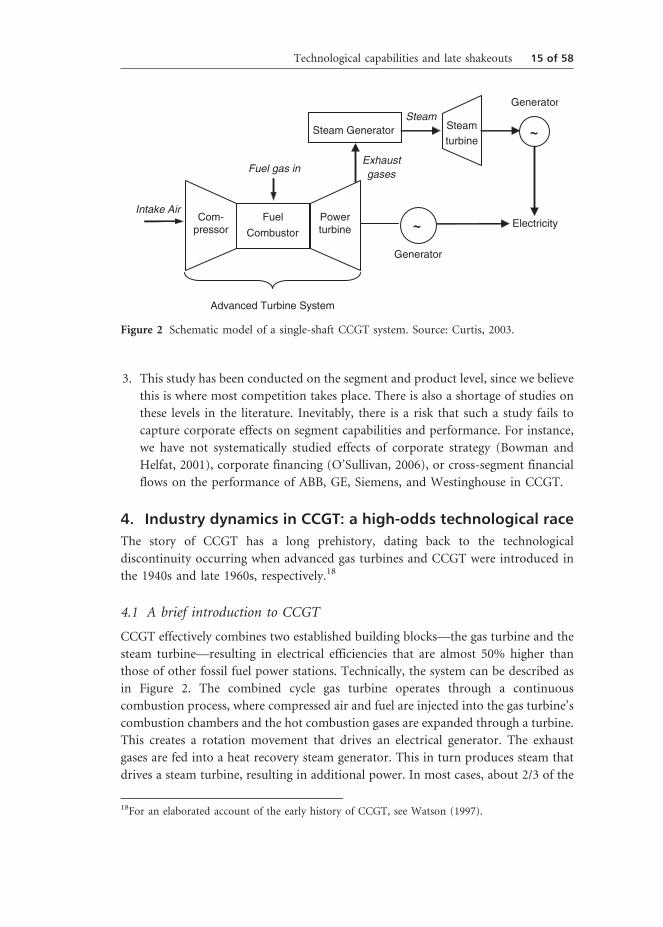
4.1 A brief introduction to CCGT
CCGT effectively combines two established building blocks—the gas turbine and the
steam turbine—resulting in electrical efficiencies that are almost 50% higher than
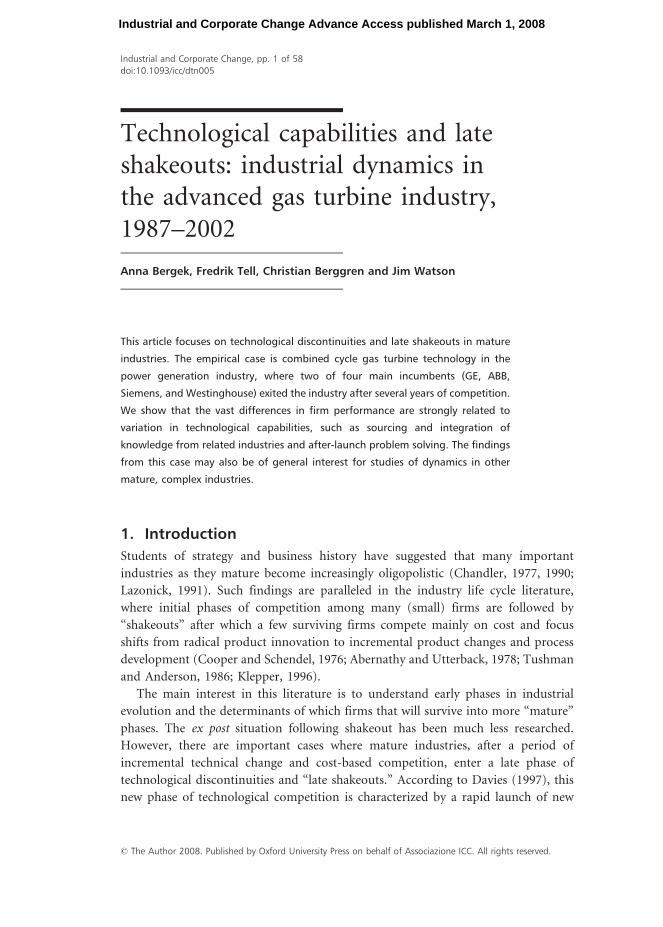
those of other fossil fuel power stations. Technically, the system can be described as
in Figure 2. The combined cycle gas turbine operates through a continuous
combustion process, where compressed air and fuel are injected into the gas turbine’s
combustion chambers and the hot combustion gases are expanded through a turbine.
This creates a rotation movement that drives an electrical generator. The exhaust
gases are fed into a heat recovery steam generator. This in turn produces steam that
drives a steam turbine, resulting in additional power. In most cases, about 2/3 of the
Intake AirPowerturbine
Com-pressor
Fuel
Combustor
Generator
Electricity
Steam Generator Steamturbine
Advanced Turbine System
GeneratorSteam
Fuel gas inExhaust gases
Figure 2 Schematic model of a single-shaft CCGT system. Source: Curtis, 2003.
18For an elaborated account of the early history of CCGT, see Watson (1997).
Technological capabilities and late shakeouts 15 of 58
capacity stems from the gas turbine and about 1/3 of the capacity originates from the
steam turbine.
From a CoPS perspective, we may distinguish between three hierarchy levels in the
product system: the CCGT system as a whole, subsystems (primary ones as e.g., the
gas turbine and the steam turbine as well as secondary ones as e.g., the heat recovery
boiler and the generators) and components of the subsystems. The gas and steam
turbine subsystems are CoPS too, which consist of a number of components. Gas
turbine components include compressors, turbine blades and vanes, cooling
technology, and combustors.
In terms of industrial organization, CCGT firms are in general very similar. They
specialize mainly in overall systems integration, including system specifications and
control systems. Gas turbines and steam turbines are usually produced in-house,
whereas many other subsystems and components are purchased from suppliers (with
the main exception being generators). For example, most CCGT firms provide
specifications of the heat recovery boiler, but leave the production to companies such
as Deutsche Babcock, Lentjes, Steinmuller, or Vogt (Watson, 1997).19
In this article, our primary focus is the “heart” of the CCGT—the advanced gas
turbine subsystem—which provides the main added value of the CCGT system.
Developments in gas turbine design, capacity, and efficiency have contributed to the
majority of advances in CCGT performance over the past 30 years. Whilst steam
turbines and heat recovery boilers have also improved, such improvements have been
modest by comparison. Even small improvements in gas turbine thermal efficiency
imply great customer benefits: One single percentage point increase in efficiency can
reduce operating costs by USD 20 million over the life cycle of a typical 400–500 MW
CCGT plant (Curtis, 2003). Achieving such improvements may, thus, bring
competitive advantage to a CCGT firm and it is, thus, perhaps not that surprising
that all CCGT firms have chosen to keep the development and manufacturing of this
subsystem in-house. However, they still source some critical turbine components
from suppliers, for example turbine blades and vanes, which are made by casting
companies such as Howmet and PCC Airfoils (Curtis, 2003).
4.2 Prologue: the breakthrough of advanced gas turbines and CCGT 20
During the early history of CCGT in the 1970s and 1980s, products were offered in
the market by several companies experimenting with the technology, including GE
and Westinghouse in North America; Siemens, ASEA, Brown Boveri, GEC, and
Alsthom in Europe; and Toshiba, Mitsubishi, and Hitachi in Asia. In the course of
19One of the reasons for this is early experience with heat recovery boiler manufacture. GE and
Westinghouse in particular found that their early boiler designs were unreliable—and that boiler
manufacture was a lower value activity than turbine design and production (Watson, 1997).
20This section is based on Watson (2004).
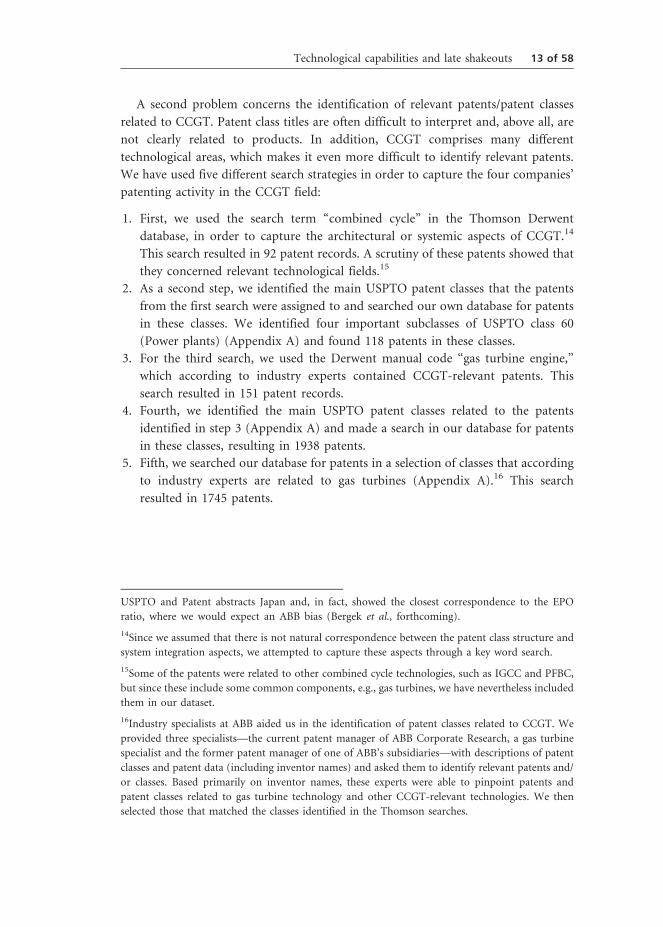
16 of 58 A. Bergek et al.
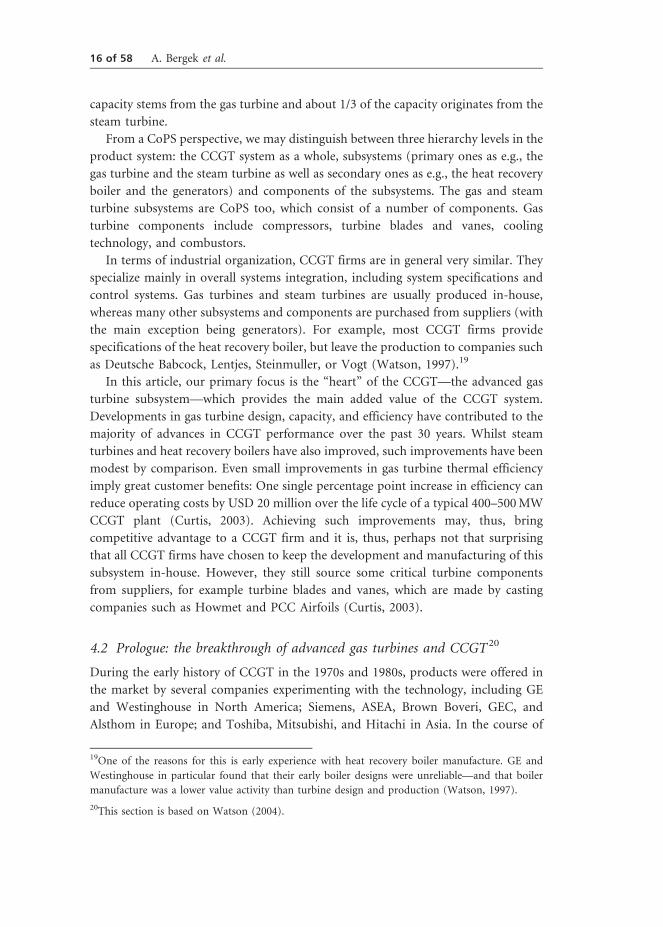
events, however, few of these were able to accumulate any substantial order stock
(Figure 3).
At the end of 1986, the total installed base amounted to �25,000 MW. Of this,
over 90% corresponded to orders given to GE, ASEA, Brown Boveri, Siemens,
Alsthom, Westinghouse, and Mitsubishi. While most of these suppliers had
developed their own proprietary technology, Alsthom manufactured under license
from GE and Mitsubishi did so with a license from Westinghouse.
With its cumulative market share of 41% GE both had a larger stock of
installations and more experience of the CCGT technology than any other company,
followed at some distance by ABB (16%), Westinghouse (14%), and Siemens (11%).
The scene was set for the next period of CCGT development, which started with the
introduction of the GE Frame 7F gas turbine in 1987.
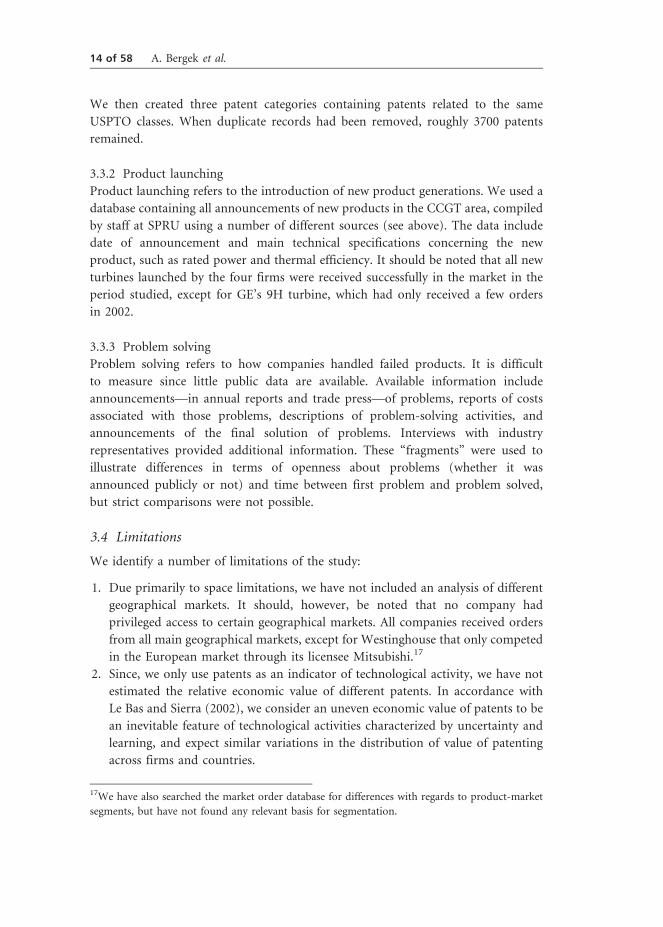
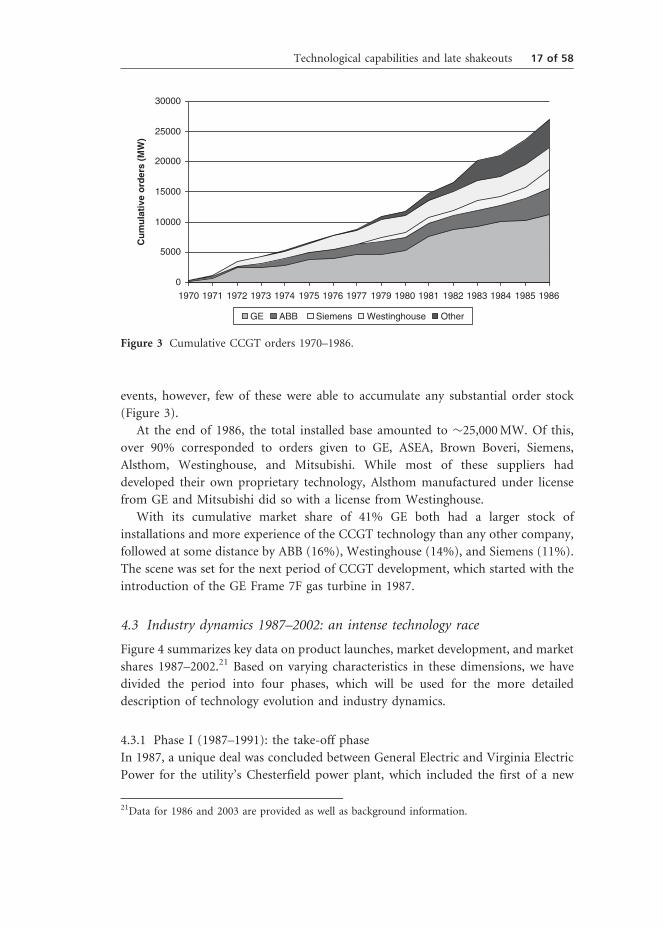
4.3 Industry dynamics 1987–2002: an intense technology race
Figure 4 summarizes key data on product launches, market development, and market
shares 1987–2002.21 Based on varying characteristics in these dimensions, we have
divided the period into four phases, which will be used for the more detailed
description of technology evolution and industry dynamics.
4.3.1 Phase I (1987–1991): the take-off phase
In 1987, a unique deal was concluded between General Electric and Virginia Electric
Power for the utility’s Chesterfield power plant, which included the first of a new
0
5000
10000
15000
20000
25000
30000
1970 1971 1972 1973 1974 1975 1976 1977 1979 1980 1981 1982 1983 1984 1985 1986
Cu
mu
lati
ve o
rder
s (M
W)
GE ABB Siemens Westinghouse Other
Figure 3 Cumulative CCGT orders 1970–1986.
21Data for 1986 and 2003 are provided as well as background information.
Technological capabilities and late shakeouts 17 of 58
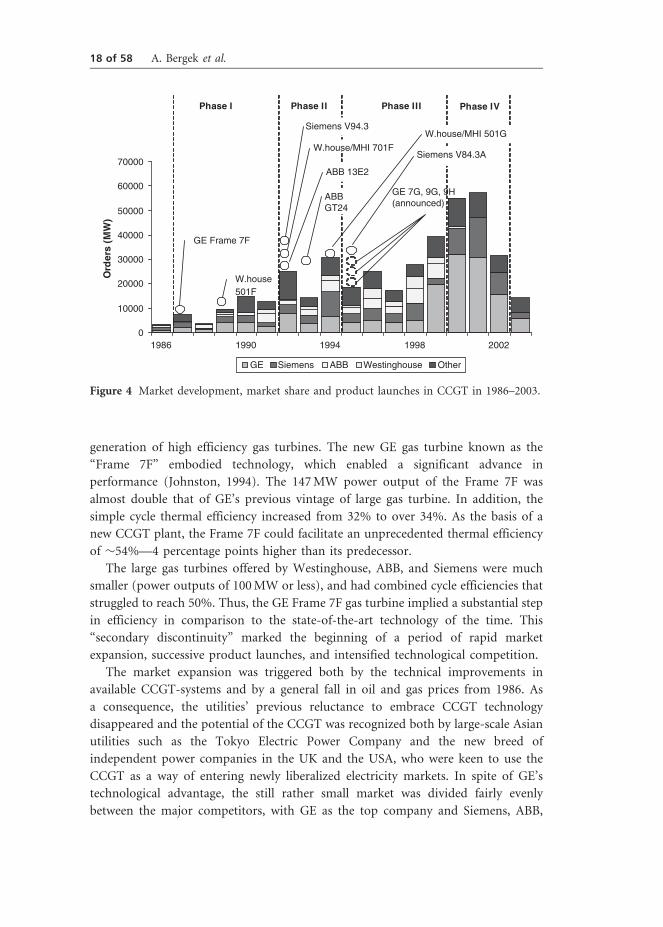
generation of high efficiency gas turbines. The new GE gas turbine known as the
“Frame 7F” embodied technology, which enabled a significant advance in
performance (Johnston, 1994). The 147 MW power output of the Frame 7F was
almost double that of GE’s previous vintage of large gas turbine. In addition, the
simple cycle thermal efficiency increased from 32% to over 34%. As the basis of a
new CCGT plant, the Frame 7F could facilitate an unprecedented thermal efficiency
of �54%—4 percentage points higher than its predecessor.
The large gas turbines offered by Westinghouse, ABB, and Siemens were much
smaller (power outputs of 100 MW or less), and had combined cycle efficiencies that
struggled to reach 50%. Thus, the GE Frame 7F gas turbine implied a substantial step
in efficiency in comparison to the state-of-the-art technology of the time. This
“secondary discontinuity” marked the beginning of a period of rapid market
expansion, successive product launches, and intensified technological competition.
The market expansion was triggered both by the technical improvements in
available CCGT-systems and by a general fall in oil and gas prices from 1986. As
a consequence, the utilities’ previous reluctance to embrace CCGT technology
disappeared and the potential of the CCGT was recognized both by large-scale Asian
utilities such as the Tokyo Electric Power Company and the new breed of
independent power companies in the UK and the USA, who were keen to use the
CCGT as a way of entering newly liberalized electricity markets. In spite of GE’s
technological advantage, the still rather small market was divided fairly evenly
between the major competitors, with GE as the top company and Siemens, ABB,
0
10000
20000
30000
40000
50000
60000
70000
1986 1990 1994 1998 2002
Ord
ers
(MW
)
GE Siemens ABB Westinghouse Other
GE Frame 7F
Siemens V94.3
ABB 13E2
ABBGT24
GE 7G, 9G, 9H(announced)
Siemens V84.3A
Phase IIPhase I Phase III Phase IV
W.house 501F
W.house/MHI 701F
W.house/MHI 501G
Figure 4 Market development, market share and product launches in CCGT in 1986–2003.
18 of 58 A. Bergek et al.
and Westinghouse (including its licensee Mitsubishi) sharing the second place
(Table 4).22
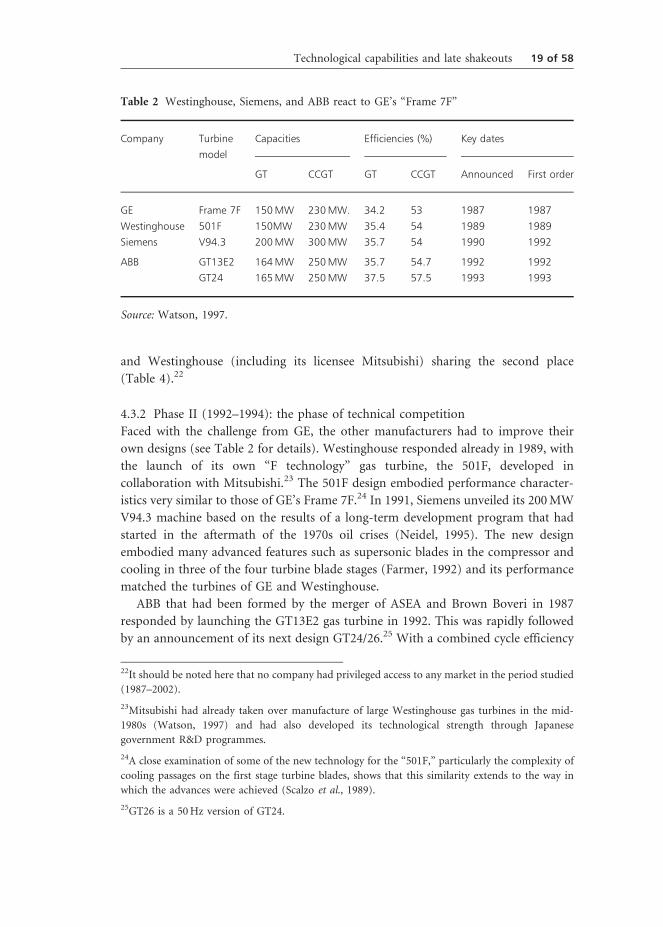
4.3.2 Phase II (1992–1994): the phase of technical competition
Faced with the challenge from GE, the other manufacturers had to improve their
own designs (see Table 2 for details). Westinghouse responded already in 1989, with
the launch of its own “F technology” gas turbine, the 501F, developed in
collaboration with Mitsubishi.23 The 501F design embodied performance character-
istics very similar to those of GE’s Frame 7F.24 In 1991, Siemens unveiled its 200 MW
V94.3 machine based on the results of a long-term development program that had
started in the aftermath of the 1970s oil crises (Neidel, 1995). The new design
embodied many advanced features such as supersonic blades in the compressor and
cooling in three of the four turbine blade stages (Farmer, 1992) and its performance
matched the turbines of GE and Westinghouse.
ABB that had been formed by the merger of ASEA and Brown Boveri in 1987
responded by launching the GT13E2 gas turbine in 1992. This was rapidly followed
by an announcement of its next design GT24/26.25 With a combined cycle efficiency
Table 2 Westinghouse, Siemens, and ABB react to GE’s “Frame 7F”
Company Turbine
model
Capacities Efficiencies (%) Key dates
GT CCGT GT CCGT Announced First order
GE Frame 7F 150MW 230MW. 34.2 53 1987 1987
Westinghouse 501F 150MW 230MW 35.4 54 1989 1989
Siemens V94.3 200MW 300MW 35.7 54 1990 1992
ABB GT13E2 164MW 250MW 35.7 54.7 1992 1992
GT24 165MW 250MW 37.5 57.5 1993 1993
Source: Watson, 1997.
22It should be noted here that no company had privileged access to any market in the period studied
(1987–2002).
23Mitsubishi had already taken over manufacture of large Westinghouse gas turbines in the mid-
1980s (Watson, 1997) and had also developed its technological strength through Japanese
government R&D programmes.
24A close examination of some of the new technology for the “501F,” particularly the complexity of
cooling passages on the first stage turbine blades, shows that this similarity extends to the way in
which the advances were achieved (Scalzo et al., 1989).
25GT26 is a 50 Hz version of GT24.
Technological capabilities and late shakeouts 19 of 58
three percentage points higher than the state-of-the-art, this turbine leapfrogged the
performance of the new turbines from GE, Westinghouse, and Siemens. It embodied
two radical developments: “sequential combustion”, i.e., a two-stage combustion
process in two separate chambers, and a compressor with an unusually high
compression ratio of over 30:1.26 Despite concerns about the wisdom of using such a
large compressor, ABB soon won several major orders for its new turbine including a
2,000 MW CCGT in South Korea, a 720 MW CCGT in the UK, and a 360 MW CCGT
in New Zealand.
As the 1990s progressed, mainstream utilities in many countries joined the early
movers and embraced the CCGT as the technology of choice, and the market began
to expand. The average orders per year doubled, from510,000 MW in the previous
period to over 23,000 MW in this period. GE (including its European licensee GEC-
Alsthom) strengthened its market leader position; Siemens caught up somewhat; and
ABB and Westinghouse competed for the position as number three in the industry
(Table 4).
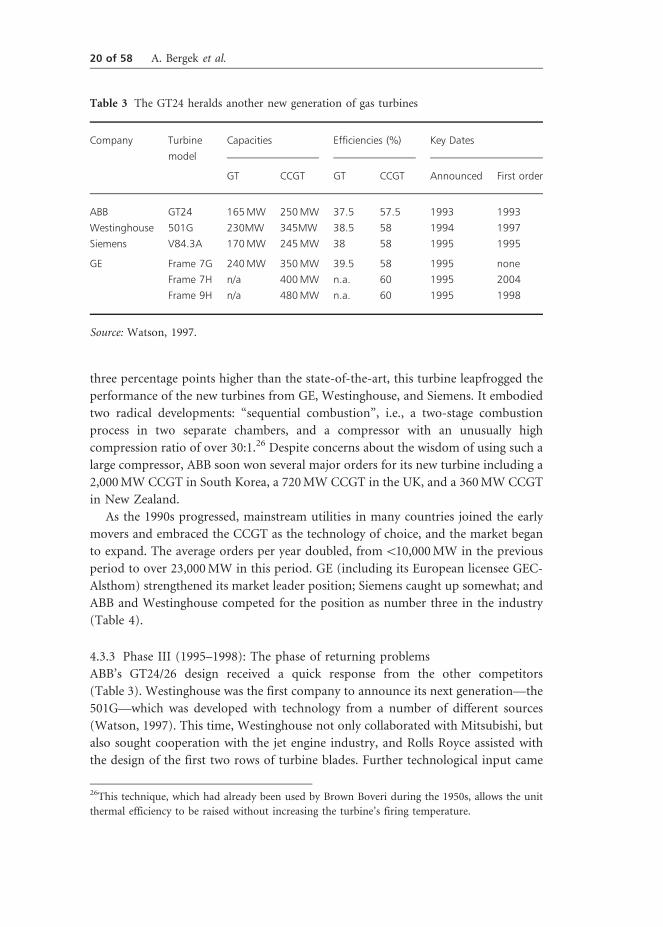
4.3.3 Phase III (1995–1998): The phase of returning problems
ABB’s GT24/26 design received a quick response from the other competitors
(Table 3). Westinghouse was the first company to announce its next generation—the
501G—which was developed with technology from a number of different sources
(Watson, 1997). This time, Westinghouse not only collaborated with Mitsubishi, but
also sought cooperation with the jet engine industry, and Rolls Royce assisted with
the design of the first two rows of turbine blades. Further technological input came
Table 3 The GT24 heralds another new generation of gas turbines
Company Turbine
model
Capacities Efficiencies (%) Key Dates
GT CCGT GT CCGT Announced First order
ABB GT24 165MW 250MW 37.5 57.5 1993 1993
Westinghouse 501G 230MW 345MW 38.5 58 1994 1997
Siemens V84.3A 170MW 245MW 38 58 1995 1995
GE Frame 7G 240MW 350MW 39.5 58 1995 none
Frame 7H n/a 400MW n.a. 60 1995 2004
Frame 9H n/a 480MW n.a. 60 1995 1998
Source: Watson, 1997.
26This technique, which had already been used by Brown Boveri during the 1950s, allows the unit
thermal efficiency to be raised without increasing the turbine’s firing temperature.
20 of 58 A. Bergek et al.
from work conducted under a US Department of Energy Advanced Turbine Systems
(ATS) R&D program.27
In contrast to ABB, the new V84.3A turbine from Siemens was based largely on its
previous vintage, with increases in firing temperature and compressor airflow to
improve performance. Some of the new technology, such as blade designs, high
temperature materials, and cooling configurations, was contributed by Pratt &
Whitney.28 GE’s next generation of gas turbines was announced in 1995. This was the
Frame H, operating with an advanced closed-loop steam cooling technology, which
was tailor-made for CCGT applications.
The intense battle for the highest efficiency following the introduction of GE’s
Frame 7F and culminating with the launch of GE’s H technology (Tables 2 and 3)
implied a great challenge for the companies. Efficiency improvements this size could
not be achieved by incremental changes, but required access to state-of-the-art
knowledge in several fields. For example, the key to the improvements in efficiency
and power output for the 7F was a significant increase in firing temperature and
compressor airflow, which required advanced materials and blade cooling
techniques. But the intense competition in power output and efficiency came at a
cost. In the mid-1990s, the problems of reliability, which had plagued the CCGT-
technology before 1986 returned with a vengeance, and all major manufacturers had
to devote significant efforts to “after-launch redevelopment” and problem solving.
In its annual report 1995, GE announced that a major challenge was the resolution
of rotor issues on its F class gas turbine: “This was the highest priority and involved
mobilizing GE and supplier resources to restore customers to service in the shortest
possible time . . . .” To rectify these problems, the rotors were taken out of the faulty
turbines and flown back to GE’s plants in the US. These problems affected the
confidence in GE’s products and its major competitors were able to catch up in terms
of orders received.
However, in 1996 and 1997, respectively, the utilities operating on ABB and
Siemens equipment also began experiencing major problems. ABB did not mention
any technical problems in its annual reports and did not slow down its sales efforts.
The materials problems caused by overheating in its turbines did not go away,
however, and customers were not inclined to any lenience. Finally, ABB had to
terminate further deliveries, compensate clients for losses and damages, and dedicate
increasing resources to problem solving (Carlsson and Nachemsson-Ekwall, 2003).
27The output of this work was most visible in the 501G’s use of steam cooling in the “transition
piece” between the combustors and the turbines.
28These techniques, which were first developed for aircraft engine blades in the 1970s, create a
particularly “uniform” material structure that is able to withstand the increased stress associated
with firing temperatures in excess of the F technology standard. Although these advanced blades do
not constitute a new innovation, their use on large industrial gas turbines presents several
challenges, including a substantial scaling-up (Neidel, 1995).
Technological capabilities and late shakeouts 21 of 58

Siemens was more public in recognizing its problems, announcing in the 1997
annual report: “. . .with advanced technologies come added challenges that need to
be addressed when meeting deadlines and ensuring a high level of quality.” This
comment referred to substantial delays in the introduction of its new turbines. In the
two following years, Siemens continued to report vibration problems associated with
its new turbines, and the cost associated with rectifying these predicaments caused
the entire power generation segment to lose money in 1999.
Westinghouse managed to keep its own reliability issues out of the press and did
not mention them in its official statements or reports. This did not mean that
Westinghouse had less trouble than other companies. The gas turbines delivered by
Westinghouse suffered from significant reliability problems, particularly after further
upgrades were implemented in the compressor systems. These difficulties, however,
were dwarfed by the company’s tribulations in its nuclear power business, which
were frequently discussed in its annual reports, such as tube degradation in steam
generators for nuclear steam supply systems. As a result, the company incurred major
litigation costs and had to report significant losses in its power systems segment for
all years 1995–1997, from MUSD 200 to almost MUSD 500 in 1996.
GE solved its rotor issues fairly quickly and regained its leading technology
position when demand (in particular in the US) took off in the late 1990s. In
addition to the advantage of having a properly working F generation gas turbine, GE
announced the Frame H generation gas turbines in 1995, tailor-made for CCGT
applications. This new technology was partly a result of GE’s participation in the
Department of Energy ATS program alongside Westinghouse. Some of the
advantages accruing to steam cooling were higher efficiencies (Table 3) and lower
NOX emissions (Curtis, 2003). Despite the improved performance promised by the
H generation, GE did not manage to sell any plants for several years.29
As the problems started to appear, demand stagnated in spite of a rapidly
expanding market for power generation equipment in general. GE and Siemens lost
some market share, whereas ABB managed to keep up the appearance by not making
its problems public (Table 4). As a result of sales of its 501F turbine Westinghouse
came out strong in this period in terms of CCGT market share, but its Power Systems
segment suffered huge losses.30 When after-delivery problems hit the gas turbine and
CCGT business, there were no resources to cope with the new challenges. After a new
disappointing year, it was decided in 1997 to restructure the entire corporation and
divest power generation.
29The reason for this is a combination of utility caution following the F technology reliability
problems, and the incremental improvements to this technology, which eroded the H technology’s
advantages.
30Westinghouse also experienced a bumpy road on a corporate level during the entire 1990s, with
several restructuring campaigns and sell-out of major divisions.
22 of 58 A. Bergek et al.

4.3.4 Phase IV (1999–2002): market expansion and sealed fate of the incumbents
This phase was characterized by a surge in demand with CCGT orders moving from
27,000 MW in 1998 to a peak of over 57,000 MW in 2001. Much of this increase was
due to large rise in orders from power companies in the US. With its own problems
solved, and its European competitors still struggling, GE was in an excellent position.
Having a reliable F generation turbine as well as a new advanced H generation on
offer with a booming home market, GE regained the trust of the market. Increased
sales and market share (Table 4) were almost a foregone conclusion. Although the H
technology did not catch on, this was offset by the success of GE’s existing
technologies. For its competitors, this was the moment of truth.
In 1998, Westinghouse divested its Power Generation business to Siemens. After
increasing difficulties in reigning in the problems with the GT 24/26 turbines, ABB
too opted for a full-scale retreat. In 1999, its power generation segment was first
merged into a joint venture with its counterpart division in Alstom (the new name
for GEC-Alsthom). A year later, ABB sold out to Alstom altogether. The French firm
was to devote another 3 years to the turbine problems, which contributed to a serious
financial crisis. In 2002—6 years after the problems started to appear—it finally
announced that they had been solved.
The other European contender, Siemens, announced in its report for year 2000
that it “made solid progress in meeting technical challenges with its new gas turbine
technology.” Only in 2001 these problems seem to have been convincingly solved,
however. Through the acquisition of Westinghouse’s power generation, the company
inherited the 501F design and also gained access to the steam-cooling technology
developed during the US government ATS program.
Table 4 Market shares
Company 1987–1991 1992–1994 1995–1998 1999–2002
GE 28% 26% 22% 54%
GEC-Alsthom/Alstoma 9% 14% 6% 15%
ABB 18% 12% 17%
Siemens 19% 24% 21% 22%
Westinghouse 5% 7% 13%
Mitsubishib 13% 8% 12% 8%
Other 8% 9% 9% 1%
aGE licensee in the first three phases. In the fourth phase, Alstom acquired ABB’s power
generation business. (In 1989, the energy and transport businesses of Alsthom merged with
GEC, forming GEC-Alsthom.)
bWestinghouse licensee in the first phases.
Technological capabilities and late shakeouts 23 of 58
Table 4 gives an overview of market performance during this phase. GE
dominated, with a total market share of over 50%. Siemens was able to remain a
strong number two with just over 20% of the market. Westinghouse and ABB exited
the field in 1998 and 1999/2000, respectively. Alstom, that acquired ABB’s power
generation segment, was left to struggle at a distant third place. With the exception of
Mitsubishi, all other companies, including the new entrants during the gas turbine
boom in the 1990s, virtually disappeared.
5. The technological capabilities of the incumbents
How could this dramatic difference in outcome be explained? An assumption of this
article is that the chief suspect is differences between the companies in terms of
technological capabilities. Since we view technological capabilities as constituted by
two main dimensions—strategies and activities—the four incumbent firms will be
described along these two dimensions.
5.1 Technology strategies
5.1.1 Technology leadership, technology scope, and cost focus strategies
At the power generation segment level, GE seems to be the most focused company,
emphasizing its “unwavering commitment to technological leadership” in a few
selected areas, where gas turbines and CCGT consistently emerge as the most
important: “This technology leadership is most evident in . . . the new ‘F’ gas turbine
models . . .” (1988), “GE leadership in gas turbine technology was demonstrated by
the successful operation of the first advanced ‘F’ gas turbine . . .” (1990), “. . . our
Power Systems business had a fabulous year because of its global leadership in gas
turbine technology . . .” (2001) (see Table 5 and Appendix C).
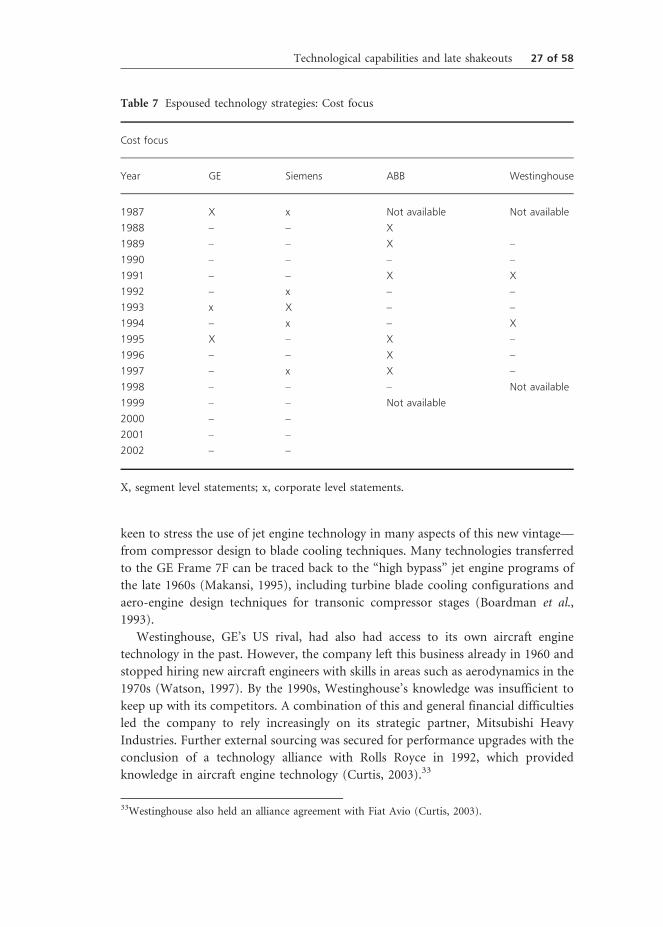
ABB, on the other hand, seems eager to present itself not only as a technology
leader in power generation and CCGT (Table 5), but also as the most complete
supplier (Table 6), having “the most complete range of products, systems and service
available on the market” as demonstrated by the large number of power generation
technologies mentioned each year. It also has a recurring corporate and segment level
emphasis on being the “world low-cost producer in core businesses,” including
power generation (Table 7).
The strategy of Siemens is positioned somewhere in-between GE and ABB. At a
couple of occasions it claims to be “pacesetters in power generation” and refers to a
“world record for efficiency” set by its gas turbine power plant, but in general
Siemens is less focused than GE on technological leadership (Table 5). As for scope,
Siemens mentions more power generation technologies than GE, but fewer than ABB
(Table 6). Some references to a cost focus strategy are found on the corporate level
(Table 7), but in power generation the company seems to be more of a follower than
a leader in this respect: “We have responded to these cost pressures by launching
extensive productivity enhancing programs . . . .” The development and sales of gas
24 of 58 A. Bergek et al.
turbines and combined cycle plants figure prominently in the reports of its power
generation segment, an indicator of its importance in the segments’ overall strategy.
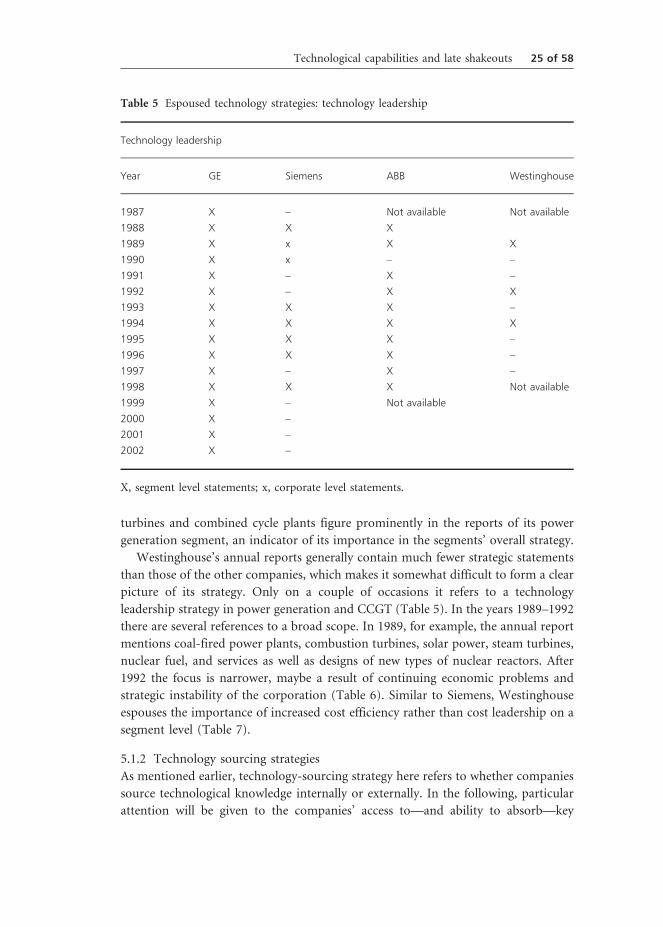
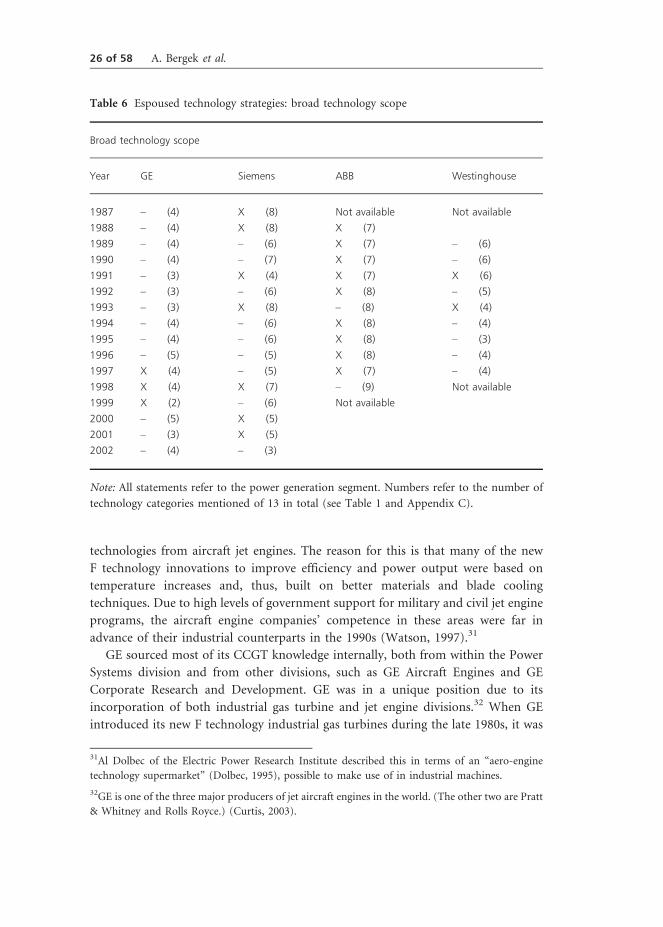
Westinghouse’s annual reports generally contain much fewer strategic statements
than those of the other companies, which makes it somewhat difficult to form a clear
picture of its strategy. Only on a couple of occasions it refers to a technology
leadership strategy in power generation and CCGT (Table 5). In the years 1989–1992
there are several references to a broad scope. In 1989, for example, the annual report
mentions coal-fired power plants, combustion turbines, solar power, steam turbines,
nuclear fuel, and services as well as designs of new types of nuclear reactors. After
1992 the focus is narrower, maybe a result of continuing economic problems and
strategic instability of the corporation (Table 6). Similar to Siemens, Westinghouse
espouses the importance of increased cost efficiency rather than cost leadership on a
segment level (Table 7).
5.1.2 Technology sourcing strategies
As mentioned earlier, technology-sourcing strategy here refers to whether companies
source technological knowledge internally or externally. In the following, particular
attention will be given to the companies’ access to—and ability to absorb—key
Table 5 Espoused technology strategies: technology leadership
Technology leadership
Year GE Siemens ABB Westinghouse
1987 X – Not available Not available
1988 X X X
1989 X x X X
1990 X x – –
1991 X – X –
1992 X – X X
1993 X X X –
1994 X X X X
1995 X X X –
1996 X X X –
1997 X – X –
1998 X X X Not available
1999 X – Not available
2000 X –
2001 X –
2002 X –
X, segment level statements; x, corporate level statements.
Technological capabilities and late shakeouts 25 of 58
technologies from aircraft jet engines. The reason for this is that many of the new
F technology innovations to improve efficiency and power output were based on
temperature increases and, thus, built on better materials and blade cooling
techniques. Due to high levels of government support for military and civil jet engine
programs, the aircraft engine companies’ competence in these areas were far in
advance of their industrial counterparts in the 1990s (Watson, 1997).31
GE sourced most of its CCGT knowledge internally, both from within the Power
Systems division and from other divisions, such as GE Aircraft Engines and GE
Corporate Research and Development. GE was in a unique position due to its
incorporation of both industrial gas turbine and jet engine divisions.32 When GE
introduced its new F technology industrial gas turbines during the late 1980s, it was
Table 6 Espoused technology strategies: broad technology scope
Broad technology scope
Year GE Siemens ABB Westinghouse
1987 – (4) X (8) Not available Not available
1988 – (4) X (8) X (7)
1989 – (4) – (6) X (7) – (6)
1990 – (4) – (7) X (7) – (6)
1991 – (3) X (4) X (7) X (6)
1992 – (3) – (6) X (8) – (5)
1993 – (3) X (8) – (8) X (4)
1994 – (4) – (6) X (8) – (4)
1995 – (4) – (6) X (8) – (3)
1996 – (5) – (5) X (8) – (4)
1997 X (4) – (5) X (7) – (4)
1998 X (4) X (7) – (9) Not available
1999 X (2) – (6) Not available
2000 – (5) X (5)
2001 – (3) X (5)
2002 – (4) – (3)
Note: All statements refer to the power generation segment. Numbers refer to the number of
technology categories mentioned of 13 in total (see Table 1 and Appendix C).
31Al Dolbec of the Electric Power Research Institute described this in terms of an “aero-engine
technology supermarket” (Dolbec, 1995), possible to make use of in industrial machines.
32GE is one of the three major producers of jet aircraft engines in the world. (The other two are Pratt
& Whitney and Rolls Royce.) (Curtis, 2003).
26 of 58 A. Bergek et al.
keen to stress the use of jet engine technology in many aspects of this new vintage—
from compressor design to blade cooling techniques. Many technologies transferred
to the GE Frame 7F can be traced back to the “high bypass” jet engine programs of
the late 1960s (Makansi, 1995), including turbine blade cooling configurations and
aero-engine design techniques for transonic compressor stages (Boardman et al.,
1993).
Westinghouse, GE’s US rival, had also had access to its own aircraft engine
technology in the past. However, the company left this business already in 1960 and
stopped hiring new aircraft engineers with skills in areas such as aerodynamics in the
1970s (Watson, 1997). By the 1990s, Westinghouse’s knowledge was insufficient to
keep up with its competitors. A combination of this and general financial difficulties
led the company to rely increasingly on its strategic partner, Mitsubishi Heavy
Industries. Further external sourcing was secured for performance upgrades with the
conclusion of a technology alliance with Rolls Royce in 1992, which provided
knowledge in aircraft engine technology (Curtis, 2003).33
Table 7 Espoused technology strategies: Cost focus
Cost focus
Year GE Siemens ABB Westinghouse
1987 X x Not available Not available
1988 – – X
1989 – – X –
1990 – – – –
1991 – – X X
1992 – x – –
1993 x X – –
1994 – x – X
1995 X – X –
1996 – – X –
1997 – x X –
1998 – – – Not available
1999 – – Not available
2000 – –
2001 – –
2002 – –
X, segment level statements; x, corporate level statements.
33Westinghouse also held an alliance agreement with Fiat Avio (Curtis, 2003).
Technological capabilities and late shakeouts 27 of 58

Siemens’ engineers had to make use of commercially available materials for
critical components such as the turbine blades, since they did not have direct access
to a jet engine company. In 1990, however, Siemens commenced a fruitful alliance
with Pratt & Whitney, which “gave Siemens exclusive rights to Pratt & Whitney’s
technology in so far as it can be applied to heavy-duty land-based gas turbines”
(Baxter, 1995). This alliance was a key reason for the performance improvements
embodied in the V94.3A and V84.3A gas turbines introduced in 1994 and 1995.
Siemens also relied extensively on other external sources of technology, such as
university researchers, government laboratories and testing facilities, and the casting
companies Howmet and PCC Airfoils. Finally, through the acquisition of
Westinghouse, Siemens sourced further knowledge about large steam turbines and
gas turbines (Curtis, 2003).
ABB sourced most of its key technology internally, which contributed to some
idiosyncratic design features such as the sequential combustion process. In addition,
the Swiss-Swedish firm tried external sourcing through various technology alliances.
Its efforts in this regard were not as successful, though. Although it was first to
negotiate an alliance—with Rolls Royce in 1988—this partnership was dissolved
4 years later due to a difference of opinion on the “way forward” (Mukherjee, 1995).
As a result, ABB decided to follow a different technological path than its competitors
for its GT24 and GT26 models. Nevertheless, it also made use of jet engine
technology from Motoren-und Turbinen Union (MTU), a German jet engine
company, and recruited a number of jet engine specialists from the former Soviet
Union (Watson, 1997).34
In sum, GE’s introduction of the F technology, thus, provided the catalyst for a
series of deals between its competitors and the other two large aircraft engine
suppliers (Rolls Royce and Pratt & Whitney). These are summarized in Table 8.
5.2 Technological activities
The second dimension of technological capabilities measured relates to the
technological activities of firms. Our principal variables here are patenting in
relevant areas, product launches, and reported problem-solving activities.
5.2.1 R&D activity in terms of patenting
As described earlier, we have used five different search strategies in order to capture
the four companies’ patenting activity in the CCGT field (see Section 2). The
combined results of the searches are shown in Figure 5. Except for the two first years,
GE clearly outperformed all the other three competitors in terms of sheer numbers
34More recently, Alstom—the company that purchased ABB’s industrial turbine business—has
changed tracks. In 2002, it announced a new alliance with Rolls Royce to access advanced jet engine
technology (Alstom, 2002).
28 of 58 A. Bergek et al.

throughout the period studied. The patenting activity of Westinghouse was higher
than ABB and Siemens in the first period, but then decreased continuously. The
patenting of Siemens and ABB was on approximately the same level in the first two
phases, after which Siemens’s patenting increased more rapidly.
Table 8 Technological Alliances between ABB, Siemens, Westinghouse, and Aircraft Engine
companies
Companies Year(s) Scope
Westinghouse with Rolls Royce 1960s–72 Periodic design advice
ASEA with Pratt and Whitney 1972–76 Technology for a new 100MW gas turbine
ABB with Rolls Royce 1988–92 Compressor and turbine blade technology
Siemens with Pratt & Whitney 1990–? Compressor and turbine blade technology
Westinghouse/Siemens
with Rolls Royce
1992–? Two-way technology exchange
ABB with Saturn (Russia) 1993–1999? To supply turbine parts and expertise
ABB with MTU 1993?–1999? Periodic design advice
Note: MTU (Motoren und Turbinen Union) is a German jet engine supplier.
Source: ‘ASEA and United Aircraft Co-operate in the development of gas turbines and turbo-
generators,’ ASEA Journal, 45 (4) (1972), 121; ‘New Gas Turbine Unveiled,’ ASEA Journal, 48
(1) (1975), 23; Baxter, A. ‘Partners See Growth Potential,’ Financial Times, Survey of Power
Generation Equipment, 17th May 1994, p. 4; Interviews with employees of Siemens, ABB,
Westinghouse, and Rolls Royce.
Source: Watson, 1997.
0
50
100
150
200
250
300
350
1987
1988
1989
1990
1991
1992
1993
1994
1995
1996
1997
1998
1999
2000
ABB GE Siemens Westinghouse
Figure 5 Total number of patents, all searches combined (per application date).
Technological capabilities and late shakeouts 29 of 58
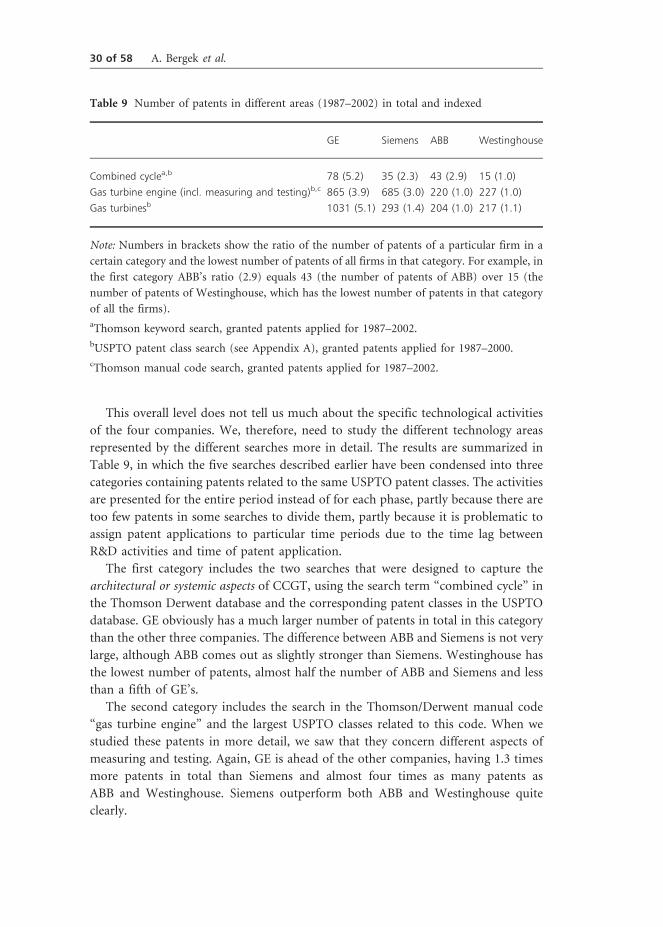
This overall level does not tell us much about the specific technological activities
of the four companies. We, therefore, need to study the different technology areas
represented by the different searches more in detail. The results are summarized in
Table 9, in which the five searches described earlier have been condensed into three
categories containing patents related to the same USPTO patent classes. The activities
are presented for the entire period instead of for each phase, partly because there are
too few patents in some searches to divide them, partly because it is problematic to
assign patent applications to particular time periods due to the time lag between
R&D activities and time of patent application.
The first category includes the two searches that were designed to capture the
architectural or systemic aspects of CCGT, using the search term “combined cycle” in
the Thomson Derwent database and the corresponding patent classes in the USPTO
database. GE obviously has a much larger number of patents in total in this category
than the other three companies. The difference between ABB and Siemens is not very
large, although ABB comes out as slightly stronger than Siemens. Westinghouse has
the lowest number of patents, almost half the number of ABB and Siemens and less
than a fifth of GE’s.
The second category includes the search in the Thomson/Derwent manual code
“gas turbine engine” and the largest USPTO classes related to this code. When we
studied these patents in more detail, we saw that they concern different aspects of
measuring and testing. Again, GE is ahead of the other companies, having 1.3 times
more patents in total than Siemens and almost four times as many patents as
ABB and Westinghouse. Siemens outperform both ABB and Westinghouse quite
clearly.
Table 9 Number of patents in different areas (1987–2002) in total and indexed
GE Siemens ABB Westinghouse
Combined cyclea,b 78 (5.2) 35 (2.3) 43 (2.9) 15 (1.0)
Gas turbine engine (incl. measuring and testing)b,c 865 (3.9) 685 (3.0) 220 (1.0) 227 (1.0)
Gas turbinesb 1031 (5.1) 293 (1.4) 204 (1.0) 217 (1.1)
Note: Numbers in brackets show the ratio of the number of patents of a particular firm in a
certain category and the lowest number of patents of all firms in that category. For example, in
the first category ABB’s ratio (2.9) equals 43 (the number of patents of ABB) over 15 (the
number of patents of Westinghouse, which has the lowest number of patents in that category
of all the firms).
aThomson keyword search, granted patents applied for 1987–2002.
bUSPTO patent class search (see Appendix A), granted patents applied for 1987–2000.
cThomson manual code search, granted patents applied for 1987–2002.
30 of 58 A. Bergek et al.
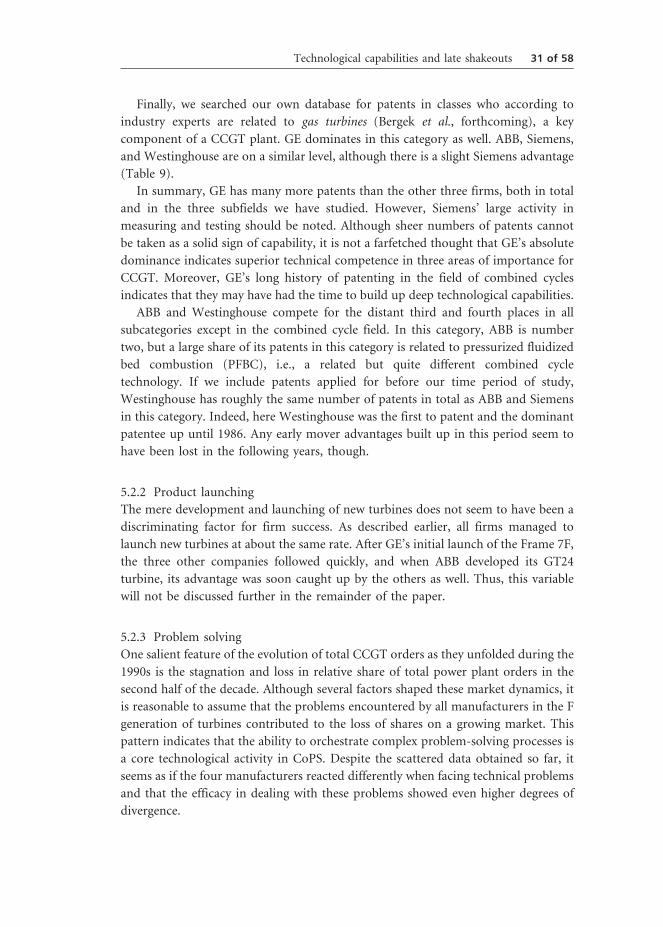
Finally, we searched our own database for patents in classes who according to
industry experts are related to gas turbines (Bergek et al., forthcoming), a key
component of a CCGT plant. GE dominates in this category as well. ABB, Siemens,
and Westinghouse are on a similar level, although there is a slight Siemens advantage
(Table 9).
In summary, GE has many more patents than the other three firms, both in total
and in the three subfields we have studied. However, Siemens’ large activity in
measuring and testing should be noted. Although sheer numbers of patents cannot
be taken as a solid sign of capability, it is not a farfetched thought that GE’s absolute
dominance indicates superior technical competence in three areas of importance for
CCGT. Moreover, GE’s long history of patenting in the field of combined cycles
indicates that they may have had the time to build up deep technological capabilities.
ABB and Westinghouse compete for the distant third and fourth places in all
subcategories except in the combined cycle field. In this category, ABB is number
two, but a large share of its patents in this category is related to pressurized fluidized
bed combustion (PFBC), i.e., a related but quite different combined cycle
technology. If we include patents applied for before our time period of study,
Westinghouse has roughly the same number of patents in total as ABB and Siemens
in this category. Indeed, here Westinghouse was the first to patent and the dominant
patentee up until 1986. Any early mover advantages built up in this period seem to
have been lost in the following years, though.
5.2.2 Product launching
The mere development and launching of new turbines does not seem to have been a
discriminating factor for firm success. As described earlier, all firms managed to
launch new turbines at about the same rate. After GE’s initial launch of the Frame 7F,
the three other companies followed quickly, and when ABB developed its GT24
turbine, its advantage was soon caught up by the others as well. Thus, this variable
will not be discussed further in the remainder of the paper.
5.2.3 Problem solving
One salient feature of the evolution of total CCGT orders as they unfolded during the
1990s is the stagnation and loss in relative share of total power plant orders in the
second half of the decade. Although several factors shaped these market dynamics, it
is reasonable to assume that the problems encountered by all manufacturers in the F
generation of turbines contributed to the loss of shares on a growing market. This
pattern indicates that the ability to orchestrate complex problem-solving processes is
a core technological activity in CoPS. Despite the scattered data obtained so far, it
seems as if the four manufacturers reacted differently when facing technical problems
and that the efficacy in dealing with these problems showed even higher degrees of
divergence.
Technological capabilities and late shakeouts 31 of 58
GE seems to have reacted in a very determined way when reports about turbine
problems began to surface in the mid 1990s. Faulty turbines were rapidly
decommissioned and brought to the US; problem-solving teams were put together
with experts from relevant divisions. The company publicly announced its problems
and the measures taken to rectify them, and within 2 years it had solved the issues
with the rotors. GE was able to use its long experience in this technological domain,
both in aero-engines as well as in stationary gas turbines.
Much in the same vein, Siemens publicly announced its problems with the new
generation of turbines. However, the German company had much less rapid success
than GE. For a several consecutive years, Siemens had to devote considerable
resources to these technical problems. It was not until the beginning of the new
millennium that the company could announce that they were on the right track
again.
Reports on problem-solving efforts at ABB are more difficult to come across.
Despite being aware of problems with the new GT24/26 design, the company
continued selling its turbines and CCGT applications until it was no longer possible.
In hindsight, it is clear that ABB was overambitious in its hurried introduction of this
design, perhaps because it was the last to launch an F technology product. This,
combined with a unique design, laid the ground for the problems that emerged. The
company never managed to rectify the technical problems, but these were to be
inherited by Alstom when they acquired ABB’s Power Generation business towards
the end of the 20th century.
Westinghouse’s problems were even less public than ABB’s. It is difficult to find
published acknowledgement that problems were experienced with Westinghouse or
Mitsubishi turbines. However, many in the gas turbine industry acknowledge that
Westinghouse had its own reliability problems (Lukas, 2003; Smith, 2003).
6. Analysis: what were the main differences and can theyexplain (part of) the outcome?
This article set out to analyze late industry dynamics in mature science-based
industries, using the case of CCGT technology to explore the influence of
technological capabilities on the outcome. Earlier, we described how GE,
Westinghouse, ABB, and Siemens launched products with advanced technical
performance in the 1980s and early 1990s. At the end of the 1990s, however, GE came
out as number one in the industry and Siemens followed as a strong number two,
whereas Westinghouse and ABB divested its power generation segment. Why did the
fate of these big four come to be so different? Can differences in technological
capabilities (Table 10) explain the outcome? To identify the main distinguishing
factors, we will start by discussing GE in relation to the other companies. After that
32 of 58 A. Bergek et al.
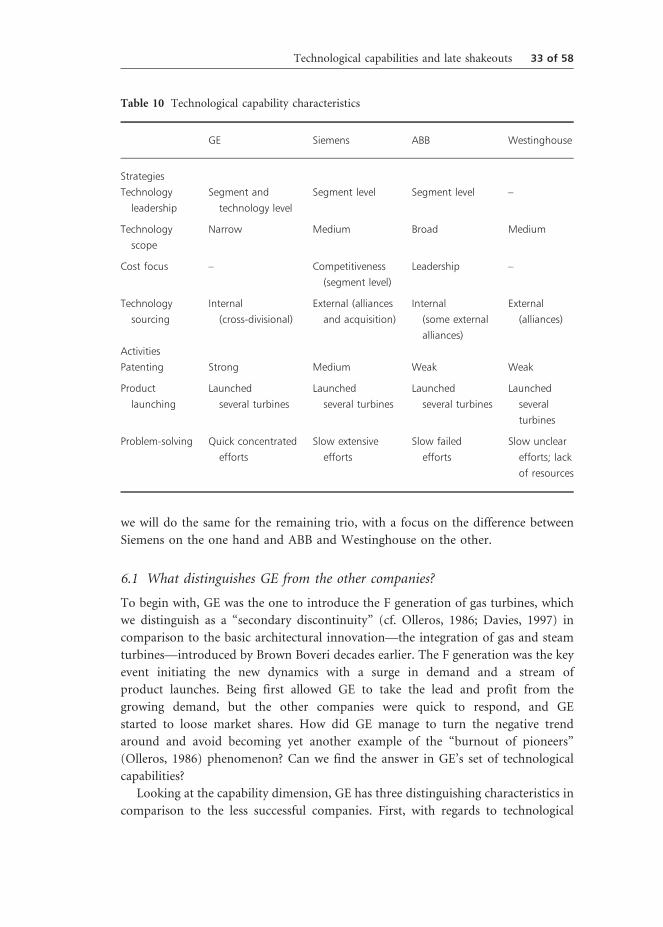
we will do the same for the remaining trio, with a focus on the difference between
Siemens on the one hand and ABB and Westinghouse on the other.
6.1 What distinguishes GE from the other companies?
To begin with, GE was the one to introduce the F generation of gas turbines, which
we distinguish as a “secondary discontinuity” (cf. Olleros, 1986; Davies, 1997) in
comparison to the basic architectural innovation—the integration of gas and steam
turbines—introduced by Brown Boveri decades earlier. The F generation was the key
event initiating the new dynamics with a surge in demand and a stream of
product launches. Being first allowed GE to take the lead and profit from the
growing demand, but the other companies were quick to respond, and GE
started to loose market shares. How did GE manage to turn the negative trend
around and avoid becoming yet another example of the “burnout of pioneers”
(Olleros, 1986) phenomenon? Can we find the answer in GE’s set of technological
capabilities?
Looking at the capability dimension, GE has three distinguishing characteristics in
comparison to the less successful companies. First, with regards to technological
Table 10 Technological capability characteristics
GE Siemens ABB Westinghouse
Strategies
Technology
leadership
Segment and
technology level
Segment level Segment level –
Technology
scope
Narrow Medium Broad Medium
Cost focus – Competitiveness
(segment level)
Leadership –
Technology
sourcing
Internal
(cross-divisional)
External (alliances
and acquisition)
Internal
(some external
alliances)
External
(alliances)
Activities
Patenting Strong Medium Weak Weak
Product
launching
Launched
several turbines
Launched
several turbines
Launched
several turbines
Launched
several
turbines
Problem-solving Quick concentrated
efforts
Slow extensive
efforts
Slow failed
efforts
Slow unclear
efforts; lack
of resources
Technological capabilities and late shakeouts 33 of 58
scope, GE was much more focused on a few technological areas (of which CCGT was
the most prominent) and had a clearer technology leadership strategy within this
area than the other companies.
Second, the high patenting activity suggests that GE had a pool of knowl-
edge in the chosen focus area, which was both deeper and broader than those of the
other firms. In combination with its long experiences in design, manufacturing,
operation, and service of CCGT plants this may be one of the explanations for
GE’s superior problem-solving abilities. ABB, Siemens, and Westinghouse had less
total experience and were forced to launch new products very quickly, as they
struggled to catch up with GE. It seems reasonable to assume that they had less time
for extensive testing and interaction with selected “lead customers,” and thus, were
not able to learn and accumulate experience from experimentation to the same
extent as GE.
Third, and in part as a result of the first two characteristics, GE’s showed proof
of true technology leadership when its customers started to experience turbine
problems, and managed to solve these problems quickly through a concentrated
effort. This problem-solving ability was key to regaining market trust and becoming
well positioned before the market “exploded” in the late 1990s.
The differences with respect to technology sourcing are less clear-cut. GE and ABB
primarily used internal technology sourcing, whereas Siemens and Westinghouse
used external alliances. In contrast to GE, however, ABB neither had internal aircraft
engine competence, nor the same competence in gas turbines and CCGT (as
indicated by the lower patenting activity).
6.2 What about Siemens, ABB, and Westinghouse?
If the factors outlined earlier can explain GE’s relative success, then what about the
other three companies? They had been active in the industry since long before the
discontinuous F generation gas turbine was introduced by GE and soon after that
launched their own advanced gas turbines. They obviously had the willingness and
ability to respond initially. We may note that Siemens was neither the fastest
follower, nor the quickest to launch a new generation of turbines. Siemens could,
thus, hardly benefit from any distinct “second-mover” advantages. In terms of
market position, the three companies ran neck-to-neck at least until 1998 in a fast-
growing market. Can we distinguish any capability-related factors pointing to
Siemens’ becoming the industry’s number two?
In comparison to ABB, Siemens was technologically more focused, had less of a
cost focus and made more effective use of external technology sourcing. Although
ABB teamed up with a number of different companies, little seems to have been
transferred from these alliances to ABB’s development of CCGT, whereas Siemens
was able to get full access to aircraft engine competence through its alliance with
34 of 58 A. Bergek et al.
Pratt & Whitney. Both ABB and Siemens aimed at technology leadership, but
Siemens had a much more clear ambition to be the industry pacesetter in power
generation than ABB. The differences between Siemens and ABB with regards to
technological activities were smaller, but still significant in terms of total number of
gas turbine-related patents, which indicates that Siemens had a stronger basis both
for effective design and for “after-delivery development.”
The strategic differences between Siemens and Westinghouse in power generation
are less accentuated. Both companies had similar scope and neither of them had an
explicit cost focus. Both used external sourcing and had fruitful external alliances.
Both companies were able to launch several successive products with similar
performance. An important difference, however, was Westinghouse’s strong
commitment to nuclear power.
Westinghouse’s patenting activity was much lower than Siemens, though,
indicating less ability to design effective turbines, and much gas turbine competence
pertaining to the original design was transferred to Westinghouse’s Japanese
partner Mitsubishi. In addition, there are strong indications that corporate
effects had a detrimental effect on Westinghouse (Annual Reports 1993–1997;
cf. Bowman and Helfat (2001) and O’Sullivan (2006)). The company tried
several times to cut off bleeding business segments from its highly diversified
portfolio and suffered from continuous turmoil at the senior management level. The
power generation segment exhibited a similar pattern of trying to narrow the
technological scope, making the company even more dependent on its nuclear
business, which in turn was fraught with liability claims and costs. With
accumulating losses in its power systems segment from 1993 and onwards, and
insufficient depth in CCGT-technology, the company lacked technological, financial,
and managerial resources to meet the continuing challenges in this high-odds
technology race, especially when substantial efforts had to be deployed to solve after-
delivery problems.
7. Discussion and conclusions
The purpose of this article was to analyze the role of technological capabilities for the
competitive outcomes in mature, complex systems-oriented industries facing
technological change.
We started by noting the dominant focus in much of the innovation literature on
early shakeouts and the lack of research on the evolution of industries in their mature
stages (cf. Klepper, 1997). Through our study of the CCGT case, we have shown that
mature industries may indeed be characterized by substantial dynamics in terms of
technological changes, market shares and survival/shake-out patterns: there was
rapid introduction of radically better gas turbines; market leadership positions
Technological capabilities and late shakeouts 35 of 58
changed several times between the incumbent firms; but no new entrants appeared
on the scene. Thus, in line with the CoPS literature (Davies, 1997; Hobday, 1998),
this study provides a contrast to the standard industry life cycle literature and
demonstrates that mature industries neither have to be characterized by stable
market share division among incumbents, nor do they have to be overtaken by new
entrants taking advantage of the technological discontinuities (cf. also Granstrand
and Sjolander, 1990). Most importantly, however, we saw how two out of four large
and old companies were forced to exit one of their main business areas in a late
shakeout.
In our analysis in the previous section, we made the case that the differences
between the four incumbent firms in terms of performance and survival may be
related to differences in their technological capabilities. We saw that two companies
with superior technological capabilities (GE and Siemens), in comparison to the
other two incumbents (ABB and Westinghouse), came out as number one and two in
the CCGT “race.” We will here highlight the most important observations in relation
to this.
First, this article demonstrates the importance of having a large and relevant
capability base, built up by R&D activities, as a foundation for product development
in complex technology fields. This corresponds well with the findings of previous
research (cf. Prencipe, 2000; Wang and von Tunzelmann, 2000). In particular,
however, our study emphasizes the importance of integrating knowledge from
several different technology fields in order to develop new subsystems. Whereas all
CCGT firms were able to source and integrate external knowledge related to some
components and subsystems, e.g., alloys and coatings for turbines and blades, there
was a divergence among firms in how they organized the sourcing and integration of
critical capabilities related to the core of the CCGT plant—the advanced gas
turbine—from the aircraft engine field.
This finding generates questions regarding the organization of systems integ-
ration in CoPS firms. In contrast to most previous research on this matter
(Brusoni et al., 2001; Dosi et al., 2003; Prencipe, 2003), our study highlights the
challenges involved in integrating knowledge from “parallel” industries rather than
from other parts of the vertical supply chain. In this study, all firms were vertically
integrated as far as the gas turbine was concerned, but the successful firms managed
to source relevant complementary knowledge from another sector—the aero engine
industry. This implies that the notion of integrative (Henderson and Cockburn,
1994), relational (Lorenzoni and Lipparini, 1999), or network (Prencipe, 2003)
capabilities needs to be broadened to also include related and complementary
industries.
Moreover, while it was true that GE had access to more relevant aero engine
knowledge in-house than its competitors, we may note that the case of Siemens
shows that not all capabilities need to be available in-house. Although we, thus,
cannot say whether internal or external sourcing is better per se, we can make two
36 of 58 A. Bergek et al.
observations from this case: (i) Internal sourcing requires internal capabilities in
relevant areas. This was true for GE, but when ABB tried internal sourcing it lacked
the necessary depth in related fields in-house. (ii) External sourcing requires
effective management of alliances on both strategic and operational levels. Siemens
and Westinghouse seem to have been more effective in utilizing their alliances
than ABB, but a more detailed answer with regards to why they were so requires
further research. Indeed, the major discrepancies between these three firms in
the way they succeeded in establishing, maintaining, and gaining from external
sourcing imply that an important task for future research is to better understand
how firms can maintain sufficient integration also in more loosely coupled
constellations, such as technology alliances, when underlying knowledge is systemic
and complex.
Second, a focused technology strategy on the segment level seems to be posit-
ively related to performance (cf. also Bergek et al., forthcoming). In this study,
the companies that focused on a limited number of technologies on the segment
level were more successful than the ones that had a broad technology scope.
In particular, it seems likely that ABB’s broad scope diverted attention and resources
from CCGT to other technologies, such as PFBC, which never became a com-
mercial success (Watson, 2004). It is also noticeable that ABB, in contrast to GE
and Siemens, did not express any explicit aim to be the first to introduce new
product generations within power generation and/or CCGT. Broad scope was
difficult to combine with a technological leadership strategy in this demanding
segment.
The consequence of this observation is that technological depth is preferable to
technological breadth. At a first glance, this may seem to contradict the literature on
technological diversification (Granstrand et al., 1997; Fai, 2003; Torrisi and
Granstrand, 2004) and the literature on systems integration (Prencipe, 2000; Wang
and von Tunzelmann, 2000). However, the diversification literature has most often
studied diversification on a corporate level, which may still give an advantage.
Indeed, diversification on a corporate level was important for GE, since it could
source aircraft competence internally.35 Moreover, the finding supports the general
idea that systems integration firms have to economize on their cognitive efforts by
35In addition, the technological diversification literature often makes a distinction between
technological diversification and product diversification (cf. Granstrand and Sjolander, 1990;
Gambardella and Torrisi, 1998; Garcia-Vega, 2000). Whereas there, as mentioned previously, is
evidence that technological diversification is positively related to performance, the benefits of
product diversification has been questioned (cf. Gambardella and Torrisi, 1998; Garcia-Vega, 2000).
In CoPS, the distinction between technology and product is not always easy to make empirically,
since even “generic” technologies (i.e., technologies used in several application areas), such as steam
turbine technology, has to be adapted to each specific application.
Technological capabilities and late shakeouts 37 of 58
finding an appropriate scope and division of labor in its technological activities
(cf. Dosi et al., 2003).
Third, the study shows that the development and launching of new products may
not be as important as implicitly assumed in much of the capabilities literature
(Teece et al., 1997; Cockburn et al., 2000; Eisenhardt and Martin, 2000). In this case,
all companies were able to launch successive generations of turbines at about the
same rate and with similar performance in terms of efficiency. However, all
companies also suffered from periods of customer-experienced problems in their
delivered machines (perhaps because of the forced launch rate), and had to devote
considerable resources to problem-solving activities. Solving these after-delivery
problems and safeguarding high operational reliability in these complex machines
seem to have been the moment of truth. This implies that after-launch
redevelopment may be more important than initial product development in cases
with rapid introduction of new product generations.
Perhaps this is a consequence of the CoPS character of CCGT; the complexity,
degree of customer adaptation, and sheer scale implies that full load tests cannot be
made by the supplier before a new product is launched on the market (cf. Hobday,
1998). When there is both rapid technology and market development, products may
already be widely spread by the time problems are noticed. To handle the resulting
large-scale problem of redevelopment is a great challenge that all firms are not
equally equipped to handle. In learning from previous mistakes (cf. Helfat and
Raubitschek, 2000), the abovementioned aspects—a deep competence base in
relevant fields, ability to source relevant knowledge, and a focused strategy—seem to
be a decisive advantage. Indeed, GE’s outstanding ability of after-launch
redevelopment demonstrated true technology leadership and showed that the
strategic statements in annual reports were not “all talk,” but consistent with actual
operational capabilities.
To sum up, this article has explored (i) technological competition and discon-
tinuities in mature industries, and (ii) the importance of technological capabilities in
explaining the resulting “late shakeouts.” Mainly our study fills a void in the existing
CoPS literature, where there is a lack of studies relating technological evolution with
market outcomes and changes in industry structures. Our findings indicate that
when applying traditional models of industry life cycles to CoPS industries, they need
to be amended to incorporate the possibilities of successive discontinuities and
changes in industry leadership based on the technological capabilities of incumbent
firms.
Our conclusions regarding technological discontinuities, late shakeouts, and the
importance of technological capabilities in the CCGT case may offer insights also for the
study of the dynamics in “non-CoPS” industries. One case in point is the automotive
industry. Here, in a once mature industry, the challenges of global climate change,
38 of 58 A. Bergek et al.
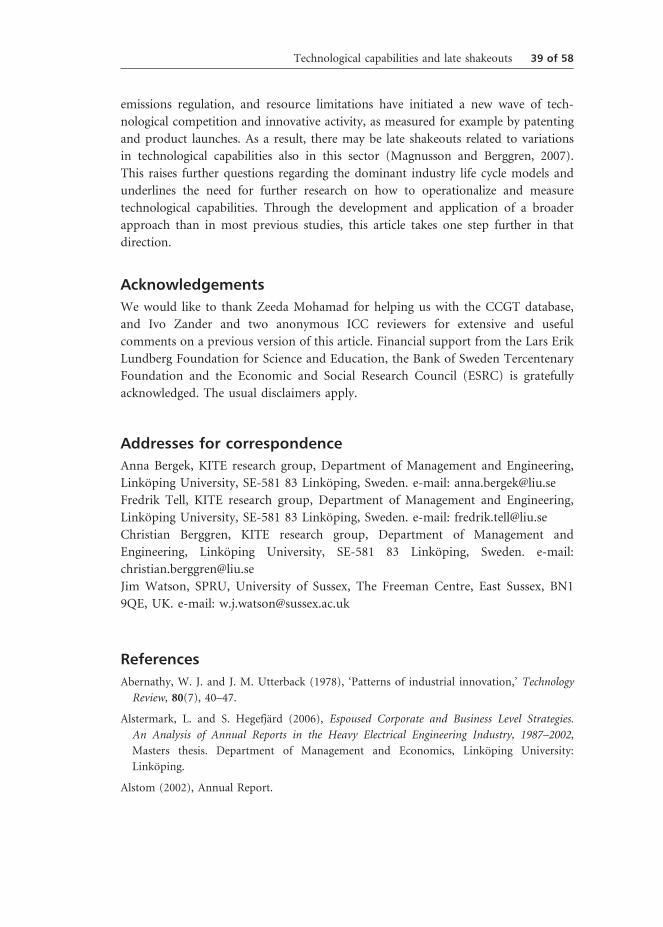
emissions regulation, and resource limitations have initiated a new wave of tech-
nological competition and innovative activity, as measured for example by patenting
and product launches. As a result, there may be late shakeouts related to variations
in technological capabilities also in this sector (Magnusson and Berggren, 2007).
This raises further questions regarding the dominant industry life cycle models and
underlines the need for further research on how to operationalize and measure
technological capabilities. Through the development and application of a broader
approach than in most previous studies, this article takes one step further in that
direction.
Acknowledgements
We would like to thank Zeeda Mohamad for helping us with the CCGT database,
and Ivo Zander and two anonymous ICC reviewers for extensive and useful
comments on a previous version of this article. Financial support from the Lars Erik
Lundberg Foundation for Science and Education, the Bank of Sweden Tercentenary
Foundation and the Economic and Social Research Council (ESRC) is gratefully
acknowledged. The usual disclaimers apply.
Addresses for correspondence
Anna Bergek, KITE research group, Department of Management and Engineering,
Linkoping University, SE-581 83 Linkoping, Sweden. e-mail: [email protected]
Fredrik Tell, KITE research group, Department of Management and Engineering,
Linkoping University, SE-581 83 Linkoping, Sweden. e-mail: [email protected]
Christian Berggren, KITE research group, Department of Management and
Engineering, Linkoping University, SE-581 83 Linkoping, Sweden. e-mail:
Jim Watson, SPRU, University of Sussex, The Freeman Centre, East Sussex, BN1
9QE, UK. e-mail: [email protected]
References
Abernathy, W. J. and J. M. Utterback (1978), ‘Patterns of industrial innovation,’ Technology
Review, 80(7), 40–47.
Alstermark, L. and S. Hegefjard (2006), Espoused Corporate and Business Level Strategies.
An Analysis of Annual Reports in the Heavy Electrical Engineering Industry, 1987–2002,
Masters thesis. Department of Management and Economics, Linkoping University:
Linkoping.
Alstom (2002), Annual Report.
Technological capabilities and late shakeouts 39 of 58
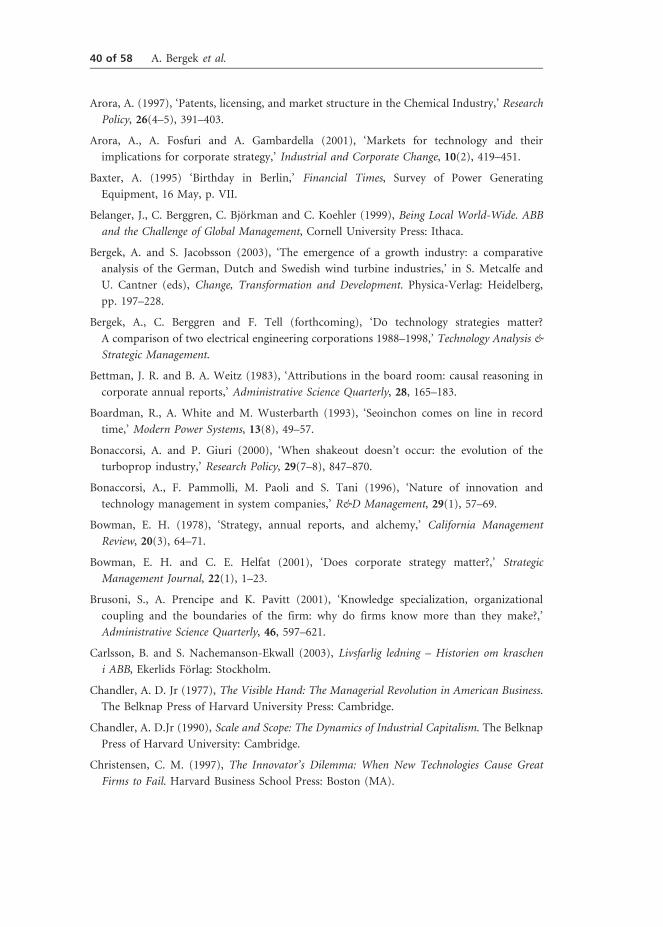
Arora, A. (1997), ‘Patents, licensing, and market structure in the Chemical Industry,’ Research
Policy, 26(4–5), 391–403.
Arora, A., A. Fosfuri and A. Gambardella (2001), ‘Markets for technology and their
implications for corporate strategy,’ Industrial and Corporate Change, 10(2), 419–451.
Baxter, A. (1995) ‘Birthday in Berlin,’ Financial Times, Survey of Power Generating
Equipment, 16 May, p. VII.
Belanger, J., C. Berggren, C. Bjorkman and C. Koehler (1999), Being Local World-Wide. ABB
and the Challenge of Global Management, Cornell University Press: Ithaca.
Bergek, A. and S. Jacobsson (2003), ‘The emergence of a growth industry: a comparative
analysis of the German, Dutch and Swedish wind turbine industries,’ in S. Metcalfe and
U. Cantner (eds), Change, Transformation and Development. Physica-Verlag: Heidelberg,
pp. 197–228.
Bergek, A., C. Berggren and F. Tell (forthcoming), ‘Do technology strategies matter?
A comparison of two electrical engineering corporations 1988–1998,’ Technology Analysis &
Strategic Management.
Bettman, J. R. and B. A. Weitz (1983), ‘Attributions in the board room: causal reasoning in
corporate annual reports,’ Administrative Science Quarterly, 28, 165–183.
Boardman, R., A. White and M. Wusterbarth (1993), ‘Seoinchon comes on line in record
time,’ Modern Power Systems, 13(8), 49–57.
Bonaccorsi, A. and P. Giuri (2000), ‘When shakeout doesn’t occur: the evolution of the
turboprop industry,’ Research Policy, 29(7–8), 847–870.
Bonaccorsi, A., F. Pammolli, M. Paoli and S. Tani (1996), ‘Nature of innovation and
technology management in system companies,’ R&D Management, 29(1), 57–69.
Bowman, E. H. (1978), ‘Strategy, annual reports, and alchemy,’ California Management
Review, 20(3), 64–71.
Bowman, E. H. and C. E. Helfat (2001), ‘Does corporate strategy matter?,’ Strategic
Management Journal, 22(1), 1–23.
Brusoni, S., A. Prencipe and K. Pavitt (2001), ‘Knowledge specialization, organizational
coupling and the boundaries of the firm: why do firms know more than they make?,’
Administrative Science Quarterly, 46, 597–621.
Carlsson, B. and S. Nachemanson-Ekwall (2003), Livsfarlig ledning – Historien om kraschen
i ABB, Ekerlids Forlag: Stockholm.
Chandler, A. D. Jr (1977), The Visible Hand: The Managerial Revolution in American Business.
The Belknap Press of Harvard University Press: Cambridge.
Chandler, A. D.Jr (1990), Scale and Scope: The Dynamics of Industrial Capitalism. The Belknap
Press of Harvard University: Cambridge.
Christensen, C. M. (1997), The Innovator’s Dilemma: When New Technologies Cause Great
Firms to Fail. Harvard Business School Press: Boston (MA).
40 of 58 A. Bergek et al.
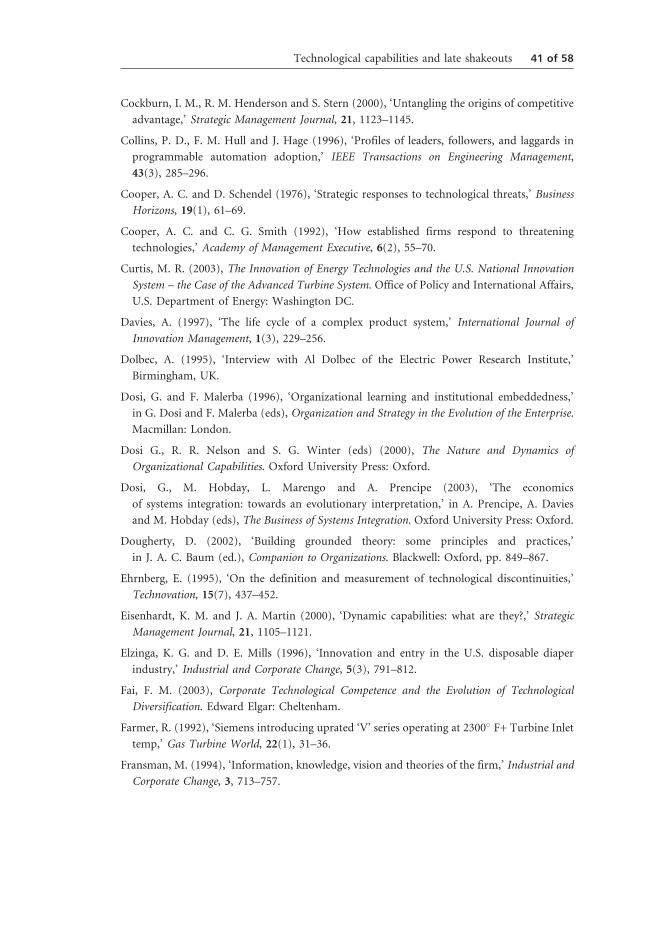
Cockburn, I. M., R. M. Henderson and S. Stern (2000), ‘Untangling the origins of competitive
advantage,’ Strategic Management Journal, 21, 1123–1145.
Collins, P. D., F. M. Hull and J. Hage (1996), ‘Profiles of leaders, followers, and laggards in
programmable automation adoption,’ IEEE Transactions on Engineering Management,
43(3), 285–296.
Cooper, A. C. and D. Schendel (1976), ‘Strategic responses to technological threats,’ Business
Horizons, 19(1), 61–69.
Cooper, A. C. and C. G. Smith (1992), ‘How established firms respond to threatening
technologies,’ Academy of Management Executive, 6(2), 55–70.
Curtis, M. R. (2003), The Innovation of Energy Technologies and the U.S. National Innovation
System – the Case of the Advanced Turbine System. Office of Policy and International Affairs,
U.S. Department of Energy: Washington DC.
Davies, A. (1997), ‘The life cycle of a complex product system,’ International Journal of
Innovation Management, 1(3), 229–256.
Dolbec, A. (1995), ‘Interview with Al Dolbec of the Electric Power Research Institute,’
Birmingham, UK.
Dosi, G. and F. Malerba (1996), ‘Organizational learning and institutional embeddedness,’
in G. Dosi and F. Malerba (eds), Organization and Strategy in the Evolution of the Enterprise.
Macmillan: London.
Dosi G., R. R. Nelson and S. G. Winter (eds) (2000), The Nature and Dynamics of
Organizational Capabilities. Oxford University Press: Oxford.
Dosi, G., M. Hobday, L. Marengo and A. Prencipe (2003), ‘The economics
of systems integration: towards an evolutionary interpretation,’ in A. Prencipe, A. Davies
and M. Hobday (eds), The Business of Systems Integration. Oxford University Press: Oxford.
Dougherty, D. (2002), ‘Building grounded theory: some principles and practices,’
in J. A. C. Baum (ed.), Companion to Organizations. Blackwell: Oxford, pp. 849–867.
Ehrnberg, E. (1995), ‘On the definition and measurement of technological discontinuities,’
Technovation, 15(7), 437–452.
Eisenhardt, K. M. and J. A. Martin (2000), ‘Dynamic capabilities: what are they?,’ Strategic
Management Journal, 21, 1105–1121.
Elzinga, K. G. and D. E. Mills (1996), ‘Innovation and entry in the U.S. disposable diaper
industry,’ Industrial and Corporate Change, 5(3), 791–812.
Fai, F. M. (2003), Corporate Technological Competence and the Evolution of Technological
Diversification. Edward Elgar: Cheltenham.
Farmer, R. (1992), ‘Siemens introducing uprated ‘V’ series operating at 2300� F+ Turbine Inlet
temp,’ Gas Turbine World, 22(1), 31–36.
Fransman, M. (1994), ‘Information, knowledge, vision and theories of the firm,’ Industrial and
Corporate Change, 3, 713–757.
Technological capabilities and late shakeouts 41 of 58
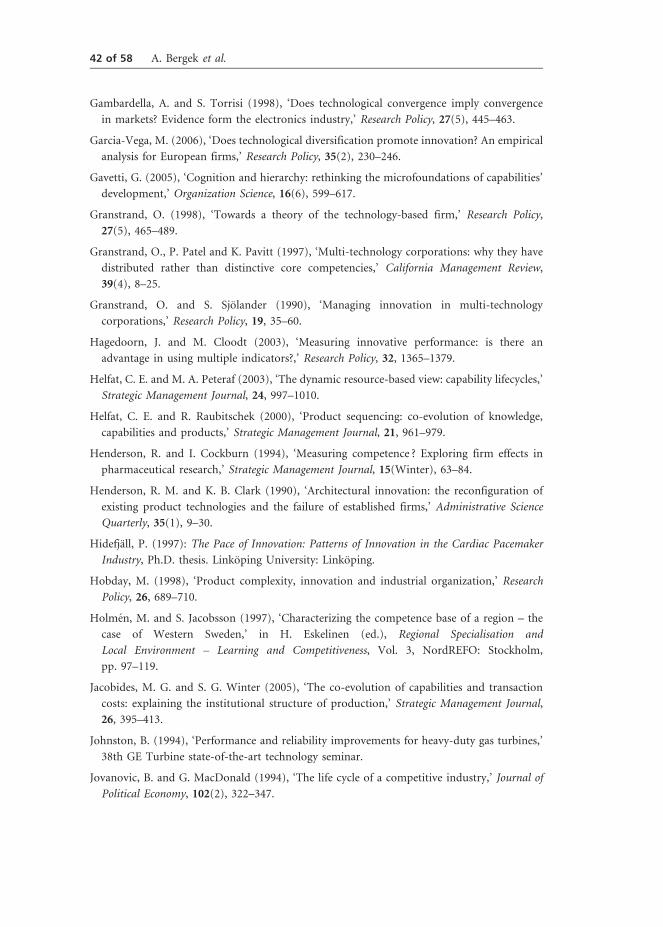
Gambardella, A. and S. Torrisi (1998), ‘Does technological convergence imply convergence
in markets? Evidence form the electronics industry,’ Research Policy, 27(5), 445–463.
Garcia-Vega, M. (2006), ‘Does technological diversification promote innovation? An empirical
analysis for European firms,’ Research Policy, 35(2), 230–246.
Gavetti, G. (2005), ‘Cognition and hierarchy: rethinking the microfoundations of capabilities’
development,’ Organization Science, 16(6), 599–617.
Granstrand, O. (1998), ‘Towards a theory of the technology-based firm,’ Research Policy,
27(5), 465–489.
Granstrand, O., P. Patel and K. Pavitt (1997), ‘Multi-technology corporations: why they have
distributed rather than distinctive core competencies,’ California Management Review,
39(4), 8–25.
Granstrand, O. and S. Sjolander (1990), ‘Managing innovation in multi-technology
corporations,’ Research Policy, 19, 35–60.
Hagedoorn, J. and M. Cloodt (2003), ‘Measuring innovative performance: is there an
advantage in using multiple indicators?,’ Research Policy, 32, 1365–1379.
Helfat, C. E. and M. A. Peteraf (2003), ‘The dynamic resource-based view: capability lifecycles,’
Strategic Management Journal, 24, 997–1010.
Helfat, C. E. and R. Raubitschek (2000), ‘Product sequencing: co-evolution of knowledge,
capabilities and products,’ Strategic Management Journal, 21, 961–979.
Henderson, R. and I. Cockburn (1994), ‘Measuring competence ? Exploring firm effects in
pharmaceutical research,’ Strategic Management Journal, 15(Winter), 63–84.
Henderson, R. M. and K. B. Clark (1990), ‘Architectural innovation: the reconfiguration of
existing product technologies and the failure of established firms,’ Administrative Science
Quarterly, 35(1), 9–30.
Hidefjall, P. (1997): The Pace of Innovation: Patterns of Innovation in the Cardiac Pacemaker
Industry, Ph.D. thesis. Linkoping University: Linkoping.
Hobday, M. (1998), ‘Product complexity, innovation and industrial organization,’ Research
Policy, 26, 689–710.
Holmen, M. and S. Jacobsson (1997), ‘Characterizing the competence base of a region – the
case of Western Sweden,’ in H. Eskelinen (ed.), Regional Specialisation and
Local Environment – Learning and Competitiveness, Vol. 3, NordREFO: Stockholm,
pp. 97–119.
Jacobides, M. G. and S. G. Winter (2005), ‘The co-evolution of capabilities and transaction
costs: explaining the institutional structure of production,’ Strategic Management Journal,
26, 395–413.
Johnston, B. (1994), ‘Performance and reliability improvements for heavy-duty gas turbines,’
38th GE Turbine state-of-the-art technology seminar.
Jovanovic, B. and G. MacDonald (1994), ‘The life cycle of a competitive industry,’ Journal of
Political Economy, 102(2), 322–347.
42 of 58 A. Bergek et al.
Klepper, S. (1996), ‘Entry, exit, growth, and innovation over the product life cycle,’ American
Economic Review, 86(3), 562–583.
Klepper, S. (1997), ‘Industry life cycles,’ Industrial and Corporate Change, 6(1), 145–182.
Klepper, S. (2002), ‘Firm survival and the evolution of oligopoly,’ RAND Journal of Economics,
33, 37–61.
Klepper, S. and E. Graddy (1990), ‘The evolution of new industries and the determinants of
market structure,’ RAND Journal of Economics, 21, 24–44.
Klepper, S. and K. L. Simons (2000), ‘The making on an oligopoly: firm survival and
technological change in the evolution of the U.S. tire industry,’ Journal of Political Economy,
108(4), 728–760.
Klepper, S. and K. L. Simons (2005), ‘Industry shakeouts and technological change,’
International Journal of Industrial Organization, 23, 23–43.
Kline, S. J. and N. Rosenberg (1986), ‘An overview of innovation,’ in R. Landau and
N. Rosenberg (eds), The Positive Sum Strategy. Harnessing Technology for Economic Growth.
National Academy Press: Washington DC.
Lazonick, W. (1991), Business Organization and the Myth of the Market Economy. Cambridge
University Press: Cambridge.
Lazonick, W. and A. Prencipe (2005), ‘Dynamic capabilities and sustained innovation:
strategic control and financial commitment at Rolls-Royce plc,’ Industrial and Corporate
Change, 14(3), 501–542.
Le Bas, C. and C. Sierra (2002), ‘Location versus home country advantages in R&D
activities: some further results on multinationals locational strategies,’ Research Policy, 31,
589–609.
Lieberman, M. B. and D. B. Montgomery (1988), ‘First-mover advantages,’ Strategic
Management Journal, 9(summer special issue), 41–58.
Lieberman, M. B. and D. B. Montgomery (1998), ‘First-mover (dis)advantages: retrospective
and link with the resource-based view,’ Strategic Management Journal, 19, 1111–1125.
Lorenzoni, G. and A. Lipparini (1999), ‘The leveraging of interfirm relationships as a
distinctive organizational capability. A longitudinal study,’ Strategic Management Journal,
20(4), 317–338.
Lukas, H. (2003), ‘Today’s high efficiency gas turbines – advantages and problems,’
Presentation at the AEGIS Risk Management seminar: The Benefits & Importance of Loss
Control in Managing Risk.
Magnusson, T. and C. Berggren (2007), ‘Innovation in sustainable vehicles – managing the
new technology based competition within the auto industry,’ Paper presented at the
RADMA conference, Bremen, 4–6 July.
Magnusson, T., F. Tell and J. Watson (2005), ‘From CoPS to mass production? Capabilities
and innovation in power generation equipment manufacturing,’ Industrial and Corporate
Change, 14(1), 1–26.
Technological capabilities and late shakeouts 43 of 58

Maidique, M. A. and P. Patch (1982), ‘Corporate strategy and technological policy,’
in M. L. Tushman and W. A. Moore (eds), Readings in the Management of Innovation.
Pittman: Marchfield (MA).
Makansi, J. (1995), Personal communication from the editor of Power magazine. New York,
USA.
Mansfield, E. (1986), ‘Patents and innovation: an empirical study,’ Management Science, 32(2),
173–181.
Mukherjee, D. (1995), Interview. ABB Power Generation: Baden, Switzerland.
Neidel, A. (1995), Interview. Siemens Gas Turbine Manufacturing Plant: Berlin, Germany,
9th November.
Nelson, R. R. (1991), ‘Why do firms differ, and how does it matter?,’ Strategic Management
Journal, 12(special issue), 61–74.
Nelson, R. R. and S. G. Winter (1982), An Evolutionary Theory of Economic Change. The
Belknap Press of Harvard University Press: Cambridge (MA).
Olleros, F. J. (1986), ‘Emerging industries and the burnout of pioneers,’ Journal of Product
Innovation Management, 1, 5–18.
O’Sullivan, M. A. (2006), ‘Living with the U.S. financial system: the experiences of general
electric and westinghouse electric in the last century,’ Business History Review, 80(4),
621–655.
Patel, P. and K. Pavitt (1991), ‘Large firms in the production of the world’s technology:
an important case of “non-globalisation”,’ Journal of International Business Studies, 22(1),
1–21.
Patel, P. and K. Pavitt (1997), ‘The technological competences of the world’s largest firms:
complex and path-dependent, but not much variety,’ Research Policy, 26, 141–156.
Pavitt, K. (1984), ‘Sectoral patterns of technical change: towards a taxonomy and a theory,’
Research Policy, 13, 343–373.
Porter, M. E. (1980), Competitive Strategy: Techniques for Analyzing Industries and Competitors.
The Free Press: New York.
Porter, M. E. (1983), ‘The technological dimension of competitive strategy,’ Research on
Technological Innovation, Management and Policy, 1, 1–33.
Porter, M. E. (1985), Competitive Advantage. Creating and Sustaining Superior Performance.
The Free Press: New York.
Prencipe, A. (1997), ‘Technological competencies and product’s evolutionary dynamics a case
study from the aero-engine industry,’ Research Policy, 25, 1261–1276.
Prencipe, A. (2000), ‘Breadth and depth of technological capabilities in CoPS: the case of the
aircraft engine control system,’ Research Policy, 29, 895–911.
44 of 58 A. Bergek et al.
Prencipe, A. (2003), ‘Corporate strategy and systems integration capabilities:
managing networks in complex systems industries,’ in A. Prencipe, A. Davies and
M. Hobday (eds), The Business of Systems Integration. Oxford University Press: Oxford.
Sanchez, R. and J. Mahoney (1996), ‘Modularity, flexibility, and knowledge management
in product and organization design,’ Strategic Management Journal, 17(Winter special
issue), 63–76.
Scalzo, A. J., L. D. McLaurin, G. S. Howard, Y. Mori, H. Hiura and T. Sato (1989), ‘A new
150 MW high-efficiency heavy-duty combustion turbine,’ ASME Journal of Engineering for
Gas Turbines and Power, 111(2), 212.
Scherer, F. M. (1983), ‘The propensity to patent,’ International Journal of Industrial
Organization, 1(1), 107–128.
Smith, D. J. (2003), ‘Gas turbines: breaking through the barriers to higher reliability,’ Power
Engineering, 107(5)(May issue).
Strauss, A. and J. Corbin (1990), Basics of Qualitative Research: Grounded Theory Procedures
and Techniques. Sage: Newbury Park.
Teece, D. J. (1986), ‘Profiting from technological innovation:
implications for integration, collaboration, licensing and public policy,’ Research Policy,
15(5), 285–305.
Teece, D. J., G. Pisano and A. Shuen (1997), ‘Dynamic capabilities and strategic management,’
Strategic Management Journal, 18(7), 509–533.
Tell, F. (2000), Organizational Capabilities – A Study of Electrical Power
Transmission Equipment Manufacturers, 1878–1990, PhD Dissertation. Linkoping
University: Linkoping.
Torrisi, S. and O. Granstrand (2004), ‘Technological and business diversification: a survey
of theories and empirical evidence,’ in J. Cantwell, A. Gambardella and O. Granstrand (eds),
The Economics of Technological Diversification. Routledge: London.
Tushman, M. L. and P. Anderson (1986), ‘Technological discontinuities and organizational
environments,’ Administrative Science Quarterly, 31, 439–465.
Utterback, J. M. and F. F. Suarez (1993), ‘Innovation, competition, and industry structure,’
Research Policy, 22(1), 1–21.
Wang, Q. and N. von Tunzelmann (2000), ‘Complexity and the functions of the firm: breadth
and depth,’ Research Policy, 29(7–8), 805–818.
Watson, W. J. (1997), Constructing Success in the Electric Power Industry:
Combined Cycle Gas Turbines and Fluidised Beds, DPhil Thesis. SPRU, University of
Sussex: Falmer.
Watson, W. J. (2004), ‘Selection environments, flexibility, and the success of the gas turbine,’
Research Policy, 33, 1065–1080.
Technological capabilities and late shakeouts 45 of 58
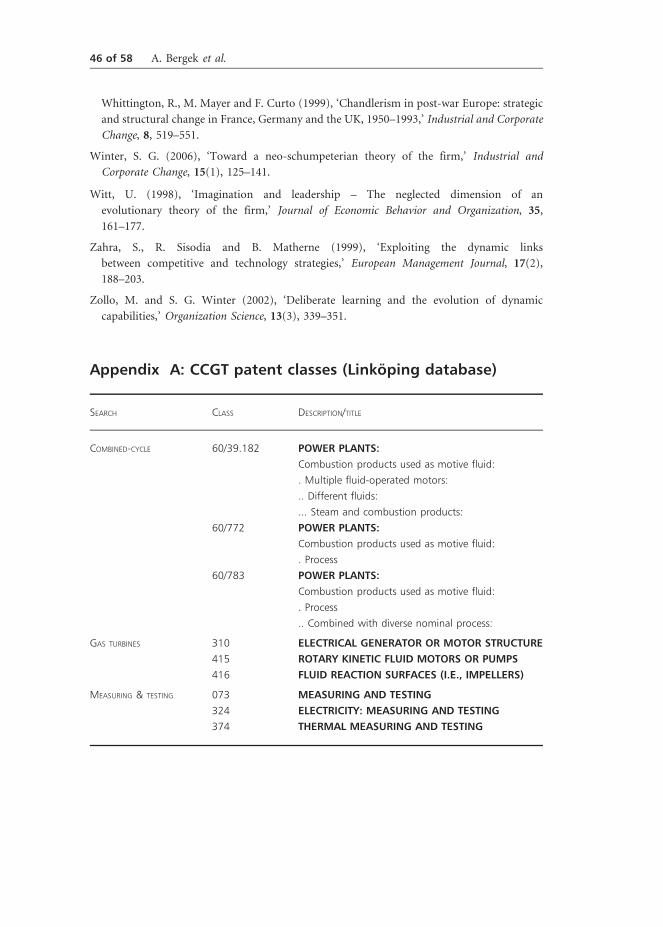
Whittington, R., M. Mayer and F. Curto (1999), ‘Chandlerism in post-war Europe: strategic
and structural change in France, Germany and the UK, 1950–1993,’ Industrial and Corporate
Change, 8, 519–551.
Winter, S. G. (2006), ‘Toward a neo-schumpeterian theory of the firm,’ Industrial and
Corporate Change, 15(1), 125–141.
Witt, U. (1998), ‘Imagination and leadership – The neglected dimension of an
evolutionary theory of the firm,’ Journal of Economic Behavior and Organization, 35,
161–177.
Zahra, S., R. Sisodia and B. Matherne (1999), ‘Exploiting the dynamic links
between competitive and technology strategies,’ European Management Journal, 17(2),
188–203.
Zollo, M. and S. G. Winter (2002), ‘Deliberate learning and the evolution of dynamic
capabilities,’ Organization Science, 13(3), 339–351.
Appendix A: CCGT patent classes (Linkoping database)
SEARCH CLASS DESCRIPTION/TITLE
COMBINED-CYCLE 60/39.182 POWER PLANTS:
Combustion products used as motive fluid:
. Multiple fluid-operated motors:
.. Different fluids:
... Steam and combustion products:
60/772 POWER PLANTS:
Combustion products used as motive fluid:
. Process
60/783 POWER PLANTS:
Combustion products used as motive fluid:
. Process
.. Combined with diverse nominal process:
GAS TURBINES 310 ELECTRICAL GENERATOR OR MOTOR STRUCTURE
415 ROTARY KINETIC FLUID MOTORS OR PUMPS
416 FLUID REACTION SURFACES (I.E., IMPELLERS)
MEASURING & TESTING 073 MEASURING AND TESTING
324 ELECTRICITY: MEASURING AND TESTING
374 THERMAL MEASURING AND TESTING
46 of 58 A. Bergek et al.

Appendix B: Sources for market database
The market order database has been compiled from a number of sources, including:
� Manufacturer reference lists, obtained from the companies
� Utility web sites
� Trade magazines: Gas Turbine World, Modern Power Systems, Asian Electricity
Power, and Turbomachinery International
� World bank publications
� US Department of Energy (for US utility plants)
Technological capabilities and late shakeouts 47 of 58
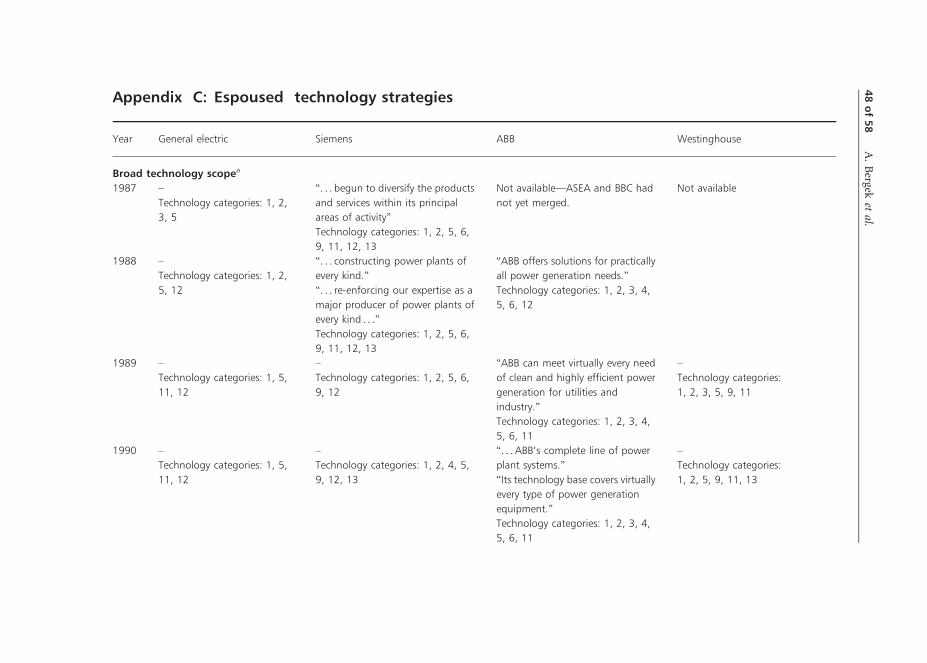
Appendix C: Espoused technology strategies
Year General electric Siemens ABB Westinghouse
Broad technology scopea
1987 –
Technology categories: 1, 2,
3, 5
“. . . begun to diversify the products
and services within its principal
areas of activity”
Technology categories: 1, 2, 5, 6,
9, 11, 12, 13
Not available—ASEA and BBC had
not yet merged.
Not available
1988 –
Technology categories: 1, 2,
5, 12
“. . . constructing power plants of
every kind.”
“. . . re-enforcing our expertise as a
major producer of power plants of
every kind . . .”
Technology categories: 1, 2, 5, 6,
9, 11, 12, 13
“ABB offers solutions for practically
all power generation needs.”
Technology categories: 1, 2, 3, 4,
5, 6, 12
1989 –
Technology categories: 1, 5,
11, 12
–
Technology categories: 1, 2, 5, 6,
9, 12
“ABB can meet virtually every need
of clean and highly efficient power
generation for utilities and
industry.”
Technology categories: 1, 2, 3, 4,
5, 6, 11
–
Technology categories:
1, 2, 3, 5, 9, 11
1990 –
Technology categories: 1, 5,
11, 12
–
Technology categories: 1, 2, 4, 5,
9, 12, 13
“. . .ABB’s complete line of power
plant systems.”
“Its technology base covers virtually
every type of power generation
equipment.”
Technology categories: 1, 2, 3, 4,
5, 6, 11
–
Technology categories:
1, 2, 5, 9, 11, 13
48of58
A.
Bergek
etal.
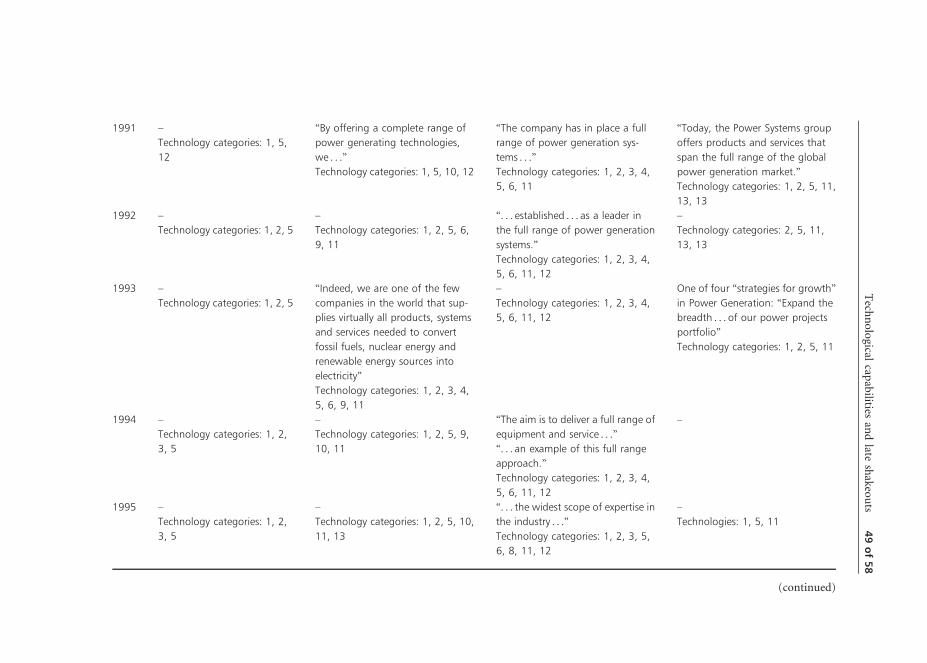
1991 –
Technology categories: 1, 5,
12
“By offering a complete range of
power generating technologies,
we . . .”
Technology categories: 1, 5, 10, 12
“The company has in place a full
range of power generation sys-
tems . . .”
Technology categories: 1, 2, 3, 4,
5, 6, 11
“Today, the Power Systems group
offers products and services that
span the full range of the global
power generation market.”
Technology categories: 1, 2, 5, 11,
13, 13
1992 –
Technology categories: 1, 2, 5
–
Technology categories: 1, 2, 5, 6,
9, 11
“. . . established . . . as a leader in
the full range of power generation
systems.”
Technology categories: 1, 2, 3, 4,
5, 6, 11, 12
–
Technology categories: 2, 5, 11,
13, 13
1993 –
Technology categories: 1, 2, 5
“Indeed, we are one of the few
companies in the world that sup-
plies virtually all products, systems
and services needed to convert
fossil fuels, nuclear energy and
renewable energy sources into
electricity”
Technology categories: 1, 2, 3, 4,
5, 6, 9, 11
–
Technology categories: 1, 2, 3, 4,
5, 6, 11, 12
One of four “strategies for growth”
in Power Generation: “Expand the
breadth . . . of our power projects
portfolio”
Technology categories: 1, 2, 5, 11
1994 –
Technology categories: 1, 2,
3, 5
–
Technology categories: 1, 2, 5, 9,
10, 11
“The aim is to deliver a full range of
equipment and service . . .”
“. . . an example of this full range
approach.”
Technology categories: 1, 2, 3, 4,
5, 6, 11, 12
–
1995 –
Technology categories: 1, 2,
3, 5
–
Technology categories: 1, 2, 5, 10,
11, 13
“. . . the widest scope of expertise in
the industry . . .”
Technology categories: 1, 2, 3, 5,
6, 8, 11, 12
–
Technologies: 1, 5, 11
(continued)
Tech
no
logical
capab
ilitiesan
dlate
shak
eou
ts49of58

Appendix C Continued
Year General electric Siemens ABB Westinghouse
1996 –
Technology categories: 1, 2, 5, 11,
12
–
Technology categories: 1, 2, 5, 11
“. . . the most complete range of
products, systems and service
available on the market.”
“the industry’s broadest range of
technology and products.”
Technology categories: 1, 2, 3, 4,
5, 6, 11, 12
–
Technology categories: 1, 2, 5, 11
1997 “. . . a portfolio of innovative ser-
vices and products.”
Technology categories: 1, 5, 11, 13
–
Technology categories: 1, 2, 5, 6,
11
“A key to our approach is the ability
to offer the broadest scope of
power generation systems and
equipment in the industry.”
“Our uniquely broad scope of
supply . . .”
Technology categories: 1, 2, 3, 5,
6, 11, 12
–
Technology categories: 1, 2, 5, 11
1998 “We continued expanding our
portfolio of products, services and
capabilities . . .”
Technology categories: 1, 7, 11, 10
“Our broad range of products and
services . . .”
Technology categories: 1, 2, 5, 6,
8, 10, 11
–
Technology categories: 1, 2, 3, 4,
5, 6, 7, 11, 12
Not available—Westinghouse’s
fossil fuel power plant business was
divested to Siemens in 1998.
1999 “GE Power Systems continued
expanding its portfolio of product
and service solutions for the energy
industry . . .”
Technology categories: 1, 7
–
Technology categories: 1, 2, 5, 6,
11, 13
Not available—ABB’s power gen-
eration activities were transferred
to ABB Alstom Power and later
divested to Alstom.
50of58
A.
Bergek
etal.
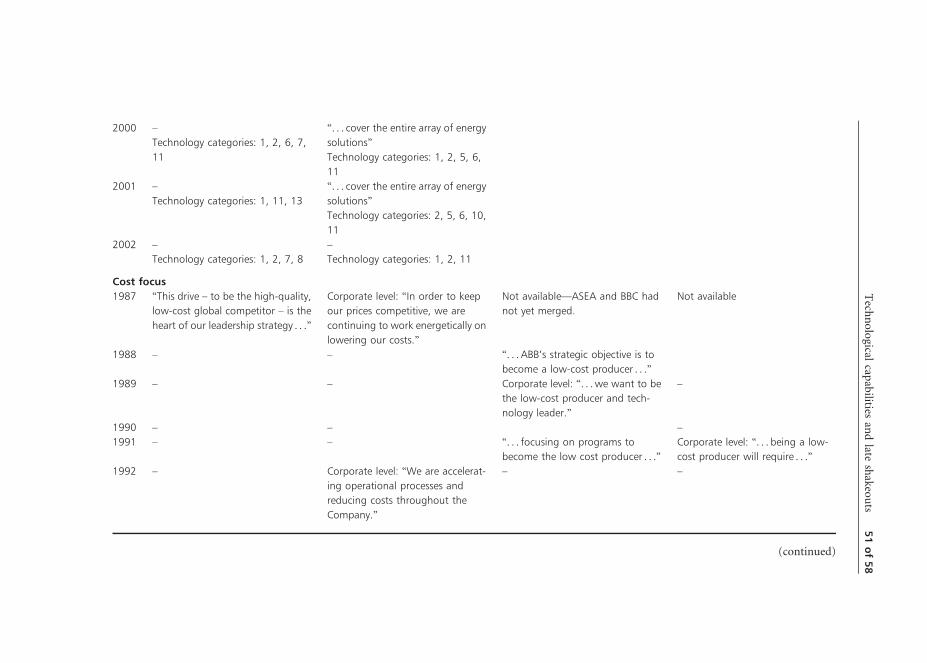
2000 –
Technology categories: 1, 2, 6, 7,
11
“. . . cover the entire array of energy
solutions”
Technology categories: 1, 2, 5, 6,
11
2001 –
Technology categories: 1, 11, 13
“. . . cover the entire array of energy
solutions”
Technology categories: 2, 5, 6, 10,
11
2002 –
Technology categories: 1, 2, 7, 8
–
Technology categories: 1, 2, 11
Cost focus
1987 “This drive – to be the high-quality,
low-cost global competitor – is the
heart of our leadership strategy . . .”
Corporate level: “In order to keep
our prices competitive, we are
continuing to work energetically on
lowering our costs.”
Not available—ASEA and BBC had
not yet merged.
Not available
1988 – – “. . .ABB’s strategic objective is to
become a low-cost producer . . .”
1989 – – Corporate level: “. . .we want to be
the low-cost producer and tech-
nology leader.”
–
1990 – – –
1991 – – “. . . focusing on programs to
become the low cost producer . . .”
Corporate level: “. . . being a low-
cost producer will require . . .”
1992 – Corporate level: “We are accelerat-
ing operational processes and
reducing costs throughout the
Company.”
– –
(continued)
Tech
no
logical
capab
ilitiesan
dlate
shak
eou
ts51of58
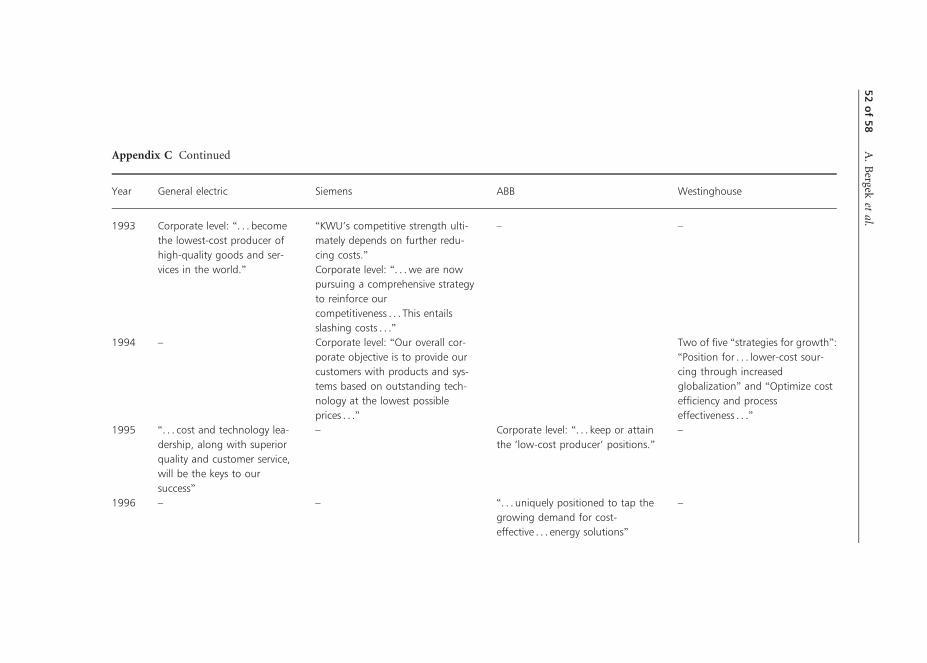
Appendix C Continued
Year General electric Siemens ABB Westinghouse
1993 Corporate level: “. . . become
the lowest-cost producer of
high-quality goods and ser-
vices in the world.”
“KWU’s competitive strength ulti-
mately depends on further redu-
cing costs.”
Corporate level: “. . .we are now
pursuing a comprehensive strategy
to reinforce our
competitiveness . . . This entails
slashing costs . . .”
– –
1994 – Corporate level: “Our overall cor-
porate objective is to provide our
customers with products and sys-
tems based on outstanding tech-
nology at the lowest possible
prices . . .”
Two of five “strategies for growth”:
“Position for . . . lower-cost sour-
cing through increased
globalization” and “Optimize cost
efficiency and process
effectiveness . . .”
1995 “. . . cost and technology lea-
dership, along with superior
quality and customer service,
will be the keys to our
success”
– Corporate level: “. . . keep or attain
the ‘low-cost producer’ positions.”
–
1996 – – “. . .uniquely positioned to tap the
growing demand for cost-
effective . . . energy solutions”
–
52of58
A.
Bergek
etal.
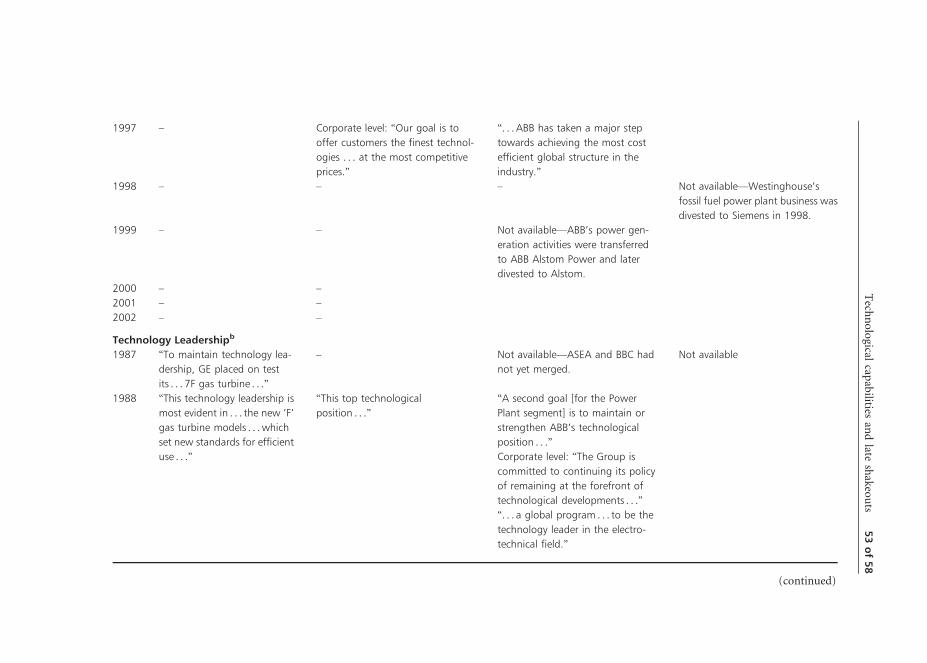
1997 – Corporate level: “Our goal is to
offer customers the finest technol-
ogies . . . at the most competitive
prices.”
“. . .ABB has taken a major step
towards achieving the most cost
efficient global structure in the
industry.”
1998 – – – Not available—Westinghouse’s
fossil fuel power plant business was
divested to Siemens in 1998.
1999 – – Not available—ABB’s power gen-
eration activities were transferred
to ABB Alstom Power and later
divested to Alstom.
2000 – –
2001 – –
2002 – –
Technology Leadershipb
1987 “To maintain technology lea-
dership, GE placed on test
its . . . 7F gas turbine . . .”
– Not available—ASEA and BBC had
not yet merged.
Not available
1988 “This technology leadership is
most evident in . . . the new ‘F’
gas turbine models . . .which
set new standards for efficient
use . . .”
“This top technological
position . . .”
“A second goal [for the Power
Plant segment] is to maintain or
strengthen ABB’s technological
position . . .”
Corporate level: “The Group is
committed to continuing its policy
of remaining at the forefront of
technological developments . . .”
“. . . a global program . . . to be the
technology leader in the electro-
technical field.”
(continued)
Tech
no
logical
capab
ilitiesan
dlate
shak
eou
ts53of58
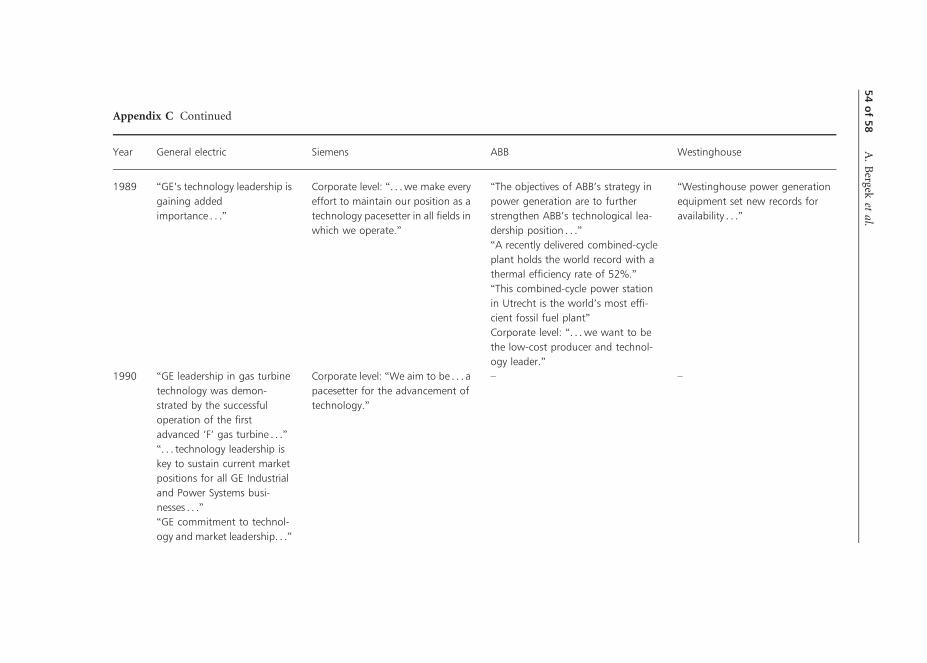
Appendix C Continued
Year General electric Siemens ABB Westinghouse
1989 “GE’s technology leadership is
gaining added
importance . . .”
Corporate level: “. . .we make every
effort to maintain our position as a
technology pacesetter in all fields in
which we operate.”
“The objectives of ABB’s strategy in
power generation are to further
strengthen ABB’s technological lea-
dership position . . .”
“A recently delivered combined-cycle
plant holds the world record with a
thermal efficiency rate of 52%.”
“This combined-cycle power station
in Utrecht is the world’s most effi-
cient fossil fuel plant”
Corporate level: “. . .we want to be
the low-cost producer and technol-
ogy leader.”
“Westinghouse power generation
equipment set new records for
availability . . .”
1990 “GE leadership in gas turbine
technology was demon-
strated by the successful
operation of the first
advanced ‘F’ gas turbine . . .”
“. . . technology leadership is
key to sustain current market
positions for all GE Industrial
and Power Systems busi-
nesses . . .”
“GE commitment to technol-
ogy and market leadership. . .”
Corporate level: “We aim to be . . . a
pacesetter for the advancement of
technology.”
– –
54of58
A.
Bergek
etal.
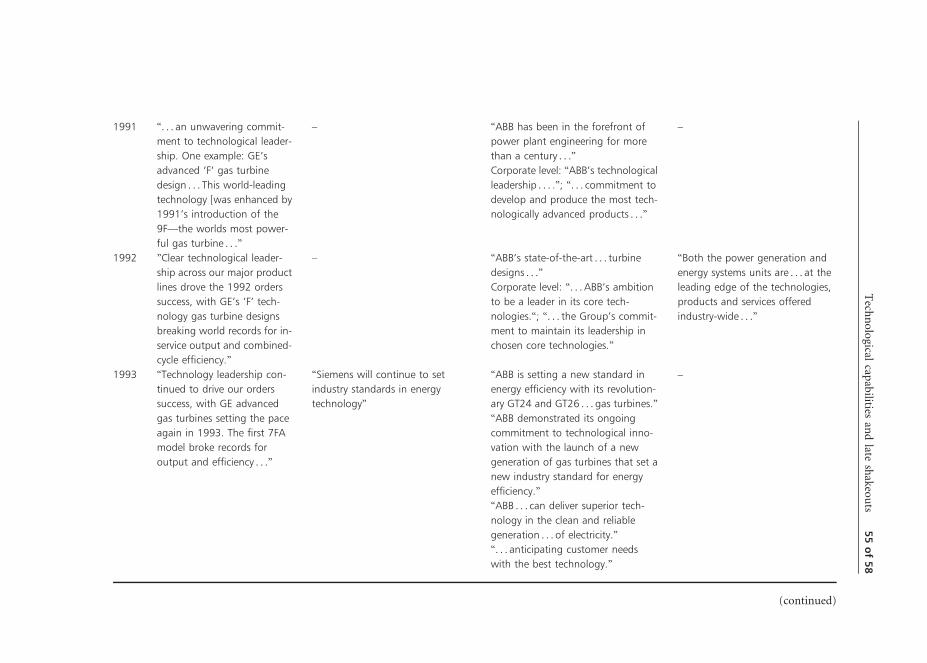
1991 “. . . an unwavering commit-
ment to technological leader-
ship. One example: GE’s
advanced ‘F’ gas turbine
design . . . This world-leading
technology [was enhanced by
1991’s introduction of the
9F—the worlds most power-
ful gas turbine . . .”
– “ABB has been in the forefront of
power plant engineering for more
than a century . . .”
Corporate level: “ABB’s technological
leadership . . . .”; “. . . commitment to
develop and produce the most tech-
nologically advanced products . . .”
–
1992 ”Clear technological leader-
ship across our major product
lines drove the 1992 orders
success, with GE’s ‘F’ tech-
nology gas turbine designs
breaking world records for in-
service output and combined-
cycle efficiency.”
– “ABB’s state-of-the-art . . . turbine
designs . . .”
Corporate level: “. . .ABB’s ambition
to be a leader in its core tech-
nologies.“; “. . . the Group’s commit-
ment to maintain its leadership in
chosen core technologies.”
“Both the power generation and
energy systems units are . . . at the
leading edge of the technologies,
products and services offered
industry-wide . . .”
1993 “Technology leadership con-
tinued to drive our orders
success, with GE advanced
gas turbines setting the pace
again in 1993. The first 7FA
model broke records for
output and efficiency . . .”
“Siemens will continue to set
industry standards in energy
technology”
“ABB is setting a new standard in
energy efficiency with its revolution-
ary GT24 and GT26 . . . gas turbines.”
“ABB demonstrated its ongoing
commitment to technological inno-
vation with the launch of a new
generation of gas turbines that set a
new industry standard for energy
efficiency.”
“ABB . . . can deliver superior tech-
nology in the clean and reliable
generation . . .of electricity.”
“. . . anticipating customer needs
with the best technology.”
–
(continued)
Tech
no
logical
capab
ilitiesan
dlate
shak
eou
ts55of58
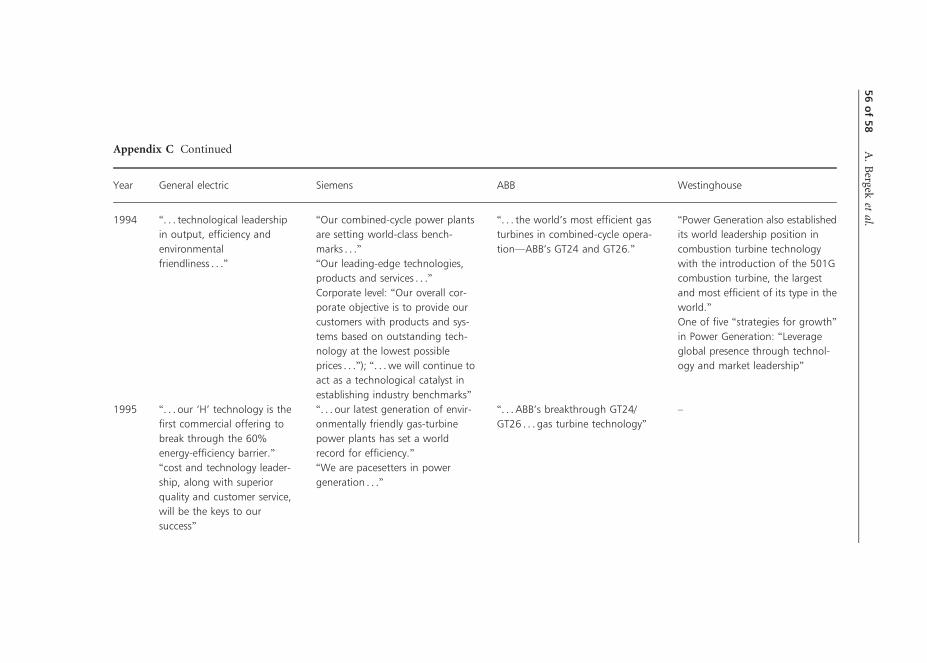
Appendix C Continued
Year General electric Siemens ABB Westinghouse
1994 “. . . technological leadership
in output, efficiency and
environmental
friendliness . . .”
“Our combined-cycle power plants
are setting world-class bench-
marks . . .”
“Our leading-edge technologies,
products and services . . .”
Corporate level: “Our overall cor-
porate objective is to provide our
customers with products and sys-
tems based on outstanding tech-
nology at the lowest possible
prices . . .”); “. . .we will continue to
act as a technological catalyst in
establishing industry benchmarks”
“. . . the world’s most efficient gas
turbines in combined-cycle opera-
tion—ABB’s GT24 and GT26.”
“Power Generation also established
its world leadership position in
combustion turbine technology
with the introduction of the 501G
combustion turbine, the largest
and most efficient of its type in the
world.”
One of five “strategies for growth”
in Power Generation: “Leverage
global presence through technol-
ogy and market leadership”
1995 “. . . our ‘H’ technology is the
first commercial offering to
break through the 60%
energy-efficiency barrier.”
“cost and technology leader-
ship, along with superior
quality and customer service,
will be the keys to our
success”
“. . . our latest generation of envir-
onmentally friendly gas-turbine
power plants has set a world
record for efficiency.”
“We are pacesetters in power
generation . . .”
“. . .ABB’s breakthrough GT24/
GT26 . . .gas turbine technology”
–
56of58
A.
Bergek
etal.

1996 “We continued to revitalize
our technology leader-
ship . . . to assure that GE
products remain the world
standard.”
“With our new gas turbine, we
have been able to raise the effi-
ciency of our combines-cycle . . . -
power plants to a record 58%.”
“Leading technology” (heading)
“The GT24 has set a new industry
standard for output, efficiency and
emissions . . .”
–
1997 “. . .our ‘H’ gas turbine tech-
nology . . . has the potential
to . . . lead the next generation
of advanced combined cycle
turbines.”
– Corporate level: “Innovative tech-
nology and leadership” (heading);
“. . .being first with innovative,
cost-effective and total system
solutions.”
–
1998 “. . . affirming GE’s continued
leadership in gas turbine
technology . . .”
“We intent to further reinforce and
expand our position as the industry
pace setter in power plant
technology.”
“. . .with its leading tech-
nologies . . .”
“. . .ABB’s Powerformer, a break-
through in generator tech-
nology . . .”
Corporate level: “With a strong
commitment to technology
leadership . . .”
Not available—Westinghouse’s
fossil fuel power plant business was
divested to Siemens in 1998.
1999 “‘H’ gas turbine technology,
the world’s most
advanced . . .”
– Not available—ABB’s power gen-
eration activities were transferred
to ABB Alstom Power and later
divested to Alstom.
2000 “. . . the ‘H’ turbine, the
world’s highest-efficiency tur-
bine generator.”
–
(continued)
Tech
no
logical
capab
ilitiesan
dlate
shak
eou
ts57of58
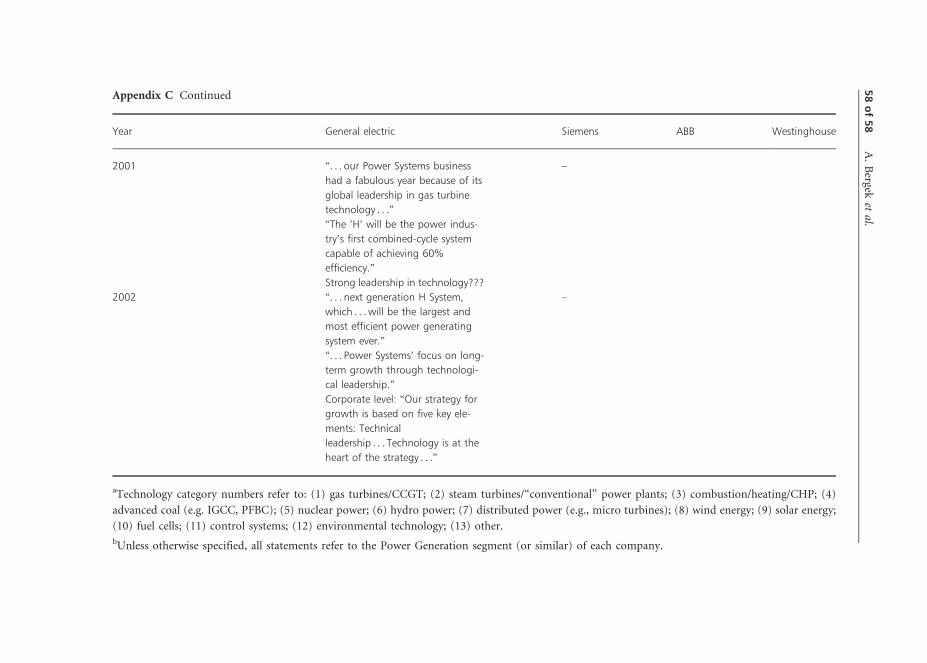
Appendix C Continued
Year General electric Siemens ABB Westinghouse
2001 “. . . our Power Systems business
had a fabulous year because of its
global leadership in gas turbine
technology . . .”
“The ‘H’ will be the power indus-
try’s first combined-cycle system
capable of achieving 60%
efficiency.”
Strong leadership in technology???
–
2002 “. . . next generation H System,
which . . .will be the largest and
most efficient power generating
system ever.”
“. . . Power Systems’ focus on long-
term growth through technologi-
cal leadership.”
Corporate level: “Our strategy for
growth is based on five key ele-
ments: Technical
leadership . . . Technology is at the
heart of the strategy . . .”
–
aTechnology category numbers refer to: (1) gas turbines/CCGT; (2) steam turbines/“conventional” power plants; (3) combustion/heating/CHP; (4)
advanced coal (e.g. IGCC, PFBC); (5) nuclear power; (6) hydro power; (7) distributed power (e.g., micro turbines); (8) wind energy; (9) solar energy;
(10) fuel cells; (11) control systems; (12) environmental technology; (13) other.
bUnless otherwise specified, all statements refer to the Power Generation segment (or similar) of each company.
58of58
A.
Bergek
etal.