Embed Size (px)
Citation preview
Pressure
pipeline
UNION OF THE COMOROS
Unity – Solidarity- Development
Ministry of Rural Development, Fishing, Handicraft and Environment
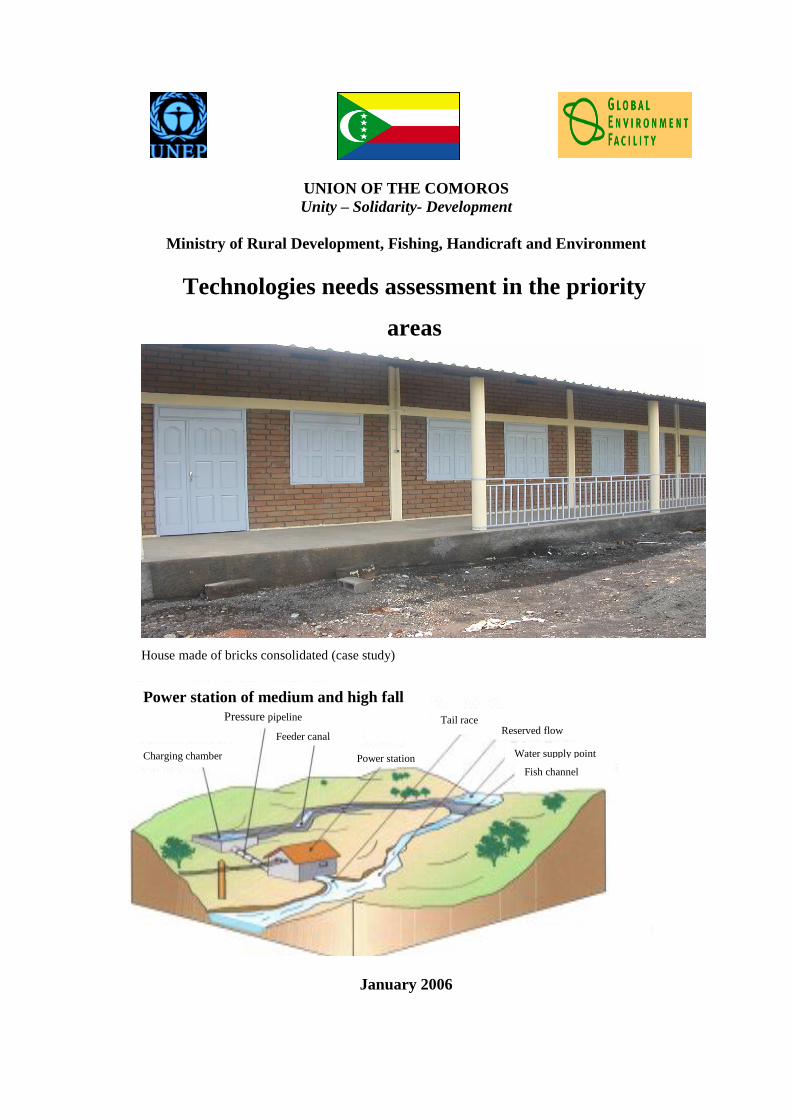
House made of bricks consolidated (case study)
January 2006
Technologies needs assessment in the priority
areas
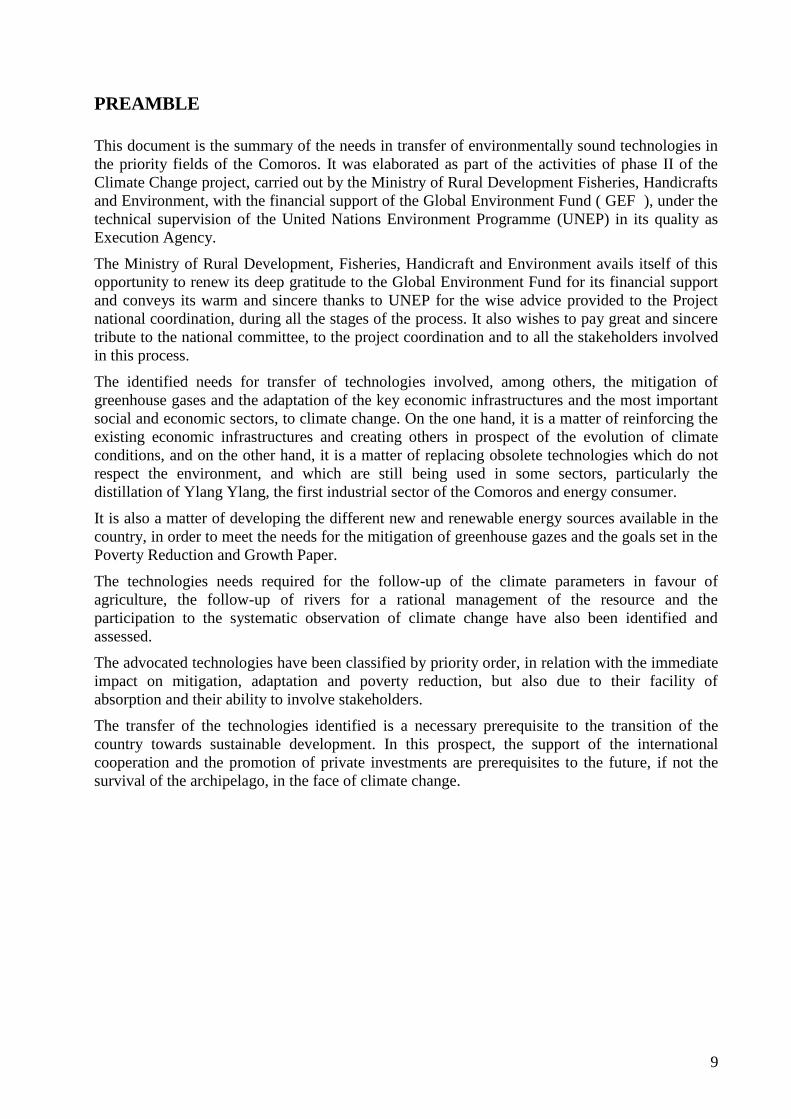
Power station of medium and high fall
Pressure pipeline
Charging chamber Power station
Tail race Reserved flow
Water supply point
Fish channel
Feeder canal
2
Contents
Pictures List ..................................................................................................................................... 4
Charts List ....................................................................................................................................... 4
Acronyms ........................................................................................................................................ 5
EXECUTIVE SUMMARY ............................................................................................................. 7
PREAMBLE .................................................................................................................................... 9
1. INTRODUCTION .................................................................................................................... 10
2. METHODOLOGICAL APPROACH ....................................................................................... 11
3. OVERALL CONTEXT ............................................................................................................. 11
4. SOCIAL AND ECONOMIC INDICATORS ........................................................................... 13
5. ECONOMY ............................................................................................................................... 13
6. SYNTHESIS OF THE EMISSION OF GREENHOUSE GAS IN 1994 ................................. 14
7. ENERGY SECTOR .................................................................................................................. 15
7.1. Petroleum products ............................................................................................................. 15
7.2. Electricity production ............................................................................................................. 16
7.3. Needs in transfer of technologies ....................................................................................... 18
8. PROMOTION OF NON-METALLIC MINERAL MATERIAL TO REPLACE TIMBER .... 23
8.1. Context: .............................................................................................................................. 23
8.2. Natural potential ................................................................................................................. 24
8.3. Assessment of the needs for the transfer of technologies .................................................. 25
9. TECHNOLOGIES FOR THE WORK OF WORKS FOR THE PROTECTION OF KEY
ECONOMIC INFRASTRUCTURES ....................................................................................... 25
9.1. Coastal national roads ........................................................................................................ 25
9.2. Hydrocarbons warehouses and power stations ................................................................... 25
9.3. Airport works ..................................................................................................................... 25
9.4. Port works .......................................................................................................................... 25
9.5. Hotels and human establishments ...................................................................................... 25
10. NEEDS FOR THE TRANSFER OF TECHNOLOGIES FOR THE WORK OF
ALTERNATIVE INLAND ROADS ............................................................................................ 26
10.1. Choice of the structure of the roadways and the inland roads. ........................................ 26
11. NEED IN TRANSFER OF TECHNOLOGIES FOR THE DEVELOPPEMENT OF A
NATIONAL PROGRAMME ON DISASTERS PREPAREDNESS ........................................... 28
11.1 Disaster profile ...................................................................................................................... 28
11.2. National Programme on Disasters Preparedness .................................................................. 28
3
11.3. Needs for a transfer of technologies ..................................................................................... 29
12. DRINKING WATER SUPPLY NETWORKS ....................................................................... 29
Total .............................................................................................................................................. 30
11.1. Needs for the transfer of technologies .............................................................................. 31
12.2. Acquisition and absorption of technologies ..................................................................... 31
13. CAPACITY-BUILDING FOR THE PARTICIPATION IN THE SYSTEMATIC
OBSERVATION NETWORK FOR CLIMATE CHANGE ........................................................ 32
13.1. Context: ............................................................................................................................ 32
13.2. Objectives: ........................................................................................................................ 32
13.3. Needs for capacity-building ............................................................................................. 32
13.4. Oceans observation Systems ............................................................................................ 33
13.5. Evaluation of the human and institutional capabilities for the participation in the
systematic observation of climate change ................................................................................. 34
13.6. Capacity-building needs ................................................................................................... 34
14. INSTITUTIONAL FRAMEWORK FOR THE TRANSFER OF TECHNOLOGIES ........... 35
15. CONCLUSION AND RECOMMANDATIONS ................................................................... 37
16. ATTACHMENTS: MAPS OF SYNOPTIC AND AGRO METEOROLOGICAL STATIONS
....................................................................................................................................................... 39
17. BIBLIOGRAPHY ................................................................................................................... 43
4
Pictures List
Picture 1 : Geographic map of the Comoros 6
Picture 2 : Evolution of the consumption of petroleum products (m3) 16
Picture 3 : Lingoni river: 2005 17
Picture 4 : Evolution of the production of electricity 17
Picture 5 : Mid and high fall plant 19
Picture 6 : Fuel system used in the distilleries 21
Picture 7 : New proposed system 23
Charts List
Chart 1 : Demographic profile of the Comoros 13
Chart 2 : Macroeconomic aggregates 2001 – 2004 14
Charts 3 and 4 : Checklist of the emissions 14
Chart 5 : Scenarios on GHG mitigation 18
Chart 6 : Natural potential 24
Chart 7 : Implementation technologies 26
Chart 8 : Costs per kilometre for the surfaced roads per type of roadway 27
Chart 9 : Length and the total coast of the alternative roads to be built 27
Chart 10 : Types of disasters and the foreseen consequences 28
Chart 11 : Evolution of the water demand for the years 2002 and 2025 30
Chart 12 : Needs of technologies tranfer 31
Chart 13 : Obstacles and actions to be taken to overcome them 35
Chart 14 : Priorisation of the needs of technologies transfer 37
5
Acronyms
LV Low voltage
PRSP Poverty Reduction Strategy Paper
EIS Households Integral Survey
FSCD Support Funds to Community Development
CF Comorian Franc
GG Greenhouse gas
IEGCE Inter departmental Experts Group on Climate Evolution
GOOS Global Ocean Observation System
PI Plasticity Index
KWh Kilo Watt hour
MCD Mecanism for Clean Development
MT Mid Tension
MW Mega Watt
NEPAD New Partnership for Africa’s Development
OECD Organisation for Economic Cooperation and Development
ODINAFRICA Ocean Data and Information Network for Africa
MDG Millennium Development Goals
NGO Non-Gouvernemental Organisation
GDP Gross Domestic Product
LDC Least Developped Countries
GSPH General Census on Population and Housing
UNESCO United Nations Education, Scientific and Cultural Organisation
US United States
USD United States Dollars
6
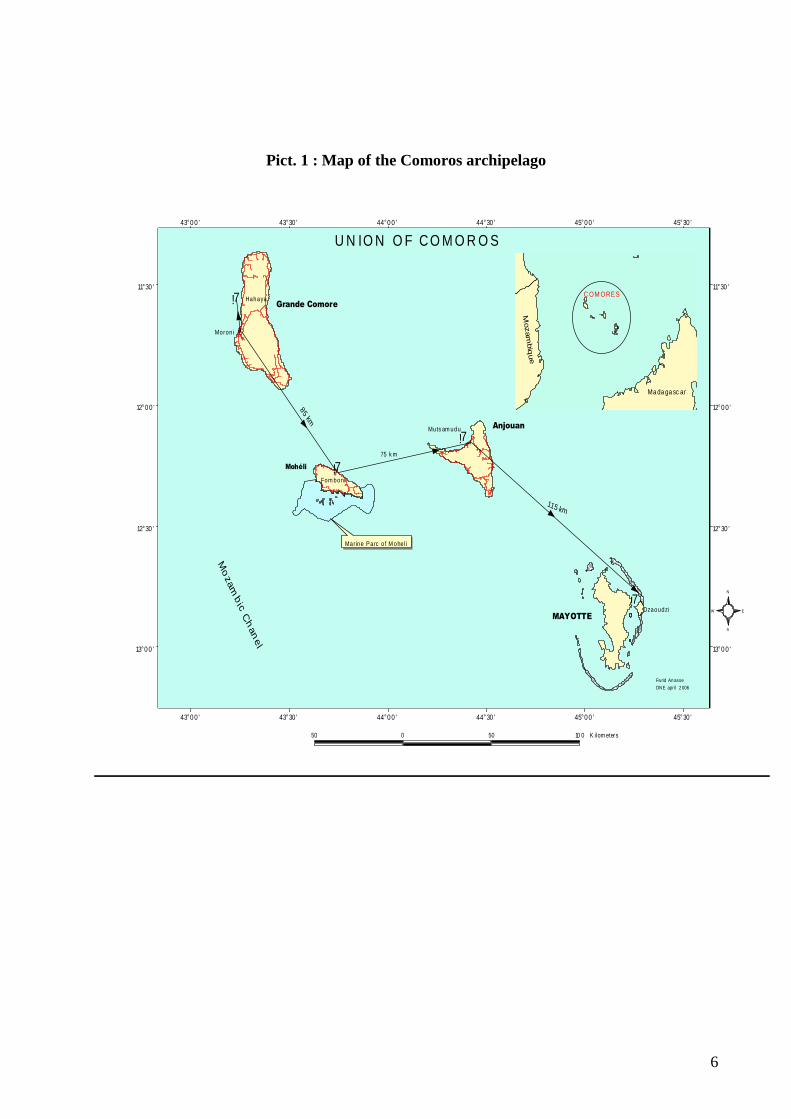
Pict. 1 : Map of the Comoros archipelago
13°0 0 ' 13°0 0 '
12°30 ' 12°30 '
12°0 0 ' 12°0 0 '
11°30 ' 11°30 '
43°0 0 '
43°0 0 '
43°30 '
43°30 '
44°0 0 '
44°0 0 '
44°30 '
44°30 '
45°0 0 '
45°0 0 '
45°30 '
45°30 '
#
#
#
Moroni
Fom boni
Muts am udu
Grande Comore
Mohéli
Anjouan
Mo
zam
bi c
Ch
an
el
115 km
75 k m
85 km
!7
!7
!7
!7
Hahaya
DzaoudziMAYOTTE
Mar ine Parc o f M ohel i
Ind
ian
Oc
ea
n
50 0 50 10 0 K ilom eters
S
N
EW
U N IO N O F CO M O R O S
Fa rid An asse
DNE april 2 006
Mozam
biq
ue
C OM ORES
Ma da ga sc ar
7
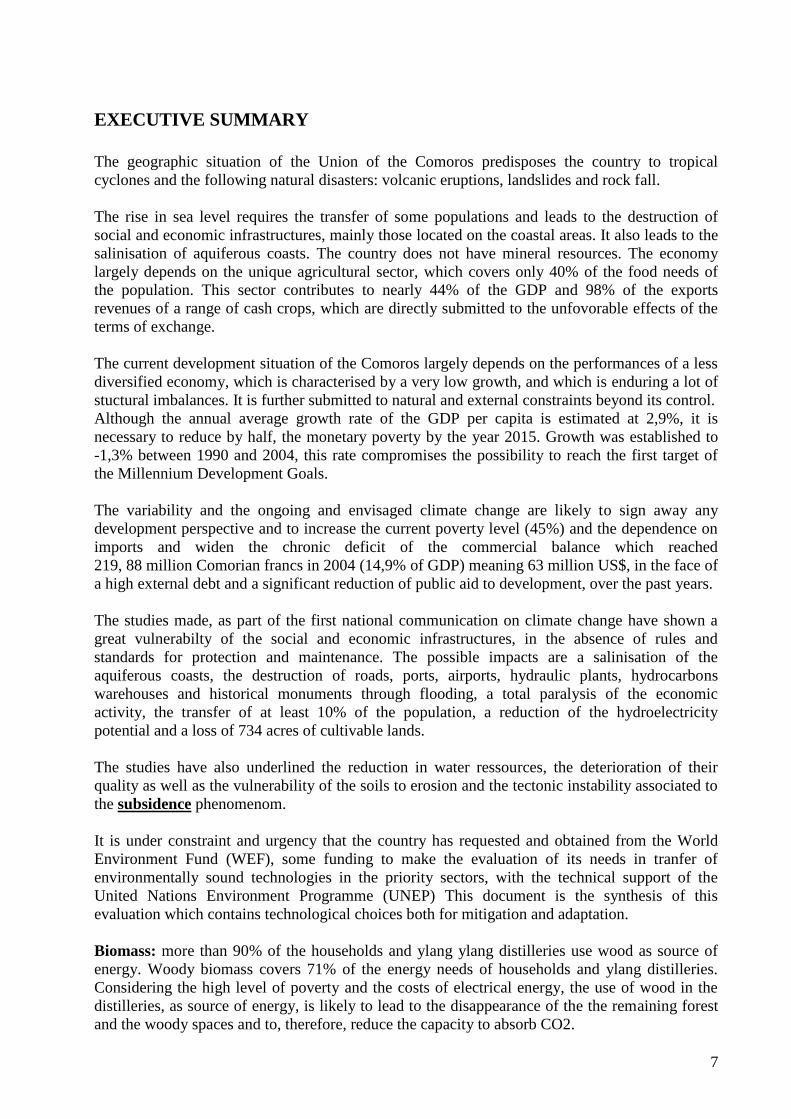
EXECUTIVE SUMMARY
The geographic situation of the Union of the Comoros predisposes the country to tropical
cyclones and the following natural disasters: volcanic eruptions, landslides and rock fall.
The rise in sea level requires the transfer of some populations and leads to the destruction of
social and economic infrastructures, mainly those located on the coastal areas. It also leads to the
salinisation of aquiferous coasts. The country does not have mineral resources. The economy
largely depends on the unique agricultural sector, which covers only 40% of the food needs of
the population. This sector contributes to nearly 44% of the GDP and 98% of the exports
revenues of a range of cash crops, which are directly submitted to the unfovorable effects of the
terms of exchange.
The current development situation of the Comoros largely depends on the performances of a less
diversified economy, which is characterised by a very low growth, and which is enduring a lot of
stuctural imbalances. It is further submitted to natural and external constraints beyond its control.
Although the annual average growth rate of the GDP per capita is estimated at 2,9%, it is
necessary to reduce by half, the monetary poverty by the year 2015. Growth was established to
-1,3% between 1990 and 2004, this rate compromises the possibility to reach the first target of
the Millennium Development Goals.
The variability and the ongoing and envisaged climate change are likely to sign away any
development perspective and to increase the current poverty level (45%) and the dependence on
imports and widen the chronic deficit of the commercial balance which reached
219, 88 million Comorian francs in 2004 (14,9% of GDP) meaning 63 million US$, in the face of
a high external debt and a significant reduction of public aid to development, over the past years.
The studies made, as part of the first national communication on climate change have shown a
great vulnerabilty of the social and economic infrastructures, in the absence of rules and
standards for protection and maintenance. The possible impacts are a salinisation of the
aquiferous coasts, the destruction of roads, ports, airports, hydraulic plants, hydrocarbons
warehouses and historical monuments through flooding, a total paralysis of the economic
activity, the transfer of at least 10% of the population, a reduction of the hydroelectricity
potential and a loss of 734 acres of cultivable lands.
The studies have also underlined the reduction in water ressources, the deterioration of their
quality as well as the vulnerability of the soils to erosion and the tectonic instability associated to
the subsidence phenomenom.
It is under constraint and urgency that the country has requested and obtained from the World
Environment Fund (WEF), some funding to make the evaluation of its needs in tranfer of
environmentally sound technologies in the priority sectors, with the technical support of the
United Nations Environment Programme (UNEP) This document is the synthesis of this
evaluation which contains technological choices both for mitigation and adaptation.
Biomass: more than 90% of the households and ylang ylang distilleries use wood as source of
energy. Woody biomass covers 71% of the energy needs of households and ylang distilleries.
Considering the high level of poverty and the costs of electrical energy, the use of wood in the
distilleries, as source of energy, is likely to lead to the disappearance of the the remaining forest
and the woody spaces and to, therefore, reduce the capacity to absorb CO2.
8
This is the reason why this sector has been targeted to reduce forest clearing and deforestation.
The acecepted options consist in the replacement of the fuel mechanism in the distilleries by
consolidated brick-made ovens. These ovens allow a reduction of more than 50 to 60% of the
wood consumption and may last 20 times longer than the currently used mechanisms.
Hydroelectricity: The country has a hydroelectric potential, which can cover 90% of the current
needs on the island of Mohéli and 100% of the needs of Anjouan.
In Anjouan, two options are possible:
(i) big hydro-electricity (centralised production )
(ii) small hydro-electriciy (decentralised production).
In Mohéli: The small hydro-electricity option is accepted because of the level of the potential.
The development of this new and renewable energy source allows limiting forest clearing and
deforestation and to facilitate the access of the majority of the population to electrical energy at a
lesser cost.
Controlling energy: the policy aiming at controlling the proposed energy, saving it and using it
in an efficient way allows reducing consumption and to therefore to reduce the level of the
emissions.
However, the extension and the improvement of the distribution networks through their
standardisation, would allow limiting the deterioration of the technical capacity and the loss of
lines.
Infrastructures:
(i.) Technologies for the manufacture of consolidated or baked clay bricks for the
construction as well as the production of sand from volcanic rocks, are relevent
choices to replace traditional cob or straw-made houses;
(ii.) Technologies for the construction of works to protect key economic infrastructures
(roads, ports, power plants, hydrocarbons warehouses, hotels…) have also been
identified;
(iii.) Technologies for the construction of inland roads have furthermore been identified;
(iv.) For the management and maintenance of the networks and the supply of drinking
water, the technologies identified involve:
- Equipments and facilities to pump, harness, distribute and control the
quality of the ressource;
- The protection of the basin slopes;
- The increase of the water storage capacity.
(v.) In the field related to the systematic observation of climate change, the needs in
technologies transfer, particularly the measurement networks, have been identified
for meteorology, hydrology and oceans observation system.
Finally, the technologies for the development of a national programme on disaters preparedness
have also been identified.
9
PREAMBLE
This document is the summary of the needs in transfer of environmentally sound technologies in
the priority fields of the Comoros. It was elaborated as part of the activities of phase II of the
Climate Change project, carried out by the Ministry of Rural Development Fisheries, Handicrafts
and Environment, with the financial support of the Global Environment Fund ( GEF ), under the
technical supervision of the United Nations Environment Programme (UNEP) in its quality as
Execution Agency.
The Ministry of Rural Development, Fisheries, Handicraft and Environment avails itself of this
opportunity to renew its deep gratitude to the Global Environment Fund for its financial support
and conveys its warm and sincere thanks to UNEP for the wise advice provided to the Project
national coordination, during all the stages of the process. It also wishes to pay great and sincere
tribute to the national committee, to the project coordination and to all the stakeholders involved
in this process.
The identified needs for transfer of technologies involved, among others, the mitigation of
greenhouse gases and the adaptation of the key economic infrastructures and the most important
social and economic sectors, to climate change. On the one hand, it is a matter of reinforcing the
existing economic infrastructures and creating others in prospect of the evolution of climate
conditions, and on the other hand, it is a matter of replacing obsolete technologies which do not
respect the environment, and which are still being used in some sectors, particularly the
distillation of Ylang Ylang, the first industrial sector of the Comoros and energy consumer.
It is also a matter of developing the different new and renewable energy sources available in the
country, in order to meet the needs for the mitigation of greenhouse gazes and the goals set in the
Poverty Reduction and Growth Paper.
The technologies needs required for the follow-up of the climate parameters in favour of
agriculture, the follow-up of rivers for a rational management of the resource and the
participation to the systematic observation of climate change have also been identified and
assessed.
The advocated technologies have been classified by priority order, in relation with the immediate
impact on mitigation, adaptation and poverty reduction, but also due to their facility of
absorption and their ability to involve stakeholders.
The transfer of the technologies identified is a necessary prerequisite to the transition of the
country towards sustainable development. In this prospect, the support of the international
cooperation and the promotion of private investments are prerequisites to the future, if not the
survival of the archipelago, in the face of climate change.
10
1. INTRODUCTION
The Union of the Comoros has endorsed the recommendations on Environment and
Development made by the World Conference, held in Rio in 1992. The elaboration of a national
policy on Environment in 1993 has materialised the commitment of the country. Furthermore,
this policy comes within the scope of the current economic context and meets the requirements of
the degradation of the state of the Environment as well as the economic policy defined by the
government. The national policy provides the required strategic and operational framework for
the effective implementation of Agenda 21, at the national level.
The country has further ratified several international Conventions on Environment, such as the
United Nations Framework-Convention on Climate Change, in October 1994. In order to
implement this Convention, the country has made the inventory of the anthropic sources and the
shafts that absorb greenhouse gas (GHG), for the year 1994. The analysis of the emissions and
the absorptions was conducted in the following sectors: energy, agriculture, wastes, as well as the
change in the allocation of lands and forests. The outcome of the inventory shows that the sector
related to the change in the allocation of lands and forests is the first responsible for the
emissions of greenhouse gas, followed by agriculture. However, the country’s level of emissions
is relatively low, indeed insignificant (2,63 T Eq 2/person).
On the contrary, the vulnerability and adaptation study conducted shows that the key social and
economic sectors of the country are very vulnerable. They are agriculture, health, water
resources, infrastructures and coastal ecosystems. The outcomes of greenhouse gas inventory
have allowed the evaluation of the options related to the reduction of the emissions, at the
national level.
Therefore, in accordance with article: 4.1, idented lines g);h) and j) ; 4.4 ; 4.5 ; 4.8 ; 4.9 ; 5 and
12.4 of the Framework-Convention of the United Nations on Climate Change, this document
offers to assess the needs related to the transfer of environmentally sound technologies in the
priority sectors, in order to contribute to the national Development Goals and to the realisation of
the objectives of the Convention, particularly the chapters related to mitigation and adaptation.
According to IPCC (Intergovernmental Panel on Climate Change) the transfer of technologies
constitutes more than a mere transposition of equipments in a developing country. It should
include:
(i) A better use of the transferred technology (ii) an adaptation of this technology to the local
needs and conditions; (iii) a field reproduction of the technology; (iv) a large integration of the
different stakeholders which are the governments, the private sector, the financial bodies, NGOs
and the institutions in charge of research and education.
The transfer of technologies is therefore a process, which must allow the population to take over
the technology, to reproduce it, including the ability to chose it and integrate it to the
autochthonous technologies.
11
2. METHODOLOGICAL APPROACH
Although the contribution of the Union of the Comoros to the emission of greenhouse gas is low,
the country wants to pursue the objective set to remain a carbon shaft and to participate in the
world effort to eliminate carbon from the planet.
To this end, the selection of the priority sectors that require a transfer of environmentally sound
technologies was made on the basis of the outcome of the national inventory of the greenhouse
gas and the vulnerability and adaptation studies. It is from this selection that the technologic
options have been identified in order to increase the efforts for GHG mitigation and for
adaptation to the adverse effects of climate change.
The assessment of the needs in transfer of clean technologies also relied on the methodology
proposed by the United Nations Development Programme (UNDP) in the report entitled
«Assessing Technology Needs for Climate Change» which guided the countries that are
committed in this exercise, in addition to their initial national communication. Therefore, this
document completes the initial national communication of the Comoros, which was submitted to
the Conference of the Parties in 2003, in accordance with article 12 of the United Nations
Framework-Convention on Climate Change. The study was also inspired by experts’ opinion.
. The priority sectors accepted are: (i) Hydro-electricity; (ii) Alternative technologies to reduce
the use of firewood in the Ylang Ylang distilleries; (iii) The promotion of non-metallic local
materials to replace timber (iv) Technologies (breakwater, levies) for the protection of key
economic infrastructures of the country (hydro electric plants, ports, hydrocarbons warehouses,
airports; (v) Technologies related to alternative roads works; (vi) Technologies for a national
programme on disasters preparedness; (vii) Management and maintenance of water supply
systems; (viii) Capacity-building for the participation in the network for the systematic
observation of climate change.
These choices have also been guided by their contribution to:
1. The Development Goals targeted in the sectoral strategies and policies defined by the
government;
2. The fight against greenhouse effect
3. The mitigation of the vulnerability of the country to the adverse effects of climate change.
The choice of the technological options for the mitigation and adaptation has been confirmed by:
(i) experts opinion, (ii) the priorities set by the national programmes and strategies for social and
economic development in the involved sectors, (iii) the opinions expressed by the stakeholders
during the different consultation workshops held on the issue.
3. OVERALL CONTEXT
The Union of the Comoros is composed of four volcanic islands which are the followings: from
East to West, Mayotte (370 square kilometres), Anjouan (424), Mohéli (290) and Grand Comoro
(1148). The country is located in the Indian Ocean, in the North of the Mozambique Channel,
between Madagascar and the eastern coast of Africa. The distance between the islands is
approximately 30 to 40 kilometres separated by deep submarine channels. Although the country
attained international sovereignty in 1975, Mayotte is still under French rule. Therefore, this
document refers only to three islands with a total area of 1862 square kilometres.
12
The main wealth of the country is the diversity of its biological resources. However, this
potential is fragile and is now highly threatened by human activities, which are closely linked to
the ecologic specificities of the islands (steep slopes sensitive to erosion), the social situation and
the economic conditions of the population, marked by:
(i) A rapid population growth (2,1% per annum) and a human pressure which varies according to
the islands and the rural areas, (ii) high poverty, (iii) inadequate economic growth and
agricultural production, (iv) land instability which undermines long term investment and
macroeconomic imbalances at the expense of natural resources. This potential is also weakened
by the climate conditions of the archipelago: heavy rains, pronounced dry seasons which favour
fire and cyclones, reefs threatened by the rise of deep cold sea levels (upwellings), abnormal rise
in the ocean upper temperatures. All these events are translated into a general degradation of the
natural resources.
The Comoros is one of the Least Developed Counties (LDC). It ranks 136 out of 177 countries
under the UNDP Human Development Indicia of 1997. The Gross Domestic Product (GDP) in
2000 was estimated at 376 US$, per capita.
The complete survey on households conducted in 2004 shows that 36,9% of the families, at the
national level, live in poverty. However, the poverty level varies according to the islands. The
number of poor in therefore as follows: Grand Comoro 35,3%, Anjouan 38,4%, and Mohéli
37,8%.
The situation is characterised by a reduced level of technologies, an inadequate information
system, inadequate infrastructures, institutional weaknesses and modest means of action.
Like most of the LDCs, we note a low literacy rate (more than half the adult population are
illiterate, 65% of them are women) and a population in bad health (the infant mortality rate is 115
out of 1000, the existence of significant malnutrition problems in women and children).
13
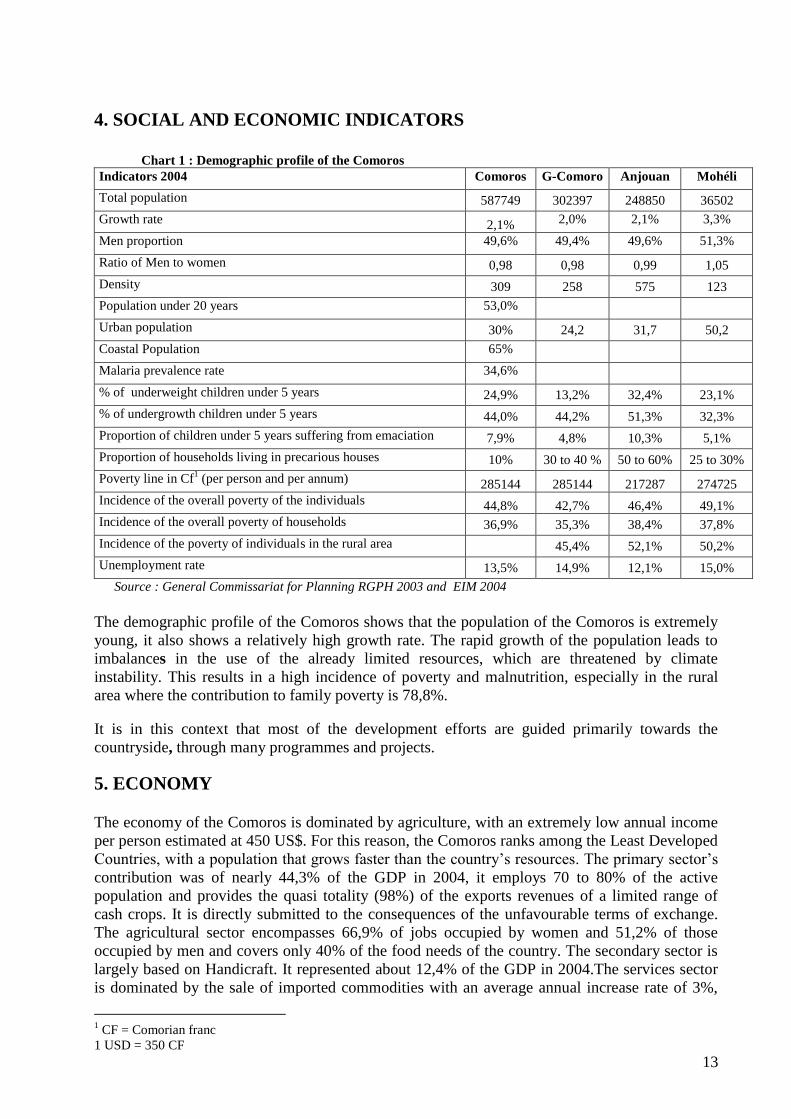
4. SOCIAL AND ECONOMIC INDICATORS
Chart 1 : Demographic profile of the Comoros
Indicators 2004 Comoros G-Comoro Anjouan Mohéli
Total population 587749 302397 248850 36502
Growth rate 2,1% 2,0% 2,1% 3,3%
Men proportion 49,6% 49,4% 49,6% 51,3%
Ratio of Men to women 0,98 0,98 0,99 1,05
Density 309 258 575 123
Population under 20 years 53,0%
Urban population 30% 24,2 31,7 50,2
Coastal Population 65%
Malaria prevalence rate 34,6%
% of underweight children under 5 years 24,9% 13,2% 32,4% 23,1%
% of undergrowth children under 5 years 44,0% 44,2% 51,3% 32,3%
Proportion of children under 5 years suffering from emaciation 7,9% 4,8% 10,3% 5,1%
Proportion of households living in precarious houses 10% 30 to 40 % 50 to 60% 25 to 30%
Poverty line in Cf1 (per person and per annum) 285144 285144 217287 274725
Incidence of the overall poverty of the individuals 44,8% 42,7% 46,4% 49,1%
Incidence of the overall poverty of households 36,9% 35,3% 38,4% 37,8%
Incidence of the poverty of individuals in the rural area 45,4% 52,1% 50,2%
Unemployment rate 13,5% 14,9% 12,1% 15,0%
Source : General Commissariat for Planning RGPH 2003 and EIM 2004
The demographic profile of the Comoros shows that the population of the Comoros is extremely
young, it also shows a relatively high growth rate. The rapid growth of the population leads to
imbalances in the use of the already limited resources, which are threatened by climate
instability. This results in a high incidence of poverty and malnutrition, especially in the rural
area where the contribution to family poverty is 78,8%.
It is in this context that most of the development efforts are guided primarily towards the
countryside, through many programmes and projects.
5. ECONOMY
The economy of the Comoros is dominated by agriculture, with an extremely low annual income
per person estimated at 450 US$. For this reason, the Comoros ranks among the Least Developed
Countries, with a population that grows faster than the country’s resources. The primary sector’s
contribution was of nearly 44,3% of the GDP in 2004, it employs 70 to 80% of the active
population and provides the quasi totality (98%) of the exports revenues of a limited range of
cash crops. It is directly submitted to the consequences of the unfavourable terms of exchange.
The agricultural sector encompasses 66,9% of jobs occupied by women and 51,2% of those
occupied by men and covers only 40% of the food needs of the country. The secondary sector is
largely based on Handicraft. It represented about 12,4% of the GDP in 2004.The services sector
is dominated by the sale of imported commodities with an average annual increase rate of 3%,
1 CF = Comorian franc
1 USD = 350 CF
14
per year, thus increasing the trade deficit of the country. The ongoing and foreseen climate
change is likely to sign away the primary sector, which is already going through difficulties and
could (i) exacerbate food insecurity, (ii) increase the poverty level of individuals and households,
(iii) increase dependency on imported foodstuffs which already absorb more than the ¾ of the
export revenues and, widen the chronic deficit of the commercial balance which in 2004, was of
21.888 millions Comorian francs (14,9% of the GDP), that is to say 63 millions US$, in the face
of a high external debt and a significant decrease of public aid to development, over the past ten
years.
The negative economic growth per person which results in an increase of poverty, combined to
climate variability, deteriorate the living conditions and make difficult the access to basic social
services such as health or drinking water, and contribute to increase the vulnerability of the
population to the negative consequences of climate change.
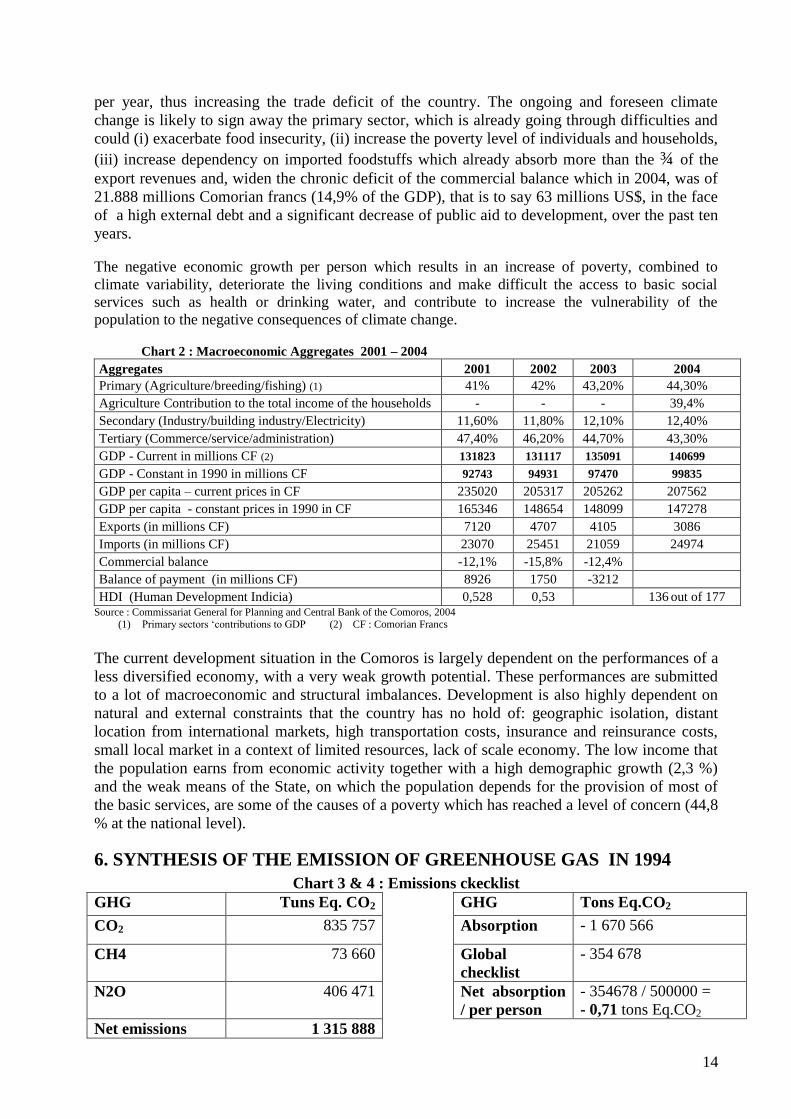
Chart 2 : Macroeconomic Aggregates 2001 – 2004
Aggregates 2001 2002 2003 2004
Primary (Agriculture/breeding/fishing) (1) 41% 42% 43,20% 44,30%
Agriculture Contribution to the total income of the households - - - 39,4%
Secondary (Industry/building industry/Electricity) 11,60% 11,80% 12,10% 12,40%
Tertiary (Commerce/service/administration) 47,40% 46,20% 44,70% 43,30%
GDP - Current in millions CF (2) 131823 131117 135091 140699
GDP - Constant in 1990 in millions CF 92743 94931 97470 99835
GDP per capita – current prices in CF 235020 205317 205262 207562
GDP per capita - constant prices in 1990 in CF 165346 148654 148099 147278
Exports (in millions CF) 7120 4707 4105 3086
Imports (in millions CF) 23070 25451 21059 24974
Commercial balance -12,1% -15,8% -12,4%
Balance of payment (in millions CF) 8926 1750 -3212
HDI (Human Development Indicia) 0,528 0,53 136 out of 177
Source : Commissariat General for Planning and Central Bank of the Comoros, 2004
(1) Primary sectors ‘contributions to GDP (2) CF : Comorian Francs
The current development situation in the Comoros is largely dependent on the performances of a
less diversified economy, with a very weak growth potential. These performances are submitted
to a lot of macroeconomic and structural imbalances. Development is also highly dependent on
natural and external constraints that the country has no hold of: geographic isolation, distant
location from international markets, high transportation costs, insurance and reinsurance costs,
small local market in a context of limited resources, lack of scale economy. The low income that
the population earns from economic activity together with a high demographic growth (2,3 %)
and the weak means of the State, on which the population depends for the provision of most of
the basic services, are some of the causes of a poverty which has reached a level of concern (44,8
% at the national level).
6. SYNTHESIS OF THE EMISSION OF GREENHOUSE GAS IN 1994
Chart 3 & 4 : Emissions ckecklist
GHG Tuns Eq. CO2 GHG Tons Eq.CO2
CO2 835 757 Absorption - 1 670 566
CH4 73 660 Global
checklist
- 354 678
N2O 406 471 Net absorption
/ per person
- 354678 / 500000 =
- 0,71 tons Eq.CO2
Net emissions 1 315 888
15
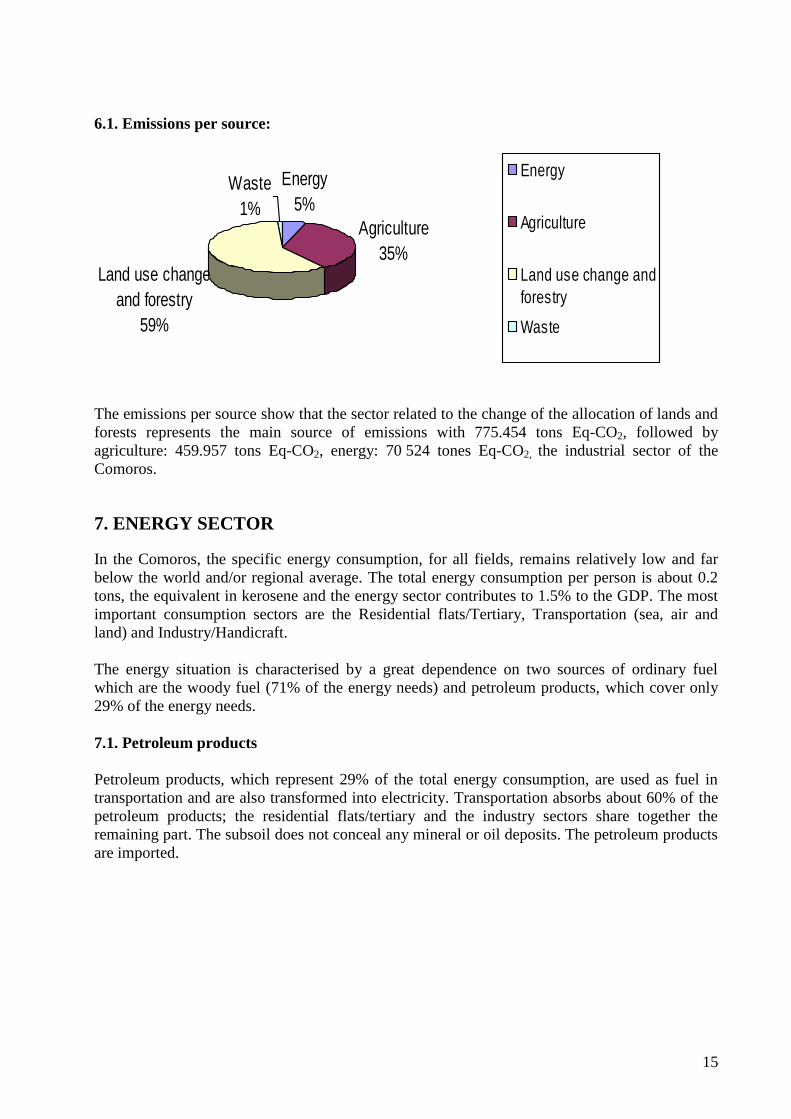
6.1. Emissions per source:
The emissions per source show that the sector related to the change of the allocation of lands and
forests represents the main source of emissions with 775.454 tons Eq-CO2, followed by
agriculture: 459.957 tons Eq-CO2, energy: 70 524 tones Eq-CO2, the industrial sector of the
Comoros.
7. ENERGY SECTOR In the Comoros, the specific energy consumption, for all fields, remains relatively low and far
below the world and/or regional average. The total energy consumption per person is about 0.2
tons, the equivalent in kerosene and the energy sector contributes to 1.5% to the GDP. The most
important consumption sectors are the Residential flats/Tertiary, Transportation (sea, air and
land) and Industry/Handicraft.
The energy situation is characterised by a great dependence on two sources of ordinary fuel
which are the woody fuel (71% of the energy needs) and petroleum products, which cover only
29% of the energy needs.
7.1. Petroleum products
Petroleum products, which represent 29% of the total energy consumption, are used as fuel in
transportation and are also transformed into electricity. Transportation absorbs about 60% of the
petroleum products; the residential flats/tertiary and the industry sectors share together the
remaining part. The subsoil does not conceal any mineral or oil deposits. The petroleum products
are imported.
Energy
5%
Agriculture
35%Land use change
and forestry
59%
Waste
1%
Energy
Agriculture
Land use change and
forestry
Waste
16
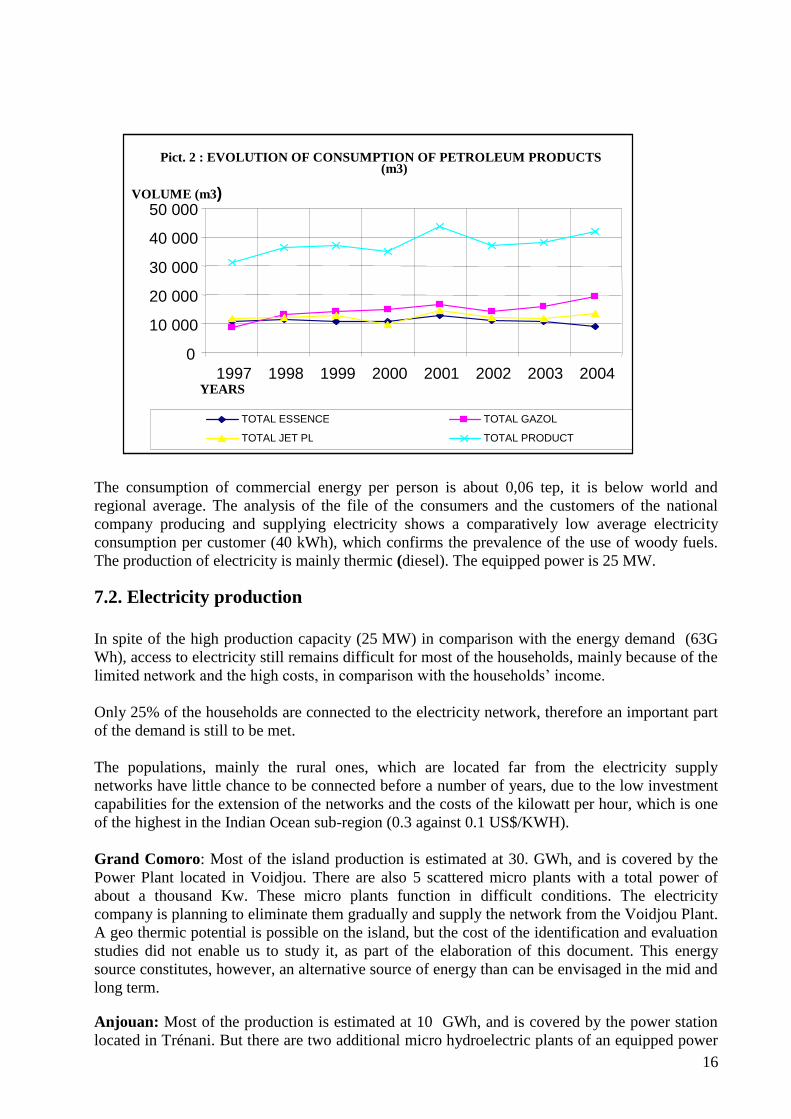
The consumption of commercial energy per person is about 0,06 tep, it is below world and
regional average. The analysis of the file of the consumers and the customers of the national
company producing and supplying electricity shows a comparatively low average electricity
consumption per customer (40 kWh), which confirms the prevalence of the use of woody fuels.
The production of electricity is mainly thermic (diesel). The equipped power is 25 MW.
7.2. Electricity production
In spite of the high production capacity (25 MW) in comparison with the energy demand (63G
Wh), access to electricity still remains difficult for most of the households, mainly because of the
limited network and the high costs, in comparison with the households’ income.
Only 25% of the households are connected to the electricity network, therefore an important part
of the demand is still to be met.
The populations, mainly the rural ones, which are located far from the electricity supply
networks have little chance to be connected before a number of years, due to the low investment
capabilities for the extension of the networks and the costs of the kilowatt per hour, which is one
of the highest in the Indian Ocean sub-region (0.3 against 0.1 US$/KWH).
Grand Comoro: Most of the island production is estimated at 30. GWh, and is covered by the
Power Plant located in Voidjou. There are also 5 scattered micro plants with a total power of
about a thousand Kw. These micro plants function in difficult conditions. The electricity
company is planning to eliminate them gradually and supply the network from the Voidjou Plant.
A geo thermic potential is possible on the island, but the cost of the identification and evaluation
studies did not enable us to study it, as part of the elaboration of this document. This energy
source constitutes, however, an alternative source of energy than can be envisaged in the mid and
long term.
Anjouan: Most of the production is estimated at 10 GWh, and is covered by the power station
located in Trénani. But there are two additional micro hydroelectric plants of an equipped power
Pict. 2 : EVOLUTION OF CONSUMPTION OF PETROLEUM PRODUCTS (m3)
0
10 000
20 000
30 000
40 000
50 000
1997 1998 1999 2000 2001 2002 2003 2004 YEARS
VOLUME (m3)
TOTAL ESSENCE TOTAL GAZOL
TOTAL JET PL TOTAL PRODUCT
17
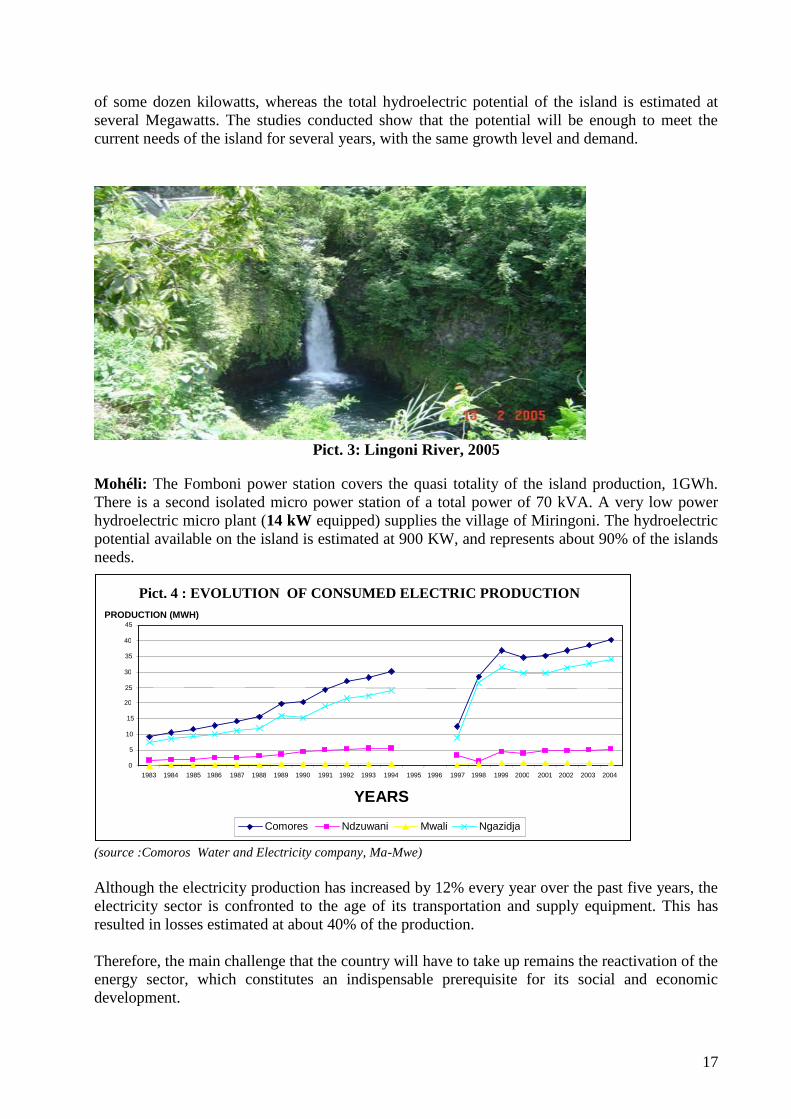
of some dozen kilowatts, whereas the total hydroelectric potential of the island is estimated at
several Megawatts. The studies conducted show that the potential will be enough to meet the
current needs of the island for several years, with the same growth level and demand.
Pict. 3: Lingoni River, 2005
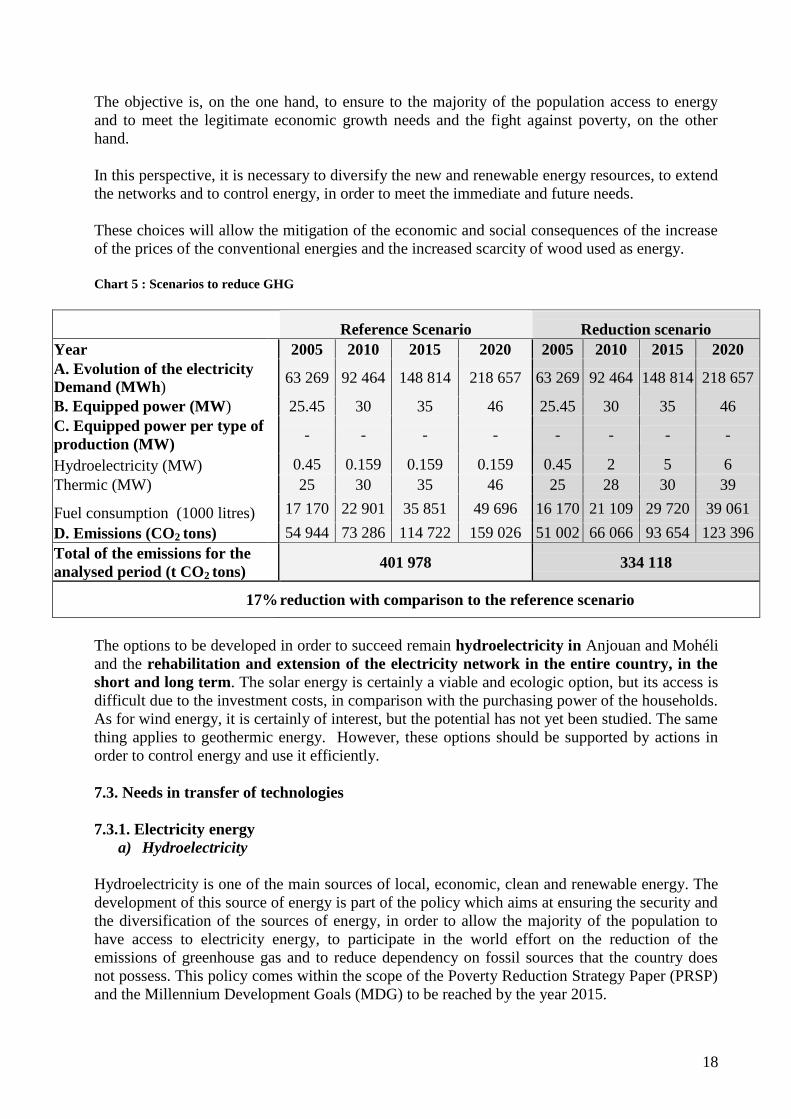
Mohéli: The Fomboni power station covers the quasi totality of the island production, 1GWh.
There is a second isolated micro power station of a total power of 70 kVA. A very low power
hydroelectric micro plant (14 kW equipped) supplies the village of Miringoni. The hydroelectric
potential available on the island is estimated at 900 KW, and represents about 90% of the islands
needs.
(source :Comoros Water and Electricity company, Ma-Mwe)
Although the electricity production has increased by 12% every year over the past five years, the
electricity sector is confronted to the age of its transportation and supply equipment. This has
resulted in losses estimated at about 40% of the production.
Therefore, the main challenge that the country will have to take up remains the reactivation of the
energy sector, which constitutes an indispensable prerequisite for its social and economic
development.
0 5
10 15
20 25 30 35 40 45
1983 1984 1985 1986 1987 1988 1989 1990 1991 1992 1993 1994 1995 1996 1997 1998 1999 2000 2001 2002 2003 2004
YEARS
PRODUCTION (MWH)
Comores Ndzuwani Mwali Ngazidja
Pict. 4 : EVOLUTION OF CONSUMED ELECTRIC PRODUCTION
18
The objective is, on the one hand, to ensure to the majority of the population access to energy
and to meet the legitimate economic growth needs and the fight against poverty, on the other
hand.
In this perspective, it is necessary to diversify the new and renewable energy resources, to extend
the networks and to control energy, in order to meet the immediate and future needs.
These choices will allow the mitigation of the economic and social consequences of the increase
of the prices of the conventional energies and the increased scarcity of wood used as energy.
Chart 5 : Scenarios to reduce GHG
Reference Scenario Reduction scenario
Year 2005 2010 2015 2020 2005 2010 2015 2020
A. Evolution of the electricity
Demand (MWh) 63 269 92 464 148 814 218 657 63 269 92 464 148 814 218 657
B. Equipped power (MW) 25.45 30 35 46 25.45 30 35 46
C. Equipped power per type of
production (MW) - - - - - - - -
Hydroelectricity (MW) 0.45 0.159 0.159 0.159 0.45 2 5 6
Thermic (MW) 25 30 35 46 25 28 30 39
Fuel consumption (1000 litres) 17 170 22 901 35 851 49 696 16 170 21 109 29 720 39 061
D. Emissions (CO2 tons) 54 944 73 286 114 722 159 026 51 002 66 066 93 654 123 396
Total of the emissions for the
analysed period (t CO2 tons) 401 978 334 118
17% reduction with comparison to the reference scenario
The options to be developed in order to succeed remain hydroelectricity in Anjouan and Mohéli
and the rehabilitation and extension of the electricity network in the entire country, in the
short and long term. The solar energy is certainly a viable and ecologic option, but its access is
difficult due to the investment costs, in comparison with the purchasing power of the households.
As for wind energy, it is certainly of interest, but the potential has not yet been studied. The same
thing applies to geothermic energy. However, these options should be supported by actions in
order to control energy and use it efficiently.
7.3. Needs in transfer of technologies
7.3.1. Electricity energy
a) Hydroelectricity
Hydroelectricity is one of the main sources of local, economic, clean and renewable energy. The
development of this source of energy is part of the policy which aims at ensuring the security and
the diversification of the sources of energy, in order to allow the majority of the population to
have access to electricity energy, to participate in the world effort on the reduction of the
emissions of greenhouse gas and to reduce dependency on fossil sources that the country does
not possess. This policy comes within the scope of the Poverty Reduction Strategy Paper (PRSP)
and the Millennium Development Goals (MDG) to be reached by the year 2015.
19
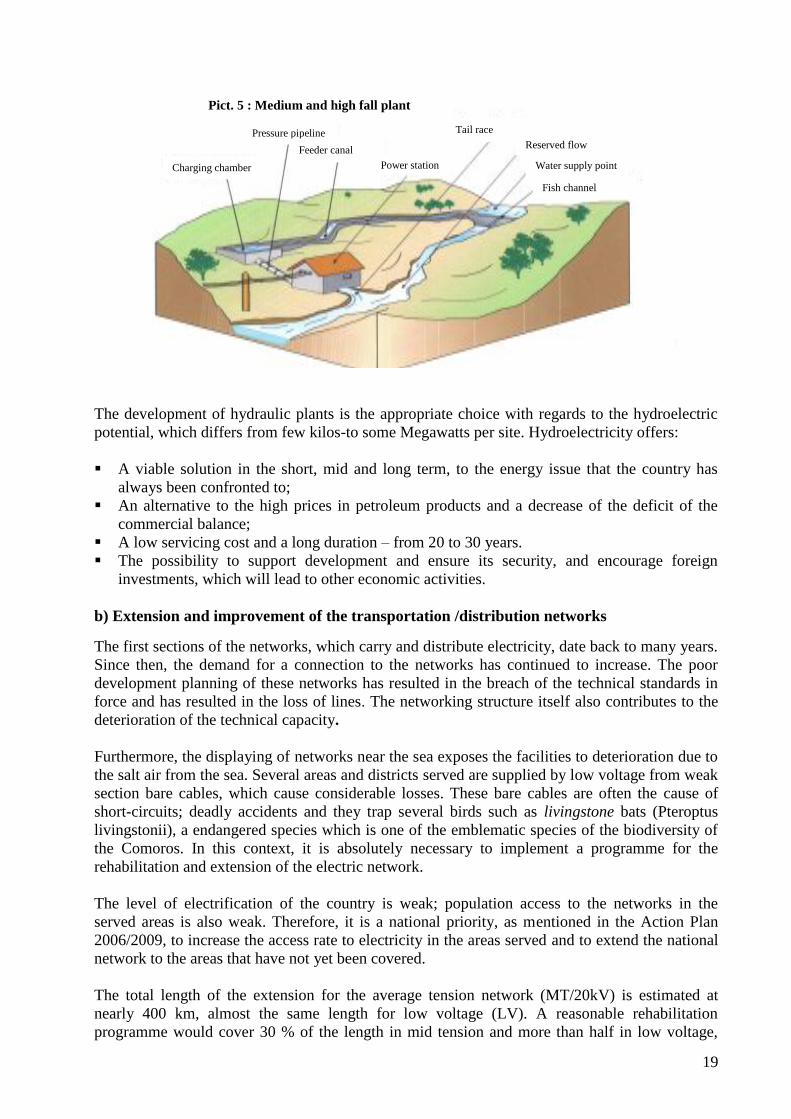
The development of hydraulic plants is the appropriate choice with regards to the hydroelectric
potential, which differs from few kilos-to some Megawatts per site. Hydroelectricity offers:
A viable solution in the short, mid and long term, to the energy issue that the country has
always been confronted to;
An alternative to the high prices in petroleum products and a decrease of the deficit of the
commercial balance;
A low servicing cost and a long duration – from 20 to 30 years.
The possibility to support development and ensure its security, and encourage foreign
investments, which will lead to other economic activities.
b) Extension and improvement of the transportation /distribution networks
The first sections of the networks, which carry and distribute electricity, date back to many years.
Since then, the demand for a connection to the networks has continued to increase. The poor
development planning of these networks has resulted in the breach of the technical standards in
force and has resulted in the loss of lines. The networking structure itself also contributes to the
deterioration of the technical capacity.
Furthermore, the displaying of networks near the sea exposes the facilities to deterioration due to
the salt air from the sea. Several areas and districts served are supplied by low voltage from weak
section bare cables, which cause considerable losses. These bare cables are often the cause of
short-circuits; deadly accidents and they trap several birds such as livingstone bats (Pteroptus
livingstonii), a endangered species which is one of the emblematic species of the biodiversity of
the Comoros. In this context, it is absolutely necessary to implement a programme for the
rehabilitation and extension of the electric network.
The level of electrification of the country is weak; population access to the networks in the
served areas is also weak. Therefore, it is a national priority, as mentioned in the Action Plan
2006/2009, to increase the access rate to electricity in the areas served and to extend the national
network to the areas that have not yet been covered.
The total length of the extension for the average tension network (MT/20kV) is estimated at
nearly 400 km, almost the same length for low voltage (LV). A reasonable rehabilitation
programme would cover 30 % of the length in mid tension and more than half in low voltage,
Pict. 5 : Medium and high fall plant
Charging chamber
Pressure pipeline
Feeder canal
Power station
Tail race
Reserved flow
Water supply point
Fish channel
20
which is currently exploited in the country. The cost is estimated at: (i) 8,54 Millions US$ for the
extensions of the networks (ii) 6,14 Millions US$ for rehabilitation.
c) Controlling the energy
The programme related to controlling, saving and using energy efficiently does not aim at
imposing restrictions on the consumers. It rather aims at meeting the current and future demand,
on the basis of a reasonable use of the different forms of energy. The strategy to be developed is
to train and educate consumers on the need to control energy and use it efficiently, through
education campaigns aiming at changing the behaviour and the choice of equipments that
consume less energy.
An essential part of the strategy is to classify these equipments through an encouraging taxation
system and to have them labelled by a national authorised body. The creation of a national
agency to control and save energy, with regional branches, will guaranty the success of the
programme.
The objectives of the programme are both environmental and economic. They allow the slowing
down of deforestation, the control of the emissions of greenhouse gas and the reduction of
expenses related to the energy bills, both at the national and individual levels. This move always
leads to the delay of the investment needs for the strengthening and the security of the production
capacity.
The money thus saved could constitute important resources for the security of the offer and for
the strengthening of the capacity, in order to meet the demand.
The involved priority sectors of intervention, as part of this programme, are: road transportation
(particularly a strict regulation on the import of vehicles according to their specific consumption
and emissions) and the residential flats/tertiary sectors, where significant energy savings can be
made.
d) Acquisition and absorption
The hydraulic equipment can be obtained through the Mechanism for Environmentally Sound
Development (MESD) of the Kyoto Protocol, as part of NEPAD, but also through a
public/private partnership and/or private funds or bilateral and multilateral cooperation. The
equipment and the material can come whether from OECD countries or emerging countries
(South-East Asia or Latin America). There is no major problem with regards to the absorption of
this technology. Indeed, the location of the sources and sites to develop, will not affect the
economic activity and the housing areas of the populations living along them. On the contrary,
the transfer of this technology would have beneficial consequences at the economic and social
levels. The work of low volume and regulation dams would, indeed, allow a better electricity
supply in the islands and would favour the irrigation and development of fish farming. If this
energy source is valued, it can constitute the engine for the different sectors that favour growth,
for the fight against poverty and will set a good example of an integrated project. It has the
support of both the authorities and the recipient communities, and it therefore ensures good
sustainability, through the protection and preservation of the resource.
21
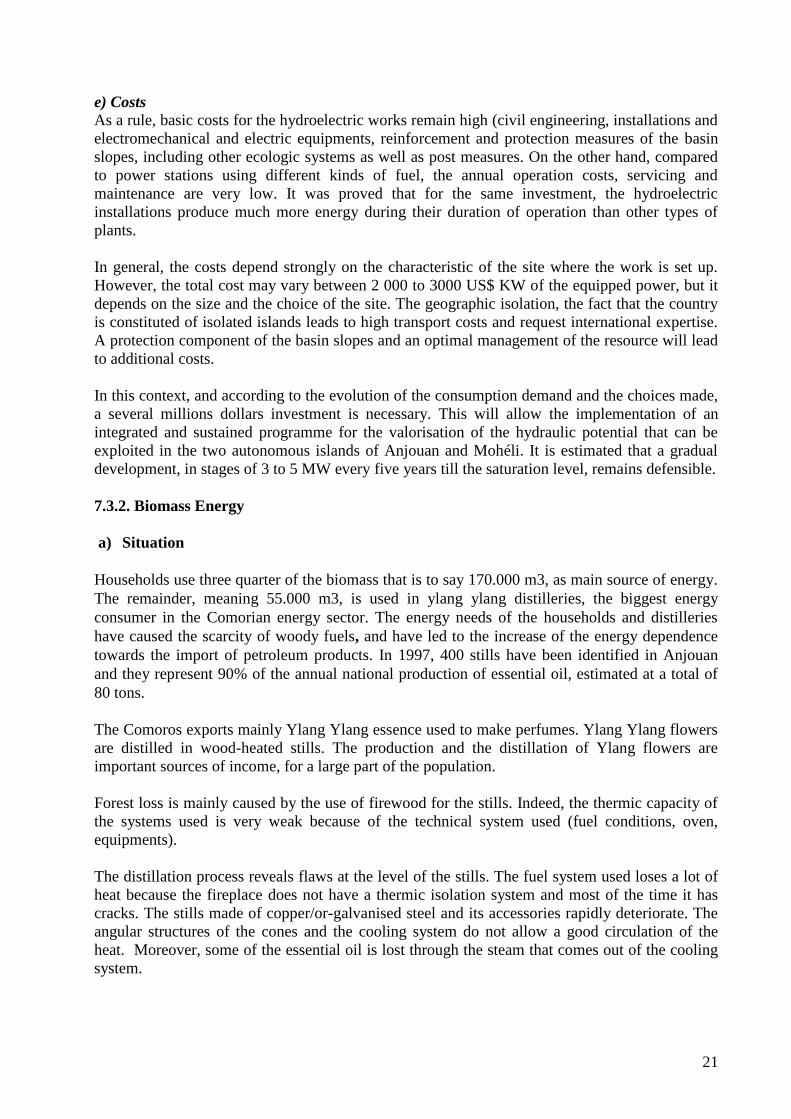
e) Costs
As a rule, basic costs for the hydroelectric works remain high (civil engineering, installations and
electromechanical and electric equipments, reinforcement and protection measures of the basin
slopes, including other ecologic systems as well as post measures. On the other hand, compared
to power stations using different kinds of fuel, the annual operation costs, servicing and
maintenance are very low. It was proved that for the same investment, the hydroelectric
installations produce much more energy during their duration of operation than other types of
plants.
In general, the costs depend strongly on the characteristic of the site where the work is set up.
However, the total cost may vary between 2 000 to 3000 US$ KW of the equipped power, but it
depends on the size and the choice of the site. The geographic isolation, the fact that the country
is constituted of isolated islands leads to high transport costs and request international expertise.
A protection component of the basin slopes and an optimal management of the resource will lead
to additional costs.
In this context, and according to the evolution of the consumption demand and the choices made,
a several millions dollars investment is necessary. This will allow the implementation of an
integrated and sustained programme for the valorisation of the hydraulic potential that can be
exploited in the two autonomous islands of Anjouan and Mohéli. It is estimated that a gradual
development, in stages of 3 to 5 MW every five years till the saturation level, remains defensible.
7.3.2. Biomass Energy
a) Situation
Households use three quarter of the biomass that is to say 170.000 m3, as main source of energy.
The remainder, meaning 55.000 m3, is used in ylang ylang distilleries, the biggest energy
consumer in the Comorian energy sector. The energy needs of the households and distilleries
have caused the scarcity of woody fuels, and have led to the increase of the energy dependence
towards the import of petroleum products. In 1997, 400 stills have been identified in Anjouan
and they represent 90% of the annual national production of essential oil, estimated at a total of
80 tons.
The Comoros exports mainly Ylang Ylang essence used to make perfumes. Ylang Ylang flowers
are distilled in wood-heated stills. The production and the distillation of Ylang flowers are
important sources of income, for a large part of the population.
Forest loss is mainly caused by the use of firewood for the stills. Indeed, the thermic capacity of
the systems used is very weak because of the technical system used (fuel conditions, oven,
equipments).
The distillation process reveals flaws at the level of the stills. The fuel system used loses a lot of
heat because the fireplace does not have a thermic isolation system and most of the time it has
cracks. The stills made of copper/or-galvanised steel and its accessories rapidly deteriorate. The
angular structures of the cones and the cooling system do not allow a good circulation of the
heat. Moreover, some of the essential oil is lost through the steam that comes out of the cooling
system.
22
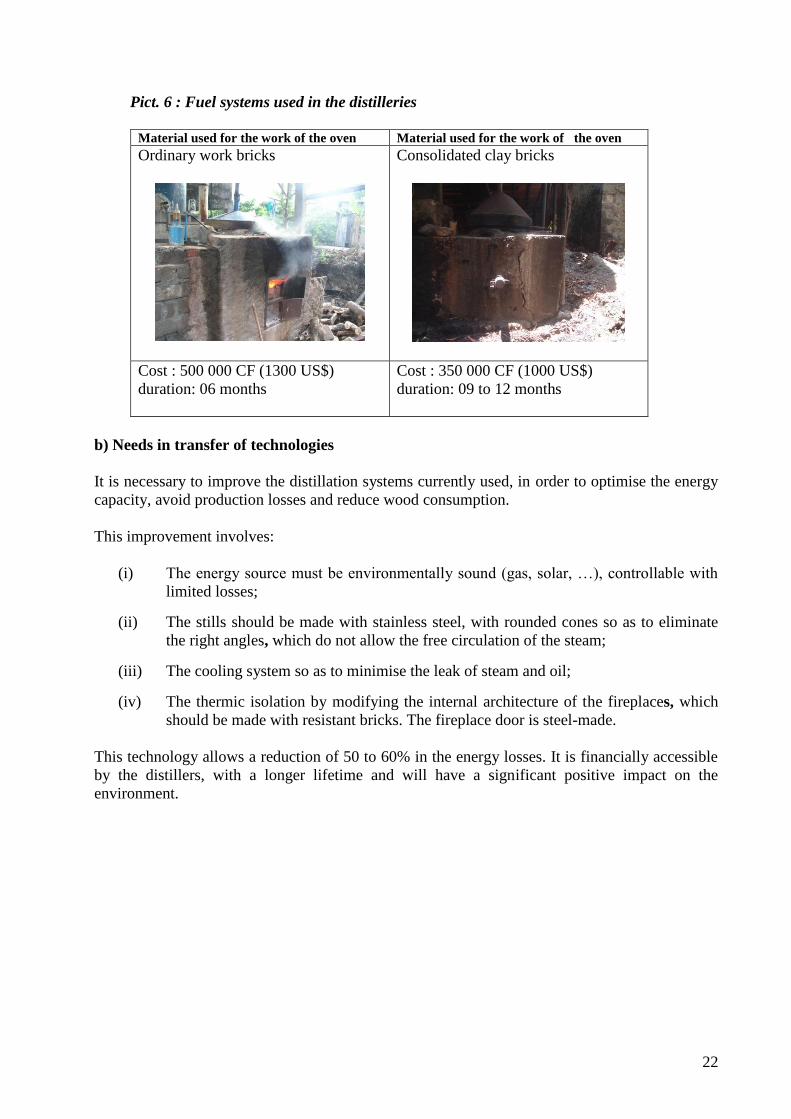
Pict. 6 : Fuel systems used in the distilleries
Material used for the work of the oven Material used for the work of the oven
Ordinary work bricks
Consolidated clay bricks
Cost : 500 000 CF (1300 US$)
duration: 06 months
Cost : 350 000 CF (1000 US$)
duration: 09 to 12 months
b) Needs in transfer of technologies
It is necessary to improve the distillation systems currently used, in order to optimise the energy
capacity, avoid production losses and reduce wood consumption.
This improvement involves:
(i) The energy source must be environmentally sound (gas, solar, …), controllable with
limited losses;
(ii) The stills should be made with stainless steel, with rounded cones so as to eliminate
the right angles, which do not allow the free circulation of the steam;
(iii) The cooling system so as to minimise the leak of steam and oil;
(iv) The thermic isolation by modifying the internal architecture of the fireplaces, which
should be made with resistant bricks. The fireplace door is steel-made.
This technology allows a reduction of 50 to 60% in the energy losses. It is financially accessible
by the distillers, with a longer lifetime and will have a significant positive impact on the
environment.

23
Pict. 7: The newly proposed system
The material used for the work of the
oven
Cost of the
fireplaces
lifetime Environmental
Impact
Resistant Bricks
2,5 millions
CF (6 600
US$)
Several years
(+ 20 years)
Reduction of more
than 50 to 60% of
wood consumption
The choice of the technology proposed takes into account the less encouraging results obtained
from the tests made with gas oil and coal. Gas oil proves to be too expensive and the material
used for the work of the stills does not resist coal heat. But, the stills made of steel are
gas-resistant, they can furthermore, be adjusted. But it would be interesting to make a test with
the sun as energy source.
8. PROMOTION OF NON-METALLIC MINERAL MATERIAL TO
REPLACE TIMBER
8.1. Context:
About 30 to 40%, 50 to 60%, 25 to 30% of the Comorian families respectively in Grand Comoro,
Anjouan and Mohéli live in cob or straw-made houses, with a woody frame which does not stand
bad weathers (MICS 2000).
The increase trend in extreme climate events observed over the past years is likely to jeopardise
the life of these families. Indeed, 30% of the works are made of concrete and half concrete and
70% s of them are made of weak structure which therefore make them precarious.
Nearly 6.000 houses are built every year on the three islands, 4.200 with weak structure. With a
total poverty incidence of the individuals of 44,8% and a total poverty incidence of households of
36,9% and an unemployment rate of 13,5%, the access to concrete houses remains limited to the
rich families, due to the high costs of this kind of work. The outcome of the census conducted in
1991 foresees, between 1991 and 2010, an evolution of the number of houses estimated at
246.977 in comparison with the demographic projections during this period. The use of new
material produced locally will lead to a significant decrease of the work costs. The work made
with concrete through non-metallic mineral materials better resists wind and heavy rain, and can
last for several decades, whereas cob or straw-made works must be renewed almost every year.
Due to the limited availability of woody resources, it is urgent to resort to an alternative solution
to prevent the use of timber and to preserve the forest resources. The use of these materials
would contribute to improve the comfort of the houses.
The promotion of the non-metallic sector is also indispensable in order to preserve the local soils
and rivers, aquiferous layers and biodiversity, as well as climate balance. The development of the
non-metallic sector allows the emergence of entrepreneurs in the ceramic sector, job creation, the
24
limitation of rural exodus, the increase of concrete works and the gradual disappearance of
precarious housing, the reduction of deforestation, the development of commercial perspectives.
Granulates, sand, puzzolane, silt and clay are used not only for housing but also in infrastructures
such as roads, bridges, airports, ports, schools, tanks etc. and in the manufacture of a variety of
products in ceramic which offer interesting perspectives for economic growth.
Furthermore, bricks (consolidated or baked) present thermic characteristics conducive to energy
efficiency in buildings.
Finally, the production of bricks made with consolidated or baked clay requires easy moulding,
press and baking procedures. It is an adapted technology that can be controlled and reproduced
on the field.
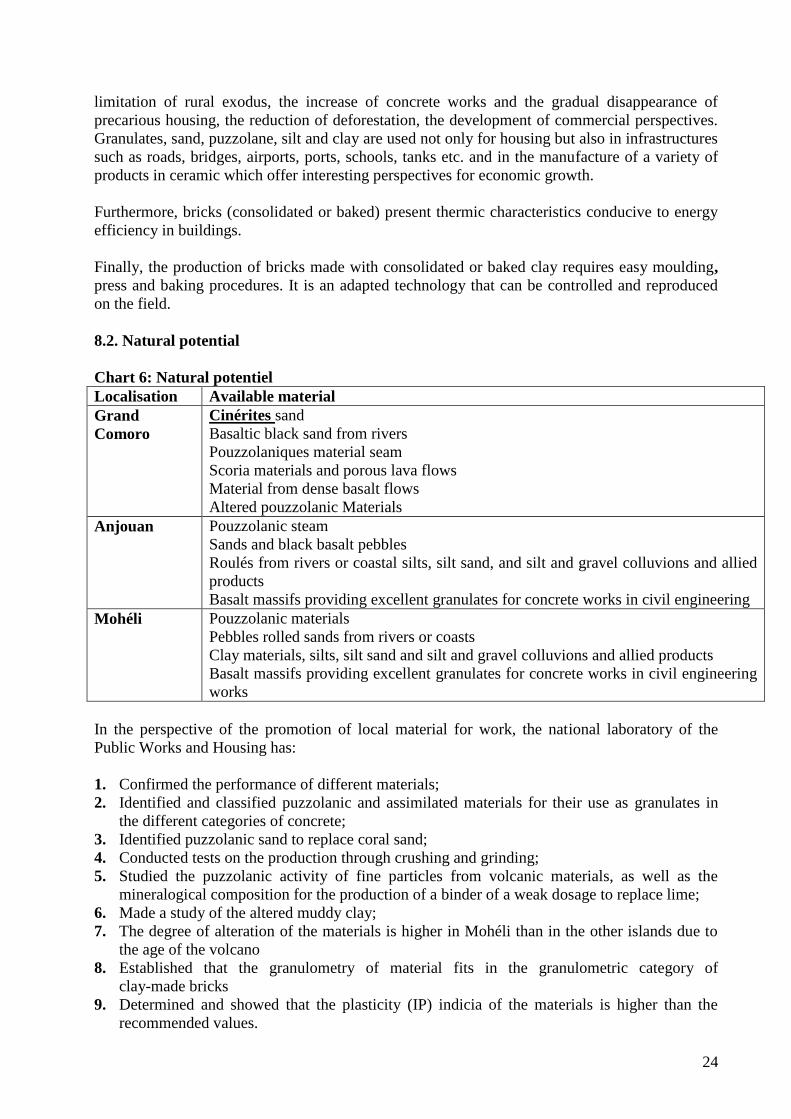
8.2. Natural potential
Chart 6: Natural potentiel
Localisation Available material
Grand
Comoro
Cinérites sand
Basaltic black sand from rivers
Pouzzolaniques material seam
Scoria materials and porous lava flows
Material from dense basalt flows
Altered pouzzolanic Materials
Anjouan Pouzzolanic steam
Sands and black basalt pebbles
Roulés from rivers or coastal silts, silt sand, and silt and gravel colluvions and allied
products
Basalt massifs providing excellent granulates for concrete works in civil engineering
Mohéli Pouzzolanic materials
Pebbles rolled sands from rivers or coasts
Clay materials, silts, silt sand and silt and gravel colluvions and allied products
Basalt massifs providing excellent granulates for concrete works in civil engineering
works
In the perspective of the promotion of local material for work, the national laboratory of the
Public Works and Housing has:
1. Confirmed the performance of different materials;
2. Identified and classified puzzolanic and assimilated materials for their use as granulates in
the different categories of concrete;
3. Identified puzzolanic sand to replace coral sand;
4. Conducted tests on the production through crushing and grinding;
5. Studied the puzzolanic activity of fine particles from volcanic materials, as well as the
mineralogical composition for the production of a binder of a weak dosage to replace lime;
6. Made a study of the altered muddy clay;
7. The degree of alteration of the materials is higher in Mohéli than in the other islands due to
the age of the volcano
8. Established that the granulometry of material fits in the granulometric category of
clay-made bricks
9. Determined and showed that the plasticity (IP) indicia of the materials is higher than the
recommended values.
25
As the outcomes of the conducted studies were encouraging, a manual on the manufacture of
consolidated clay bricks has been elaborated in 1976 and experimental operations on economical
housings made with local materials was made from 1983 to 1986.
8.3. Assessment of the needs for the transfer of technologies
For the manufacture of consolidated clay bricks, the followings are needed:
Presses, mixers, tractors, shovels and various tools.
The equipment is available in Madagascar, South Africa, India, etc
They can be absorbed through the creation of community micro enterprises.
The equipment needs of a production unit are estimated at: 462 000 US$.
9. TECHNOLOGIES FOR THE WORK OF WORKS FOR THE PROTECTION OF KEY
ECONOMIC INFRASTRUCTURES
The key economic infrastructures are located in the coastal zone. They are exposed to extreme
events. The biggest challenge is to reinforce these infrastructures through appropriate
technologies, on the one hand, and build alterative inland roads, on the other hand.
The most exposed key economic infrastructures are: the national coastal roads, the hydrocarbons
warehouses, airports, hotels and ports works.
9.1. Coastal national roads
The coastal roads are in some areas protected by works, which are near the sea. More than half of
the roadway is destroyed, and therfore disturbs road traffic. These roads and works must be
rehabilitated and new works must be built to complete this rehabilitation.
9.2. Hydrocarbons warehouses and power stations
All the hydrocarbons warehouses and the main power plant are located near the sea. It is
necessary to build works to protect them against rises in the sea levels. It is preferable to build
protecting walls or levies.
9.3. Airport works
The runway of the airport of Anjouan is the most damaged, by the rise of the sea level, along 50 m.
9.4. Port works
The most vulnerable work is the sea access in Mohéli. It needs to be protected because it may
also be used as a harbour for the fishing boats. Although it has resisted bad weather (cyclones
and heavy swells) over the past years, it must be protected to prevent its likely destruction by
extreme climate events.
9.5. Hotels and human establishments
The destruction of human housing is among the number of anticipated impacts of climate change.
It is believed to affect at least 10% of the population and the hotel infrastructures.
The search for technologies to protect and reinforce economic and social infrastructures
constitutes one of the priorities that will allow reaching the Objectives set in the Poverty
Reduction Strategy Paper (PRSP) and the Millennium Development Goals.
26
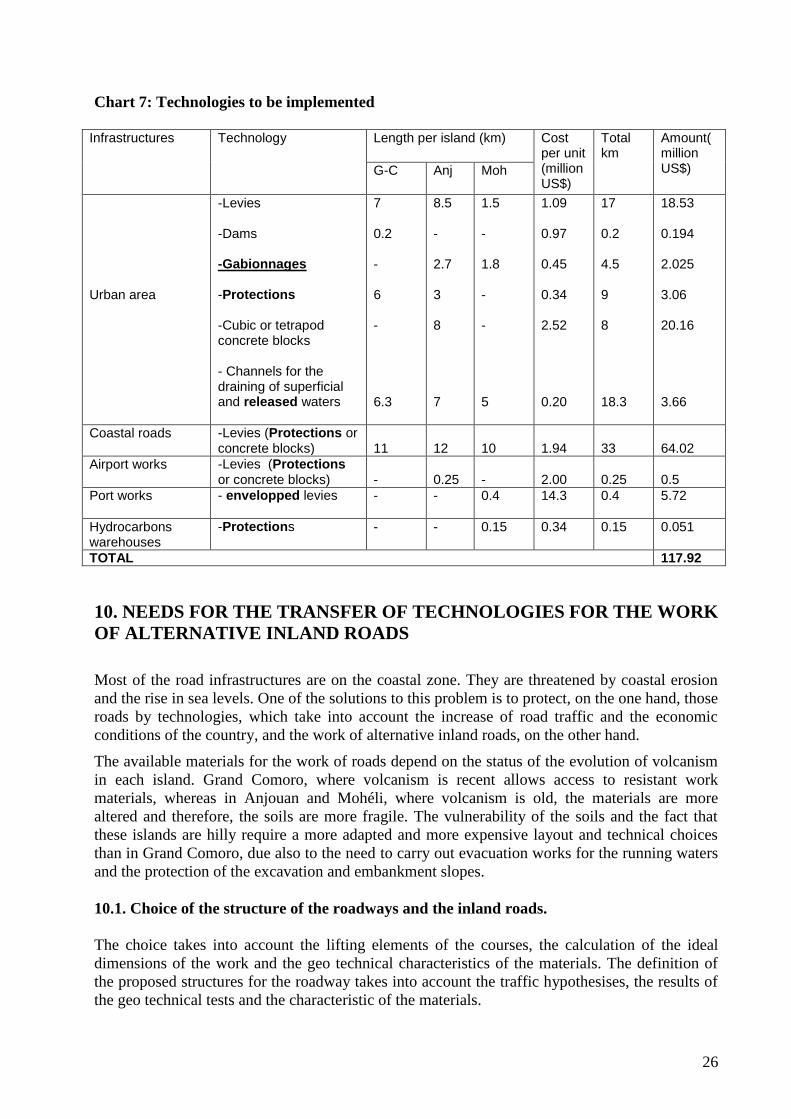
Chart 7: Technologies to be implemented
Infrastructures Technology Length per island (km) Cost
per unit (million US$)
Total km
Amount(million US$) G-C Anj Moh
Urban area
-Levies -Dams -Gabionnages -Protections -Cubic or tetrapod concrete blocks - Channels for the draining of superficial and released waters
7 0.2 - 6 - 6.3
8.5 - 2.7 3 8 7
1.5 - 1.8 - - 5
1.09 0.97 0.45 0.34 2.52 0.20
17 0.2 4.5 9 8 18.3
18.53 0.194 2.025 3.06 20.16 3.66
Coastal roads
-Levies (Protections or concrete blocks)
11
12
10
1.94
33
64.02
Airport works -Levies (Protections or concrete blocks)
-
0.25
-
2.00
0.25
0.5
Port works - envelopped levies
- - 0.4 14.3 0.4 5.72
Hydrocarbons warehouses
-Protections - - 0.15 0.34 0.15 0.051
TOTAL 117.92
10. NEEDS FOR THE TRANSFER OF TECHNOLOGIES FOR THE WORK
OF ALTERNATIVE INLAND ROADS
Most of the road infrastructures are on the coastal zone. They are threatened by coastal erosion
and the rise in sea levels. One of the solutions to this problem is to protect, on the one hand, those
roads by technologies, which take into account the increase of road traffic and the economic
conditions of the country, and the work of alternative inland roads, on the other hand.
The available materials for the work of roads depend on the status of the evolution of volcanism
in each island. Grand Comoro, where volcanism is recent allows access to resistant work
materials, whereas in Anjouan and Mohéli, where volcanism is old, the materials are more
altered and therefore, the soils are more fragile. The vulnerability of the soils and the fact that
these islands are hilly require a more adapted and more expensive layout and technical choices
than in Grand Comoro, due also to the need to carry out evacuation works for the running waters
and the protection of the excavation and embankment slopes.
10.1. Choice of the structure of the roadways and the inland roads.
The choice takes into account the lifting elements of the courses, the calculation of the ideal
dimensions of the work and the geo technical characteristics of the materials. The definition of
the proposed structures for the roadway takes into account the traffic hypothesises, the results of
the geo technical tests and the characteristic of the materials.
27
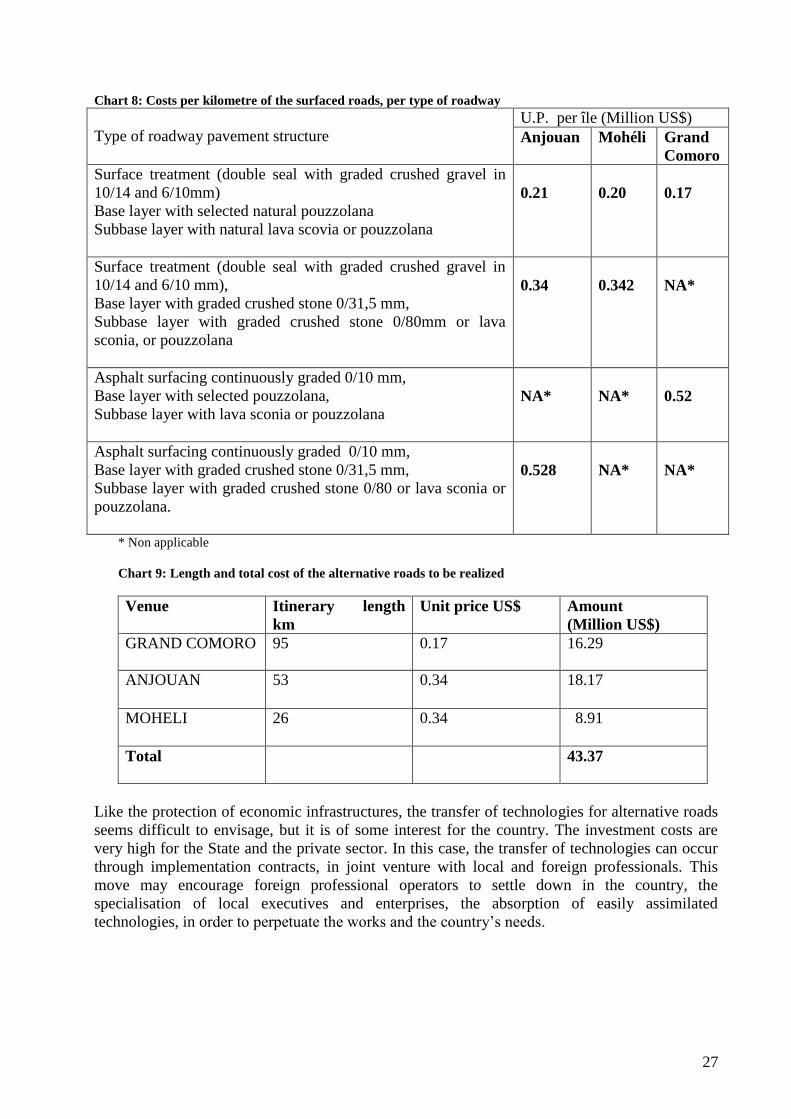
Chart 8: Costs per kilometre of the surfaced roads, per type of roadway
Type of roadway pavement structure
U.P. per île (Million US$)
Anjouan Mohéli Grand
Comoro
Surface treatment (double seal with graded crushed gravel in
10/14 and 6/10mm)
Base layer with selected natural pouzzolana
Subbase layer with natural lava scovia or pouzzolana
0.21
0.20
0.17
Surface treatment (double seal with graded crushed gravel in
10/14 and 6/10 mm),
Base layer with graded crushed stone 0/31,5 mm,
Subbase layer with graded crushed stone 0/80mm or lava
sconia, or pouzzolana
0.34
0.342
NA*
Asphalt surfacing continuously graded 0/10 mm,
Base layer with selected pouzzolana,
Subbase layer with lava sconia or pouzzolana
NA*
NA*
0.52
Asphalt surfacing continuously graded 0/10 mm,
Base layer with graded crushed stone 0/31,5 mm,
Subbase layer with graded crushed stone 0/80 or lava sconia or
pouzzolana.
0.528
NA*
NA*
* Non applicable
Chart 9: Length and total cost of the alternative roads to be realized
Venue Itinerary length
km
Unit price US$ Amount
(Million US$)
GRAND COMORO 95 0.17 16.29
ANJOUAN 53 0.34 18.17
MOHELI 26 0.34 8.91
Total 43.37
Like the protection of economic infrastructures, the transfer of technologies for alternative roads
seems difficult to envisage, but it is of some interest for the country. The investment costs are
very high for the State and the private sector. In this case, the transfer of technologies can occur
through implementation contracts, in joint venture with local and foreign professionals. This
move may encourage foreign professional operators to settle down in the country, the
specialisation of local executives and enterprises, the absorption of easily assimilated
technologies, in order to perpetuate the works and the country’s needs.
28
11. NEED IN TRANSFER OF TECHNOLOGIES FOR THE
DEVELOPPEMENT OF A NATIONAL PROGRAMME ON DISASTERS
PREPAREDNESS
The geographic situation of the Comoros predisposes the country to different types of natural,
climate and accidental disasters.
11.1 Disaster profile
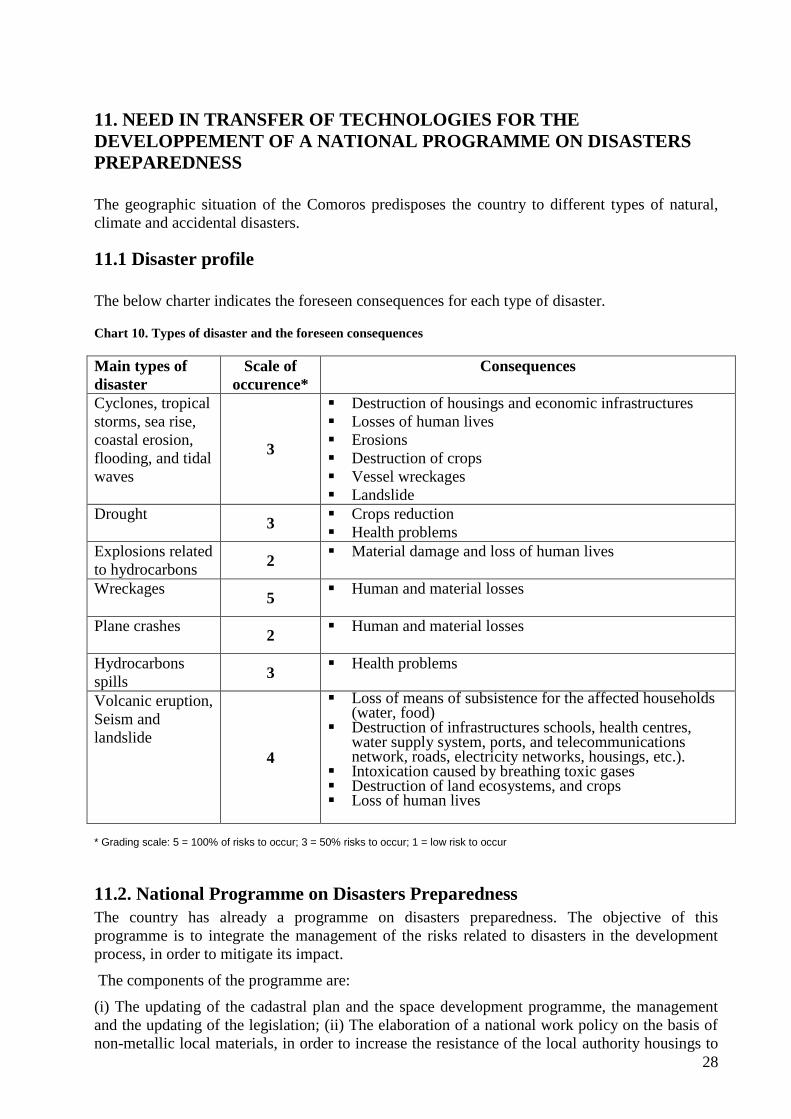
The below charter indicates the foreseen consequences for each type of disaster.
Chart 10. Types of disaster and the foreseen consequences
Main types of
disaster
Scale of
occurence*
Consequences
Cyclones, tropical
storms, sea rise,
coastal erosion,
flooding, and tidal
waves
3
Destruction of housings and economic infrastructures
Losses of human lives
Erosions
Destruction of crops
Vessel wreckages
Landslide
Drought 3
Crops reduction
Health problems
Explosions related
to hydrocarbons 2
Material damage and loss of human lives
Wreckages
5
Human and material losses
Plane crashes
2
Human and material losses
Hydrocarbons
spills 3
Health problems
Volcanic eruption,
Seism and
landslide
4
Loss of means of subsistence for the affected households (water, food)
Destruction of infrastructures schools, health centres, water supply system, ports, and telecommunications network, roads, electricity networks, housings, etc.).
Intoxication caused by breathing toxic gases Destruction of land ecosystems, and crops Loss of human lives
* Grading scale: 5 = 100% of risks to occur; 3 = 50% risks to occur; 1 = low risk to occur
11.2. National Programme on Disasters Preparedness
The country has already a programme on disasters preparedness. The objective of this
programme is to integrate the management of the risks related to disasters in the development
process, in order to mitigate its impact.
The components of the programme are:
(i) The updating of the cadastral plan and the space development programme, the management
and the updating of the legislation; (ii) The elaboration of a national work policy on the basis of
non-metallic local materials, in order to increase the resistance of the local authority housings to
29
bad weather; (iii) Equipments of the volcano surveillance centre; (iv) Vulnerability and general
adaptation studies on all the islands; (v) Reinforcement of human and institutional capacities.
(vi) Setting-up of a national coordination that brings together the different national departments
and the bilateral and multilateral partners.
11.3. Needs for a transfer of technologies
The identification of the technology needs for the development of a national programme on
disasters preparedness meets the need to reinforce and complete the above-mentioned
programme.
To that end, there are two levels of needs of technologies tranfer:
a. Planning level:
(i) Realisation of a map based on air and satellite images, as part of the cadastral plan and
soil development and occupation,
(ii) Elaboration of anti cyclones work standards,
(iii)Equipments to reinforce the volcano surveillance centre (seismologic network,
inclinometer network, geo electric measuring equipment, etc.)
(iv) Equipments for the observation, forecast and warning against extreme meteorological
phenomenon (meteorological stations network, capabilities for the acquisition and
treatment of satellite images).
b. Intervention level
(i) Equipments for intervention in case of emergencies (cyclones, scorching heat,
wreckages, explosion of hydrocarbons warehouses, plane crashes, etc.)
(ii) Training of specialists to intervene in case of disasters.
12. DRINKING WATER SUPPLY NETWORKS
With a coverage rate in drinking water of nearly 55 % in the country (35 % in Grand Comoro;
60% in Anjouan and 82 % in Mohéli) only half of the consumption needs, in drinking water, of a
great number of households are met.
The currently available water supply systems produce nearly 20 000 m3per day (11 000 in Grand
Comoro, 7 500 in Anjouan and 1 500 in Mohéli) for a demand which is estimated at 57 000 m3
per day. On the assumption that the offer remains unchanged, national demand will reach
103,085m3 per day by 2025.
30
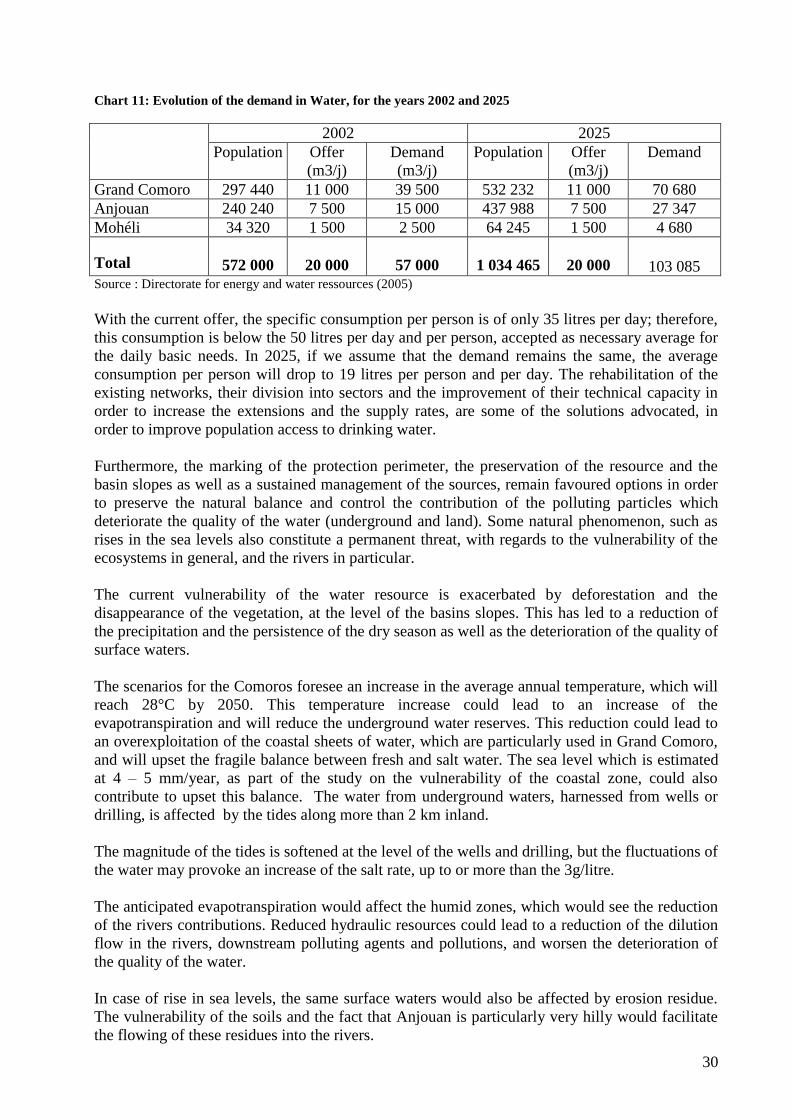
Chart 11: Evolution of the demand in Water, for the years 2002 and 2025
2002 2025
Population Offer
(m3/j)
Demand
(m3/j)
Population Offer
(m3/j)
Demand
Grand Comoro 297 440 11 000 39 500 532 232 11 000 70 680
Anjouan 240 240 7 500 15 000 437 988 7 500 27 347
Mohéli 34 320 1 500 2 500 64 245 1 500 4 680
Total
572 000
20 000
57 000
1 034 465
20 000 103 085 Source : Directorate for energy and water ressources (2005)
With the current offer, the specific consumption per person is of only 35 litres per day; therefore,
this consumption is below the 50 litres per day and per person, accepted as necessary average for
the daily basic needs. In 2025, if we assume that the demand remains the same, the average
consumption per person will drop to 19 litres per person and per day. The rehabilitation of the
existing networks, their division into sectors and the improvement of their technical capacity in
order to increase the extensions and the supply rates, are some of the solutions advocated, in
order to improve population access to drinking water.
Furthermore, the marking of the protection perimeter, the preservation of the resource and the
basin slopes as well as a sustained management of the sources, remain favoured options in order
to preserve the natural balance and control the contribution of the polluting particles which
deteriorate the quality of the water (underground and land). Some natural phenomenon, such as
rises in the sea levels also constitute a permanent threat, with regards to the vulnerability of the
ecosystems in general, and the rivers in particular.
The current vulnerability of the water resource is exacerbated by deforestation and the
disappearance of the vegetation, at the level of the basins slopes. This has led to a reduction of
the precipitation and the persistence of the dry season as well as the deterioration of the quality of
surface waters.
The scenarios for the Comoros foresee an increase in the average annual temperature, which will
reach 28°C by 2050. This temperature increase could lead to an increase of the
evapotranspiration and will reduce the underground water reserves. This reduction could lead to
an overexploitation of the coastal sheets of water, which are particularly used in Grand Comoro,
and will upset the fragile balance between fresh and salt water. The sea level which is estimated
at 4 – 5 mm/year, as part of the study on the vulnerability of the coastal zone, could also
contribute to upset this balance. The water from underground waters, harnessed from wells or
drilling, is affected by the tides along more than 2 km inland.
The magnitude of the tides is softened at the level of the wells and drilling, but the fluctuations of
the water may provoke an increase of the salt rate, up to or more than the 3g/litre.
The anticipated evapotranspiration would affect the humid zones, which would see the reduction
of the rivers contributions. Reduced hydraulic resources could lead to a reduction of the dilution
flow in the rivers, downstream polluting agents and pollutions, and worsen the deterioration of
the quality of the water.
In case of rise in sea levels, the same surface waters would also be affected by erosion residue.
The vulnerability of the soils and the fact that Anjouan is particularly very hilly would facilitate
the flowing of these residues into the rivers.
31
Flooding would also increase the danger of the contamination of the underground waters. In
Grand Comoro, the main cause of water pollution would be the use of old pumping equipment,
which are not adequately protected and, the lack of a water protection perimeter. In Mohéli and
Anjouan, the risk would appear at the level of the septic tanks, which are usually deep enough to
reach the underground waters. As a consequence, they would contain more stagnant waters, and
this would result in the breeding of mosquitoes, which transmit diseases such as malaria
filariosis.
The desirable solution is to increase the access to drinking water and optimise its management.
In this spirit, it is necessary to reconstitute the water outlets and ensure the cleaning of the
hydraulic basins beds, first, by mitigating erosion through anti erosion systems, then through
upstream dams to limit the flow of sediment.
11.1. Needs for the transfer of technologies
The needs for the transfer of technologies in the sector of water management are:
Equipments and installations for the pumping of underground waters, the harnessing of upper
waters, the distribution and control of the quality of the water.
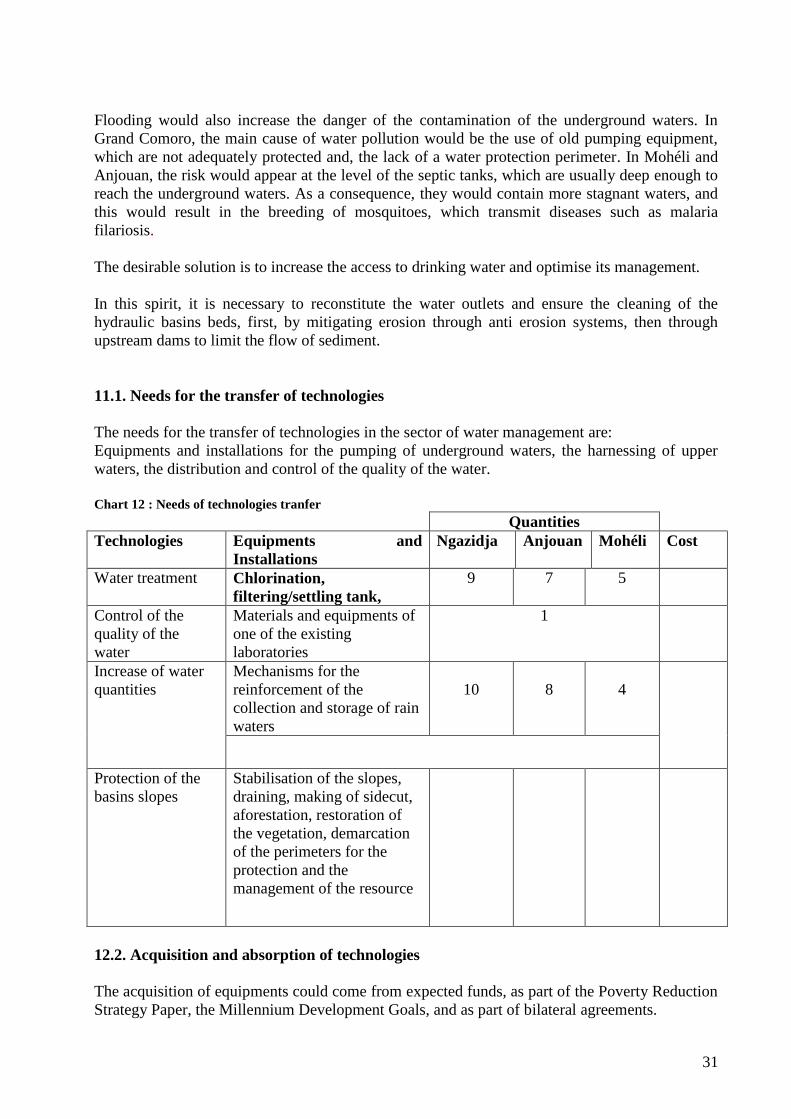
Chart 12 : Needs of technologies tranfer
Quantities
Technologies Equipments and
Installations
Ngazidja Anjouan Mohéli Cost
Water treatment Chlorination,
filtering/settling tank,
9 7 5
Control of the
quality of the
water
Materials and equipments of
one of the existing
laboratories
1
Increase of water
quantities
Mechanisms for the
reinforcement of the
collection and storage of rain
waters
10
8
4
Protection of the
basins slopes
Stabilisation of the slopes,
draining, making of sidecut,
aforestation, restoration of
the vegetation, demarcation
of the perimeters for the
protection and the
management of the resource
12.2. Acquisition and absorption of technologies
The acquisition of equipments could come from expected funds, as part of the Poverty Reduction
Strategy Paper, the Millennium Development Goals, and as part of bilateral agreements.
32
The experience obtained through FSCD, the several years Programme for Micro Realisation, the
Local Development Project and the ongoing effort for the decentralisation of public
responsibilities to the basic communities constitute a major absorption asset.
The national and islands administrative institutions responsible for the water issues and the
creation within the University of the Comoros of an Institute of Technologies together with the
Research existing Institutes guarantees the absorption capacity.
13. CAPACITY-BUILDING FOR THE PARTICIPATION IN THE
SYSTEMATIC OBSERVATION NETWORK FOR CLIMATE CHANGE
13.1. Context:
Until 1990, The Comoros had sixteen meteorological stations, four of which were synoptic,
10 climatologic stations and forty-six pluviometric stations. Currently, only the synoptic
station of the airport is operational. The successive economic crises that the country is still
experiencing did not allow maintaining and renewing the existing stations, and enable the
follow-up of these parameters, the treatment and diffusion of data.
The ongoing and foreseen climate change requires the implementation of a follow-up of the
meteorological, hydrological and oceanographic programmes, through the setting-up and the
operation of an observation network. The envisaged increase of the frequency of tropical
cyclones requires, more than ever, a monitoring and warning system for the security of the
populations and their goods.
This observation network allows, on the one hand, a better understanding of the evolution of
the weather at the national level, and to be able to participate in the climate global systematic
observation network, on the other hand. The obtained data will allow providing support, and
particularly guidance to the sectoral strategies for food security and poverty reduction.
13.2. Objectives:
Capacity-building meets a twofold need:
a) Fill the gaps in the field of meteorology, hydrology and oceanography, in order to meet
the pressing needs in agriculture, water, fishing, energy and environment
b) Participate in the systematic observation network for climate change and develop the
scientific and technical knowledge required for the follow-up, the surveillance of natural
resources and their evaluation for the vulnerability to change and climate variability.
13.3. Needs for capacity-building
13.3.1. In the field of meteorology
The follow-up of the meteorological parameters requires the setting-up of a network of
measurement stations (see attached map) of the following parameters: speed and direction of
the wind, air temperature relative humidity, air pressure, visibility and duration of the sun, net
radiation, precipitation, soil temperature and humidity.
This network comprises:

33
1. Synoptic observation stations in surface and in altitude; (4 in Anjouan; 3 in Mohéli and
5 in Grand Comoro).
2. Agro meteorological stations in order to be able to respect the agricultural timeframe
(4 in Anjouan; 3 in Mohéli and 5 in Grand Comoro).
The objective of this observation network is to better understand the evolution of the climate at
the national level, on the one hand, and to be able to participate in the global network for
systematic observation of the climate, on the other hand (see attached map).
A trained staff is available in the synoptic stations of Hahaya, Moroni, Bandar Salam and Ouani.
The agro meteorological stations should be computerised to increase the reliability and the
accuracy of the data and to better meet the need to adapt to the agricultural calendar to the
evolution of the climate.
13.3.2. In the field of hydrology
The creation of a hydrologic network stations meets the need for a quantitative follow-up of the
water resource for a rational management, but also for the development of hydroelectricity as
well as the prevention of flooding.
This network will allow the measurement of the sources and rivers flow and to assure
the follow-up of the piezometric level of waters. It is also necessary to prospect new underground
waters.
In total, it is estimated at 20, the number of permanent rivers, which must be followed up, 3
stations per river (1 upstream, 1 midstream and 1 downstream) for an estimated amount of
150,000 US$.
As for the ground waters, fifty measurement stations have been accepted on the entire territory.
Considering the high costs of the drilling equipment and the lack of local professionals, it is
timely to enlist the services of a foreign professional, to carry out the accepted drilling
programme, estimated at 870,000 US$.
13.4. Oceans observation Systems
The Comoros coastal space is threatened by the terrigen contributions, sand and coral mining
used for work, the swell dynamics and the envisaged rise of the sea level. The subsequent erosion
is a major threat to the economic and social infrastructure, the ecosystem, the cultural heritage
and the historical as well as the overall balance of the islands.
In the same context, it is necessary to ensure the follow-up of the coastal erosion and the status of
the reefs as well as the oceanographic parameters, such as water temperature, salt rate, water
turbidity, oxygen content, acidity (PH), sea level, the swell dynamics and currents. This data will
enable to prevent the risks related to extreme events such as swells, storms, flooding, and also: (i)
to develop knowledge on sea and coastal environment; (ii) promote the reasonable use of marine
and coastal resources (iii) identify, monitor and foresee extreme events in order to mitigate their
effects; (iv) ensure the security and the efficiency of maritime operations and (v) guide
development strategies.
34
13.5. Evaluation of the human and institutional capabilities for the participation in the
systematic observation of climate change
There are two national institutions in the field of systematic observation of climate change: (i) the
national directorate of meteorology endowed with a technical staff at several levels. However,
the rapid evolution of the technologies requires capacity-buildingat the level of the stakes and
needs of the country for the systematic observation of climate change, and (ii) the national centre
for ocean data and information (CNDO). This centre was created as part of ODINAFRICA
project (Ocean Data and Information Network for Africa).
The project brings together twenty African countries supported by UNESCO Intergovernmental
Oceanographic Committee. Since its inception, the centre has developed several activities
related to the compilation of existing data and training in the following fields: management of
Ocean data and marine information, basic development of national data and index notebooks.
Other activities are related to:
- The elaboration of a database on the national experts on marine and coastal environment,
- The elaboration of a database on Ocean data from special software « Ocean Data View ».
Other activities are envisaged in the next phase of the ODINAFRICA project. They are:
The setting-up of an ocean observation system and proficiency in the management of ocean data
and marine information,
Concerning ocean observation, the Comoros appears in the first list of countries that should
benefit from equipped maregraphs for meteorological and hydrologic panels. The national
meteorological directorate has been designated as focal point for that project.
13.6. Capacity-building needs
Training of technicians in the information system for the gathering, analysis, exploitation, filing
of climate, hydrological and ocean data and the maintenance of equipments.
- Installation, functioning and maintenance of the equipment
- Timely gathering and transmission of data
- Data quality control and management
- Data analyses
- Data use and broadcasting in the national and regional ocean programmes
For Oceanography, training will be carried out on the basis of GOOS methodology used (Global
Ocean Observation System).

35
Chart 13. Obstacles and ations to be taken to overcome them
Sector Transfer obstacles To overcome the obstacles
Electric energy
Weak industrial development
Difficult access to funds
Limited human capabilities
Weakness of the legal and
regulatory framework
Promote and reinforce public/private
partnership and cooperation with the
institutions that support the development
of clean energy.
Staff proficiency
Establish technical standards for the
installation of electric equipments
Biomass
- Difficult access to information on
economical energy technologies
- Relatively high access cost
- Inform and educate ylang distillers
- Tax exemption on the import of clean
technologies
Local work
material - No systematic resort to a
professional qualified for a lasting
architectural conception.
Inform, educate and promote architectural
conception.
Protection of the
infrastructures
-------------------
Work of
alternative roads
- High infrastructures coast in
comparison with the means of the
country
- Lack of equipments and enterprises
specialised in the realisation of works
and qualified labour
- Search for bilateral and multilateral
financial support for adaptation
- Promote and reinforce regional and
international with special enterprises.
- Apply the public procurement regulation
- Control of the quality of the aggregates
and works.
Improve the
management and
the maintenance
of clean water
networks
- Financial resources
- Diminution of the resource
- Efforts to mobilise financial resources
as part of the international initiatives
(MDG)
- Reconstitution of the vegetation
- Exploration of new resources
- Constitution of storage reserves
National
programme on
disasters
preparedness
- Limited State financial resources
- Weakness of the capabilities of
the institutions in charge of
disasters management
- Non-respect of urban standards
- Reinforce regional and international
cooperation in terms of disasters
management
- Increase the understanding of the
communities on the need to adopt the
work and urbanism standards
Climate
observation
system
- Access costs of the important
equipment
- Inadequate access to financial
information
- Reinforce regional and international
cooperation in the field of climate
systematic observation
14. INSTITUTIONAL FRAMEWORK FOR THE TRANSFER OF
TECHNOLOGIES
There is not yet any institutional and regulatory mechanism for the transfer of technologies in
general and the ecologically rational technologies, in particular.
This situation is attributable to the weak economic and industrial development of the country.
The geographic isolation and the country being far from international markets do not always
favour access to information, in spite of the accession to the new Information, due to high costs
and the weak coverage rate of the network.
36
However, a certain number of actions have already been taken to stop the import of vehicles of
more than 7 years and the substances that weaken the ozone layer. Others encourage the import
of electrical equipments that consume less energy.
In order to protect the promotion of clean technologies, it is necessary to create a structure
responsible for the coordination of the transfer of clean technologies to the public and private
sectors.
This coordination would allow the promotion of clean technologies, in order to make viable the
development strategies.
This structure could be composed of the Chamber of Commerce, the employers, les consumers
and the Groups of Economic Interest, under the supervision of the Ministry of Economy,
Commerce and Industry and the Ministry of Environment of the Union of the Comoros.
The role of the structure could be as follows:
1. Make an inventory of the needs in the transfer of clean technologies, in comparison with the
national context.
2. Propose measures aiming at creating conditions conducive to the transfer (creation of a
conducive environment: improvement of the rules of the local markets, favourable legislation,…)
and to reinforce the capabilities of the stakeholders, through training and information.
4. Implementation of the transfer through:
- Patents and Licence contracts and other industrial propriety rights;
- Agreements in the communication of know-how;
- Contracts in technical assistance and vocational training;
- Contracts in the realisation of industrial package works (i.e., contracts "with immediate
occupation", partial, complete);
- Direct Investment contracts and others.
The transfer of technologies should therefore be envisaged through the combination of two
actions:
- The private sector, which transposes a technology in the country;
- The government, which creates conducive conditions.
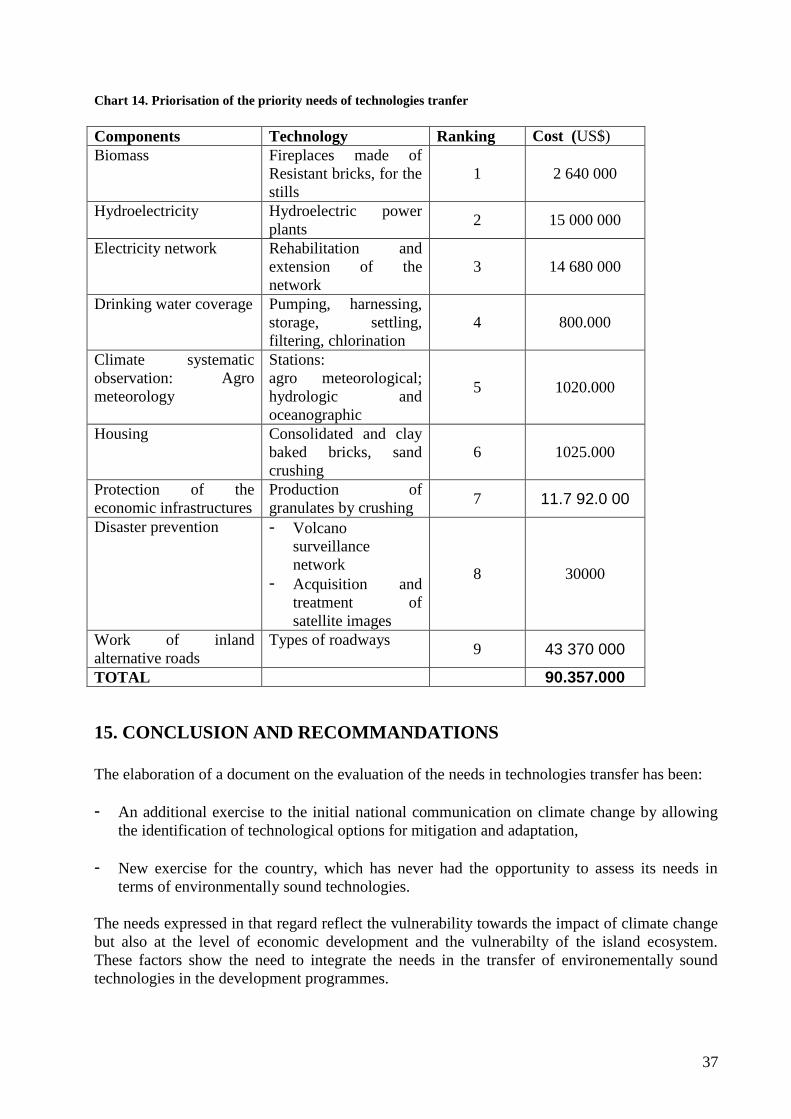
37
Chart 14. Priorisation of the priority needs of technologies tranfer
Components Technology Ranking Cost (US$)
Biomass Fireplaces made of
Resistant bricks, for the
stills
1 2 640 000
Hydroelectricity Hydroelectric power
plants 2 15 000 000
Electricity network Rehabilitation and
extension of the
network
3 14 680 000
Drinking water coverage Pumping, harnessing,
storage, settling,
filtering, chlorination
4 800.000
Climate systematic
observation: Agro
meteorology
Stations:
agro meteorological;
hydrologic and
oceanographic
5 1020.000
Housing Consolidated and clay
baked bricks, sand
crushing
6 1025.000
Protection of the
economic infrastructures
Production of
granulates by crushing 7 11.7 92.0 00
Disaster prevention - Volcano
surveillance
network
- Acquisition and
treatment of
satellite images
8 30000
Work of inland
alternative roads
Types of roadways 9 43 370 000
TOTAL 90.357.000
15. CONCLUSION AND RECOMMANDATIONS
The elaboration of a document on the evaluation of the needs in technologies transfer has been:
- An additional exercise to the initial national communication on climate change by allowing
the identification of technological options for mitigation and adaptation,
- New exercise for the country, which has never had the opportunity to assess its needs in
terms of environmentally sound technologies.
The needs expressed in that regard reflect the vulnerability towards the impact of climate change
but also at the level of economic development and the vulnerabilty of the island ecosystem.
These factors show the need to integrate the needs in the transfer of environementally sound
technologies in the development programmes.
38
The priorities identified are placed at the level of the reinforcement and the protection of
economic infrastructures (energy, water, roads, ports and airports), housing, and the participation
to the systematic network for the observation of climate change and disasters preparedness.
The country has therefore a synthesis document on the priority technologies needs required for
its adaptation to climate change and its economic development.
It is therefore recommended to:
(i.) Set-up, as soon as possible, the institutional framework for the transfer of technologies as
advocated in this document.
(ii.) Set-up the first three priorities which are: ylang distilleries, the installation and
exploitation of hudroelectical plants, the setting-up of networks for the systematic
observation of climate change, particularly the agro meteorologic network in the
perspective of controlling agricultural calendar.
39
16. ATTACHMENTS: MAPS OF SYNOPTIC AND AGRO
METEOROLOGICAL STATIONS
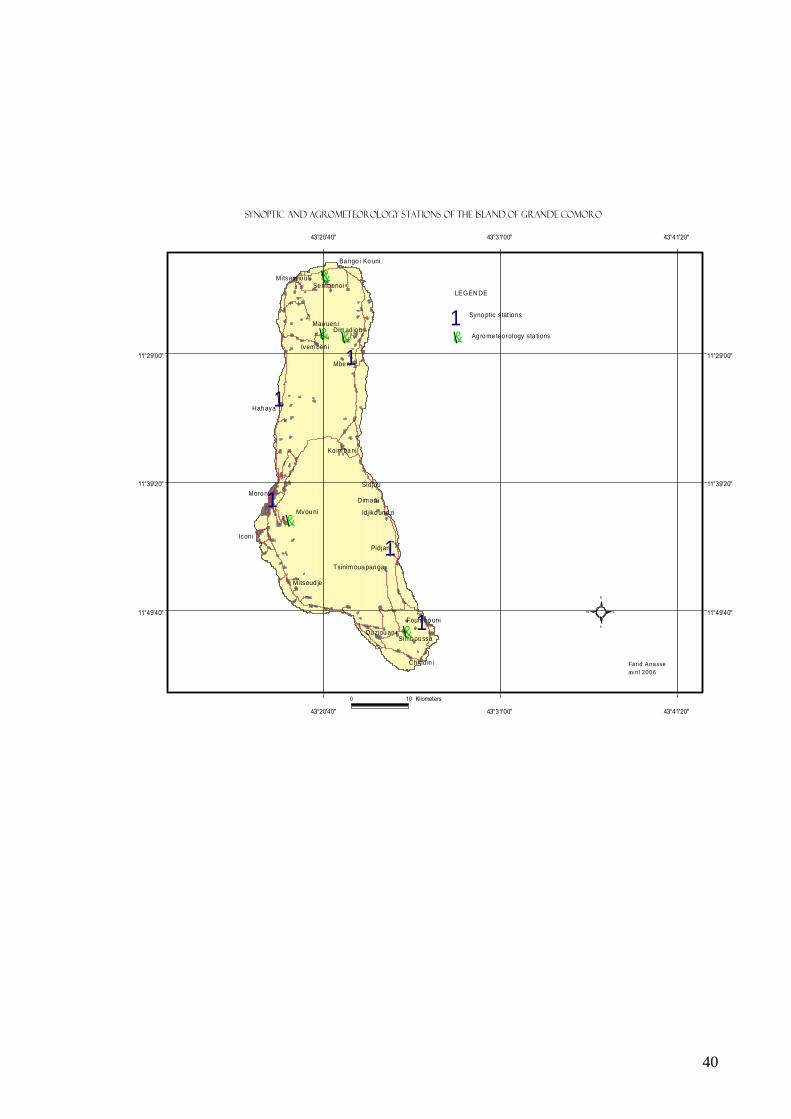
40
Moro ni
Hah aya
Mitsam io uli
Ko im ba ni
Foum bo uni
Chind in i
Ivem ben i
Tsinim oua pan ga
Idjiko und zi
Sidjou
Pidjani
Ba ngo i Ko uni
Iconi
Ou ziou an i
Mbe ni
Mitsoud je
1
1
1
1
1
1 Syno ptic stat io ns
&\
Mvou ni
&\
Mao uen i
&\
Dim an i
Dim ad jo u
&\
&\Se mb eno i
Simb ou ssa&\
Ag ro me teo rology sta tions
LEGEN DE
0 10 Kilometers
S
N
EW
Synoptic and agrometeorology stations of the island of Grande comoro
11°49'40" 11°49'40"
11°39'20" 11°39'20"
11°29'00" 11°29'00"
43°20'40"
43°20'40"
43°31'00"
43°31'00"
43°41'20"
43°41'20"
Farid Anasse
av ri l 2006
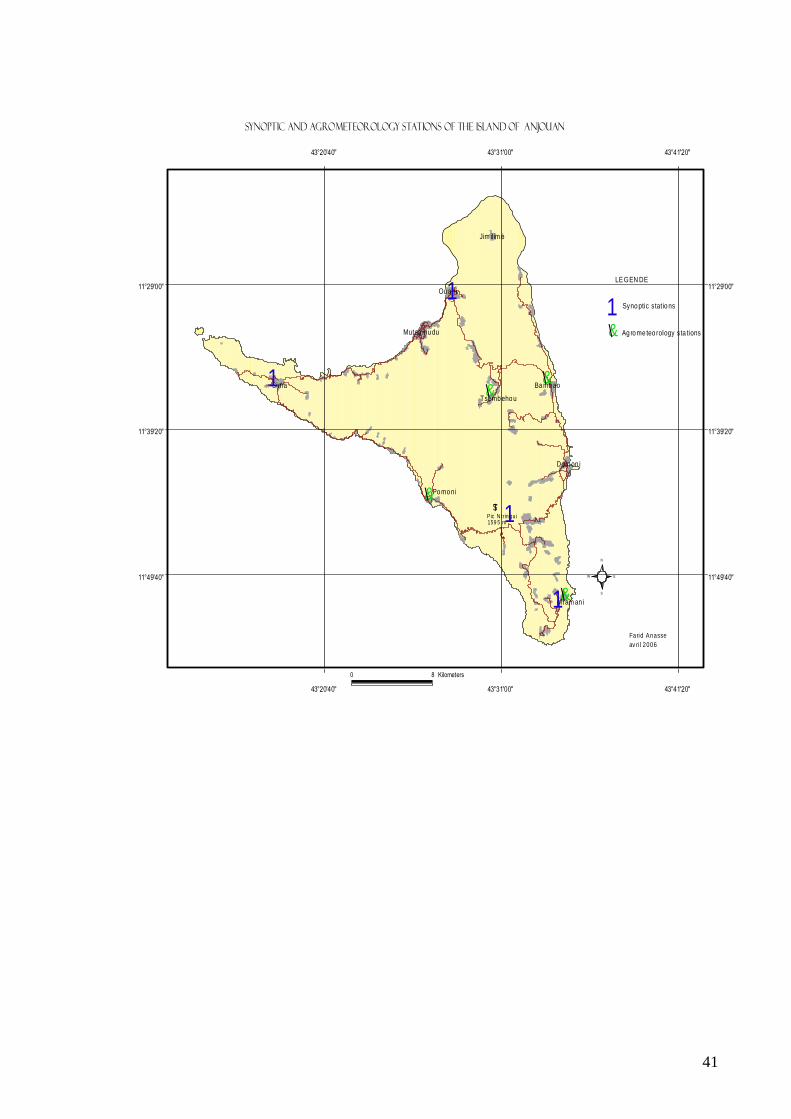
41
Jim ilimé
Sima
Dom on i
Mutsa mu du
Mram an i
Tse mb eho u
Ba mb ao
Po mo ni
&\
&\
&\
&\
&\
Ag ro me teo rology sta tions
Ou an i
11
1
1
1
Syno ptic stat io ns
$TPic N trin gui159 5 m
LEGEN DE
0 8 Kilometers
S
N
EW
Synoptic and agrometeorology stations of the island of Anjouan
11°49'40" 11°49'40"
11°39'20" 11°39'20"
11°29'00" 11°29'00"
43°20'40"
43°20'40"
43°31'00"
43°31'00"
43°41'20"
43°41'20"
Farid Anasse
av ri l 2006
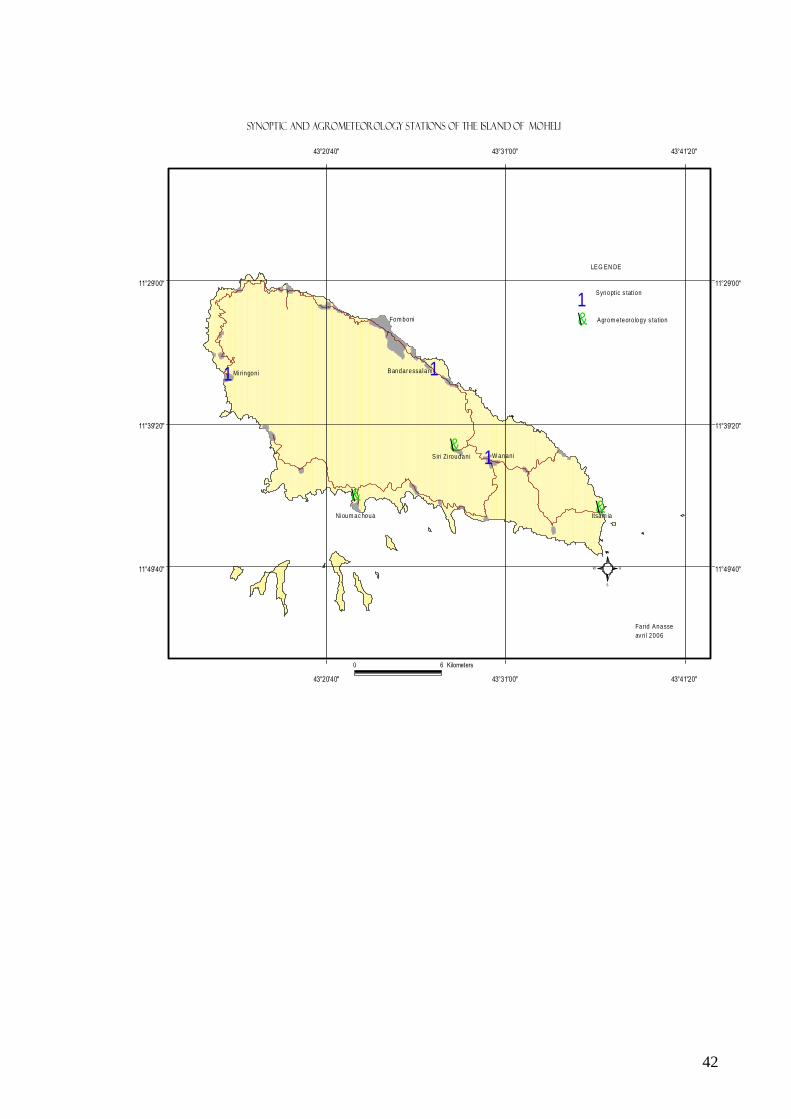
42
Fom boni
W anani
Itsam ia
Miringoni
Nioum ac houa
Bandaressa lam11
1
1
Sir i Zi roudani
&\
&\&\
&\
Synoptic s tation
Agrom eteoro logy s ta tion
LEG EN DE
0 6 Kilometers
S
N
EW
Synoptic and agrometeorology stations of the island of Moheli
11°49'40" 11°49'40"
11°39'20" 11°39'20"
11°29'00" 11°29'00"
43°20'40"
43°20'40"
43°31'00"
43°31'00"
43°41'20"
43°41'20"
Farid Anasse
av ri l 2006
43
17. BIBLIOGRAPHY
1. Geologic map of Grand Comoro- 1993
2. Morphopedologic maps of the Comoros - 1977
3. MARIOTTI: Optimal use of material resources in the Comoros - 1983
4. CEBTP: Analyses and various on puzzolanic samples - 1985
5. UN. REUNION: Regional Workshop on the Adapted Economic Housing - 1985
6. CSIR : Housing for the Comoros - 1988
7. CSIR : Comoros manual on construction - 1990
8. R.J.S.SPENCE : Predicting the performance of soil cement as a building material in
tropical countries - 1975
9. BIT: Manuel of use for the press CINVA RAM on the manufacture and implementation of
consoldated clay-made bricks - 1976
10. CNUEH : Housing in the Comoros - 1986
11. V.T.A : Understanding stabilized earth construction - 1984
12. UNESCO / CEBTP: Spontaneous and economic housing in the Comoros - 1985
13. Report on the Activities of the African Housing Funds (AHF) - 1994
14. UNCHS: Housing in Subsaharan Africa - 1993
15. UNESCO/CEBTP: Researches on the local material used for the construction of
economic housing in Africa - 1985
16. CSIR : Examination of materials from the Comoro Islands - 1984
17. Country report on Human Establishment - march 1996
18. RRI: Faisability study pertaining to the exploitation of materials to replace sea sand in the
Comoros - 2002
19. CEBTP/LNTPB: Puzzolanic Granulate concrete - 1986
20. CEBTP: mud; a construction material - 1982
21. NBRI/CSIR : Low cost Housing special report - 1987
22. ISTD: News bulletin on Building in developping countries - 1983
44
23. Recommandations and specifications for the production and the implementation of
concrete blocks made of consolidated mud
24. Catalogue RUTEC : Micro- Enterprise systems -1995
25. AURAM INDIA : Earth construction Equipment
26. Adobe s.a Belgique: Construction-Industries-Technologies - 1995
27. ALTECH INFOS - 1995
28. UNESCO : An Integrated Ocean Observation and Service Network for Africa,
ODINAFRICA III - 2003
29. BCEOM: Development of the port of Mutsamudu – 1979 / 1982
30. BCEOM Development of the port of Moroni – 1988
31. SOERNI: Sea access in Mohéli – 1985
32. EYSER: Roads Construction and surfacing –1990
33. SECMO: Etudes d’itinéraires routiers Anjouan – 1980
34. BCEOM: Studies on Miringoni road– Nioumachioi – 1980
35. SECMO: Studies of the road itineraries in Grand-Comoro – 1980
36. DINIKA: Reinforcement studies on the national roads RN1and RN2 Grand-Comoro –
1990/ 2000
37. BCEOM: Feasability study, infrastructures projects – Water and Environment – 2000
38. BCEOM: Project study ; periodic maintenance of the roads – 2003
39. BCEOM: Infrastructures project, Water and Environment- Rehabilitation and extension
of the infrastructures for the supply in drinking water to different urban centres – 2003
40. UNESCO, An Integrated Ocean Observation and Service Network for Africa,
ODINAFRICA III -2003
41. IOGOOS, Indian Ocean Global Ocean Observing System, First Conference - 2002
42. AHMED Abdoulkarim, 2004, Climate Change Impact on tourism in the Comoros
43. Five-year Plan on the development of meteorology 2005/2009
44. DOC OMM 49 thechnical regulations
45. IPCC report 2001