Embed Size (px)
Citation preview
ZAMBIA
TECHNOLOGY NEEDS ASSESSMENT AND TECHNOLOGY ACTION PLANS FOR CLIMATE CHANGE MITIGATION
PART I: TECHNOLOGY NEEDS ASSESSMENT REPORT
M a r c h . 2 0 1 3
S u p p o r t e d b y :
Centre for Energy, Environment and Engineering Zambia Limited
CEEEZ

Preface Zambia
Disclaimer
This document is an output of the Technology Needs Assessment project, funded by the Global Environment Facility (GEF) and implemented by the United Nations Environment Programme (UNEP) and the UNEP Risoe Centre (URC) in collaboration with the Regional Centre (from the corresponding region), for the benefit of the participating countries. The present report is the output of a fully country-led process and the views and information contained herein are a product of the National TNA team, led by the Ministry of Lands, Natural Resources and Environmental Protection.
iii
Foreword
As a non-Annex I country to the UNFCCC, Zambia is not subject to binding greenhouse gas emission reduction commitments under the Kyoto Protocol. Our contribution to global greenhouse gas emissions is small in the energy sector but relatively high under agriculture and land use and forestry. Although not bound compulsory, as a country, vulnerable country to the impacts of climate change, Zambia takes its responsibilities seriously and it will continue to do its part in the global efforts to address climate change. Climate variability and change has become major threats to sustainable development in Zambia. Evidence suggests that the country is already experiencing climate –induced hazards such as droughts, floods and extreme temperatures. Without urgent and coordinated action, climate change and related disasters could negate decades of development progress and undermine the efforts to attain MDGs which may eventually result in failure to sustain Zambia’s recently attained low-medium income country status. Zambia has had some success in mainstreaming climate change in its Sixth National Development Plan and in developing National Programme of Action (NAPA). Zambia has also developed a draft National Climate Change Response Strategy (NCCRS) focusing on capacity development for mainstreaming climate change into policies and programmes. However, most of the projects identified have not been implemented due to scarcity of detailed information and bankable proposals. The Technology Needs Assessment initiative and its objectives of “(i) identifying and prioritizing through country-driven participatory processes, technologies that can contribute to mitigation and adaptation goals of the participant countries, while meeting their national sustainable development goals and priorities, (ii) identifying barriers hindering the acquisition, deployment, and diffusion of prioritized technologies, (iii) developing technology action plans (TAP) specifying activities and enabling frameworks to overcome the barriers and facilitating the transfer, adoption, and diffusion of selected technologies in the participant countries, and present project ideas”, has resulted in the development of concrete detailed action plans that can help decision makers to identify, create, and expand adaptation technologies and market for identified mitigation technologies. This Technology Needs Assessment project considered several adaptation technologies related to water and agriculture, some of the most vulnerable sectors in Zambia, and developed concrete action plans to increase the resilience of these sectors in facing the expected adverse effects of climate change. Additionally, the TNA report has developed mitigation option in energy supply, energy efficiency, sustainable charcoal production and sustainable agriculture. The project ideas developed will serve as an input into development of bankable proposal for financing from various climate related funding under the UNFCCC and other bilateral and multilateral arrangement. Minister of Lands, Natural Resources and Environmental Protection

ACKNOWLEDGEMENTS
We would like to thank all the project partners that worked closely on this project, namely the UNEP RISOE Center and ENDA Senegal for their constructive review and follow-up, the Global Environment Facility for their financial support, and the Ministry of Lands, Natural Resources and Environmental Protection for hosting and implementing this project. We would also like to express our gratitude and appreciation to the contributors of this report, participants of consultation meetings, experts assisting in document reviews, and input guidance from related projects draft Second National Communication, draft National Climate Change Response Strategy, Sixth National Development Plan, in addition to academic institutions, and private companies, whose proactive participation was fundamental to the completion of the Technology Needs Assessment report. Last but not least, we would like to thank the main authors of these report, Prof F D. Yamba and Dr. D Chiwele for their professionalism, friendship and patience throughout the project process. The TNA Project Team (Mitigation and Adaptation).
v
Contents ACKNOWLEDGEMENTS ....................................................................................................................................... iv
ABBREVIATIONS .................................................................................................................................................. vii
EXECUTIVE SUMMARY ......................................................................................................................................... 1
CHAPTER 1 INTRODUCTION ................................................................................................................................ 3
1. 1 About the TNA project ....................................................................................................................... 3
1.2 Existing national policies about climate change mitigation and development priorities .................. 4
1.2.1 Existing National Policies Related to Climate Change ................................................................. 4
1.2.2 Sustainable Development ............................................................................................................ 6
CHAPTER 2 INSTITUTIONAL ARRANGEMENT FOR THE TNA AND THE STAKEHOLDERS’ INVOLVEMENT ............ 9
2.1 National TNA team ............................................................................................................................. 9
2.2 Stakeholder Engagement Process followed in TNA – Overall assessment .................................. 9
CHAPTER 3 SECTOR AND TECHNOLOGIES SELECTION ........................................................................................ 9
3.1 An overview of GHG emissions status and trends of the different sectors ................................ 9
3.2 Sector Selection .......................................................................................................................... 11
3.3 Process, criteria, and results of technology selection ............................................................... 11
CHAPTER 4 TECHNOLOGY PRIORITIZATION FOR ENERGY BASED TECHNOLOGIES ........................................... 18
4.1 GHG emissions and existing technologies for Energy Based Projects ......................................................... 18
4.2 An overview of possible mitigation technology options in Energy and their mitigation benefits ... 18
4.2.1 Energy Based Projects ............................................................................................................... 18
4.2.2 Off-Grid Technologies ................................................................................................................ 21
4.2.3 Energy Efficiency ........................................................................................................................ 23
4.2.4 Biofuels ...................................................................................................................................... 25
4.2.5 Improved Cooking Devices ........................................................................................................ 27
4.2.6 Improved Charcoal Production .................................................................................................. 28
vi
CHAPTER 5 TECHNOLOGY PRIORITIZATION FOR AGRICULTURE, LAND USE CHANGE AND FORESTRY ............ 30
5.1.1 Afforestation and reforestation ....................................................................................................... 31
5.1.2 Conservation Tillage ................................................................................................................. 31
5.1.3 Use of organic manure ............................................................................................................. 31
5.1.4 Control of weeds ....................................................................................................................... 31
CHAPTER 6 PRIORITISATION OF FINAL LIST OF TECHNOLOGIES ....................................................................... 32
6.1 Overview of Prioritised Technologies ......................................................................................... 32
6.2 Prioritisation of final list ............................................................................................................. 32
CHAPTER 7 SUMMARY AND CONCLUSIONS ...................................................................................................... 34
LIST OF REFERENCES .......................................................................................................................................... 35
Annex I. Technology Factsheets for selected technologies .................................................................... 36
Annex II: Results of ranking of Technologies for long list....................................................................... 55
Annex III(a) Marginal Costing of on-grid technologies .......................................................................... 65
Annex III(a) GHG emissions calculations ............................................................................................... 65
Annex IV :Detailed financial calculations for off-grid systems ............................................................... 66
Annex V: Calculations for marginal costing for improved cooking devices ........................................... 70
Annex VI: List of Stakeholders (Working group) for Finalisation of Final List ........................................ 71
Annex VII Detailed results of ranking of final list ................................................................................... 71
Annex VIII: List of Participants ................................................................................................................ 74
vii
ABBREVIATIONS BAZ Biofuels Association of Zambia CBA Cost Benefit Analysis CDM Clean Development Mechanism CEEEZ Centre for Energy, Environment and Engineering Zambia Ltd CFL Compact Fluorescent Lights CH4 Methane CO Carbon monoxide CO2 Carbon dioxide COD Chemical Oxygen Demand COP Conference of the Parties CSP Concentrated Solar Power DOE Department of Energy EE Energy Efficiency ERB Energy Regulation Board FD Forest Department FNDP Fifth National Development Plan GART Golden Valley Research Institute GDP Gross Domestic Product GEF Global Environmental Facility GHG Greenhouse gas HFCs Hydrofluorocarbons IRR Internal Rate of Return LFA Logical Framework Analysis MDG Millenium Development Goals MCA Multi-Criteria Analysis MFI Micro Financial Institution MLNREP Ministry of Lands, Natural Resource and Environmental Protection NAMA Nationally Mitigation Actions N2O Nitrous Oxide NGO Non Governmental Organisation NMVOC Non Methane Volatile Organic Compounds NO Nitrogen Oxide NPV Net Present Value PV Photo voltaic R&D Research and Development RTSA Road Transport and Safety Agency SADC Southern African Development Community SAPP Southern African Power Pool SNC Second National Communication SNDP Sixth National Development Plan SO2 Sulphur Dioxide TAP Technology Action Plan TFS Technology Factsheet TNA Technology Needs Assessment UNCED UN Conference on Environment and Development UNEP DTIE UNEP Division of Technology, Industry and Economics UNFCCC United Nations Framework Convention on Climate Change URC UNEP Risoe Centre UNZA University of Zambia

viii
WCED World Commission on Environment and Development
1
EXECUTIVE SUMMARY Background Technology Needs Assessments are a set of country-driven activities that identify and determine the mitigation and adaptation technology priorities of developing countries and are central to the work of Parties to the Convention on technology transfer. They present an opportunity for countries to track their evolving need for new equipment, techniques, practical knowledge and skills necessary to mitigate GHG emissions.
Objectives The main objectives of the project are; (i) to identify and prioritize through country-driven participatory processes, technologies that can contribute to mitigation and adaptation goals of the participant countries, while meeting their national sustainable development goals and priorities, (ii) to identify barriers hindering the acquisition, deployment, and diffusion of prioritized technologies, (iii) to develop technology action plans (TAP) specifying activities and enabling frameworks to overcome the barriers and facilitate the transfer, adoption, and diffusion of selected technologies in the participant countries, and present project ideas.
Existing National Policies Related to Climate Change and Development Priorities The general policy on environment covers some aspects of air quality and climate change. The main objective of this policy measure is “to minimize the adverse impact of climate change and to reduce air pollution and greenhouse gas emissions. As part of the National Climate Change Response Strategy (NCCRS) development, the Climate Change Facilitation Unit (CCFU) has been developing a climate change policy which has now been completed and is awaiting approval by Cabinet.
The Government of the Republic Zambia prepares five year development plans which serve as a guide to systematic planning aimed at achieving sustainable development. During the preparation of Sixth National Development Plan (SNDP)(2011-2015), the Government identified climate change as an important cross-cutting issue and was subsequently mainstreamed into the Plan. As part of the plan, climate change activities related to adaptation and mitigation were mainstreamed across economic, services and social sectors
Institutional Arrangements and Stakeholder Engagements The national institutional set up for the TNA project consists of the national TNA coordinator, core team (steering committee), the consultants for Adaptation and Mitigation, and two working groups( one for mitigation and another for adaptation). The mitigation working group was further sub divided into four groups to deal with specialized sectors during selection of preliminary list of technologies. The consultant for TNA mitigation is Centre Energy, Environment and Engineering Zambia (CEEEZ) which was engaged through URC. The Mitigation working group was constituted in close collaboration with focal point and was made up of individuals from various organisations which included; government, NGOs, academia and private sector.
2
Sector and Technologies Selection In the year 2000, out of a total GHG 54.72 million tonnes, the largest contribution to emissions came from land use change and forestry at 73.7% followed by agriculture at 18.9%. Energy registered a low 4.8% followed by industrial processes and waste at 1.8% and 0.8%, respectively. Technology selection involved six steps. Step (i) involved selection of sectors. Since a lot of efforts involving multi stakeholder approach have been made in identification and assessments of sectors with potential for mitigation under the SNC, SNDP and NCCRS, the TNA project took advantage of the output from these processes and adopted measures identified from the same as part of creating synergies among programmes. For this reason, it was agreed at the inception meeting that sectors and subsectors and their corresponding technologies to be considered under TNA project be those elaborated under the country’s development efforts, arising from the processes mentioned above.
Subsequent steps in technology prioritisation for climate change mitigation are provided as follows; (ii) development of assessment framework, (iii) familiarization, identification and description of long list of mitigation technologies, (iv) identification of the preliminary list from the initial long list of mitigation technologies using ranking based on multi criteria analysis, (v) detailed assessment of preliminary lists of mitigation technologies to include costs assessment (capital cost and internal rate of return, marginal costing), and GHG reduction potential, and qualitative assessments of social economic and environmental considerations, (vi) prioritisation of final lists of mitigation technologies using Multi Criteria Analysis from the shortlisted number of technologies.
Long and preliminary lists The long list of technologies was formulated by the consultants from identified sectors in the SNC, SNDP and NCCRS to include energy; agriculture, land use change and forestry, and waste. Out of this list, a preliminary list under energy was selected as follows; (i) biofuels (biodiesel from jatropha, bioethanol from sugarcane, bioethanol from sweet sorghum, and maize, and biofuels from second generation), (ii) charcoal production (brick kiln, improved traditional kiln, and metal kiln), (iii) energy efficiency(energy management system, industrial and commercial end use, and household end use), (iv) electricity generation(biomass combustion, geothermal, wind energy, biomass waste water, PV utility and waste landfill, (v) improved cooking and heating and lighting devices (improved charcoal stoves, improved biomass institutional stoves, improved firewood stoves, biogas for cooking, and solar lanterns), (vi) off grid (small hydros, biomass gasifier, biogas digester, and small wind turbine).
List of preliminary projects from agriculture, land use change and forestry include; (i) agriculture (conservation tillage, development of green manure and cover crop for soil improvements, and control of weeds), (ii) land use change and forestry (afforestation and reforestation, improved biomass institutional stoves, improved charcoal stove, biomass gasification, retort kiln and metal kiln).
Detailed assessments The process was then followed by detailed assessment of preliminary lists of mitigation technologies aimed at producing fact sheets on each selected technology and quantitative analysis to include; costs assessment (capital cost and internal rate of return, marginal costing), and GHG reduction potential, and qualitative assessments of social economic and environmental considerations for both energy, and agriculture land use change and forestry based projects.
3
Prioritisation of technologies This process involved prioritisation of final list from the preliminary list using multi criteria analysis. The input data and information required for the prioritization of final list were obtained from detailed assessments including cost benefit analysis, and qualitative assessments of socio-economic and environmental consideration for each technology. Based on the results and also on agreement that the technology topping first in each sub sector is finally selected, the following technologies have finally been selected for further elaboration and these are; (i) Geothermal-electricity generation(ii) biodiesel from jatropha-biofuels (iii) Energy management systems-energy efficiency, (iv) Improved cooking stoves, (v) Improved charcoal production, (vi) Conservation agriculture-Agriculture land use change and forestry, and (vii) Under off-grid systems biomass gasifier was selected based on preliminary list assessment
The some of the technologies selected as priorities for TNA above will contribute to reduction of deforestation, which is the largest source of GHG emissions in Zambia. These technologies (geothermal electricity and off grid systems) will contribute to provision of electricity in rural areas, where currently electricity penetration rate is estimated at 4%. On the conservation side, technologies including improved cooking stoves and improved charcoal production (brick kiln) are also likely to contribute to reduction of deforestation. Further, conservation farming will reduce deforestation since there is no need to open new lands because productivity of land is maintained through addition of external nutrients coming from mineral and organic sources.
CHAPTER 1 INTRODUCTION
1. 1 About the TNA project
The successive agreements made between the Parties of the United Nations Framework Convention on Climate Change (UNFCCC) have highlighted the need to accelerate the transfer of environmentally-sound technologies to developing countries. Since the Seventh Conference of the Parties (COP), developing country Parties have been conducting Technology Needs Assessments (TNAs) in the areas of climate change mitigation and adaptation through an analysis that takes account of their development plans and strategies. The TNAs have been supported, guided and funded by the Global Environmental Facility (GEF).
Technology Needs Assessments are a set of country-driven activities that identify and determine the mitigation and adaptation technology priorities of developing countries and are central to the work of Parties to the Convention of technology transfer. They present an opportunity for countries to track their evolving need for new equipment, techniques, practical knowledge and skills necessary to mitigate GHG emissions and/or reduce the vulnerability of economic sectors and livelihoods to the adverse impacts of climate change.
The UNEP Division of Technology, Industry and Economics (DTIE) in collaboration with the UNEP Risoe Centre (URC) are providing targeted financial, technical and methodological support to assist a total of 36 countries, including Zambia, to conduct TNA projects. The main objectives of the project are;
4
• To identify and prioritize through country-driven participatory processes, technologies that can contribute to mitigation and adaptation goals of the participant countries, while meeting their national sustainable development goals and priorities
• To identify barriers hindering the acquisition, deployment, and diffusion of prioritized technologies
• To develop technology action plans (TAP) specifying activities and enabling frameworks to overcome the barriers and facilitate the transfer, adoption, and diffusion of selected technologies in the participant countries.
This report is focusing on objective 1.
1.2 Existing national policies about climate change mitigation and development priorities
1.2.1 Existing National Policies Related to Climate Change
1.2.1.1 General Policy on Environment
The general policy on environment covers some aspects of air quality and climate change. The main objective of this policy measure is “to minimize the adverse impact of climate change and to reduce air pollution and greenhouse gas emissions”(NPE, 2007). The guiding principles relevant to climate change under this policy measure are follows:
(i). The climate is a fundamental natural resource which, if not well managed, can become a major constraint to socio-economic development
(ii). Greenhouse gas emissions must be reduced and greenhouse gas sinks must be enhanced in order to prevent interference with the climate system
Further, the strategies relevant to climate change under this policy measure include;
(i). Support funding for research on air quality and climate change;
(ii). Develop and promote alternative energy sources to fuel-wood and technologies in order to reduce the use of fuel-wood and enhance carbon sinks;
(iii). Develop and enforce regulations regarding air emissions;
(iv). Strengthen the existing national climate and meteorological database and monitoring networks;
(v). Assess and monitor the potential impact of climate change on ecosystems.
(vi). Use climate data to help guide land use and economic development decisions;
(vii). Reduce gas emissions from the transport sector and the manufacturing industry
(viii). Environment awareness campaigns should include danger of uncontrolled bush fires and proper management of bush fires(NPE, 2007).
5
As part of the NCCRS development, the Climate Change Facilitation Unit (CCFU) has been developing a climate change policy which has now been completed and is awaiting approval by Cabinet.
1.2.1.2 Mitigation Measures/Options under the Sixth National Development Plan, Second National Communication and National Climate Change Response Strategy The Government of the Republic Zambia prepares five year development plans which serve as a guide to systematic planning aimed at achieving sustainable development. During the preparation of Sixth National Development Plan (SNDP)(2011-2015), the Government identified climate change as an important cross-cutting issue and was subsequently mainstreamed into the Plan. As part of the plan, climate change activities related to adaptation and mitigation were mainstreamed across economic, services and social sectors to include; (i) economic sectors-transport infrastructure, energy, agriculture , livestock and fisheries, mining, tourism, manufacturing, commerce and trade, and natural resource (ii) services- information and communication technology, science technology and innovation, and, (ii) social sectors - human health, gender, education, local government and decentralization.
In accordance with Article 8.2(c), of the United Nations Framework Convention on Climate Change (UNFCCC), Zambia has prepared its Second National Communication (SNC) and is awaiting approval by Cabinet. With the assistance from UNDP/GEF, a mitigation analysis study was undertaken as part of the preparation of the Second National Communication. Mitigation sectors identified were energy, agriculture, land use change and forestry, and waste. For each sector projects were identified and are provided as follows:
(i) Energy-(fuel Switch diesel/HFO to biodiesel, switch from petrol to ethanol , fuel switch coal to biomass, grid extension to isolated diesel, , switch diesel to biodiesel, switch from existing isolated diesel to mini hydro)
(ii) Agriculture-rural biogas, rural biomass and conservation farming
(iii) Land use change and forestry-electric stoves, improved charcoal and traditional woodstoves, improved charcoal production (improved traditional, brick, metal, and charcoal retort), biomass electricity, forestation/enhancement, and sustainable agriculture.
(iv) Waste-(Biomethanation and Landfill )
During preparation of the Sixth National Development Plan, the above mentioned projects were then integrated in the plan. Further, the National Climate Change Response Strategy (NCCRS) identified that the sectors associated with large GHG emissions in Zambia include; land-use (forestry and agriculture) and energy (road transport and industries (mining) primarily due to fossil fuel consumption). The following are some recommended mitigation measures in these sectors.
(i) Land use -Development and promotion of sustainable agricultural practices (e.g. CA) to discourage shifting cultivation (‘chitemene’), Promoting sustainable silviculture, e.g. by
6
mandating that commercial timber be produced from renewable planted woodlots, and Promoting the use of alternative energy technologies including those that use renewable biomass and biomass waste as fuel.
(ii) Transport-promotion of low-cost public transport modes such as bus rapid transit (BRT)56 and other means of mass transport; proper urban transport planning to facilitate efficient and low GHG modes of transportation; encouraging non-motorised modes of transport (NMT) by creating bikeways and pedestrian walkways in urban centres; creating transport demand management measures that encourage or favour public transport and NMT; creating a programme to phase out old and inefficient (high fuel-consuming) motor vehicles, while encouraging importation of efficient vehicles through tax incentives and other financial tools; creating awareness and possibly “car-pooling” policies through punitive taxes and charges, e.g. road and fuel levies to reduce unnecessary travel; strictly enforcing vehicle inspection rules to ensure motor vehicles are well maintained in order to reduce pollution; effective traffic management, which can reduce traffic congestion in urban areas and bring about significant environmental gains; and enacting a law that would compel vehicle owners to install pollution-control devices such as the three-way catalytic converter.
(iii) Energy-Developing renewable energy resource maps including wind-regimes and geothermal maps, and possibly, storing the information in an accessible location, e.g. a webportal, promoting rural electrification using solar photovoltaics and other solar technologies, enhanced investment in hydro electricity generation schemes, promoting the use of renewable biomass as an alternative energy source, promotion of energy efficiency and investing in a biofuel industry, covering the whole chain of biofuels (from the cultivation of crops to processing of fuels).
(iv) Mining-Fuel-switch, e.g. using electric conveyor systems as opposed to trucks for transportation of ores and other materials, Promotion of the use of renewable energy sources including renewable biomass, e.g. charcoal and firewood produced from renewable plantation forests and Promotion of energy efficiency (i.e. use of efficient technologies as well as process redesign to improve resource efficiency)
The SNC, SNDP, and NCCRS have provided a basis for identifying sectors and related mitigation measures/options for consideration under the TNA project.
1.2.2 Sustainable Development
1.2.2.1 General Definition The term, sustainable development, was popularized in Our Common Future, a report published by the World Commission on Environment and Development (WCED) in 1987. Also known as the Brundtland report, Our Common Future included the “classic” definition of sustainable development: “development which meets the needs of the present without compromising the ability of future generations to meet their own needs” (WCED, p. 43). Acceptance of the report by the United Nations (UN) General Assembly gave the term political salience; and in 1992 leaders set out the principles of sustainable development at
7
the UN Conference on Environment and Development (UNCED) in Rio de Janeiro, Brazil, also referred to as the Rio Summit and the Earth Summit (CEEEZ, 2005).
The many elements of sustainable development are often organised into three dimensions or pillars: environmental, economic and social. There are different approaches to how they relate to each other, whether they are pillars on the same level or three rather different but closely linked dimensions of sustainable development.
Economic sustainability assumes that economic development needs to occur without jeopardising the social and environmental dimensions of development. The bottom line is to ensure attainment of economic efficiency and improved rational use of natural resources as a key component of economic development, taking into account the equitable distribution of wealth in the society and the preservation of the ecosystem’s functions. Social sustainability assumes that economic and environmental dimensions must be defined by taking into account social considerations (i.e. intra- and inter – generational equity). Environment sustainability assumes that the economic and social dimensions of projects must be defined by considering environmental constraints. Of great importance is the interaction between global climate change and local or regional environmental problems such as air urban pollution, in-door pollution, acid rain, loss of biological diversity and land degradation. Such interaction reinforces the requirement of an integrated assessment of environmental sustainability when dealing with the definition of a climate change response strategy. This is another aspect of development where the concept of technological sustainability duly requires application.
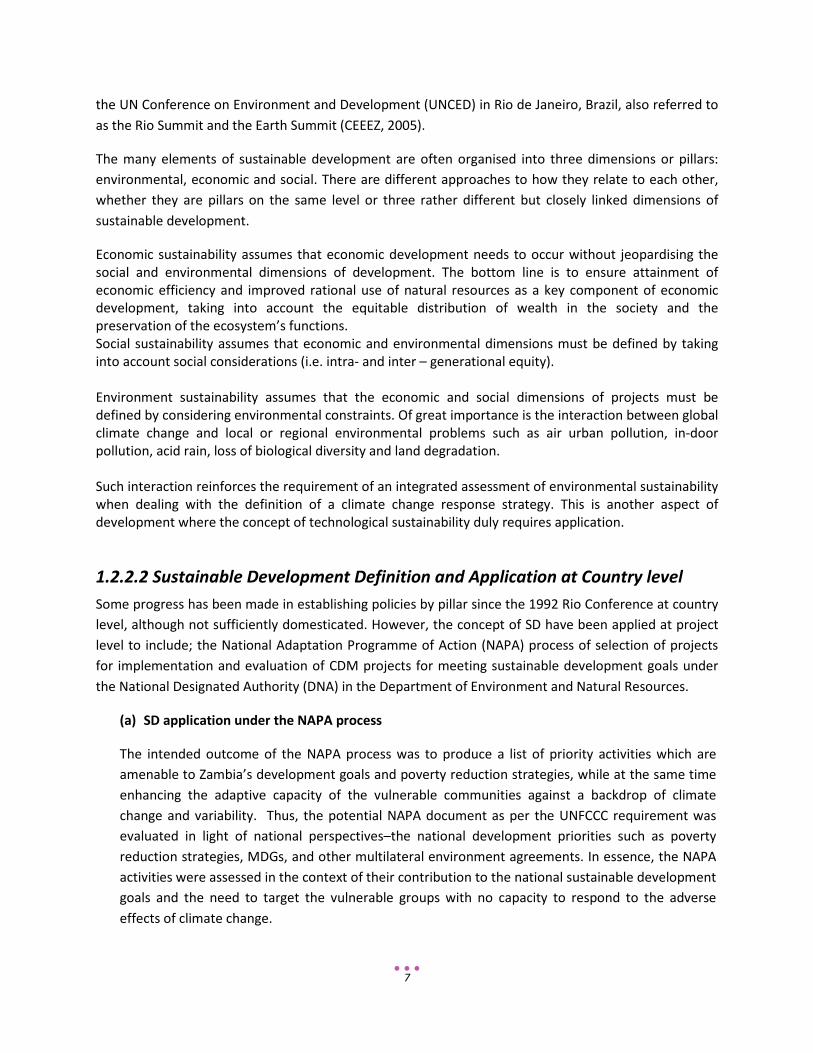
1.2.2.2 Sustainable Development Definition and Application at Country level Some progress has been made in establishing policies by pillar since the 1992 Rio Conference at country level, although not sufficiently domesticated. However, the concept of SD have been applied at project level to include; the National Adaptation Programme of Action (NAPA) process of selection of projects for implementation and evaluation of CDM projects for meeting sustainable development goals under the National Designated Authority (DNA) in the Department of Environment and Natural Resources.
(a) SD application under the NAPA process
The intended outcome of the NAPA process was to produce a list of priority activities which are amenable to Zambia’s development goals and poverty reduction strategies, while at the same time enhancing the adaptive capacity of the vulnerable communities against a backdrop of climate change and variability. Thus, the potential NAPA document as per the UNFCCC requirement was evaluated in light of national perspectives–the national development priorities such as poverty reduction strategies, MDGs, and other multilateral environment agreements. In essence, the NAPA activities were assessed in the context of their contribution to the national sustainable development goals and the need to target the vulnerable groups with no capacity to respond to the adverse effects of climate change.
8
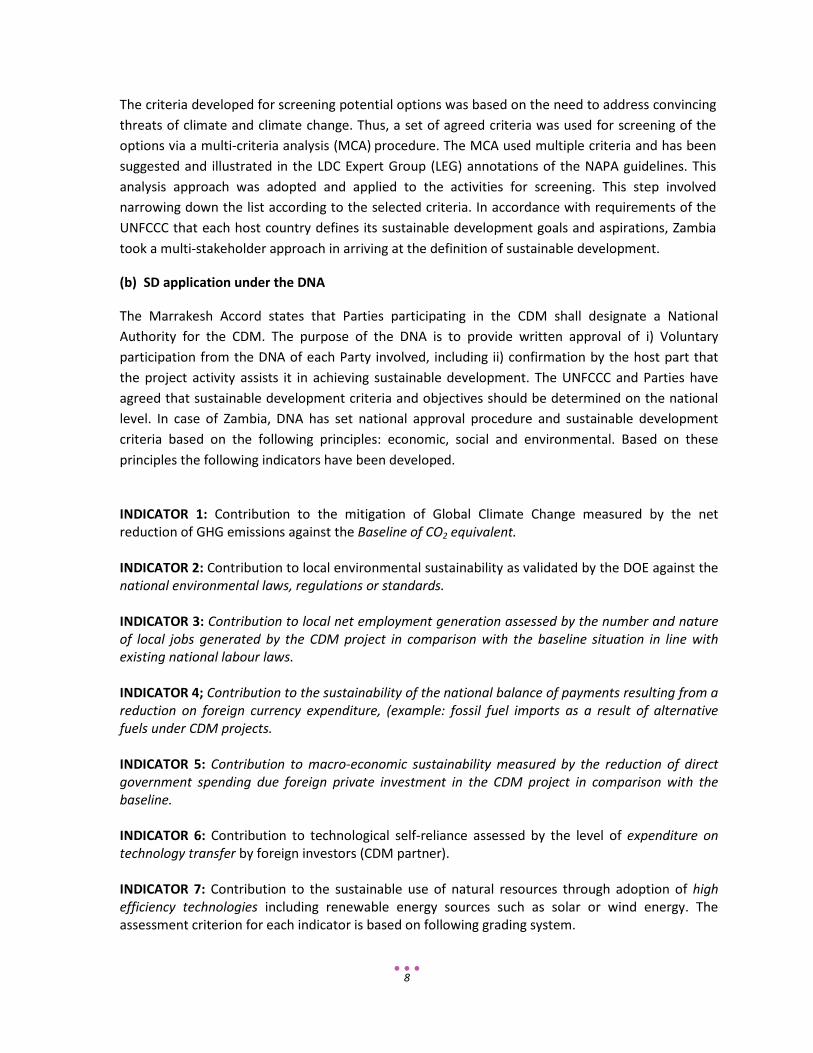
The criteria developed for screening potential options was based on the need to address convincing threats of climate and climate change. Thus, a set of agreed criteria was used for screening of the options via a multi-criteria analysis (MCA)
procedure. The MCA used multiple criteria and has been suggested and illustrated in the LDC Expert Group (LEG) annotations of the NAPA guidelines. This analysis approach was adopted and applied to the activities for screening. This step involved narrowing down the list according to the selected criteria. In accordance with requirements of the UNFCCC that each host country defines its sustainable development goals and aspirations, Zambia took a multi-stakeholder approach in arriving at the definition of sustainable development.
(b) SD application under the DNA
The Marrakesh Accord states that Parties participating in the CDM shall designate a National Authority for the CDM. The purpose of the DNA is to provide written approval of i) Voluntary participation from the DNA of each Party involved, including ii) confirmation by the host part that the project activity assists it in achieving sustainable development. The UNFCCC and Parties have agreed that sustainable development criteria and objectives should be determined on the national level. In case of Zambia, DNA has set national approval procedure and sustainable development criteria based on the following principles: economic, social and environmental. Based on these principles the following indicators have been developed.
INDICATOR 1: Contribution to the mitigation of Global Climate Change measured by the net reduction of GHG emissions against the Baseline of CO2 equivalent. INDICATOR 2: Contribution to local environmental sustainability as validated by the DOE against the national environmental laws, regulations or standards. INDICATOR 3: Contribution to local net employment generation assessed by the number and nature of local jobs generated by the CDM project in comparison with the baseline situation in line with existing national labour laws. INDICATOR 4; Contribution to the sustainability of the national balance of payments resulting from a reduction on foreign currency expenditure, (example: fossil fuel imports as a result of alternative fuels under CDM projects. INDICATOR 5: Contribution to macro-economic sustainability measured by the reduction of direct government spending due foreign private investment in the CDM project in comparison with the baseline. INDICATOR 6: Contribution to technological self-reliance assessed by the level of expenditure on technology transfer by foreign investors (CDM partner). INDICATOR 7: Contribution to the sustainable use of natural resources through adoption of high efficiency technologies including renewable energy sources such as solar or wind energy. The assessment criterion for each indicator is based on following grading system.

9
The same SD approach (used under NAPA project selection) has been used to prioritise technologies for moving forward under the TNA.
CHAPTER 2 INSTITUTIONAL ARRANGEMENT FOR THE TNA AND THE STAKEHOLDERS’ INVOLVEMENT
2.1 National TNA team
The national institutional set up for the TNA project consists of the national TNA coordinator, core team (steering committee), the consultants for Adaptation and Mitigation, and two working groups( one for mitigation and another for adaptation). The mitigation working group was further sub divided into four groups to deal with specialized sectors during selection of preliminary list of technologies. The consultant for TNA mitigation is Centre Energy, Environment and Engineering Zambia (CEEEZ) which was engaged through URC. The Mitigation working group was constituted in close collaboration with focal point and was made up of individuals from various organisations which included; government, NGOs, academia and private sector. A detailed list of working group members is provided on Annex I.
2.2 Stakeholder Engagement Process followed in TNA – Overall assessment
On 14th September 2011, the then Ministry of Local Government, Housing Early Education, and Environmental Protection (MLGHEEEP), which is now Ministry of Lands, Natural Resource and Environmental Protection (MLNEP) convened a national inception workshop aimed at introducing the project to stakeholders. At the workshop, the priority technologies for climate change mitigation and methodology for selection of preliminary and prioritised lists of mitigation and adaptation technologies/options were presented. The inception meeting provided a good opportunity for the focal point to identify institutions for possible inclusion into working groups. On 18th November 2011, Stakeholder Working Groups for both Mitigation and Adaptation were constituted. The role of the Stakeholder Working Group for Mitigation was to undertake the following:
(i) Prioritise preliminary lists of mitigation technologies using Multi Criteria Analysis from the long lists developed by the consultant(CEEEZ)
(ii) Detailed assessment of preliminary lists (from (i) above) of mitigation technologies to include costs assessment (capital cost and internal rate of return, marginal costing), and GHG reduction potential, and qualitative assessments of social economic and environmental considerations.
(iii) Prioritisation of final lists of mitigation technologies using Multi Criteria Analysis from the long lists developed in (ii) above
CHAPTER 3 SECTOR AND TECHNOLOGIES SELECTION
3.1 An overview of GHG emissions status and trends of the different sectors
GHG inventories for the year 2000 and 1994 were estimated and compared accordingly. Total GHG emissions increased by 6.2% from 51.52 million tonnes CO2 equiv in 1994 to 54.72 million tonnes CO2
equiv in 2000. In the year 2000, the largest contribution to GHG emissions came from land use change
10
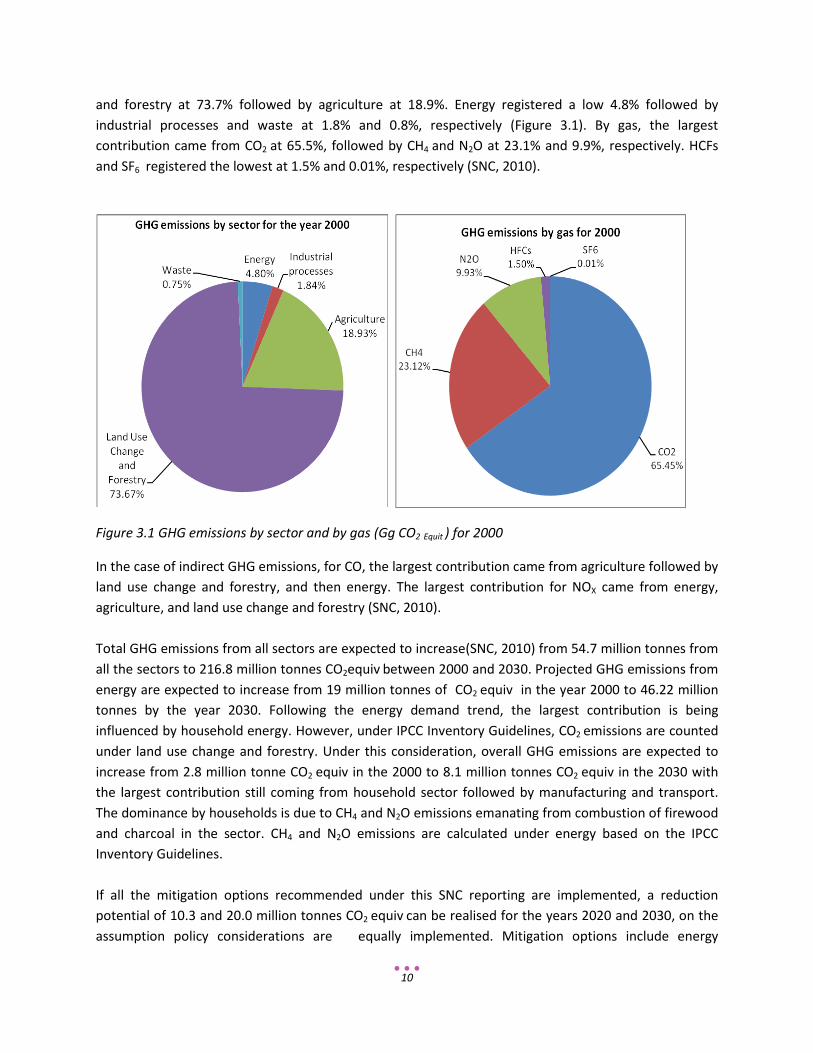
and forestry at 73.7% followed by agriculture at 18.9%. Energy registered a low 4.8% followed by industrial processes and waste at 1.8% and 0.8%, respectively (Figure 3.1). By gas, the largest contribution came from CO2 at 65.5%, followed by CH4 and N2O at 23.1% and 9.9%, respectively. HCFs and SF6 registered the lowest at 1.5% and 0.01%, respectively (SNC, 2010).
Figure 3.1 GHG emissions by sector and by gas (Gg CO2 Equit ) for 2000
In the case of indirect GHG emissions, for CO, the largest contribution came from agriculture followed by land use change and forestry, and then energy. The largest contribution for NOX came from energy, agriculture, and land use change and forestry (SNC, 2010). Total GHG emissions from all sectors are expected to increase(SNC, 2010) from 54.7 million tonnes from all the sectors to 216.8 million tonnes CO2equiv between 2000 and 2030. Projected GHG emissions from energy are expected to increase from 19 million tonnes of CO2 equiv in the year 2000 to 46.22 million tonnes by the year 2030. Following the energy demand trend, the largest contribution is being influenced by household energy. However, under IPCC Inventory Guidelines, CO2 emissions are counted under land use change and forestry. Under this consideration, overall GHG emissions are expected to increase from 2.8 million tonne CO2 equiv in the 2000 to 8.1 million tonnes CO2 equiv in the 2030 with the largest contribution still coming from household sector followed by manufacturing and transport. The dominance by households is due to CH4 and N2O emissions emanating from combustion of firewood and charcoal in the sector. CH4 and N2O emissions are calculated under energy based on the IPCC Inventory Guidelines. If all the mitigation options recommended under this SNC reporting are implemented, a reduction potential of 10.3 and 20.0 million tonnes CO2 equiv can be realised for the years 2020 and 2030, on the assumption policy considerations are equally implemented. Mitigation options include energy

11
management, promotion of renewable energy including biofuels, conservation farming through use of manure crops, and electricity generation from agriculture biomass and municipal solid and liquid organic waste (SNC, 2010).
3.2 Sector Selection
Since a lot of efforts involving multi stakeholder approach have been made in identification and assessments of sectors with potential for mitigation under the SNC, SNDP and NCCRS, the TNA project took advantage of the output from these processes and adopted measures identified from the same as part of creating synergies among programmes. For this reason, it was agreed at the inception meeting that sectors and subsectors and their corresponding technologies to be considered under TNA project be those elaborated under the country’s development efforts, arising from the processes mentioned above.
3.3 Process, criteria, and results of technology selection
This process involved selection and prioritisation of technologies for climate change mitigation as elaborated below.
Step 1: Identifying and categorising priority sector and subsectors (See section 3.2).
Step 2: Assessment framework proposed to stakeholders and agreed upon
Step 3: Familiarization, identification and description of long list of mitigation technologies (Annex II).
Step 4: Identification of the preliminary list from the initial long list of mitigation technologies using ranking based on multi criteria analysis.
Step 5: Detailed assessment of preliminary lists of mitigation technologies to include cost assessment, (capital cost and internal rate of return, marginal costing), where data available, and GHG reduction potential, and qualitative assessments of social economic and environmental considerations. Step 6: Prioritisation of final lists of mitigation technologies using Multi Criteria Analysis from the shortlisted number of technologies developed in Step 4.
For step 1. Selection of sectors and subsectors was based on inputs from SNC, SNDP and NCCRS, (see section 3.2)
Step 2: This step involved proposing a framework for selection of technologies based on the NAPA selection criteria process which used multi criteria analysis approach. The framework was discussed at length at and agreed upon at the inception workshop and first mitigation working group meeting. The meeting further also agreed on the indicators and weighting to be used in the MCA for assessment.
Under TNA process, technology prioritisation for mitigation in different sectors involved use of multi criteria analysis which takes account of sustainable development at a national level. The ranking

12
method used under TNA was a combination of Rating and Normal Ranking. Ranking is a systematic tool that allows the qualitative comparison of very different and interrelated policy priorities or preferences. In the case of sustainable development, ranking is useful for assisting policy makers come to a uniform decision on what should be prioritised.
The rating approach gives appropriate weighting to the three broadly agreed upon principles of sustainable development goals, namely economic, environmental and social. Indicators related to each of these principles can be identified in relation to the indicators agreed upon earlier. The normal approach can then weigh each indicator in each given category after which the total marks accrued will be proportionally related to a percentage of a given category. The TNA mitigation working group recommended the weighting for the main principles based on national development priorities. The weighting used under TNA is provided as follows:
• Economic 33.3% • Environmental 33.3% • Social 33.3%
The rationale behind such a weighting is that economic development should be carried out in an environmentally friendly manner and thus improve the social life. Regarding the weighting of indicators, the normal ranking criteria of between 1 and 9 was adopted. Given in Tables 3.1 and 3.2 is an example of the assessment of sustainable development indicators, and the overall assessment.
Table 3.1 Example of assessment for sustainable development based on the normal ranking methodology
INDICATOR
RANKING (NORMAL)
TOTA
L
1 3 5 7 9
Wea
kly
impo
rtan
t Le
ss
Impo
rtan
t
Mod
erat
ely
Impo
rtan
t M
ore
Impo
rtan
t Ex
trem
ely
Impo
rtan
t Economic Reducing the burden on the imports of energy and enhancing the balance of payment
√ 5
Increased investment in priority sectors of the economy √ 3 Contributing to competitiveness at a micro-level, like industry √ 9 Positive effects on the balance of payment √ 7 Improved sectoral productivity, growth and linkages leading to higher contribution to GDP
√ 7
Reduction of energy intensity (energy used per unit product) at a micro level
√ 7
Increasing share in the contribution of renewable energy to the energy supply mix at a macro-level
√ 9
Job creation √ 9 Sub – total 56 Total Maximum Score=Maximum score(9) *Number of indicators(8) 72
13
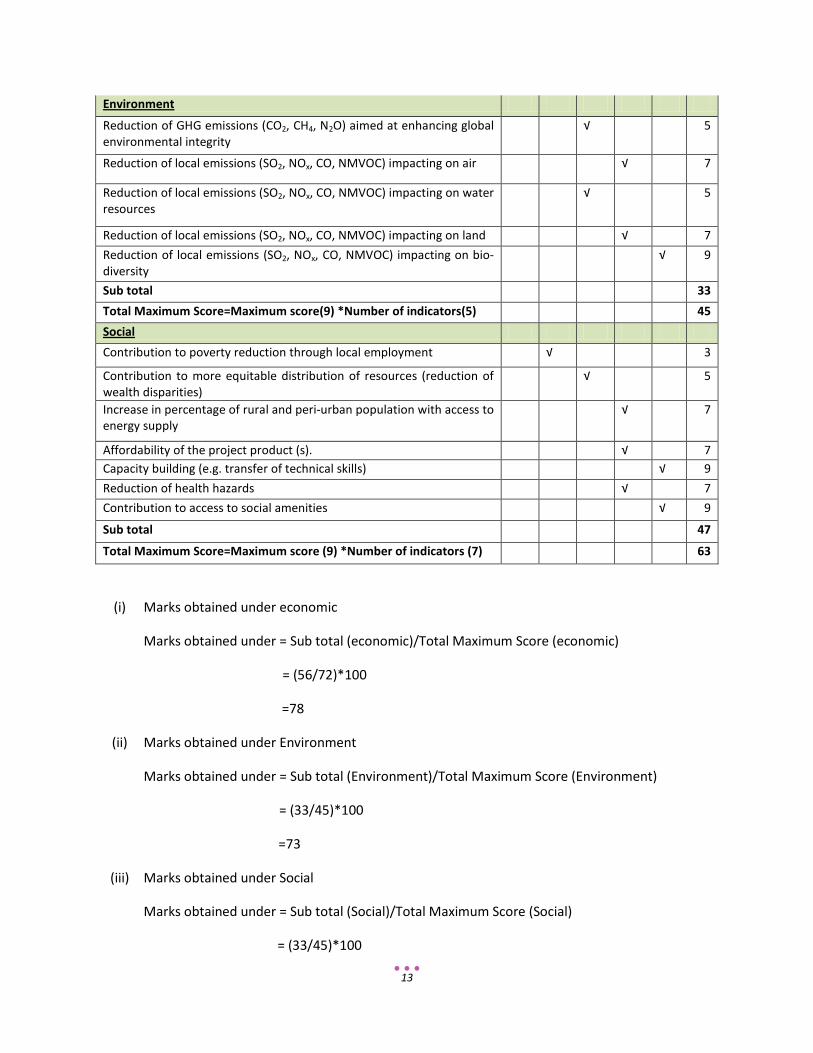
Environment
Reduction of GHG emissions (CO2, CH4, N2O) aimed at enhancing global environmental integrity
√ 5
Reduction of local emissions (SO2, NOx, CO, NMVOC) impacting on air √ 7
Reduction of local emissions (SO2, NOx, CO, NMVOC) impacting on water resources
√ 5
Reduction of local emissions (SO2, NOx, CO, NMVOC) impacting on land √ 7 Reduction of local emissions (SO2, NOx, CO, NMVOC) impacting on bio-diversity
√ 9
Sub total 33 Total Maximum Score=Maximum score(9) *Number of indicators(5) 45 Social Contribution to poverty reduction through local employment √ 3
Contribution to more equitable distribution of resources (reduction of wealth disparities)
√ 5
Increase in percentage of rural and peri-urban population with access to energy supply
√ 7
Affordability of the project product (s). √ 7 Capacity building (e.g. transfer of technical skills) √ 9 Reduction of health hazards √ 7 Contribution to access to social amenities √ 9
Sub total 47
Total Maximum Score=Maximum score (9) *Number of indicators (7) 63
(i) Marks obtained under economic
Marks obtained under = Sub total (economic)/Total Maximum Score (economic)
= (56/72)*100
=78
(ii) Marks obtained under Environment
Marks obtained under = Sub total (Environment)/Total Maximum Score (Environment)
= (33/45)*100
=73
(iii) Marks obtained under Social
Marks obtained under = Sub total (Social)/Total Maximum Score (Social)
= (33/45)*100
14
= 75
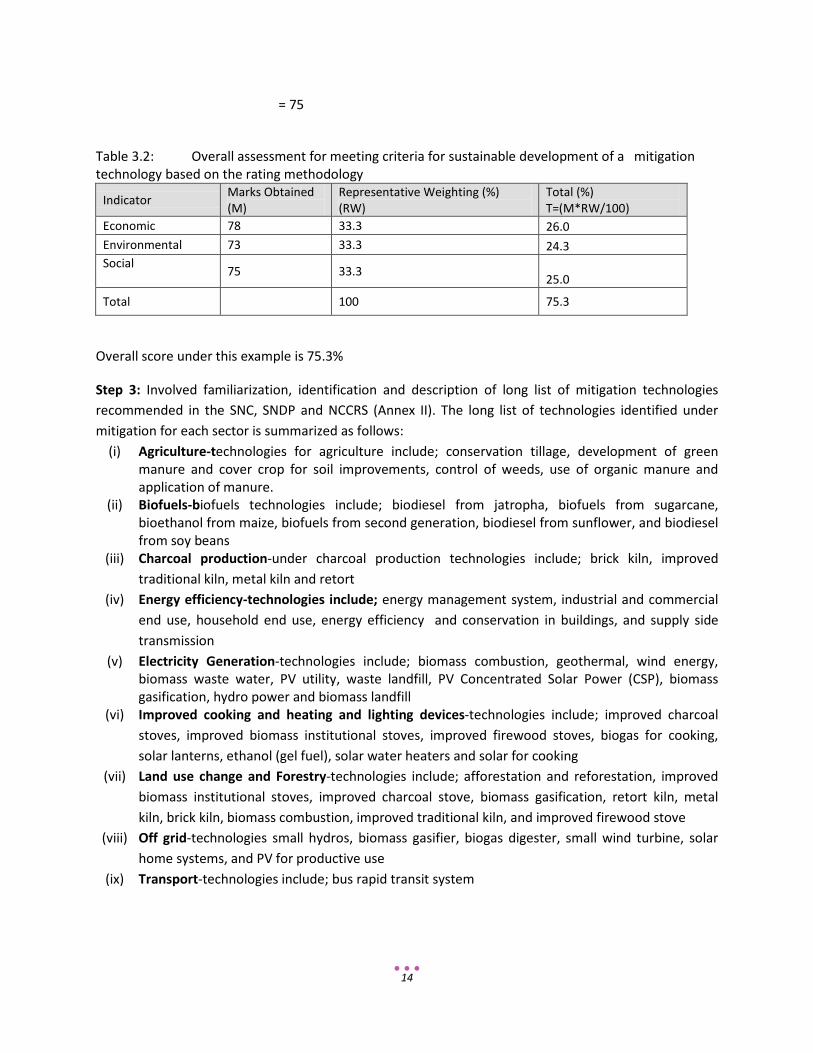
Table 3.2: Overall assessment for meeting criteria for sustainable development of a mitigation technology based on the rating methodology
Indicator Marks Obtained (M)
Representative Weighting (%) (RW)
Total (%) T=(M*RW/100)
Economic 78 33.3 26.0 Environmental 73 33.3 24.3 Social 75 33.3 25.0
Total 100 75.3
Overall score under this example is 75.3%
Step 3: Involved familiarization, identification and description of long list of mitigation technologies recommended in the SNC, SNDP and NCCRS (Annex II). The long list of technologies identified under mitigation for each sector is summarized as follows:
(i) Agriculture-technologies for agriculture include; conservation tillage, development of green manure and cover crop for soil improvements, control of weeds, use of organic manure and application of manure.
(ii) Biofuels-biofuels technologies include; biodiesel from jatropha, biofuels from sugarcane, bioethanol from maize, biofuels from second generation, biodiesel from sunflower, and biodiesel from soy beans
(iii) Charcoal production-under charcoal production technologies include; brick kiln, improved traditional kiln, metal kiln and retort
(iv) Energy efficiency-technologies include; energy management system, industrial and commercial end use, household end use, energy efficiency and conservation in buildings, and supply side transmission
(v) Electricity Generation-technologies include; biomass combustion, geothermal, wind energy, biomass waste water, PV utility, waste landfill, PV Concentrated Solar Power (CSP), biomass gasification, hydro power and biomass landfill
(vi) Improved cooking and heating and lighting devices-technologies include; improved charcoal stoves, improved biomass institutional stoves, improved firewood stoves, biogas for cooking, solar lanterns, ethanol (gel fuel), solar water heaters and solar for cooking
(vii) Land use change and Forestry-technologies include; afforestation and reforestation, improved biomass institutional stoves, improved charcoal stove, biomass gasification, retort kiln, metal kiln, brick kiln, biomass combustion, improved traditional kiln, and improved firewood stove
(viii) Off grid-technologies small hydros, biomass gasifier, biogas digester, small wind turbine, solar home systems, and PV for productive use
(ix) Transport-technologies include; bus rapid transit system
15
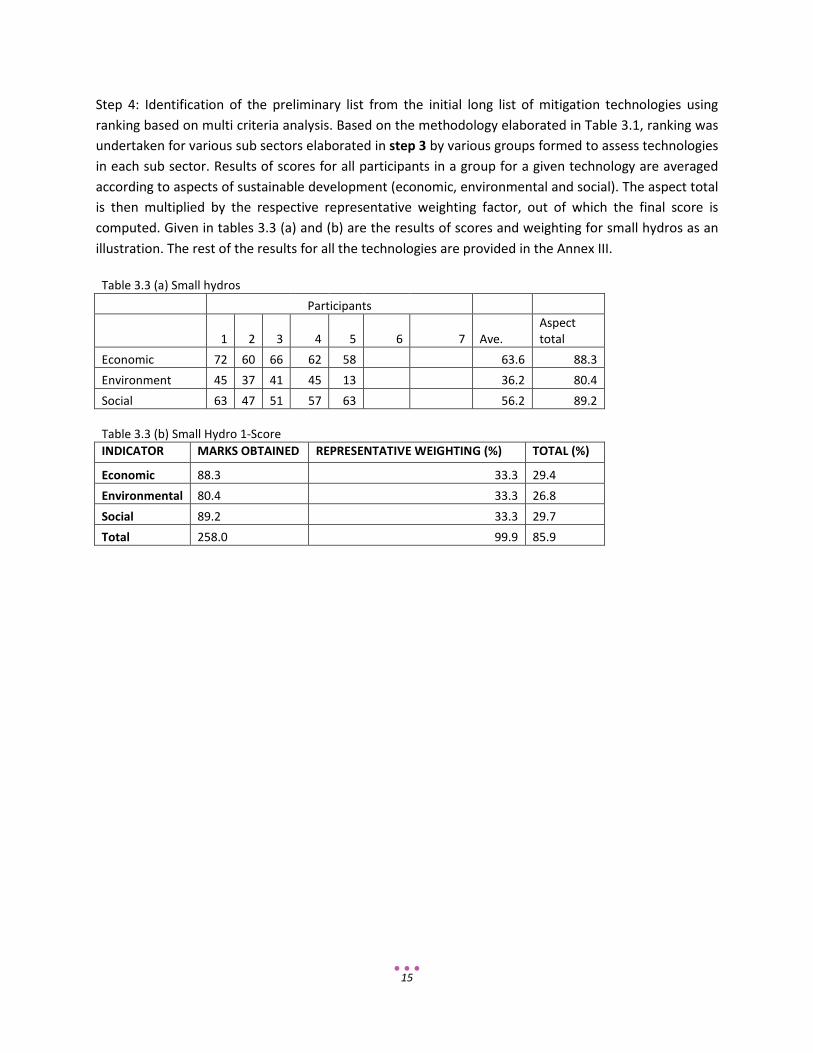
Step 4: Identification of the preliminary list from the initial long list of mitigation technologies using ranking based on multi criteria analysis. Based on the methodology elaborated in Table 3.1, ranking was undertaken for various sub sectors elaborated in step 3 by various groups formed to assess technologies in each sub sector. Results of scores for all participants in a group for a given technology are averaged according to aspects of sustainable development (economic, environmental and social). The aspect total is then multiplied by the respective representative weighting factor, out of which the final score is computed. Given in tables 3.3 (a) and (b) are the results of scores and weighting for small hydros as an illustration. The rest of the results for all the technologies are provided in the Annex III.
Table 3.3 (a) Small hydros Participants
1 2 3 4 5 6 7 Ave. Aspect total
Economic 72 60 66 62 58 63.6 88.3 Environment 45 37 41 45 13 36.2 80.4 Social 63 47 51 57 63 56.2 89.2 Table 3.3 (b) Small Hydro 1-Score
INDICATOR MARKS OBTAINED REPRESENTATIVE WEIGHTING (%) TOTAL (%)
Economic 88.3 33.3 29.4 Environmental 80.4 33.3 26.8 Social 89.2 33.3 29.7 Total 258.0 99.9 85.9
16
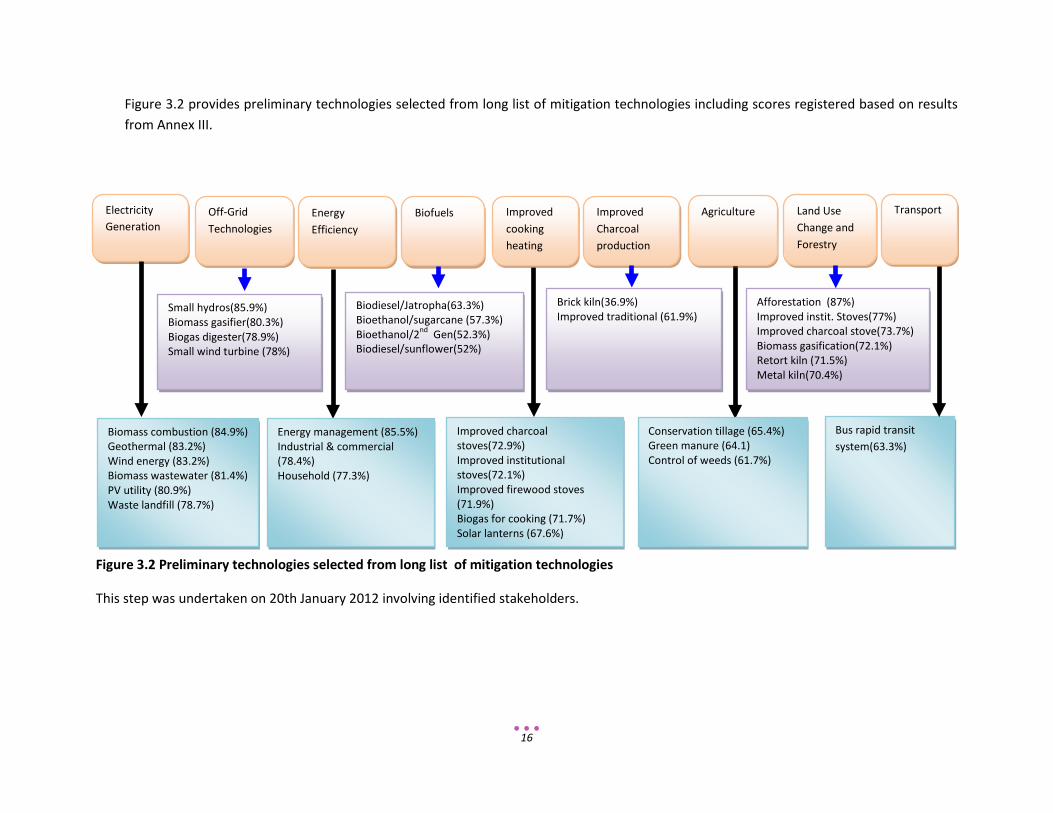
Figure 3.2 provides preliminary technologies selected from long list of mitigation technologies including scores registered based on results from Annex III.
Figure 3.2 Preliminary technologies selected from long list of mitigation technologies
This step was undertaken on 20th January 2012 involving identified stakeholders.
Electricity Generation
Biomass combustion (84.9%) Geothermal (83.2%) Wind energy (83.2%) Biomass wastewater (81.4%) PV utility (80.9%) Waste landfill (78.7%)
Small hydros(85.9%) Biomass gasifier(80.3%) Biogas digester(78.9%) Small wind turbine (78%)
Improved charcoal stoves(72.9%) Improved institutional stoves(72.1%) Improved firewood stoves (71.9%) Biogas for cooking (71.7%) Solar lanterns (67.6%)
Biodiesel/Jatropha(63.3%) Bioethanol/sugarcane (57.3%) Bioethanol/2nd Gen(52.3%) Biodiesel/sunflower(52%)
Conservation tillage (65.4%) Green manure (64.1) Control of weeds (61.7%)
Brick kiln(36.9%) Improved traditional (61.9%)
Bus rapid transit system(63.3%)
Afforestation (87%) Improved instit. Stoves(77%) Improved charcoal stove(73.7%) Biomass gasification(72.1%) Retort kiln (71.5%) Metal kiln(70.4%)
Off-Grid Technologies
Improved cooking heating
Agriculture Improved Charcoal production
Land Use Change and Forestry
Transport Biofuels
Energy management (85.5%) Industrial & commercial (78.4%) Household (77.3%)
Energy Efficiency
17
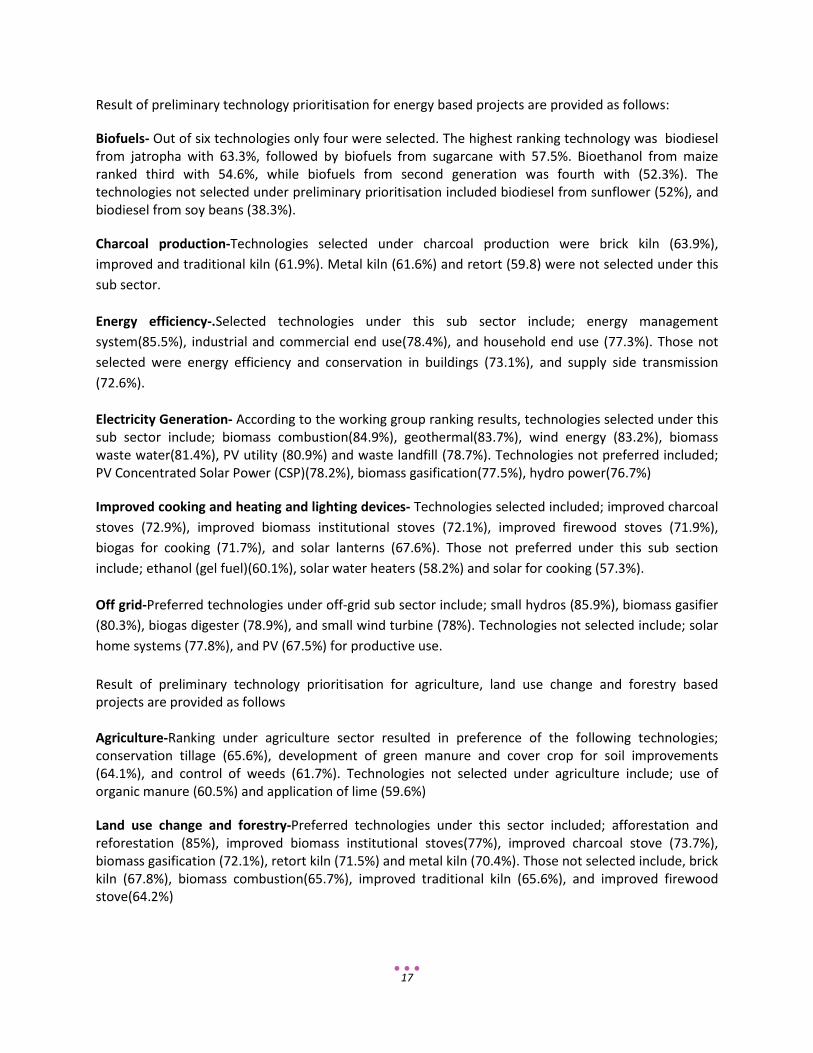
Result of preliminary technology prioritisation for energy based projects are provided as follows:
Biofuels- Out of six technologies only four were selected. The highest ranking technology was biodiesel from jatropha with 63.3%, followed by biofuels from sugarcane with 57.5%. Bioethanol from maize ranked third with 54.6%, while biofuels from second generation was fourth with (52.3%). The technologies not selected under preliminary prioritisation included biodiesel from sunflower (52%), and biodiesel from soy beans (38.3%).
Charcoal production-Technologies selected under charcoal production were brick kiln (63.9%), improved and traditional kiln (61.9%). Metal kiln (61.6%) and retort (59.8) were not selected under this sub sector.
Energy efficiency-.Selected technologies under this sub sector include; energy management system(85.5%), industrial and commercial end use(78.4%), and household end use (77.3%). Those not selected were energy efficiency and conservation in buildings (73.1%), and supply side transmission (72.6%).
Electricity Generation- According to the working group ranking results, technologies selected under this sub sector include; biomass combustion(84.9%), geothermal(83.7%), wind energy (83.2%), biomass waste water(81.4%), PV utility (80.9%) and waste landfill (78.7%). Technologies not preferred included; PV Concentrated Solar Power (CSP)(78.2%), biomass gasification(77.5%), hydro power(76.7%)
Improved cooking and heating and lighting devices- Technologies selected included; improved charcoal stoves (72.9%), improved biomass institutional stoves (72.1%), improved firewood stoves (71.9%), biogas for cooking (71.7%), and solar lanterns (67.6%). Those not preferred under this sub section include; ethanol (gel fuel)(60.1%), solar water heaters (58.2%) and solar for cooking (57.3%).
Off grid-Preferred technologies under off-grid sub sector include; small hydros (85.9%), biomass gasifier (80.3%), biogas digester (78.9%), and small wind turbine (78%). Technologies not selected include; solar home systems (77.8%), and PV (67.5%) for productive use.
Result of preliminary technology prioritisation for agriculture, land use change and forestry based projects are provided as follows
Agriculture-Ranking under agriculture sector resulted in preference of the following technologies; conservation tillage (65.6%), development of green manure and cover crop for soil improvements (64.1%), and control of weeds (61.7%). Technologies not selected under agriculture include; use of organic manure (60.5%) and application of lime (59.6%)
Land use change and forestry-Preferred technologies under this sector included; afforestation and reforestation (85%), improved biomass institutional stoves(77%), improved charcoal stove (73.7%), biomass gasification (72.1%), retort kiln (71.5%) and metal kiln (70.4%). Those not selected include, brick kiln (67.8%), biomass combustion(65.7%), improved traditional kiln (65.6%), and improved firewood stove(64.2%)
18
Step 5-Detailed assessment of preliminary lists of mitigation technologies to include costs assessment, (capital cost and internal rate of return, marginal costing), and GHG reduction potential, and qualitative assessments of social economic and environmental considerations for energy based projects, and agriculture land use change and forestry based projects are elaborated in chapters 4, and 5.
The technologies considered under energy are renewable energy electricity generation, off-grid, energy efficiency, biofuels, improved cooking devices and improved charcoal production. The technologies appearing for improving cooking devices and improved charcoal production under land use change and forestry have been categorized as energy. In view of the above, technologies for agriculture, land use change and forestry which are non-market based are categorized in one group for the purpose of assessment. The same goes for projects appearing under waste which have been categorized under energy. In this case therefore, there are only two sectors being considered for assessments, energy which is market based and agriculture and land use change which is non market based.
CHAPTER 4 TECHNOLOGY PRIORITIZATION FOR ENERGY BASED TECHNOLOGIES 4.1 GHG emissions and existing technologies for Energy Based Projects GHG emissions from energy based projects are coming from energy and some aspect of agriculture and land use change and forestry. Depending on the application, the baseline for technologies for energy based projects for on-grid is the Southern African Power Pool emission factor, which has been calculated and approved by the CDM Executive Board of the UNFCCC. Its operationalisation is awaiting approval from SADC DNAs. In the case of off-grid systems, the baseline is predominantly diesel.
4.2 An overview of possible mitigation technology options in Energy and their mitigation benefits
4.2.1 Energy Based Projects
4.2.1.1 Renewable Energy Electricity Generation Technologies This section provides detailed assessments of renewable energy technologies for electricity generation for the following biomass combustion, geothermal, wind energy, biomass wastewater and PV Utility. The technical indicators considered are an internal rate of return of 10%, investment costs, operations and maintenance cost, Net Present Value, payback period, marginal costing, tariff, and GHG reduction.
19
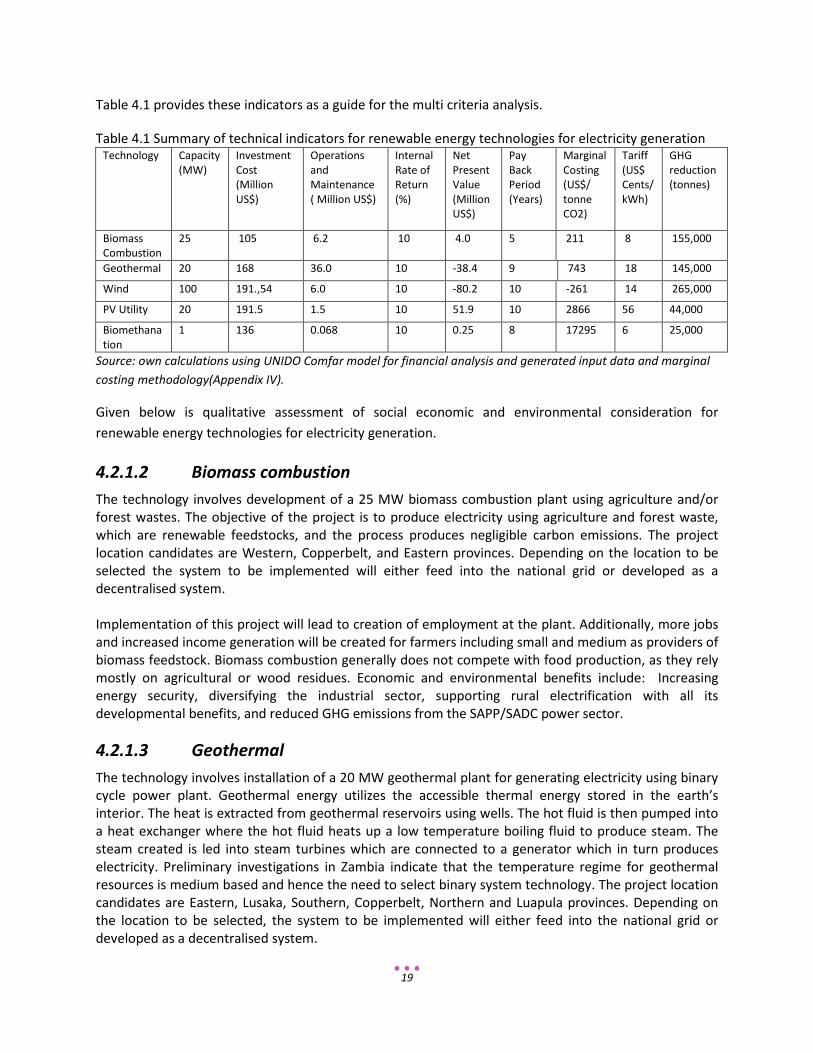
Table 4.1 provides these indicators as a guide for the multi criteria analysis.
Table 4.1 Summary of technical indicators for renewable energy technologies for electricity generation Technology Capacity
(MW) Investment Cost (Million US$)
Operations and Maintenance ( Million US$)
Internal Rate of Return (%)
Net Present Value (Million US$)
Pay Back Period (Years)
Marginal Costing (US$/ tonne CO2)
Tariff (US$ Cents/kWh)
GHG reduction (tonnes)
Biomass Combustion
25 105 6.2 10 4.0 5 211 8 155,000
Geothermal 20 168 36.0 10 -38.4 9 743 18 145,000
Wind 100 191.,54 6.0 10 -80.2 10 -261 14 265,000
PV Utility 20 191.5 1.5 10 51.9 10 2866 56 44,000
Biomethanation
1 136 0.068 10 0.25 8 17295 6 25,000
Source: own calculations using UNIDO Comfar model for financial analysis and generated input data and marginal costing methodology(Appendix IV).
Given below is qualitative assessment of social economic and environmental consideration for renewable energy technologies for electricity generation.
4.2.1.2 Biomass combustion The technology involves development of a 25 MW biomass combustion plant using agriculture and/or forest wastes. The objective of the project is to produce electricity using agriculture and forest waste, which are renewable feedstocks, and the process produces negligible carbon emissions. The project location candidates are Western, Copperbelt, and Eastern provinces. Depending on the location to be selected the system to be implemented will either feed into the national grid or developed as a decentralised system. Implementation of this project will lead to creation of employment at the plant. Additionally, more jobs and increased income generation will be created for farmers including small and medium as providers of biomass feedstock. Biomass combustion generally does not compete with food production, as they rely mostly on agricultural or wood residues. Economic and environmental benefits include: Increasing energy security, diversifying the industrial sector, supporting rural electrification with all its developmental benefits, and reduced GHG emissions from the SAPP/SADC power sector.
4.2.1.3 Geothermal The technology involves installation of a 20 MW geothermal plant for generating electricity using binary cycle power plant. Geothermal energy utilizes the accessible thermal energy stored in the earth’s interior. The heat is extracted from geothermal reservoirs using wells. The hot fluid is then pumped into a heat exchanger where the hot fluid heats up a low temperature boiling fluid to produce steam. The steam created is led into steam turbines which are connected to a generator which in turn produces electricity. Preliminary investigations in Zambia indicate that the temperature regime for geothermal resources is medium based and hence the need to select binary system technology. The project location candidates are Eastern, Lusaka, Southern, Copperbelt, Northern and Luapula provinces. Depending on the location to be selected, the system to be implemented will either feed into the national grid or developed as a decentralised system.
20
This technology requires no fuel, and is therefore immune to fuel cost fluctuations. Geothermal electricity production has been successfully developed in regions with hydrothermal manifestations (e.g., geysers and hot springs). For example the rift valley where Kenya is currently producing electricity around 250 MW. Zambia lies in the rift valley and has similar manifestations like Kenya and therefore has good potential which warrants serious investigations. Geothermal power is a stable source of energy as it is independent of weather circumstances. It is therefore a reliable source of energy and commonly has a high capacity factor of between 70 and 90% of installed capacity, which makes it applicable for both base and peak load. Geothermal power production has the environmental benefit of being a relatively clean technology. It also contributes to greenhouse gas emission reduction.
4.2.1.4 Wind energy The technology involves installation of a 100 MW wind energy park for producing electricity on-shore. On-shore wind technologies are commercial technologies with global applications and are suitable for Zambia. For them to operate optimally, they need to have an average wind speed of more than 7 metres per second at 50m height. Zambia has some hotspots which have been identified with wind speeds between 6-9 m/s, and warrant further investigations. The project location candidates are Chongwe, Muchinga Escarpment, and Western Province. Depending on the location to be selected the system to be implemented will either feed into the national grid or developed as a decentralised system.
4.2.1.5 Biomass wastewater The technology involves the capture of CH4 through anaerobic digestion from sewerage ponds and generate electricity in a gas generator. The reactors to be installed will remove the organic material in the sludge, and hence reduce COD and subsequent CH4 fugitive emissions. The Project covers construction of three reactors and purchase of 1.0 MW gas generator. The project location candidate is Manchinchi wastewater treatment plant belonging to Lusaka Water and Sewerage Company. The electricity produced will be used internally and surplus sold to the national grid through Zesco. Economic benefits include; profitability of sustainability of a Water Utilities through saving of electricity bills; environmental through reduction of odour in surrounding locations. The challenge with this technology is awareness and information programme required.
4.2.1.6 PV Utility The technology involves installation of 20 MW PV utility to produce electricity using the technology based on solar cells which converts solar radiation directly into electricity. This technology can be used at Utility-scale level, sometimes called “central station PV,” which acts more like a power plant, producing electricity that is fed into the national grid. The project location candidates are Luapula, Northern, Muchinga, Central and Western provinces. Depending on the location to be selected, the system to be implemented will either feed into the national grid or developed as a decentralised system. No fuel, and is therefore immune to fuel cost fluctuations. Solar PV systems, once manufactured, are closed systems. During operation and electricity production, they require no inputs such as fuels. They are silent and vibration free. The main environmental impacts of solar cells are related to their production and decommissioning. Solar PV has a very low lifecycle cost of pollution per kilowatt-hour (compared to other technologies). Solar PV can play a significant role in climate change mitigation since it has a lower GHG emissions lifecycle in the order of 30 to 70 gCO2e/kWh against more than 900 gCO2e/kWh for coal, and more than 400 gCO2e/kWh for gas. It has a
21
capacity factor of 15-27%. Resource potential is known in Zambia. A significant problem with solar power is high investment cost and higher levelised costs compared to other technologies.
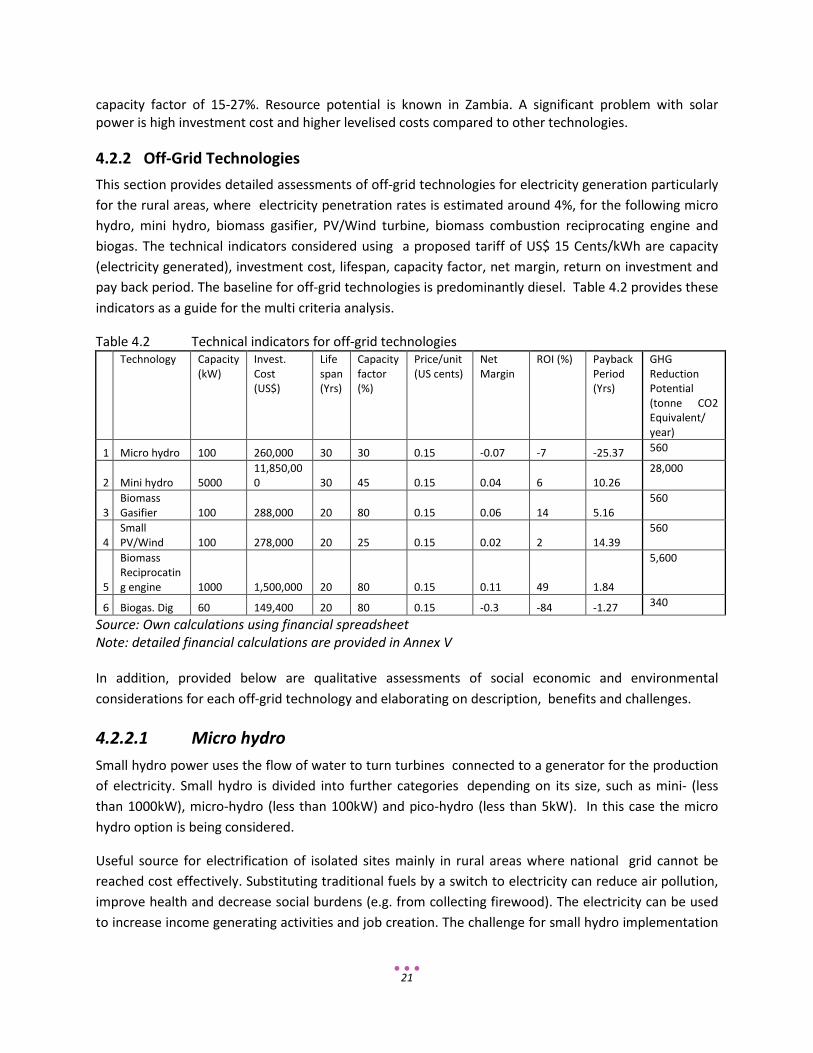
4.2.2 Off-Grid Technologies This section provides detailed assessments of off-grid technologies for electricity generation particularly for the rural areas, where electricity penetration rates is estimated around 4%, for the following micro hydro, mini hydro, biomass gasifier, PV/Wind turbine, biomass combustion reciprocating engine and biogas. The technical indicators considered using a proposed tariff of US$ 15 Cents/kWh are capacity (electricity generated), investment cost, lifespan, capacity factor, net margin, return on investment and pay back period. The baseline for off-grid technologies is predominantly diesel. Table 4.2 provides these indicators as a guide for the multi criteria analysis.
Table 4.2 Technical indicators for off-grid technologies
Technology Capacity (kW)
Invest. Cost (US$)
Life span (Yrs)
Capacity factor (%)
Price/unit (US cents)
Net Margin
ROI (%) Payback Period (Yrs)
GHG Reduction Potential (tonne CO2 Equivalent/ year)
1 Micro hydro 100 260,000 30 30 0.15 -0.07 -7 -25.37 560
2 Mini hydro 5000 11,850,000 30 45 0.15 0.04 6 10.26
28,000
3 Biomass Gasifier 100 288,000 20 80 0.15 0.06 14 5.16
560
4 Small PV/Wind 100 278,000 20 25 0.15 0.02 2 14.39
560
5
Biomass Reciprocating engine 1000 1,500,000 20 80 0.15 0.11 49 1.84
5,600
6 Biogas. Dig 60 149,400 20 80 0.15 -0.3 -84 -1.27 340
Source: Own calculations using financial spreadsheet Note: detailed financial calculations are provided in Annex V In addition, provided below are qualitative assessments of social economic and environmental considerations for each off-grid technology and elaborating on description, benefits and challenges.
4.2.2.1 Micro hydro Small hydro power uses the flow of water to turn turbines connected to a generator for the production of electricity. Small hydro is divided into further categories depending on its size, such as mini- (less than 1000kW), micro-hydro (less than 100kW) and pico-hydro (less than 5kW). In this case the micro hydro option is being considered.
Useful source for electrification of isolated sites mainly in rural areas where national grid cannot be reached cost effectively. Substituting traditional fuels by a switch to electricity can reduce air pollution, improve health and decrease social burdens (e.g. from collecting firewood). The electricity can be used to increase income generating activities and job creation. The challenge for small hydro implementation
22
is the need to have innovative financing mechanism aimed at leveraging the relatively higher electricity generating costs compared to big hydro.
4.2.2.2 Mini hydro Small hydro power uses the flow of water to turn turbines connected to a generator for the production of electricity. Small hydro is divided into further categories depending on its size, such as mini- (less than 1000kW), micro-hydro (less than 100kW) and pico-hydro (less than 5kW). In this case the mini hydro option is being considered.
Useful source for electrification of isolated sites mainly in rural areas where national grid cannot be reached cost effectively. It may provide an extra contribution to national electrical production for peak demand. Substituting traditional fuels by a switch to electricity can reduce air pollution, improve health and decrease social burdens (e.g. from collecting firewood). The electricity can be used to increase income generating activities and job creation.
The challenge for small hydro implementation is the need to have innovative financing mechanism aimed at leveraging the relatively higher electricity generating costs compared to big hydro.
4.2.2.3 Biomass Gasifier Biomass gasification for off grid applications involves production of gaseous fuel called producer gas used in a gas engines, or modified gasoline and diesel internal combustion engines for electricity generation. Producer gas can also be used to produce steam which is then expanded on a steam reciprocating internal engine to produce electricity.
Besides providing electricity to isolated areas in rural areas and associated benefits, it creates additional employment for feedstock providers who are mostly small and medium scale farmers. The challenge for biomass gasification implementation is lack of awareness for sensitizing policy makers and financial providers on the potential of the technology, and innovative financing mechanism aimed at leveraging the relatively higher electricity generating costs compared to other traditional energy supply systems.
4.2.2.4 PV/Wind Turbine PV/wind hybrids can be found in a wide range of applications including off-grid power; either PV directly charging a storage battery or in combination with wind turbine to cover intermittent periods when there is little or no wind, respectively. Small scale hybrid power wind rating applications range; less than 1000W(battery charging and light seasonal loads), 1-30kW (residential and heavy seasonal loads), and 30-300kW(farms and remote communities. Small PV/wind may be cost effective depending on the costs of alternate off-grid technologies and fuel prices; however the overall contribution of small PV/wind to climate change mitigation will probably be limited due to the long payback periods and is also limited by the very small amount of GHG reduced
Challenges include need to have awareness and information programme for sensitising policy makers and financial providers on the potential of the technology and innovative financing mechanism aimed
23
at leveraging the relatively higher electricity generating costs compared to other traditional energy supply systems.
4.2.2.5 Biomass Combustion/Reciprocating Engine This technology involves use of biomass which comes in various forms such as wood from conventional and short-rotation forestry, other energy crops, residues from forestry and agricultural production for production of electricity and if required heat for various process applications.
Biomass is an interesting option for electricity due to its abundance and availability in Africa including Zambia. It can contribute to job creation at the plant, more jobs and increased income generation for farmers including small and medium as providers of biomass feedstock. Biomass combustion generally does not compete with food production, as they rely mostly on agricultural or wood residues. Economic and environmental benefits include; diversifying the small scale industry in rural areas, supporting rural electrifications with all its developmental benefits, and reduced GHG emissions. The biggest challenge is awareness and information of the readily availability of these technologies by various stakeholders to include: policy makers, private sector, NGOs, and financial institutions.
4.2.2.6 Biogas Biogas is generated during anaerobic digestion processes using waste water, solid waste, organic waste, (e.g. animal manure), and other sources of biomass. It can be used in a gas engine and modified gasoline, or diesel internal combustion engine for electricity generation or used to produce steam which is then expanded on a steam reciprocating internal engine to produce electricity. Benefits include; (i) social (smoke-free and ash-free kitchen, so women and their children are no longer prone to respiratory infections; women are spared the burden of gathering firewood), (ii) environmental (improves sanitation, reduce deforestation levels, where people heavily rely on woodfuel,, sludge remaining after digestion is a good fertilizer, contributing to climate mitigation (a single, small scale bio-digester reduces between 3 and 5 tCO2-eq./year), substituting kerosene and firewood. Challenges include need to have awareness and information programme for sensitizing policy makers and financial providers on the potential of the technology, and innovative financing mechanism aimed at leveraging the relatively higher electricity generating costs compared to other traditional energy supply systems.
4.2.3 Energy Efficiency This section provides assessments of energy efficiency, a win-win option aimed at reducing energy demand and intensity. The energy efficiency technologies under consideration are energy management systems, Industrial and commercial end-use energy efficiency (for commercial/industrial and mining) and household end-use energy efficiency. The technical indicators considered are net specific energy costs for implementing the measure and simple payback period. The baseline for energy efficiency is SAPP emission factor. Table 4.3 provides these indicators as a guide for the multi criteria analysis.
24
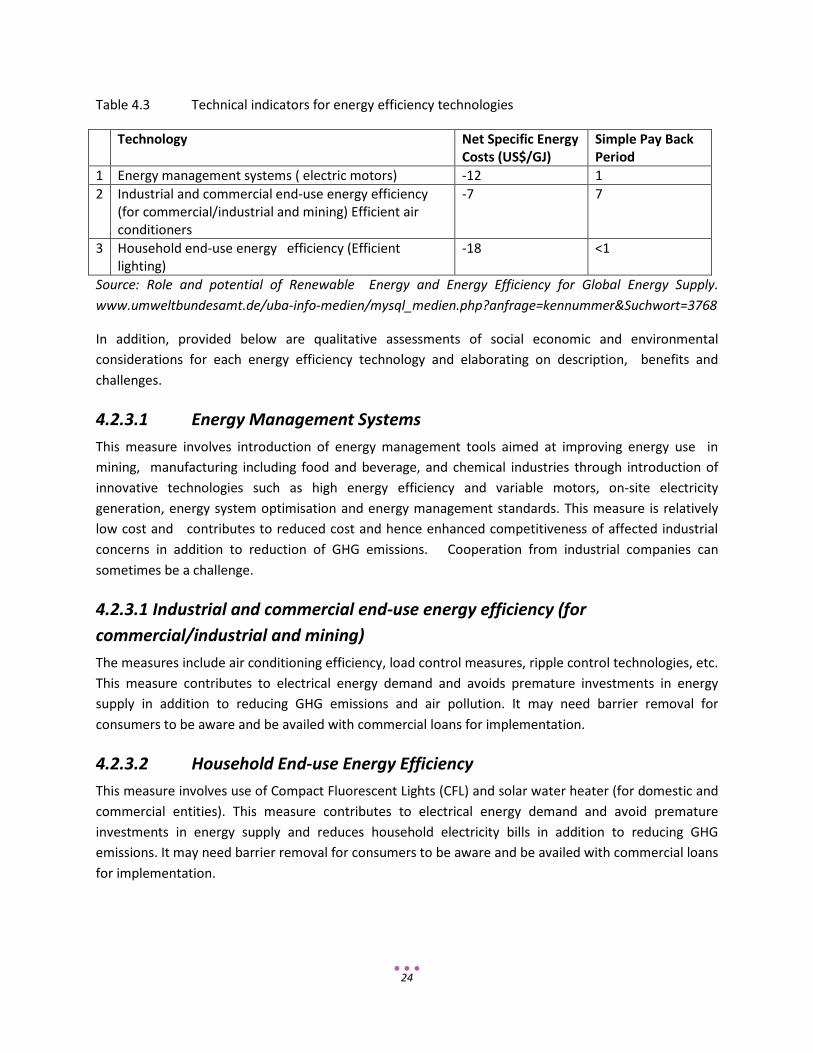
Table 4.3 Technical indicators for energy efficiency technologies
Technology Net Specific Energy Costs (US$/GJ)
Simple Pay Back Period
1 Energy management systems ( electric motors) -12 1 2 Industrial and commercial end-use energy efficiency
(for commercial/industrial and mining) Efficient air conditioners
-7 7
3 Household end-use energy efficiency (Efficient lighting)
-18 <1
Source: Role and potential of Renewable Energy and Energy Efficiency for Global Energy Supply. www.umweltbundesamt.de/uba-info-medien/mysql_medien.php?anfrage=kennummer&Suchwort=3768
In addition, provided below are qualitative assessments of social economic and environmental considerations for each energy efficiency technology and elaborating on description, benefits and challenges.
4.2.3.1 Energy Management Systems This measure involves introduction of energy management tools aimed at improving energy use in mining, manufacturing including food and beverage, and chemical industries through introduction of innovative technologies such as high energy efficiency and variable motors, on-site electricity generation, energy system optimisation and energy management standards. This measure is relatively low cost and contributes to reduced cost and hence enhanced competitiveness of affected industrial concerns in addition to reduction of GHG emissions. Cooperation from industrial companies can sometimes be a challenge.
4.2.3.1 Industrial and commercial end-use energy efficiency (for commercial/industrial and mining) The measures include air conditioning efficiency, load control measures, ripple control technologies, etc. This measure contributes to electrical energy demand and avoids premature investments in energy supply in addition to reducing GHG emissions and air pollution. It may need barrier removal for consumers to be aware and be availed with commercial loans for implementation.
4.2.3.2 Household End-use Energy Efficiency This measure involves use of Compact Fluorescent Lights (CFL) and solar water heater (for domestic and commercial entities). This measure contributes to electrical energy demand and avoid premature investments in energy supply and reduces household electricity bills in addition to reducing GHG emissions. It may need barrier removal for consumers to be aware and be availed with commercial loans for implementation.
25
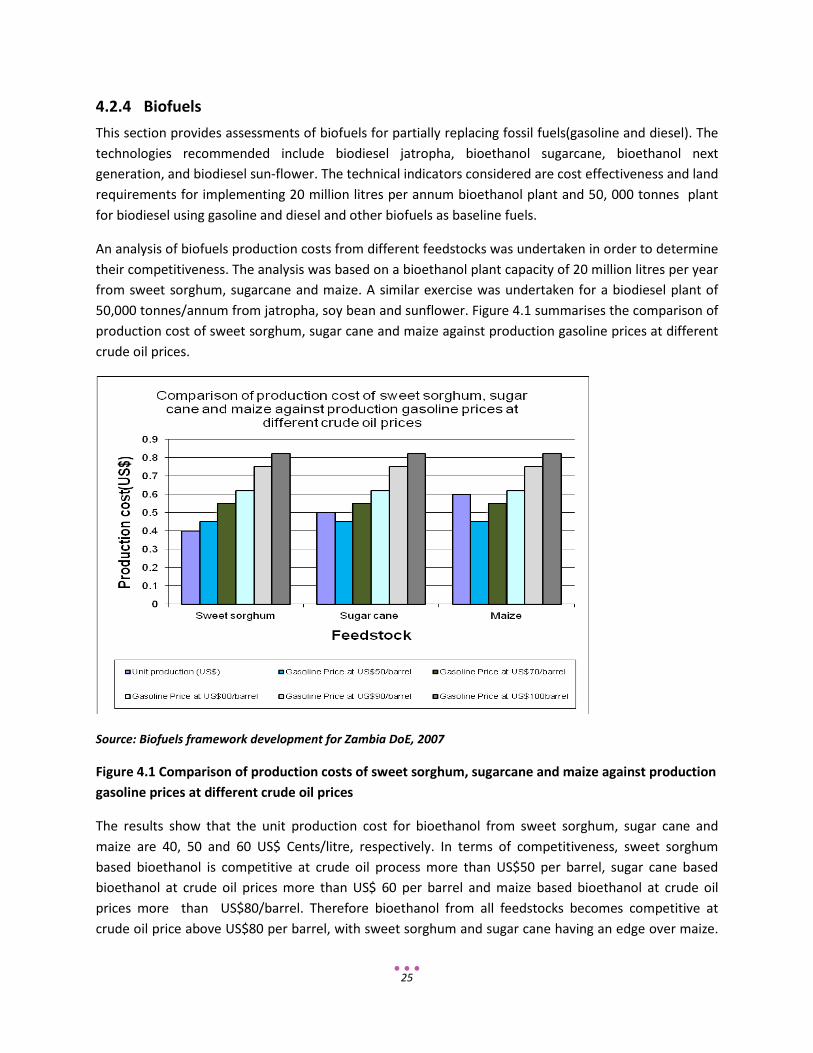
4.2.4 Biofuels This section provides assessments of biofuels for partially replacing fossil fuels(gasoline and diesel). The technologies recommended include biodiesel jatropha, bioethanol sugarcane, bioethanol next generation, and biodiesel sun-flower. The technical indicators considered are cost effectiveness and land requirements for implementing 20 million litres per annum bioethanol plant and 50, 000 tonnes plant for biodiesel using gasoline and diesel and other biofuels as baseline fuels.
An analysis of biofuels production costs from different feedstocks was undertaken in order to determine their competitiveness. The analysis was based on a bioethanol plant capacity of 20 million litres per year from sweet sorghum, sugarcane and maize. A similar exercise was undertaken for a biodiesel plant of 50,000 tonnes/annum from jatropha, soy bean and sunflower. Figure 4.1 summarises the comparison of production cost of sweet sorghum, sugar cane and maize against production gasoline prices at different crude oil prices.
Source: Biofuels framework development for Zambia DoE, 2007
Figure 4.1 Comparison of production costs of sweet sorghum, sugarcane and maize against production gasoline prices at different crude oil prices
The results show that the unit production cost for bioethanol from sweet sorghum, sugar cane and maize are 40, 50 and 60 US$ Cents/litre, respectively. In terms of competitiveness, sweet sorghum based bioethanol is competitive at crude oil process more than US$50 per barrel, sugar cane based bioethanol at crude oil prices more than US$ 60 per barrel and maize based bioethanol at crude oil prices more than US$80/barrel. Therefore bioethanol from all feedstocks becomes competitive at crude oil price above US$80 per barrel, with sweet sorghum and sugar cane having an edge over maize.
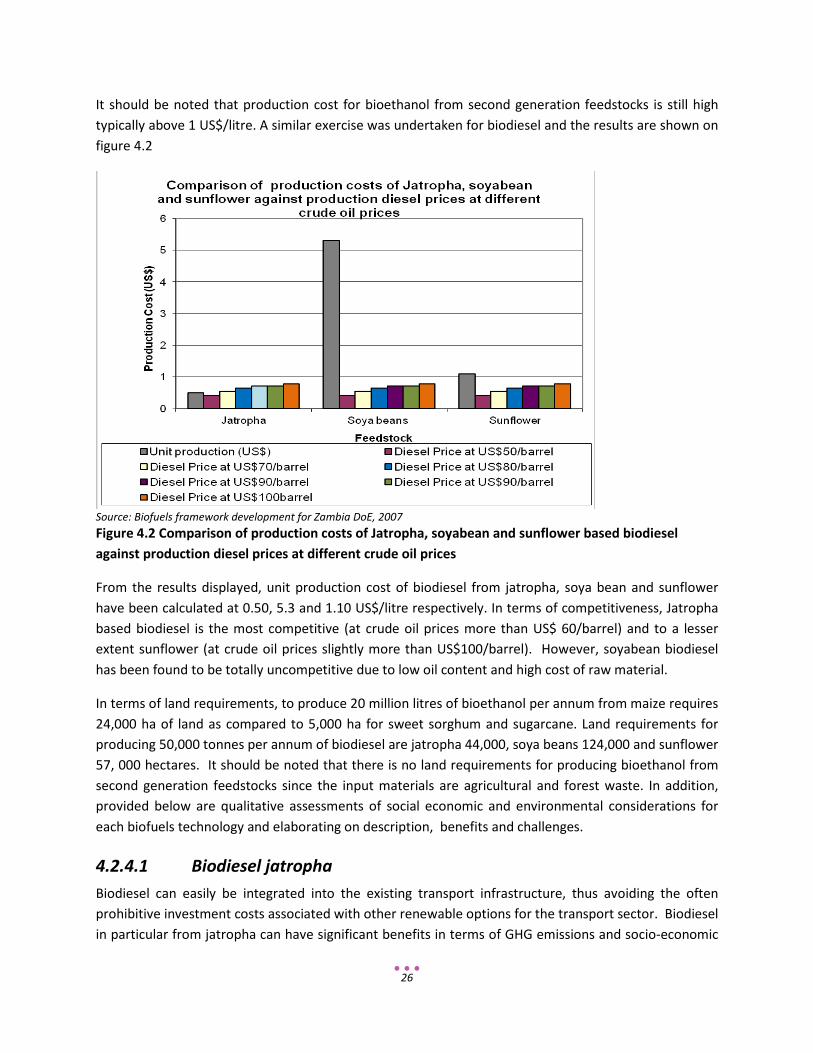
26
It should be noted that production cost for bioethanol from second generation feedstocks is still high typically above 1 US$/litre. A similar exercise was undertaken for biodiesel and the results are shown on figure 4.2
Source: Biofuels framework development for Zambia DoE, 2007 Figure 4.2 Comparison of production costs of Jatropha, soyabean and sunflower based biodiesel against production diesel prices at different crude oil prices
From the results displayed, unit production cost of biodiesel from jatropha, soya bean and sunflower have been calculated at 0.50, 5.3 and 1.10 US$/litre respectively. In terms of competitiveness, Jatropha based biodiesel is the most competitive (at crude oil prices more than US$ 60/barrel) and to a lesser extent sunflower (at crude oil prices slightly more than US$100/barrel). However, soyabean biodiesel has been found to be totally uncompetitive due to low oil content and high cost of raw material.
In terms of land requirements, to produce 20 million litres of bioethanol per annum from maize requires 24,000 ha of land as compared to 5,000 ha for sweet sorghum and sugarcane. Land requirements for producing 50,000 tonnes per annum of biodiesel are jatropha 44,000, soya beans 124,000 and sunflower 57, 000 hectares. It should be noted that there is no land requirements for producing bioethanol from second generation feedstocks since the input materials are agricultural and forest waste. In addition, provided below are qualitative assessments of social economic and environmental considerations for each biofuels technology and elaborating on description, benefits and challenges.
4.2.4.1 Biodiesel jatropha Biodiesel can easily be integrated into the existing transport infrastructure, thus avoiding the often prohibitive investment costs associated with other renewable options for the transport sector. Biodiesel in particular from jatropha can have significant benefits in terms of GHG emissions and socio-economic
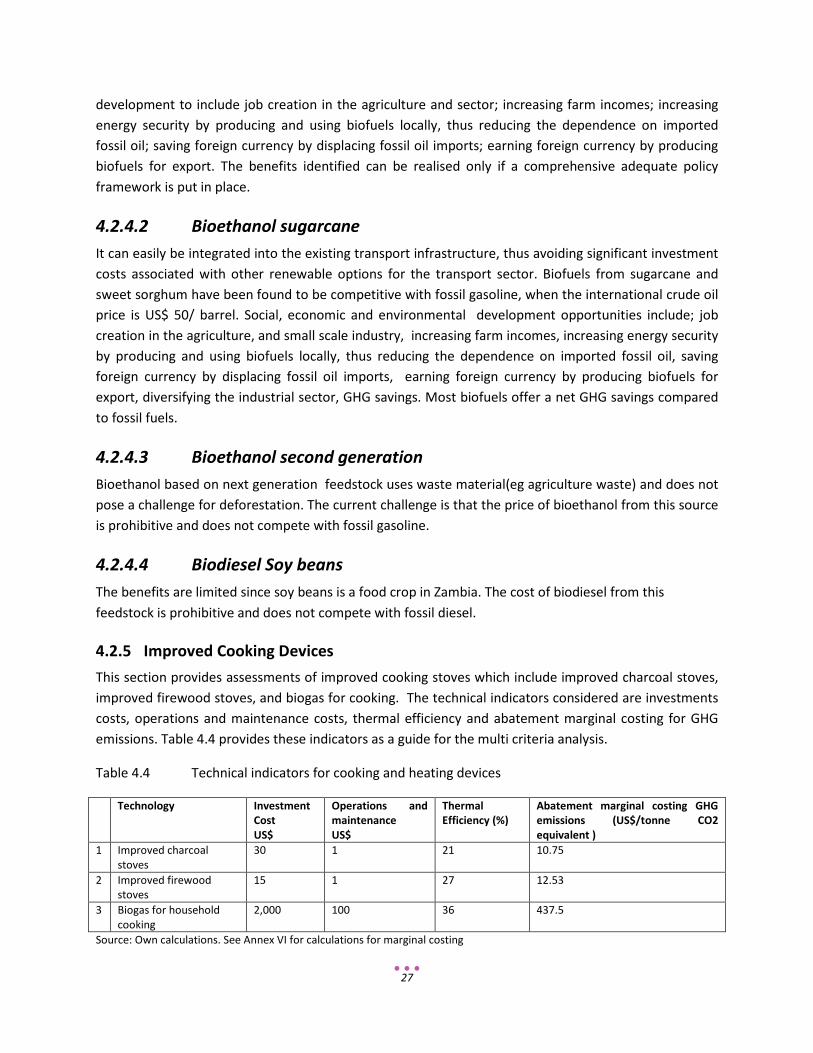
27
development to include job creation in the agriculture and sector; increasing farm incomes; increasing energy security by producing and using biofuels locally, thus reducing the dependence on imported fossil oil; saving foreign currency by displacing fossil oil imports; earning foreign currency by producing biofuels for export. The benefits identified can be realised only if a comprehensive adequate policy framework is put in place.
4.2.4.2 Bioethanol sugarcane It can easily be integrated into the existing transport infrastructure, thus avoiding significant investment costs associated with other renewable options for the transport sector. Biofuels from sugarcane and sweet sorghum have been found to be competitive with fossil gasoline, when the international crude oil price is US$ 50/ barrel. Social, economic and environmental development opportunities include; job creation in the agriculture, and small scale industry, increasing farm incomes, increasing energy security by producing and using biofuels locally, thus reducing the dependence on imported fossil oil, saving foreign currency by displacing fossil oil imports, earning foreign currency by producing biofuels for export, diversifying the industrial sector, GHG savings. Most biofuels offer a net GHG savings compared to fossil fuels.
4.2.4.3 Bioethanol second generation Bioethanol based on next generation feedstock uses waste material(eg agriculture waste) and does not pose a challenge for deforestation. The current challenge is that the price of bioethanol from this source is prohibitive and does not compete with fossil gasoline.
4.2.4.4 Biodiesel Soy beans The benefits are limited since soy beans is a food crop in Zambia. The cost of biodiesel from this feedstock is prohibitive and does not compete with fossil diesel.
4.2.5 Improved Cooking Devices This section provides assessments of improved cooking stoves which include improved charcoal stoves, improved firewood stoves, and biogas for cooking. The technical indicators considered are investments costs, operations and maintenance costs, thermal efficiency and abatement marginal costing for GHG emissions. Table 4.4 provides these indicators as a guide for the multi criteria analysis.
Table 4.4 Technical indicators for cooking and heating devices
Technology Investment Cost US$
Operations and maintenance US$
Thermal Efficiency (%)
Abatement marginal costing GHG emissions (US$/tonne CO2 equivalent )
1 Improved charcoal stoves
30 1 21 10.75
2 Improved firewood stoves
15 1 27 12.53
3 Biogas for household cooking
2,000 100 36 437.5
Source: Own calculations. See Annex VI for calculations for marginal costing
28
In addition, provided below are qualitative assessments of social economic and environmental considerations for each improved cooking devices and elaborating on description, benefits and challenges.
4.2.5.1 Improved charcoal stoves Improved Charcoal stove is defined as one that meets technical, scientific and safety standards, and has high combustion quality, technical efficiency, minimal smoke emission, ergonomics and structural stability. Its efficiency is around 21% as compared to 10% traditional stove. The technology leads to reduced indoor pollution and financial savings from charcoal consumption. Requires an innovative financing and distribution mechanism.
4.2.5.2 Improved Firewood Stoves Improved firewood stove is defined as one that meets technical, scientific and safety standards, and has high combustion quality, technical efficiency, minimal smoke emission, ergonomics and structural stability. Measured efficiency for a typical improved firewood stove is 27.6%(Ice Cap, 2010) as compared to 8% three stone stove. It reduces indoor pollution and financial savings from firewood consumption. Requires an innovative financing and distribution mechanism.
4.2.5.3 Biogas for cooking Biogas is generated during anaerobic digestion processes using waste water, solid waste, organic waste, (e.g. animal manure), and other sources of biomass. It can be used in a gas engine and modified gasoline, or diesel internal combustion engine for electricity generation or used to produce steam which is then expanded on a steam reciprocating internal engine to produce electricity. Benefits include; (i) social (smoke-free and ash-free kitchen, so women and their children are no longer prone to respiratory infections; women are spared the burden of gathering firewood), (ii) environmental (improves sanitation, reduce deforestation levels, where people heavily rely on woodfuel,, sludge remaining after digestion is a good fertilizer, contributing to climate mitigation (a single, small scale bio-digester reduces between 3 and 5 tCO2-eq./year), substituting kerosene and firewood. Challenges include need to have awareness and information programme for sensitizing policy makers and financial providers on the potential of the technology, and innovative financing mechanism aimed at leveraging the relatively higher electricity generating costs compared to other traditional energy supply systems.
4.2.6 Improved Charcoal Production This section provides assessments of technologies for improved charcoal production which include improved traditional kiln, brick kiln, metal kiln and retort kiln. The technical indicators considered are investments costs, operations and maintenance costs, and marginal abatement costing for GHG emissions and conversion efficiency. Table 4.5 provides these indicators as a guide for the multi criteria analysis.
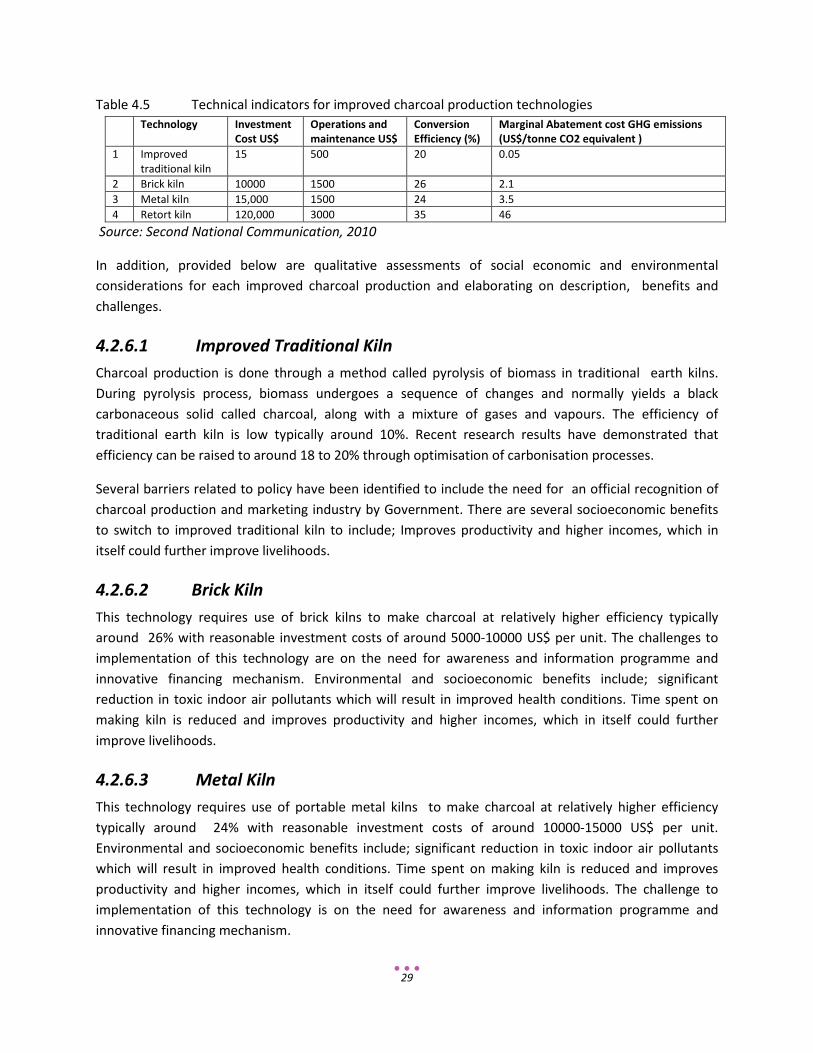
29
Table 4.5 Technical indicators for improved charcoal production technologies Technology Investment
Cost US$ Operations and maintenance US$
Conversion Efficiency (%)
Marginal Abatement cost GHG emissions (US$/tonne CO2 equivalent )
1 Improved traditional kiln
15 500 20 0.05
2 Brick kiln 10000 1500 26 2.1 3 Metal kiln 15,000 1500 24 3.5 4 Retort kiln 120,000 3000 35 46
Source: Second National Communication, 2010
In addition, provided below are qualitative assessments of social economic and environmental considerations for each improved charcoal production and elaborating on description, benefits and challenges.
4.2.6.1 Improved Traditional Kiln Charcoal production is done through a method called pyrolysis of biomass in traditional earth kilns. During pyrolysis process, biomass undergoes a sequence of changes and normally yields a black carbonaceous solid called charcoal, along with a mixture of gases and vapours. The efficiency of traditional earth kiln is low typically around 10%. Recent research results have demonstrated that efficiency can be raised to around 18 to 20% through optimisation of carbonisation processes.
Several barriers related to policy have been identified to include the need for an official recognition of charcoal production and marketing industry by Government. There are several socioeconomic benefits to switch to improved traditional kiln to include; Improves productivity and higher incomes, which in itself could further improve livelihoods.
4.2.6.2 Brick Kiln This technology requires use of brick kilns to make charcoal at relatively higher efficiency typically around 26% with reasonable investment costs of around 5000-10000 US$ per unit. The challenges to implementation of this technology are on the need for awareness and information programme and innovative financing mechanism. Environmental and socioeconomic benefits include; significant reduction in toxic indoor air pollutants which will result in improved health conditions. Time spent on making kiln is reduced and improves productivity and higher incomes, which in itself could further improve livelihoods.
4.2.6.3 Metal Kiln This technology requires use of portable metal kilns to make charcoal at relatively higher efficiency typically around 24% with reasonable investment costs of around 10000-15000 US$ per unit. Environmental and socioeconomic benefits include; significant reduction in toxic indoor air pollutants which will result in improved health conditions. Time spent on making kiln is reduced and improves productivity and higher incomes, which in itself could further improve livelihoods. The challenge to implementation of this technology is on the need for awareness and information programme and innovative financing mechanism.
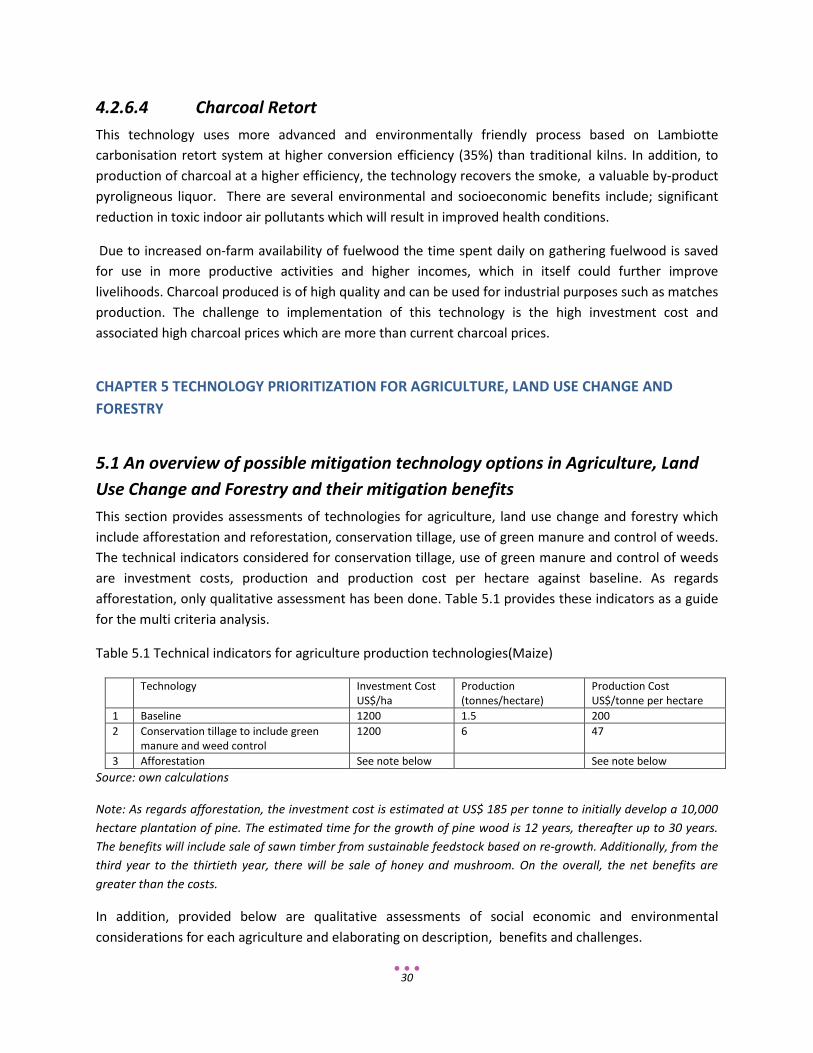
30
4.2.6.4 Charcoal Retort This technology uses more advanced and environmentally friendly process based on Lambiotte carbonisation retort system at higher conversion efficiency (35%) than traditional kilns. In addition, to production of charcoal at a higher efficiency, the technology recovers the smoke, a valuable by-product pyroligneous liquor. There are several environmental and socioeconomic benefits include; significant reduction in toxic indoor air pollutants which will result in improved health conditions.
Due to increased on-farm availability of fuelwood the time spent daily on gathering fuelwood is saved for use in more productive activities and higher incomes, which in itself could further improve livelihoods. Charcoal produced is of high quality and can be used for industrial purposes such as matches production. The challenge to implementation of this technology is the high investment cost and associated high charcoal prices which are more than current charcoal prices.
CHAPTER 5 TECHNOLOGY PRIORITIZATION FOR AGRICULTURE, LAND USE CHANGE AND FORESTRY
5.1 An overview of possible mitigation technology options in Agriculture, Land Use Change and Forestry and their mitigation benefits This section provides assessments of technologies for agriculture, land use change and forestry which include afforestation and reforestation, conservation tillage, use of green manure and control of weeds. The technical indicators considered for conservation tillage, use of green manure and control of weeds are investment costs, production and production cost per hectare against baseline. As regards afforestation, only qualitative assessment has been done. Table 5.1 provides these indicators as a guide for the multi criteria analysis.
Table 5.1 Technical indicators for agriculture production technologies(Maize)
Technology Investment Cost US$/ha
Production (tonnes/hectare)
Production Cost US$/tonne per hectare
1 Baseline 1200 1.5 200 2 Conservation tillage to include green
manure and weed control 1200 6 47
3 Afforestation See note below See note below Source: own calculations
Note: As regards afforestation, the investment cost is estimated at US$ 185 per tonne to initially develop a 10,000 hectare plantation of pine. The estimated time for the growth of pine wood is 12 years, thereafter up to 30 years. The benefits will include sale of sawn timber from sustainable feedstock based on re-growth. Additionally, from the third year to the thirtieth year, there will be sale of honey and mushroom. On the overall, the net benefits are greater than the costs.
In addition, provided below are qualitative assessments of social economic and environmental considerations for each agriculture and elaborating on description, benefits and challenges.
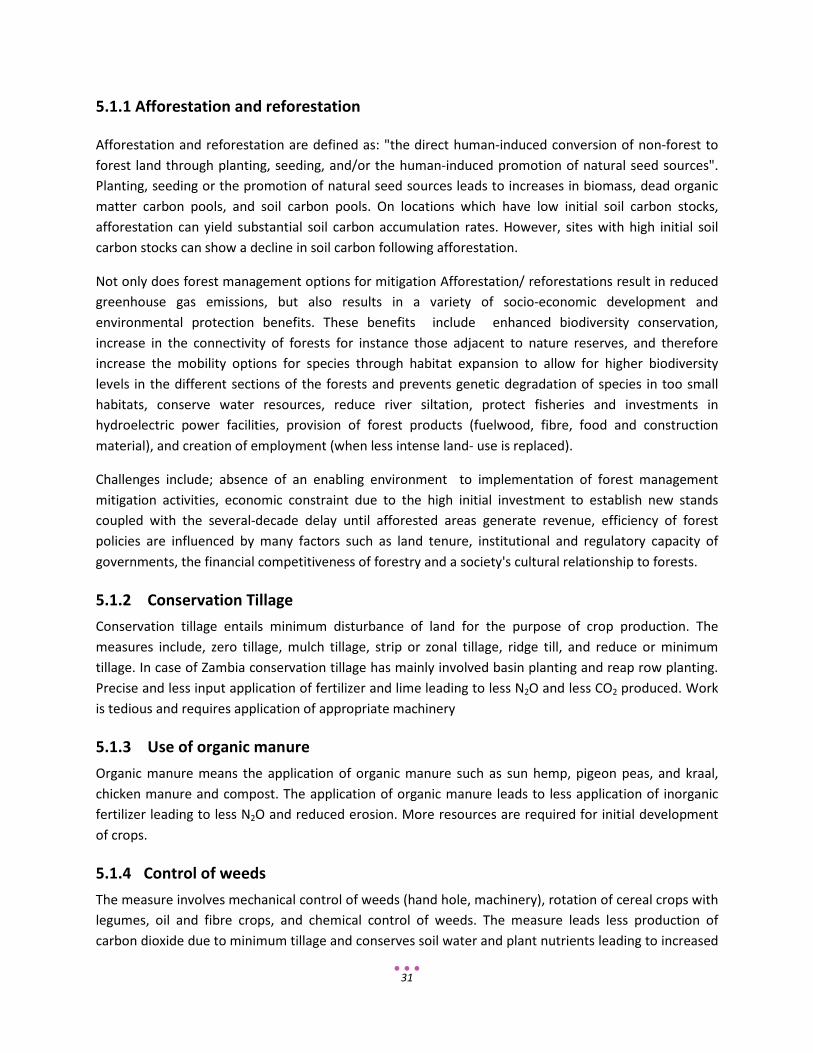
31
5.1.1 Afforestation and reforestation
Afforestation and reforestation are defined as: "the direct human-induced conversion of non-forest to forest land through planting, seeding, and/or the human-induced promotion of natural seed sources". Planting, seeding or the promotion of natural seed sources leads to increases in biomass, dead organic matter carbon pools, and soil carbon pools. On locations which have low initial soil carbon stocks, afforestation can yield substantial soil carbon accumulation rates. However, sites with high initial soil carbon stocks can show a decline in soil carbon following afforestation.
Not only does forest management options for mitigation Afforestation/ reforestations result in reduced greenhouse gas emissions, but also results in a variety of socio-economic development and environmental protection benefits. These benefits include enhanced biodiversity conservation, increase in the connectivity of forests for instance those adjacent to nature reserves, and therefore increase the mobility options for species through habitat expansion to allow for higher biodiversity levels in the different sections of the forests and prevents genetic degradation of species in too small habitats, conserve water resources, reduce river siltation, protect fisheries and investments in hydroelectric power facilities, provision of forest products (fuelwood, fibre, food and construction material), and creation of employment (when less intense land- use is replaced).
Challenges include; absence of an enabling environment to implementation of forest management mitigation activities, economic constraint due to the high initial investment to establish new stands coupled with the several-decade delay until afforested areas generate revenue, efficiency of forest policies are influenced by many factors such as land tenure, institutional and regulatory capacity of governments, the financial competitiveness of forestry and a society's cultural relationship to forests.
5.1.2 Conservation Tillage Conservation tillage entails minimum disturbance of land for the purpose of crop production. The measures include, zero tillage, mulch tillage, strip or zonal tillage, ridge till, and reduce or minimum tillage. In case of Zambia conservation tillage has mainly involved basin planting and reap row planting. Precise and less input application of fertilizer and lime leading to less N2O and less CO2 produced. Work is tedious and requires application of appropriate machinery
5.1.3 Use of organic manure Organic manure means the application of organic manure such as sun hemp, pigeon peas, and kraal, chicken manure and compost. The application of organic manure leads to less application of inorganic fertilizer leading to less N2O and reduced erosion. More resources are required for initial development of crops.
5.1.4 Control of weeds The measure involves mechanical control of weeds (hand hole, machinery), rotation of cereal crops with legumes, oil and fibre crops, and chemical control of weeds. The measure leads less production of carbon dioxide due to minimum tillage and conserves soil water and plant nutrients leading to increased

32
crop productivity and production. In addition, the measure leads to increased carbon sequestration. Improved crop varieties tolerant abiotic and biotic stresses are essential components of conservation agriculture; however, more resources are required for initial development of crops and for research on training and use of safe herbicides.
During final assessment, the options on conservation tillage, use of organic manure and control of weeds were regrouped into one major activity conservation agriculture.
CHAPTER 6 PRIORITISATION OF FINAL LIST OF TECHNOLOGIES
6.1 Overview of Prioritised Technologies
This section elaborates Step 6 involving prioritisation of final lists of mitigation technologies from step 4 (section 3.2). Section 4 involved identification of the preliminary list from the initial long list of mitigation technologies using multi criteria analysis. The input data and information required for the prioritisation of final list were obtained from detailed assessments (step 5- Chapters 4 and 5), including cost benefit analysis, and qualitative assessments of socio-economic and environmental consideration for each technology. The technologies from the preliminary list for the purpose of this assessment are arranged as energy, and agriculture, land use change and forestry based options.
(a) Energy based The energy sector is further divided into sub sectors 1 Electricity generation-biomass combustion, geothermal, wind energy, biomethanation and
PV utility
2 Biofuels-biodiesel from jatropha, bioethanol from sugar cane, bioethanol from sweet sorghum and bioethanol from maize
3 Energy Efficiency-energy management systems, industrial and commercial end use efficiency and household end use efficiency
4 Improved cooking Devices-Improved charcoal stove, Improved firewood stove and Biogas for cooking
5 Improved charcoal production-brick kiln, traditional improved kiln and metal kiln
6 Off-grid systems – mini hydro, biomass gasifier, biogas digester
(b) Agriculture, Land use Change and Forestry
1. Afforestation 2. Conservation agriculture to include; tillage, development of green manure and control of
weeds
6.2 Prioritisation of final list
For this purpose, the same multi criteria analysis described in section 3.2 was used to prioritise the final list using detailed assessments as input data and information as a guide for selection. A working group of
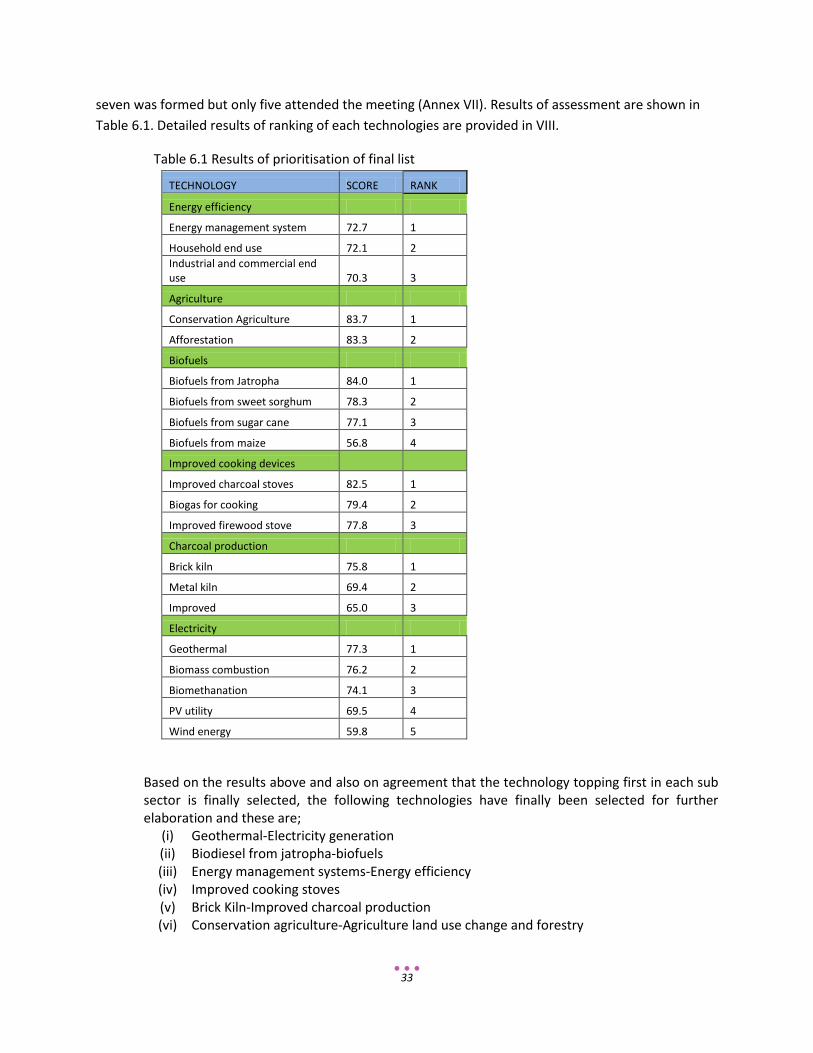
33
seven was formed but only five attended the meeting (Annex VII). Results of assessment are shown in Table 6.1. Detailed results of ranking of each technologies are provided in VIII.
Table 6.1 Results of prioritisation of final list
TECHNOLOGY SCORE RANK
Energy efficiency
Energy management system 72.7 1
Household end use 72.1 2 Industrial and commercial end use 70.3 3
Agriculture
Conservation Agriculture 83.7 1
Afforestation 83.3 2
Biofuels
Biofuels from Jatropha 84.0 1
Biofuels from sweet sorghum 78.3 2
Biofuels from sugar cane 77.1 3
Biofuels from maize 56.8 4
Improved cooking devices Improved charcoal stoves 82.5 1
Biogas for cooking 79.4 2
Improved firewood stove 77.8 3
Charcoal production
Brick kiln 75.8 1
Metal kiln 69.4 2
Improved 65.0 3
Electricity
Geothermal 77.3 1
Biomass combustion 76.2 2
Biomethanation 74.1 3
PV utility 69.5 4
Wind energy 59.8 5
Based on the results above and also on agreement that the technology topping first in each sub sector is finally selected, the following technologies have finally been selected for further elaboration and these are;
(i) Geothermal-Electricity generation (ii) Biodiesel from jatropha-biofuels (iii) Energy management systems-Energy efficiency (iv) Improved cooking stoves (v) Brick Kiln-Improved charcoal production (vi) Conservation agriculture-Agriculture land use change and forestry
34
(vii) Under off-grid systems biomass gasifier was selected based on preliminary list assessment
The some of the technologies selected above will contribute to reduction of deforestation, which is the largest source of GHG emissions in Zambia. These technologies(geothermal electricity and off grid systems) will contribute to provision of electricity in rural areas, where currently electricity penetration rate is estimated at 4%. On the conservation side, technologies including improved cooking stoves and improved charcoal production (brick kiln) are also likely to contribute to reduction of deforestation. Further, conservation farming will reduce deforestation since there is no need to open new lands because productivity of land is maintained through addition of external nutrients coming from mineral and organic sources.
Having identified and prioritised technologies that can contribute to the mitigation of climate change in Zambia, and which can contribute to meeting its national sustainable development goals and priorities, the next step involves barrier analysis. This analysis will involve identifying barriers hindering the acquisition and diffusion of prioritised technologies and to develop enabling frameworks to overcome the barriers and facilitate the transfer, adoption and diffusion of selected technologies in Zambia. This will then be followed by development of Technology Action Plans (TAPs) which will specify a road map of activities (based on the enabling frameworks) at the sectoral and cross-cutting levels to facilitate the transfer, adoption and diffusion of selected technologies.
CHAPTER 7 SUMMARY AND CONCLUSIONS This process of Technology Needs Assessment involved the following steps: (i) identification and categorisation of priority sector and subsectors, (ii) development of assessment framework, (iii) familiarization, identification and description of long list of mitigation technologies, (iv) identification of the preliminary list from the initial long list of mitigation technologies using ranking based on multi criteria analysis, (v) detailed assessment of preliminary lists of mitigation technologies based on cost assessments( capital cost and internal rate of return, marginal costing), and GHG reduction potential, and qualitative assessment of socio-economic and environmental considerations, (vi) prioritisation of final lists of mitigation technologies using Multi Criteria Analysis from the shortlisted number of technologies.
The long list of technologies was selected using multi criteria analysis involving stakeholders from sectors to include energy; agriculture, land use change and forestry, and waste. Out of this list, a preliminary list under energy was selected as follows; (i) biofuels (biodiesel from jatropha, bioethanol from sugarcane and maize, and biofuels from second generation), (ii) charcoal production (brick kiln, improved traditional kiln, and metal kiln), (iii) energy efficiency(energy management system, industrial and commercial end use, and household end use), (iv) electricity generation(biomass combustion, geothermal, wind energy, biomass waste water, PV utility and waste landfill, (v) improved cooking and heating and lighting devices (improved charcoal stoves, improved biomass institutional stoves, improved firewood stoves, biogas for cooking, and solar lanterns), (vi) off grid (small hydros, biomass gasifier, biogas digester, and small wind turbine.
List of preliminary technologies from agriculture, land use change and forestry include; (i) agriculture (conservation tillage, development of green manure and cover crop for soil improvements, and control
35
of weeds), (ii) land use change and forestry (afforestation and reforestation, improved biomass institutional stoves, improved charcoal stove, biomass gasification, retort kiln and metal kiln). The process was then followed by detailed assessment of preliminary lists of mitigation technologies aimed at producing fact sheets on each selected technology and quantitative analysis to include; capital cost and internal rate of return, marginal costing and GHG reduction potential, and qualitative assessment of socio-economic and environmental considerations for energy based, and agriculture land use change and forestry based technologies. Based on this information, prioritisation of final list was undertaken.
Having identified and prioritised technologies that can contribute to the mitigation of Zambia, and which can contribute to meeting its national sustainable development goals and priorities, the next step involves barrier analysis stage. This analysis will involve identifying barriers hindering the acquisition and diffusion of prioritised technologies and to develop enabling frameworks to overcome the barriers and facilitate the transfer, adoption and diffusion of selected technologies in Zambia. This will then be followed by development of Technology Action Plans (TAPs) which will specify a road map of activities (based on the enabling frameworks) at the sectoral and cross-cutting levels to facilitate the transfer, adoption and diffusion of selected technologies. LIST OF REFERENCES
NPE, 2007: National Policy on Environment, published by Ministry of Tourism, Environment and Natural Resources
CEEEZ, 2005: Sustainable development goals and indicators from clean development mechanism (CDM)
perspectives
SNDP, 2010: Sixth National Development Plan for Zambia published by Government Republic of Zambia(2011-2015)
FNDP, 2006: Fifth National Development Plan for Zambia published by Government Republic of Zambia (2006-2010)
Vision, 2006: The Vision 2030 –“A Prosperous Middle-Income Nation by 2030”. Published by Government Republic of Zambia
SNC, 2010: Second National Communication for Zambia
NCCRS, 2010; National Climate Change Response Strategy for Zambia; Government Republic of Zambia
ICE CAP 2010: Laboratory cook stove measurements,
SREEN 2011: IPCC Special Report on Renewable Energy Sources and Climate Change Mitigation
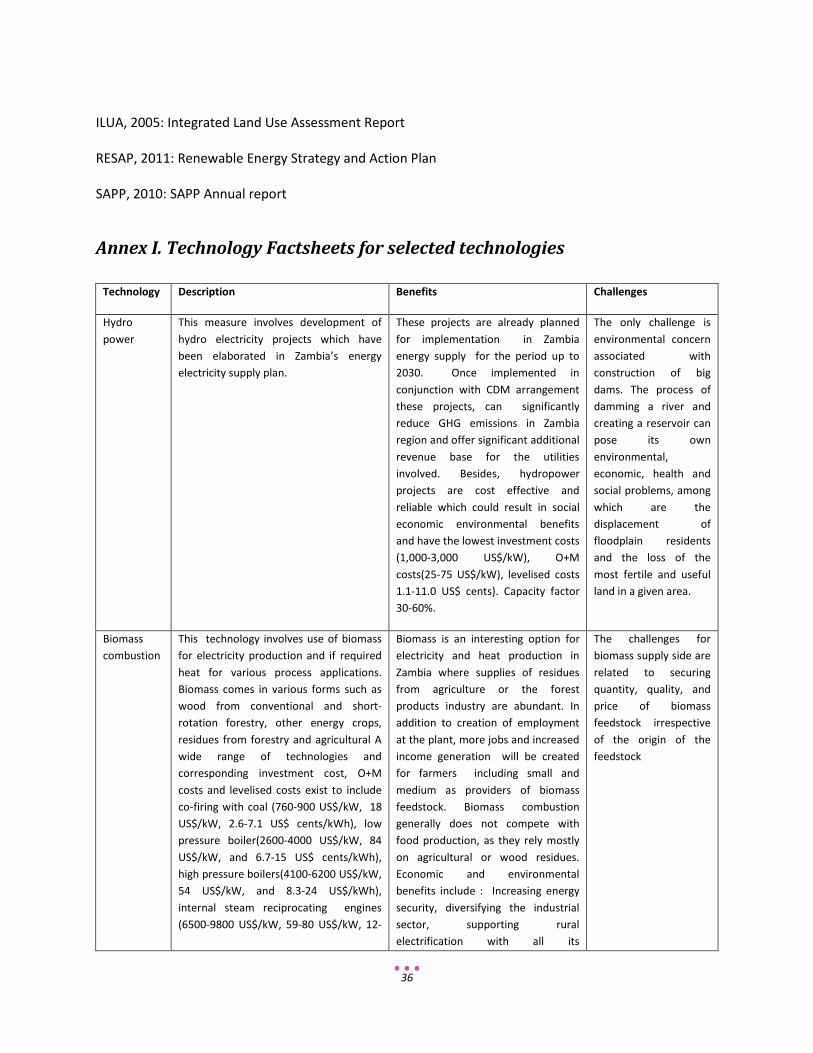
36
ILUA, 2005: Integrated Land Use Assessment Report RESAP, 2011: Renewable Energy Strategy and Action Plan SAPP, 2010: SAPP Annual report
Annex I. Technology Factsheets for selected technologies
Technology Description Benefits Challenges
Hydro power
This measure involves development of hydro electricity projects which have been elaborated in Zambia’s energy electricity supply plan.
These projects are already planned for implementation in Zambia energy supply for the period up to 2030. Once implemented in conjunction with CDM arrangement these projects, can significantly reduce GHG emissions in Zambia region and offer significant additional revenue base for the utilities involved. Besides, hydropower projects are cost effective and reliable which could result in social economic environmental benefits and have the lowest investment costs (1,000-3,000 US$/kW), O+M costs(25-75 US$/kW), levelised costs 1.1-11.0 US$ cents). Capacity factor 30-60%.
The only challenge is environmental concern associated with construction of big dams. The process of damming a river and creating a reservoir can pose its own environmental, economic, health and social problems, among which are the displacement of floodplain residents and the loss of the most fertile and useful land in a given area.
Biomass combustion
This technology involves use of biomass for electricity production and if required heat for various process applications. Biomass comes in various forms such as wood from conventional and short-rotation forestry, other energy crops, residues from forestry and agricultural A wide range of technologies and corresponding investment cost, O+M costs and levelised costs exist to include co-firing with coal (760-900 US$/kW, 18 US$/kW, 2.6-7.1 US$ cents/kWh), low pressure boiler(2600-4000 US$/kW, 84 US$/kW, and 6.7-15 US$ cents/kWh), high pressure boilers(4100-6200 US$/kW, 54 US$/kW, and 8.3-24 US$/kWh), internal steam reciprocating engines (6500-9800 US$/kW, 59-80 US$/kW, 12-
Biomass is an interesting option for electricity and heat production in Zambia where supplies of residues from agriculture or the forest products industry are abundant. In addition to creation of employment at the plant, more jobs and increased income generation will be created for farmers including small and medium as providers of biomass feedstock. Biomass combustion generally does not compete with food production, as they rely mostly on agricultural or wood residues. Economic and environmental benefits include : Increasing energy security, diversifying the industrial sector, supporting rural electrification with all its
The challenges for biomass supply side are related to securing quantity, quality, and price of biomass feedstock irrespective of the origin of the feedstock
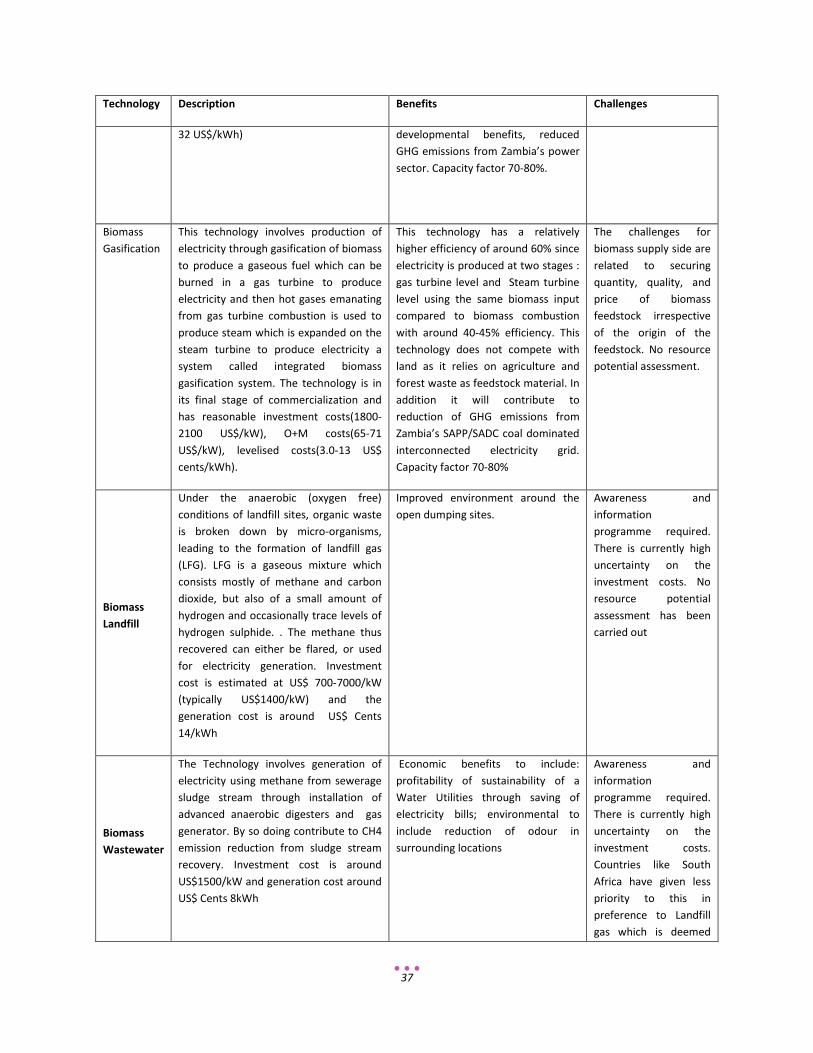
37
Technology Description Benefits Challenges
32 US$/kWh) developmental benefits, reduced GHG emissions from Zambia’s power sector. Capacity factor 70-80%.
Biomass Gasification
This technology involves production of electricity through gasification of biomass to produce a gaseous fuel which can be burned in a gas turbine to produce electricity and then hot gases emanating from gas turbine combustion is used to produce steam which is expanded on the steam turbine to produce electricity a system called integrated biomass gasification system. The technology is in its final stage of commercialization and has reasonable investment costs(1800-2100 US$/kW), O+M costs(65-71 US$/kW), levelised costs(3.0-13 US$ cents/kWh).
This technology has a relatively higher efficiency of around 60% since electricity is produced at two stages : gas turbine level and Steam turbine level using the same biomass input compared to biomass combustion with around 40-45% efficiency. This technology does not compete with land as it relies on agriculture and forest waste as feedstock material. In addition it will contribute to reduction of GHG emissions from Zambia’s SAPP/SADC coal dominated interconnected electricity grid. Capacity factor 70-80%
The challenges for biomass supply side are related to securing quantity, quality, and price of biomass feedstock irrespective of the origin of the feedstock. No resource potential assessment.
Biomass Landfill
Under the anaerobic (oxygen free) conditions of landfill sites, organic waste is broken down by micro-organisms, leading to the formation of landfill gas (LFG). LFG is a gaseous mixture which consists mostly of methane and carbon dioxide, but also of a small amount of hydrogen and occasionally trace levels of hydrogen sulphide. . The methane thus recovered can either be flared, or used for electricity generation. Investment cost is estimated at US$ 700-7000/kW (typically US$1400/kW) and the generation cost is around US$ Cents 14/kWh
Improved environment around the open dumping sites.
Awareness and information programme required. There is currently high uncertainty on the investment costs. No resource potential assessment has been carried out
Biomass Wastewater
The Technology involves generation of electricity using methane from sewerage sludge stream through installation of advanced anaerobic digesters and gas generator. By so doing contribute to CH4 emission reduction from sludge stream recovery. Investment cost is around US$1500/kW and generation cost around US$ Cents 8kWh
Economic benefits to include: profitability of sustainability of a Water Utilities through saving of electricity bills; environmental to include reduction of odour in surrounding locations
Awareness and information programme required. There is currently high uncertainty on the investment costs. Countries like South Africa have given less priority to this in preference to Landfill gas which is deemed

38
Technology Description Benefits Challenges
cheaper to invest in. No resource potential assessment done
PV utility Solar photovoltaic (PV), refers to the technology of using solar cells to convert solar radiation directly into electricity. This technology can be used at Utility-scale level, sometimes called “central station PV,” which acts more like a power plant, producing electricity that is fed into the national grid. Currently investment costs, O+M, and levelised costs are highest at 3100-5000 US$/kW, 16-75 US$/kW, and 13-42 US$ cents/TWh respectively.
Solar PV systems, once manufactured, are closed systems; during operation and electricity production they require no inputs such as fuels.. They are silent and vibration free. The main environmental impacts of solar cells are related to their production and decommissioning. Solar PV has a very low lifecycle cost of pollution per kilowatt-hour (compared to other technologies).Solar PV can play a significant role in climate change mitigation since it has a lower GHG emissions lifecycle in the order of 30 to 70 gCO2e/kWh against more than 900 gCO2e/kWh for coal, and more than 400 gCO2e/kWh for gas. Capacity factor 15-27%. Resource potential known in the region.
A significant problem with solar power is high investment cost and higher levelised costs compared to other technologies.
PV CSP CSP is the conversion of sunlight into electricity, indirectly using concentrated solar power (CSP).Concentrated solar power systems use lenses or mirrors and tracking systems to focus a large area of sunlight into a small beam to boil water which produces steam which then later expands on traditional steam turbines to generate electricity. CSP has relatively lower investment costs, O+M costs, and levelised costs compared to PV Utility at 5000-7300 US$/kW, 60-82 US$/kW and 16-25 US$ cents/kWh.
CSP although at its final stage of commercialisation is beginning to be competitive compared to other technologies. It has similar GHG benefit emissions as PV Utility. Capacity factor 35-42%.
In terms of costs although relatively higher than other technologies, it is more competitive than PV Utility.
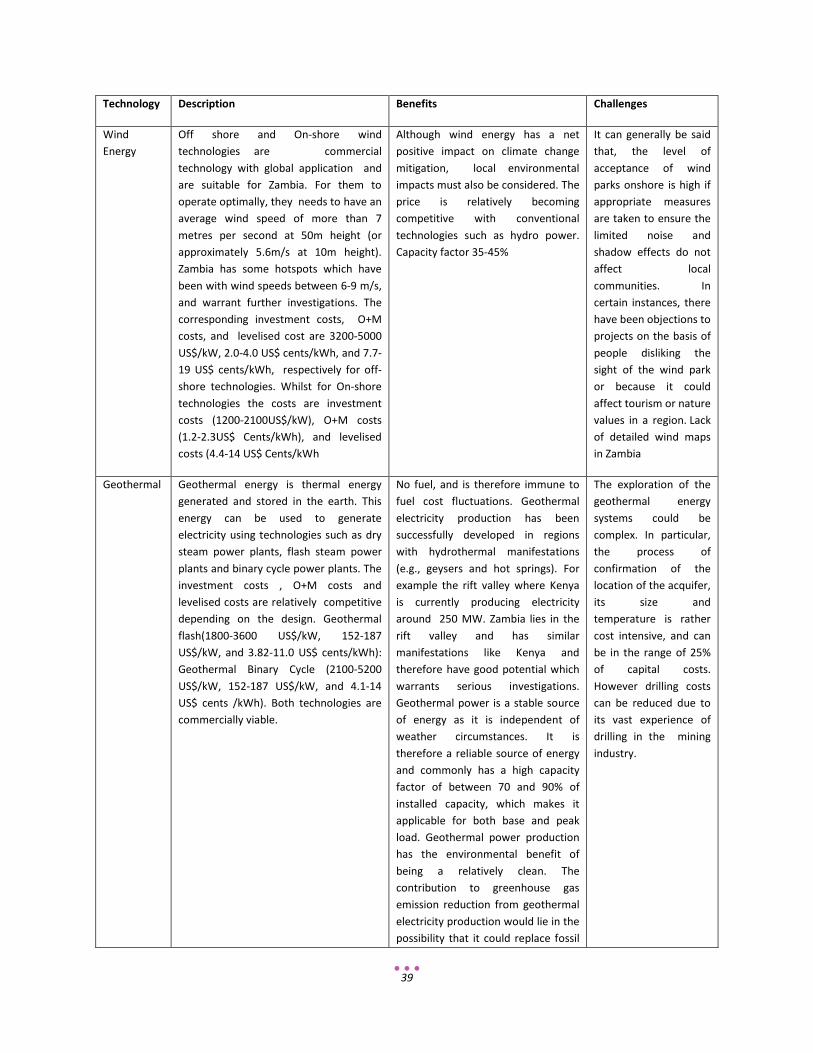
39
Technology Description Benefits Challenges
Wind Energy
Off shore and On-shore wind technologies are commercial technology with global application and are suitable for Zambia. For them to operate optimally, they needs to have an average wind speed of more than 7 metres per second at 50m height (or approximately 5.6m/s at 10m height). Zambia has some hotspots which have been with wind speeds between 6-9 m/s, and warrant further investigations. The corresponding investment costs, O+M costs, and levelised cost are 3200-5000 US$/kW, 2.0-4.0 US$ cents/kWh, and 7.7-19 US$ cents/kWh, respectively for off-shore technologies. Whilst for On-shore technologies the costs are investment costs (1200-2100US$/kW), O+M costs (1.2-2.3US$ Cents/kWh), and levelised costs (4.4-14 US$ Cents/kWh
Although wind energy has a net positive impact on climate change mitigation, local environmental impacts must also be considered. The price is relatively becoming competitive with conventional technologies such as hydro power. Capacity factor 35-45%
It can generally be said that, the level of acceptance of wind parks onshore is high if appropriate measures are taken to ensure the limited noise and shadow effects do not affect local communities. In certain instances, there have been objections to projects on the basis of people disliking the sight of the wind park or because it could affect tourism or nature values in a region. Lack of detailed wind maps in Zambia
Geothermal Geothermal energy is thermal energy generated and stored in the earth. This energy can be used to generate electricity using technologies such as dry steam power plants, flash steam power plants and binary cycle power plants. The investment costs , O+M costs and levelised costs are relatively competitive depending on the design. Geothermal flash(1800-3600 US$/kW, 152-187 US$/kW, and 3.82-11.0 US$ cents/kWh): Geothermal Binary Cycle (2100-5200 US$/kW, 152-187 US$/kW, and 4.1-14 US$ cents /kWh). Both technologies are commercially viable.
No fuel, and is therefore immune to fuel cost fluctuations. Geothermal electricity production has been successfully developed in regions with hydrothermal manifestations (e.g., geysers and hot springs). For example the rift valley where Kenya is currently producing electricity around 250 MW. Zambia lies in the rift valley and has similar manifestations like Kenya and therefore have good potential which warrants serious investigations. Geothermal power is a stable source of energy as it is independent of weather circumstances. It is therefore a reliable source of energy and commonly has a high capacity factor of between 70 and 90% of installed capacity, which makes it applicable for both base and peak load. Geothermal power production has the environmental benefit of being a relatively clean. The contribution to greenhouse gas emission reduction from geothermal electricity production would lie in the possibility that it could replace fossil
The exploration of the geothermal energy systems could be complex. In particular, the process of confirmation of the location of the acquifer, its size and temperature is rather cost intensive, and can be in the range of 25% of capital costs. However drilling costs can be reduced due to its vast experience of drilling in the mining industry.
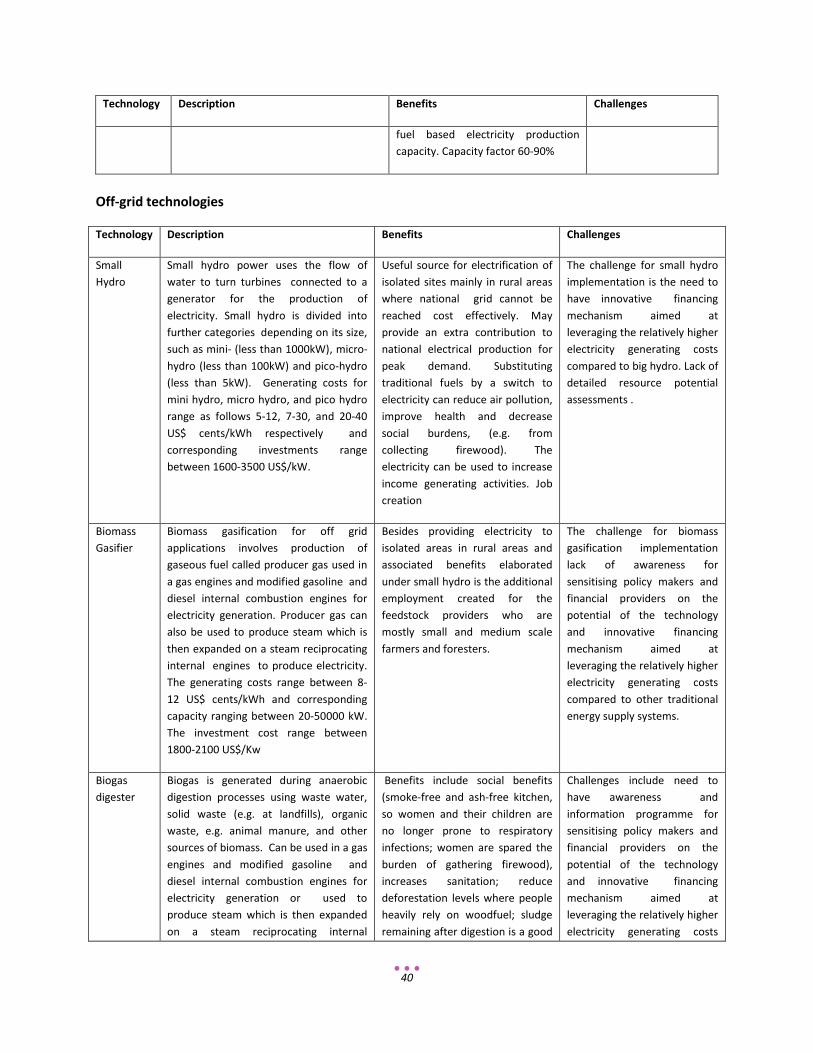
40
Technology Description Benefits Challenges
fuel based electricity production capacity. Capacity factor 60-90%
Off-grid technologies
Technology Description Benefits Challenges
Small Hydro
Small hydro power uses the flow of water to turn turbines connected to a generator for the production of electricity. Small hydro is divided into further categories depending on its size, such as mini- (less than 1000kW), micro-hydro (less than 100kW) and pico-hydro (less than 5kW). Generating costs for mini hydro, micro hydro, and pico hydro range as follows 5-12, 7-30, and 20-40 US$ cents/kWh respectively and corresponding investments range between 1600-3500 US$/kW.
Useful source for electrification of isolated sites mainly in rural areas where national grid cannot be reached cost effectively. May provide an extra contribution to national electrical production for peak demand. Substituting traditional fuels by a switch to electricity can reduce air pollution, improve health and decrease social burdens, (e.g. from collecting firewood). The electricity can be used to increase income generating activities. Job creation
The challenge for small hydro implementation is the need to have innovative financing mechanism aimed at leveraging the relatively higher electricity generating costs compared to big hydro. Lack of detailed resource potential assessments .
Biomass Gasifier
Biomass gasification for off grid applications involves production of gaseous fuel called producer gas used in a gas engines and modified gasoline and diesel internal combustion engines for electricity generation. Producer gas can also be used to produce steam which is then expanded on a steam reciprocating internal engines to produce electricity. The generating costs range between 8-12 US$ cents/kWh and corresponding capacity ranging between 20-50000 kW. The investment cost range between 1800-2100 US$/Kw
Besides providing electricity to isolated areas in rural areas and associated benefits elaborated under small hydro is the additional employment created for the feedstock providers who are mostly small and medium scale farmers and foresters.
The challenge for biomass gasification implementation lack of awareness for sensitising policy makers and financial providers on the potential of the technology and innovative financing mechanism aimed at leveraging the relatively higher electricity generating costs compared to other traditional energy supply systems.
Biogas digester
Biogas is generated during anaerobic digestion processes using waste water, solid waste (e.g. at landfills), organic waste, e.g. animal manure, and other sources of biomass. Can be used in a gas engines and modified gasoline and diesel internal combustion engines for electricity generation or used to produce steam which is then expanded on a steam reciprocating internal
Benefits include social benefits (smoke-free and ash-free kitchen, so women and their children are no longer prone to respiratory infections; women are spared the burden of gathering firewood), increases sanitation; reduce deforestation levels where people heavily rely on woodfuel; sludge remaining after digestion is a good
Challenges include need to have awareness and information programme for sensitising policy makers and financial providers on the potential of the technology and innovative financing mechanism aimed at leveraging the relatively higher electricity generating costs
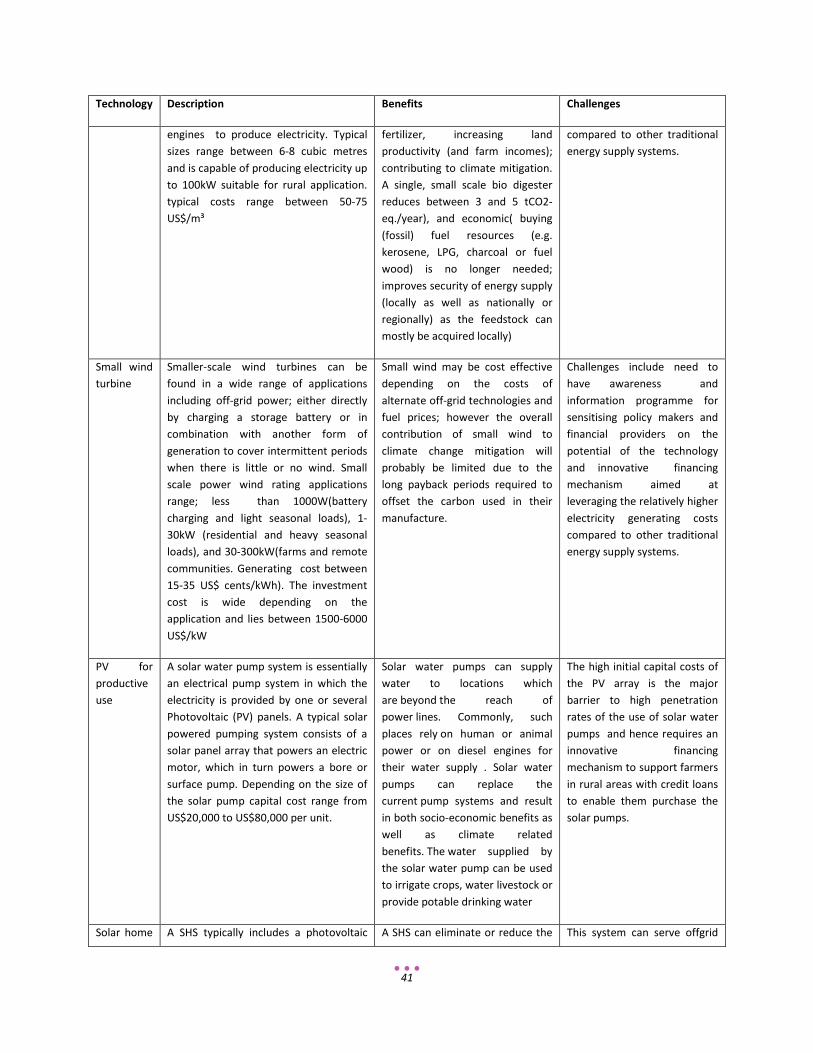
41
Technology Description Benefits Challenges
engines to produce electricity. Typical sizes range between 6-8 cubic metres and is capable of producing electricity up to 100kW suitable for rural application. typical costs range between 50-75 US$/m³
fertilizer, increasing land productivity (and farm incomes); contributing to climate mitigation. A single, small scale bio digester reduces between 3 and 5 tCO2-eq./year), and economic( buying (fossil) fuel resources (e.g. kerosene, LPG, charcoal or fuel wood) is no longer needed; improves security of energy supply (locally as well as nationally or regionally) as the feedstock can mostly be acquired locally)
compared to other traditional energy supply systems.
Small wind turbine
Smaller-scale wind turbines can be found in a wide range of applications including off-grid power; either directly by charging a storage battery or in combination with another form of generation to cover intermittent periods when there is little or no wind. Small scale power wind rating applications range; less than 1000W(battery charging and light seasonal loads), 1-30kW (residential and heavy seasonal loads), and 30-300kW(farms and remote communities. Generating cost between 15-35 US$ cents/kWh). The investment cost is wide depending on the application and lies between 1500-6000 US$/kW
Small wind may be cost effective depending on the costs of alternate off-grid technologies and fuel prices; however the overall contribution of small wind to climate change mitigation will probably be limited due to the long payback periods required to offset the carbon used in their manufacture.
Challenges include need to have awareness and information programme for sensitising policy makers and financial providers on the potential of the technology and innovative financing mechanism aimed at leveraging the relatively higher electricity generating costs compared to other traditional energy supply systems.
PV for productive use
A solar water pump system is essentially an electrical pump system in which the electricity is provided by one or several Photovoltaic (PV) panels. A typical solar powered pumping system consists of a solar panel array that powers an electric motor, which in turn powers a bore or surface pump. Depending on the size of the solar pump capital cost range from US$20,000 to US$80,000 per unit.
Solar water pumps can supply water to locations which are beyond the reach of power lines. Commonly, such places rely on human or animal power or on diesel engines for their water supply . Solar water pumps can replace the current pump systems and result in both socio-economic benefits as well as climate related benefits. The water supplied by the solar water pump can be used to irrigate crops, water livestock or provide potable drinking water
The high initial capital costs of the PV array is the major barrier to high penetration rates of the use of solar water pumps and hence requires an innovative financing mechanism to support farmers in rural areas with credit loans to enable them purchase the solar pumps.
Solar home A SHS typically includes a photovoltaic A SHS can eliminate or reduce the This system can serve offgrid
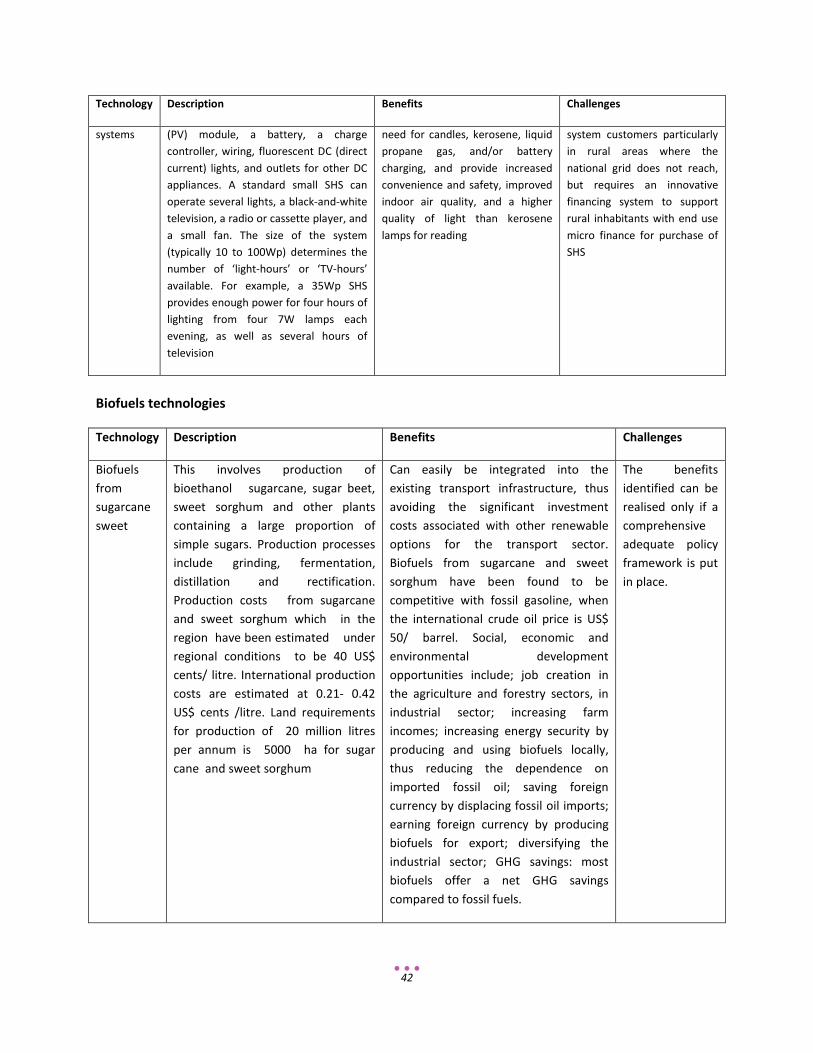
42
Technology Description Benefits Challenges
systems (PV) module, a battery, a charge controller, wiring, fluorescent DC (direct current) lights, and outlets for other DC appliances. A standard small SHS can operate several lights, a black-and-white television, a radio or cassette player, and a small fan. The size of the system (typically 10 to 100Wp) determines the number of ‘light-hours’ or ‘TV-hours’ available. For example, a 35Wp SHS provides enough power for four hours of lighting from four 7W lamps each evening, as well as several hours of television
need for candles, kerosene, liquid propane gas, and/or battery charging, and provide increased convenience and safety, improved indoor air quality, and a higher quality of light than kerosene lamps for reading
system customers particularly in rural areas where the national grid does not reach, but requires an innovative financing system to support rural inhabitants with end use micro finance for purchase of SHS
Biofuels technologies
Technology Description Benefits Challenges
Biofuels from sugarcane sweet
This involves production of bioethanol sugarcane, sugar beet, sweet sorghum and other plants containing a large proportion of simple sugars. Production processes include grinding, fermentation, distillation and rectification. Production costs from sugarcane and sweet sorghum which in the region have been estimated under regional conditions to be 40 US$ cents/ litre. International production costs are estimated at 0.21- 0.42 US$ cents /litre. Land requirements for production of 20 million litres per annum is 5000 ha for sugar cane and sweet sorghum
Can easily be integrated into the existing transport infrastructure, thus avoiding the significant investment costs associated with other renewable options for the transport sector. Biofuels from sugarcane and sweet sorghum have been found to be competitive with fossil gasoline, when the international crude oil price is US$ 50/ barrel. Social, economic and environmental development opportunities include; job creation in the agriculture and forestry sectors, in industrial sector; increasing farm incomes; increasing energy security by producing and using biofuels locally, thus reducing the dependence on imported fossil oil; saving foreign currency by displacing fossil oil imports; earning foreign currency by producing biofuels for export; diversifying the industrial sector; GHG savings: most biofuels offer a net GHG savings compared to fossil fuels.
The benefits identified can be realised only if a comprehensive adequate policy framework is put in place.

43
Technology Description Benefits Challenges
Bioethanol from maize
1st generation bioethanol, also known as carbohydrate ethanol, can be produced from starch based crops such as maize. Unlike bioethanol from sugar based stocks, bioethanol production from this feedstock requires an additional process hydrolysis process to convert into sugar and this requires additional investment. Production costs from maize in the region have been estimated under regional conditions to be 60 US$ cents/litre. Land requirements, to produce 50,000 tonnes of bioethanol per annum from maize requires 24,000 ha of land.
Social, economic and environmental development opportunities include: job creation in the agriculture and forestry sectors, Job creation in the industrial sector; increasing farm incomes; increasing energy security by producing and using biofuels locally, thus reducing the dependence on imported fossil oil; saving foreign currency by displacing fossil oil imports; earning foreign currency by producing biofuels for export; diversifying the industrial sector; GHG savings: most biofuels offer a net GHG savings compared to fossil fuels.
The challenge for bioethanol from maize is relatively higher than that from ethanol and requires subsides for its implementation. It also competes with food since maize is used as a staple food for African countries.
Biofuels from Second Generation
Bioethanol can also be made from 2nd generation feedstocks to include agriculture and forest wastes, short rotational crops but requires additional processes and expensive enzymes to convert the starch into sugars.
Bioethanol from this feedstock uses waste material and does not pose a challenge for deforestation
The current challenge is that the price of bioethanol from this source is prohibitive and does not compete with fossil gasoline.
Biodiesel from jatropha
Bio Diesel fuel can be produced from oilseed plants such as sunflower, soy beans, and jatropha. Bio Diesel can be used alone or mixed in any ratio with mineral oil diesel fuel. Production costs for jatropha based biodiesel have been estimated under regional conditions to be 0.50 US$ cents /litre as long as the price of crude oil is more than 60 US$/barrel. Those of soy beans and sunflower have been calculated at 5.3 and 1.1 US$/litre, respectively. Land requirements for production of 50,000 tonnes of biodiesel per annum is 44,000 ha for jatropha as
Can easily be integrated into the existing transport infrastructure, thus avoiding the often prohibitive investment costs associated with other renewable options for the transport sector. Biodiesel in particular from jatropha can have significant benefits in terms of GHG emissions and socio-economic development to include job creation in the agriculture and forestry sectors, with significant unused land resources and a large pool of unskilled workers; increasing farm incomes; increasing energy security by producing and using biofuels locally, thus reducing the dependence on imported fossil oil;
The benefits identified can be realised only if a comprehensive adequate policy framework is put in place.

44
Technology Description Benefits Challenges
compared to 124,000 ha for soy beans and 57,000 ha for sunflower.
saving foreign currency by displacing fossil oil imports; earning foreign currency by producing biofuels for export.
Biodiesel from soy beam
Production costs for soy beans have been estimated under regional conditions to be 5.30 US$ cents /litre. In terms of land requirements soy beans require 124,000 ha to produce 50,000 tonnes of biodiesel per annum.
The benefits are limited since soy beans is a food crop in the Zambia region.
The cost of biodiesel from this feedstock is prohibitive and does not compete with fossil diesel
Biodiesel from sun flower
Production costs for sunflower have been estimated under regional conditions to be 1.10 US$ cents /litre. Land requirements for production of 50,000 tonnes of biodiesel per annum from sunflower is 57,000 ha.
The benefits are limited since soy beans is a food crop in Zambia region.
The cost of biodiesel from this feedstock is prohibitive and does not compete with fossil diesel
Transport Technology Description Benefits Challenges
Bus Rapid Transit systems
A bus rapid transit system (BRT) is a high-capacity transport system with its own right of way, and can be described as being a systematic combination of infrastructure (busways, stations, terminals) with organized operations and intelligent technologies to provide a higher quality experience than possible with traditional bus operation. To be most effective, BRT systems (like other transport initiatives) should be part of a comprehensive strategy that includes increasing vehicle and fuel taxes, strict land-use controls, limits and higher fees on parking, and integrating transit systems into a
BRTs can make an important contribution to a sustainable urban transport system. It is more energy efficient than conventional bus systems per person-kilometre due to the higher speeds and higher capacity buses. Also it may improve the modal split towards more use of public transport. Thereby it contributes to the following aspects of sustainable development; (i) reduction of air pollution, (ii) reduction of GHG emissions, (iii) congestion reduction, (iv) increase in
BRT has the following challenges that the following should be taken into account:
(i) Public acceptance of the BRT and awareness of the diverse benefits (social, environmental, etc)
(ii) Appropriate consideration of non-technical aspects
(iii) Careful planning, for example in order to avoid bus overcrowding during peak periods.
(iv) Possible resistance by
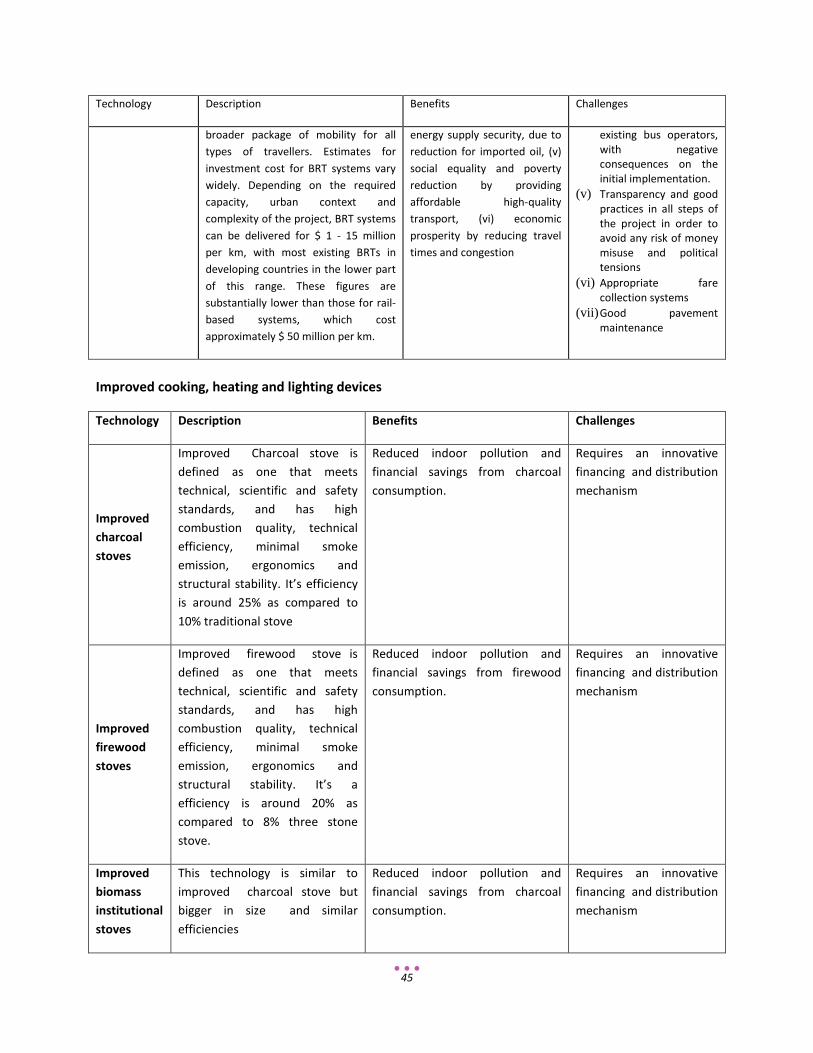
45
Technology Description Benefits Challenges
broader package of mobility for all types of travellers. Estimates for investment cost for BRT systems vary widely. Depending on the required capacity, urban context and complexity of the project, BRT systems can be delivered for $ 1 - 15 million per km, with most existing BRTs in developing countries in the lower part of this range. These figures are substantially lower than those for rail-based systems, which cost approximately $ 50 million per km.
energy supply security, due to reduction for imported oil, (v) social equality and poverty reduction by providing affordable high-quality transport, (vi) economic prosperity by reducing travel times and congestion
existing bus operators, with negative consequences on the initial implementation.
(v) Transparency and good practices in all steps of the project in order to avoid any risk of money misuse and political tensions
(vi) Appropriate fare collection systems
(vii) Good pavement maintenance
Improved cooking, heating and lighting devices
Technology Description Benefits Challenges
Improved charcoal stoves
Improved Charcoal stove is defined as one that meets technical, scientific and safety standards, and has high combustion quality, technical efficiency, minimal smoke emission, ergonomics and structural stability. It’s efficiency is around 25% as compared to 10% traditional stove
Reduced indoor pollution and financial savings from charcoal consumption.
Requires an innovative financing and distribution mechanism
Improved firewood stoves
Improved firewood stove is defined as one that meets technical, scientific and safety standards, and has high combustion quality, technical efficiency, minimal smoke emission, ergonomics and structural stability. It’s a efficiency is around 20% as compared to 8% three stone stove.
Reduced indoor pollution and financial savings from firewood consumption.
Requires an innovative financing and distribution mechanism
Improved biomass institutional stoves
This technology is similar to improved charcoal stove but bigger in size and similar efficiencies
Reduced indoor pollution and financial savings from charcoal consumption.
Requires an innovative financing and distribution mechanism

46
Technology Description Benefits Challenges
Biogas for cooking
Biogas can be produced on a very small scale for household use, mainly for cooking and water heating or on larger industrial scale. Small scale biogas for household use is a simple, low-cost, low-maintenance technology, which has been used for decades across the developing world. Such small-scale applications are mostly implemented through programmes supported by governments. In such cases, it usually concerns rural areas and communities without connection to the grid. Although some cattle would be needed to feed the digester (about seven) and water needs to be available as well, other requirements are rather low. A rough estimate of costs of a simple, unheated biogas plant, including all essential installations but not including land, is between 50-75 US$ per m3 capacity. 35 - 40% of the total costs are for the digester
Social benefits are (smoke-free and ash-free kitchen, so women and their children are no longer prone to respiratory infections; women are spared the burden of gathering firewood); Environmental and health benefits (keeping manure and waste in a confined area and processing them in the digester reduces the amount of pollutants in the immediate environment and increases sanitation, households no longer need to extract wood for cooking, which can reduce deforestation levels where people heavily rely on woodfuel, the sludge remaining after digestion is a good fertilizer, increasing land productivity and farm incomes, the release of methane is avoided thus contributing to climate mitigation. A single, small scale bio digester reduces between 3 and 5 tCO2-eq./year); Economic benefits (buying (fossil) fuel resources (e.g. kerosene, LPG, charcoal or fuel wood) is no longer needed
The main challenge is cultural among the rural communities associated with animal waste and let alone human waste and high prohibitive cost
Solar for cooking
The solar cooker concentrates and bends solar radiation with the help of a reflecting surface on the back, top, and bottom sides of a pot. There are a variety of types of solar cookers. According to the design, solar cookers are of three types: box cooker, panel cooker and a parabolic cooker. Investment cost for a solar cooker ranges between US$ 20-30 per unit.
Handling it is easy, but the solar cooker does need its space: the larger the reflector surface, the stronger its power to heat.
Currently, the use of solar ovens is very limited among the rural communities of the developing countries. This is due to their high manufacturing costs and the inappropriateness of current designs for multiple environments. Many designs utilise material that is not locally available, or require highly skilled labour. The technology can only be

47
Technology Description Benefits Challenges
used outdoors, during the day and is dependent upon the weather.
Ethanol (gel fuel)
Alcohol burning stoves based on ethanol can be used for cooking, water heating and heating of buildings. The technology can be applied in households, institutions (e.g. schools), industries where it is used for boiler heating and in catering industry where it is used for keeping food warm. Ethanol is produced from sugar plants or other sources of biomass.
An ethanol gel stove could cost between USD 2 and USD 20 per unit and the fuel cost would be USD 0.30-0.70/litre of ethanol. Five litres of gel costs about $9.70 and paraffin costs approximately $3.55 for the same amount A two-plate stove sells for R160 (approx. $25 USD) and a lamp for R50 (around $8) in South Africa.
An advantage of the technologies is that ethanol burning does not have the air pollution problems of simple biomass burning for cooking purposes. As ethanol provides a higher heat flux with no soot or smoke, cooking and hot water production can take place faster and pollution free. The greenhouse gas emission reduction contribution from ethanol cook stoves depends on the feedstock used for the ethanol, the distance from feedstock location to ethanol production, and what it replaces.
The challenge lies in the source of production of gel fuel since it requires initially to produce to produce ethanol which is mixed with a gel and currently there are no small scale ethanol production systems
Solar lanterns
solar PV systems including whole-home systems and lantern that are charged from solar can be clean source of lighting in homes and some institutions such as rural clinics and schools. Technology is mature but management of systems is still important. Solar lanterns cost end users between US$10 and US$45, depending on the model. Solar home and institutional systems depend on sizes but range from US$7-12/Watt.
In rural areas where electricity is not available, this will be benefit for many purposes e.g. providing lighting for students studying in schools and homes, lighting for women giving birth at night in clinics
Prices are still high for home systems and in case of institutions government provides systems but maintenance then requires local capacity.
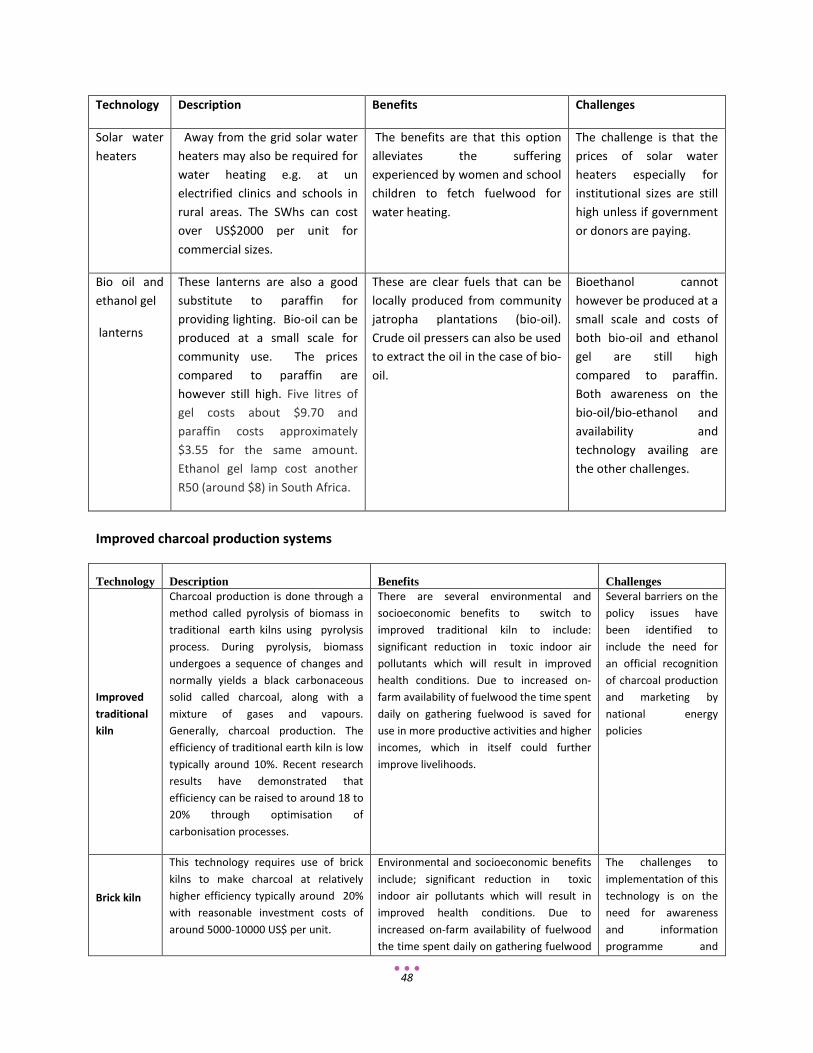
48
Technology Description Benefits Challenges
Solar water heaters
Away from the grid solar water heaters may also be required for water heating e.g. at un electrified clinics and schools in rural areas. The SWhs can cost over US$2000 per unit for commercial sizes.
The benefits are that this option alleviates the suffering experienced by women and school children to fetch fuelwood for water heating.
The challenge is that the prices of solar water heaters especially for institutional sizes are still high unless if government or donors are paying.
Bio oil and ethanol gel
lanterns
These lanterns are also a good substitute to paraffin for providing lighting. Bio-oil can be produced at a small scale for community use. The prices compared to paraffin are however still high. Five litres of gel costs about $9.70 and paraffin costs approximately $3.55 for the same amount. Ethanol gel lamp cost another R50 (around $8) in South Africa.
These are clear fuels that can be locally produced from community jatropha plantations (bio-oil). Crude oil pressers can also be used to extract the oil in the case of bio-oil.
Bioethanol cannot however be produced at a small scale and costs of both bio-oil and ethanol gel are still high compared to paraffin. Both awareness on the bio-oil/bio-ethanol and availability and technology availing are the other challenges.
Improved charcoal production systems
Technology Description Benefits Challenges
Improved traditional kiln
Charcoal production is done through a method called pyrolysis of biomass in traditional earth kilns using pyrolysis process. During pyrolysis, biomass undergoes a sequence of changes and normally yields a black carbonaceous solid called charcoal, along with a mixture of gases and vapours. Generally, charcoal production. The efficiency of traditional earth kiln is low typically around 10%. Recent research results have demonstrated that efficiency can be raised to around 18 to 20% through optimisation of carbonisation processes.
There are several environmental and socioeconomic benefits to switch to improved traditional kiln to include: significant reduction in toxic indoor air pollutants which will result in improved health conditions. Due to increased on-farm availability of fuelwood the time spent daily on gathering fuelwood is saved for use in more productive activities and higher incomes, which in itself could further improve livelihoods.
Several barriers on the policy issues have been identified to include the need for an official recognition of charcoal production and marketing by national energy policies
Brick kiln
This technology requires use of brick kilns to make charcoal at relatively higher efficiency typically around 20% with reasonable investment costs of around 5000-10000 US$ per unit.
Environmental and socioeconomic benefits include; significant reduction in toxic indoor air pollutants which will result in improved health conditions. Due to increased on-farm availability of fuelwood the time spent daily on gathering fuelwood
The challenges to implementation of this technology is on the need for awareness and information programme and
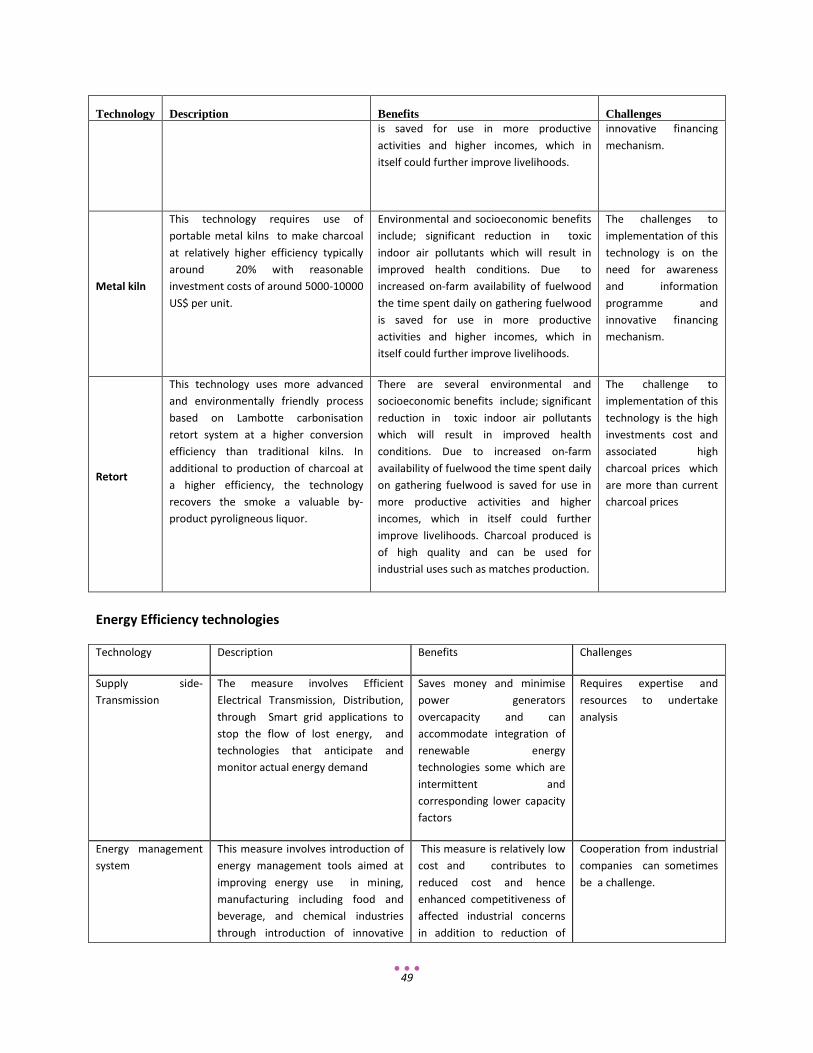
49
Technology Description Benefits Challenges is saved for use in more productive activities and higher incomes, which in itself could further improve livelihoods.
innovative financing mechanism.
Metal kiln
This technology requires use of portable metal kilns to make charcoal at relatively higher efficiency typically around 20% with reasonable investment costs of around 5000-10000 US$ per unit.
Environmental and socioeconomic benefits include; significant reduction in toxic indoor air pollutants which will result in improved health conditions. Due to increased on-farm availability of fuelwood the time spent daily on gathering fuelwood is saved for use in more productive activities and higher incomes, which in itself could further improve livelihoods.
The challenges to implementation of this technology is on the need for awareness and information programme and innovative financing mechanism.
Retort
This technology uses more advanced and environmentally friendly process based on Lambotte carbonisation retort system at a higher conversion efficiency than traditional kilns. In additional to production of charcoal at a higher efficiency, the technology recovers the smoke a valuable by-product pyroligneous liquor.
There are several environmental and socioeconomic benefits include; significant reduction in toxic indoor air pollutants which will result in improved health conditions. Due to increased on-farm availability of fuelwood the time spent daily on gathering fuelwood is saved for use in more productive activities and higher incomes, which in itself could further improve livelihoods. Charcoal produced is of high quality and can be used for industrial uses such as matches production.
The challenge to implementation of this technology is the high investments cost and associated high charcoal prices which are more than current charcoal prices
Energy Efficiency technologies
Technology Description Benefits Challenges
Supply side-Transmission
The measure involves Efficient Electrical Transmission, Distribution, through Smart grid applications to stop the flow of lost energy, and technologies that anticipate and monitor actual energy demand
Saves money and minimise power generators overcapacity and can accommodate integration of renewable energy technologies some which are intermittent and corresponding lower capacity factors
Requires expertise and resources to undertake analysis
Energy management system
This measure involves introduction of energy management tools aimed at improving energy use in mining, manufacturing including food and beverage, and chemical industries through introduction of innovative
This measure is relatively low cost and contributes to reduced cost and hence enhanced competitiveness of affected industrial concerns in addition to reduction of
Cooperation from industrial companies can sometimes be a challenge.

50
Technology Description Benefits Challenges
technologies to include onsite on site electricity generation , energy system optimisation and energy management standards
GHG emissions
Industrial and commercial end-use energy efficiency (for commercial/industrial and mining)
The measures include air conditioning efficiency, load control measures, ripple control technologies, etc
This measure contributes to reduction in electrical energy demand and avoids premature investments in energy supply in addition to reducing GHG emissions and air pollution.
May need barrier removal for consumers to be aware and be availed with commercial loans for implementation. Funding probably recoverable through savings
Household end-use energy efficiency
This measure involves use of Compact Fluorescent Lights (CFL) or Light Emitting Diodes lights (LEDs) and solar water heater (for domestic and commercial entities)
This measure contributes to reduction in electrical energy demand and avoid premature investments in energy supply and reduces household electricity bills in addition to reducing GHG emissions
May need barrier removal for consumers to be aware and be availed with commercial loans for implementation. Funding probably recoverable through savings. Might require legislation banning the use of Incandescent Lamps
Energy Efficiency and Conservation in buildings
energy audits, operation and maintenance manuals, energy management practices, energy efficiency guidelines and regulations
There are large opportunities that can be tapped in introduction of energy efficiency measures such as insulation, improving lighting, and energy conservation measures. Some initiatives have started with government buildings e.g. in Botswana, South Africa through Danish support.
The process requires to start with energy audits and capacity for that in terms of energy auditors needs to be upgraded in the region. There is also no clear incentives or regulation that can encourage energy audits and energy management practices in buildings.
Long list of mitigation technologies-Agriculture sector
Subsectors Technology Description Benefits Challenges
Sustainable agriculture
Development of Green Manure and Cover crops for soil improvements
The measure involves growing of green manure crop such as velvet beans, sunhemp, pigeon peas, cowpeas in rotation with cereals
Less use of mineral nitrogen leading to less loss of N2O, nutrition protein food, and measure breaks soil pan leading to less run-off
More resources required in initial development and farm application of the crops
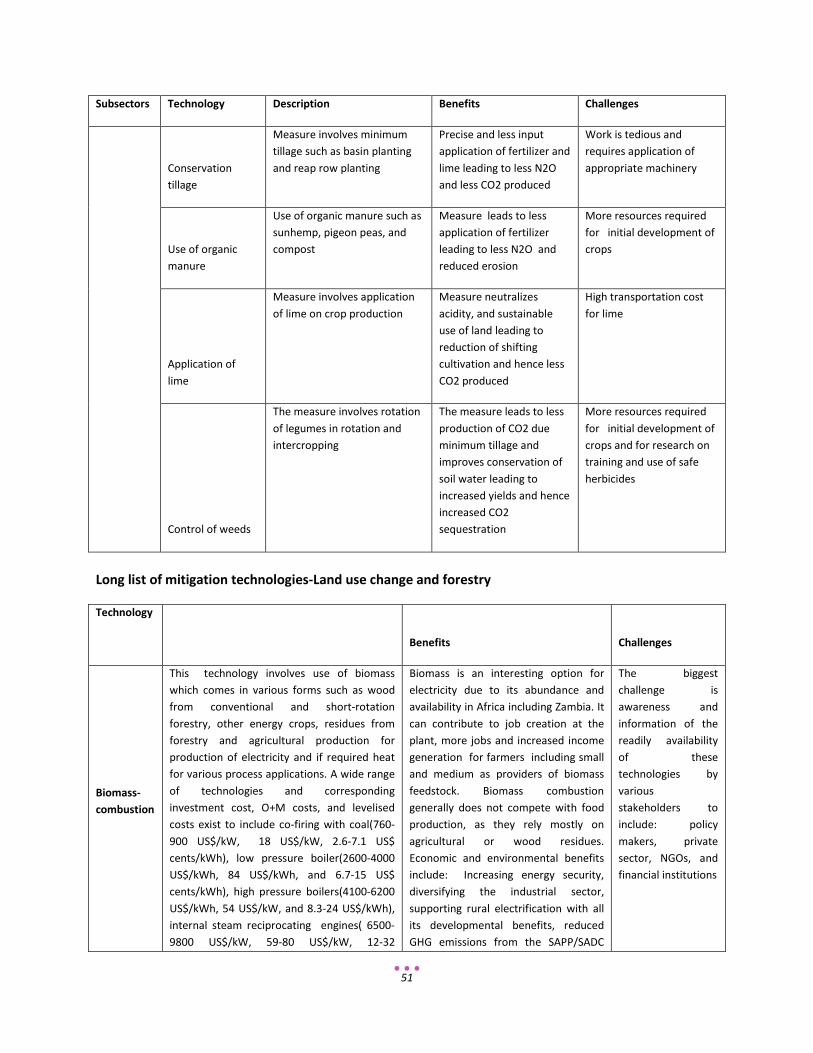
51
Subsectors Technology Description Benefits Challenges
Conservation tillage
Measure involves minimum tillage such as basin planting and reap row planting
Precise and less input application of fertilizer and lime leading to less N2O and less CO2 produced
Work is tedious and requires application of appropriate machinery
Use of organic manure
Use of organic manure such as sunhemp, pigeon peas, and compost
Measure leads to less application of fertilizer leading to less N2O and reduced erosion
More resources required for initial development of crops
Application of lime
Measure involves application of lime on crop production
Measure neutralizes acidity, and sustainable use of land leading to reduction of shifting cultivation and hence less CO2 produced
High transportation cost for lime
Control of weeds
The measure involves rotation of legumes in rotation and intercropping
The measure leads to less production of CO2 due minimum tillage and improves conservation of soil water leading to increased yields and hence increased CO2 sequestration
More resources required for initial development of crops and for research on training and use of safe herbicides
Long list of mitigation technologies-Land use change and forestry
Technology
Benefits Challenges
Biomass-combustion
This technology involves use of biomass which comes in various forms such as wood from conventional and short-rotation forestry, other energy crops, residues from forestry and agricultural production for production of electricity and if required heat for various process applications. A wide range of technologies and corresponding investment cost, O+M costs, and levelised costs exist to include co-firing with coal(760-900 US$/kW, 18 US$/kW, 2.6-7.1 US$ cents/kWh), low pressure boiler(2600-4000 US$/kWh, 84 US$/kWh, and 6.7-15 US$ cents/kWh), high pressure boilers(4100-6200 US$/kWh, 54 US$/kW, and 8.3-24 US$/kWh), internal steam reciprocating engines( 6500-9800 US$/kW, 59-80 US$/kW, 12-32
Biomass is an interesting option for electricity due to its abundance and availability in Africa including Zambia. It can contribute to job creation at the plant, more jobs and increased income generation for farmers including small and medium as providers of biomass feedstock. Biomass combustion generally does not compete with food production, as they rely mostly on agricultural or wood residues. Economic and environmental benefits include: Increasing energy security, diversifying the industrial sector, supporting rural electrification with all its developmental benefits, reduced GHG emissions from the SAPP/SADC
The biggest challenge is awareness and information of the readily availability of these technologies by various stakeholders to include: policy makers, private sector, NGOs, and financial institutions
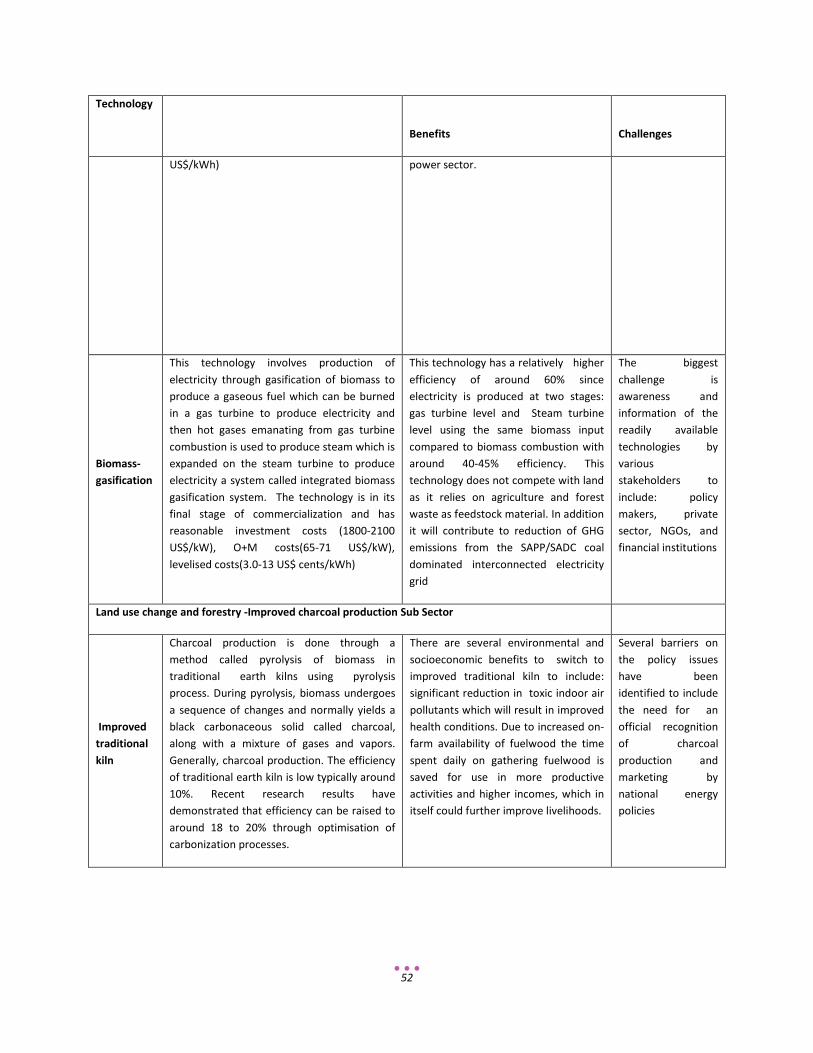
52
Technology
Benefits Challenges
US$/kWh) power sector.
Biomass-gasification
This technology involves production of electricity through gasification of biomass to produce a gaseous fuel which can be burned in a gas turbine to produce electricity and then hot gases emanating from gas turbine combustion is used to produce steam which is expanded on the steam turbine to produce electricity a system called integrated biomass gasification system. The technology is in its final stage of commercialization and has reasonable investment costs (1800-2100 US$/kW), O+M costs(65-71 US$/kW), levelised costs(3.0-13 US$ cents/kWh)
This technology has a relatively higher efficiency of around 60% since electricity is produced at two stages: gas turbine level and Steam turbine level using the same biomass input compared to biomass combustion with around 40-45% efficiency. This technology does not compete with land as it relies on agriculture and forest waste as feedstock material. In addition it will contribute to reduction of GHG emissions from the SAPP/SADC coal dominated interconnected electricity grid
The biggest challenge is awareness and information of the readily available technologies by various stakeholders to include: policy makers, private sector, NGOs, and financial institutions
Land use change and forestry -Improved charcoal production Sub Sector
Improved traditional kiln
Charcoal production is done through a method called pyrolysis of biomass in traditional earth kilns using pyrolysis process. During pyrolysis, biomass undergoes a sequence of changes and normally yields a black carbonaceous solid called charcoal, along with a mixture of gases and vapors. Generally, charcoal production. The efficiency of traditional earth kiln is low typically around 10%. Recent research results have demonstrated that efficiency can be raised to around 18 to 20% through optimisation of carbonization processes.
There are several environmental and socioeconomic benefits to switch to improved traditional kiln to include: significant reduction in toxic indoor air pollutants which will result in improved health conditions. Due to increased on-farm availability of fuelwood the time spent daily on gathering fuelwood is saved for use in more productive activities and higher incomes, which in itself could further improve livelihoods.
Several barriers on the policy issues have been identified to include the need for an official recognition of charcoal production and marketing by national energy policies

53
Technology
Benefits Challenges
Brick kiln
This technology requires use of brick kilns to make charcoal at relatively higher efficiency typically around 20% with reasonable investment costs of around 5000-10000 US$ per unit.
Environmental and socioeconomic benefits include; significant reduction in toxic indoor air pollutants which will result in improved health conditions. Due to increased on-farm availability of fuelwood the time spent daily on gathering fuelwood is saved for use in more productive activities and higher incomes, which in itself could further improve livelihoods.
The challenges to implementation of this technology is on the need for awareness and information programme and innovative financing mechanism.
Metal kiln
This technology requires use of portable metal kilns to make charcoal at relatively higher efficiency typically around 20% with reasonable investment costs of around 5000-10000 US$ per unit.
Environmental and socioeconomic benefits include; significant reduction in toxic indoor air pollutants which will result in improved health conditions. Due to increased on-farm availability of fuelwood the time spent daily on gathering fuelwood is saved for use in more productive activities and higher incomes, which in itself could further improve livelihoods.
The challenges to implementation of this technology is on the need for awareness and information programme and innovative financing mechanism.
Retort
This technology uses more advanced and environmentally friendly process based on Lambotte carbonization retort system at a higher conversion efficiency than traditional kilns. In additional to production of charcoal at a higher efficiency, the technology recovers the smoke a valuable by-product pyroligneous liquor.
There are several environmental and socioeconomic benefits include; significant reduction in toxic indoor air pollutants which will result in improved health conditions. Due to increased on-farm availability of fuelwood the time spent daily on gathering fuelwood is saved for use in more productive activities and higher incomes, which in itself could further improve livelihoods. Charcoal produced is of high quality and can be used for industrial uses such as matches production.
The challenge to implementation of this technology is the high investments cost and associated high charcoal prices which are more than current charcoal prices
Land use change and forestry-Improved biomass stoves Sub Sector
Improved charcoal stoves
Improved Charcoal stove is defined as one that meets technical, scientific and safety standards, and has high combustion quality, technical efficiency, minimal smoke emission, ergonomics and structural stability. It’s efficiency is around 25% as compared to 10% traditional stove
Reduced indoor pollution and financial savings from charcoal consumption.
Requires an innovative financing mechanism
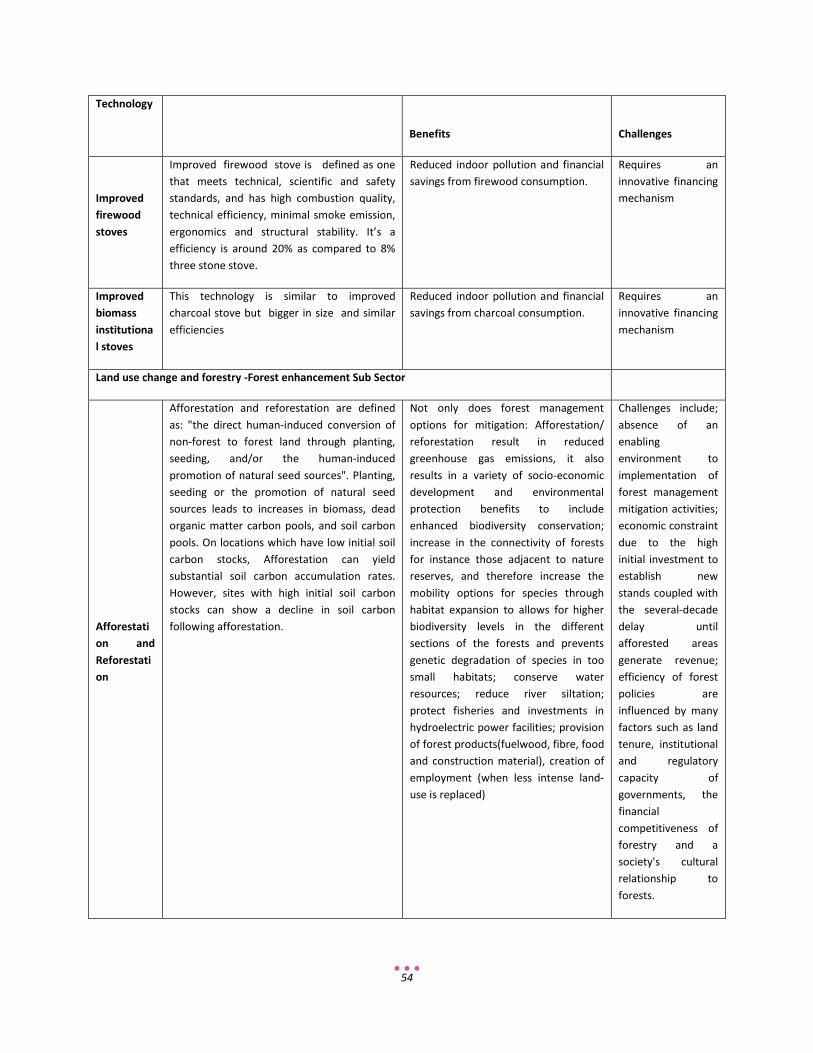
54
Technology
Benefits Challenges
Improved firewood stoves
Improved firewood stove is defined as one that meets technical, scientific and safety standards, and has high combustion quality, technical efficiency, minimal smoke emission, ergonomics and structural stability. It’s a efficiency is around 20% as compared to 8% three stone stove.
Reduced indoor pollution and financial savings from firewood consumption.
Requires an innovative financing mechanism
Improved biomass institutional stoves
This technology is similar to improved charcoal stove but bigger in size and similar efficiencies
Reduced indoor pollution and financial savings from charcoal consumption.
Requires an innovative financing mechanism
Land use change and forestry -Forest enhancement Sub Sector
Afforestation and Reforestation
Afforestation and reforestation are defined as: "the direct human-induced conversion of non-forest to forest land through planting, seeding, and/or the human-induced promotion of natural seed sources". Planting, seeding or the promotion of natural seed sources leads to increases in biomass, dead organic matter carbon pools, and soil carbon pools. On locations which have low initial soil carbon stocks, Afforestation can yield substantial soil carbon accumulation rates. However, sites with high initial soil carbon stocks can show a decline in soil carbon following afforestation.
Not only does forest management options for mitigation: Afforestation/ reforestation result in reduced greenhouse gas emissions, it also results in a variety of socio-economic development and environmental protection benefits to include enhanced biodiversity conservation; increase in the connectivity of forests for instance those adjacent to nature reserves, and therefore increase the mobility options for species through habitat expansion to allows for higher biodiversity levels in the different sections of the forests and prevents genetic degradation of species in too small habitats; conserve water resources; reduce river siltation; protect fisheries and investments in hydroelectric power facilities; provision of forest products(fuelwood, fibre, food and construction material), creation of employment (when less intense land- use is replaced)
Challenges include; absence of an enabling environment to implementation of forest management mitigation activities; economic constraint due to the high initial investment to establish new stands coupled with the several-decade delay until afforested areas generate revenue; efficiency of forest policies are influenced by many factors such as land tenure, institutional and regulatory capacity of governments, the financial competitiveness of forestry and a society's cultural relationship to forests.
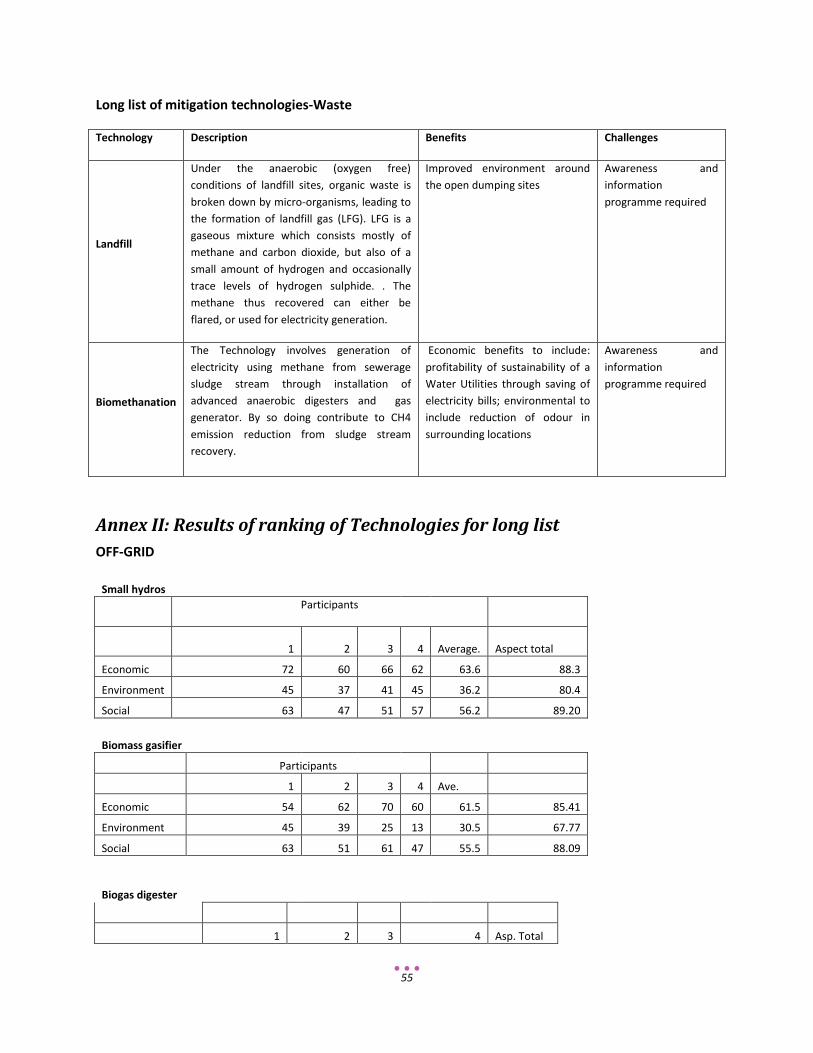
55
Long list of mitigation technologies-Waste
Technology Description Benefits Challenges
Landfill
Under the anaerobic (oxygen free) conditions of landfill sites, organic waste is broken down by micro-organisms, leading to the formation of landfill gas (LFG). LFG is a gaseous mixture which consists mostly of methane and carbon dioxide, but also of a small amount of hydrogen and occasionally trace levels of hydrogen sulphide. . The methane thus recovered can either be flared, or used for electricity generation.
Improved environment around the open dumping sites
Awareness and information programme required
Biomethanation
The Technology involves generation of electricity using methane from sewerage sludge stream through installation of advanced anaerobic digesters and gas generator. By so doing contribute to CH4 emission reduction from sludge stream recovery.
Economic benefits to include: profitability of sustainability of a Water Utilities through saving of electricity bills; environmental to include reduction of odour in surrounding locations
Awareness and information programme required
Annex II: Results of ranking of Technologies for long list OFF-GRID
Small hydros
Participants
1 2 3 4 Average. Aspect total
Economic 72 60 66 62 63.6 88.3
Environment 45 37 41 45 36.2 80.4
Social 63 47 51 57 56.2 89.20
Biomass gasifier Participants
1 2 3 4 Ave.
Economic 54 62 70 60 61.5 85.41
Environment 45 39 25 13 30.5 67.77
Social 63 51 61 47 55.5 88.09
Biogas digester
1 2 3 4 Asp. Total

56
Economic 62 68 72 56 89.58
Environment 45 13 13 37 60
Social 61 55 55 49 87.30
Small wind turbine Participants
1 2 3 4 Ave. Asp. total
Economic 62 64 60 72 64.5 89.58
Environment 45 13 37 13 27 60
Social 57 52 51 53 53.25 84.52
PV for Productive use Participants
1 2 3 4 Ave. Asp. total
Economic 64 58 58 8 47 65.28
Environment 45 45 39 5 33.5 74.44
Social 59 44 49 7 39.75 63.09
Solar home systems
1 2 3 4 Ave. Asp. total
Economic 60 50 62 72 61 84.72
Environment 45 13 33 13 26 57.77
Social 57 57 53 63 57.5 91.26
IMPROVED COOKING AND HEATING AND LIGHTING
Ethanol (gel fuel) Participants
1 2 3 4 5 6 7 Ave. Asp. Total
Economic 48 54 34 32 24 26 36.333333 50.46
Environment 37 37 35 35 29 27 33.333333 74.07
Social 43 57 31 35 29 17 35.333333 56.08
Improved charcoal stoves Participants
1 2 3 4 5 6 7 Ave.
Economic 50 56 44 45 48.75 67.70
Environment 29 45 35 32 35.25 78.33

57
Social 31 51 43 59 46 73.01
Solar lanterns Participants
1 2 3 4 5 6 7 Ave. Asp. Total
Economic 58 34 46 46 63.88
Environment 37 45 35 39 86.67
Social 47 23 29 33 52.38
Solar water heaters Participants
1 2 3 4 5 6 7 Ave. Asp. Total
Economic 52 14 20 28.666667 39.81
Environment 33 45 45 41 91.11
Social 47 13 23 27.666667 43.91
Improved firewood stoves Participants
1 2 3 4 5 6 7 Ave. Asp. Total
Economic 58 56 44 49 51.75 71.87
Environment 25 39 35 39 34.5 76.66
Social 35 51 43 41 42.5 67.46
Improved biomass institutional stoves
Participants
1 2 3 4 5 6 7 Ave. Asp. Total
Economic 52 56 44 46 49.5 68.75
Environment 17 45 35 32 32.25 71.66
Social 39 51 43 59 48 76.19
Solar for cooking Participants
1 2 3 4 5 6 7 Ave. Asp. Total
Economic 54 34 42 43.333333 60.18
Environment 29 35 25 29.666667 65.92
Social 43 31 13 29 46.03
Biogas for cooking Participants
1 2 3 4 5 6 7 Ave. Aspect. total
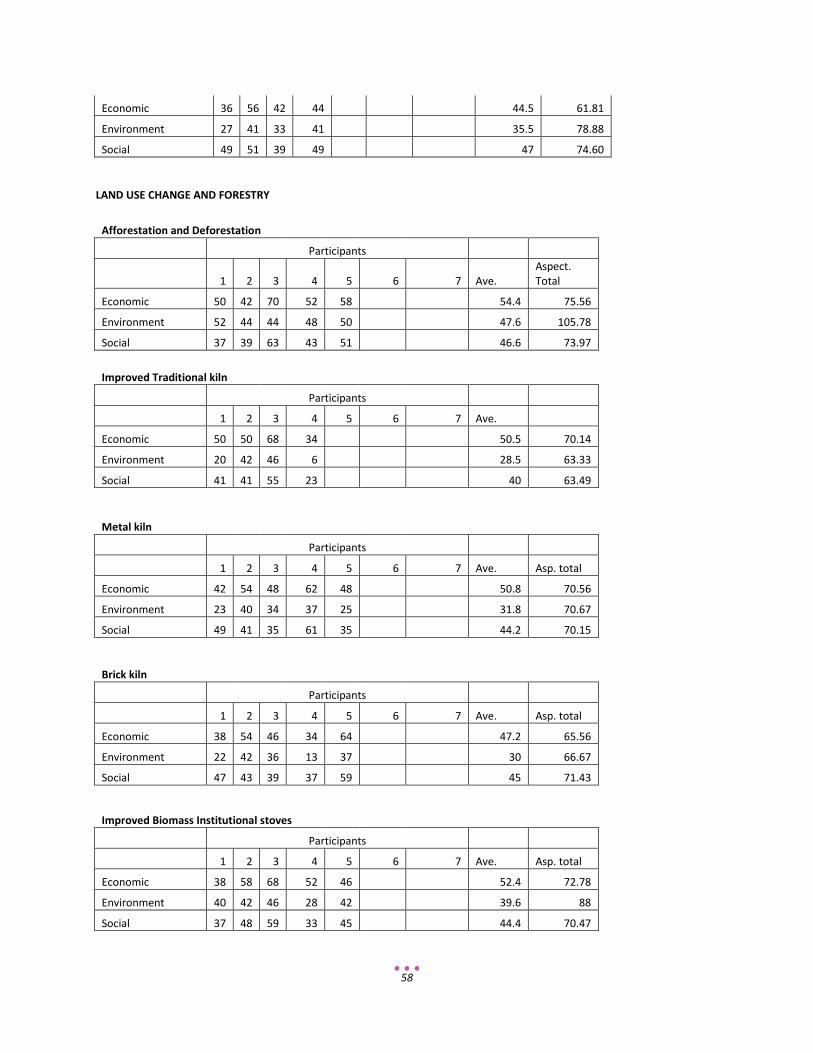
58
Economic 36 56 42 44 44.5 61.81
Environment 27 41 33 41 35.5 78.88
Social 49 51 39 49 47 74.60
LAND USE CHANGE AND FORESTRY
Afforestation and Deforestation Participants
1 2 3 4 5 6 7 Ave. Aspect. Total
Economic 50 42 70 52 58 54.4 75.56
Environment 52 44 44 48 50 47.6 105.78
Social 37 39 63 43 51 46.6 73.97
Improved Traditional kiln Participants
1 2 3 4 5 6 7 Ave.
Economic 50 50 68 34 50.5 70.14
Environment 20 42 46 6 28.5 63.33
Social 41 41 55 23 40 63.49
Metal kiln Participants
1 2 3 4 5 6 7 Ave. Asp. total
Economic 42 54 48 62 48 50.8 70.56
Environment 23 40 34 37 25 31.8 70.67
Social 49 41 35 61 35 44.2 70.15
Brick kiln Participants
1 2 3 4 5 6 7 Ave. Asp. total
Economic 38 54 46 34 64 47.2 65.56
Environment 22 42 36 13 37 30 66.67
Social 47 43 39 37 59 45 71.43
Improved Biomass Institutional stoves Participants
1 2 3 4 5 6 7 Ave. Asp. total
Economic 38 58 68 52 46 52.4 72.78
Environment 40 42 46 28 42 39.6 88
Social 37 48 59 33 45 44.4 70.47
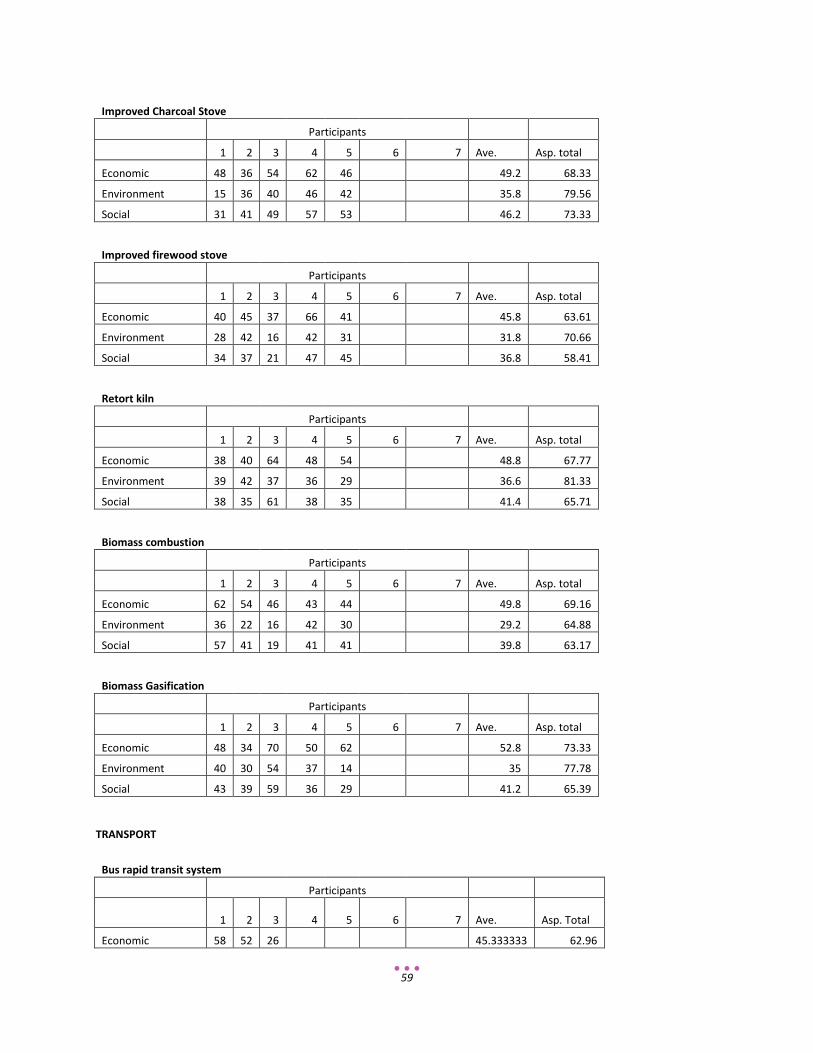
59
Improved Charcoal Stove Participants
1 2 3 4 5 6 7 Ave. Asp. total
Economic 48 36 54 62 46 49.2 68.33
Environment 15 36 40 46 42 35.8 79.56
Social 31 41 49 57 53 46.2 73.33
Improved firewood stove Participants
1 2 3 4 5 6 7 Ave. Asp. total
Economic 40 45 37 66 41 45.8 63.61
Environment 28 42 16 42 31 31.8 70.66
Social 34 37 21 47 45 36.8 58.41
Retort kiln Participants
1 2 3 4 5 6 7 Ave. Asp. total
Economic 38 40 64 48 54 48.8 67.77
Environment 39 42 37 36 29 36.6 81.33
Social 38 35 61 38 35 41.4 65.71
Biomass combustion Participants
1 2 3 4 5 6 7 Ave. Asp. total
Economic 62 54 46 43 44 49.8 69.16
Environment 36 22 16 42 30 29.2 64.88
Social 57 41 19 41 41 39.8 63.17
Biomass Gasification Participants
1 2 3 4 5 6 7 Ave. Asp. total
Economic 48 34 70 50 62 52.8 73.33
Environment 40 30 54 37 14 35 77.78
Social 43 39 59 36 29 41.2 65.39
TRANSPORT
Bus rapid transit system Participants
1 2 3 4 5 6 7 Ave. Asp. Total
Economic 58 52 26 45.333333 62.96
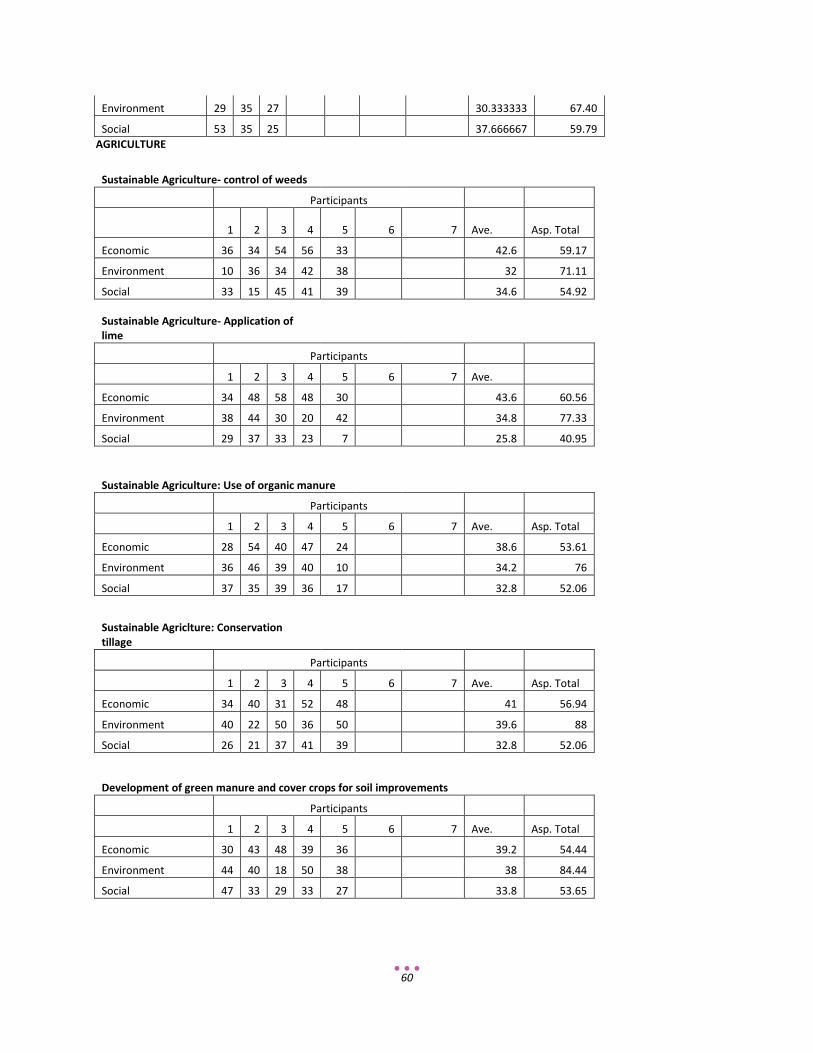
60
Environment 29 35 27 30.333333 67.40
Social 53 35 25 37.666667 59.79 AGRICULTURE
Sustainable Agriculture- control of weeds Participants
1 2 3 4 5 6 7 Ave. Asp. Total
Economic 36 34 54 56 33 42.6 59.17
Environment 10 36 34 42 38 32 71.11
Social 33 15 45 41 39 34.6 54.92
Sustainable Agriculture- Application of lime
Participants
1 2 3 4 5 6 7 Ave.
Economic 34 48 58 48 30 43.6 60.56
Environment 38 44 30 20 42 34.8 77.33
Social 29 37 33 23 7 25.8 40.95
Sustainable Agriculture: Use of organic manure Participants
1 2 3 4 5 6 7 Ave. Asp. Total
Economic 28 54 40 47 24 38.6 53.61
Environment 36 46 39 40 10 34.2 76
Social 37 35 39 36 17 32.8 52.06
Sustainable Agriclture: Conservation tillage
Participants
1 2 3 4 5 6 7 Ave. Asp. Total
Economic 34 40 31 52 48 41 56.94
Environment 40 22 50 36 50 39.6 88
Social 26 21 37 41 39 32.8 52.06
Development of green manure and cover crops for soil improvements Participants
1 2 3 4 5 6 7 Ave. Asp. Total
Economic 30 43 48 39 36 39.2 54.44
Environment 44 40 18 50 38 38 84.44
Social 47 33 29 33 27 33.8 53.65
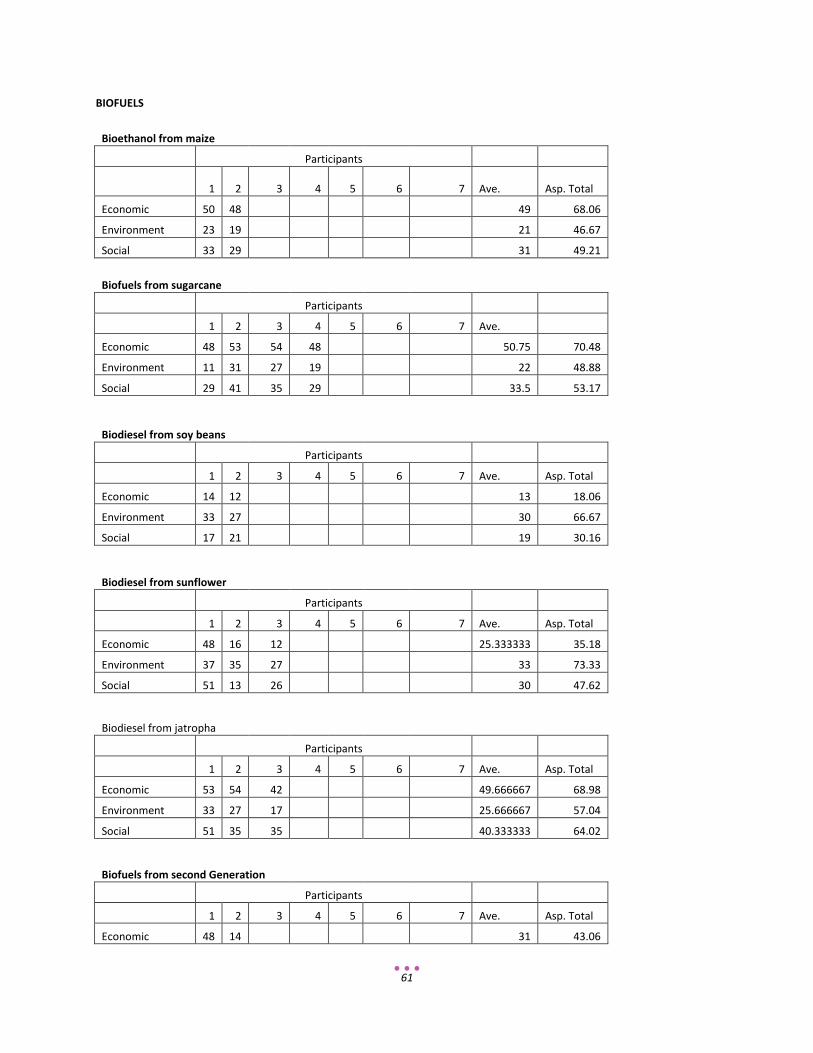
61
BIOFUELS
Bioethanol from maize Participants
1 2 3 4 5 6 7 Ave. Asp. Total
Economic 50 48 49 68.06
Environment 23 19 21 46.67
Social 33 29 31 49.21
Biofuels from sugarcane Participants
1 2 3 4 5 6 7 Ave.
Economic 48 53 54 48 50.75 70.48
Environment 11 31 27 19 22 48.88
Social 29 41 35 29 33.5 53.17
Biodiesel from soy beans Participants
1 2 3 4 5 6 7 Ave. Asp. Total
Economic 14 12 13 18.06
Environment 33 27 30 66.67
Social 17 21 19 30.16
Biodiesel from sunflower Participants
1 2 3 4 5 6 7 Ave. Asp. Total
Economic 48 16 12 25.333333 35.18
Environment 37 35 27 33 73.33
Social 51 13 26 30 47.62
Biodiesel from jatropha Participants
1 2 3 4 5 6 7 Ave. Asp. Total
Economic 53 54 42 49.666667 68.98
Environment 33 27 17 25.666667 57.04
Social 51 35 35 40.333333 64.02
Biofuels from second Generation
Participants
1 2 3 4 5 6 7 Ave. Asp. Total
Economic 48 14 31 43.06
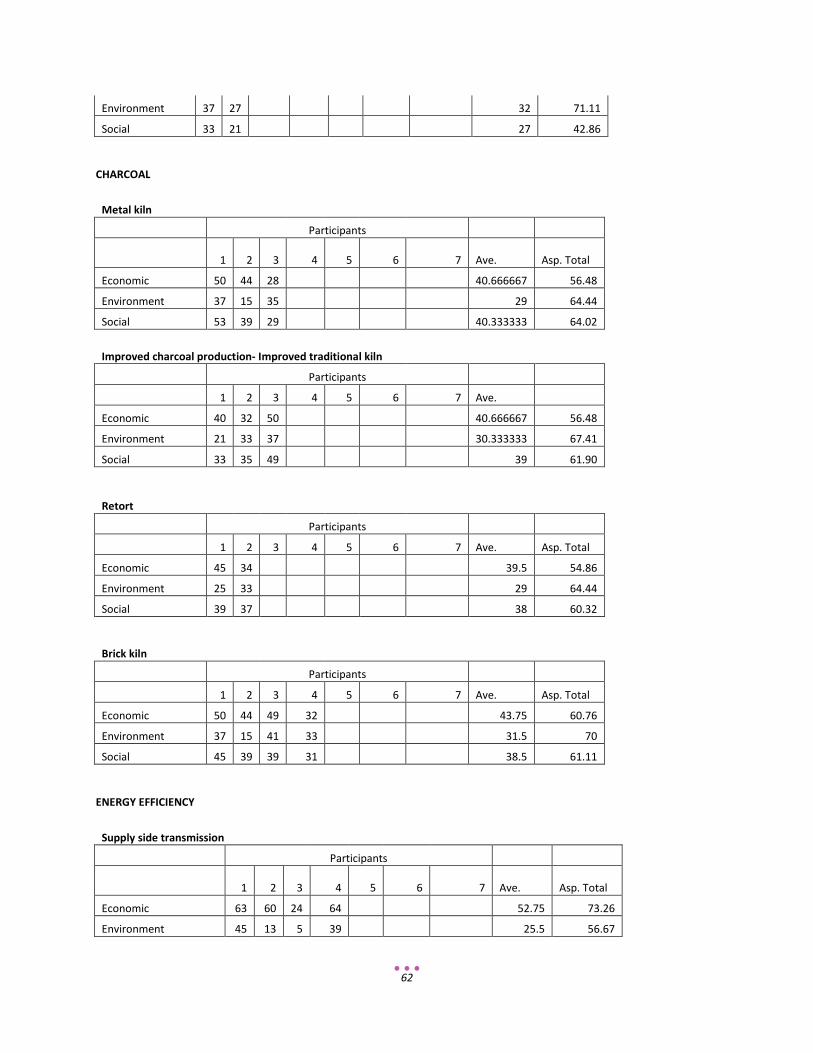
62
Environment 37 27 32 71.11
Social 33 21 27 42.86
CHARCOAL
Metal kiln Participants
1 2 3 4 5 6 7 Ave. Asp. Total
Economic 50 44 28 40.666667 56.48
Environment 37 15 35 29 64.44
Social 53 39 29 40.333333 64.02
Improved charcoal production- Improved traditional kiln Participants
1 2 3 4 5 6 7 Ave.
Economic 40 32 50 40.666667 56.48
Environment 21 33 37 30.333333 67.41
Social 33 35 49 39 61.90
Retort Participants
1 2 3 4 5 6 7 Ave. Asp. Total
Economic 45 34 39.5 54.86
Environment 25 33 29 64.44
Social 39 37 38 60.32
Brick kiln Participants
1 2 3 4 5 6 7 Ave. Asp. Total
Economic 50 44 49 32 43.75 60.76
Environment 37 15 41 33 31.5 70
Social 45 39 39 31 38.5 61.11
ENERGY EFFICIENCY
Supply side transmission Participants
1 2 3 4 5 6 7 Ave. Asp. Total
Economic 63 60 24 64 52.75 73.26
Environment 45 13 5 39 25.5 56.67

63
Social 55 57 55 55 55.5 88.09
Energy management system Participants
1 2 3 4 5 6 7 Ave.
Economic 70 66 64 64 66 91.67
Environment 45 45 39 39 42 93.33
Social 53 49 41 41 46 73.02
Industrial and commercial end-use EE
Participants
1 2 3 4 5 6 7 Ave. Asp. Total
Economic 66 64 62 62 58 62.4 86.67
Environment 45 37 37 13 35 33.4 74.22
Social 51 53 53 41 37 47 74.60
Household end-use EE Participants
1 2 3 4 5 6 7 Ave. Asp. Total
Economic 72 64 52 62 62.5 86.81
Environment 45 31 39 13 32 71.11
Social 59 38 45 45 46.75 74.21
EE and conservation in buildings Participants
1 2 3 4 5 6 7 Ave. Asp. Total
Economic 72 42 64 70 62 86.11
Environment 45 19 39 13 29 64.44
Social 55 41 29 49 43.5 69.05
ELECTRICITY GENERATION
Hydro power Participants
1 2 3 4 5 6 7 Ave. Asp. Total
Economic 70 66 63 66 66.25 92.01
Environment 13 13 45 21 23 51.11
Social 61 49 55 55 55 87.30
Biomass landfill Participants
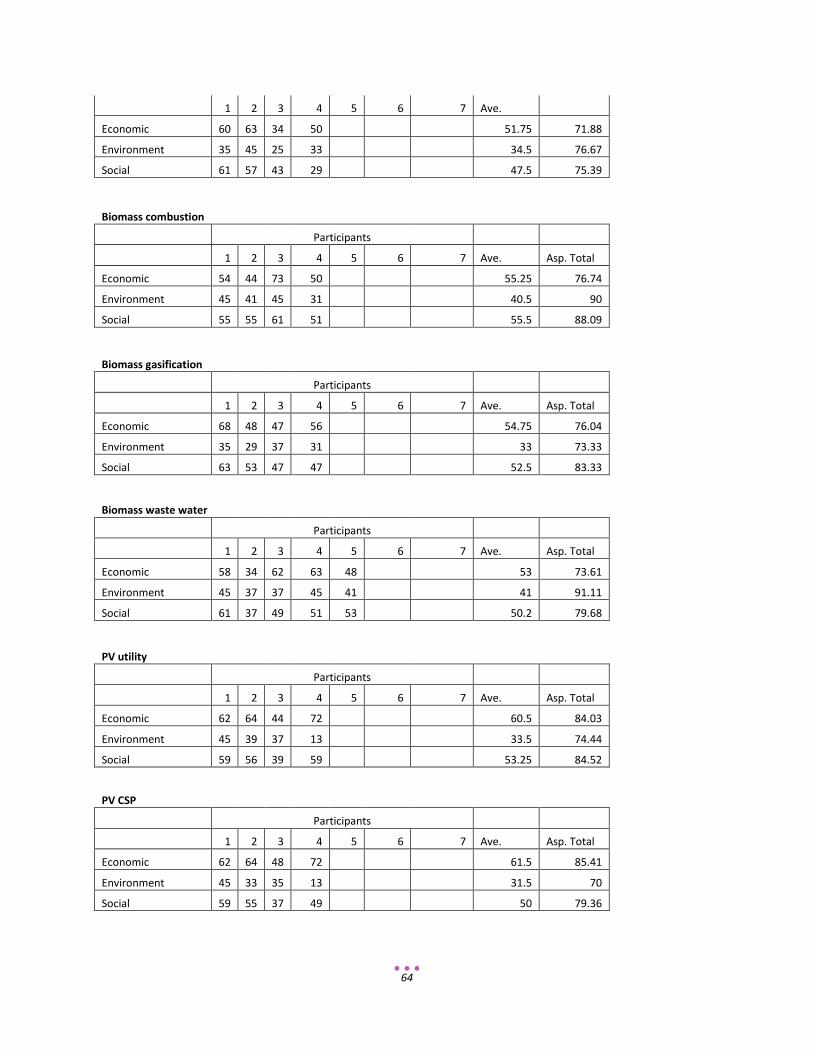
64
1 2 3 4 5 6 7 Ave.
Economic 60 63 34 50 51.75 71.88
Environment 35 45 25 33 34.5 76.67
Social 61 57 43 29 47.5 75.39
Biomass combustion Participants
1 2 3 4 5 6 7 Ave. Asp. Total
Economic 54 44 73 50 55.25 76.74
Environment 45 41 45 31 40.5 90
Social 55 55 61 51 55.5 88.09
Biomass gasification Participants
1 2 3 4 5 6 7 Ave. Asp. Total
Economic 68 48 47 56 54.75 76.04
Environment 35 29 37 31 33 73.33
Social 63 53 47 47 52.5 83.33
Biomass waste water Participants
1 2 3 4 5 6 7 Ave. Asp. Total
Economic 58 34 62 63 48 53 73.61
Environment 45 37 37 45 41 41 91.11
Social 61 37 49 51 53 50.2 79.68
PV utility
Participants
1 2 3 4 5 6 7 Ave. Asp. Total
Economic 62 64 44 72 60.5 84.03
Environment 45 39 37 13 33.5 74.44
Social 59 56 39 59 53.25 84.52
PV CSP Participants
1 2 3 4 5 6 7 Ave. Asp. Total
Economic 62 64 48 72 61.5 85.41
Environment 45 33 35 13 31.5 70
Social 59 55 37 49 50 79.36
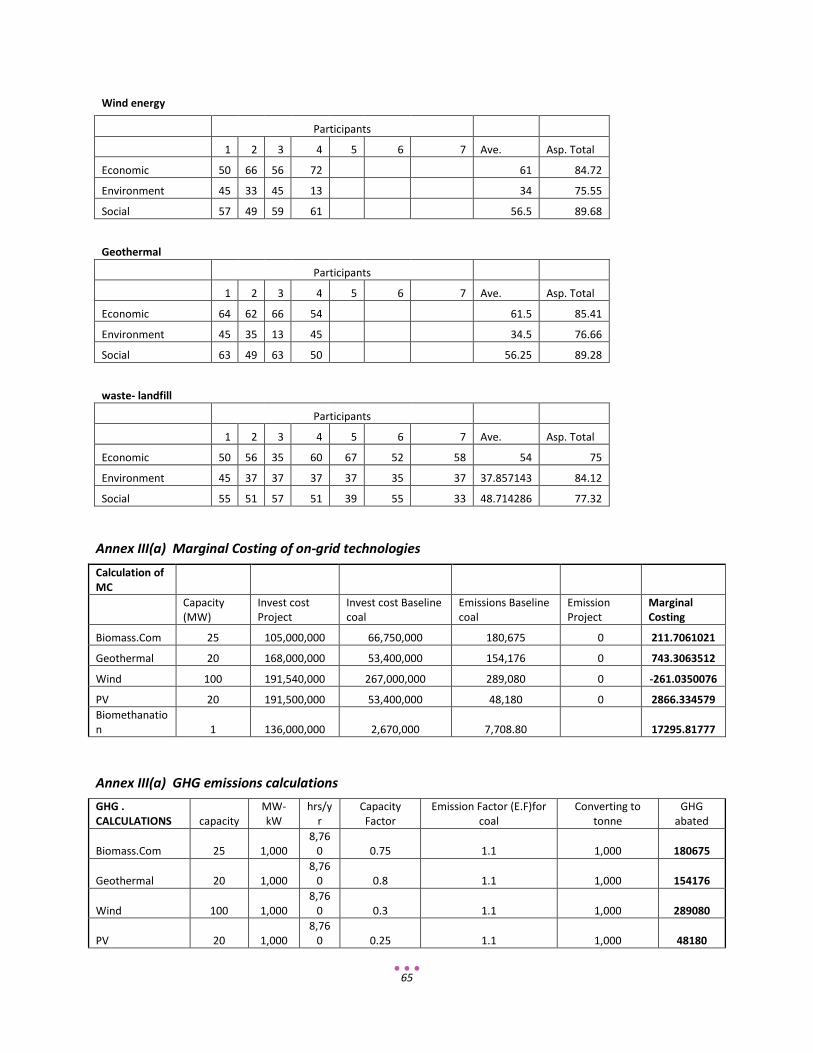
65
Wind energy
Participants
1 2 3 4 5 6 7 Ave. Asp. Total
Economic 50 66 56 72 61 84.72
Environment 45 33 45 13 34 75.55
Social 57 49 59 61 56.5 89.68
Geothermal Participants
1 2 3 4 5 6 7 Ave. Asp. Total
Economic 64 62 66 54 61.5 85.41
Environment 45 35 13 45 34.5 76.66
Social 63 49 63 50 56.25 89.28
waste- landfill Participants
1 2 3 4 5 6 7 Ave. Asp. Total
Economic 50 56 35 60 67 52 58 54 75
Environment 45 37 37 37 37 35 37 37.857143 84.12
Social 55 51 57 51 39 55 33 48.714286 77.32
Annex III(a) Marginal Costing of on-grid technologies
Calculation of MC
Capacity (MW)
Invest cost Project
Invest cost Baseline coal
Emissions Baseline coal
Emission Project
Marginal Costing
Biomass.Com 25 105,000,000 66,750,000 180,675 0 211.7061021
Geothermal 20 168,000,000 53,400,000 154,176 0 743.3063512
Wind 100 191,540,000 267,000,000 289,080 0 -261.0350076
PV 20 191,500,000 53,400,000 48,180 0 2866.334579 Biomethanation 1 136,000,000 2,670,000 7,708.80 17295.81777
Annex III(a) GHG emissions calculations GHG . CALCULATIONS capacity
MW-kW
hrs/yr
Capacity Factor
Emission Factor (E.F)for coal
Converting to tonne
GHG abated
Biomass.Com 25 1,000 8,76
0 0.75 1.1 1,000 180675
Geothermal 20 1,000 8,76
0 0.8 1.1 1,000 154176
Wind 100 1,000 8,76
0 0.3 1.1 1,000 289080
PV 20 1,000 8,76
0 0.25 1.1 1,000 48180
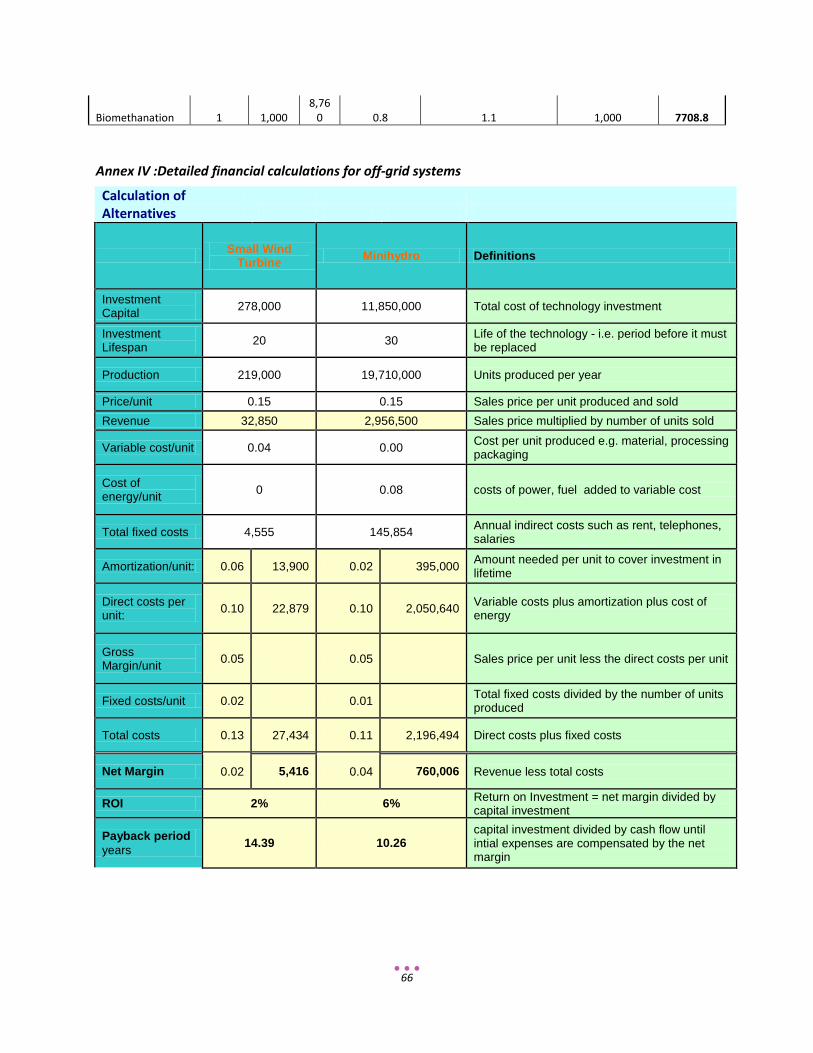
66
Biomethanation 1 1,000 8,76
0 0.8 1.1 1,000 7708.8
Annex IV :Detailed financial calculations for off-grid systems
Calculation of Alternatives
Small Wind Turbine Minihydro Definitions
Investment Capital 278,000 11,850,000 Total cost of technology investment
Investment Lifespan 20 30 Life of the technology - i.e. period before it must
be replaced
Production 219,000 19,710,000 Units produced per year
Price/unit 0.15 0.15 Sales price per unit produced and sold Revenue 32,850 2,956,500 Sales price multiplied by number of units sold
Variable cost/unit 0.04 0.00 Cost per unit produced e.g. material, processing packaging
Cost of energy/unit 0 0.08 costs of power, fuel added to variable cost
Total fixed costs 4,555 145,854 Annual indirect costs such as rent, telephones, salaries
Amortization/unit: 0.06 13,900 0.02 395,000 Amount needed per unit to cover investment in lifetime
Direct costs per unit: 0.10 22,879 0.10 2,050,640 Variable costs plus amortization plus cost of
energy
Gross Margin/unit 0.05 0.05 Sales price per unit less the direct costs per unit
Fixed costs/unit 0.02 0.01 Total fixed costs divided by the number of units produced
Total costs 0.13 27,434 0.11 2,196,494 Direct costs plus fixed costs
Net Margin 0.02 5,416 0.04 760,006 Revenue less total costs
ROI 2% 6% Return on Investment = net margin divided by capital investment
Payback period years 14.39 10.26
capital investment divided by cash flow until intial expenses are compensated by the net margin
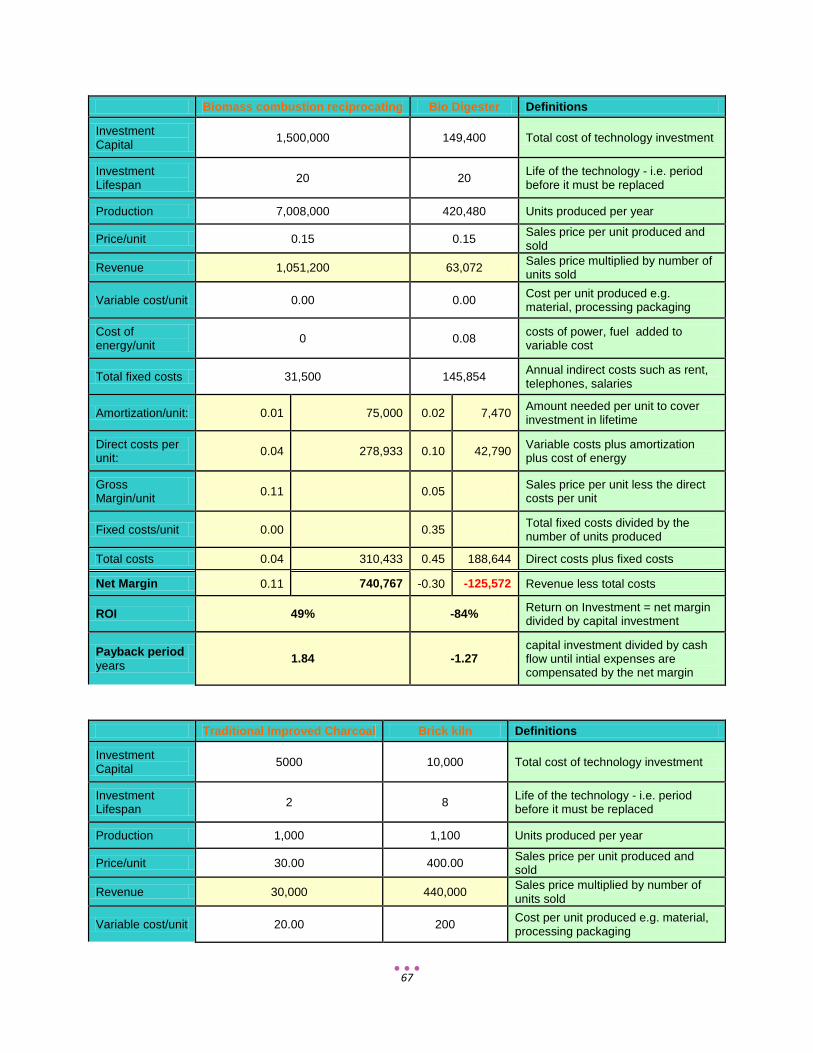
67
Biomass combustion reciprocating Bio Digester Definitions
Investment Capital 1,500,000 149,400 Total cost of technology investment
Investment Lifespan 20 20 Life of the technology - i.e. period
before it must be replaced
Production 7,008,000 420,480 Units produced per year
Price/unit 0.15 0.15 Sales price per unit produced and sold
Revenue 1,051,200 63,072 Sales price multiplied by number of units sold
Variable cost/unit 0.00 0.00 Cost per unit produced e.g. material, processing packaging
Cost of energy/unit 0 0.08 costs of power, fuel added to
variable cost
Total fixed costs 31,500 145,854 Annual indirect costs such as rent, telephones, salaries
Amortization/unit: 0.01 75,000 0.02 7,470 Amount needed per unit to cover investment in lifetime
Direct costs per unit: 0.04 278,933 0.10 42,790 Variable costs plus amortization
plus cost of energy
Gross Margin/unit 0.11 0.05 Sales price per unit less the direct
costs per unit
Fixed costs/unit 0.00 0.35 Total fixed costs divided by the number of units produced
Total costs 0.04 310,433 0.45 188,644 Direct costs plus fixed costs
Net Margin 0.11 740,767 -0.30 -125,572 Revenue less total costs
ROI 49% -84% Return on Investment = net margin divided by capital investment
Payback period years 1.84 -1.27
capital investment divided by cash flow until intial expenses are compensated by the net margin
Traditional Improved Charcoal Brick kiln Definitions
Investment Capital 5000 10,000 Total cost of technology investment
Investment Lifespan 2 8 Life of the technology - i.e. period
before it must be replaced
Production 1,000 1,100 Units produced per year
Price/unit 30.00 400.00 Sales price per unit produced and sold
Revenue 30,000 440,000 Sales price multiplied by number of units sold
Variable cost/unit 20.00 200 Cost per unit produced e.g. material, processing packaging
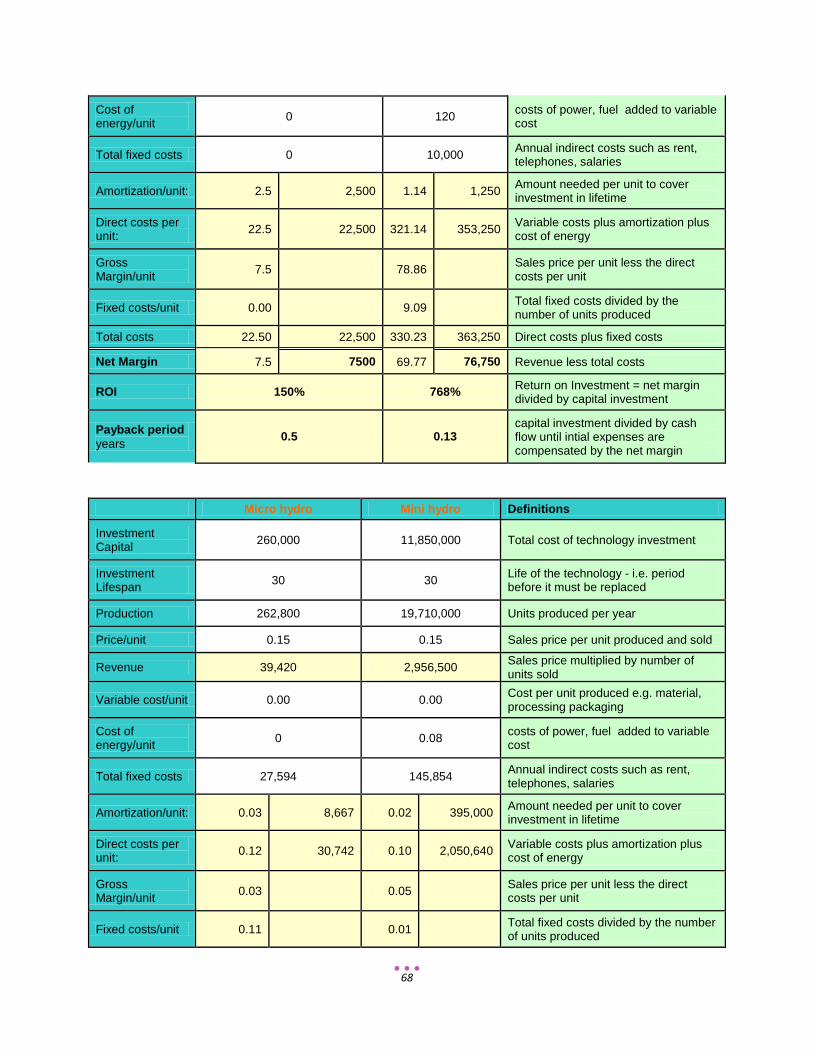
68
Cost of energy/unit 0 120 costs of power, fuel added to variable
cost
Total fixed costs 0 10,000 Annual indirect costs such as rent, telephones, salaries
Amortization/unit: 2.5 2,500 1.14 1,250 Amount needed per unit to cover investment in lifetime
Direct costs per unit: 22.5 22,500 321.14 353,250 Variable costs plus amortization plus
cost of energy
Gross Margin/unit 7.5 78.86 Sales price per unit less the direct
costs per unit
Fixed costs/unit 0.00 9.09 Total fixed costs divided by the number of units produced
Total costs 22.50 22,500 330.23 363,250 Direct costs plus fixed costs
Net Margin 7.5 7500 69.77 76,750 Revenue less total costs
ROI 150% 768% Return on Investment = net margin divided by capital investment
Payback period years 0.5 0.13
capital investment divided by cash flow until intial expenses are compensated by the net margin
Micro hydro Mini hydro Definitions
Investment Capital 260,000 11,850,000 Total cost of technology investment
Investment Lifespan 30 30 Life of the technology - i.e. period
before it must be replaced
Production 262,800 19,710,000 Units produced per year
Price/unit 0.15 0.15 Sales price per unit produced and sold
Revenue 39,420 2,956,500 Sales price multiplied by number of units sold
Variable cost/unit 0.00 0.00 Cost per unit produced e.g. material, processing packaging
Cost of energy/unit 0 0.08 costs of power, fuel added to variable
cost
Total fixed costs 27,594 145,854 Annual indirect costs such as rent, telephones, salaries
Amortization/unit: 0.03 8,667 0.02 395,000 Amount needed per unit to cover investment in lifetime
Direct costs per unit: 0.12 30,742 0.10 2,050,640 Variable costs plus amortization plus
cost of energy
Gross Margin/unit 0.03 0.05 Sales price per unit less the direct
costs per unit
Fixed costs/unit 0.11 0.01 Total fixed costs divided by the number of units produced

69
Total costs 0.22 58,336 0.11 2,196,494 Direct costs plus fixed costs
Net Margin -0.07 -18,916 0.04 760,006 Revenue less total costs
ROI -7% 6% Return on Investment = net margin divided by capital investment
Payback period years -25.37 10.26
capital investment divided by cash flow until intial expenses are compensated by the net margin
Biomass Gasifier Biogas Digester Definitions
Investment Capital 375,400 194,220 Total cost of technology investment
Investment Lifespan 20 20 Life of the technology - i.e. period before it must
be replaced
Production 700,800 420,480 Units produced per year
Price/unit 0.08 0.08 Sales price per unit produced and sold
Revenue 56,064 33,638 Sales price multiplied by number of units sold
Variable cost/unit 0.02 0.02 Cost per unit produced e.g. material, processing packaging
Cost of energy/unit 0 0 costs of power, fuel added to variable cost
Total fixed costs 2,383 1,261 Annual indirect costs such as rent, telephones, salaries
Amortization/unit: 0.03 18,770 Amount needed per unit to cover investment in lifetime
Direct costs per unit: 0.07 48,904 Variable costs plus amortization plus cost of
energy
Gross Margin/unit 0.01 Sales price per unit less the direct costs per unit
Fixed costs/unit 0.00 Total fixed costs divided by the number of units produced
Total costs 0.07 51,287 Direct costs plus fixed costs
Net Margin 0.01 4,777 Revenue less total costs
ROI 1% Return on Investment = net margin divided by capital investment
Payback period years 15.94 capital investment divided by cash flow until intial
expenses are compensated by the net margin
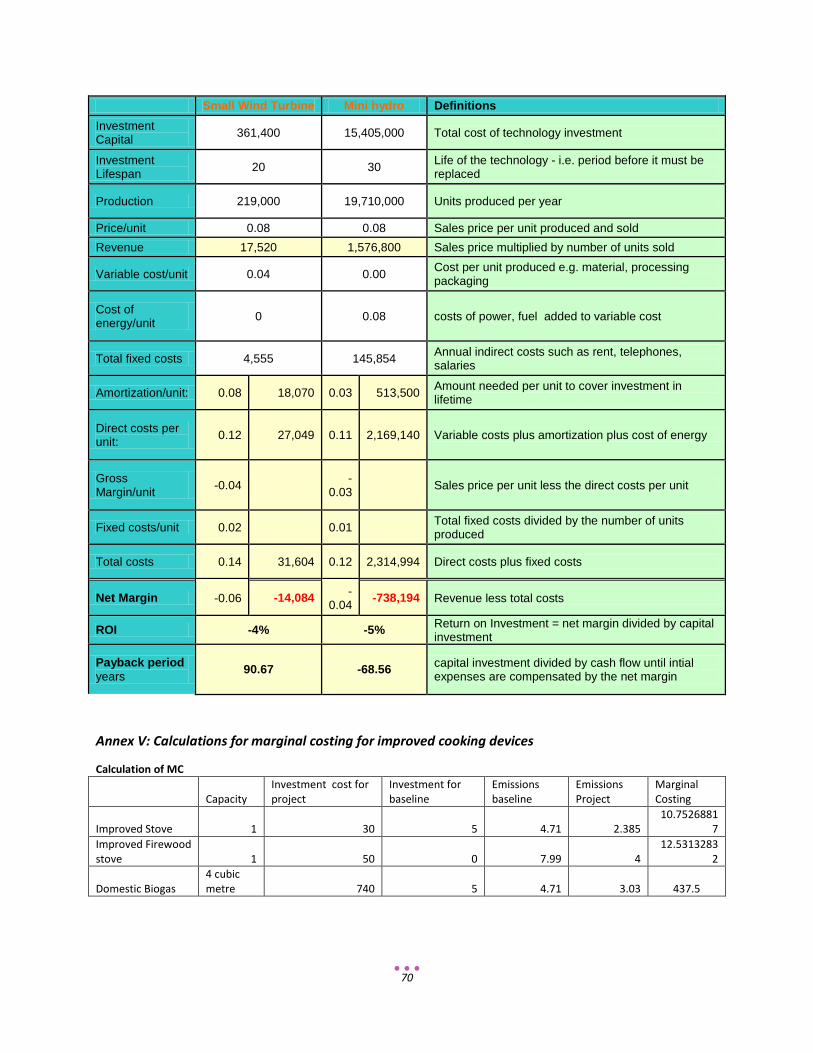
70
Small Wind Turbine Mini hydro Definitions Investment Capital 361,400 15,405,000 Total cost of technology investment
Investment Lifespan 20 30 Life of the technology - i.e. period before it must be
replaced
Production 219,000 19,710,000 Units produced per year
Price/unit 0.08 0.08 Sales price per unit produced and sold Revenue 17,520 1,576,800 Sales price multiplied by number of units sold
Variable cost/unit 0.04 0.00 Cost per unit produced e.g. material, processing packaging
Cost of energy/unit 0 0.08 costs of power, fuel added to variable cost
Total fixed costs 4,555 145,854 Annual indirect costs such as rent, telephones, salaries
Amortization/unit: 0.08 18,070 0.03 513,500 Amount needed per unit to cover investment in lifetime
Direct costs per unit: 0.12 27,049 0.11 2,169,140 Variable costs plus amortization plus cost of energy
Gross Margin/unit -0.04 -
0.03 Sales price per unit less the direct costs per unit
Fixed costs/unit 0.02 0.01 Total fixed costs divided by the number of units produced
Total costs 0.14 31,604 0.12 2,314,994 Direct costs plus fixed costs
Net Margin -0.06 -14,084 -0.04 -738,194 Revenue less total costs
ROI -4% -5% Return on Investment = net margin divided by capital investment
Payback period years 90.67 -68.56 capital investment divided by cash flow until intial
expenses are compensated by the net margin
Annex V: Calculations for marginal costing for improved cooking devices
Calculation of MC
Capacity Investment cost for project
Investment for baseline
Emissions baseline
Emissions Project
Marginal Costing
Improved Stove 1 30 5 4.71 2.385 10.7526881
7 Improved Firewood stove 1 50 0 7.99 4
12.53132832
Domestic Biogas 4 cubic metre 740 5 4.71 3.03 437.5
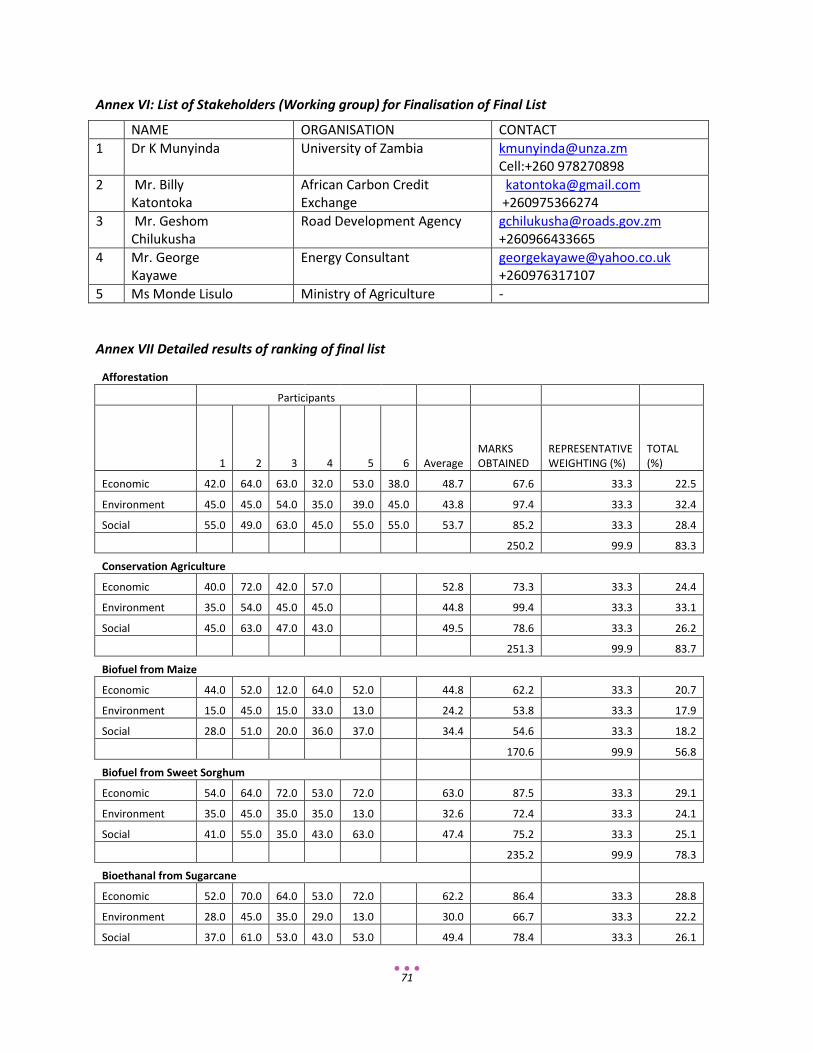
71
Annex VI: List of Stakeholders (Working group) for Finalisation of Final List
NAME ORGANISATION CONTACT 1 Dr K Munyinda University of Zambia [email protected]
Cell:+260 978270898 2 Mr. Billy
Katontoka African Carbon Credit Exchange
[email protected] +260975366274
3 Mr. Geshom Chilukusha
Road Development Agency [email protected] +260966433665
4 Mr. George Kayawe
Energy Consultant [email protected] +260976317107
5 Ms Monde Lisulo Ministry of Agriculture -
Annex VII Detailed results of ranking of final list
Afforestation Participants
1 2 3 4 5 6 Average MARKS OBTAINED
REPRESENTATIVE WEIGHTING (%)
TOTAL (%)
Economic 42.0 64.0 63.0 32.0 53.0 38.0 48.7 67.6 33.3 22.5
Environment 45.0 45.0 54.0 35.0 39.0 45.0 43.8 97.4 33.3 32.4
Social 55.0 49.0 63.0 45.0 55.0 55.0 53.7 85.2 33.3 28.4
250.2 99.9 83.3
Conservation Agriculture Economic 40.0 72.0 42.0 57.0 52.8 73.3 33.3 24.4
Environment 35.0 54.0 45.0 45.0 44.8 99.4 33.3 33.1
Social 45.0 63.0 47.0 43.0 49.5 78.6 33.3 26.2
251.3 99.9 83.7
Biofuel from Maize Economic 44.0 52.0 12.0 64.0 52.0 44.8 62.2 33.3 20.7
Environment 15.0 45.0 15.0 33.0 13.0 24.2 53.8 33.3 17.9
Social 28.0 51.0 20.0 36.0 37.0 34.4 54.6 33.3 18.2
170.6 99.9 56.8
Biofuel from Sweet Sorghum
Economic 54.0 64.0 72.0 53.0 72.0 63.0 87.5 33.3 29.1
Environment 35.0 45.0 35.0 35.0 13.0 32.6 72.4 33.3 24.1
Social 41.0 55.0 35.0 43.0 63.0 47.4 75.2 33.3 25.1
235.2 99.9 78.3
Bioethanal from Sugarcane
Economic 52.0 70.0 64.0 53.0 72.0 62.2 86.4 33.3 28.8
Environment 28.0 45.0 35.0 29.0 13.0 30.0 66.7 33.3 22.2
Social 37.0 61.0 53.0 43.0 53.0 49.4 78.4 33.3 26.1

72
231.5 99.9 77.1
Biofuel from Jatroph
Economic 56.0 62.0 60.0 72.0 72.0 64.4 89.4 33.3 29.8
Environment 35.0 31.0 45.0 45.0 17.0 34.6 76.9 33.3 25.6
Social 43.0 45.0 57.0 63.0 63.0 54.2 86.0 33.3 28.6
252.4 99.9 84.0 Improved charcoal production- Improved traditional kiln
Economic 32.0 44.0 64.0 35.0 72.0 49.4 68.6 33.3 22.8
Environment 21.0 37.0 39.0 35.0 45.0 35.4 78.7 33.3 26.2
Social 53.0 43.0 53.0 41.0 63.0 50.6 80.3 33.3 26.7
227.6 99.9 75.8
Brick kiln
Economic 46.0 44.0 26.0 62.0 56.0 46.8 65.0 33.3 21.6
Environment 37.0 29.0 25.0 39.0 35.0 33.0 73.3 33.3 24.4
Social 39.0 49.0 35.0 49.0 49.0 44.2 70.2 33.3 23.4
208.5 99.9 69.4
Metal kiln
Economic 39.0 46.0 40.0 34.0 48.0 41.4 57.5 33.3 19.1
Environment 39.0 31.0 25.0 21.0 33.0 29.8 66.2 33.3 22.1
Social 47.0 45.0 35.0 53.0 45.0 45.0 71.4 33.3 23.8
195.2 99.9 65.0
Geothermal Economic 55.0 20.0 58.0 68.0 58.0 51.8 71.9 33.3 24.0
Environment 45.0 35.0 31.0 19.0 45.0 35.0 77.8 33.3 25.9
Social 61.0 31.0 56.0 53.0 59.0 52.0 82.5 33.3 27.5
232.3 99.9 77.3
Biomass Combustion
Economic 41.0 60.0 50.5 70.1 33.3 23.4
Environment 37.0 30.0 33.5 74.4 33.3 24.8
Social 55.0 51.0 53.0 84.1 33.3 28.0
228.7 99.9 76.2
Wind Energy
Economic 18.0 68.0 64.0 50.0 69.4 33.3 23.1
Environment 25.0 4.0 29.0 19.3 43.0 33.3 14.3
Social 21.0 57.0 49.0 42.3 67.2 33.3 22.4
179.6 99.9 59.8
Electricity Generation- PV utility
Economic 26.0 56.0 40.0 53.0 66.0 48.2 66.9 33.3 22.3
Environment 15.0 45.0 35.0 29.0 13.0 27.4 60.9 33.3 20.3
Social 33.0 61.0 49.0 49.0 63.0 51.0 81.0 33.3 27.0
208.8 99.9 69.5

73
Biomethanation
Economic 42.0 64.0 64.0 52.0 52.0 54.8 76.1 33.3 25.3
Environment 15.0 43.0 31.0 22.0 45.0 31.2 69.3 33.3 23.1
Social 49.0 55.0 45.0 45.0 49.0 48.6 77.1 33.3 25.7
222.6 99.9 74.1
Household end use efficiency Economic 56.0 56.0 54.0 49.0 66.0 56.2 78.1 33.3 26.0
Environment 35.0 42.0 45.0 35.0 5.0 32.4 72.0 33.3 24.0
Social 35.0 49.0 39.0 35.0 51.0 41.8 66.3 33.3 22.1
216.4 99.9 72.1
Industrial and commerical end use efficiency
Economic 66.0 56.0 56.0 40.0 54.0 54.4 75.6 33.3 25.2
Environment 45.0 28.0 35.0 30.0 5.0 28.6 63.6 33.3 21.2
Social 55.0 49.0 41.0 35.0 47.0 45.4 72.1 33.3 24.0
211.2 99.9 70.3
Energy management system
Economic 66.0 52.0 40.0 44.0 58.0 52.0 72.2 33.3 24.1
Environment 45.0 35.0 35.0 42.0 5.0 32.4 72.0 33.3 24.0
Social 59.0 35.0 49.0 49.0 41.0 46.6 74.0 33.3 24.6
218.2 99.9 72.7
Biogas for Cooking Economic 72.0 50.0 44.0 64.0 57.5 79.9 33.3 26.6
Environment 54.0 35.0 33.0 45.0 41.8 92.8 33.3 30.9
Social 63.0 31.0 51.0 55.0 50.0 79.4 33.3 26.4
252.0 99.9 83.9
Improved firewood stove
Economic 60.0 48.0 72.0 49.0 58.0 54.0 56.8 78.9 33.3 26.3
Environment 45.0 25.0 45.0 21.0 33.0 35.0 34.0 75.6 33.3 25.2
Social 47.0 49.0 51.0 64.0 49.0 34.0 49.0 77.8 33.3 25.9
232.3 99.9 77.3
Improved charcoal stove
Economic 41.0 46.0 72.0 60.0 54.8 76.0 33.3 25.3
Environment 35.0 29.0 45.0 31.0 35.0 77.8 33.3 25.9
Social 41.0 63.0 55.0 49.0 52.0 82.5 33.3 27.5
236.4 99.9 78.7
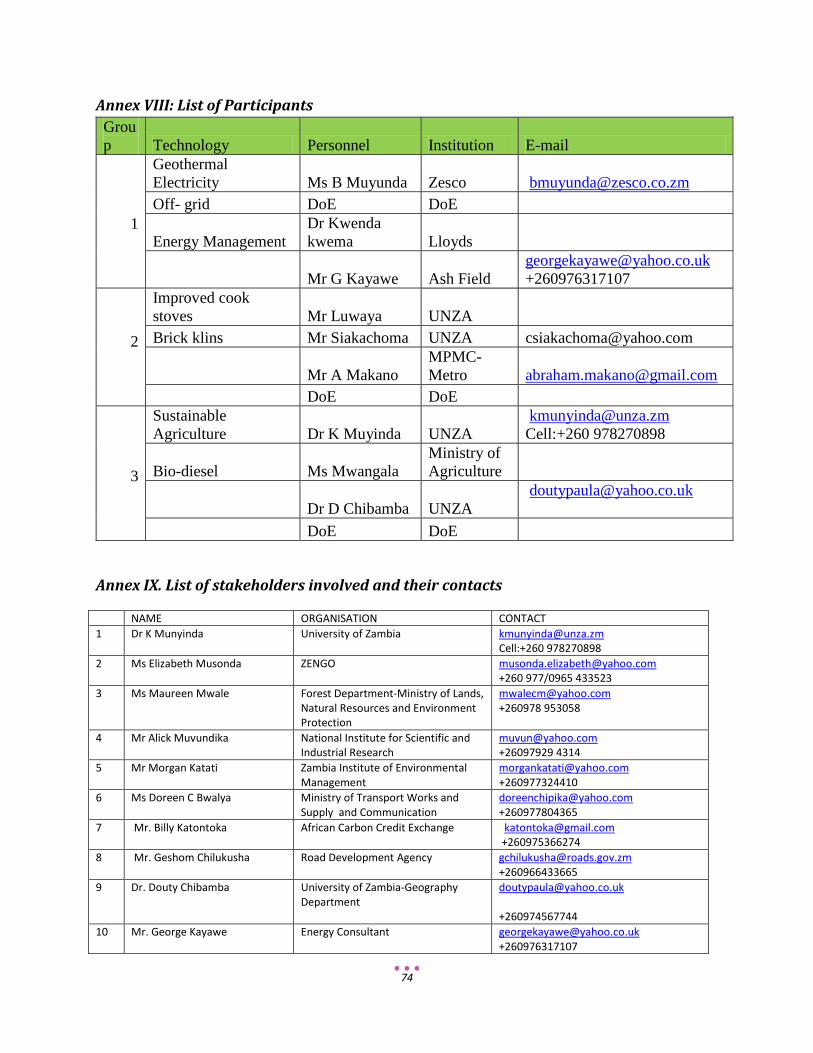
74
Annex VIII: List of Participants Group Technology Personnel Institution E-mail
1
Geothermal Electricity Ms B Muyunda Zesco [email protected] Off- grid DoE DoE
Energy Management Dr Kwenda kwema Lloyds
Mr G Kayawe Ash Field
[email protected] +260976317107
2
Improved cook stoves Mr Luwaya UNZA
Brick klins Mr Siakachoma UNZA [email protected]
Mr A Makano MPMC-Metro [email protected]
DoE DoE
3
Sustainable Agriculture Dr K Muyinda UNZA
[email protected] Cell:+260 978270898
Bio-diesel Ms Mwangala Ministry of Agriculture
Dr D Chibamba UNZA [email protected]
DoE DoE
Annex IX. List of stakeholders involved and their contacts
NAME ORGANISATION CONTACT 1 Dr K Munyinda University of Zambia [email protected]
Cell:+260 978270898 2 Ms Elizabeth Musonda ZENGO [email protected]
+260 977/0965 433523 3 Ms Maureen Mwale Forest Department-Ministry of Lands,
Natural Resources and Environment Protection
[email protected] +260978 953058
4 Mr Alick Muvundika National Institute for Scientific and Industrial Research
[email protected] +26097929 4314
5 Mr Morgan Katati Zambia Institute of Environmental Management
[email protected] +260977324410
6 Ms Doreen C Bwalya Ministry of Transport Works and Supply and Communication
[email protected] +260977804365
7 Mr. Billy Katontoka African Carbon Credit Exchange [email protected] +260975366274
8 Mr. Geshom Chilukusha Road Development Agency [email protected] +260966433665
9 Dr. Douty Chibamba University of Zambia-Geography Department
[email protected] +260974567744
10 Mr. George Kayawe Energy Consultant [email protected] +260976317107

75
11 Mr C. Siakachoma University of Zambia-Mechanical Engineering Department
12 Ms M. Muyunda Zesco-Environment Unit [email protected]