Embed Size (px)
Citation preview

Technology Anxiety Past and Present
David H. Autor, MIT and NBER
Man and Machine: The Impact of Technology on
Employment
February 28, 2013

Agenda
1. Technology anxiety – Past and present
2. What is distinctive about the computer revolution?
3. Changes in occupations: A detailed look
4. The difficulty of forecasting
5. Luddites revisited – What neoclassical theory says
6. Final thoughts
An Era of Technology Anxiety

Are We Entering the “PC Era” of Workplace Robotics?
Rodney Brooks, CEO Rethink Robotics,
with “Baxter”

Are We Entering the “PC Era of Workplace Robotics”?

Declining U.S. Labor Force Participation Since 2000
Males
Females

Declining Labor Share of National Income Since 2000
Jacobson and Occhino, 2012

Traditional Economic View
1. Technological change is a win-win
• The only free lunch that economists can believe in (Mokyr, 1990)
2. Labor demand is unlimited
• “One of the best-known fallacies in economics is the notion that
there is a fixed amount of work to be done—a lump of labor—
which can be shared out in different ways to create fewer or
more jobs.”
3. Those who fear technological change are “Luddites.”
The Lump of Labor Fallacy

An Earlier Era of Technology Anxiety
Ned Ludd “Machine Trashing”
1812

66
100 Years of U.S. Consumer Spending
The sources of incomes changed,
too. In 1901, the average U.S. family
received 90.5 percent of its income from
the earnings of family members, with
9.5 percent of these earnings contrib-
uted by children. By the 21st century,
only 80.7 percent of family income came
from the direct earnings of family mem-
bers. Interestingly, in 2002-03 in New
York City and Boston, family earnings
constituted a greater proportion of
household income than they did in the
country as a whole. In New York City,
family members’ earnings contributed
85.0 percent to total household income;
in Boston, family earnings contributed
89.0 percent.
During the 100-year period, house-
hold expenditure patterns also demon-
strated great variability. In 1901, the
average U.S. household had $769 in
expenditures. By 2002–03, these expen-
ditures had increased 53-fold, to
$40,748. Over the same period, expen-
ditures in New York City had increased
62-fold, from $814 to $50,319, while in
Boston, the increase was 48-fold, from
$880 to $41,814. (See chart 39.)
In real dollars, calculated with 1901
as the base, expenditures also demon-
strated a notable increase. In 1901, as
noted, the average U.S. family had $769
in expenditures. By 2002–03, that
family’s expenditures would have risen
to $1,848, a 2.4-fold increase. In New
York City the increase would have been
2.8-fold, from $814 to $2,283; in Boston
the increase would have been 2.2-fold,
from $880 to $1,897. (See chart 40.)
The material well-being of families
in the United States improved dramati-
cally, as demonstrated by the change
over time in the percentage of expendi-
tures allocated for food, clothing, and
housing. In 1901, the average U.S. fam-
ily devoted 79.8 percent of its spend-
ing to these necessities, while families
in New York City spent 80.3 percent,
and families in Boston allocated 86.0
percent. By 2002–03, allocations on ne-
cessities had been reduced substan-
tially, for U.S. families to 50.1 percent
of spending, for New York City families
to 56.7 percent, and for Boston families
to 53.8 percent. (See chart 41.)
The continued and significant de-
cline over the century in the share of
expenditures allocated for food also
reflected improved living standards. In
1901, U.S. households allotted 42.5 per-
cent of their expenditures for food; by
2002–03, food’s share of spending had
dropped to just 13.2 percent. For New
York City households, the expenditure
share had declined from 43.7 percent
to 13.9 percent; for Boston households,
the decline was from 41.7 percent to
13.5 percent. (See chart 42.)
Beginning in the 1970s, another
trend emerged in spending for food. At
the time, the average U.S. family allo-
cated 72.4 percent of food expenditures
for food eaten at home and 26.4 per-
cent for food eaten away from home.
In New York City, a similar pattern held:
households allocated 72.2 percent of
their food spending for food eaten at
home and 26.7 percent for food eaten
$500
$1,000
$1,500
$2,000
$2,500
$3,000
$3,500
1901 1918-19 1934-36 1950 1960-61 1972-73 1984-85 1996-97 2002-03
United States
Boston
New York City
Chart 38. Income deflated to 1901 for the United States,
New York City, and Boston
SOURCE: U.S. Bureau of Labor Statistics, Consumer Expenditure Survey
Over the Course of a Century…

Over the Course of a Century…
68
100 Years of U.S. Consumer Spending
away from home. Boston family food
expenditure patterns were different,
with 66.1 percent of food spending al-
located for food at home and 33.5 per-
cent allocated for food eaten away from
home.
By the 21st century, however, the
average U.S. family allocated just 58.1
percent of food spending for food eaten
at home and 41.9 percent for food eaten
away from home. Similar patterns ex-
isted in New York City and in Boston:
the allocations in New York City were
54.4 percent and 45.6 percent, respec-
tively; in Boston, they were 58.7 per-
cent and 41.3 percent.
Changes in diets also occurred over
the 100-year period. In 1901, New York
City families allocated 40.4 percent of
their grocery expenditures for meat,
poultry, fish, and eggs; 16.3 percent for
dairy products; 14.5 percent for fruits
and vegetables; and 11.0 percent for
cereals and bakery products. Among
Boston families, the allocations for
these four categories of items were 48.4
percent, 17.5 percent, 8.3 percent, and
9.2 percent, respectively.
By 2002–03, grocery expenditure
shares for meat, poultry, fish, and eggs
had decreased to 28.3 percent in New
York City and to 27.2 percent in Bos-
ton. Shares for dairy products had de-
creased to 10.4 percent in New York City
and 10.8 percent in Boston; shares for
fruits and vegetables had increased to
19.2 percent in New York City and 17.0
percent in Boston; and shares for cere-
als and bakery products had increased
to 15.0 percent in both cities.
Home ownership shifted markedly.
In 1901, 19 percent of Americans owned
their home, while in 2002–03, 67 per-
cent of U.S. families did. In 2002–03,
56 percent of New York City households
owned their home, while in Boston, the
share was greater: 59 percent.
With greater home ownership and
higher housing costs, in the 1960s fam-
ily spending for housing became the
most significant item in household bud-
gets, displacing spending on food.
Spending for shelter constituted the
single largest segment of the average
family’s housing expenditures: 62.5 per-
cent in the country as a whole, 62.7 per-
cent in New York City, and 66.8 percent
in Boston.
Forty years later, in 2002–03, shelter
costs represented 19.3 percent of total
household expenditures in the coun-
try as a whole, 24.6 percent in New York
City, and 24.3 percent in Boston. In
other words, 1 out of every 4 dollars
spent by New York City and Boston
families went for shelter.
With the rise in expenditures for
shelter came an increase in spending
for utilities. In the 1970s, the average
U.S. family allotted 4.9 percent of total
spending for utilities; the average New
York City family, 3.8 percent; and the
average Boston household, 4.9 per-
cent. By 2002–03, shares of total
spending for utility costs were 6.7 per-
cent, 6.1 percent, and 6.4 percent.
Over the 100-year period, expendi-
ture shares for clothing steadily de-
50
55
60
65
70
75
80
85
90
1901 1918-19 1934-36 1950 1960-61 1972-73 1984-85 1996-97 2002-03
Percent
United States
Boston
New York City
Chart 41. Food, clothing, and housing expenditure shares
for the United States, New York City, and Boston
SOURCE: U.S. Bureau of Labor Statistics, Consumer Expenditure Survey

U.S. Employment Shares in Agriculture, Industry and Services, 1840 - 2010
Johnston 2012
68%
22%
10%
40%
27%
33%
11%
37%
52%
2%
20%
78%
0%
10%
20%
30%
40%
50%
60%
70%
80%
90%
Agriculture Industry Services
U.S. Employment Shares in Agriculture, Industry and Services, 1840 - 2010
1840 1900 1950 2010

Agenda
1. Technology anxiety – Past and present
2. What is distinctive about the computer revolution?
3. Changes in occupations: A detailed look
4. The difficulty of forecasting
5. Luddites revisited – What neoclassical theory says
6. Final thoughts

Automation of ‘Routine Tasks:’ Jacquard Loom (1801)

Two Centuries of Productivity Growth in Computing: 2+ Trillion Fold Decline in Cost of Computing v. Labor
Nordhaus 2007

Information Technology Accounted for ~40% of
Business Investment as of 2010
0.00
0.04
0.08
0.12
0.16
0.20
0.24
0.28
0.32
0.36
0.40
1959 1962 1965 1968 1971 1974 1977 1980 1983 1986 1989 1992 1995 1998 2001 2004 2007 2010
Informa onProcessingEquipment+So wareShareofAllPrivateNon-Residen alInvestment,1959-2010(Source:BEANIPA)

Substitution, Complementarity: Tasks and Technology
Task
Description
Example Occupations
Potential Impact of Computerization
Routine Tasks • ‘Rules-based’
• Repetitive
• Procedural
• Bookkeepers
• Assembly line
workers
• Direct Substitution
Abstract Tasks • Abstract
problem-solving
• Mental flexibility
• Scientists
• Attorneys
• Managers
• Doctors
• Strong Complementarity
Manual Tasks • Environmental
Adaptability
• Interpersonal
Adaptability
• Truck drivers
• Security guards
• Flight attendants
• Home health aides
• Waiters
• Cleaners
• Limited Complementarity
or Substitution

U.S. Job Task Input by Education Group, 1980 Averages
HS
Dro
po
uts
HS
Dro
po
uts
HS
Dro
po
uts
HS
Gra
du
ate
s
HS
Gra
du
ate
s
HS
Gra
du
ate
s
So
me C
olle
ge
So
me C
olle
ge
So
me
Co
lleg
e
Co
lleg
e G
rad
s
Co
lleg
e G
rad
s
Co
lleg
e G
rad
s
0%
10%
20%
30%
40%
50%
60%
70%
80%
90%
100%
Manual Tasks Abstract Tasks Routine Tasks
U.S. Task Input by Education Group, 1980 Averages
Autor, Levy and Murnane, 2003

Agenda
1. Technology anxiety – Past and present
2. What is distinctive about the computer revolution?
3. Changes in occupations: A detailed look
4. The difficulty of forecasting
5. Luddites revisited – What neoclassical theory says
6. Final thoughts

Autor, Levy and Murnane ‘03 Figure 1:
Economy Wide Changes in Job Task Content 1960 - 1998
Figure I.
Trends in Routine and Nonroutine Task Input, 1960 to 1998.
38
40
42
44
46
48
50
52
54
56
58
60
62
1960 1970 1980 1990 2000
Me
an
Ta
sk I
np
ut
in P
erc
en
tile
s o
f 1
96
0 T
ask D
istr
ibu
tio
n
Nonroutine analytic Nonroutine interactive Nonroutine manual
Routine cognitive Routine manual
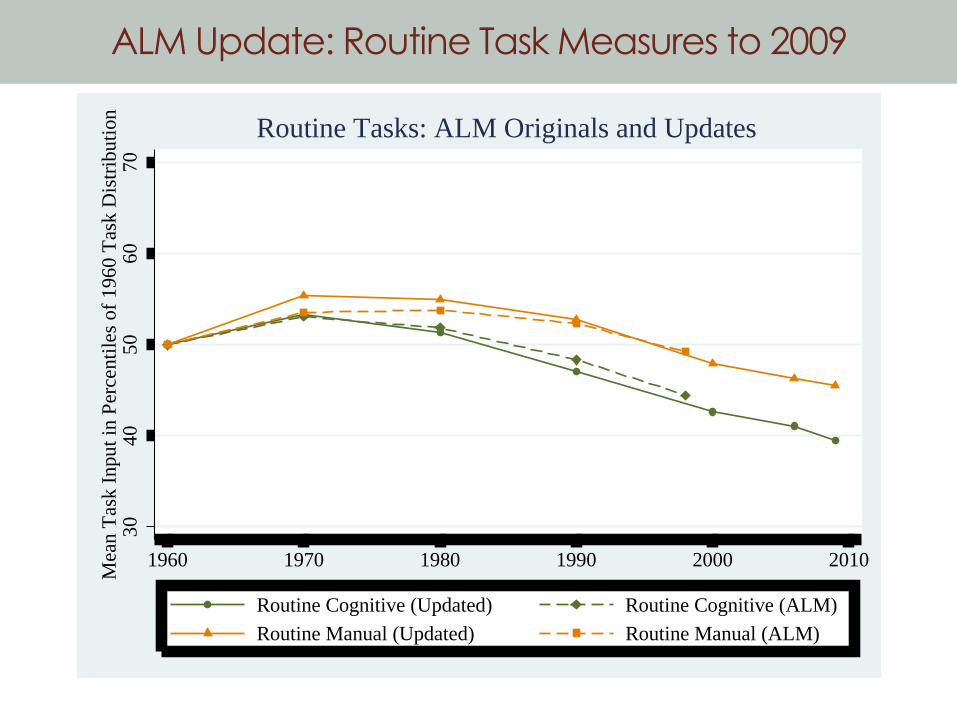
ALM Update: Routine Task Measures to 2009
30
40
50
60
70
Mea
n T
ask I
npu
t in
Per
centi
les
of
196
0 T
ask D
istr
ibu
tion
1960 1970 1980 1990 2000 2010
Routine Cognitive (Updated) Routine Cognitive (ALM)
Routine Manual (Updated) Routine Manual (ALM)
Routine Tasks: ALM Originals and Updates

ALM Update:
Non-Routine Cognitive Task Measures to 2009
30
40
50
60
70
Mea
n T
ask I
npu
t in
Per
centi
les
of
196
0 T
ask D
istr
ibu
tion
1960 1970 1980 1990 2000 2010
Non−routine Analytical (Updated) Non−routine Analytical (ALM)
Non−routine Interpersonal (Updated) Non−routine Interpersonal (ALM)
Non−routine Cognitive Tasks: ALM Originals and Updates

ALM Update:
Non-Routine Manual Task Measure to 2009
30
40
50
60
70
Mea
n T
ask
Inp
ut
in P
erce
nti
les
of
196
0 T
ask
Dis
trib
uti
on
1960 1970 1980 1990 2000 2010
Non−routine Manual (Updated) Non−routine Manual (ALM)
Non−routine Manual Tasks: ALM Originals and Updates

Autor, Levy and Murnane ‘03 Figure 1 Update:
Economy Wide Changes in Job Task Content 1960 - 1998
30
40
50
60
70
Mea
n T
ask
In
put
in P
erce
nti
les
of
19
60
Dis
trib
uti
on
1960 1970 1980 1990 2000 2010
Non−routine Analytical Non−routine Interpersonal
Non−routine Manual Routine Cognitive
Routine Manual
All Education Groups
Worker Tasks in the U.S. Economy, 1960 − 2009:

The Impact of Another Decade’s Data
Original: 1960 – 1998 Update: 1960 – 2009
30
40
50
60
70
Mea
n T
ask
In
put
in P
erce
nti
les
of
19
60
Dis
trib
uti
on
1960 1970 1980 1990 2000 2010
Non−routine Analytical Non−routine Interpersonal
Non−routine Manual Routine Cognitive
Routine Manual
Autor, Levy, and Murnane (2003) Figure 1
Worker Tasks in the U.S. Economy, 1960 − 1998:
30
40
50
60
70
Mea
n T
ask
In
put
in P
erce
nti
les
of
19
60
Dis
trib
uti
on
1960 1970 1980 1990 2000 2010
Non−routine Analytical Non−routine Interpersonal
Non−routine Manual Routine Cognitive
Routine Manual
All Education Groups
Worker Tasks in the U.S. Economy, 1960 − 2009:
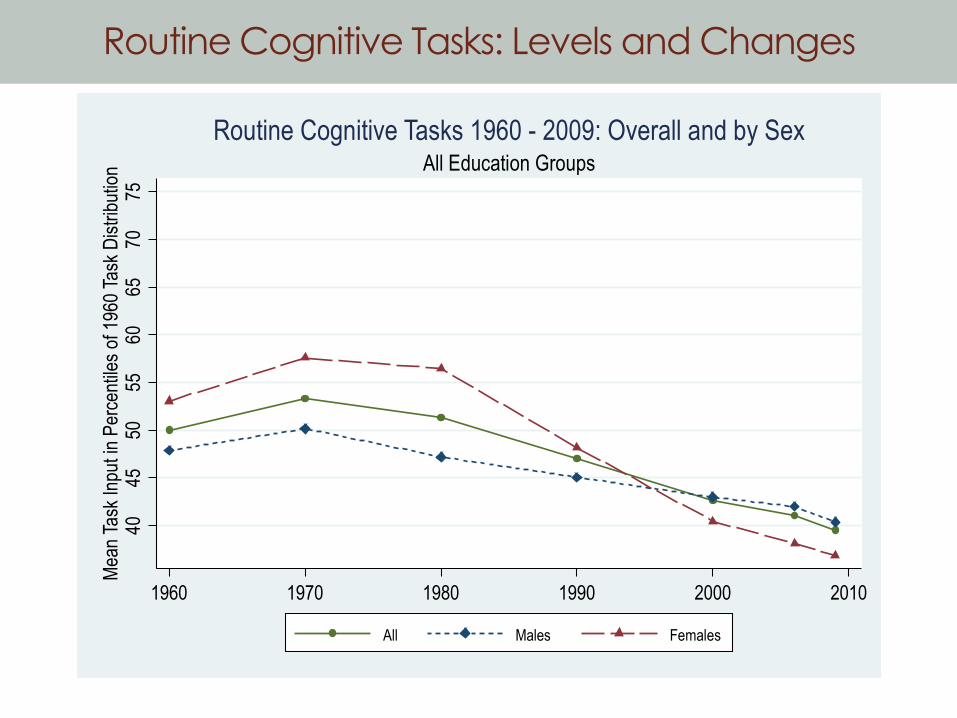
Routine Cognitive Tasks: Levels and Changes
4045
5055
6065
7075
Mea
n Ta
sk In
put i
n P
erce
ntile
s of
196
0 Ta
sk D
istr
ibut
ion
1960 1970 1980 1990 2000 2010
All Males Females
All Education Groups
Routine Cognitive Tasks 1960 - 2009: Overall and by Sex

Routine Manual Tasks: Levels and Changes
3035
4045
5055
6065
7075
8085
90M
ean
Task
Inpu
t in
Per
cent
iles
of 1
960
Task
Dis
trib
utio
n
1960 1970 1980 1990 2000 2010
All Males Females
All Education Groups
Routine Manual Tasks 1960 - 2009: Overall and by Sex

Nonroutine Analytical Tasks: Levels and Changes
3035
4045
5055
6065
70M
ean
Task
Inpu
t in
Per
cent
iles
of 1
960
Task
Dis
trib
utio
n
1960 1970 1980 1990 2000 2010
All Males Females
All Education Groups
Nonroutine Analytical Tasks 1960 - 2009: Overall and by Sex

Nonroutine Interpersonal Tasks: Levels and
Changes
2025
3035
4045
5055
6065
7075
80M
ean
Task
Inpu
t in
Per
cent
iles
of 1
960
Task
Dis
trib
utio
n
1960 1970 1980 1990 2000 2010
All Males Females
All Education Groups
Nonroutine Interpersonal Tasks 1960 - 2009: Overall and by Sex

Nonroutine Manual Tasks: Levels and Changes
2025
3035
4045
5055
6065
70M
ean
Task
Inpu
t in
Per
cent
iles
of 1
960
Task
Dis
trib
utio
n
1960 1970 1980 1990 2000 2010
All Males Females
All Education Groups
Non-Routine Manual Tasks 1960 - 2009: Overall and by Sex

Employment Polarization, 1979 – 2010 Percent Growth in Employment by Occupation
-.2
0.2
.4.6
Perso
nal C
are
Food/C
leaning Service
Prote
ctive
Service
Operato
rs/Laborers
Produ
ction
Offic
e/Adm
in
Sales
Technicians
Professio
nals
Mana
gers
Percent Change in Employment by Occupation, 1979-2010
1979-1989 1989-1999
1999-2007 2007-2010

Employment Polarization, 1979 – 2009 Percent Growth in Employment by Occupation
-10
-50
510
15
Servic
es
Prodn
/ Cra
ft/ O
per/
Labo
rer
Clerica
l/ Adm
in/ S
ales
Prof/
Tech/
Man
ager
s
Males
Ages 25-39 Ages 40-64
-10
-50
510
15Ser
vices
Prodn
/ Cra
ft/ O
per/
Labo
rer
Clerica
l/ Adm
in/ S
ales
Prof/
Tech/
Man
ager
s
Females
Ages 25-39 Ages 40-64
by Age Group and Major Occupation
Percent Change in Employment Share 1980-2009

Changes in Employment Share by Job Skill Tercile, 1993-2006 Comparison of U.S. and European Union Countries
-20
-10
010
20
USA
EU Ave
rage
Portug
al
Irelan
d
Finlan
d
Norway
Nether
lands
Greec
eUK
Sweden
Germ
any
Spain
Belgium
Denm
ark
Luxe
mbo
urg
Franc
e
Austri
aIta
ly
Source: Goos, Salomons and Manning (2009)
Lower Third Middle Third
Upper Third
US v. EU
Averages
EU Nations Ordered by Growth in High Skill
Occupation Share

Agenda
1. Technology anxiety – Past and present
2. What is distinctive about the computer revolution?
3. Changes in occupations: A detailed look
4. The difficulty of forecasting
5. Luddites revisited – What neoclassical theory says
6. Final thoughts

Projection Occupational Employment Trends:
Gasoline Service Station Attendants
• 1976 projections
• “Employment of gasoline service station attendants should continue
to grow over the next few years….
• …The trend towards cars better gas mileage capabilities could
eventually reduced total gasoline consumption, which might severely
limited growth in this occupation over the long run.
• …Self-service gas stations may also limit growth.”
• 2002/03 projections
• Service station attendants (0*NET 53-6031.00).
• Service automobiles, buses, trucks, boats, and other automotive or
marine vehicles with fuel, lubricants, and accessories.
• Projected 2000-10 employment change: A decline

46.2K
40.5K
31.4K
35.2K
33.2K
31.1K
25.8K
22.8K 21.8K
22.8K
0K
5K
10K
15K
20K
25K
30K
35K
40K
45K
50K
2002 2003 2004 2005 2006 2007 2008 2009 2010 2011
Gas Station Attendants in the U.S. 2000 - 2011

Projection Occupational Employment Trends:
Bank Tellers
1968
• “Important clerical occupations such as secretaries, stenographers, typists, cashiers, bank tellers, mail carriers, postal clerks, and telephone operators are not expected to be heavily affected by the use of computers…”
1980
• “Technological innovations will not affect many types of clerical workers whose jobs involve a high degree of personal contact.”
1992
• “… Employment of bank tellers is not expected to keep pace with overall employment growth in banks and other savings and credit institutions because of the increasing use of automatic teller machines…”
2000
• “… The increased use of ATM machines and Internet banking will reduce the number of tellers.”

493K
533K 527K 539K
553K
599K 603K 608K 600K
577K
556K 544K
0K
100K
200K
300K
400K
500K
600K
700K
2000 2001 2002 2003 2004 2005 2006 2007 2008 2009 2010 2011
Bank Tellers in the U.S. 2000 - 2011

Agenda
1. Technology anxiety – Past and present
2. What is distinctive about the computer revolution?
3. Changes in occupations: A detailed look
4. The difficulty of forecasting
5. Luddites revisited – What neoclassical theory says
6. Final thoughts

Traditional Economic View
1. Technological change is a win-win
• The only free lunch that economists can believe in (Mokyr, 1990)
2. Labor demand is unlimited
• “One of the best-known fallacies in economics is the notion that
there is a fixed amount of work to be done—a lump of labor—
which can be shared out in different ways to create fewer or
more jobs.”
3. Those who fear technological change are “Luddites.”
The Lump of Labor Fallacy
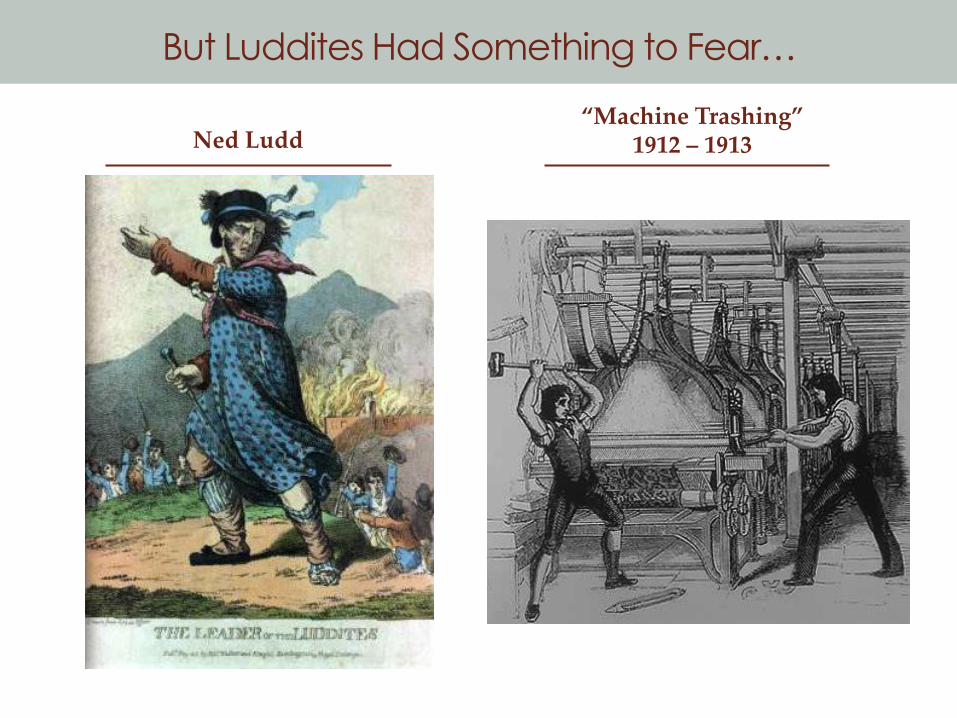
But Luddites Had Something to Fear…
Ned Ludd “Machine Trashing”
1912 – 1913

Technology Anxiety: Should we Worry?
• What the neoclassical theory predicts
a. There is a market-clearing wage, but it need only be
weakly positive
b. Labor’s share can rise or fall
c. Rising productivity passes the Kaldor-Hicks test, but not
necessarily the Pareto test

Percentage Point Changes in Real Hourly Wages by Education and Sex, 1979-2010
-25
-20
-15
-10
-50
510
15
20
25
30
35
< High
Sch
ool
High S
choo
l Gra
d
Some
Colleg
e
Colleg
e Gra
d
Post-C
olleg
e
Ages 25-39
Males Females
-25
-20
-15
-10
-50
510
15
20
25
30
35
< High
Sch
ool
High S
choo
l Gra
d
Some
Colleg
e
Colleg
e G
rad
Post-C
olleg
e
Ages 40-64
Males Females
by Education and Sex
Percent Changes in Real Hourly Wage Levels 1979-2010
Autor and Wasserman, 2013

Percentage Point Changes in Emp/Pop Rates by Education and Sex, 1979-2010
-0.1
0-0
.05
0.0
00
.05
0.1
00
.15
HS Dro
pout
HS Gra
duate
Some C
ollege
College G
raduate
Postcolle
ge
Pe
rce
nta
ge
po
int c
ha
ng
e in
em
plo
yme
nt t
o p
op
ula
tion
ra
te
1979-2007
Males Females
-0.1
0-0
.05
0.0
00
.05
0.1
00
.15
HS Dro
pout
HS Gra
duate
Some C
ollege
College G
raduate
Postcolle
ge
Pe
rce
nta
ge
po
int c
ha
ng
e in
em
plo
yme
nt t
o p
op
ula
tion
ra
te
2007-2010
Males Females
Changes in Employment to Population Rates by Sex and Education Group: Ages 25-64
Autor and Wasserman, 2013
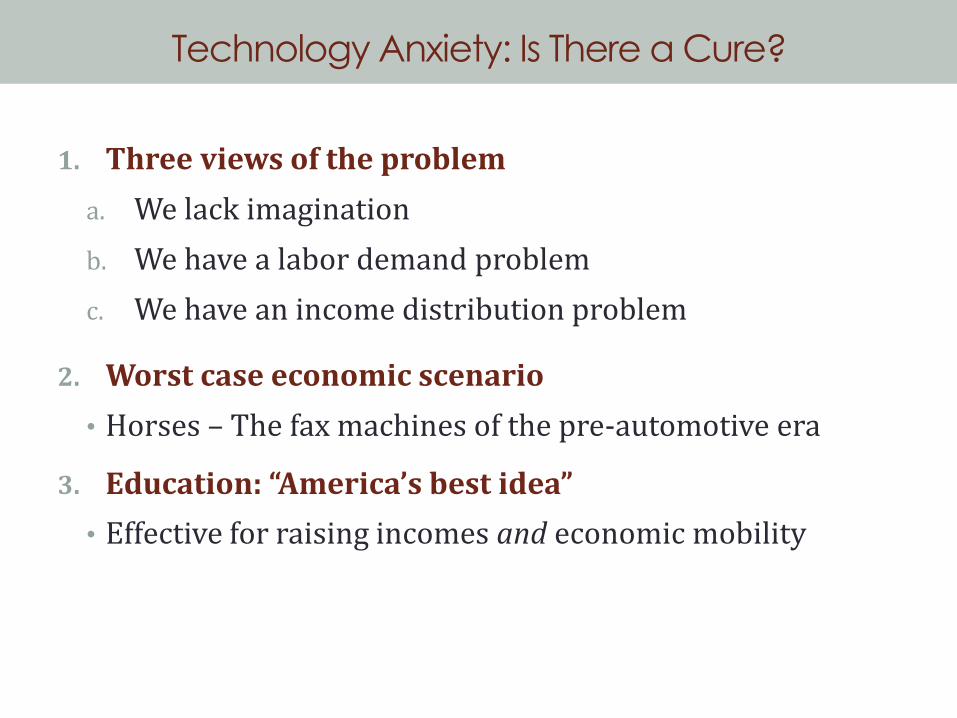
Technology Anxiety: Is There a Cure?
1. Three views of the problem
a. We lack imagination
b. We have a labor demand problem
c. We have an income distribution problem
2. Worst case economic scenario
• Horses – The fax machines of the pre-automotive era
3. Education: “America’s best idea”
• Effective for raising incomes and economic mobility