Embed Size (px)
Citation preview
Technology sourcing and exploitation in the knowledge economy: The case of the Hybrid Electric Vehicles industry
Master of Science Thesis in the Master Degree Programme,
Business Design
ERIC JAEGER Department of Technology Management and Economics Division of Management of Organizational Renewal and Entrepreneurship – MORE CHALMERS UNIVERSITY OF TECHNOLOGY Gothenburg, Sweden, 2011 Report No. E 2011:093
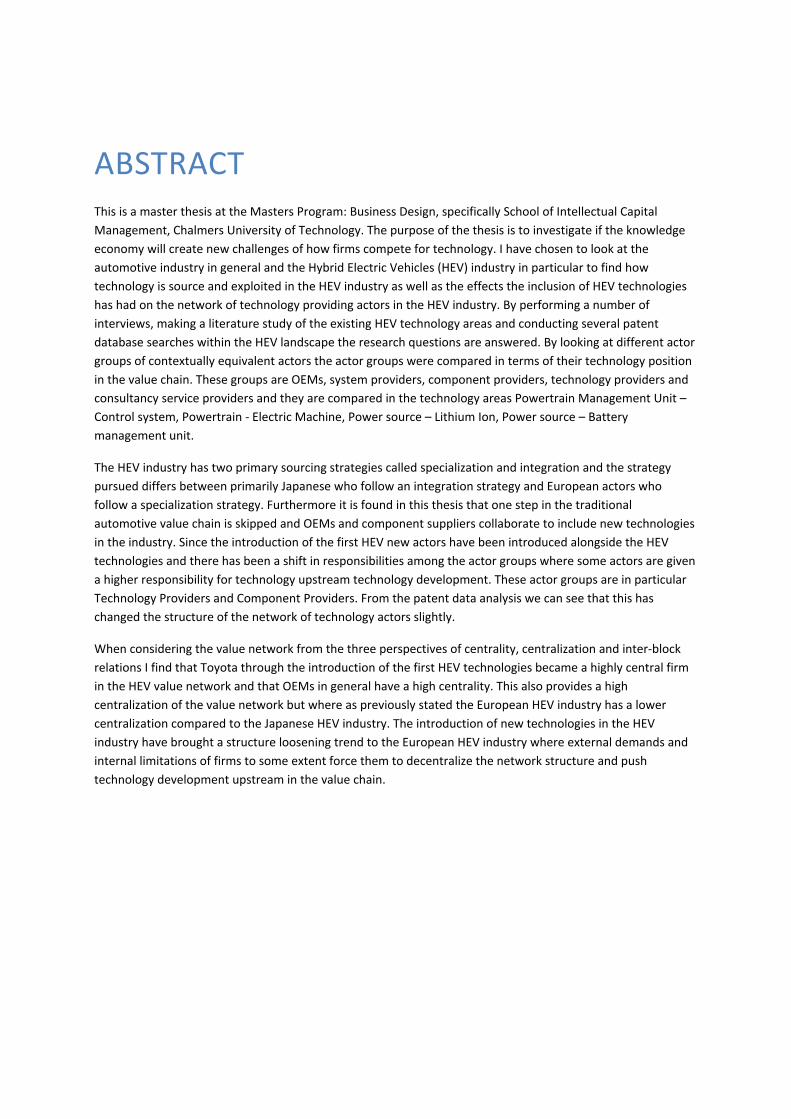
ABSTRACT This is a master thesis at the Masters Program: Business Design, specifically School of Intellectual Capital
Management, Chalmers University of Technology. The purpose of the thesis is to investigate if the knowledge
economy will create new challenges of how firms compete for technology. I have chosen to look at the
automotive industry in general and the Hybrid Electric Vehicles (HEV) industry in particular to find how
technology is source and exploited in the HEV industry as well as the effects the inclusion of HEV technologies
has had on the network of technology providing actors in the HEV industry. By performing a number of
interviews, making a literature study of the existing HEV technology areas and conducting several patent
database searches within the HEV landscape the research questions are answered. By looking at different actor
groups of contextually equivalent actors the actor groups were compared in terms of their technology position
in the value chain. These groups are OEMs, system providers, component providers, technology providers and
consultancy service providers and they are compared in the technology areas Powertrain Management Unit –
Control system, Powertrain ‐ Electric Machine, Power source – Lithium Ion, Power source – Battery
management unit.
The HEV industry has two primary sourcing strategies called specialization and integration and the strategy
pursued differs between primarily Japanese who follow an integration strategy and European actors who
follow a specialization strategy. Furthermore it is found in this thesis that one step in the traditional
automotive value chain is skipped and OEMs and component suppliers collaborate to include new technologies
in the industry. Since the introduction of the first HEV new actors have been introduced alongside the HEV
technologies and there has been a shift in responsibilities among the actor groups where some actors are given
a higher responsibility for technology upstream technology development. These actor groups are in particular
Technology Providers and Component Providers. From the patent data analysis we can see that this has
changed the structure of the network of technology actors slightly.
When considering the value network from the three perspectives of centrality, centralization and inter‐block
relations I find that Toyota through the introduction of the first HEV technologies became a highly central firm
in the HEV value network and that OEMs in general have a high centrality. This also provides a high
centralization of the value network but where as previously stated the European HEV industry has a lower
centralization compared to the Japanese HEV industry. The introduction of new technologies in the HEV
industry have brought a structure loosening trend to the European HEV industry where external demands and
internal limitations of firms to some extent force them to decentralize the network structure and push
technology development upstream in the value chain.
2
TABLE OF CONTENTS 1 Introduction To the thesis ............................................................................................................................... 7
1.1 Research questions .............................................................................................................................. 14
2 Research methodology ................................................................................................................................. 15
2.1.1 Data collection ................................................................................................................................ 16
2.1.2 Data analysis ................................................................................................................................... 17
2.1.3 Validity Discussion ........................................................................................................................... 19
2.1.4 Limitations ....................................................................................................................................... 20
3 Theoretical framework .................................................................................................................................. 21
3.1 The Value chain ................................................................................................................................... 21
3.2 The value network ............................................................................................................................... 22
3.3 Knowledge sourcing............................................................................................................................. 23
3.4 Vertical scope ...................................................................................................................................... 25
3.5 The value network from an infrastructure perspective ....................................................................... 25
3.6 The entrepreneurial change of the value network infrastructure ...................................................... 27
3.7 Theoretical framework discussion ....................................................................................................... 28
4 Finding the knowledge base – A technology tree ......................................................................................... 29
4.1 Technology development in Electric hybrid vehicles .......................................................................... 29
4.1.1 The hybrid engine ............................................................................................................................ 29
4.1.2 Hybrid engine topology ................................................................................................................... 30
4.1.3 Power source ................................................................................................................................... 32
4.1.4 Electrical Machines for Hybride electrical vehicles ......................................................................... 33
4.2 technology chapter Discussion ............................................................................................................ 34
5 The automotive industry ............................................................................................................................... 36
5.1 The Automotive value chain ................................................................................................................ 36
5.2 The Automotive actors ........................................................................................................................ 37
5.2.1 Battery actors .................................................................................................................................. 39
5.3 HEV Actor roles and relationships ....................................................................................................... 40
3
5.3.1 HEV Roles ........................................................................................................................................ 40
5.3.2 HEV relational types ........................................................................................................................ 41
5.3.3 How is technology shared, transfereed and controlled in the HEV industry .................................. 42
5.4 HEV R&D Sourcing strategies ............................................................................................................... 44
5.4.1 OEM powertrain ‐ technology sourcing and Innovation strategies ................................................ 45
5.4.2 Component and system supplier technology sourcing and innovation strategies ......................... 46
5.5 Intellectual Property Rights Position ................................................................................................... 48
5.6 IPR Position in Technology Areas......................................................................................................... 52
5.6.1 Powertrain Management Unit – Control system ............................................................................ 52
5.6.2 Powertrain ‐ Electric Machine ......................................................................................................... 53
5.6.3 Power source ................................................................................................................................... 54
6 Conclusion and discussion ............................................................................................................................ 57
6.1 Future Research ................................................................................................................................... 60
7 References..................................................................................................................................................... 61
8 Interviews ...................................................................................................................................................... 64
9 Appendix ....................................................................................................................................................... 65
9.1 Appendix A – Twenty largest auto component manufacturers ........................................................... 65
9.2 Appendix B – Ten largest auto Manufacturers (OEM) ......................................................................... 67
9.3 Appendix C – Interview Questionnarie ................................................................................................ 68
9.4 Appendix D – Patent Analysis .............................................................................................................. 71
9.4.1 Battery Management System .......................................................................................................... 71
9.4.2 Lithium Ion ...................................................................................................................................... 72
9.4.3 Electric Machine .............................................................................................................................. 73
9.4.4 Powertrain Management Unit ........................................................................................................ 74
9.4.5 Top 100 cited patents and assignees in the HEV dataset ................................................................ 75
4
LIST OF FIGURES Figure 1 – The growth of newly established R&D partnerships 1960‐1998. Source: Hagedoorn, 2002 ............... 10
Figure 2 – Relevance of five trends and developments for the automotive industry today and in ten years.
Source: Ili & Albers & Miller, 2010 ........................................................................................................................ 11
Figure 3 ‐ External sources of innovation ranked based on their preference in the automotive industry. Source:
Ili & Albers & Miller, 2010 ..................................................................................................................................... 12
Figure 5 – Methods for external exploitation of own IP in the automotive industry, Source: Ili & Albers & Miller,
2010 ...................................................................................................................................................................... 12
Figure 6 – Schematically described method used in this thesis ............................................................................ 16
Figure 7 – Process for data analysis ...................................................................................................................... 18
Figure 8 ‐ IP data test plan .................................................................................................................................... 19
Figure 9 ‐ The key technology fields in hybrid electrical vehicles (Source: Omonowo & Omoigui, 2009) ............ 30
Figure 10 ‐ Series hybrid topology ........................................................................................................................ 31
Figure 11 – Parallel hybrid topology ..................................................................................................................... 32
Figure 12 ‐ Battery technology field brakedown ................................................................................................... 32
Figure 13 – Technology tree for a Battery Management System ......................................................................... 33
Figure 14 ‐ Regenerative braking in parallel hybrid buses .................................................................................... 34
Figure 15 ‐ The Automotive industry value chain (source: IMAP 2010)................................................................ 37
Figure 16 – Ten Largest Auto Manufacturers by revenue (2008) (source: IMAP, 2010) ....................................... 38
Figure 17 ‐ Twenty Largest component manufacturers in the automotive industry (source: IMAP, 2010) ......... 39
Figure 18 – Schematic picture over Toyota technology licensing activities towards different actors .................. 45
Figure 19 ‐ Schematic picture over PSA’s technology development partners for their diesel HEV ...................... 46
Figure 20 – Visualization of a few of the key supplier/technology relationships of the Toyota Hybrid Synergy
Drive ...................................................................................................................................................................... 47
Figure 21‐ Number of published HEV patents (source: Thomson Innovation) and HEV sales (source:
www.afdc.energy.gov/afdc/data/docs/hev_sales.xls) ......................................................................................... 48
Figure 22 – Cumulative patent distribution between different actors in the HEV industry ................................. 49
Figure 23 – Patent portfolio development over time for the top patenting OEM and Suppliers in the HEV
industry ................................................................................................................................................................. 49
Figure 24 ‐ Number of top 100 cited patents per actors and actor role ............................................................... 51
5
Figure 25 ‐ Summary of key technology fields in hybrid electrical vehicles where the investigated technology
areas are highlighted............................................................................................................................................. 52
Figure 26 ‐ Relative patent density per actor group ............................................................................................. 53
Figure 27 ‐ Patenting activity comparison between 2000‐2005 and 2006‐2010 in control system ..................... 53
Figure 28 ‐ Patenting activity comparison between 2000‐2005 and 2006‐2010 in electric machine ................... 54
Figure 29 ‐ Relative patent density per actor group ............................................................................................. 54
Figure 30 ‐ Patenting activity comparison between 2000‐2005 and 2006‐2010 in lithium ion batteries ............ 55
Figure 31 ‐ Relative patent density per actor group ............................................................................................. 55
Figure 32 ‐ Patenting activity comparison between 2000‐2005 and 2006‐2010 in battery management unit .... 56
Figure 33 ‐ Relative patent density per actor group ............................................................................................. 56
Figure 34 ‐ A schematic view of technology/knowledge sharing among actor roles in the HEV value network .. 57
LIST OF TABLES Table 3 ‐ Most dominant HEV patent owners (Source: Lloyd & Blows, 2009) ...................................................... 51
Table 4 ‐ Most dominant HEV patents by owner (Source: Lloyd & Blows, 2009) ................................................. 51
Table 3 ‐ Short description of the 20 largest Auto Component Manufacturers (Source: IMAP 2010) ................. 66
Table 4‐ Short description of the ten largest Auto Manufacturers (source: IMAP 2010) ..................................... 67
6
FOREWORD The knowledge economy and the exponential change in societies producing the commoditization of knowledge
are ever intriguing. Starting of this thesis I wanted to find out what aspects of an industry that changes as it
moves towards becoming more knowledge centered. As it turned out it was hard to concretize something
abstract by nature. Building on an interest spurred in the master course Advanced ICM theory and an interest
for the automotive industry I sat out to investigate if the introduction of the hybrid electric vehicle could mean
that also the automotive industry is entering this economy of knowledge and if so how would the infrastructure
of that industry change. This proved to be an interesting and challenging task.
I have now reached the summer and closing in on the end of my thesis I am thinking of what I’ve learned this
autumn and from whom. Throughout this spring I have spent many hours investigating the hybrid electric
vehicles industry and by that got an insight to both managerial principles and technical innovations but
experiences are gained through interaction with others. Starting of I would therefore like to thank Anders
Sundelin who has supervised and mentored me throughout the spring. He has also provided me with tools and
principles from CIP Professional Services that have been used in this thesis. Thank you for your patience and
support. Furthermore I would like to thank all interviewees for helpful and interesting interviews and a
willingness to share your experiences. To everyone at CIP Professional Services, thank you for making this
spring both fun and interesting. My last thank you goes to the ever cheerful Eva Henricsson for being a
sounding board and support during this spring.
7
1 INTRODUCTION TO THE THESIS
“The change brought about by the networked information environment is deep. It is structural. It goes to the
very foundations of how liberal markets and liberal democracies have co‐evolved for almost two centuries”.1
The knowledge economy differs from the industrial economy in the way the fundamental scarce resources in
economic production of the economy are assessed. In this new economy the traditional resources such as land,
labor and capital are superseded by knowledge as such2. What can be seen in this economy is that access and
production of knowledge becomes prerequisites for value creation3. As an analogy it is said that the role of
knowledge in the knowledge economy is of similar importance as capital in the industrial economy.4 What also
can be seen is that the neoclassical view of the firms is no longer valid since the firm cannot be assumed to be
unable to affect its environment and market conditions. Innovation and the creation of markets is dependent
on the firm, the system in which the firm operates and the firm’s ability to affect this system5. Hence,
innovation is no longer exogenous and can be sourced through the collective ideas and knowledge within a
system.
But what are an economy and a market? Economic theory describes an economy as markets where products,
services and monetary flows are analyzed in terms of their impact on said market. The theories are based on
the assumption that humans are rational and profit maximizing and models are created over how rational
humans will act to consume, produce or trade goods or services under the pressure of scare resources. This
choice made by humans is connected to an opportunity cost6. Hence, a market is driven by human choice. A
less abstract definition of a market is that it is
“a means by which the exchange of goods and services takes place as a result of buyers and sellers
being in contact with one another, either directly or through mediating agents or institutions”7.
Although expressed in a number of different ways8 a market is usually defined as a means for an exchange of
goods between actors that are in some way connected through mediating agents or institutions. Hence,
defining a market includes describing the different means for exchange of goods, the actors which make the
exchange, how these actors are connected and the agents and/or institutions which mediate the connection
between different actors. The concept of division of labor, as introduced by Adam Smith, is that the means for
productivity is specialization. In order for this specialization to function there needs to be an exchange. If the
cost of this exchange (the transaction cost) is lowered the specialization will increase. According to the theories
of Ronald Coase, the cost of exchange depends on the institutions of a country: its legal system, political
system, social system, educational system, its culture etc9.
Kotler et al (2009) takes a marketing management perspective on markets and specify the exchange as a
transaction of any product or service class. This highlights the issue if knowledge that is not codified or tacit can
be said to be a product or service class. Petrusson (2004) categorizes knowledge that is codified, valuable and
transferrable as intellectual capital. While some assets e.g. innovations or technologies can be codified as
Intellectual Property Rights some might not be possible to be represented as property or capital as a product or
1 Benkler, 2006 2 Liu, 2007 3 Drucker, 1994 4 Liu, 2007 5 Kim & Mauborgne, 1999 6 Wessels, 2006 7 www.britannica.com (2011‐02‐11) 8 Kotler, 2009 9 Coase, 1990
8
service class could be. It can therefore be interesting to find effects of specialization and cost of exchange
(benefits of exchange) regarding innovation and technology in the knowledge economy.
Each economy e.g. regional economy, national economy and global economy and consequently also the
knowledge economy consist of complex interactions interlinked through transactions10. This is by Kotler et al
(2009) referred to as the network economy. The network economy is defined as a dynamic, technology and
knowledge dominant environment where organizations and institutions have evolved into networks such as11:
‐ Internal networks that reduce hierarchy and open up firms towards the environment
‐ Vertical networks that maximize the output of serially dependent functions by collaborations
‐ Inter‐market networks that leverage through horizontal synergies in an industry
‐ Opportunity networks are networks centering on consumer needs and market opportunity to try to
solve this market imbalance.
The networked economy shares some of the characteristics of the definition of the knowledge economy given
in this thesis but in the knowledge economy a dimension of exchange of knowledge within the network is
further emphasized besides the exchange of information. Kotler et al argue that when companies become
more networked and through this business markets and the actors within these markets become more
networked the level of complexity increases for the player in the market. This has several effects, out of which
Kotler et al mention four:
1. Outsourcing and relationships that allow companies to operate blur the concept of the value chain.
2. As buyers and sellers collaborate in joint development efforts the concept of customer relationship is
blurred.
3. The line between organizational functions are blurred since departments are interlinked through
technology
4. The concept of product, experience and service is blurred as the economy moves from and industrial
base to knowledge‐based business.
There exist a basic set of collective resources for the knowledge economy which represent a supportive
framework for the knowledge economy. This includes infrastructures, R&D potential, educational and training
environment, pool of relationships and rules & norms providing trust and reliability i.e. institutions12.
Furthermore the logic for strategic management can be said to have changed where primary strategic focus in
the knowledge economy must be to expand existing markets or create new markets over outperforming
competition in obsolete markets13. Blaxill and Eckhardt (2009) also argue that the concept of open or
collaborative innovation in essence is about jointly growing the collective market14. Therefore it seems to exist
a need to investigate under which conditions a firm can strategically interact with its environment and create
wealth.
The knowledge economy has brought new types of actors and increased complexity of roles and relationships
among actors15. One such actor and role that has undergone a change in responsibility and role is that of the
service provider, especially regarding innovation and regional competitiveness. This is due to the fact that
knowledge services systematically contribute to the distribution and implementation of knowledge16.
Furthermore, knowledge services are also the starting point for the dispersion of the knowledge economy and
10 Kotler, 2009 11 Kotler, 2009 12 Fuchs & Shapira, 2005 13 Kim & Mauborgne, 1999 14 Blaxill & Eckhardt, 2009 15 Link & Siegel, 2007 16 Fuchs & Shapira, 2005
9
knowledge markets as is exemplified in the quote below from Benkler (2006). “By codification, knowledge picks
up more and more of the properties of a commodity. Market transactions are facilitated by codification:
codified knowledge can be more precisely described and specified in terms of content and intellectual
properties, and this can reduce uncertainties and information asymmetries in any transaction involving
knowledge.”17
In creating wealth, knowledge is becoming more and more important and is gradually replacing traditional
assets as the key asset for wealth creation18. When intellectual properties are transacted and packaged so that
they by the receivers are perceived as transactable the property can be interpreted as intellectual capital. It is
not so much the transaction as such as the acceptance of the asset being transactable by the economic
infrastructure that is the determining factor. The asset shall have reached a level of acceptance and perceived
value that enables it to be used as collateral, basis for a technology license or other financial extraction
means19. The value of intellectual capital or tradable intangibles (IPRs) is contextual and can have more than
one revenue stream, in more than one context at the same time20. Since intellectual capital is a twofold issue of
packaging the asset on the sending end and acceptance of the same asset on the receiving end both sides must
be investigated to understand the creation of valuable assets in the knowledge economy. If assets are not
accepted as a financial instrument they become dead capital21. There seem to exist a need for further studies
that set out to investigate the infrastructures surrounding the receiving and creation of intellectual capital. This
includes how infrastructural factors have evolved when knowledge is turned into intellectual capital and how
knowledge is used to leverage ones position among a network of interdependent actors competing for the
knowledge and technological upper hand.
Primary technological advancement has erased the physical and material barriers to production of information
and knowledge which has produced a society in its foundation based on human creativity where economics of
knowledge and information are the core infrastructure of the networked information economy or the
knowledge economy. This structure for the new economy differs from the foundations of the structures of the
industrial economy and the prevailing consensus around economic production of the past century or two22.
One of the most radical observations as a result of this new economy is the emergence of effective, large‐scale
cooperative production efforts of knowledge, information and culture. The typical example of the co‐creation
era and also the success of the same are coming from open‐source software and the Information &
Communication Technology industries e.g. Linux23 and Wikipedia24. Lately we there has been a growth of
similar efforts also in other areas where it is no longer just software platforms that are co‐created25, e.g. the
Human Genome Project26.
The potential of co‐creation seems to grow as more industries gradually evolve into using a similar set of assets
or try to serve similar markets. Industry convergence is generally described as a blurring of industry
boundaries27. Technological innovations are in many cases the drivers of industry convergence. Industries can
be said to be technologically convergent when their products and processes rely on a similar set of
technological assets28. In one general definition there exist two types of technological convergence, in
17 Fuchs & Shapira, 2005 18 Kim & Mauborgne, 1999 19 Petrusson, 2004 20 Sullivan, 2004 21 De Soto, 2000 22 Benkler, 2006 23 http://www.linuxfoundation.org/ 24 http://en.wikipedia.org/wiki/Wikipedia:About 25 Benkler, 2006 26 http://www.ornl.gov/sci/techresources/Human_Genome/project/hgp.shtml 27 Stieglitz, 2002 28 Stieglitz, 2002
10
downstream and upstream markets. In upstream convergence of markets products of diverging traits to a
larger extent rely on the same set of technological assets. One classical example of this upstream convergence
of markets is the convergence of telecommunications, computing and entertainment into a multimedia
industry29. In downstream convergence of markets existing technological assets form diverging markets are
used jointly or pooled in order to create new products and services30. One example is the Smartphone/PDA
industry where telecommunications firms, computer firms, entertainment firms and the calculator industry
competed to develop the first PDAs31 and continue to compete for new generations of hand held devices. What
effect does this industry convergence have on the creation and exploitation of technology and the actors
creating this technology?
As an example we can see that more than 50% of the inventions stemming from Bell Laboratories are used
outside the telephone industry32. There are also numerous examples from e.g. the consumer electronics
industry where knowledge and products are co‐ created from numerous actors. This include the iPhone/iTunes
interface where users, music providers, Apple and its suppliers all partake in the (co‐)creation of not just the
phone but the whole system of applications, media and hardware. This need for collaborative creation of
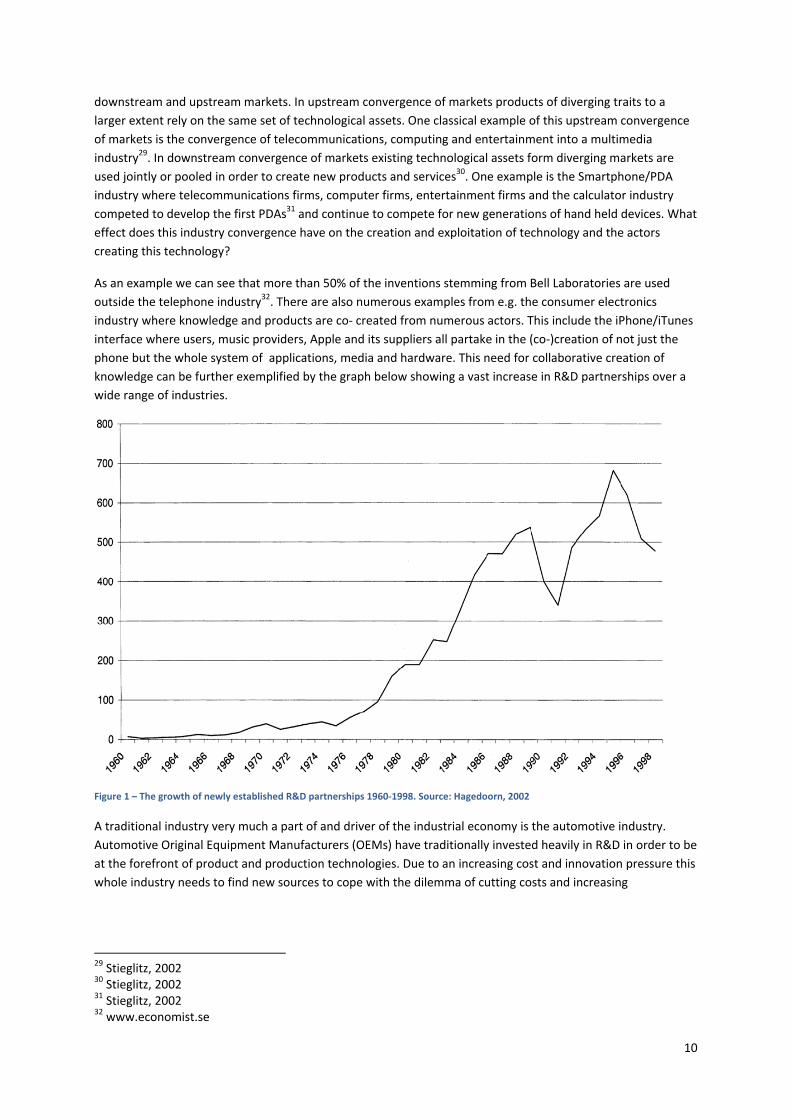
knowledge can be further exemplified by the graph below showing a vast increase in R&D partnerships over a
wide range of industries.
Figure 1 – The growth of newly established R&D partnerships 1960‐1998. Source: Hagedoorn, 2002
A traditional industry very much a part of and driver of the industrial economy is the automotive industry.
Automotive Original Equipment Manufacturers (OEMs) have traditionally invested heavily in R&D in order to be
at the forefront of product and production technologies. Due to an increasing cost and innovation pressure this
whole industry needs to find new sources to cope with the dilemma of cutting costs and increasing
29 Stieglitz, 2002 30 Stieglitz, 2002 31 Stieglitz, 2002 32 www.economist.se
11
innovativeness simultaneously33. So far the tendency has been to look outside the boundary of the firms but
the industry has lacked external paths to market outside the current business up until today34.
The trends leading up to the argument that we are entering a knowledge economy are both compelling and
interesting but some industries seems to be more affected and adjunct with this new economy than others. I.e.
one can see these new forms of collaborative innovation and open usage of knowledge in the software
industries and consumer goods35 but will it be able to enter old industries such as the automotive industries? If
this transformation is underway, how will it affect the industry and the network of actors in the industry? What
roles, relationships and characteristics will a mature industry characterized by industrial and production assets
need to undergo this change?
A highly attenuated topic of research and management literature is the notion of open innovation which also
argues for an open and collaborative approach towards innovation where knowledge (R&D) is sourced from
outside the boundaries of the firm and is exploited externally36. How appropriate this external sourcing of
knowledge is depends on the extent to which a firm conforms to macro level trends such as globalization,
technology fusion, technology intensity, introduction of new business models and knowledge leveraging;
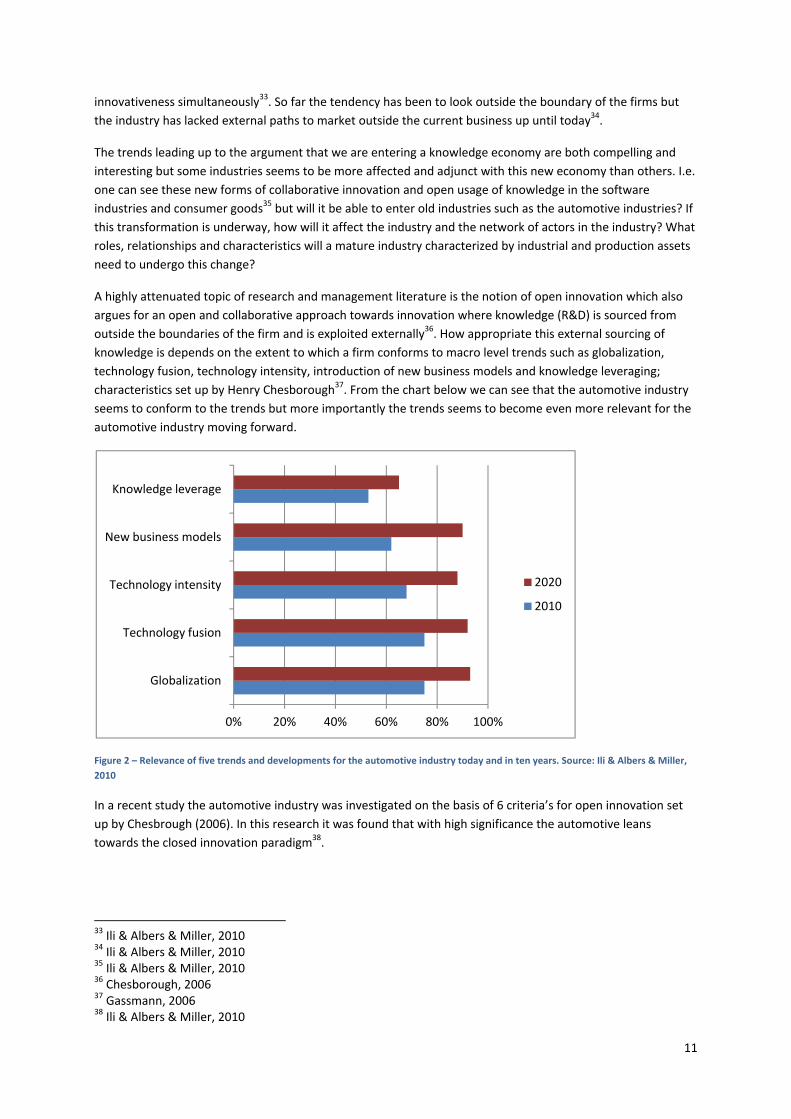
characteristics set up by Henry Chesborough37. From the chart below we can see that the automotive industry
seems to conform to the trends but more importantly the trends seems to become even more relevant for the
automotive industry moving forward.
Figure 2 – Relevance of five trends and developments for the automotive industry today and in ten years. Source: Ili & Albers & Miller,
2010
In a recent study the automotive industry was investigated on the basis of 6 criteria’s for open innovation set
up by Chesbrough (2006). In this research it was found that with high significance the automotive leans
towards the closed innovation paradigm38.
33 Ili & Albers & Miller, 2010 34 Ili & Albers & Miller, 2010 35 Ili & Albers & Miller, 2010 36 Chesborough, 2006 37 Gassmann, 2006 38 Ili & Albers & Miller, 2010
0% 20% 40% 60% 80% 100%
Globalization
Technology fusion
Technology intensity
New business models
Knowledge leverage
2020
2010
12
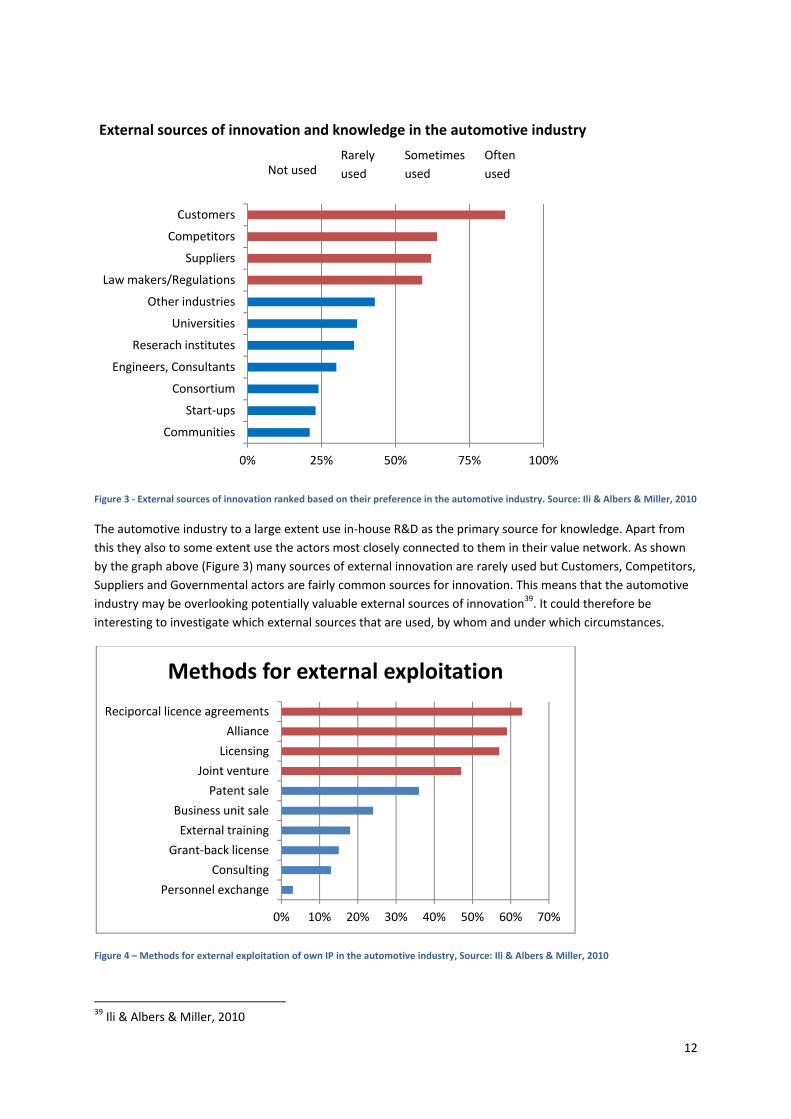
Figure 3 ‐ External sources of innovation ranked based on their preference in the automotive industry. Source: Ili & Albers & Miller, 2010
The automotive industry to a large extent use in‐house R&D as the primary source for knowledge. Apart from
this they also to some extent use the actors most closely connected to them in their value network. As shown
by the graph above (Figure 3) many sources of external innovation are rarely used but Customers, Competitors,
Suppliers and Governmental actors are fairly common sources for innovation. This means that the automotive
industry may be overlooking potentially valuable external sources of innovation39. It could therefore be
interesting to investigate which external sources that are used, by whom and under which circumstances.
Figure 4 – Methods for external exploitation of own IP in the automotive industry, Source: Ili & Albers & Miller, 2010
39 Ili & Albers & Miller, 2010
0% 25% 50% 75% 100%
Communities
Start‐ups
Consortium
Engineers, Consultants
Reserach institutes
Universities
Other industries
Law makers/Regulations
Suppliers
Competitors
Customers
0% 10% 20% 30% 40% 50% 60% 70%
Personnel exchange
Consulting
Grant‐back license
External training
Business unit sale
Patent sale
Joint venture
Licensing
Alliance
Reciporcal licence agreements
Methods for external exploitation
External sources of innovation and knowledge in the automotive industry
Not used Rarely
used
Sometimes
used
Often
used
13
The most commonly used methods for exploitation of IP (knowledge) are licencing, alliances and reciprocal
agreements. These are manly put in place as a measure to avoide conflict (reduce cost) rather than as means
for profit maximization. So far there exists no norms or mindsets for active expliotations over the full
automotive industry40. This thesis will investigate to what extent the industry will change in its view on
technology sourcing and exploitation when entering into an era where knowledge access and knowledge
production becomes more important. Potentially this change will be brought to traditional manufacturing
industries such as the automotive industries as has happened in other areas of information and communication
technologies, biotechnology etc. This industry wide change could be brought by the green era with fossil fuel
reductions and the chase for reduced emissions with the use of new technology. The green era has already
started alongside a electrification trend in the automotive industry. As stated earlier, technological innovation
drives industry convergence and could it be so that these trends will bring new players to the industry, create
new relationships, new knowledge and an increase in the usage of IPRs? I set out to analyze the transition to
the knowledge economy in the automotive industry by looking at the growing hybrid and electrical vehicles
market. Since the introduction of the first Toyota Prius in 199741 many of the large actors in the automotive
industry have followed and introduced hybrid electric vehicles42. It does not only seem as though it is the car
manufaturers (or OEMs) that are introduceing the new electrified technologies, new actors appear on the
market and the whole value chain of actors seems to be affected in one way or another. In the knowledge
economy where access to knowledge becomes crucial, will and have the dynamics between the actors in this
industry changed?
40 Ili & Albers & Miller, 2010 41 http://www.hybridcars.com/history/history‐of‐hybrid‐vehicles.html 42 http://www.hybridcars.com/cars.html
14
1.1 RESEARCH QUESTIONS
The introduction introduced a number of interesting areas of research which have been boiled down to two
thesis research questions. The introduction highlighted challenges and characteristics of the knowledge
economy where new knowledge and innovation brings industries to converge which in turn brings new players,
products, relationships and challenges to an industry. The industry studied in particular is the automotive
industry and the “electrification” trend of the same where modern cars use hybrid electric drive trains to
reduce emissions and fuel consumption. The thesis will investigate the industry development over time
focusing on indicators of the knowledge economy with a high focus on where, how and by whom technology
and knowledge is created in the Hybrid Electric Vehicles industry. The aim is to look at the dynamics of an
industry in transition and to see if there is a shift in how technology is sourced. From this conclusions will be
draw on what trends that are apparent in this transition to the knowledge economy and how the industry
infrastructure changes in this transition. The research questions are presented below:
1. How is new technology sourced and exploited in the Hybrid Electrical Vehicles industry?
2. What effects has the introduction of new technology had on the network of actors creating the
technology in the HEV industry: how has the network changed?
In my opinion there are a number of ways in which these questions can be answered so I will elaborate on
what sub‐questions were generated by the presented research questions. Hopefully this will also bring some
clarity into the way in which I have approached in answering the questions which in turn lead to the chosen
research methodology. Starting with the first question it focuses on new technology in the hybrid electric
vehicles industry. This industry segment is chosen since it is closely coupled to recent introductions of
technologies within the electrification of the automotive industry. To find sourcing and exploiting strategies my
study will include mapping the technology areas of the HEV industry as well as mapping the different actor
groups participating in the creation of these technology areas. By studying the relational types between these
actor groups the exploitation strategies existent in the industry can be found. Also, by investigating how
technology ownership and R&D activities to create new technology differ between different actor groups I will
be able to conclude if the network of technology creators has changed since the introduction of the HEV
technologies.
15
2 RESEARCH METHODOLOGY
The purpose of this section is to describe the process in which the research questions were answered and to
motivate why the conclusions are valid as well as providing a set of limitations of the thesis.
‐‐‐‐‐‐‐‐‐‐‐‐‐‐‐‐‐‐‐‐‐‐‐‐‐‐‐‐‐‐‐‐‐‐‐‐‐‐‐‐‐‐‐‐‐‐‐‐‐‐‐‐‐‐‐‐‐‐‐‐‐‐‐‐‐‐‐‐‐‐‐‐‐‐‐‐‐‐‐‐‐‐‐‐‐‐‐‐‐‐‐‐‐‐‐‐‐‐‐‐‐‐‐‐‐‐‐‐‐‐‐‐‐‐‐‐‐‐‐‐‐‐‐‐‐‐‐‐‐‐‐‐‐‐‐‐‐‐‐‐‐‐‐‐‐‐‐
This thesis aims at empirically testing the transition of an industry to become more knowledge centered when
new technological innovations are introduced. When performing empirical research three commonly used
approaches are deductive, inductive and abductive research. The three methods differ in how theory is applied
and related to the empirically collected data. Deductive research takes the starting point in existing theory to
produce a hypothesis and proves or rejects that theory with the support of empirical findings. Inductive
research on the contrary uses empirical findings to produce a theory or improve existing theory. Abductive
research combines the two concepts and starts with writing a theory on the basis of empirical findings and then
uses new empirical data to test and improve the theory43.
The research was initiated by an investigation of existing literature and theoretical concepts relating to the
research questions. Literature in the form of books and articles has been used to produce the theoretical
framework. This theoretical framework was then used as a basis for the empirical research and the conclusions
drawn from the collected data. Hence, this thesis can be said to have deductive research approach.
The empirical research strategy used in this thesis is a case study. A case study typically studies an individual
unit such as a child, a class, a school or a community44. The HEV industry studied in this thesis can be said to
represent a community, sharing common characteristics. Furthermore, the purpose of a case study observation
is to gain a deep understanding and analyze the life cycle of a unit and its many shifts and turns45. A case study
is said to be applicable when you want to find phenomena close to peoples experience and practice and at the
same time be able to draw generalized conclusions on a wider scale. This thesis uses the case of the HEV
industry to be able to draw conclusions on the automotive industry at large. Furthermore, the suitability for
small scale research also makes the case study a practical choice from a resource perspective46.
43 Patel and Davidson, 1991 44 Biggham, 2008 45 Biggham, 2008 46 Blaxter, Hughes and Tight, 2006
16
Figure 5 – Schematically described method used in this thesis
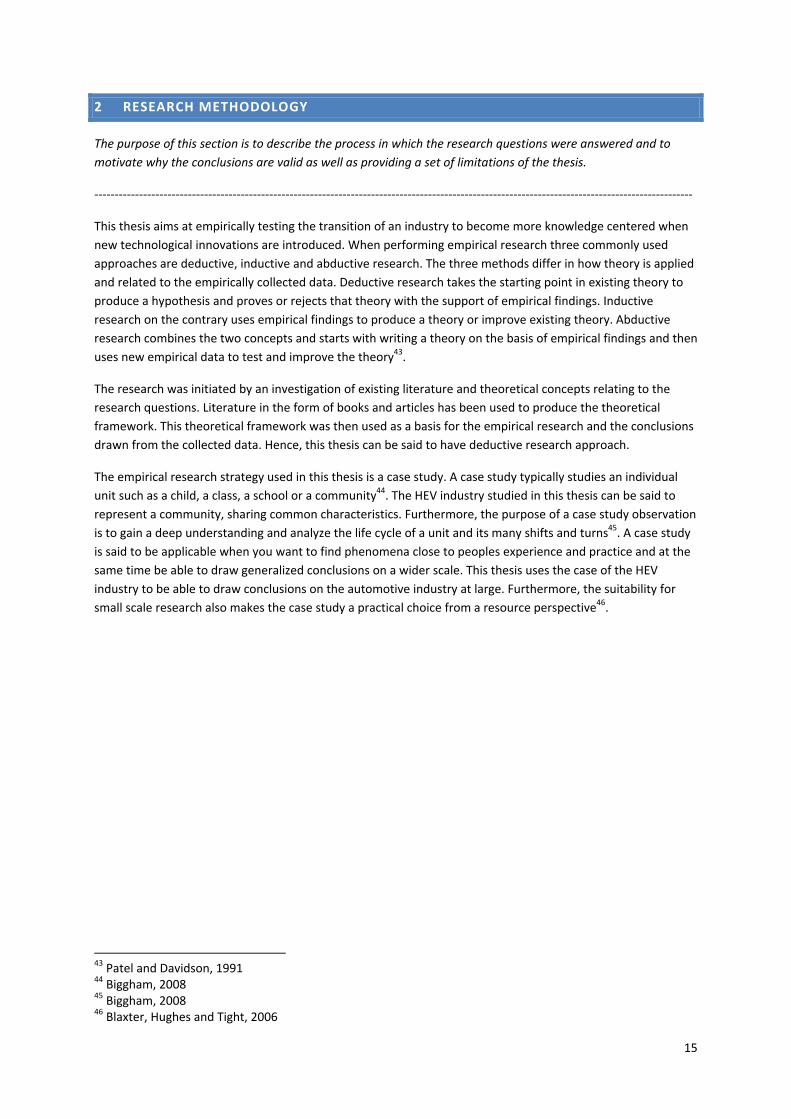
As is shown in Figure 5 the starting point in the thesis was to conduct a literature study and create a theoretical
framework used to guide the analysis. After the theoretical framework was chosen a data collection phase
started. This phase can be said to be divided into three parts as described in the figure. The first part was to
map the knowledge base by presenting the technology areas in the HEV industry depicted by a technology tree.
This was followed by an identification of the value chain of processes and actors in the industry. To be able to
build a value network I investigated what actor types, roles and relationships that exist and group them in
order to be able to analyze and compare the different groups in the analysis. To finalize and answer the
questions of the effect of new technology have had on the network of actors creating the technology in the
HEV industry I looked at changes in IPR position between different actor groups holding different positions in
the value chain.
2.1.1 DATA COLLECTION
Quantitative and qualitative methodologies are two different approaches to systematic collection, organization
and interpretation of data47. In this setting qualitative approaches can be said to hypothesis generating while
quantitative approaches can be said to be hypothesis validating48. A qualitative approach is used to investigate
the meaning of social phenomena as they are experienced by individuals themselves in a natural context49.
Hence, the knowledge is acquired by interpreting the dataset. Au contraire, in quantitative research knowledge
is acquired strictly based on positive affirmation50.
An interview can be either quantitative or qualitative. A qualitative interview is used to unfold a characteristic
or phenomenon. The interview can be either structured or unstructured51 and depending on the research
method they will differ in suitability. A structured interview will be performed in a questionnaire leaving less
47 Malterud, 2001 48 Ödman, 2007 49 Malterud, 2001 50 Ödman, 2007 51 Phillips and Stawarski, 2008
17
room for flexibility outside the questions in the questionnaire whereas an unstructured interview leaves more
room for reasoning from the interviewee52.
The nature of the research in this thesis makes it suitable to use both quantitative and qualitative research
methods. Initially this thesis sets out to find a set of characteristics in the HEV industry which were not set from
the beginning. Therefore the qualitative approach was used through semi‐structured interviews. These
interviews rendered in a number of characteristics such as actors, roles and relationships. In order to find
changes and trends in the characteristics generated in the interviews a more quantitative approach was used.
Through patent database searches this thesis set out to find changes in their position in the value network.
Since the thesis sets out to find developments in an industry at large this approach was chosen due the higher
validity when studying the whole population by using patent searches.
The interview questionnaire (Appendix C – Interview Questionnarie) and the interviews was created with
respect to that the interviewee ideally should be able to elaborate as much as possible on the different
questions and depending on the expertise of the interviewee questions were given different emphasis during
the interviews. The patent searches were performed in the patent database tool Thomson Innovation53. The
searches were performed with respect to that a specific population of patents would represent the HEV
industry. The population chosen to represent the HEV industry was ~16 500 patents found when performing a
search for “hybrid” NEAR2 (“vehicle” OR “car”). All subsequent searches were done within this dataset.
The searches within the dataset will make the result skewed since it is tainted by the search phrase but it has
been triangulated from a professional patent search report54. The patent dataset will also be skewed towards
architectural patents meaning that there is a risk that the firms doing architectural R&D could be
overrepresented in my searches. In effect this means that OEMs might be overrepresented in the results.
Although a rigorous literature study and presentation of the technology areas of the HEV industry is made in
the results chapter, this thesis chooses to focus in on a few specific technology areas to try to see trends in
technology development and knowledge creation between different actor roles and position in the value chain.
For practical and resource reasons only a sample from the total population could be investigated in the
interviews. There are many sampling techniques available, including, random sampling, stratified sampling,
cluster sampling, systematic sampling quota sampling and convenience sampling. This thesis has chosen a
convenience sampling of the interviewees due to the highly disperse and large population of actors in the HEV
industry. Convenience sampling is as the name suggest non‐random55 and was implemented due to the
accessibility of interviewees. Therefore the results from the interviews have to be treated with care and the
reliability of the data from the interviews has been triangulated56 by comparing it to a third source providing
secondary data. The types of sources were data from industry reports, annual reports, business databases and
web searches. The thesis therefore can argue for the possibility to generalize the findings over the full
population of actors.
2.1.2 DATA ANALYSIS
52 Phillips and Stawarski, 2008 53 http://www.thomsoninnovation.com/ 54 Lloyd & Blows, 2009 55 Biggham, 2008 56 Biggham, 2008
18
The data used in this thesis comes from two primary sources of data namely interviews and patent database
searches. To support this data secondary data from industry reports, annual reports, business databases and
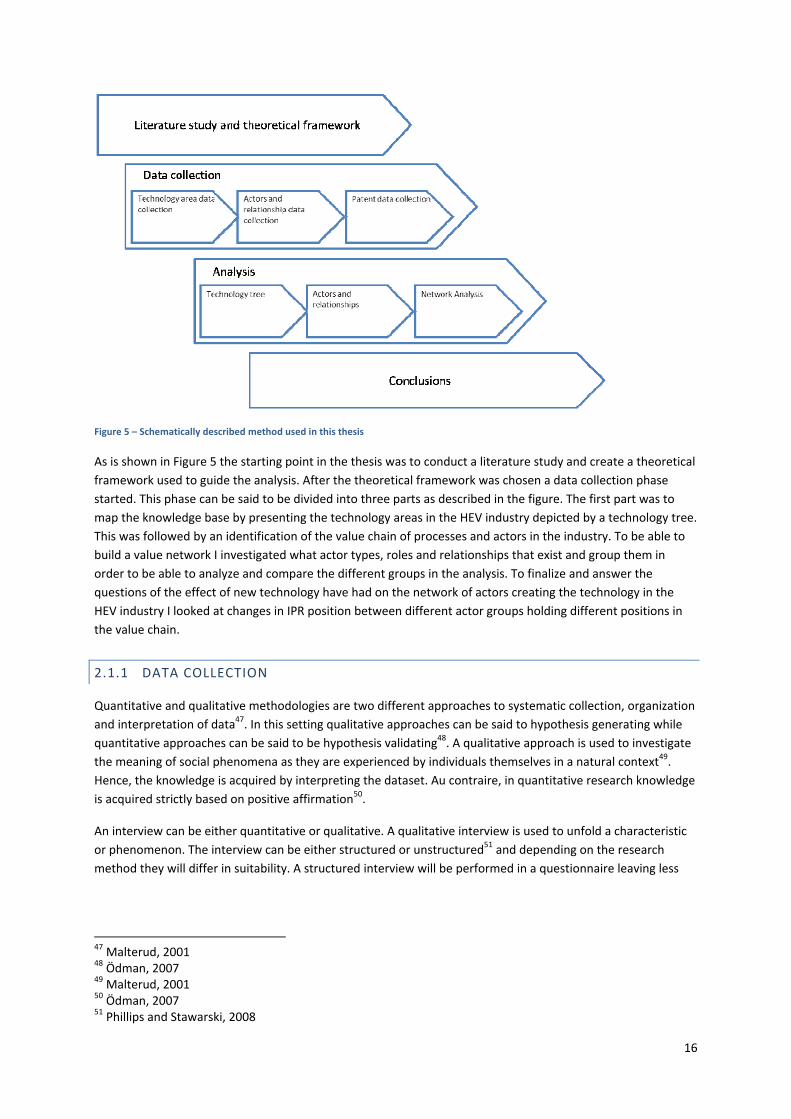
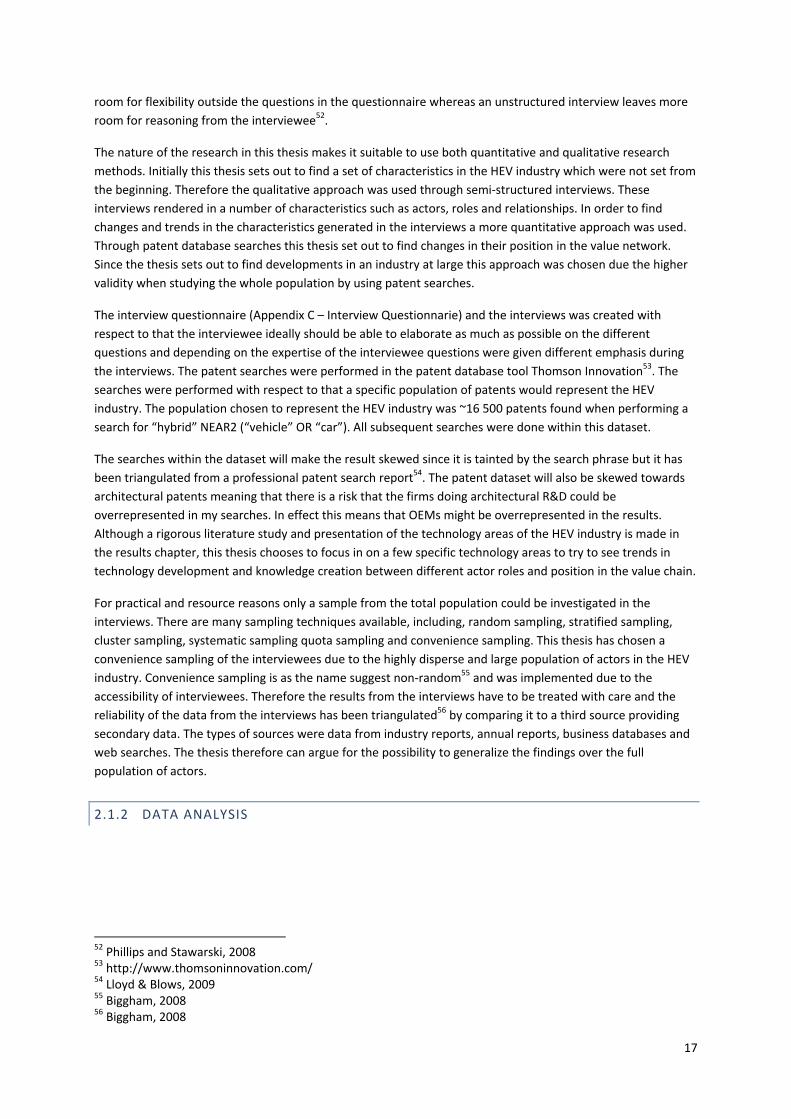
web searches has been used. To analyze the qualitative data an iterative analysis process has been used. This
process is focused around the concepts of description, analysis and interpretation. Analyzing qualitative data
requires an iterative process57, why this has been applied. This process is shown in Figure 6.
The collected data was described and grouped into the themes actors, roles and relationships and analyzed
separately. This was then interpreted at a whole to produce a broad understanding for the network of actors,
relationships and technologies building up the HEV industry infrastructure. After this the findings from the data
analysis were put into the analytical framework to find an academic context for the findings.
The actors were grouped into OEM, component and system supplier, consultancy or technology provider. This
grouping was based on the interviews and also supported by industry reports. There exist a number of ways in
which this large industry could be grouped but given the purpose of the thesis this level of scope in terms of
comparable value chain/value network actors was considered suitable. A higher number of groups were
expected to generate less clear‐cut differences between the groups why this grouping was chosen.
2.1.2.1 PATENT DATA ANALYSIS
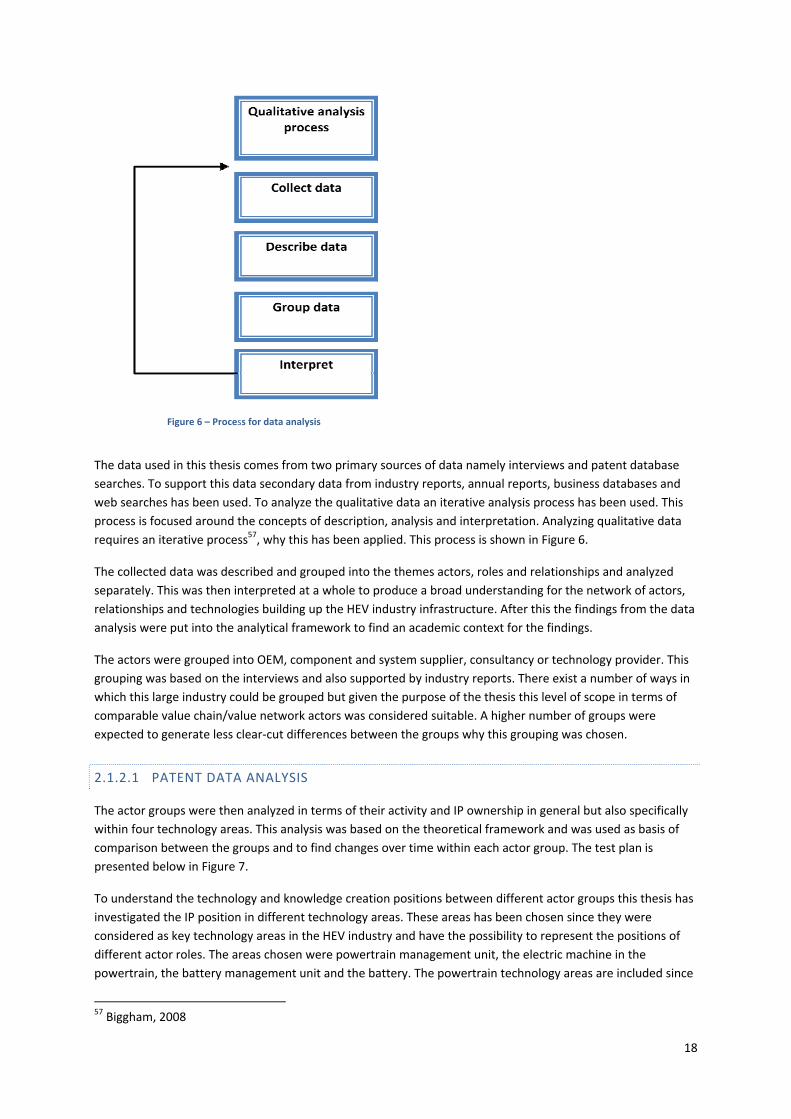
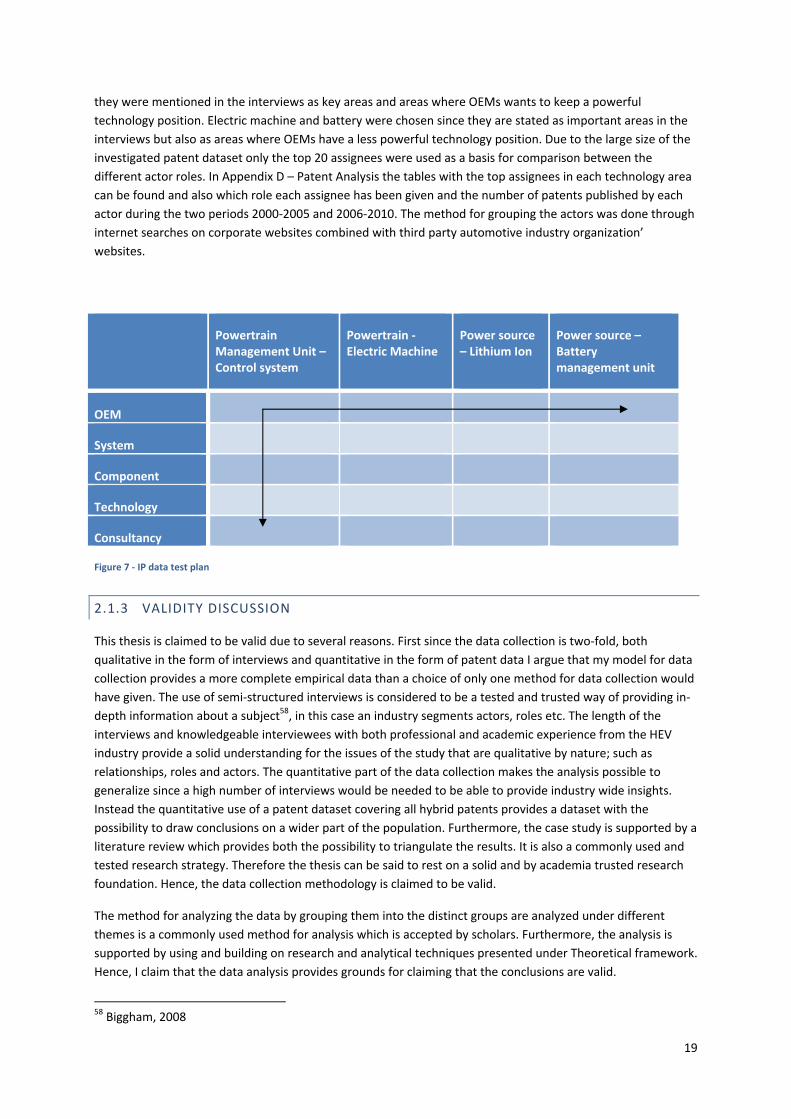
The actor groups were then analyzed in terms of their activity and IP ownership in general but also specifically
within four technology areas. This analysis was based on the theoretical framework and was used as basis of
comparison between the groups and to find changes over time within each actor group. The test plan is
presented below in Figure 7.
To understand the technology and knowledge creation positions between different actor groups this thesis has
investigated the IP position in different technology areas. These areas has been chosen since they were
considered as key technology areas in the HEV industry and have the possibility to represent the positions of
different actor roles. The areas chosen were powertrain management unit, the electric machine in the
powertrain, the battery management unit and the battery. The powertrain technology areas are included since
57 Biggham, 2008
Figure 6 – Process for data analysis
19
they were mentioned in the interviews as key areas and areas where OEMs wants to keep a powerful
technology position. Electric machine and battery were chosen since they are stated as important areas in the
interviews but also as areas where OEMs have a less powerful technology position. Due to the large size of the
investigated patent dataset only the top 20 assignees were used as a basis for comparison between the
different actor roles. In Appendix D – Patent Analysis the tables with the top assignees in each technology area
can be found and also which role each assignee has been given and the number of patents published by each
actor during the two periods 2000‐2005 and 2006‐2010. The method for grouping the actors was done through
internet searches on corporate websites combined with third party automotive industry organization’
websites.
Powertrain Management Unit – Control system
Powertrain ‐ Electric Machine
Power source – Lithium Ion
Power source – Battery management unit
OEM
System
Component
Technology
Consultancy
Figure 7 ‐ IP data test plan
2.1.3 VALIDITY DISCUSSION
This thesis is claimed to be valid due to several reasons. First since the data collection is two‐fold, both
qualitative in the form of interviews and quantitative in the form of patent data I argue that my model for data
collection provides a more complete empirical data than a choice of only one method for data collection would
have given. The use of semi‐structured interviews is considered to be a tested and trusted way of providing in‐
depth information about a subject58, in this case an industry segments actors, roles etc. The length of the
interviews and knowledgeable interviewees with both professional and academic experience from the HEV
industry provide a solid understanding for the issues of the study that are qualitative by nature; such as
relationships, roles and actors. The quantitative part of the data collection makes the analysis possible to
generalize since a high number of interviews would be needed to be able to provide industry wide insights.
Instead the quantitative use of a patent dataset covering all hybrid patents provides a dataset with the
possibility to draw conclusions on a wider part of the population. Furthermore, the case study is supported by a
literature review which provides both the possibility to triangulate the results. It is also a commonly used and
tested research strategy. Therefore the thesis can be said to rest on a solid and by academia trusted research
foundation. Hence, the data collection methodology is claimed to be valid.
The method for analyzing the data by grouping them into the distinct groups are analyzed under different
themes is a commonly used method for analysis which is accepted by scholars. Furthermore, the analysis is
supported by using and building on research and analytical techniques presented under Theoretical framework.
Hence, I claim that the data analysis provides grounds for claiming that the conclusions are valid.
58 Biggham, 2008
20
2.1.4 LIMITATIONS
In order to set a suitable scope in relation to the time at hand and thereby be able to put more efforts into
specific parts of the thesis the research area has been limited to not include all aspects of the automotive
industry and the HEV industry segment. First of all, this thesis focuses on the business‐to‐business aspects of
the industry and uses a technology development and deployment perspective solely and leaves market
performance, sales etc to a large extent untouched. The underlying reason is that looking into this would be a
step away from reaching the answers to the research questions which focus on technologies and actors
without considering sales and financial performance to a large extent. Therefore, markets aspects have been
limited to provide room for a deeper and more insightful analysis in the other areas covered by the thesis. The
thesis also limit the area of research to a fewer number of technology areas due to the same reason as earlier,
ability to focus on the research areas deemed to have highest importance. Nonetheless, the chosen technology
areas were chosen in conjunction with and confirmed by researchers active in the area of hybrid electric
vehicles. Therefore the chosen level of detail in the technology areas is considered to be sufficient.
A limitation was also made in terms of areas where patent data is used. Since the thesis focuses on the
relational aspect of technology and tries to measure the impact of technology a deep‐dive into the network of
technology actors in the HEV industry was made by analyzing the patent landscape. The starting point was to
investigate which actors and actor roles that hold the most powerful and widely used technologies. Once again,
to provide a subset of comparable variables providing valuable information the actor groups and the
technology areas needed to be limited to the once with highest importance. A few areas of interest was chosen
based on information from the interviews and the literature study and the basis for choosing the areas was if
the technology area was “new” to the industry and the relative importance of that technology area. This was
an iterative process with some elements of trial an error and the use of supporting information gained in the
interviews to find a scope where the quantitative data was focused enough to provide results showing
differences or similarities between the chosen groups of actors and technologies.
The research questions are to a large extent focusing on industry wide issues why different actors, relationships
and roles are not singled out and examined but rather grouped and compared on a more aggregate level. To
stay focused on the research questions at hand and to be able to find similarities or differences between larger
groups this choice was made, but the author do recognize that looking in to specific relationships is an
interesting field of research which could be interesting areas for future research.
An assumption that is made throughout the thesis is that patent information can be used as an indicator for
knowledge and technology creation. This is a far too simple version of the world but when patent data it is used
as a measure of comparison between groups containing several actors, patent data can be used as a proxy for
technology creation e.g. in cases such as the one applied in this thesis but several factors affect the quality of
the patent information and its usefulness59. Furthermore, Carpenter and Narin (1981) argue that important
innovations are more likely to be highly cited60.
The thesis uses non probabilistic sampling of the interview in a case study which could form a problem of
skewed or misguiding data. However, the data was not used for generalization but rather as a foundation for
the quantitative research. As argued by Malterud (2001), a qualitative approach is used to investigate the
meaning of social phenomena as they are experienced by individuals themselves in a natural context61. This
experience was later supported by more quantitative measures. The non‐probability problem is therefore
reduced and accounted for giving the thesis grounds for generalizability.
59 Basberg, 1987 60 Carpenter and Narin, 1981 61 Malterud, 2001
21
3 THEORETICAL FRAMEWORK
This section will provide an overview of the theoretical concepts used as foundation for the analysis and
conclusions of this thesis. Taking a starting point in the introduction this thesis will investigate concepts of
technology sourcing and technology exploitation using and aggregated view considering a whole chain or
network of actors. The focus is to look at theories of how firms in different levels of the value chain interact in
terms of knowledge and technology, the significance of integrated or disintegrated technology functions, the
structure of how they interact in a value network and how this evolves over time.
3.1 THE VALUE CHAIN
To analyze the transactions of intellectual capital in an industry characterized by knowledge transaction we
need to place both actors and transactions into context. Since, as previously stated, knowledge become capital
first when it is perceived as transactable the context for transaction is as important as the object transacted. As
stated above, outsourcing and relationships that allow companies to operate blur the concept of the value
chain. Therefore there exists a need to understand the concept of the value chain to be able to understand the
change it will undergo in a transition to the knowledge economy and thereby understand the context in which
intellectual capital is transacted.
The concept of value chain analysis was introduced by Michael Porter62 as a strategic management tool to
analyze industries. The term value chain can be defined as a linked chain of activities (the value chain) that
creates value63 or more specifically the sequential and productive actions that generate and support the end
usage64 of a product or service. The value chain concept has over the course of strategic management
consisted of creating strategies for controlling the value chain and has been a useful tool for analyzing first and
foremost manufacturing industries65. As industries and economies are evolving to become less focused of
physical products the material value chains as it was introduced becomes insufficient for analyzing and
understanding industries and value creation66.
The value chain is built around the end product and the logic and consecutive order in which it is performed.
The value chain encompasses all the activities from raw material to end product and that every company holds
a position within the value chain. Upstream actors provide input for the closest downstream activity and actor
in the chain who in turn pass it forward until it reaches the customer67. In strategic management the value
chain has been used to analyze the competitive landscape and find gaps where a firm could take action to close
the gaps. This can be considered very valuable when considering the material value chain and manufacturing
firms but can prove to be less valuable when the industry is not focusing on manufacturing industries68. When
considering a system with products and services characterized by being to some extent intangible (blurred) and
the value chain itself lose its physical dimension the value chain approach becomes obsolete as a tool for
uncovering value and value creation in industries69, industries characterized by the being part of the knowledge
economy.
The nature of the knowledge economy and the new business environment which appears alongside this new
economy calls for a reassessment of traditional methods for analyzing competitive environments. Linear
62 Porter, 1985 63 Peppard & Rylander, 2006 64 Sturgeon, 2001 65 Peppard & Rylander, 2006 66 Peppard & Rylander, 2006 67 Norman & Ramirez, 1994 68 Peppard & Rylander, 2006 69 Norman & Ramirez, 1994
22
models, including the value chain approach, does not explain the nature of alliances, competitors,
complementors and other members in business networks, and the collaborative environment in many
industries70.
3.2 THE VALUE NETWORK
In order to understand how value is created, sourced and exploited in the knowledge economy we must
recognize that value is created in relationships between actors. Understanding these relationships is the
shorthand to understanding how value is created in the network71 of interrelated relationships. Value creation
must be viewed as a product of its context and the individual actors’ ability to extract value must be analyzed
on the basis of her ability to create value in the value network72. Understanding the competitive environment
can to a large extent be reduced to understanding the underlying network of relations73. A value network is
constantly evolving and this change is driven by the actors in the network. Therefore all aspects of the network
have an impact on the analysis of the value network, including customers, competitors, allies, regulators etc74.
When observing the chain of actions leading to the production and usage of a product aforementioned as the
value chain is called value chain analysis, which in essence means analyzing and mapping vertical and
sequential activities of delivery, production, maintenance to mention a few75. A contrasting way of observing
the value‐adding activities performed to generate a product or service is to observe the value creating system
itself. In this system: suppliers, customers, allies and partners jointly co‐produce value76. The network approach
emphasize on the infrastructure for and extent of inter‐firm relationships that connects firms to form economic
groups or economic networks77. From one perspective the logic for competition that was once among distinct
firms has now changed to become a battle between networks of interrelated actors. Leading positions and
competitive advantage becomes dependent on maintaining the health of the network, hence not only the own
firm but also the relationships and other actors participating in the value creating network78.
Value networks are constructed from nodes and linkages connecting the value creating network. Firms in the
network are independent, otherwise they would be considered to be in a lose state of vertical integration. The
nodes in the value network are autonomous and independent actors that function under a common set of
rules in a common infrastructure79. Inter‐firm relationships play an important role in strategic performance and
in industry evolution80. Madhavan et al. (1998) argue that inter‐firm networks evolve as responses to events in
said industry causing the industry structures to become reinforced or loosened. One can also argue that these
events can be identified in advance and that managers are able to act on based on these assumptions on
structure reinforcing or loosening events by improving the individual position in the firm81. The theories of
transaction cost provide a framework for understanding why transformations occur in an industry. This is based
on two options for a firm to organize its activities, internal hierarchical structures that integrate activities or in
market relationships with external firms82. The information era and the knowledge economy have brought a
70 Peppard & Rylander, 2006 71 Blankenburg Holm & Eriksson & Johansson, 1999 72 Blankenburg Holm & Eriksson & Johansson, 1999 73 Rylander & Peppard, 2006 74 Rylander & Peppard, 2006 75 Sturgeon, 2001 76 Rylander & Peppard, 2006 77 Sturgeon, 2001. 78 Rylander & Peppard, 2006 79 Rylander & Peppard, 2006 80 Madhavan et al., 1998 81 Madhavan et al., 1998 82 Willianson, 1985
23
significant cost structure change reducing both inter and intra firm transaction costs83. Traditional positive
effects of integrated firms due to transaction cost reductions are therefore lowered. Evidence of this lowering
can be seen across several industries84.
3.3 KNOWLEDGE SOURCING
Internally controllable activities are hierarchically or contractually controlled and relates closely to the strategy
of the firm. The resources are used to provide customers with value while still having a competitive advantage
over competition through the in‐house control over the assets. Further resources can be obtained by means of
exchange with the environment85. The absorptive capacity of a firm is described as the ability to identify and
assimilate knowledge from external sources and the ability to commercially exploit this knowledge86. To be
able to understand the foundation of firm boundaries and how this relates the ability to exploit knowledge I
will investigate the concepts of integration and disintegration and relate them to the knowledge that can be
claimed by an individual actor.
Vertical integration is often analyzed from a market foreclosure perspective to see to which extent joint
ownership of upstream or downstream functions hinder goods from market exposure by creating internal
markets and taking away the means for actors on the market to meet (connect). Typically this will produce a
higher concentration of actors which in turn is expected to raise prices87. Nevertheless, under some specific
market characteristics, vertical integration can have the opposite effect and put a downward pressure on
prices88.
In an example from the semiconductor industry including several companies the internal knowledge flow and
human capital dependent information flows within the firm is used as an example of why and when vertical
integration support innovation89. Information and knowledge sharing within the firm boundaries will become
streamlined and the implementation of new technologies will be facilitated when complex and interdependent
stages in the development process are vertically integrated90. Furthermore, when innovations are systemic and
firms hold critical capabilities in‐house, sourcing from outside the firm can make it loose its edge and
leadership in the longer term. The firm should therefore source less critical knowledge from outside the firm
but source critical parts of the value chain in‐house91. Later management literature although put higher focus
on the sourcing of knowledge outside the firm and less focus on owning critical parts of the value chain when
technology is said to be disruptive rather than incremental92.
The relation between vertical integration and performance remains both inconclusive and unpredictable93 and
studies has historically focused on economic and financial performance94. Li & Tang (2010) focus on the
importance of sourcing knowledge from outside the boundaries of the firm to sustain the innovative capability
of a firm. It is recognized that vertical integration is likely to affect the returns on R&D which is stated to
determine the absorptive capacity95 of a firm. The absorptive capacity will in turn influence the external
83 Rylander & Peppard, 2006 84 Rylander & Peppard, 2006 85 Håkansson & Snehota, 2006 86 Cohen and Levinthal, 1990 87 Bunn, 2010 88 Bunn, 2010 89 Monteverde, 1995 90 Monteverde, 1995 91 Chesbrough & Teece, 1996 92 Chesbrough, 2006 93 Li & Tang, 2010 94 Li & Tang, 2010 95 Cohen & Levinthal, 1990
24
knowledge sourcing96. In the same study by Li & Tang (2010) it is found that vertical integration at an early and
limited stage can have positive effects on innovative performance but that the effects will turn negative as the
level of vertical integration increase. Hence, external knowledge sourcing is to some extent dependent on the
level of vertical integration, at least in its effectiveness97.
It seems evident that vertical integration has a twofold effect on innovation and the knowledge base of a firm
since it improves the internal information and knowledge transfer98. At the same time vertical integration is
shown to have the impact that it can render a firm with a less flexible organization that reduce the
innovativeness and competitiveness of the firm. This is explained as stemming from the new entrants ability to
transfer capabilities from one sector to another.99
Vertical integration might not give conclusive answers to technology output in terms of commercial products or
offerings but R&D contracts and licenses could be seen as representing the upstream knowledge (base) that a
firm needs to have access to in order to be competitive in downstream activities100. The pace of technological
change and the risk inherent in R&D investments put firms in a position where they have to rely on external
linkages for knowledge sourcing. Knowledge and information from outside the boundaries of the firm has
become more important as R&D becomes multidisciplinary and innovation is to a larger extent derived from a
network of actors interacting on different levels101,102. The effect of this external sourcing of knowledge is found
to have largest effect when the firm possesses an internal R&D infrastructure103. The need for an internal
infrastructure and external linkages suggest that both internal and external factors affect a firms potential for
external knowledge sourcing. When an industry is facing a change in technological base, technology sourcing
(internal and external R&D) is detrimental to generating capabilities for technology output104. Upstream actors
entering with radical innovations and downstream actors with a large set of complementary business assets
enter a symbiotic relationship where scientific research and downstream assets are utilized through alliances
such as joint ventures and license agreements. It is suggested that new entrants focus on upstream activities
whereas incumbents focus on downstream activities105.
Technology sourcing, or the wider notion of knowledge sourcing used in this paper, refers to a firm’s ability to
generate new technological capabilities from a multidimensional subset of sources. These sources can be both
internal; in‐house R&D and external technology sources (linkages or alliances) such as; R&D contracts, licenses,
joint ventures, minority equity investments and acquisitions106. The success in this external technology sourcing
partnerships is depending on the technology being pursued, the degree of technical change in the industry and
uncertainty in the external environment107.
The external availability of knowledge affects the ability and incentives for a firm to innovate108. One could
therefore argue that the knowledge pool of an industry will determine the incentives for the actors in the
industry to innovate. This should mean that an industry characterized by knowledge‐based business is
dependent on the available knowledge pool. Further supporting arguments is that the frequency and density of
96 Li & Tang, 2010 97 Li & Tang, 2010 98 Li & Tang, 2010 99 Li & Tang, 2010 100 Nicholls‐Nixon & Woo, 2003 101 Veugelers, 1997 102 Nicholls‐Nixon & Woo, 2003 103 Veugelers, 1997 104 Nicholls‐Nixon & Woo, 2003 105 Hill & Rothaermel, 2003 106 Nicholls‐Nixon & Woo, 2003 107 Nicholls‐Nixon & Woo, 2003 108 Caloghirou et al., 2004
25
interactions together with knowledge openness are detrimental for the generation, utilization and distribution
of knowledge109.
3.4 VERTICAL SCOPE
When analysis locus is lifted from firm level to industry level, vertical specialization must be view in the context
of the value chain. When taking this perspective vertical specialization becomes a function of the diversity of
productive capabilities in the value chain. This in turn will affect the vertical scope of the industry. Vertical
scope is the accumulation of knowledge bases in an industry. When this heterogeneity of capabilities appear in
an industry this generates a process which promote vertical disintegration. The disintegration will change the
industry capability pool and actor composition in the industry and drive the capability development and vertical
scope of the industry110. Thus, going from being an integrated industry to a disintegrated industry will change
the nature of the industry and the structure of the capabilities needed to compete111. Hence, integration and
disintegration to some extent is a selection process where the fittest will survive and earn market share,
market growth and profits112.
When the vertical scope of an industry is changed it has the potential of altering the pool of actors and the set
of relevant knowledge bases. When actors become more specialized and the industry is divided into pieces
some activities performed will closely resemble or be closely linked to activities performed by actors in other
industry sectors. Learning from this we can see that specialization can be linked to opportunities for new
entrants113 and that the specialization could further lead to a networked firm and industry. The boundaries of
the industry should therefore be viewed as set by the knowledge accumulation processes of all firms in an
industry114.
Industries will also in some cases have incentives to vertically integrate when new knowledge or actors have
entered the industry. The integrated firm will in these cases be in a better control position. In the case of
telecommunications the ability to develop and deploy new technologies is argued to relate to the control an
actor exercise over the value chain115. It is in this case the most vertically integrated firm that holds the best
position to develop interdependent technological architectures116. In general this type of benefits could be
found in manufacturing industries where single actors have the ability to provide “the total solution”117.
3.5 THE VALUE NETWORK FROM AN INFRASTRUCTURE PERSPECTIVE
If the industry vertical scope will change in a transition from an industrial economy to a knowledge economy
and we are to understand this transition we need a framework that can guide the analysis. The value network
and consequent relationships in the value network of an industry could provide the insights this thesis is
searching for. Relationships with external actors provide access to key resources. The structure of these
relationships describes and controls the access to raw material, information, key technologies, markets etc.
Hence, the network structures provide the infrastructure for competitive action118.
109 Caloghirou et al., 2004 110 Jacobides & Winter, 2005 111 Jacobides & Winter, 2005 112 Malerba et al., 2008 113 Jacobides & Winter, 2005 114 Jacobides &Winter, 2005 115 Raynor & Christiansen, 2002 116 Raynor & Christiansen, 2002 117 Jacobides & Winter, 2005 118 Madhavan et al., 1998
26
The principles of the value network forms the structural order actors in the value network must conform to in
order to extract value119. Drawing parallels to the notion of vertical scope and evolution of the knowledge base
in an industry one could argue that the entrance of new firms with new knowledge bases is an entrepreneurial
activity. This entrepreneurial activity can to some extent than be seen as a way to be disloyal to the set
structures of the industry and it is the entrepreneur and entrepreneurial firm that has the capability to either
or both be disloyal to the structure in the value network or absorb and accept the disloyalty from new entrants,
i.e. new nodes in the value network.
The network infrastructure manages and controls the access to key resources of a specific firm. As a
consequence it is the infrastructure that enhances or constrains the ability each firm in the networks ability to
shape the industry roadmap. An actor that is disconnected to the network will lack timely information about
and knowledge input to mandate decisions with industry wide implications120. One cannot build an efficient
network without the ability to attract the right partners or allies. Alliance activity is also shown to have a
positive effect on innovative performance. A large change in this infrastructure, a structural change, would be
characterized by a significant change in the pattern of relationships in the network between the subset of
actors121.
Stemming from the theories of networks this thesis chooses to deconstruct the value network infrastructure
into three distinct parts, centrality, centralization and interblock relations. Network centrality at a conceptual
level represents the significance of an individual firm. The significance in turn is a measure of the number of
relations with other firms in the network. Hence, a central firm has a high number of network relations and
connections122.
The accumulated firm centralities together represent the centralization of a network. Centrality can be said to
represent the significance of a firm and centralization represent the network level concentration of central
firms. This network level measure indicates whether a given firm in the midst of the network is likely to be
more central than other firms in the network. A centralized network is characterized in that it hold a few very
central firms and that the main bulk of actors are peripheral. The centralization measure provides indications of
the distribution of centrality in the network. In order to assess structural change in a network the centralization
before and after an event can be used123.
Centrality and centralization help establish an understanding for the relational patterns between individual
actors. By analyzing groups of firms we are able to analyze general patterns and relational types between
different groups of firms, defined as interblock relations. To support this analysis, groups of firms can be
divided into blocks based on three criteria; structural equivalence; general equivalence and contextual
equivalence. Structural equivalence and general equivalence are built from analyzing the relational patterns in
the network to construct groups that are discrete enough to analyze. Contextual equivalence uses similarity
between the attributes of a number of firms to group them into blocks124. This thesis sets out to analyze the
development in the relations between different actors and actor groups in an industry (value network).
Contextual equivalence provides a tool for keeping the interblocks constant and analyzing the change in
relations and relational types over time. The blocks of actors in this thesis are chosen on their attributes as a
technology provider in the value network and are used as basis for the analysis. This approach provides a
119 Petrusson, 2004 120 Madhavan et al., 1998 121 Madhavan et al., 1998 122 Madhavan et al., 1998 123 Madhavan et al., 1998 124 Barley, 1986
27
meaningful and constant difference between groups or blocks of actors while observing the relational
differences and changes over time125.
In a short comparison with the initial discussion on the blurring of marketing concepts we can see that this
concrete choice of infrastructure building blocks, that can be said to be somewhat more constant in both the
intra and inter actor relations in the value network, we get a tool for analyzing an industry from a knowledge
economy perspective. This is done through recognizing actor roles as tightly linked to technology and to group
these actors with similar technology roles into interblock groups that are contextually similar.
3.6 THE ENTREPRENEURIAL CHANGE OF THE VALUE NETWORK INFRASTRUCTURE
Restructuring in an industry occurs when actors face exogenous chock126. Early adopters as opposed to late
adopters of technology are more likely to increase their centrality in the network127. Madhavan et. Al (1998)
proposes that it is key industry events that provide this exogenous chock that ignites a restructuring of a value
network of e.g. technology actors. The events change the industry wide basis for competition and could include
the introduction of new technology, new competitors or competitive, regulatory changes, shifts in consumer
preferences or other efforts defined as entrepreneurial activities in this thesis128. Entrepreneurial activities
center on the creation of structures, including the value network structures, by the entrepreneur129, the
exploitation of these structures130,131 and how these structures relate to environment132. In other words, the
structures and the environment form the source of opportunities and the process for discovering, evaluating
and exploiting opportunities133.
Some industry events provide opportunities or challenges for an actor to improve or change her position in the
network134. Hence, there exists a need for firm level entrepreneurship to be able to discover, evaluate and
exploit this opportunity or challenge. The opportunities or challenges in the events could stem from
fundamental regulatory changes or the introduction of a disruptive innovation135 that reshape the basis for
competition. This will in turn have substantial impact on the value network of relations in the industry and put
pressure on actors to access new resources from a new set of actors. To access the new set of resources actors
will join forces with new actors/partners setting up new relationships. Consequently, some industry events
have the potential to fundamentally alter the network structure136.
If or when a structure changing event has occurred the question becomes what effect it will have on the
network. Two tools available are to categorize the change as structure reinforcing or structure loosening. A
structure reinforcing event would render in a network where already powerful firms become more powerful
and less powerful firms are reduced in power. This would translate into a higher centralization of the value
network strengthening the existing distribution of power. If on the contrary the event has a structure loosening
effect on the network structure, the previously powerful firms are reduced in power and centrality as opposed
to the less powerful actors the increase in power and centrality, reducing the centralization of the network. The
125 Madhavan et al., 1998 126 Barley, 1986 127 Burkhardt & Brass, 1990 128 Madhavan et al., 1998 129 Petrusson, 2004 130 Gartner, 2001 131 Shane, 2000 132 Gartner, 2001 133 Shane, 2000 134 Madhavan et al., 1998 135 Christiansen, 1997 136 Madhavan et al., 1998

28
direction of change in the network is dependent on if the network power is reinforced or loosened by
centralizing or decentralizing the power in the network137.
To be able to predict the direction of change one can analyze the event or occurrence that is expected to drive
the structural change and through this analysis predict the structural change. Structure reinforcing events reify
the present structure in the network by fortifying industry trajectories in general and in our case technology
trajectories. This fortification will naturally benefit previously set key actors and key technologies and are
therefore also likely to have been initiated by industry key actors. However, structure loosening events
function much in the opposite way. They initiate changes in previously set structures and relationships since
they are likely to be disruptive to the norm structure of the industry. This type of event would benefit
peripheral actors and provide an opportunity for them to improve their position in the network. Hence, this
event is less likely to be initiated by actors with high network centrality138. Thus, predicting an event and
analyzing its implication can provide information that enables an actor to initiate the managerial activities
needed to improve its position in the network.
3.7 THEORETICAL FRAMEWORK DISCUSSION
In the Introduction To the thesis the knowledge economy is described as an economy where knowledge plays
the key role for the success of firms. Furthermore, indicators of large‐scale cooperative production of
knowledge and the convergence of industries are mentioned as effects of the transition to the knowledge
economy. The theoretical framework provided above aims at finding a way of guiding the analysis of a network
and industry in transition. My conclusions from the theoretical framework is that the change in the structure,
symbolized by the change in the value network, is driven by technology and actors reshaping the vertical scope
of an industry by integration or specialization in terms of technology.
The value chain and value network provides a framework for analyzing the production of knowledge, although
these tools might not provide a complete picture. This is related to the strategy of integration or specialization
of a firm and the ability to source knowledge form both inside and outside the firm. The theories presented in
this chapter suggest that an industry knowledge base is built up by the network of actors in that industry and
that the development and evolution of the vertical scope is technology and actor driven by entrepreneurial
efforts. This entrepreneurial effort could then potentially also change the structure of the network, a structure
built up by actors and relationships, in this thesis grouped into groups of actor types and how the groups relate
to other groups. The final part of the theoretical framework provides a framework and vocabulary for
investigating the effects on the value network.
The introductory chapter provides some insights of an industry in transition, where manufacturing capabilities
of the industrial economy are gradually mixed with demands for knowledge sourcing and production
capabilities of the knowledge economy. Leaning on the presented theory I will set out to find the effects on an
infrastructural level of the HEV industry. The starting point will be to map the knowledge base by presenting a
technology tree of the HEV industry. This will be followed by identifying the value chain of processes and actors
in the industry. To be able to build a value network I will investigate what actor types, roles and relationships
that exist and group them into “contextually equivalent139” groups. To finalize and answer the questions of the
effect of new technologies will have on the industry infrastructure I will look at changes in IPR position
between different actor groups holding different positions in the value chain.
137 Madhavan et al., 1998 138 Madhavan et al., 1998 139 Barley, 1986
29
4 FINDING THE KNOWLEDGE BASE – A TECHNOLOGY TREE
In this chapter the hybrid electric vehicle and knowledge base of the HEV industry will be presented using a
technology tree and a short description of key technology areas of the HEV. This will form a foundation for the
analysis of the technology position held by different actors groups and also provide a framework for analyzing
what phase of integration or disintegration the industry is in depending on technology area. This chapter will
also contribute to finding which technology areas that are new to the automotive industry.
4.1 TECHNOLOGY DEVELOPMENT IN ELECTRIC HYBRID VEHICLES
In an internal combustion engine sudden accelerations or increases in load causes rapid increases of fuel
consumption and emissions due to an increased injection of fuel when the engine tries to accelerate as a
response to the change in load. When breaking an internal combustion engine has limited possibilities for
recovering some of the energy spent when acceleration and most energy will be lost140. Hence, there exists a
problem of energy utilization.
In a hybrid electric vehicle (HEV) alteration or combination of the power source used for traction between a
traditional internal combustion engine (ICE), based on fuel, and an electric power source can even out the load
peaks in the combustion engine. By using the electric motor or a combination of the electric motor and the ICE
load peaks with high fuel consumption and emissions can be reduced. The battery also enables regeneration of
braking energy. The main drawback with the HEV is the increased costs due to the increase in complexity level
that it incurs to the drive train and energy supply141.
The electric ICE hybrid engine is in general built up from two main parts, the ICE and the electrical machine. The
electrical engine evens out the load on the ICE to produce higher efficiency and lower emissions. HEVs can
often be differentiated by how the different parts of the hybrid engine are organized and by what percentage
of power is provided by each part. The two main categories of HEVs are series hybrids and parallel hybrids142.
Technologies improving fuel consumption performance and emissions performance are measured how they
can improve the performance in relation to the International, United States, European or Japan driving cycles
(for cars). This means that improvements are measured in a way that creates design restraints since if the cycle
is not improved the technology in many cases is discarded. Another example is EURO NCAP for safety. If safety
initiatives are not affecting the EURO NCAP score they are not considered as having as high potential and
therefore have less probability of reaching the market. This will have implications since the driving cycles are
different depending on the vehicle type and the driving cycle therefore has to be kept in mind when
considering the technologies deployed and if technologies are transferrable between light weight and heavy
duty HEVs143.
4.1.1 THE HYBRID ENGINE
A conventional ICE uses diesel, gasoline or other fossil fuels as energy source and in the beginning the car
industry the electric vehicle was on par with the inefficient ICE engine. Due to the restraints put on the electric
vehicle in the form of battery technology and its effect on driving distance the ICE has been the dominant
design144.
140 Jonasson, 2005 141 Jonasson, 2005 142 Omonowo & Omoigui, 2009 143 Interview with Jonathan Rice, 2011‐03‐24 144 Omonowo & Omoigui, 2009
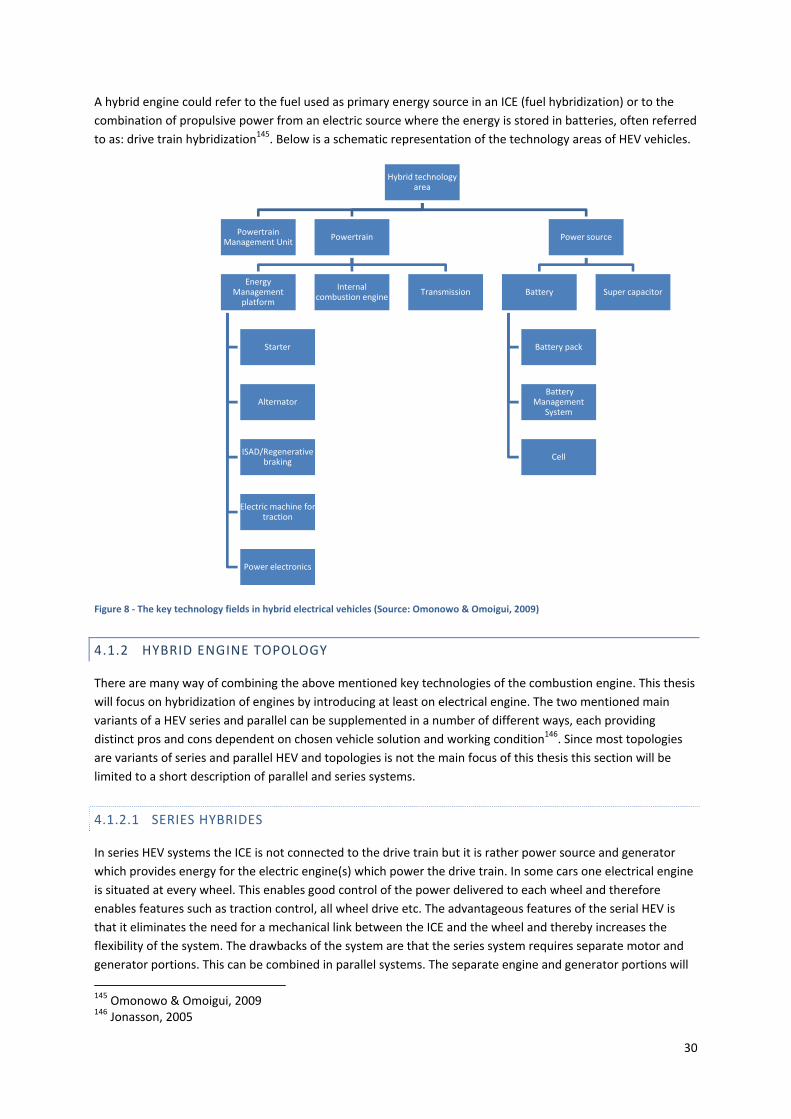
30
A hybrid engine could refer to the fuel used as primary energy source in an ICE (fuel hybridization) or to the
combination of propulsive power from an electric source where the energy is stored in batteries, often referred
to as: drive train hybridization145. Below is a schematic representation of the technology areas of HEV vehicles.
Figure 8 ‐ The key technology fields in hybrid electrical vehicles (Source: Omonowo & Omoigui, 2009)
4.1.2 HYBRID ENGINE TOPOLOGY
There are many way of combining the above mentioned key technologies of the combustion engine. This thesis
will focus on hybridization of engines by introducing at least on electrical engine. The two mentioned main
variants of a HEV series and parallel can be supplemented in a number of different ways, each providing
distinct pros and cons dependent on chosen vehicle solution and working condition146. Since most topologies
are variants of series and parallel HEV and topologies is not the main focus of this thesis this section will be
limited to a short description of parallel and series systems.
4.1.2.1 SERIES HYBRIDES
In series HEV systems the ICE is not connected to the drive train but it is rather power source and generator
which provides energy for the electric engine(s) which power the drive train. In some cars one electrical engine
is situated at every wheel. This enables good control of the power delivered to each wheel and therefore
enables features such as traction control, all wheel drive etc. The advantageous features of the serial HEV is
that it eliminates the need for a mechanical link between the ICE and the wheel and thereby increases the
flexibility of the system. The drawbacks of the system are that the series system requires separate motor and
generator portions. This can be combined in parallel systems. The separate engine and generator portions will
145 Omonowo & Omoigui, 2009 146 Jonasson, 2005
Hybrid technology area
Powertrain Management Unit
Powertrain
Energy Management platform
Starter
Alternator
ISAD/Regenerative braking
Electric machine for traction
Power electronics
Internal combustion engine
Transmission
Power source
Battery
Battery pack
Battery Management
System
Cell
Super capacitor
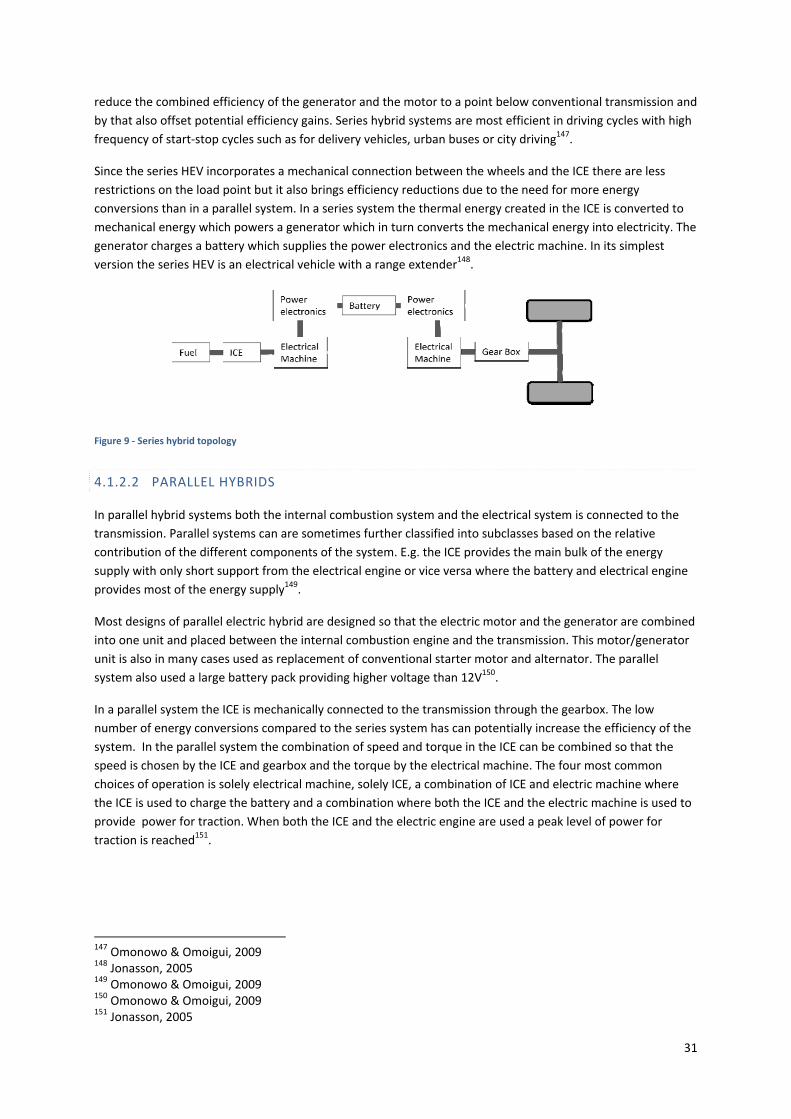
31
reduce the combined efficiency of the generator and the motor to a point below conventional transmission and
by that also offset potential efficiency gains. Series hybrid systems are most efficient in driving cycles with high
frequency of start‐stop cycles such as for delivery vehicles, urban buses or city driving147.
Since the series HEV incorporates a mechanical connection between the wheels and the ICE there are less
restrictions on the load point but it also brings efficiency reductions due to the need for more energy
conversions than in a parallel system. In a series system the thermal energy created in the ICE is converted to
mechanical energy which powers a generator which in turn converts the mechanical energy into electricity. The
generator charges a battery which supplies the power electronics and the electric machine. In its simplest
version the series HEV is an electrical vehicle with a range extender148.
Figure 9 ‐ Series hybrid topology
4.1.2.2 PARALLEL HYBRIDS
In parallel hybrid systems both the internal combustion system and the electrical system is connected to the
transmission. Parallel systems can are sometimes further classified into subclasses based on the relative
contribution of the different components of the system. E.g. the ICE provides the main bulk of the energy
supply with only short support from the electrical engine or vice versa where the battery and electrical engine
provides most of the energy supply149.
Most designs of parallel electric hybrid are designed so that the electric motor and the generator are combined
into one unit and placed between the internal combustion engine and the transmission. This motor/generator
unit is also in many cases used as replacement of conventional starter motor and alternator. The parallel
system also used a large battery pack providing higher voltage than 12V150.
In a parallel system the ICE is mechanically connected to the transmission through the gearbox. The low
number of energy conversions compared to the series system has can potentially increase the efficiency of the
system. In the parallel system the combination of speed and torque in the ICE can be combined so that the
speed is chosen by the ICE and gearbox and the torque by the electrical machine. The four most common
choices of operation is solely electrical machine, solely ICE, a combination of ICE and electric machine where
the ICE is used to charge the battery and a combination where both the ICE and the electric machine is used to
provide power for traction. When both the ICE and the electric engine are used a peak level of power for
traction is reached151.
147 Omonowo & Omoigui, 2009 148 Jonasson, 2005 149 Omonowo & Omoigui, 2009 150 Omonowo & Omoigui, 2009 151 Jonasson, 2005
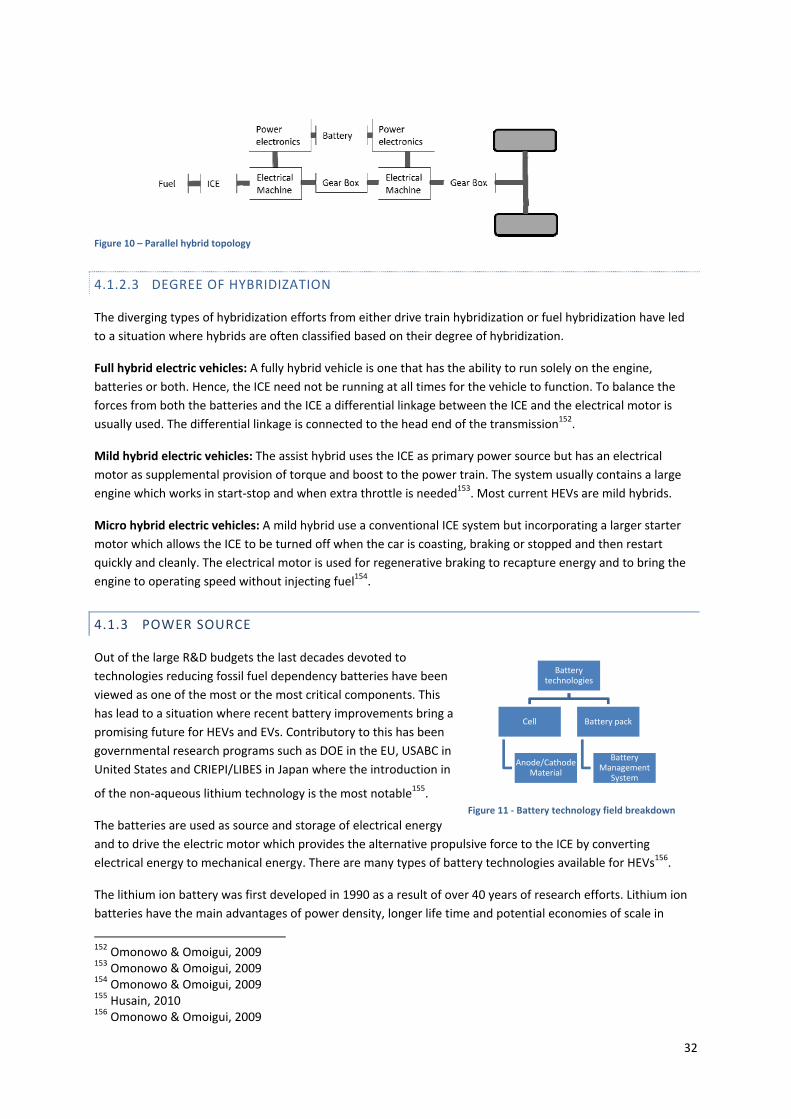
32
Battery technologies
Cell
Anode/Cathode Material
Battery pack
Battery Management
System
Figure 10 – Parallel hybrid topology
4.1.2.3 DEGREE OF HYBRIDIZATION
The diverging types of hybridization efforts from either drive train hybridization or fuel hybridization have led
to a situation where hybrids are often classified based on their degree of hybridization.
Full hybrid electric vehicles: A fully hybrid vehicle is one that has the ability to run solely on the engine,
batteries or both. Hence, the ICE need not be running at all times for the vehicle to function. To balance the
forces from both the batteries and the ICE a differential linkage between the ICE and the electrical motor is
usually used. The differential linkage is connected to the head end of the transmission152.
Mild hybrid electric vehicles: The assist hybrid uses the ICE as primary power source but has an electrical
motor as supplemental provision of torque and boost to the power train. The system usually contains a large
engine which works in start‐stop and when extra throttle is needed153. Most current HEVs are mild hybrids.
Micro hybrid electric vehicles: A mild hybrid use a conventional ICE system but incorporating a larger starter
motor which allows the ICE to be turned off when the car is coasting, braking or stopped and then restart
quickly and cleanly. The electrical motor is used for regenerative braking to recapture energy and to bring the
engine to operating speed without injecting fuel154.
4.1.3 POWER SOURCE
Out of the large R&D budgets the last decades devoted to
technologies reducing fossil fuel dependency batteries have been
viewed as one of the most or the most critical components. This
has lead to a situation where recent battery improvements bring a
promising future for HEVs and EVs. Contributory to this has been
governmental research programs such as DOE in the EU, USABC in
United States and CRIEPI/LIBES in Japan where the introduction in
of the non‐aqueous lithium technology is the most notable155.
The batteries are used as source and storage of electrical energy
and to drive the electric motor which provides the alternative propulsive force to the ICE by converting
electrical energy to mechanical energy. There are many types of battery technologies available for HEVs156.
The lithium ion battery was first developed in 1990 as a result of over 40 years of research efforts. Lithium ion
batteries have the main advantages of power density, longer life time and potential economies of scale in
152 Omonowo & Omoigui, 2009 153 Omonowo & Omoigui, 2009 154 Omonowo & Omoigui, 2009 155 Husain, 2010 156 Omonowo & Omoigui, 2009
Figure 11 ‐ Battery technology field breakdown
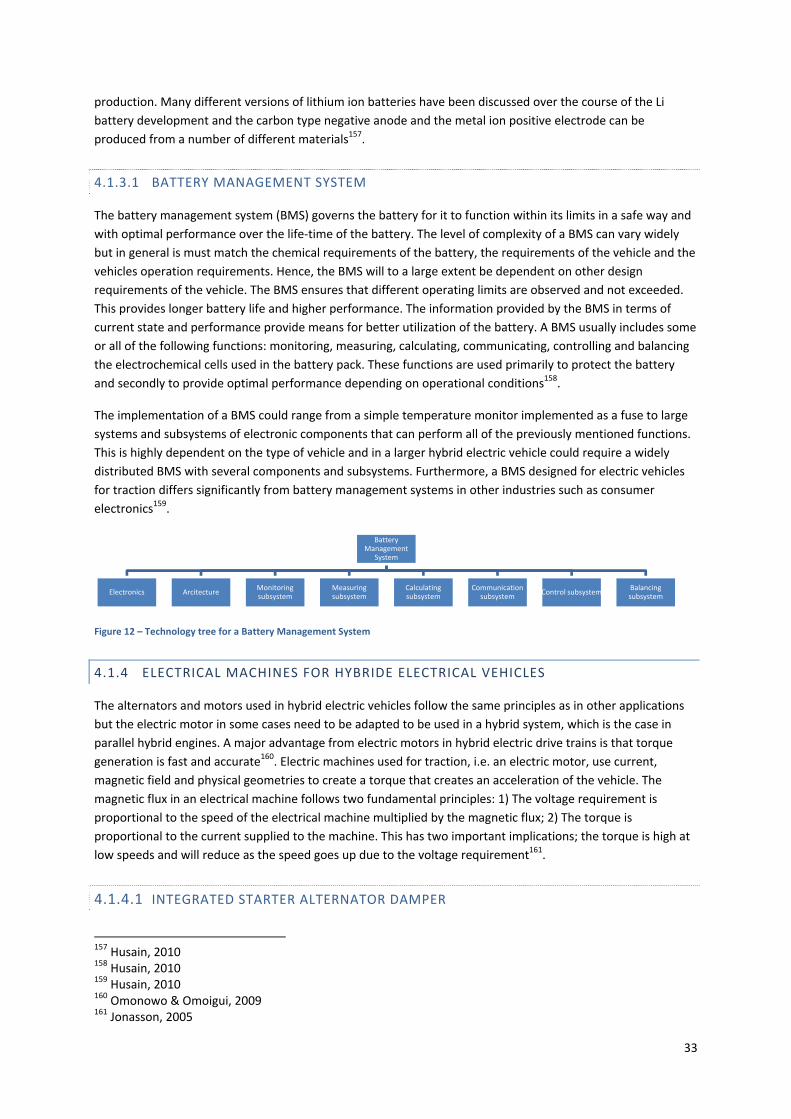
33
production. Many different versions of lithium ion batteries have been discussed over the course of the Li
battery development and the carbon type negative anode and the metal ion positive electrode can be
produced from a number of different materials157.
4.1.3.1 BATTERY MANAGEMENT SYSTEM
The battery management system (BMS) governs the battery for it to function within its limits in a safe way and
with optimal performance over the life‐time of the battery. The level of complexity of a BMS can vary widely
but in general is must match the chemical requirements of the battery, the requirements of the vehicle and the
vehicles operation requirements. Hence, the BMS will to a large extent be dependent on other design
requirements of the vehicle. The BMS ensures that different operating limits are observed and not exceeded.
This provides longer battery life and higher performance. The information provided by the BMS in terms of
current state and performance provide means for better utilization of the battery. A BMS usually includes some
or all of the following functions: monitoring, measuring, calculating, communicating, controlling and balancing
the electrochemical cells used in the battery pack. These functions are used primarily to protect the battery
and secondly to provide optimal performance depending on operational conditions158.
The implementation of a BMS could range from a simple temperature monitor implemented as a fuse to large
systems and subsystems of electronic components that can perform all of the previously mentioned functions.
This is highly dependent on the type of vehicle and in a larger hybrid electric vehicle could require a widely
distributed BMS with several components and subsystems. Furthermore, a BMS designed for electric vehicles
for traction differs significantly from battery management systems in other industries such as consumer
electronics159.
Figure 12 – Technology tree for a Battery Management System
4.1.4 ELECTRICAL MACHINES FOR HYBRIDE ELECTRICAL VEHICLES
The alternators and motors used in hybrid electric vehicles follow the same principles as in other applications
but the electric motor in some cases need to be adapted to be used in a hybrid system, which is the case in
parallel hybrid engines. A major advantage from electric motors in hybrid electric drive trains is that torque
generation is fast and accurate160. Electric machines used for traction, i.e. an electric motor, use current,
magnetic field and physical geometries to create a torque that creates an acceleration of the vehicle. The
magnetic flux in an electrical machine follows two fundamental principles: 1) The voltage requirement is
proportional to the speed of the electrical machine multiplied by the magnetic flux; 2) The torque is
proportional to the current supplied to the machine. This has two important implications; the torque is high at
low speeds and will reduce as the speed goes up due to the voltage requirement161.
4.1.4.1 INTEGRATED STARTER ALTERNATOR DAMPER
157 Husain, 2010 158 Husain, 2010 159 Husain, 2010 160 Omonowo & Omoigui, 2009 161 Jonasson, 2005
Battery Management
System
Electronics ArcitectureMonitoring subsystem
Measuring subsystem
Calculating subsystem
Communication subsystem
Control subsystemBalancing subsystem
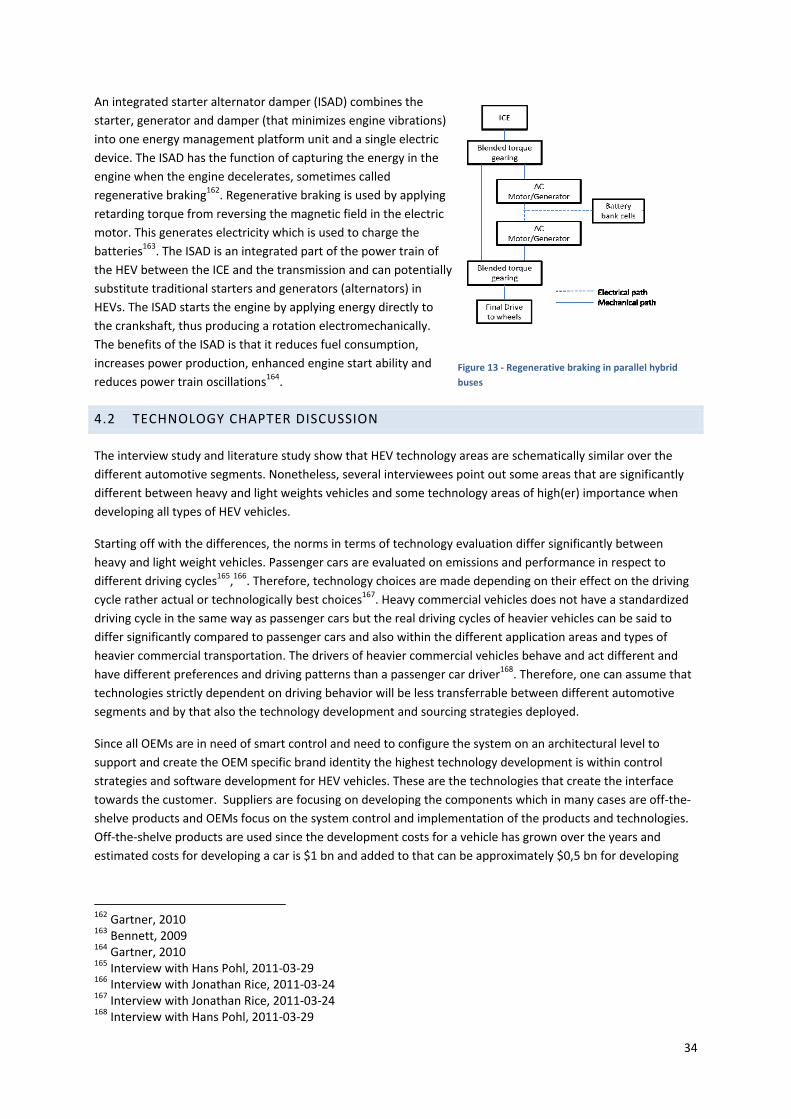
34
An integrated starter alternator damper (ISAD) combines the
starter, generator and damper (that minimizes engine vibrations)
into one energy management platform unit and a single electric
device. The ISAD has the function of capturing the energy in the
engine when the engine decelerates, sometimes called
regenerative braking162. Regenerative braking is used by applying
retarding torque from reversing the magnetic field in the electric
motor. This generates electricity which is used to charge the
batteries163. The ISAD is an integrated part of the power train of
the HEV between the ICE and the transmission and can potentially
substitute traditional starters and generators (alternators) in
HEVs. The ISAD starts the engine by applying energy directly to
the crankshaft, thus producing a rotation electromechanically.
The benefits of the ISAD is that it reduces fuel consumption,
increases power production, enhanced engine start ability and
reduces power train oscillations164.
4.2 TECHNOLOGY CHAPTER DISCUSSION
The interview study and literature study show that HEV technology areas are schematically similar over the
different automotive segments. Nonetheless, several interviewees point out some areas that are significantly
different between heavy and light weights vehicles and some technology areas of high(er) importance when
developing all types of HEV vehicles.
Starting off with the differences, the norms in terms of technology evaluation differ significantly between
heavy and light weight vehicles. Passenger cars are evaluated on emissions and performance in respect to
different driving cycles165,166. Therefore, technology choices are made depending on their effect on the driving
cycle rather actual or technologically best choices167. Heavy commercial vehicles does not have a standardized
driving cycle in the same way as passenger cars but the real driving cycles of heavier vehicles can be said to
differ significantly compared to passenger cars and also within the different application areas and types of
heavier commercial transportation. The drivers of heavier commercial vehicles behave and act different and
have different preferences and driving patterns than a passenger car driver168. Therefore, one can assume that
technologies strictly dependent on driving behavior will be less transferrable between different automotive
segments and by that also the technology development and sourcing strategies deployed.
Since all OEMs are in need of smart control and need to configure the system on an architectural level to
support and create the OEM specific brand identity the highest technology development is within control
strategies and software development for HEV vehicles. These are the technologies that create the interface
towards the customer. Suppliers are focusing on developing the components which in many cases are off‐the‐
shelve products and OEMs focus on the system control and implementation of the products and technologies.
Off‐the‐shelve products are used since the development costs for a vehicle has grown over the years and
estimated costs for developing a car is $1 bn and added to that can be approximately $0,5 bn for developing
162 Gartner, 2010 163 Bennett, 2009 164 Gartner, 2010 165 Interview with Hans Pohl, 2011‐03‐29 166 Interview with Jonathan Rice, 2011‐03‐24 167 Interview with Jonathan Rice, 2011‐03‐24 168 Interview with Hans Pohl, 2011‐03‐29
Figure 13 ‐ Regenerative braking in parallel hybrid
buses
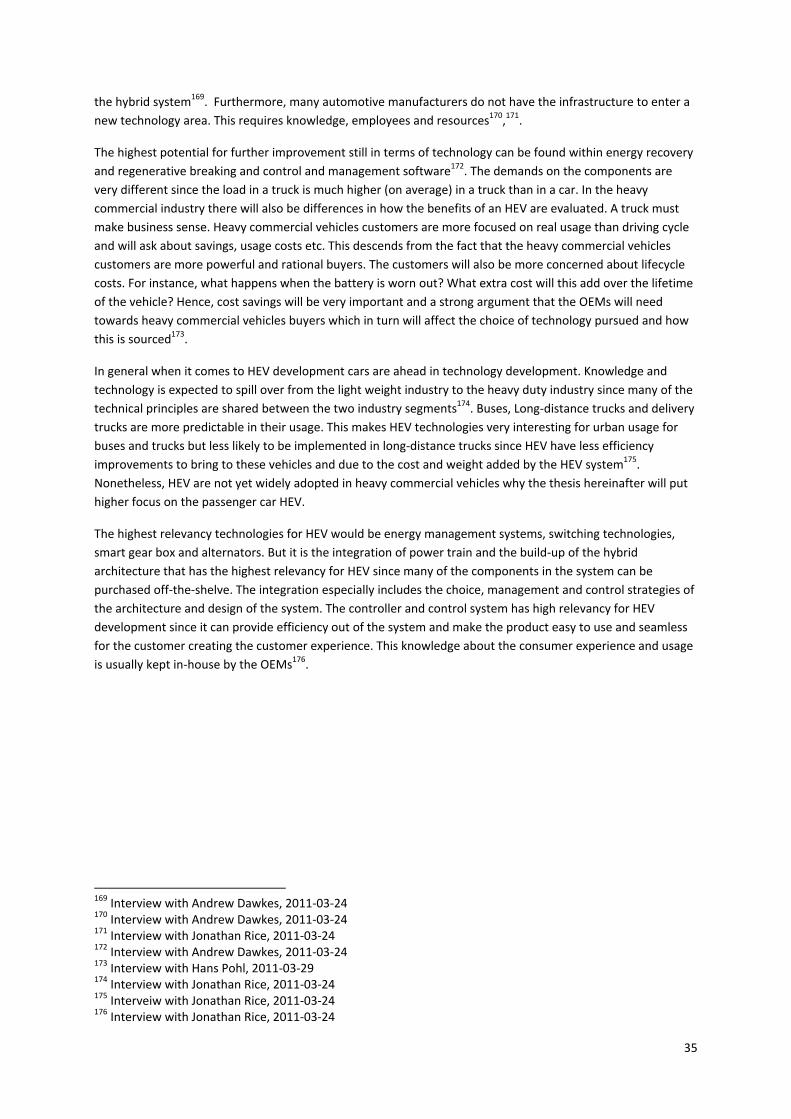
35
the hybrid system169. Furthermore, many automotive manufacturers do not have the infrastructure to enter a
new technology area. This requires knowledge, employees and resources170,171.
The highest potential for further improvement still in terms of technology can be found within energy recovery
and regenerative breaking and control and management software172. The demands on the components are
very different since the load in a truck is much higher (on average) in a truck than in a car. In the heavy
commercial industry there will also be differences in how the benefits of an HEV are evaluated. A truck must
make business sense. Heavy commercial vehicles customers are more focused on real usage than driving cycle
and will ask about savings, usage costs etc. This descends from the fact that the heavy commercial vehicles
customers are more powerful and rational buyers. The customers will also be more concerned about lifecycle
costs. For instance, what happens when the battery is worn out? What extra cost will this add over the lifetime
of the vehicle? Hence, cost savings will be very important and a strong argument that the OEMs will need
towards heavy commercial vehicles buyers which in turn will affect the choice of technology pursued and how
this is sourced173.
In general when it comes to HEV development cars are ahead in technology development. Knowledge and
technology is expected to spill over from the light weight industry to the heavy duty industry since many of the
technical principles are shared between the two industry segments174. Buses, Long‐distance trucks and delivery
trucks are more predictable in their usage. This makes HEV technologies very interesting for urban usage for
buses and trucks but less likely to be implemented in long‐distance trucks since HEV have less efficiency
improvements to bring to these vehicles and due to the cost and weight added by the HEV system175.
Nonetheless, HEV are not yet widely adopted in heavy commercial vehicles why the thesis hereinafter will put
higher focus on the passenger car HEV.
The highest relevancy technologies for HEV would be energy management systems, switching technologies,
smart gear box and alternators. But it is the integration of power train and the build‐up of the hybrid
architecture that has the highest relevancy for HEV since many of the components in the system can be
purchased off‐the‐shelve. The integration especially includes the choice, management and control strategies of
the architecture and design of the system. The controller and control system has high relevancy for HEV
development since it can provide efficiency out of the system and make the product easy to use and seamless
for the customer creating the customer experience. This knowledge about the consumer experience and usage
is usually kept in‐house by the OEMs176.
169 Interview with Andrew Dawkes, 2011‐03‐24 170 Interview with Andrew Dawkes, 2011‐03‐24 171 Interview with Jonathan Rice, 2011‐03‐24 172 Interview with Andrew Dawkes, 2011‐03‐24 173 Interview with Hans Pohl, 2011‐03‐29 174 Interview with Jonathan Rice, 2011‐03‐24 175 Interveiw with Jonathan Rice, 2011‐03‐24 176 Interview with Jonathan Rice, 2011‐03‐24
36
5 THE AUTOMOTIVE INDUSTRY
This chapter will investigate the HEV automotive industry in terms of actors, roles and relationships to be able
to group actors in terms of their role as technology provider. Once we have the groups of actors, their roles and
how they relate to other groups we can investigate the difference between the groups and how the groups have
evolved over time in terms of their position in the value network and the roles in the industry. This analysis will
be performed by looking at patent data in the end of this chapter.
‐‐‐‐‐‐‐‐‐‐‐‐‐‐‐‐‐‐‐‐‐‐‐‐‐‐‐‐‐‐‐‐‐‐‐‐‐‐‐‐‐‐‐‐‐‐‐‐‐‐‐‐‐‐‐‐‐‐‐‐‐‐‐‐‐‐‐‐‐‐‐‐‐‐‐‐‐‐‐‐‐‐‐‐‐‐‐‐‐‐‐‐‐‐‐‐‐‐‐‐‐‐‐‐‐‐‐‐‐‐‐‐‐‐‐‐‐‐‐‐‐‐‐‐‐‐‐‐‐‐‐‐‐‐‐‐‐‐‐‐‐‐‐‐‐‐
Lean production has revolutionized the automotive industry and Lean enterprises are seen as groups of
individuals, functions and legal entities that create, sell and service a family of products. They collaborate
technically and share market information business units that are connected and compete through vertical and
horizontal connections and with other companies within a single project. The lean enterprise structure for
exploiting globally emerging automotive products and markets has evolved to aim at uniting skills and
reapplying them in collaborative relationships where leadership is allocated to the actor best positioned in the
network and to integrate the internal product design process with external markets, actors and trends.
Examples show that large automotive actors e.g. BMW, Fiat and Volkswagen divest activities and focus their
resources to become so called system integrators in a network of specialized actors devoted to a specific part
of automotive manufacturing. The vertical disintegration of activities could involve separate suppliers and
affiliated actors and that large portions of the R&D and design activities are divested to system suppliers177.
Since the heavy commercial industry is still in its emerging phase of developing hybrid electric vehicles a
situation analysis of the actors, roles and relationships in HEV development in the automotive industry in
general will be made. This will form the basis for a trend analysis and conclusions about expected
developments in the heavy commercial automotive industry regarding HEV development. This approach is
chosen since the two industries and its players are very similar, the technologies to some extent are
interchangeable between the industries and since many of the actors are present in cars, light weight
commercial vehicle and heavy commercial vehicle development178.
5.1 THE AUTOMOTIVE VALUE CHAIN
The automotive business value chain is defined as consisting of auto manufacturing and auto component
manufacturing179. To this can be added raw material producers such as fuel, steel, coating and plastics actors
and aftermarket actors providing services, reparations and retailing180. I will focus in on the two parts of the
value chain most relevant for this thesis, auto manufacturing and auto component manufacturing.
Auto manufacturing is defined as containing the production of passenger cars, light weight commercial
vehicles, heavy trucks, buses and coaches. Auto component manufacturing can be divided into several sub‐
categories and includes the manufacturing of all components used in auto manufacturing181.
177 Hodkinson, 2001 178 IMAP 2010 179 IMAP 2010 180 http://www.automotive‐online.com/auto‐industry.html 181 IMAP 2010
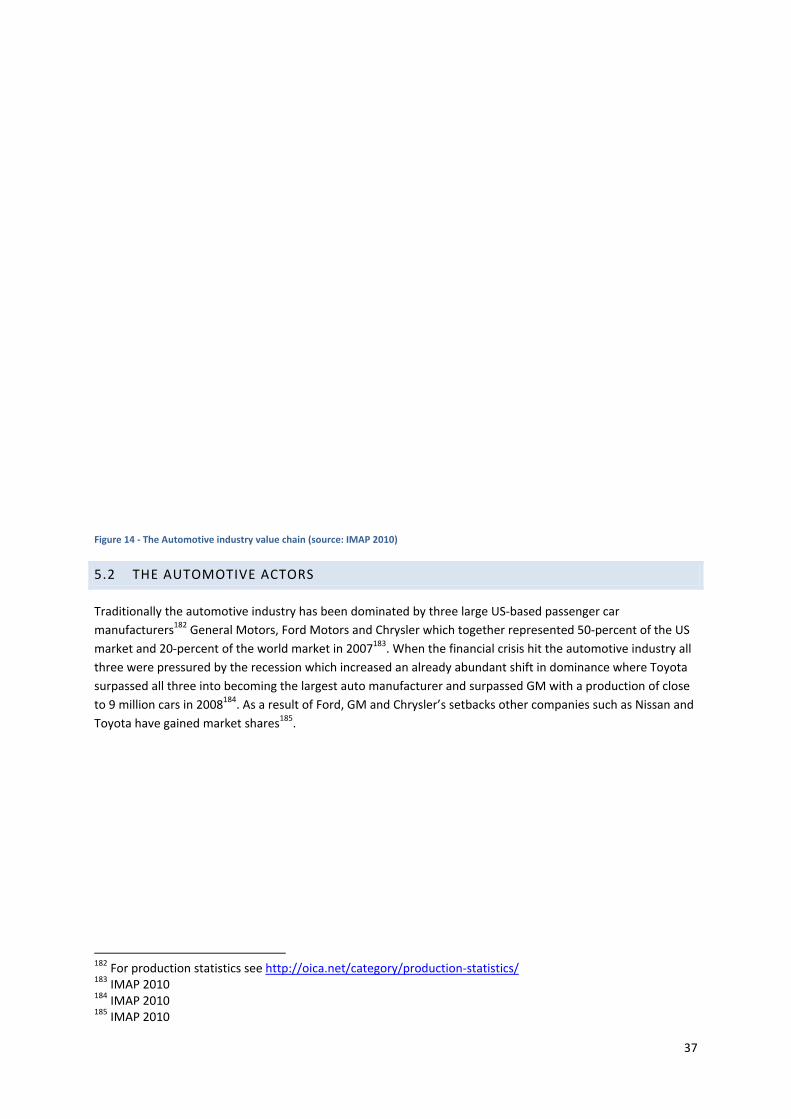
37
Figure 14 ‐ The Automotive industry value chain (source: IMAP 2010)
5.2 THE AUTOMOTIVE ACTORS
Traditionally the automotive industry has been dominated by three large US‐based passenger car
manufacturers182 General Motors, Ford Motors and Chrysler which together represented 50‐percent of the US
market and 20‐percent of the world market in 2007183. When the financial crisis hit the automotive industry all
three were pressured by the recession which increased an already abundant shift in dominance where Toyota
surpassed all three into becoming the largest auto manufacturer and surpassed GM with a production of close
to 9 million cars in 2008184. As a result of Ford, GM and Chrysler’s setbacks other companies such as Nissan and
Toyota have gained market shares185.
182 For production statistics see http://oica.net/category/production‐statistics/ 183 IMAP 2010 184 IMAP 2010 185 IMAP 2010
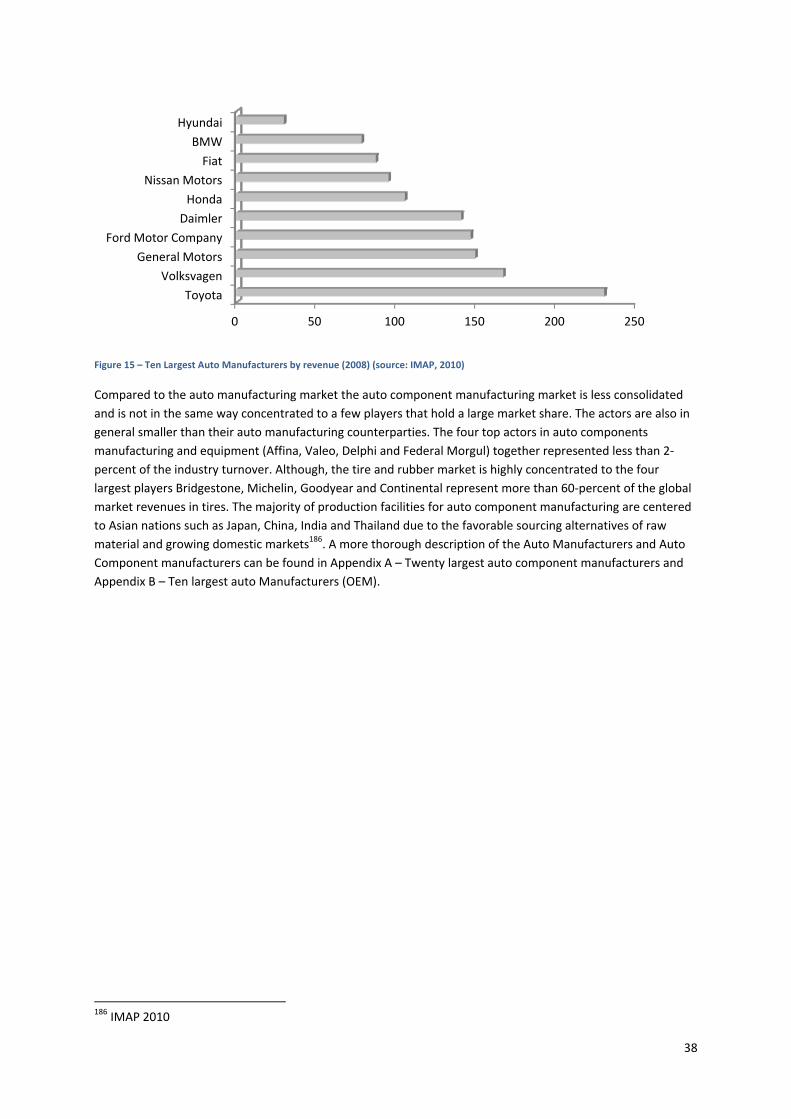
38
Figure 15 – Ten Largest Auto Manufacturers by revenue (2008) (source: IMAP, 2010)
Compared to the auto manufacturing market the auto component manufacturing market is less consolidated
and is not in the same way concentrated to a few players that hold a large market share. The actors are also in
general smaller than their auto manufacturing counterparties. The four top actors in auto components
manufacturing and equipment (Affina, Valeo, Delphi and Federal Morgul) together represented less than 2‐
percent of the industry turnover. Although, the tire and rubber market is highly concentrated to the four
largest players Bridgestone, Michelin, Goodyear and Continental represent more than 60‐percent of the global
market revenues in tires. The majority of production facilities for auto component manufacturing are centered
to Asian nations such as Japan, China, India and Thailand due to the favorable sourcing alternatives of raw
material and growing domestic markets186. A more thorough description of the Auto Manufacturers and Auto
Component manufacturers can be found in Appendix A – Twenty largest auto component manufacturers and
Appendix B – Ten largest auto Manufacturers (OEM).
186 IMAP 2010
0 50 100 150 200 250
Toyota
Volksvagen
General Motors
Ford Motor Company
Daimler
Honda
Nissan Motors
Fiat
BMW
Hyundai
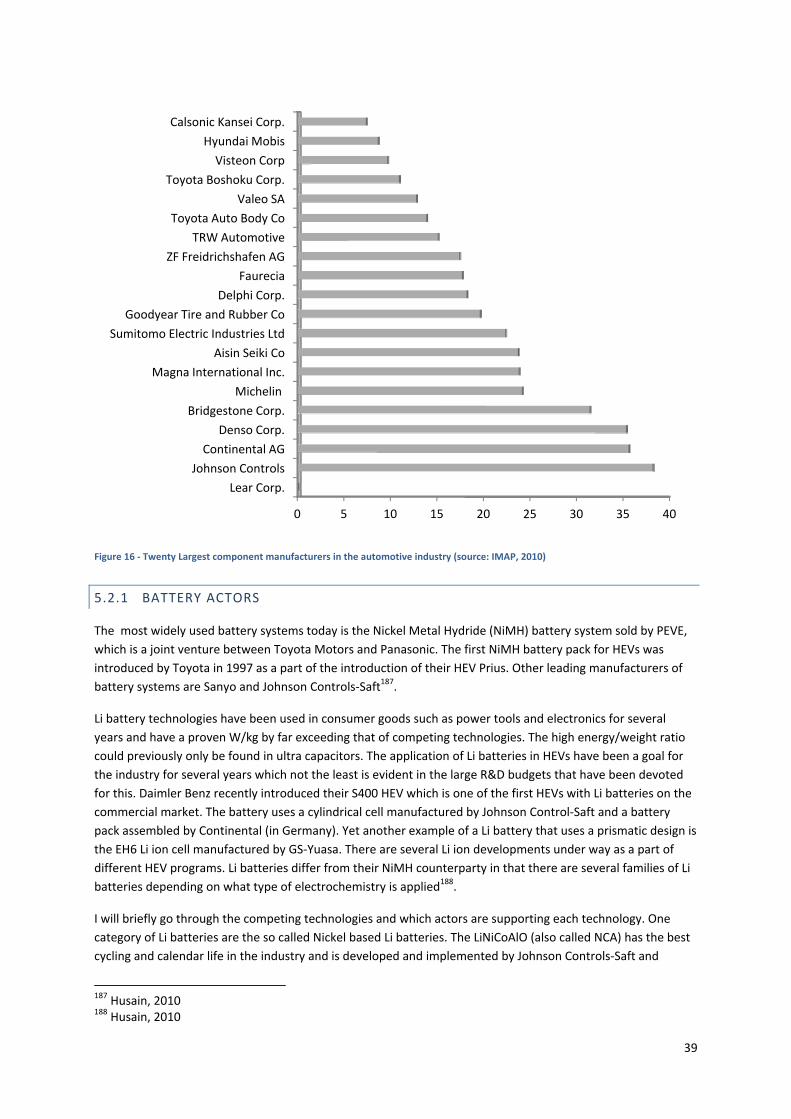
39
Figure 16 ‐ Twenty Largest component manufacturers in the automotive industry (source: IMAP, 2010)
5.2.1 BATTERY ACTORS
The most widely used battery systems today is the Nickel Metal Hydride (NiMH) battery system sold by PEVE,
which is a joint venture between Toyota Motors and Panasonic. The first NiMH battery pack for HEVs was
introduced by Toyota in 1997 as a part of the introduction of their HEV Prius. Other leading manufacturers of
battery systems are Sanyo and Johnson Controls‐Saft187.
Li battery technologies have been used in consumer goods such as power tools and electronics for several
years and have a proven W/kg by far exceeding that of competing technologies. The high energy/weight ratio
could previously only be found in ultra capacitors. The application of Li batteries in HEVs have been a goal for
the industry for several years which not the least is evident in the large R&D budgets that have been devoted
for this. Daimler Benz recently introduced their S400 HEV which is one of the first HEVs with Li batteries on the
commercial market. The battery uses a cylindrical cell manufactured by Johnson Control‐Saft and a battery
pack assembled by Continental (in Germany). Yet another example of a Li battery that uses a prismatic design is
the EH6 Li ion cell manufactured by GS‐Yuasa. There are several Li ion developments under way as a part of
different HEV programs. Li batteries differ from their NiMH counterparty in that there are several families of Li
batteries depending on what type of electrochemistry is applied188.
I will briefly go through the competing technologies and which actors are supporting each technology. One
category of Li batteries are the so called Nickel based Li batteries. The LiNiCoAlO (also called NCA) has the best
cycling and calendar life in the industry and is developed and implemented by Johnson Controls‐Saft and
187 Husain, 2010 188 Husain, 2010
0 5 10 15 20 25 30 35 40
Lear Corp.
Johnson Controls
Continental AG
Denso Corp.
Bridgestone Corp.
Michelin
Magna International Inc.
Aisin Seiki Co
Sumitomo Electric Industries Ltd
Goodyear Tire and Rubber Co
Delphi Corp.
Faurecia
ZF Freidrichshafen AG
TRW Automotive
Toyota Auto Body Co
Valeo SA
Toyota Boshoku Corp.
Visteon Corp
Hyundai Mobis
Calsonic Kansei Corp.
40
Toyota. Nickel/manganese/cobolt oxides (also called NMC) have similar merits of properties and advantages
but with considerably less industrial application time. NMC is selected as the primary choice by GS‐Yuasa and
Hitachi Vehicle Energy in Japan189.
LiMnO batteries have a somewhat lower energy density than Ni‐based batteries but also have less safety risks
than the NMC material design choice. The power capability is very high but the lifetime is somewhat shorter in
this material design. By choosing different implementations the lifetime can be prolonged as is done by NEC in
their choice of this technology. A technology that has become actualized lately is the LiFePO which has the
potential for lower cost and lower safety risk. At the same time the energy density is lower than in comparable
materials. The companies implementing this material are A123Systems and Valance Technology190.
5.3 HEV ACTOR ROLES AND RELATIONSHIPS
There are high expectations on the future growth of the HEV for passenger cars moving forward. Global
demand is expected by some sources to be as large as 4 million units by 2015 but the likeliness of this can be
discussed and the percentage of total passenger cars sales in 2008 was only 2,5% or 1,3 million units out of a
total of 52,6 million units191. Fossil fuel prices and new emission regulations are expected to drive demand for
HEVs in the future. The limited volumes in comparison to traditional cars and the lack of technology standards
in the industry regarding HEV technology has according to IMAP Automotive and Components Global Report
2010 led to that the manufacturing of motors and other HEV components are done in‐house. This is expected
to change as the produced volume of HEVs increase and prices decline, leading to a much larger outsourcing of
HEVs component production192.
5.3.1 HEV ROLES
The roles in the lightweight HEV industry to a large extent follow the tier structure implemented basically
throughout the automotive industry. One interviewee mention that due to the increase in development costs
to develop one car or car model the OEMs are pushing more and more design work towards suppliers193. To
exemplify the interviewee used the example of gearboxes and below follows the exemplification given about
HEV roles in this interview194. The gearbox is purchased from a tier one supplier and most competitors in the
same size and segment use the same gearbox. The two suppliers mentioned in this example are ZF and Hitco,
which supply components to a large number of suppliers in the same segment. The OEMs only apply software
and integration technologies to create the brand specific look and feel of the gearbox in this case. OEMs
creates the specifications for a total car and specifies for the system supplier what technologies and
components (functions) that should be included in a specific system of the car. The system supplier is
responsible for developing a system of components that are suitable for (in many cases several different
models). The system supplier in turn collaborates and holds the contacts with the component providers. Hence,
one could say that traditionally the OEMs technology control position towards the component suppliers is
exercised through the system suppliers. Furthermore, many of the system providers serve several OEMs and
hold the contact towards the component suppliers in all these relationships. I have, based on the interviews,
chosen to categorize this into three distinct roles: OEM, system provider and component provider195.
Furthermore, some of the success of the larger light weight HEV manufacturers can be derived from both
superior product and production technology and the ability to produce vehicles at a low cost. Therefore are
189 Husain, 2010 190 Husain, 2010 191 http://oica.net/wp‐content/uploads/cars3.pdf 192 IMAP, 2010 193 Interview with Andrew Dawkes, 2011‐03‐24 194 Interview with Andrew Dawkes, 2011‐03‐24 195 Interview with Andrew Dawkes & Jonathan Rice, 2011‐03‐24
41
also production technologies and the ability to build volume to achieve economies of scale critical issues for the
OEMs. It should though be noted that in general the series are smaller and the costs higher in heavy
commercial vehicles than in light weight vehicles and passenger cars. Overall the OEMs can be said to be the
most powerful actors in the industry196.
The other identified roles also exist in the automotive industry in general but are not as connected to the tier
structure of the industry. These two roles have been labeled technology provider and consultancy service
providers. They appear to be not totally mutually exclusive and share the same characteristic in that the
knowledge or technology transferred does not have to be totally connected to a product or component.
Consultancy services have a large diffusion in the industry and strict technology providers have existed for a
long time but the number has increase lately. This increase is considered to be due to a change in the total
industry rather than due to the raise of the HEV industry and that it is the timing of the HEV rather than the
characteristics of the HEV industry that has brought many new strict technology providers. The increase of
technology providers is largest among private actors while universities and public technology providers have
existed in the automotive industry for a longer period of time197.
To summarize five roles are identified in the HEV industry where actors are considered to be contextually
equivalent within the group/inter‐block. These groups are OEMs, system providers, component providers,
technology providers and consultancy service providers. The roles are not mutually exclusive and a single actor
can undertake more than one role, this applies especially to the role of technology providers and consultancy
service providers.
5.3.2 HEV RELATIONAL TYPES
Depending on the size of the actor, the technology focus and the industry segment the relational types are
diverging to some extent. Focusing in on relationships involving technology development and technology
sourcing the larger actors present two main horizontal relationship alternatives and two main vertical
relationship alternatives. A horizontal relationship is where an actor has a relationship with an actor on the
same level in the value chain. A vertical relationship is a relationship between actors on different levels in the
value chain.
The horizontal relationships that exist from a technology perspective spans from very collaborative to very
restricted in the level of collaboration that is present. One interviewee uses two examples to show how this
unfolds198. The first mentioned examples are when one OEM develops a system or platform such as an engine
and then license it out to other OEMs who make adaption to the technology and implement the technology on
their products. The HEV segment does not differ significantly from the automotive industry at large in this
aspect of relationships199. Examples of this type of relationships in HEVs can be seen between Toyota Motor
Company and several different other OEMs where Toyota license out their Hybrid Synergy Drive200,201. The
second example is that several manufacturers jointly work to develop a technology that is shared among the
actors but the product implementation is actor specific. The development costs for the platform are also
shared among the actors. An example from the HEV industry is the Global Hybrid Cooperation where several
196 Interview with Hans Pohl, 2011‐03‐29 197 Interview with Andrew Dawkes, 2011‐03‐24 198 Interview with Andrew Dawkes, 2011‐03‐24 199 Interview with Andrew Dawkes, 2011‐03‐24 200 Lloyd & Blows, 2009 201 http://www.toyota.co.jp/en/news/10/03/0329_2.pdf
42
automotive OEM jointly have started and finances a research organization202. Hence, the spectra of
collaboration are wide and situation specific.
There are a large number of relationships of the vertical kind from a technology development perspective
which have a number of diverging characteristics. I have chosen to divide them into two main types, supplier
relationship and research collaboration. The research collaboration is generally characterized by being
upstream research and in that it is less applied to a specific product or application. This is commonly done in
collaboration with universities or institutes or as a result of government initiatives203. This approach was
referred to as fishing for new technology by one interviewee since the outcome is uncertain but could
potentially generate great technology. In a supplier relationship the research is in comparison much more
applied and the OEM creates a specification for the system needed to the system provider. Depending on the
volume and purchase power of the OEM it is then up to the system provider to develop the product jointly with
the OEM but, as mentioned earlier, the architectural design on a higher level is done by the OEM and the
design on lower (modular) level is done by the system provider204. In particular, the European automotive
industry is skewed towards working with system providers in HEV development but there has been an
undersupply of suppliers able to provide HEV technologies on a system provider level. This could also be
related to the choice from the OEMs to do some technology development in‐house in order to widen their
technology base and strengthen their HEV capabilities205. The undersupply of system providers in the HEV
industry could also be related to the lower volumes and the lack of technology standards regarding HEV
technology mentioned earlier206. Therefore one of the traditional steps of systems providers in the value chain
is underutilized. Over time a consolidation of actors and the rise of HEV system providers are expected to lead
to a development where the HEV value chain is similar to the general value chain of the automotive industry207.
The relationships take different structural forms which create different infrastructures for transferring
knowledge and technology between the organizations. According to most interviewees there is not a particular
trend in the setup of the relational infrastructure208,209,210 and many different forms are used e.g. joint ventures
like PEVE between Toyota and Panasonic, research collaborations as Global Hybrid Cooperative and numerous
other examples. The differences in setup also mean that the infrastructure for transfer and sharing of
technology is different.
New types of collaborations also appear where one example is between electric utility companies and electric
and hybrid electric vehicle OEMs211. This is a totally new type of actor in the industry which can be expected to
bring new knowledge to the industry and to be included in collaborations previously unexplored.
5.3.3 HOW IS TECHNOLOGY SHARED, TRANSFEREED AND CONTROLLED IN THE HEV
INDUSTRY
Technology is contractually shared in developments and collaborations. Usually the supplier develops the
product base and the OEM sets the restraints on an architectural level of the total vehicle. Patents are
commonly used for protecting technology and usually the inventing company receives the patent rights rather
than assigning it to the company ordering the product or service e.g. the OEM. The supplier can in many cases
202 Husain, 2010 203 Interview with Jonathan Rice, 2011‐03‐24 204 Interview with Jonathan Rice, 2011‐03‐24 205 Interview with Hans Pohl, 2011‐03‐29 206 IMAP, 2010 207 Interview with Hans Pohl, 2011‐03‐29 208 Interview with Jonathan Rice, 2011‐03‐24 209 Interview with Andrew Dawkes, 2011‐03‐31 210 Interview with Hans Pohl, 2011‐03‐29 211 Interview with Hans Pohl, 2011‐03‐29
43
patent the underlying technology and that the OEM patent implementations of the same technology in a
specific vehicle212. The focus on IPRs in the automotive industry has increased in general213.
Even if the OEMs control and set the technology roadmap it can be tough for them to negotiate background
and foreground rights to the technology. OEMs rely on suppliers with good technology and suppliers which
often supply several of the OEMs in the segment214. Based on the difference in roles between OEMs and
suppliers their interests also become diverging on some points and production and implementation costs have
to be valued alongside technological quality. OEMs are interested in pressing prices and look for synergies so
that systems and platforms can be shared by several brands and several models. This builds huge volumes that
give the OEM large advantages in negotiations. At the same time this becomes a technological lock‐in for the
OEM. Commonly, contractual relations have built in demands for technological improvements. The OEMs give
the supplier a set profit margin and has demands on cost reductions each year. This means that the OEMs
control the implementation of the technology and have a market based control over the technology while a
supplier control the technical expertise and sometimes also the IPRs connected to the technology. The inventor
will patent a new technology and then license to the supplier. If it is the OEM who is the inventor the
technology will be licensed through the product sold by the system supplier, hence the system supplier is the
one who licenses out the technology further and thereby also control the market access of the technology215.
Hence, OEMs in many cases source architectural innovations in‐house and source modular innovation trough
system providers.
Consultants are a source for information and best practice in the automotive industry in general216 and in the
HEV segment in particular217. Many companies use the same consultants and can therefore be reluctant to
relying on them too much with fear of losing competitive edge through technology leakage218. At the same
time consultants are a great source of knowledge and one mentioned problem is that many companies lack an
efficient knowledge transaction strategy which means that knowledge is lost and is in the risk of being lost in
hybrid development projects219.
Although an increasing trend in patenting220, most products are controlled through production technology and
market/customer access and market power stemming from economies of scale rather than from the control
over technology but it is not one or the other. To summarize the general types of transactional norms used in
the industry knowledge is transacted in products bought off‐the‐shelves, where the knowledge is absorbed by
the company through working with the product and doing tests and implementations. The second example
includes development activities where suppliers have engineering staff participating in the development work
at the facilities of the client and by that transferring knowledge. Lastly, consultants are used as carriers
transferring knowledge between firms and between the consultancy firm and the purchaser of the consultancy
service221.
212 Interview with Anderew Dawkes, 2011‐03‐24 213 Interview with Anderew Dawkes, 2011‐03‐24 214 Interview with Jonathan Rice, 2011‐03‐24 215 Interview with Andrew Dawkes, 2011‐03‐24 216 Interview with Jonathan Rice, 2011‐03‐24 217 Interview with Hans Pohl, 2011‐03‐29 218 Interview with Jonathan Rice, 2011‐03‐24 219 Interview with Hans Pohl, 2011‐03‐29 220 Interview with Andrew Dawkes, 2011‐03‐24 221 Interview with Hans Pohl, 2011‐03‐29
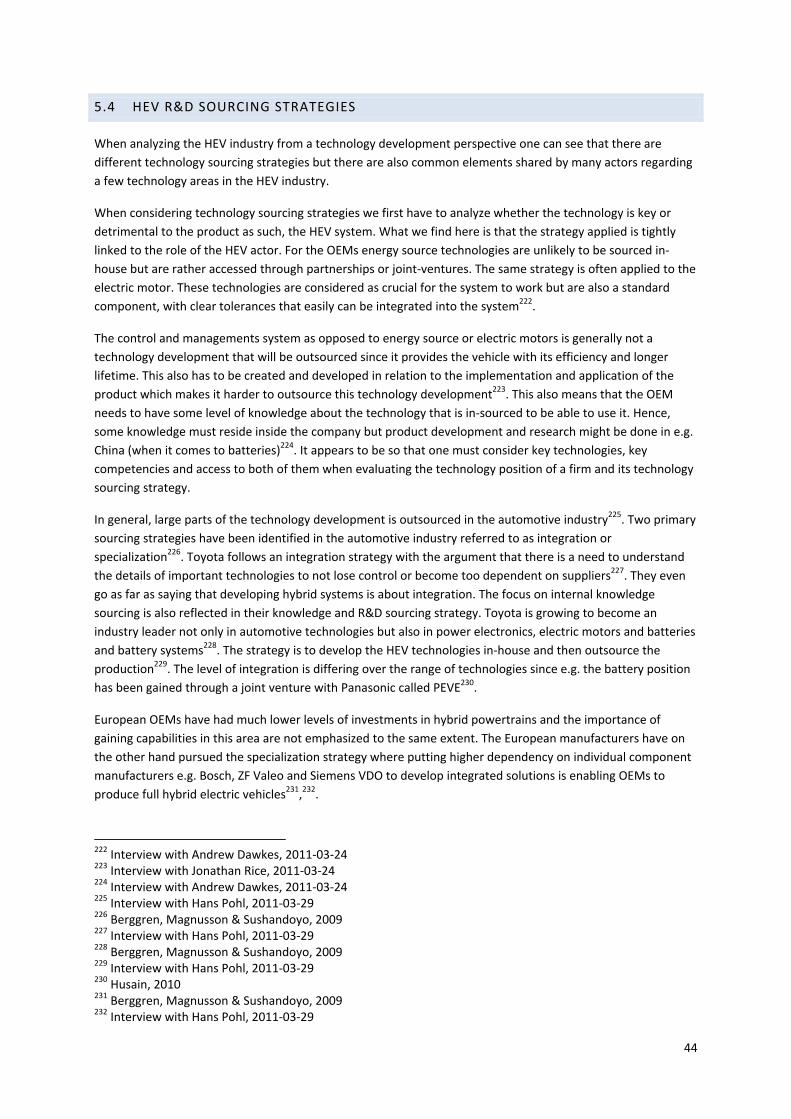
44
5.4 HEV R&D SOURCING STRATEGIES
When analyzing the HEV industry from a technology development perspective one can see that there are
different technology sourcing strategies but there are also common elements shared by many actors regarding
a few technology areas in the HEV industry.
When considering technology sourcing strategies we first have to analyze whether the technology is key or
detrimental to the product as such, the HEV system. What we find here is that the strategy applied is tightly
linked to the role of the HEV actor. For the OEMs energy source technologies are unlikely to be sourced in‐
house but are rather accessed through partnerships or joint‐ventures. The same strategy is often applied to the
electric motor. These technologies are considered as crucial for the system to work but are also a standard
component, with clear tolerances that easily can be integrated into the system222.
The control and managements system as opposed to energy source or electric motors is generally not a
technology development that will be outsourced since it provides the vehicle with its efficiency and longer
lifetime. This also has to be created and developed in relation to the implementation and application of the
product which makes it harder to outsource this technology development223. This also means that the OEM
needs to have some level of knowledge about the technology that is in‐sourced to be able to use it. Hence,
some knowledge must reside inside the company but product development and research might be done in e.g.
China (when it comes to batteries)224. It appears to be so that one must consider key technologies, key
competencies and access to both of them when evaluating the technology position of a firm and its technology
sourcing strategy.
In general, large parts of the technology development is outsourced in the automotive industry225. Two primary
sourcing strategies have been identified in the automotive industry referred to as integration or
specialization226. Toyota follows an integration strategy with the argument that there is a need to understand
the details of important technologies to not lose control or become too dependent on suppliers227. They even
go as far as saying that developing hybrid systems is about integration. The focus on internal knowledge
sourcing is also reflected in their knowledge and R&D sourcing strategy. Toyota is growing to become an
industry leader not only in automotive technologies but also in power electronics, electric motors and batteries
and battery systems228. The strategy is to develop the HEV technologies in‐house and then outsource the
production229. The level of integration is differing over the range of technologies since e.g. the battery position
has been gained through a joint venture with Panasonic called PEVE230.
European OEMs have had much lower levels of investments in hybrid powertrains and the importance of
gaining capabilities in this area are not emphasized to the same extent. The European manufacturers have on
the other hand pursued the specialization strategy where putting higher dependency on individual component
manufacturers e.g. Bosch, ZF Valeo and Siemens VDO to develop integrated solutions is enabling OEMs to
produce full hybrid electric vehicles231,232.
222 Interview with Andrew Dawkes, 2011‐03‐24 223 Interview with Jonathan Rice, 2011‐03‐24 224 Interview with Andrew Dawkes, 2011‐03‐24 225 Interview with Hans Pohl, 2011‐03‐29 226 Berggren, Magnusson & Sushandoyo, 2009 227 Interview with Hans Pohl, 2011‐03‐29 228 Berggren, Magnusson & Sushandoyo, 2009 229 Interview with Hans Pohl, 2011‐03‐29 230 Husain, 2010 231 Berggren, Magnusson & Sushandoyo, 2009 232 Interview with Hans Pohl, 2011‐03‐29
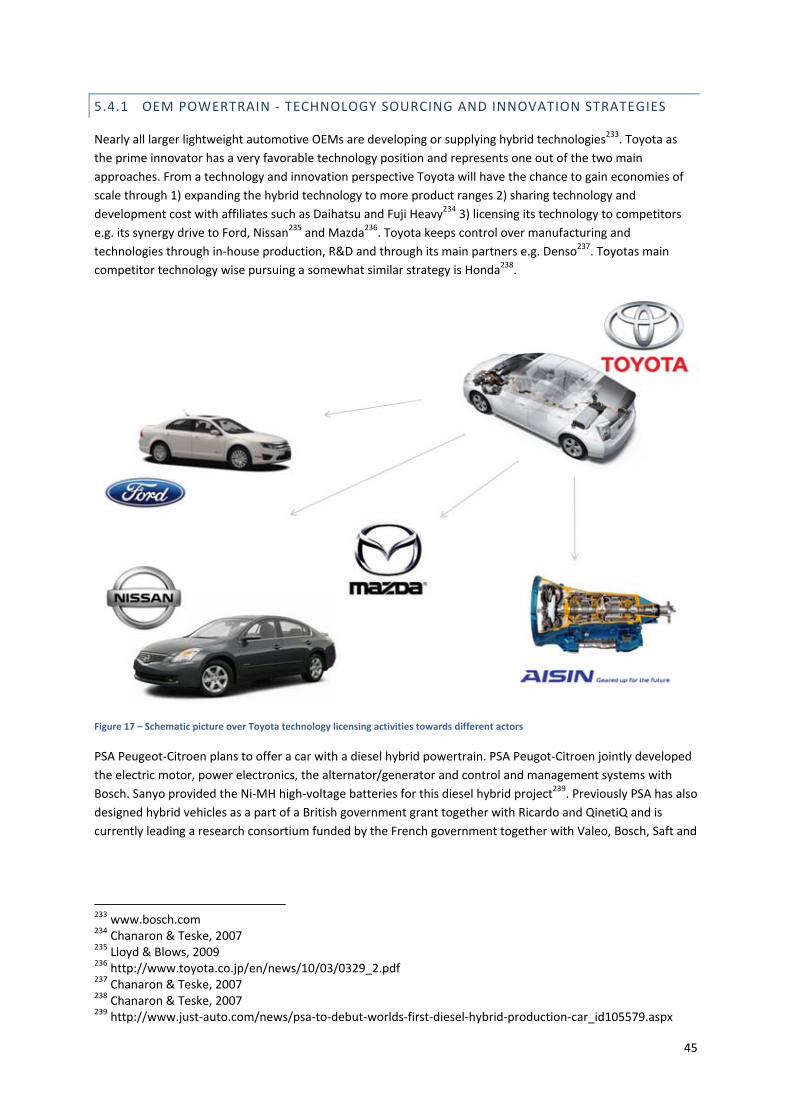
45
5.4.1 OEM POWERTRAIN ‐ TECHNOLOGY SOURCING AND INNOVATION STRATEGIES
Nearly all larger lightweight automotive OEMs are developing or supplying hybrid technologies233. Toyota as
the prime innovator has a very favorable technology position and represents one out of the two main
approaches. From a technology and innovation perspective Toyota will have the chance to gain economies of
scale through 1) expanding the hybrid technology to more product ranges 2) sharing technology and
development cost with affiliates such as Daihatsu and Fuji Heavy234 3) licensing its technology to competitors
e.g. its synergy drive to Ford, Nissan235 and Mazda236. Toyota keeps control over manufacturing and
technologies through in‐house production, R&D and through its main partners e.g. Denso237. Toyotas main
competitor technology wise pursuing a somewhat similar strategy is Honda238.
Figure 17 – Schematic picture over Toyota technology licensing activities towards different actors
PSA Peugeot‐Citroen plans to offer a car with a diesel hybrid powertrain. PSA Peugot‐Citroen jointly developed
the electric motor, power electronics, the alternator/generator and control and management systems with
Bosch. Sanyo provided the Ni‐MH high‐voltage batteries for this diesel hybrid project239. Previously PSA has also
designed hybrid vehicles as a part of a British government grant together with Ricardo and QinetiQ and is
currently leading a research consortium funded by the French government together with Valeo, Bosch, Saft and
233 www.bosch.com 234 Chanaron & Teske, 2007 235 Lloyd & Blows, 2009 236 http://www.toyota.co.jp/en/news/10/03/0329_2.pdf 237 Chanaron & Teske, 2007 238 Chanaron & Teske, 2007 239 http://www.just‐auto.com/news/psa‐to‐debut‐worlds‐first‐diesel‐hybrid‐production‐car_id105579.aspx
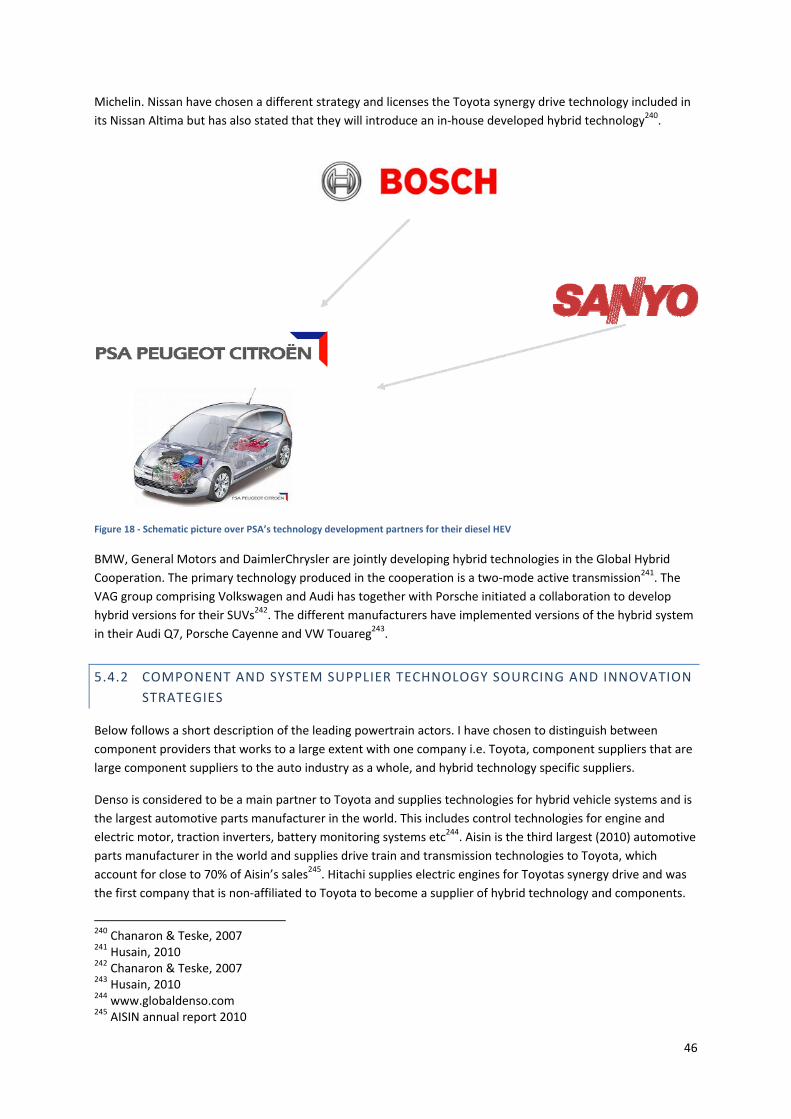
46
Michelin. Nissan have chosen a different strategy and licenses the Toyota synergy drive technology included in
its Nissan Altima but has also stated that they will introduce an in‐house developed hybrid technology240.
Figure 18 ‐ Schematic picture over PSA’s technology development partners for their diesel HEV
BMW, General Motors and DaimlerChrysler are jointly developing hybrid technologies in the Global Hybrid
Cooperation. The primary technology produced in the cooperation is a two‐mode active transmission241. The
VAG group comprising Volkswagen and Audi has together with Porsche initiated a collaboration to develop
hybrid versions for their SUVs242. The different manufacturers have implemented versions of the hybrid system
in their Audi Q7, Porsche Cayenne and VW Touareg243.
5.4.2 COMPONENT AND SYSTEM SUPPLIER TECHNOLOGY SOURCING AND INNOVATION
STRATEGIES
Below follows a short description of the leading powertrain actors. I have chosen to distinguish between
component providers that works to a large extent with one company i.e. Toyota, component suppliers that are
large component suppliers to the auto industry as a whole, and hybrid technology specific suppliers.
Denso is considered to be a main partner to Toyota and supplies technologies for hybrid vehicle systems and is
the largest automotive parts manufacturer in the world. This includes control technologies for engine and
electric motor, traction inverters, battery monitoring systems etc244. Aisin is the third largest (2010) automotive
parts manufacturer in the world and supplies drive train and transmission technologies to Toyota, which
account for close to 70% of Aisin’s sales245. Hitachi supplies electric engines for Toyotas synergy drive and was
the first company that is non‐affiliated to Toyota to become a supplier of hybrid technology and components.
240 Chanaron & Teske, 2007 241 Husain, 2010 242 Chanaron & Teske, 2007 243 Husain, 2010 244 www.globaldenso.com 245 AISIN annual report 2010
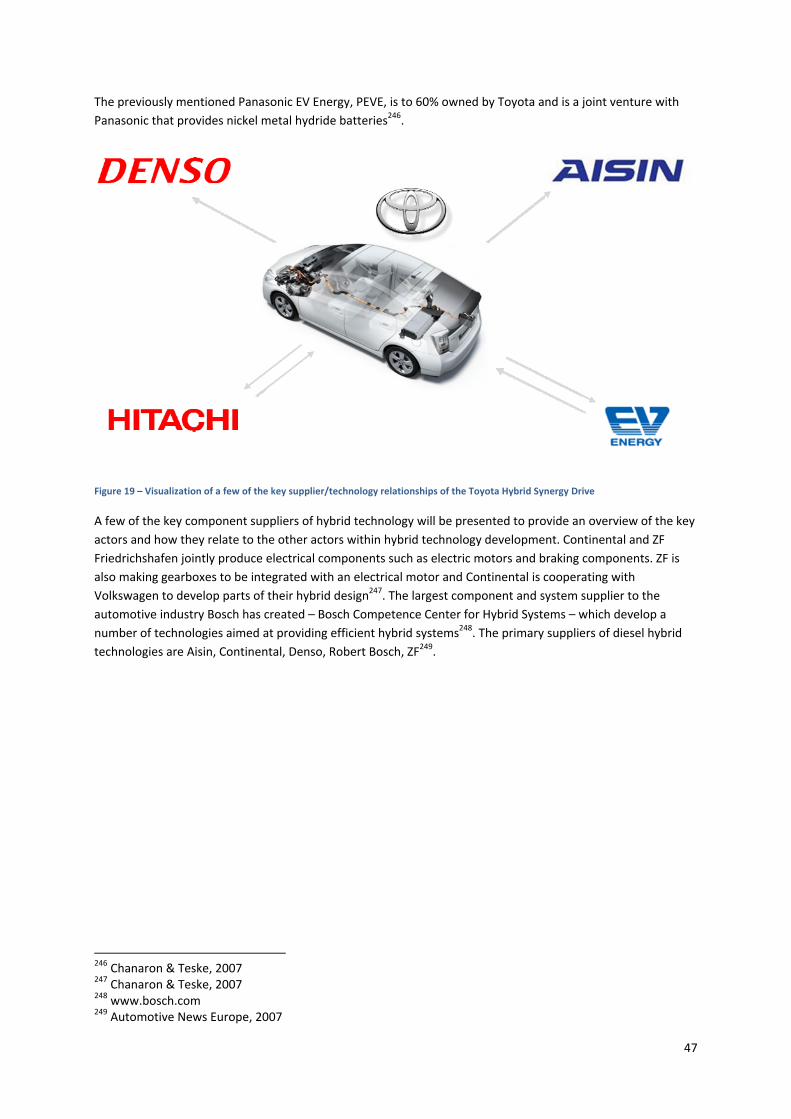
47
The previously mentioned Panasonic EV Energy, PEVE, is to 60% owned by Toyota and is a joint venture with
Panasonic that provides nickel metal hydride batteries246.
Figure 19 – Visualization of a few of the key supplier/technology relationships of the Toyota Hybrid Synergy Drive
A few of the key component suppliers of hybrid technology will be presented to provide an overview of the key
actors and how they relate to the other actors within hybrid technology development. Continental and ZF
Friedrichshafen jointly produce electrical components such as electric motors and braking components. ZF is
also making gearboxes to be integrated with an electrical motor and Continental is cooperating with
Volkswagen to develop parts of their hybrid design247. The largest component and system supplier to the
automotive industry Bosch has created – Bosch Competence Center for Hybrid Systems – which develop a
number of technologies aimed at providing efficient hybrid systems248. The primary suppliers of diesel hybrid
technologies are Aisin, Continental, Denso, Robert Bosch, ZF249.
246 Chanaron & Teske, 2007 247 Chanaron & Teske, 2007 248 www.bosch.com 249 Automotive News Europe, 2007
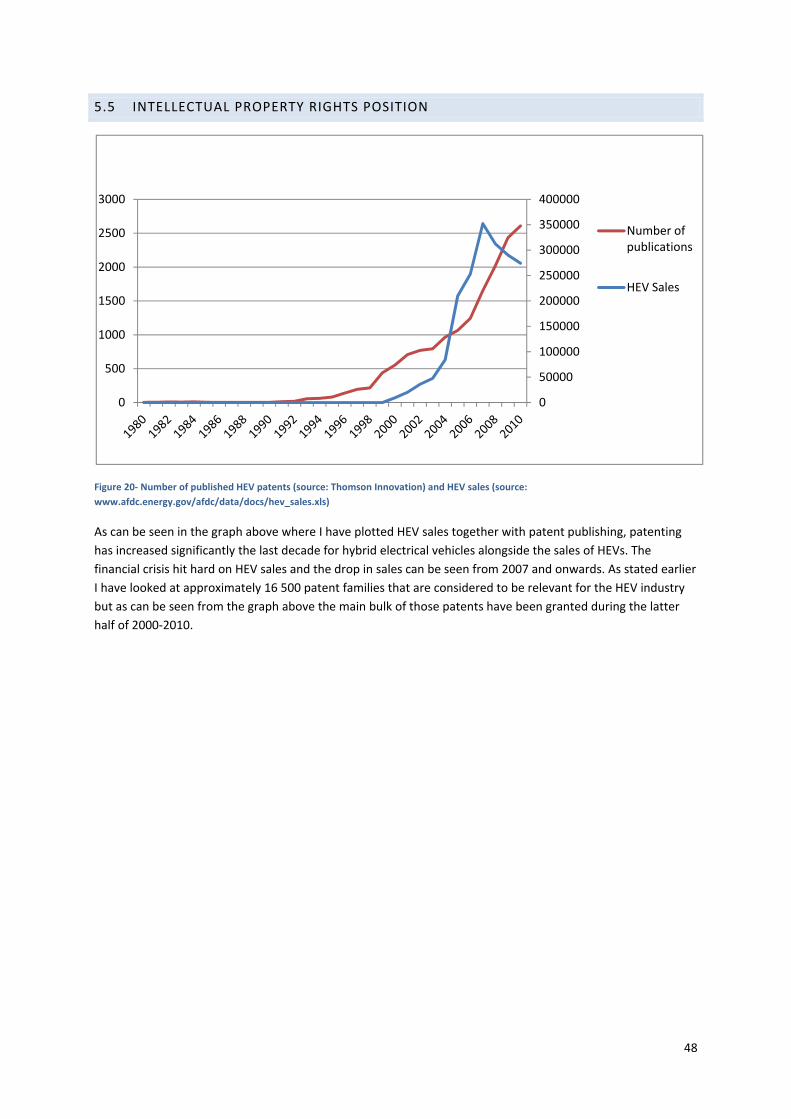
48
5.5 INTELLECTUAL PROPERTY RIGHTS POSITION
Figure 20‐ Number of published HEV patents (source: Thomson Innovation) and HEV sales (source:
www.afdc.energy.gov/afdc/data/docs/hev_sales.xls)
As can be seen in the graph above where I have plotted HEV sales together with patent publishing, patenting
has increased significantly the last decade for hybrid electrical vehicles alongside the sales of HEVs. The
financial crisis hit hard on HEV sales and the drop in sales can be seen from 2007 and onwards. As stated earlier
I have looked at approximately 16 500 patent families that are considered to be relevant for the HEV industry
but as can be seen from the graph above the main bulk of those patents have been granted during the latter
half of 2000‐2010.
0
50000
100000
150000
200000
250000
300000
350000
400000
0
500
1000
1500
2000
2500
3000
Number of publications
HEV Sales
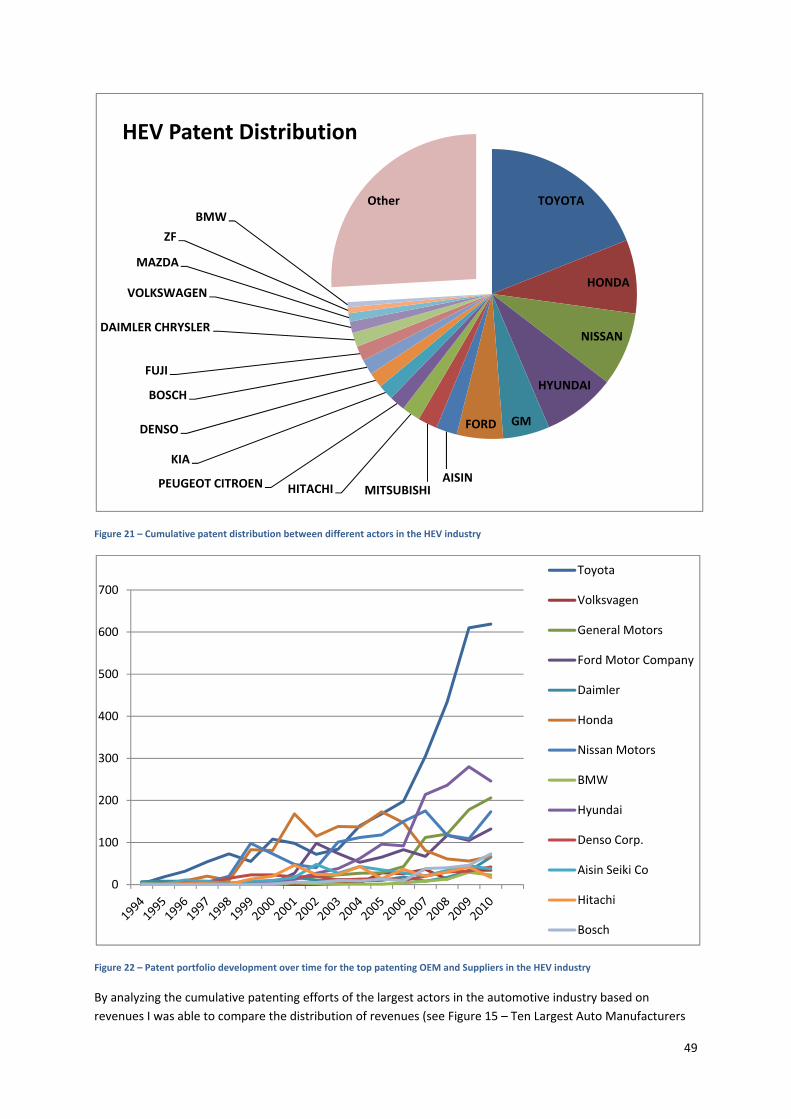
49
Figure 21 – Cumulative patent distribution between different actors in the HEV industry
Figure 22 – Patent portfolio development over time for the top patenting OEM and Suppliers in the HEV industry
By analyzing the cumulative patenting efforts of the largest actors in the automotive industry based on
revenues I was able to compare the distribution of revenues (see Figure 15 – Ten Largest Auto Manufacturers
TOYOTA
HONDA
NISSAN
HYUNDAI
GMFORD
AISINMITSUBISHIHITACHIPEUGEOT CITROEN
KIA
DENSO
BOSCH
FUJI
DAIMLER CHRYSLER
VOLKSWAGEN
MAZDA
ZF
BMWOther
HEV Patent Distribution
0
100
200
300
400
500
600
700
Toyota
Volksvagen
General Motors
Ford Motor Company
Daimler
Honda
Nissan Motors
BMW
Hyundai
Denso Corp.
Aisin Seiki Co
Hitachi
Bosch
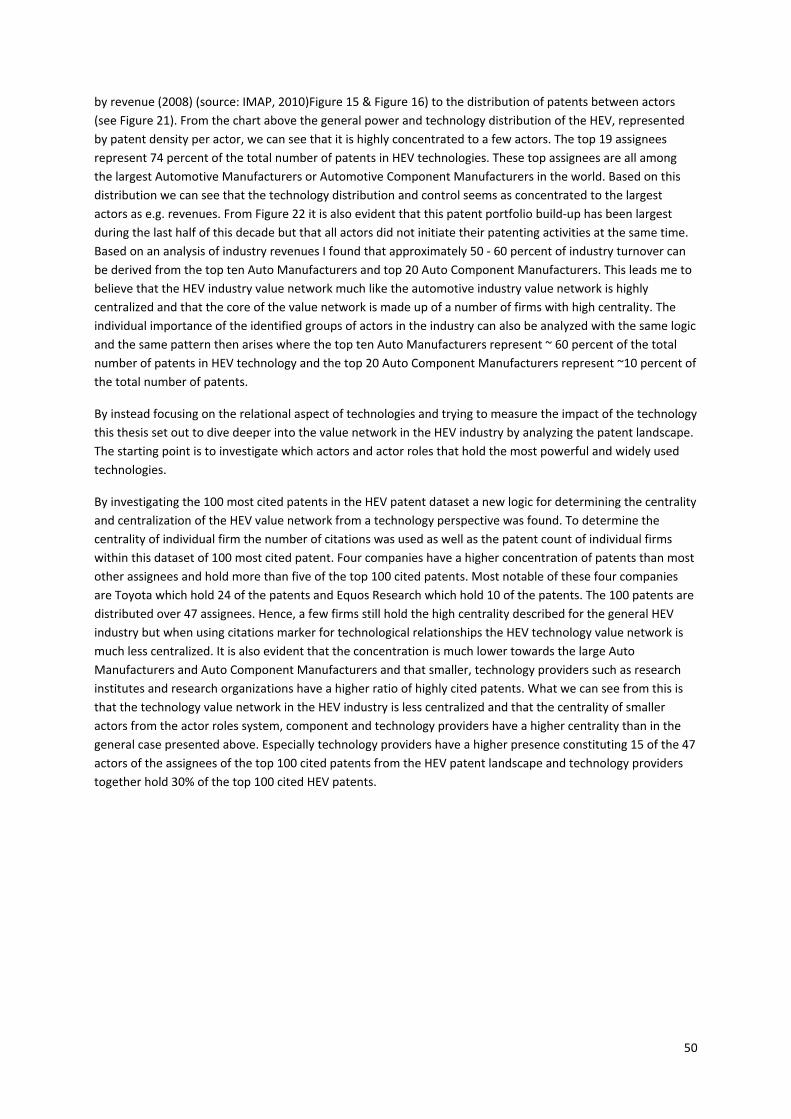
50
by revenue (2008) (source: IMAP, 2010)Figure 15 & Figure 16) to the distribution of patents between actors
(see Figure 21). From the chart above the general power and technology distribution of the HEV, represented
by patent density per actor, we can see that it is highly concentrated to a few actors. The top 19 assignees
represent 74 percent of the total number of patents in HEV technologies. These top assignees are all among
the largest Automotive Manufacturers or Automotive Component Manufacturers in the world. Based on this
distribution we can see that the technology distribution and control seems as concentrated to the largest
actors as e.g. revenues. From Figure 22 it is also evident that this patent portfolio build‐up has been largest
during the last half of this decade but that all actors did not initiate their patenting activities at the same time.
Based on an analysis of industry revenues I found that approximately 50 ‐ 60 percent of industry turnover can
be derived from the top ten Auto Manufacturers and top 20 Auto Component Manufacturers. This leads me to
believe that the HEV industry value network much like the automotive industry value network is highly
centralized and that the core of the value network is made up of a number of firms with high centrality. The
individual importance of the identified groups of actors in the industry can also be analyzed with the same logic
and the same pattern then arises where the top ten Auto Manufacturers represent ~ 60 percent of the total
number of patents in HEV technology and the top 20 Auto Component Manufacturers represent ~10 percent of
the total number of patents.
By instead focusing on the relational aspect of technologies and trying to measure the impact of the technology
this thesis set out to dive deeper into the value network in the HEV industry by analyzing the patent landscape.
The starting point is to investigate which actors and actor roles that hold the most powerful and widely used
technologies.
By investigating the 100 most cited patents in the HEV patent dataset a new logic for determining the centrality
and centralization of the HEV value network from a technology perspective was found. To determine the
centrality of individual firm the number of citations was used as well as the patent count of individual firms
within this dataset of 100 most cited patent. Four companies have a higher concentration of patents than most
other assignees and hold more than five of the top 100 cited patents. Most notable of these four companies
are Toyota which hold 24 of the patents and Equos Research which hold 10 of the patents. The 100 patents are
distributed over 47 assignees. Hence, a few firms still hold the high centrality described for the general HEV
industry but when using citations marker for technological relationships the HEV technology value network is
much less centralized. It is also evident that the concentration is much lower towards the large Auto
Manufacturers and Auto Component Manufacturers and that smaller, technology providers such as research
institutes and research organizations have a higher ratio of highly cited patents. What we can see from this is
that the technology value network in the HEV industry is less centralized and that the centrality of smaller
actors from the actor roles system, component and technology providers have a higher centrality than in the
general case presented above. Especially technology providers have a higher presence constituting 15 of the 47
actors of the assignees of the top 100 cited patents from the HEV patent landscape and technology providers
together hold 30% of the top 100 cited HEV patents.
51
Figure 23 ‐ Number of top 100 cited patents per actors and actor role250
According to patent analysis firm Griffith‐Hack only one of these technology providers qualify as one of the top
ten most dominant hybrid car patent holders, namely Paice Corporation. The table below presents rank of
most dominant HEV patent holders based on network analysis251.
Rank Name Relative dominance index Number of patents
1 Toyota 100 3635
2 Honda 71 1435
3 Nissan 62 1644
4 Ford 60 809
5 General Motors 23 428
6 Peugeot‐Citroen 22 255
7 Hitachi 21 393
8 Volksvagen 20 127
9 Paice Corporation 18 28
10 Renault 16 209
Table 1 ‐ Most dominant HEV patent owners (Source: Lloyd & Blows, 2009)
Rank Patent Owner
1 Paice Corporation
2 Paice Corporation
3 Eqous Research
4 Paice Corporation
5 Hybricon Inc
6 Toyota
7 Paice Corporation
8 Ford
9 Hitachi
10 Honda
Table 2 ‐ Most dominant HEV patents by owner (Source: Lloyd & Blows, 2009)
250 For a more detailed description of the data please see Appendix D 9.4.5 251 Lloyd & Blows, 2009
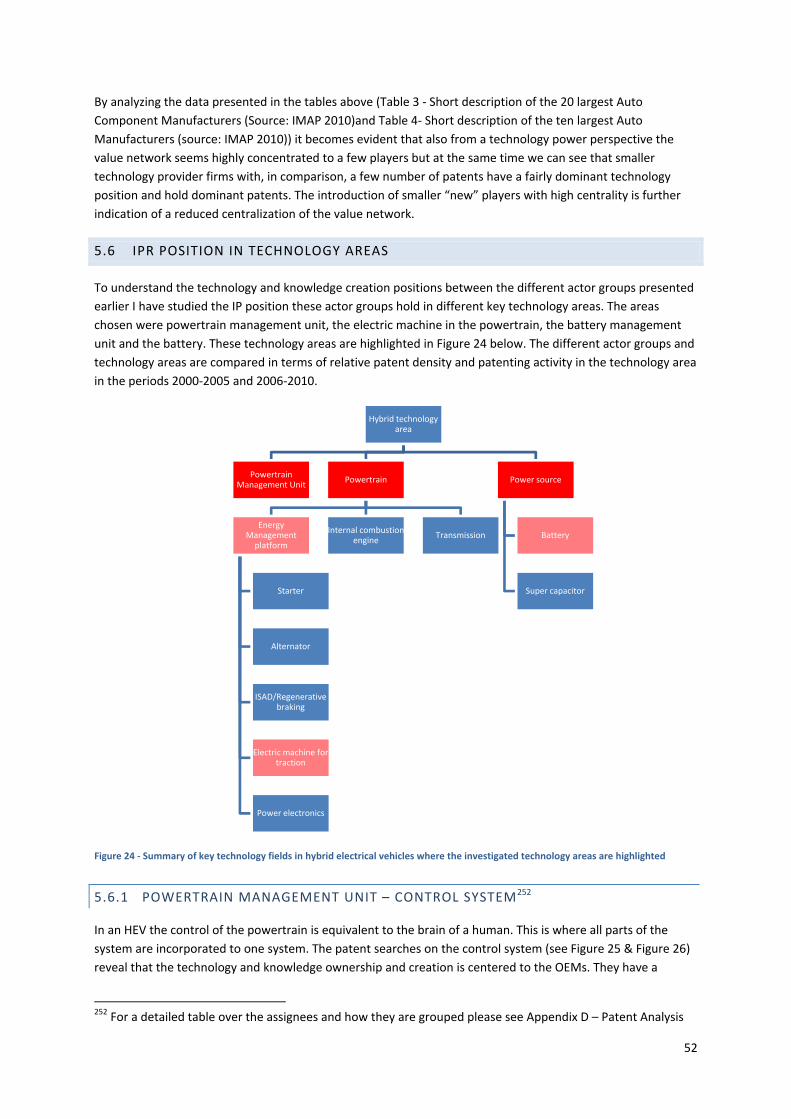
52
By analyzing the data presented in the tables above (Table 3 ‐ Short description of the 20 largest Auto
Component Manufacturers (Source: IMAP 2010)and Table 4‐ Short description of the ten largest Auto
Manufacturers (source: IMAP 2010)) it becomes evident that also from a technology power perspective the
value network seems highly concentrated to a few players but at the same time we can see that smaller
technology provider firms with, in comparison, a few number of patents have a fairly dominant technology
position and hold dominant patents. The introduction of smaller “new” players with high centrality is further
indication of a reduced centralization of the value network.
5.6 IPR POSITION IN TECHNOLOGY AREAS
To understand the technology and knowledge creation positions between the different actor groups presented
earlier I have studied the IP position these actor groups hold in different key technology areas. The areas
chosen were powertrain management unit, the electric machine in the powertrain, the battery management
unit and the battery. These technology areas are highlighted in Figure 24 below. The different actor groups and
technology areas are compared in terms of relative patent density and patenting activity in the technology area
in the periods 2000‐2005 and 2006‐2010.
Figure 24 ‐ Summary of key technology fields in hybrid electrical vehicles where the investigated technology areas are highlighted
5.6.1 POWERTRAIN MANAGEMENT UNIT – CONTROL SYSTEM252
In an HEV the control of the powertrain is equivalent to the brain of a human. This is where all parts of the
system are incorporated to one system. The patent searches on the control system (see Figure 25 & Figure 26)
reveal that the technology and knowledge ownership and creation is centered to the OEMs. They have a
252 For a detailed table over the assignees and how they are grouped please see Appendix D – Patent Analysis
Hybrid technology area
Powertrain Management Unit
Powertrain
Energy Management platform
Starter
Alternator
ISAD/Regenerative braking
Electric machine for traction
Power electronics
Internal combustion engine
Transmission
Power source
Battery
Super capacitor
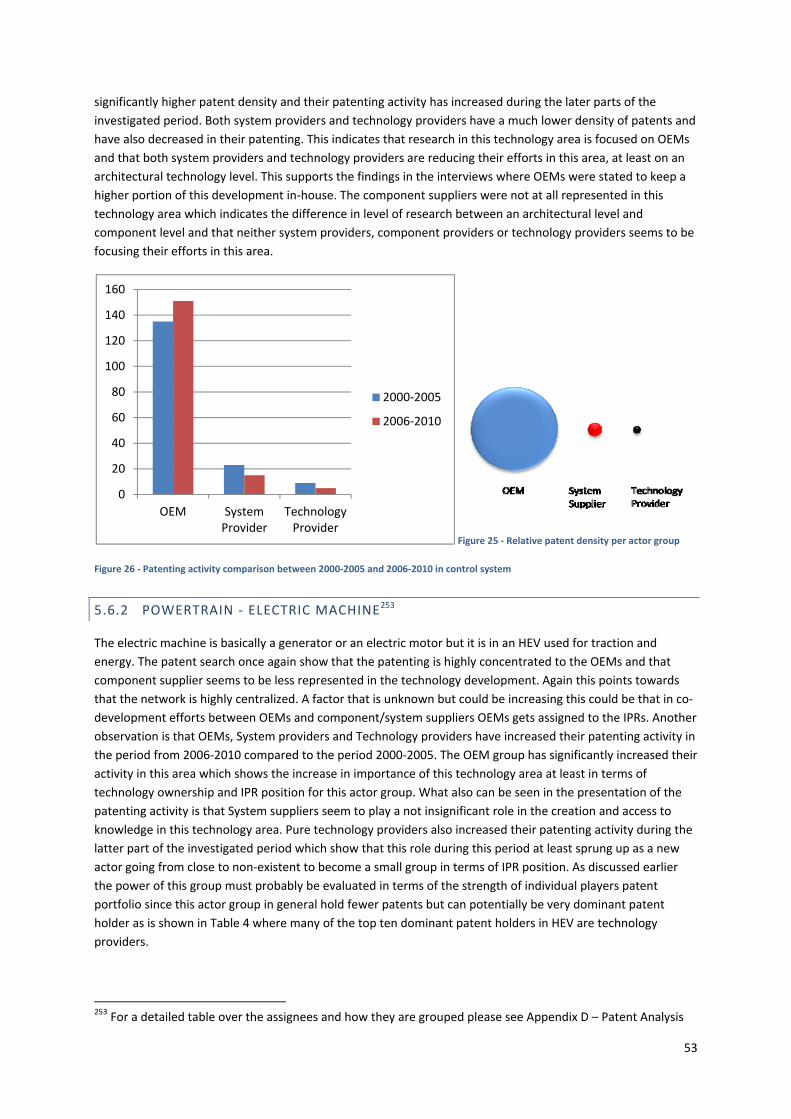
53
significantly higher patent density and their patenting activity has increased during the later parts of the
investigated period. Both system providers and technology providers have a much lower density of patents and
have also decreased in their patenting. This indicates that research in this technology area is focused on OEMs
and that both system providers and technology providers are reducing their efforts in this area, at least on an
architectural technology level. This supports the findings in the interviews where OEMs were stated to keep a
higher portion of this development in‐house. The component suppliers were not at all represented in this
technology area which indicates the difference in level of research between an architectural level and
component level and that neither system providers, component providers or technology providers seems to be
focusing their efforts in this area.
Figure 25 ‐ Relative patent density per actor group
Figure 26 ‐ Patenting activity comparison between 2000‐2005 and 2006‐2010 in control system
5.6.2 POWERTRAIN ‐ ELECTRIC MACHINE253
The electric machine is basically a generator or an electric motor but it is in an HEV used for traction and
energy. The patent search once again show that the patenting is highly concentrated to the OEMs and that
component supplier seems to be less represented in the technology development. Again this points towards
that the network is highly centralized. A factor that is unknown but could be increasing this could be that in co‐
development efforts between OEMs and component/system suppliers OEMs gets assigned to the IPRs. Another
observation is that OEMs, System providers and Technology providers have increased their patenting activity in
the period from 2006‐2010 compared to the period 2000‐2005. The OEM group has significantly increased their
activity in this area which shows the increase in importance of this technology area at least in terms of
technology ownership and IPR position for this actor group. What also can be seen in the presentation of the
patenting activity is that System suppliers seem to play a not insignificant role in the creation and access to
knowledge in this technology area. Pure technology providers also increased their patenting activity during the
latter part of the investigated period which show that this role during this period at least sprung up as a new
actor going from close to non‐existent to become a small group in terms of IPR position. As discussed earlier
the power of this group must probably be evaluated in terms of the strength of individual players patent
portfolio since this actor group in general hold fewer patents but can potentially be very dominant patent
holder as is shown in Table 4 where many of the top ten dominant patent holders in HEV are technology
providers.
253 For a detailed table over the assignees and how they are grouped please see Appendix D – Patent Analysis
0
20
40
60
80
100
120
140
160
OEM System Provider
Technology Provider
2000‐2005
2006‐2010
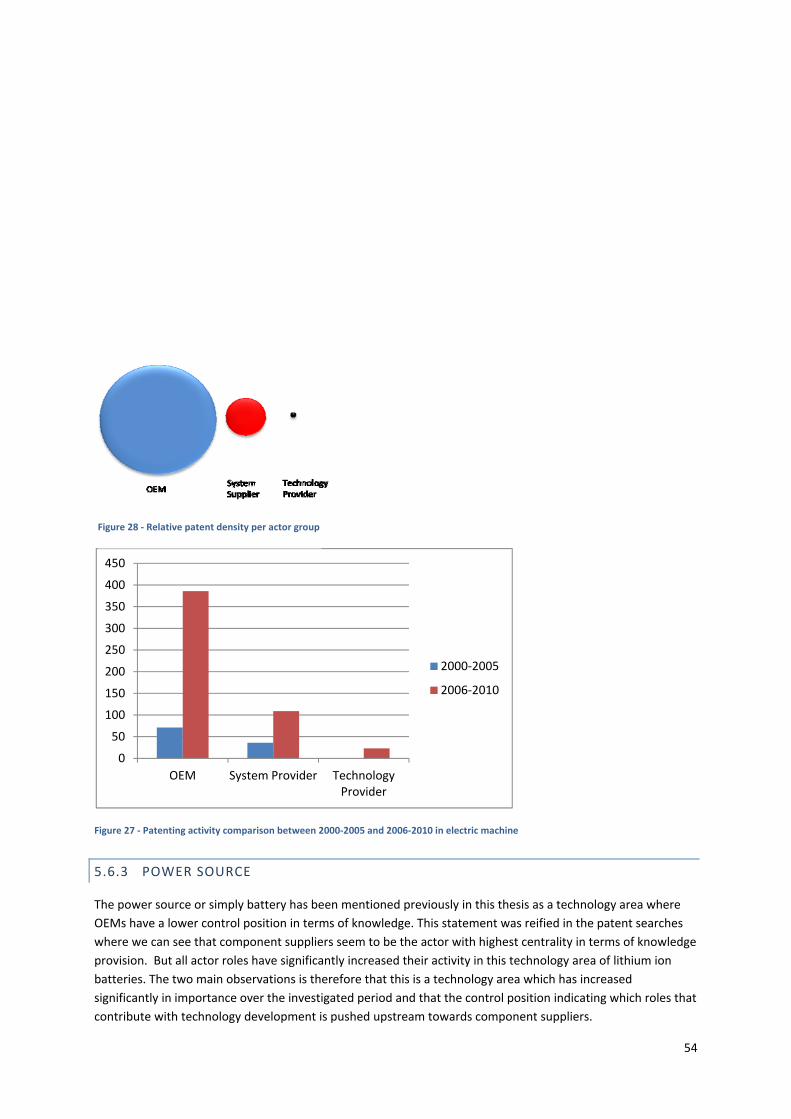
54
Figure 27 ‐ Patenting activity comparison between 2000‐2005 and 2006‐2010 in electric machine
5.6.3 POWER SOURCE
The power source or simply battery has been mentioned previously in this thesis as a technology area where
OEMs have a lower control position in terms of knowledge. This statement was reified in the patent searches
where we can see that component suppliers seem to be the actor with highest centrality in terms of knowledge
provision. But all actor roles have significantly increased their activity in this technology area of lithium ion
batteries. The two main observations is therefore that this is a technology area which has increased
significantly in importance over the investigated period and that the control position indicating which roles that
contribute with technology development is pushed upstream towards component suppliers.
0
50
100
150
200
250
300
350
400
450
OEM System Provider Technology Provider
2000‐2005
2006‐2010
Figure 28 ‐ Relative patent density per actor group
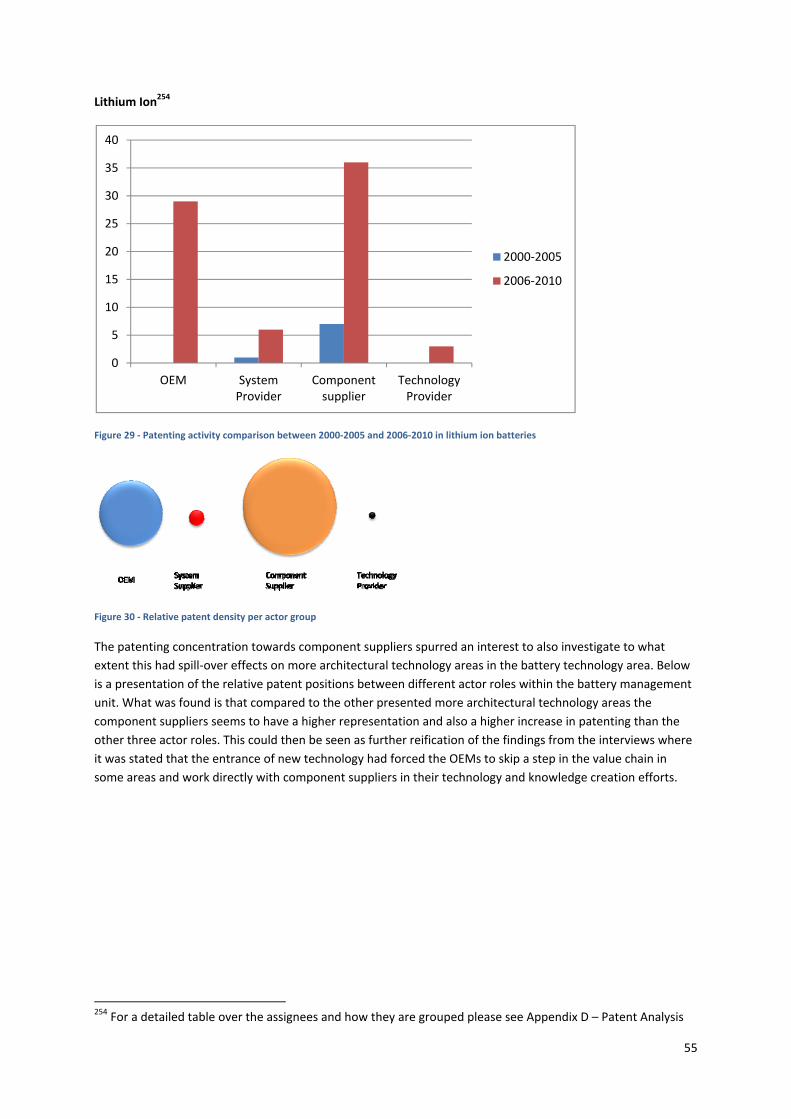
55
Lithium Ion254
Figure 29 ‐ Patenting activity comparison between 2000‐2005 and 2006‐2010 in lithium ion batteries
Figure 30 ‐ Relative patent density per actor group
The patenting concentration towards component suppliers spurred an interest to also investigate to what
extent this had spill‐over effects on more architectural technology areas in the battery technology area. Below
is a presentation of the relative patent positions between different actor roles within the battery management
unit. What was found is that compared to the other presented more architectural technology areas the
component suppliers seems to have a higher representation and also a higher increase in patenting than the
other three actor roles. This could then be seen as further reification of the findings from the interviews where
it was stated that the entrance of new technology had forced the OEMs to skip a step in the value chain in
some areas and work directly with component suppliers in their technology and knowledge creation efforts.
254 For a detailed table over the assignees and how they are grouped please see Appendix D – Patent Analysis
0
5
10
15
20
25
30
35
40
OEM System Provider
Component supplier
Technology Provider
2000‐2005
2006‐2010
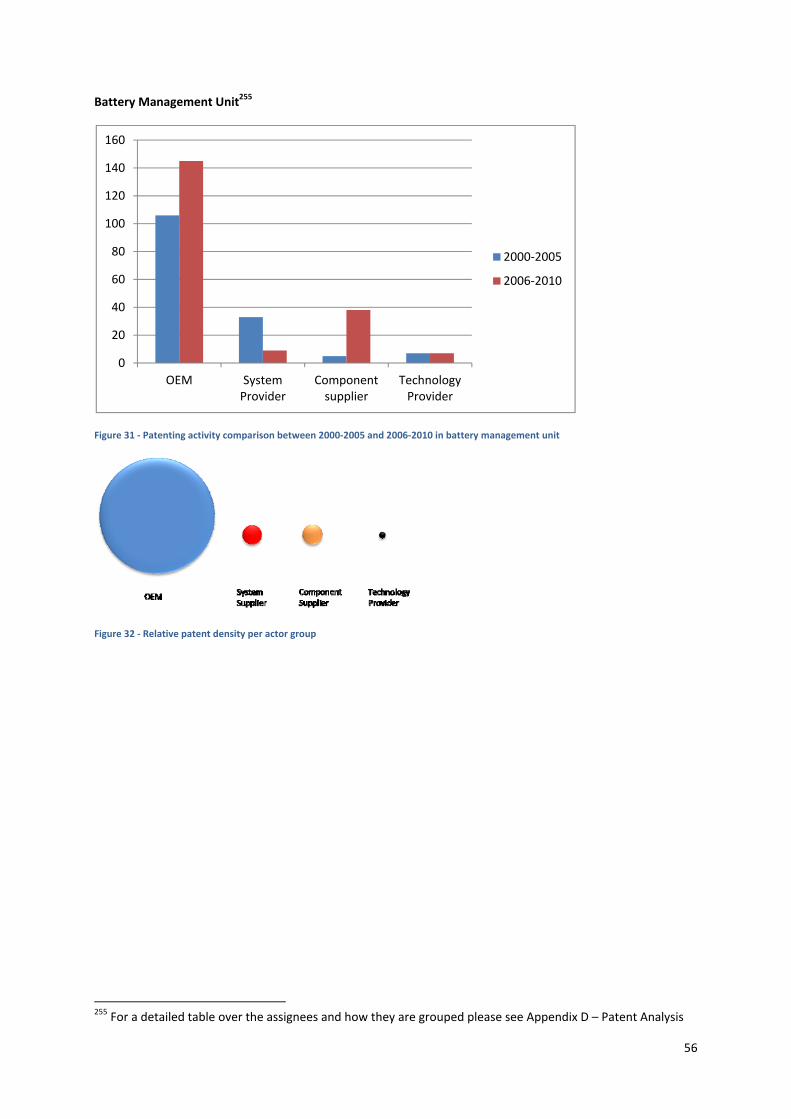
56
Battery Management Unit255
Figure 31 ‐ Patenting activity comparison between 2000‐2005 and 2006‐2010 in battery management unit
Figure 32 ‐ Relative patent density per actor group
255 For a detailed table over the assignees and how they are grouped please see Appendix D – Patent Analysis
0
20
40
60
80
100
120
140
160
OEM System Provider
Component supplier
Technology Provider
2000‐2005
2006‐2010
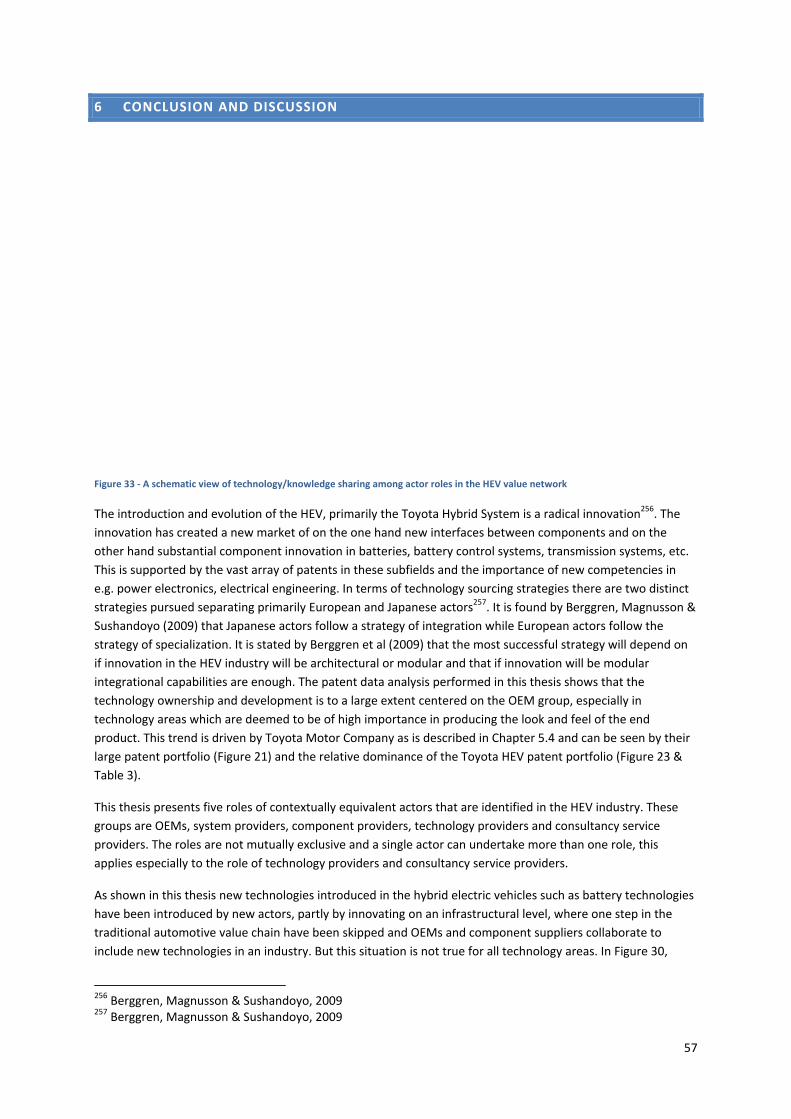
57
6 CONCLUSION AND DISCUSSION
Figure 33 ‐ A schematic view of technology/knowledge sharing among actor roles in the HEV value network
The introduction and evolution of the HEV, primarily the Toyota Hybrid System is a radical innovation256. The
innovation has created a new market of on the one hand new interfaces between components and on the
other hand substantial component innovation in batteries, battery control systems, transmission systems, etc.
This is supported by the vast array of patents in these subfields and the importance of new competencies in
e.g. power electronics, electrical engineering. In terms of technology sourcing strategies there are two distinct
strategies pursued separating primarily European and Japanese actors257. It is found by Berggren, Magnusson &
Sushandoyo (2009) that Japanese actors follow a strategy of integration while European actors follow the
strategy of specialization. It is stated by Berggren et al (2009) that the most successful strategy will depend on
if innovation in the HEV industry will be architectural or modular and that if innovation will be modular
integrational capabilities are enough. The patent data analysis performed in this thesis shows that the
technology ownership and development is to a large extent centered on the OEM group, especially in
technology areas which are deemed to be of high importance in producing the look and feel of the end
product. This trend is driven by Toyota Motor Company as is described in Chapter 5.4 and can be seen by their
large patent portfolio (Figure 21) and the relative dominance of the Toyota HEV patent portfolio (Figure 23 &
Table 3).
This thesis presents five roles of contextually equivalent actors that are identified in the HEV industry. These
groups are OEMs, system providers, component providers, technology providers and consultancy service
providers. The roles are not mutually exclusive and a single actor can undertake more than one role, this
applies especially to the role of technology providers and consultancy service providers.
As shown in this thesis new technologies introduced in the hybrid electric vehicles such as battery technologies
have been introduced by new actors, partly by innovating on an infrastructural level, where one step in the
traditional automotive value chain have been skipped and OEMs and component suppliers collaborate to
include new technologies in an industry. But this situation is not true for all technology areas. In Figure 30,
256 Berggren, Magnusson & Sushandoyo, 2009 257 Berggren, Magnusson & Sushandoyo, 2009
58
showing that the relative patent density of component providers in lithium ion batteries is significantly larger
than in the other technology areas presented in Chapter 5.6 so it seems as if this occurrence will depend on the
technology area. Throughout the thesis three reasons for collaboration between component providers and
OEMs excluding/skipping system suppliers are found. The first is that there is a lack of suppliers where the
system suppliers have not yet mobilized the capability to handle the technology development efforts towards
the components suppliers since the new technologies are introduced by new actors. The second reason found
was that the OEMs wish to gain in‐house capabilities in some of the new technology areas introduced in the
HEV industry and therefore does not want to outsource this part of the technology development. Instead OEMs
collaborate or create joint ventures with component providers, such as the Toyota‐Panasonic joint venture
PEVE. The third reason is that some components such as the Lithium Ion batteries has existed for a couple of
years already in products with smaller size and energy demands and that actors (component providers) active
here were able to provide a leap frog in technology position for OEMs.
The HEV has not only increased the vertical scope through an inclusion of new actors but also a shift in the
responsibility of the actor roles where some technology efforts are given a higher responsibility for upstream
technology development. This can be seen in the responsibility of technology providers. In Figure 23 (although
a static picture) it can be seen how circa 30% of the assignees of the top 100 cited HEV patents are technology
providers showing their relative importance in creating and introducing new technologies. The responsibility of
the component suppliers in battery development seems to have changed in much the same way. This actor
group has a higher patenting activity (see Figure 30) compared to the equivalent actor roles in other technology
areas pointing out that this group plays an important role in introducing and creating battery technologies. An
interesting development is how OEMs enter as technology providers and, primarily through licensing, provide
technologies to both upstream and downstream actors. One example found in this thesis being Toyota who
licenses HEV technologies to both suppliers and competitors (see Figure 17 & Figure 19) but also the GHC R&D
collaboration is an example of a shift in roles and relationships between actors. Nonetheless, it is unclear if this
is an effect of the blurring of the concept of the value chain in the networked economy258 or an evolution of the
actor roles in the value network or both. To conclude, both technology providers and component providers
have increased in their responsibility to create technologies previously done by OEMs or component providers.
In terms of exploitation of technology and the relationships in which this takes place the relationships take
different structural forms. The study performed in this thesis did not reveal a particular trend in the setup of
the relational infrastructure and many different forms are used e.g. joint ventures like PEVE between Toyota
and Panasonic, research collaborations as Global Hybrid Cooperative and numerous other examples. The
differences in setup also mean that the infrastructure for transfer and sharing of technology is different. Hence,
I could not find specific technology exploitation trends and on actor group level it rather seemed to be situation
and technology dependent. A new type of relationship that was found was where electric utility companies
enter as stakeholders in the HEV industry and collaborate with primarily OEMs.
The knowledge base and vertical scope of the HEV industry was represented by a technology tree. The division
of the industry into distinct technology areas enabled me to analyze the dynamics of an industry where the
different branches represent different knowledge areas that are entering or leaving the industry knowledge
base. Each branch will be in different modes of integration of specialization. I.e. that powertrain control system
is in the HEV in an integration phase and the battery and power source technologies are in a specialization
phase. This has strategic implications for actors wanting to succeed in the industry since it can provide insights
to where we need to be internally strong to gain a favorable position in the value network and where we need
to be good at gaining access to external knowledge to gain the sought for position in the value network. In an
era of open innovation described in the introduction to this thesis it becomes a strategic implication to know in
which areas innovation is sourced primarily from inside the firm and when it is sourced in collaboration with
partners. This knowledge could then contribute to efforts of creating an efficient and agile R&D function.
258 Kotler, 2009
59
Therefore, adding to the geographic and actor group aspects of technology sourcing it is also dependent on
which technology area we study and success in technology sourcing strategy could therefore be dependent on
knowledge about the sourcing strategy on different levels in the technology tree employed in an industry.
When analyzing the HEV industry from a technology development perspective one can see that there are
different technology sourcing strategies but there are also common elements shared by many actors regarding
a few technology areas in the HEV industry. What was found was that when considering technology sourcing
strategies one first have to analyze whether the technology is key or detrimental to the product as such, the
HEV system. What I find here is that the strategy applied is tightly linked to the role of the HEV actor. For the
OEMs energy source technologies are unlikely to be sourced in‐house but are rather accessed through
partnerships or joint‐ventures. The same strategy is often applied to the electric motor even though the patent
data and data from the interviews were not totally coherent. The control and managements system as opposed
to energy source or electric motors is generally not a technology development that will be outsourced since it
provides the vehicle with some key characteristics and needs to work with many other key parts of the HEV
which makes it harder to outsource this technology development. This also means that the OEM needs to have
some level of knowledge about the technology that is in‐sourced to be able to use it. Hence, some knowledge
must reside inside the company but product development and research might be done outside of the
boundaries of the firm. It appears to be so that one must consider key technologies, key competencies and
access to both of them when evaluating the technology position, sourcing and exploitation strategy of a firm.
When considering the technology network from the three perspectives of centrality, centralization and inter‐
block relations there is no doubt that Toyota through the introduction of the first HEV technologies became a
highly central firm in the HEV value network and that OEMs in general have a high centrality. This also provides
a high centralization of the technology network but where as previously stated the European HEV industry has
a lower centralization compared to the Japanese HEV industry. The integration strategy pursued and the high
centralization might be an enabling factor of the HEV industry as such. According to Raynor & Christiansen
(2002) the integrated firm will be in a better control position. This will provide an actor with the ability to
develop and deploy new technologies and the most vertically integrated firm holds the best position to develop
interdependent technological architectures259. The centralization of the industry therefore seems to be an
enabling factor for introducing architectural technologies, in our case the studied HEV technologies. But on the
other hand the frequency and density of interactions together with knowledge openness are detrimental for
the generation, utilization and distribution of knowledge260. This would mean that many, highly interlinked
actors, contribute to higher generation, utilization and distribution of knowledge. In the case of the HEV
industry, areas where new actors have sprung up as powerful players such as within power source would
contribute to both the generation and exploitation of knowledge. By finding areas of specialization/integration
we can find in which areas the highest pace of innovation is likely to occur. Predicting where we need a position
to be able to capitalize on future innovativeness of the industry. In conclusion the HEV industry is centralized
but in a few technology areas structure loosening trends are found.
The introduction of new technologies in the HEV industry have brought a structure loosening trend to the
European HEV industry where external demands and internal limitations of firms to some extent force them to
decentralize the network structure and push technology development upstream in the value chain. This could
allow for new firms to enter the industry allowing the vertical scope to develop and evolve through the
introduction of new entrepreneurial firms. This observation could be considered to be weak but is supported
by the increase in number of technology providers in the HEV industry. Although, still few in numbers and
control position compared to the OEMs the trend is increasing and as can be seen in the example of Paice
Corporation and the patent analysis where technology providers in many cases hold a powerful technology
position even though being small in terms of patent portfolio and firm size. Therefore the structure loosening
259 Raynor & Christiansen, 2002 260 Caloghirou et al., 2004
60
trends could increase the number of firms even more since some areas of technology not seems to have
reached a dominant design or technology standards.
The three concepts of structure loosening, vertical scope and actor roles seems to be interrelated and as the
automotive industry move towards a transition towards becoming more knowledge centered one could expect
that a change in the vertical scope brought by the introduction of new technologies will change the definitions
of upstream and downstream roles in terms of technology development and then also have a structure
loosening effect of the technology value network of the industry. Based on the findings in this thesis my
hypothesis is that the challenges reside in the industry’s ability to create transactional norms where knowledge
can be transferred between firms. If the possibility to source modular innovation will not exist in the HEV
industry the specialization trajectory cannot prevail and structure reinforcing effects will be the most favorable
alternative. Hence, looking forward I believe it is uncertain whether a structure loosening or reinforcing trend
will be dominant. The findings in this thesis suggest that the trend will differ depending the technology area in
question.
The interviews point both towards increasing costs in production and R&D and that it is the integration and
“consumer” experience features that are most important for automotive OEMs and especially in terms of HEVs.
Although, looking forward it seems likely that segments of the automotive industry will adhere to the
electrification trend and commercialize e.g. heavy duty HEVs. When entering into this new field there are a
number of learning’s that can be made from the light weight HEV industry evolution. In the light weight HEV
industry Toyota seems to have been very successful as a first mover in technology and has through this been
able to set the technology trajectory and also been able to position themselves in a position of high centrality
in the technology value network. This position in the value network has provided Toyota with the chance to
enter as a technology provider in the industry and successfully capitalize on this position. By using a high focus
on in‐house sourcing of innovation Toyota has further increased the centrality of the value network around
them whereas European actors have reduced their centrality in a structure loosening manner. OEMs in heavy
duty HEV industry seem to be facing two alternative roads providing diverging opportunities and risks.
Furthermore, the knowledge base and vertical scope increase provide opportunities for new actors introducing
new technologies and for new actors groups in the value network to change the network structure and gaining
a new position in the network of actors providing technology.
6.1 FUTURE RESEARCH
For future research it would be interesting to see research done concerning individual firms putting them into
the context of groups of firms that provide a framework for how to strategically act/interact with other actors
to provide a successful technology sourcing. Since, commercial success often is more detrimental than
technological success, at least in the short run it would also be interesting to see a study focusing the
commercial gains by choosing position in the value network and technology sourcing strategy. This would then
probably need an even more qualitative approach the method applied in this thesis, focusing on making a deep
dive into a few specific companies in the HEV industry. Another interesting continuation of this thesis would be
to look at the automotive industry at large and see how the technology creation network has evolved here and
then compare this to one or several other industries. Preferably these industries could be knowledge or
information centered industries such as IT, biotechnology or the alike. This could be the starting point for
finding general trends of technology sourcing in the knowledge economy and industry specific trends brought
by the knowledge economy. If this research is done it would be interesting to see if structure loosening trends
in an open innovation era reduce companies’ ability to deploy architectural innovation and if actors can change
mature industries from within by introducing new markets within markets such as the HEV industry within the
automotive industry. Is it so that by understanding the underlying structures in an industry that we can predict
where these new markets will arise?
61
7 REFERENCES
Automotive News Europe (2007) Supplement, Vol. 12, p15‐15. Section: Powertrain
Barley, S. R. (1986) Technology as an occasion for structuring: Evidence from observations of CT scanners and the social order of radiology departments, Administrative Science Quarterly, Vol. 21, pp. 78‐108.
Basberg, B. L. (1987), Patent and the Measurement of Technological Change: A Survey of the Literature.
Research Policy, Vol.16, pp.131‐141
Benkler, Y. The Wealth of Networks. Yale University Press. 2006.
Bennett, S. (2009) Medium/Heavy Duty Truck Engines, Fuel & Computerized Management Systems 3rd Edition.
Delmar: Clifton Park.
Berggren, C.; Magnusson, T. & Sushandoyo, D. (2009) Hybrids, diesel or both? The forgotten technological
competition for sustainable solutions in the global automotive industry. International Journal of Automotive
Technology and Management. Vol. 9, No. 2, pp.148‐173.
Biggam, J., (2008), Succeeding with your master's dissertation, Maidenhead: McGrawHill.
Blaxill, M & Eckhardt, R (2009) The invisible edge: taking your strategy to the next level using intellectual property. Portfolio Hardcover: New York.
Blankenburg Holm, D; Eriksson, K & Johansson, J (1999) Creating value through mutual commitment to business
network relationships. Strategic Manegement Journal, Vol. 20, pp.467‐486.
Blaxter, L., Hughes, C. and Tight, M., (2006) How to research, Buckingham ; Bristol, PA, USA : Open University
Press.
Bunn, D.W et al (2010) Vertical integration and market power: A model‐based analysis of restructuring in the
Korean electricity market, Energy Policy, vol. 38, pp 3710‐3716.
Burkhardt, M. E. & Brass D. J. (1990). Changing patterns or patterns of change: The effect of a change in technology on social network structure and power. Administrative Science Quarterly, Vol. 35, pp. 104‐127.
Caloghirou, Y., Kastelli, I., Tsakanikas, A. (2004) Internal capabilities and external knowledge sources:
complements or substitutes for innovative performance? Technovation. Vol.24, No.1, pp.29–39.
Carpenter, M., Narin, F. (1981). Citation Rates to Technologically Important Patents. World Patent Information,
Vol.3, No.4, pp.160‐163
Chanaron, J‐J. & Teske, J. (2007) Hybrid vehicles: a temporary step. International Journal of Automotive
Technology and Management. Vol. 7, No. 4, pp.268‐288.
Chesbrough, H.W. (2006) Open Innovation: the new imperative for creating and profiting from technology.
Harvard school press. Boston.
Chesbrough, H.W., Teece, D.J. (1996) When is virtual virtuous: organizing for innovation. Harvard Business
Review Vol.74, No.1, pp.65–73.
Christensen, C.M. (1997). The innovator's dilemma: when new technologies cause great firms to fail. Harvard
Business Press
Coase, R. (1990) The new institutional economics. American Economic Review. Vol.88, No.2, pp.72‐74.
62
Cohen, W., Levinthal, D., 1990. Absorptive capacity: a new perspective on learning and innovation.
Administrative Science Quarterly Vol.35, No.1, pp. 128–152.
David, P. and Foray, D. “Economic Fundamentals of the Knowledge Society.” Technical Report. Stanford University. 2002.
De Soto, H. (2000) The mystery of capital: why capitalism triumphs in the West and fail everywhere else. Basic
Books. New York.
Drucker, P. “The Age of Social Transformation.” The Atlantic. May 1994. pp 16‐34.
Fuchs, G & Shapira, P (2005) Rethinking Regional Innovation and Change ‐ Path Dependency or Regional
Breakthrough? Economics of Science, Technology and Innovation, Vol. 30
Gartner, W. (2001) Is There an Elephant in Entrepreneurship? Blind Assumptions in Theory Development.
Entrepreneurship Theory and Practice Vol. 25, No. 4, pp. 27–39.
Gassmann, O. (2006) Opening up the innovation process: towards an agenda. R&D Management, Vol. 36, pp.223–228. Hagedoorn, J (2002) Inter‐firm R&D partnerships: an overview of major trends and patterns since 1960. Research Policy vol.31, pp.477–492
Håkansson, H. & Snehota, I. (2006) No business is an island: The network concept of business strategy.
Scandinavian Journal of Management. Vol.22, pp.256‐270.
Hill, C.W.L., Rothaermel, F. (2003) The performance of incumbent firms in the face of radical technological
innovation. Academy of Management Review Vol. 28, No. 2, pp. 257–274.
Hodkinson, R. (2001) Lightweight electric/hybrid vehicle design. Butterworth‐Heinemann: Oxford.
http://www.just‐auto.com/news/psa‐to‐debut‐worlds‐first‐diesel‐hybrid‐production‐car_id105579.aspx.
Accessed: 2011‐03‐17
Husain, I. (2010) Electric and hybrid vehicles [electronic resource]: design fundamentals. Boca Raton: Taylor &
Francis
Hybrid electric vehicles http://www.etsap.org/E‐techDS/PDF/T04_HEVs_final_18Jun10_GS_OK_NH.pdf
Ili, S.; Albers, A. & Miller, S. (2010) Open innovation in the automotive industry. R&D Management, vol. 40, pp.246‐255
IMAP (2010) Automotive and Components Global Report 2010
Jacobides, M.G., Winter, S.G. (2005) The co‐evolution of capabilities and transaction costs: explaining the
institutional structure of production. Strategic Management Journal Vol.26, No.5, pp.395–413.
Jonasson, K. (2005) Control of Hybrid Electric Vehicles with Diesel Engines. Media Tryck, Lund University: Lund
Kim, C & Mauborgne, R (1999) Strategy, Value Innovation, and the knowledge economy, Sloane Management review, pp.41‐54
Kotler. P et al (2009) Marketing management, Pearson: Essex
Li, H‐L (2010) Vertical integration and innovative performance: The effects of external knowledge sourcing
modes. Technovation, Vol. 30, pp.401‐410
63
Link, A. & Siegel, D. (2007) Innovation, Entrepreneurship and Technological Change. Oxford University Press,
New York
Liu, Y. (2007) IPR and Development in a Knowledge Economy: An Overview of Issues. UCB iSchool Report.
School of Information, UC Berkeley.
Lloyd, M. & Blows, J. (2009) Who holds the power? Lessons from hybrid car innovation for clean technologies.
www.griffithhack.com.au Accessed: 2011‐03‐17
Madhavan, R.; Koka, B.R.; Prescott, J.E (1998) Networks in Transition: How Industry Events (Re)Shape Interfirm Relationships. Strategic Management Journal, Vol. 19, No. 5, pp. 439‐459
Malerba, F., Nelson, R., Orsenigo, L., Winter, S. (2008) Vertical integration and disintegration of computer firms:
a history‐friendly model of the coevolution of the computer and semiconductor industries. Industrial and
Corporate Change Vol. 17, No.2, pp.197–231.
Malterud, M. (2001) Qualitative research: standards, challenges, and guidelines. The lancet Vol. 358 pp. 483‐
488
Momoh, O.D., Omoigui, M.O. (2009) An overview of hybrid electric vehicle technology. 5th IEEE Vehicle Power
and Propulsion Conference, VPPC '09 , art. no. 5289703, pp. 1286‐1292
Monteverde, K. (1995) Technical dialog as an incentive for vertical integration in the semiconductor industry.
Management Science Vol.41, No.10, pp.1624–1638.
Nicholls‐Nixon, C.L., Woo, C.Y. (2003) Technology sourcing and output of established firms in a regime of
encompassing technological change. Strategic Management Journal Vol.24, No.7, pp.651–666.
Norman, R. & Ramirez, R. (1994) Designing Interactive Strategy: From the Value Chain to the Value
Constellation. Harvard Business Review Vol.71, No.4, pp. 65‐77
Ödman, P‐J (2007). Tolkning, förståelse, vetande – Hermeneutik i teori och praktik. 2 uppl. Stockholm:
Nordstedts Akademiska Förlag
Patel, R., Davidson, B., (1991) Forskningsmetodikens grunder Third edition, Lund: Studentlitteratur.
Peppard, J. & Rylander, A. (2006) From Value Chain to Value Network: Insights for Mobile Operators. European
Management Journal Vol. 24, Nos. 2–3, pp. 128–141
Petrusson, U. (2004) Intellectual property and entrepreneurship: creating wealth in an intellectual value chain.
Center for Intellectual Property Studies.
Phillips, P. P. and Stawarski, C. A., (2008) Data Collection: Planning for and Collecting All Types of Data, Pfeiffer
Pohl, H. (2010) Radical innovation: Management and policy for electric and hybrid electric vehicle development.
Doktorsavhandling vid Chalmers Tekniska Högskola: Gothenburg.
Porter, M. (1985) Competitive Advantage: Creating and Sustaining Superior Performance. Free Press, New York.
Raynor M, Christensen C. (2002) Integrate to Innovate. Deloitte Research Publication
(www.deloitte.com/research).
Shane, S. & Venkataraman, S. (2000). The promise of entrepreneurship as a field of research. Academy of
Management Review. Vol. 25, No.1, pp. 217–226.
64
Stieglitz, N (2002) Industry Dynamics and Types of Convergence: the Evolution of the Personal Digital Assistant Market in the 1990s and Beyond. http://www.druid.dk/conferences/summer2002/Abstracts/STIEGLITZ.pdf Accessed 2011‐06‐07.
Sturgeon, T. (2001) How do we define value chains and production networks? IDS Bulletin. Vol.32, No.3, pp. 9‐
18.
Veugelers, R (1997) Internal R&D expenditures and external technology sourcing. Research Policy vol.26, No.3,
pp. 303–315.
8 INTERVIEWS
Jonathan Rice, Researcher at the Fluid Dynamic Dept. Chalmers University of Technology, 2011‐03‐24
Andrew Dawkes, Researcher at the Fluid Dynamic Dept. Chalmers University of Technology, 2011‐03‐24
Gunnar Bäck, CEO EL‐Forest, 2011‐03‐29
Hans Pohl, Vinnova, 2011‐03‐29
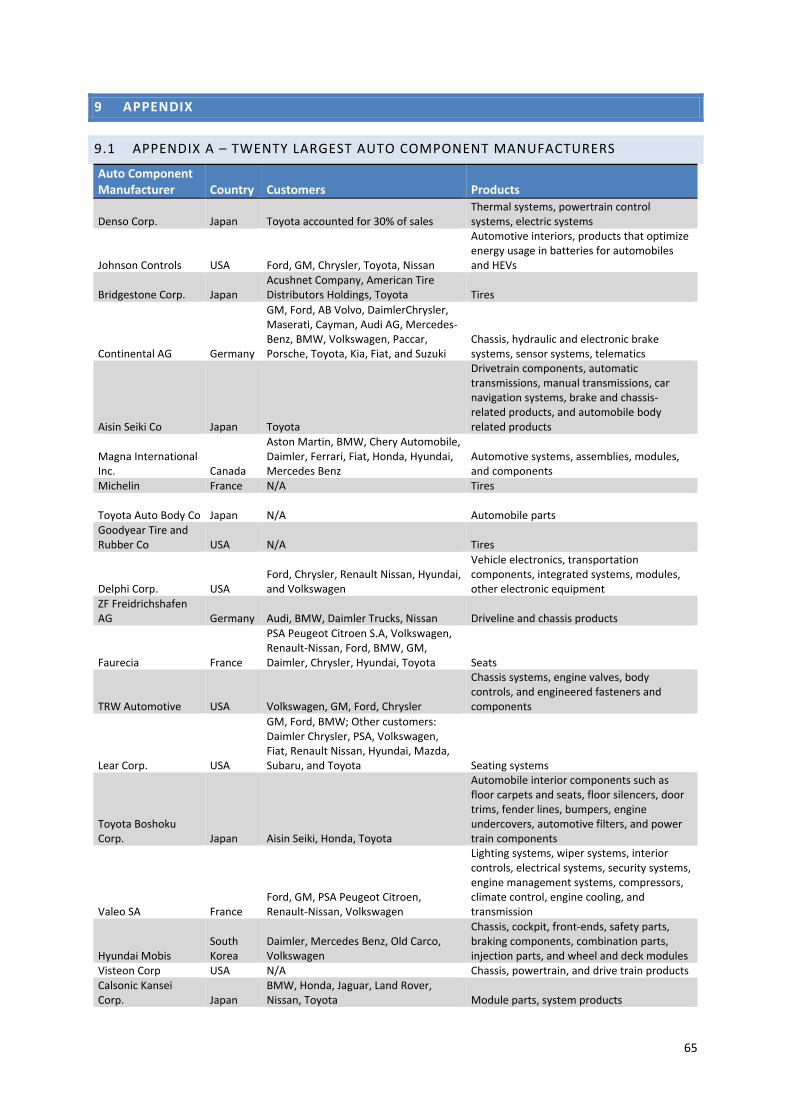
65
9 APPENDIX
9.1 APPENDIX A – TWENTY LARGEST AUTO COMPONENT MANUFACTURERS
Auto Component Manufacturer Country Customers Products
Denso Corp. Japan Toyota accounted for 30% of sales Thermal systems, powertrain control systems, electric systems
Johnson Controls USA Ford, GM, Chrysler, Toyota, Nissan
Automotive interiors, products that optimize energy usage in batteries for automobiles and HEVs
Bridgestone Corp. Japan Acushnet Company, American Tire Distributors Holdings, Toyota Tires
Continental AG Germany
GM, Ford, AB Volvo, DaimlerChrysler, Maserati, Cayman, Audi AG, Mercedes‐Benz, BMW, Volkswagen, Paccar, Porsche, Toyota, Kia, Fiat, and Suzuki
Chassis, hydraulic and electronic brake systems, sensor systems, telematics
Aisin Seiki Co Japan Toyota
Drivetrain components, automatic transmissions, manual transmissions, car navigation systems, brake and chassis‐related products, and automobile body related products
Magna International Inc. Canada
Aston Martin, BMW, Chery Automobile, Daimler, Ferrari, Fiat, Honda, Hyundai, Mercedes Benz
Automotive systems, assemblies, modules, and components
Michelin France N/A Tires
Toyota Auto Body Co Japan N/A Automobile parts Goodyear Tire and Rubber Co USA N/A Tires
Delphi Corp. USA Ford, Chrysler, Renault Nissan, Hyundai, and Volkswagen
Vehicle electronics, transportation components, integrated systems, modules, other electronic equipment
ZF Freidrichshafen AG Germany Audi, BMW, Daimler Trucks, Nissan Driveline and chassis products
Faurecia France
PSA Peugeot Citroen S.A, Volkswagen, Renault‐Nissan, Ford, BMW, GM, Daimler, Chrysler, Hyundai, Toyota Seats
TRW Automotive USA Volkswagen, GM, Ford, Chrysler
Chassis systems, engine valves, body controls, and engineered fasteners and components
Lear Corp. USA
GM, Ford, BMW; Other customers: Daimler Chrysler, PSA, Volkswagen, Fiat, Renault Nissan, Hyundai, Mazda, Subaru, and Toyota Seating systems
Toyota Boshoku Corp. Japan Aisin Seiki, Honda, Toyota
Automobile interior components such as floor carpets and seats, floor silencers, door trims, fender lines, bumpers, engine undercovers, automotive filters, and power train components
Valeo SA France Ford, GM, PSA Peugeot Citroen, Renault‐Nissan, Volkswagen
Lighting systems, wiper systems, interior controls, electrical systems, security systems, engine management systems, compressors, climate control, engine cooling, and transmission
Hyundai Mobis South Korea
Daimler, Mercedes Benz, Old Carco, Volkswagen
Chassis, cockpit, front‐ends, safety parts, braking components, combination parts, injection parts, and wheel and deck modules
Visteon Corp USA N/A Chassis, powertrain, and drive train products Calsonic Kansei Corp. Japan
BMW, Honda, Jaguar, Land Rover, Nissan, Toyota Module parts, system products

66
Sumitomo Electric Industries Ltd Japan Toyota
Wire harnesses, rubber cushions, hoses for automobiles, automobile electrical parts, and others
Table 3 ‐ Short description of the 20 largest Auto Component Manufacturers (Source: IMAP 2010)
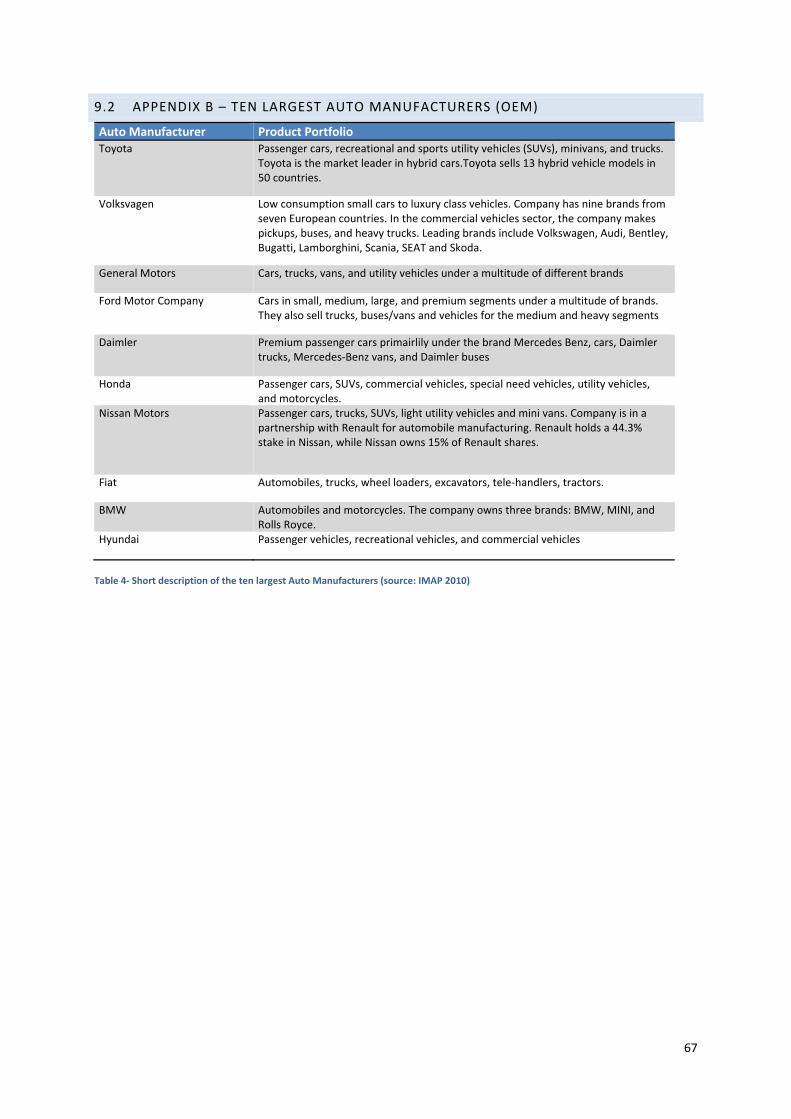
67
9.2 APPENDIX B – TEN LARGEST AUTO MANUFACTURERS (OEM)
Auto Manufacturer Product PortfolioToyota Passenger cars, recreational and sports utility vehicles (SUVs), minivans, and trucks.
Toyota is the market leader in hybrid cars.Toyota sells 13 hybrid vehicle models in 50 countries.
Volksvagen Low consumption small cars to luxury class vehicles. Company has nine brands from seven European countries. In the commercial vehicles sector, the company makes pickups, buses, and heavy trucks. Leading brands include Volkswagen, Audi, Bentley, Bugatti, Lamborghini, Scania, SEAT and Skoda.
General Motors Cars, trucks, vans, and utility vehicles under a multitude of different brands
Ford Motor Company Cars in small, medium, large, and premium segments under a multitude of brands. They also sell trucks, buses/vans and vehicles for the medium and heavy segments
Daimler Premium passenger cars primairlily under the brand Mercedes Benz, cars, Daimler trucks, Mercedes‐Benz vans, and Daimler buses
Honda Passenger cars, SUVs, commercial vehicles, special need vehicles, utility vehicles, and motorcycles.
Nissan Motors Passenger cars, trucks, SUVs, light utility vehicles and mini vans. Company is in a partnership with Renault for automobile manufacturing. Renault holds a 44.3% stake in Nissan, while Nissan owns 15% of Renault shares.
Fiat Automobiles, trucks, wheel loaders, excavators, tele‐handlers, tractors.
BMW Automobiles and motorcycles. The company owns three brands: BMW, MINI, and Rolls Royce.
Hyundai Passenger vehicles, recreational vehicles, and commercial vehicles
Table 4‐ Short description of the ten largest Auto Manufacturers (source: IMAP 2010)
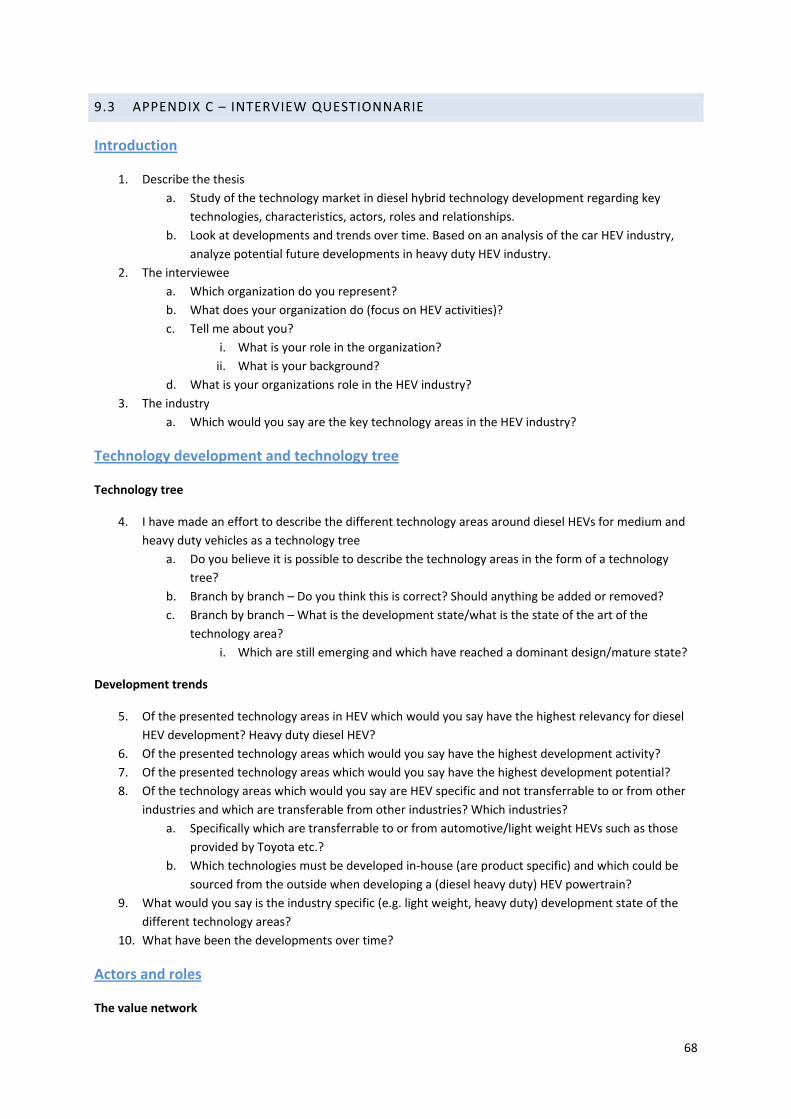
68
9.3 APPENDIX C – INTERVIEW QUESTIONNARIE
Introduction
1. Describe the thesis
a. Study of the technology market in diesel hybrid technology development regarding key
technologies, characteristics, actors, roles and relationships.
b. Look at developments and trends over time. Based on an analysis of the car HEV industry,
analyze potential future developments in heavy duty HEV industry.
2. The interviewee
a. Which organization do you represent?
b. What does your organization do (focus on HEV activities)?
c. Tell me about you?
i. What is your role in the organization?
ii. What is your background?
d. What is your organizations role in the HEV industry?
3. The industry
a. Which would you say are the key technology areas in the HEV industry?
Technology development and technology tree
Technology tree
4. I have made an effort to describe the different technology areas around diesel HEVs for medium and
heavy duty vehicles as a technology tree
a. Do you believe it is possible to describe the technology areas in the form of a technology
tree?
b. Branch by branch – Do you think this is correct? Should anything be added or removed?
c. Branch by branch – What is the development state/what is the state of the art of the
technology area?
i. Which are still emerging and which have reached a dominant design/mature state?
Development trends
5. Of the presented technology areas in HEV which would you say have the highest relevancy for diesel
HEV development? Heavy duty diesel HEV?
6. Of the presented technology areas which would you say have the highest development activity?
7. Of the presented technology areas which would you say have the highest development potential?
8. Of the technology areas which would you say are HEV specific and not transferrable to or from other
industries and which are transferable from other industries? Which industries?
a. Specifically which are transferrable to or from automotive/light weight HEVs such as those
provided by Toyota etc.?
b. Which technologies must be developed in‐house (are product specific) and which could be
sourced from the outside when developing a (diesel heavy duty) HEV powertrain?
9. What would you say is the industry specific (e.g. light weight, heavy duty) development state of the
different technology areas?
10. What have been the developments over time?
Actors and roles
The value network
69
1. How would you describe the value network of the HEV industry? (In general but focus in on
powertrain developments and actors)
a. What roles can an actor take on (with focus on technology developers)?
i. How do the roles differ between OEM/1st tier/2nd tier etc.
2. Which key technology actors would you say exists on every tier‐level/role in HEV powertrain
development?
a. Technology providers?
b. OEMs?
c. Component providers?
d. System providers?
e. Consultancy services?
3. What have been the developments over time?
a. Have new roles emerged or new actors entered the market?
Roles 1. Which are the key actors in the industry?
a. Who do you have to relate to in order to be able to act in the industry:
i. Technology wise?
ii. IPR wise?
iii. Skills wise?
b. What is the relative importance of these actors considering
i. Market share?
ii. Market or technology power?
iii. Market potential?
iv. Industry/supplier dependencies?
c. What are the barriers to freedom of action in the industry
i. Technology development and packaging?
ii. Market access?
iii. Regulatory barriers?
2. What have been the developments over time? What has changed over the last decades?
Relationships 1. What relational types exist in the industry?
a. Competitors, collaborators, suppliers, customers?
b. Alliance, Joint Ventures, Research collaborations, Governmental initiatives?
c. What are the characteristics of these relationships? What is the level of collaboration in the
relationships and the industry as a whole (for example arms‐length relationships or open
collaborations)?
d. Are there any standards or standard setting organizations (focus on HEV)?
2. How are knowledge, technology and IPRs shared in these relationships? a. Which are the norms on what to bring to the table and who gets what in a
collaboration? b. OEM power or supplier power ‐ how is technology specifications claimed and
protected? 3. What have been the developments over time? What has changed over the last decade?
Market characteristics
1. In what ways is technology transacted in the industry? a. Between what actors and what roles?

70
b. How is it transacted? Product, consultancy, license, joint development, mix? i. Product specification?
c. How is it paid for? What are the revenue streams and between whom? 2. To what extent would you estimate that the industry is open for new technology providers?
a. How set are the structures for accessing the customers/OEMs? b. How is a potential technology provider evaluated?
3. How are IPRs used? a. To protect technology? b. To share technology? c. To transact technology?
4. What have been the developments over time? What has changed over the last decade?
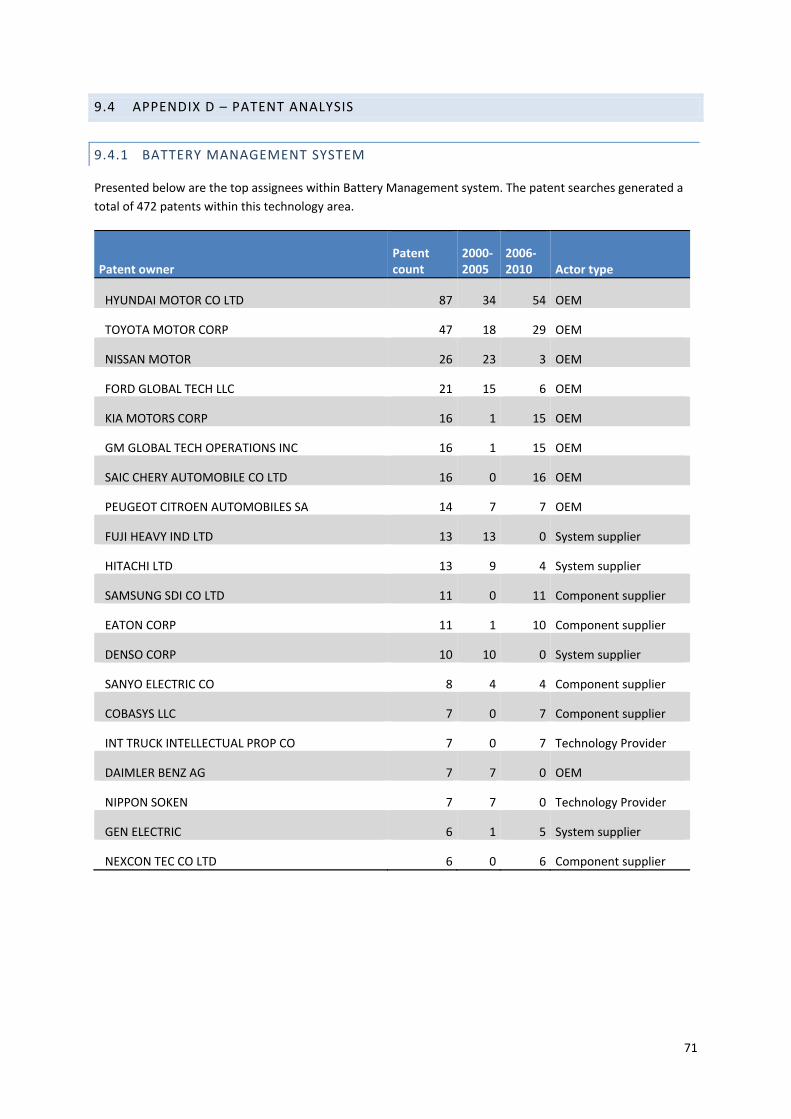
71
9.4 APPENDIX D – PATENT ANALYSIS
9.4.1 BATTERY MANAGEMENT SYSTEM
Presented below are the top assignees within Battery Management system. The patent searches generated a
total of 472 patents within this technology area.
Patent owner Patent count
2000‐2005
2006‐2010 Actor type
HYUNDAI MOTOR CO LTD 87 34 54 OEM
TOYOTA MOTOR CORP 47 18 29 OEM
NISSAN MOTOR 26 23 3 OEM
FORD GLOBAL TECH LLC 21 15 6 OEM
KIA MOTORS CORP 16 1 15 OEM
GM GLOBAL TECH OPERATIONS INC 16 1 15 OEM
SAIC CHERY AUTOMOBILE CO LTD 16 0 16 OEM
PEUGEOT CITROEN AUTOMOBILES SA 14 7 7 OEM
FUJI HEAVY IND LTD 13 13 0 System supplier
HITACHI LTD 13 9 4 System supplier
SAMSUNG SDI CO LTD 11 0 11 Component supplier
EATON CORP 11 1 10 Component supplier
DENSO CORP 10 10 0 System supplier
SANYO ELECTRIC CO 8 4 4 Component supplier
COBASYS LLC 7 0 7 Component supplier
INT TRUCK INTELLECTUAL PROP CO 7 0 7 Technology Provider
DAIMLER BENZ AG 7 7 0 OEM
NIPPON SOKEN 7 7 0 Technology Provider
GEN ELECTRIC 6 1 5 System supplier
NEXCON TEC CO LTD 6 0 6 Component supplier
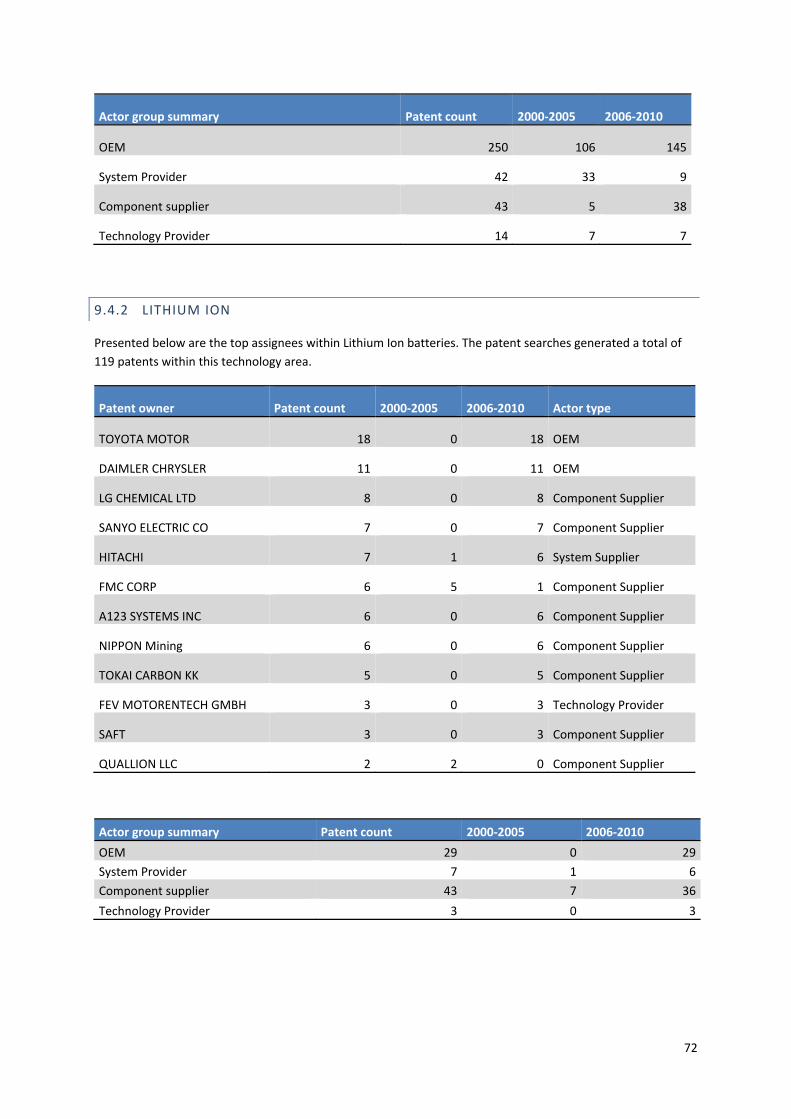
72
Actor group summary Patent count 2000‐2005 2006‐2010
OEM 250 106 145
System Provider 42 33 9
Component supplier 43 5 38
Technology Provider 14 7 7
9.4.2 LITHIUM ION
Presented below are the top assignees within Lithium Ion batteries. The patent searches generated a total of
119 patents within this technology area.
Patent owner Patent count 2000‐2005 2006‐2010 Actor type
TOYOTA MOTOR 18 0 18 OEM
DAIMLER CHRYSLER 11 0 11 OEM
LG CHEMICAL LTD 8 0 8 Component Supplier
SANYO ELECTRIC CO 7 0 7 Component Supplier
HITACHI 7 1 6 System Supplier
FMC CORP 6 5 1 Component Supplier
A123 SYSTEMS INC 6 0 6 Component Supplier
NIPPON Mining 6 0 6 Component Supplier
TOKAI CARBON KK 5 0 5 Component Supplier
FEV MOTORENTECH GMBH 3 0 3 Technology Provider
SAFT 3 0 3 Component Supplier
QUALLION LLC 2 2 0 Component Supplier
Actor group summary Patent count 2000‐2005 2006‐2010
OEM 29 0 29
System Provider 7 1 6
Component supplier 43 7 36
Technology Provider 3 0 3
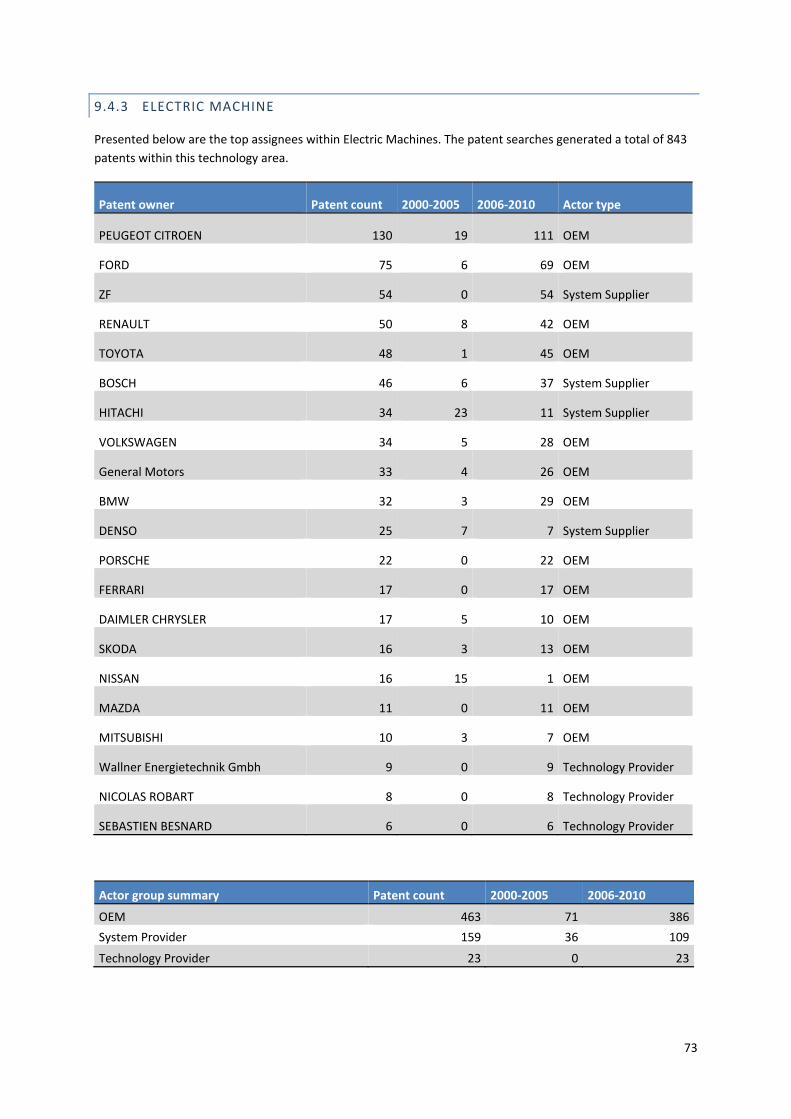
73
9.4.3 ELECTRIC MACHINE
Presented below are the top assignees within Electric Machines. The patent searches generated a total of 843
patents within this technology area.
Patent owner Patent count 2000‐2005 2006‐2010 Actor type
PEUGEOT CITROEN 130 19 111 OEM
FORD 75 6 69 OEM
ZF 54 0 54 System Supplier
RENAULT 50 8 42 OEM
TOYOTA 48 1 45 OEM
BOSCH 46 6 37 System Supplier
HITACHI 34 23 11 System Supplier
VOLKSWAGEN 34 5 28 OEM
General Motors 33 4 26 OEM
BMW 32 3 29 OEM
DENSO 25 7 7 System Supplier
PORSCHE 22 0 22 OEM
FERRARI 17 0 17 OEM
DAIMLER CHRYSLER 17 5 10 OEM
SKODA 16 3 13 OEM
NISSAN 16 15 1 OEM
MAZDA 11 0 11 OEM
MITSUBISHI 10 3 7 OEM
Wallner Energietechnik Gmbh 9 0 9 Technology Provider
NICOLAS ROBART 8 0 8 Technology Provider
SEBASTIEN BESNARD 6 0 6 Technology Provider
Actor group summary Patent count 2000‐2005 2006‐2010
OEM 463 71 386
System Provider 159 36 109
Technology Provider 23 0 23
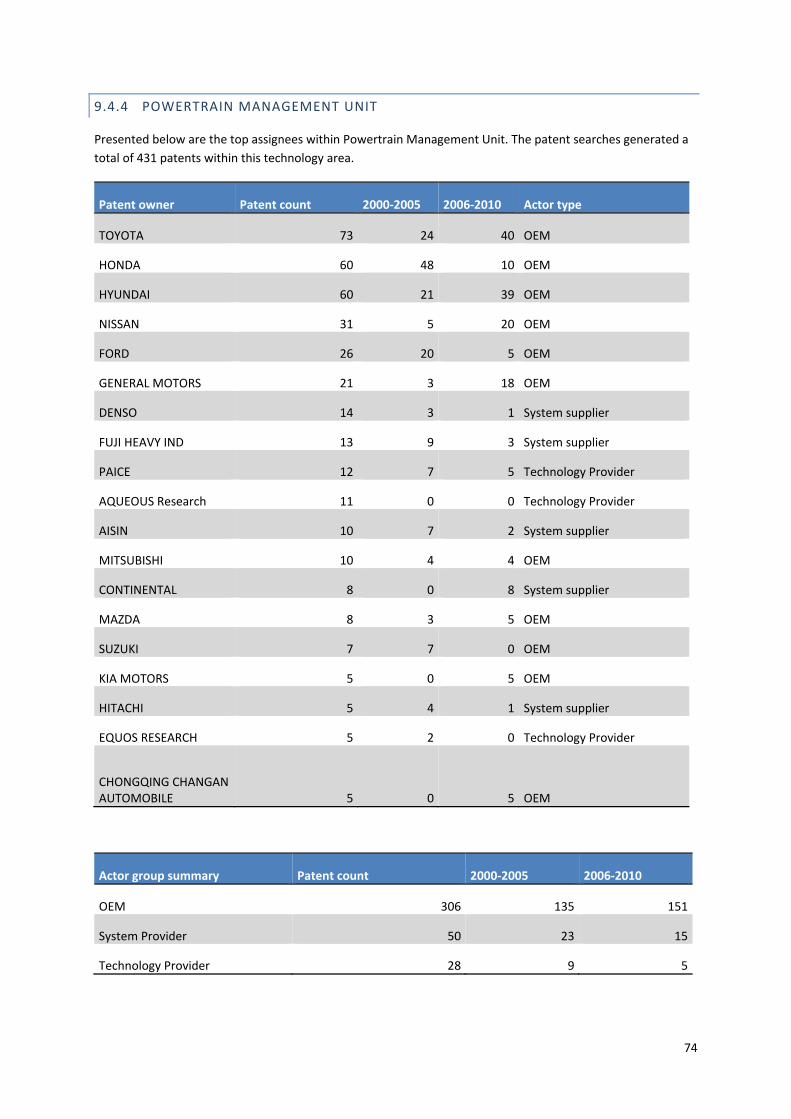
74
9.4.4 POWERTRAIN MANAGEMENT UNIT
Presented below are the top assignees within Powertrain Management Unit. The patent searches generated a
total of 431 patents within this technology area.
Patent owner Patent count 2000‐2005 2006‐2010 Actor type
TOYOTA 73 24 40 OEM
HONDA 60 48 10 OEM
HYUNDAI 60 21 39 OEM
NISSAN 31 5 20 OEM
FORD 26 20 5 OEM
GENERAL MOTORS 21 3 18 OEM
DENSO 14 3 1 System supplier
FUJI HEAVY IND 13 9 3 System supplier
PAICE 12 7 5 Technology Provider
AQUEOUS Research 11 0 0 Technology Provider
AISIN 10 7 2 System supplier
MITSUBISHI 10 4 4 OEM
CONTINENTAL 8 0 8 System supplier
MAZDA 8 3 5 OEM
SUZUKI 7 7 0 OEM
KIA MOTORS 5 0 5 OEM
HITACHI 5 4 1 System supplier
EQUOS RESEARCH 5 2 0 Technology Provider
CHONGQING CHANGAN AUTOMOBILE 5 0 5 OEM
Actor group summary Patent count 2000‐2005 2006‐2010
OEM 306 135 151
System Provider 50 23 15
Technology Provider 28 9 5
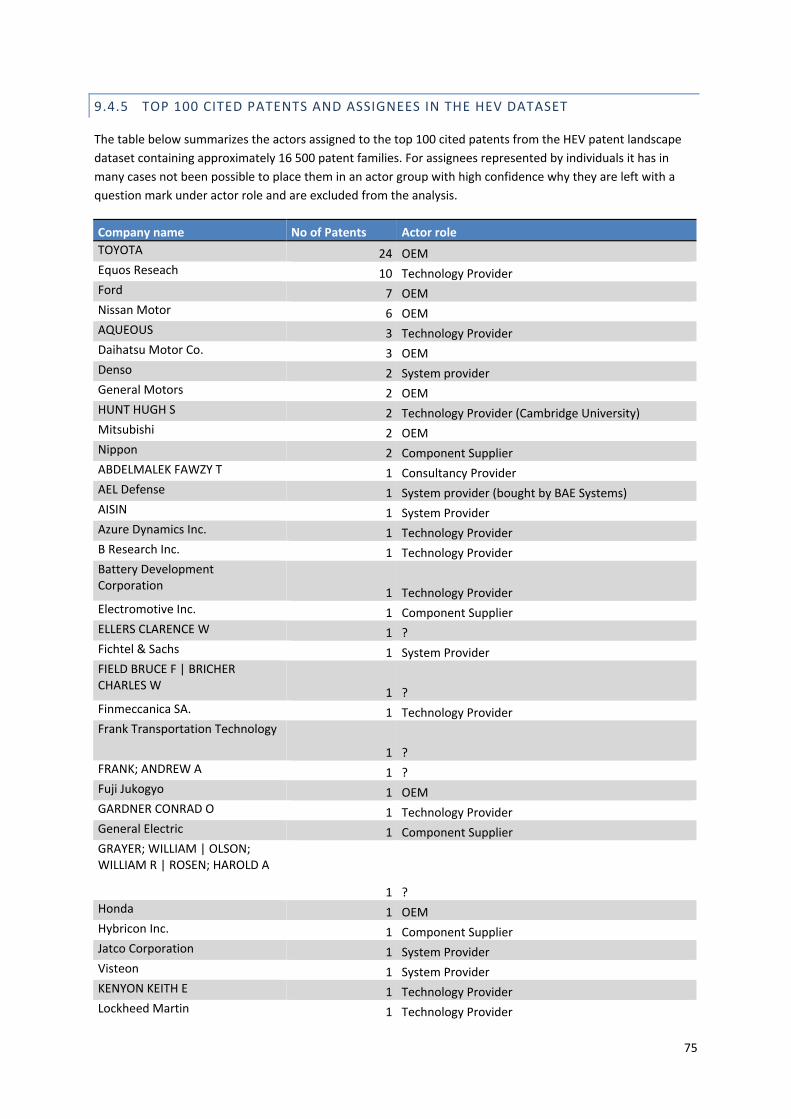
75
9.4.5 TOP 100 CITED PATENTS AND ASSIGNEES IN THE HEV DATASET
The table below summarizes the actors assigned to the top 100 cited patents from the HEV patent landscape
dataset containing approximately 16 500 patent families. For assignees represented by individuals it has in
many cases not been possible to place them in an actor group with high confidence why they are left with a
question mark under actor role and are excluded from the analysis.
Company name No of Patents Actor role
TOYOTA 24 OEM Equos Reseach 10 Technology Provider Ford 7 OEM Nissan Motor 6 OEM AQUEOUS 3 Technology Provider Daihatsu Motor Co. 3 OEM Denso 2 System provider General Motors 2 OEM HUNT HUGH S 2 Technology Provider (Cambridge University) Mitsubishi 2 OEM Nippon 2 Component Supplier ABDELMALEK FAWZY T 1 Consultancy Provider AEL Defense 1 System provider (bought by BAE Systems) AISIN 1 System Provider Azure Dynamics Inc. 1 Technology Provider B Research Inc. 1 Technology Provider Battery Development Corporation
1 Technology Provider Electromotive Inc. 1 Component Supplier ELLERS CLARENCE W 1 ? Fichtel & Sachs 1 System Provider FIELD BRUCE F | BRICHER CHARLES W
1 ? Finmeccanica SA. 1 Technology Provider Frank Transportation Technology
1 ? FRANK; ANDREW A 1 ? Fuji Jukogyo 1 OEM GARDNER CONRAD O 1 Technology Provider General Electric 1 Component Supplier GRAYER; WILLIAM | OLSON; WILLIAM R | ROSEN; HAROLD A
1 ? Honda 1 OEM Hybricon Inc. 1 Component Supplier Jatco Corporation 1 System Provider Visteon 1 System Provider KENYON KEITH E 1 Technology Provider Lockheed Martin 1 Technology Provider
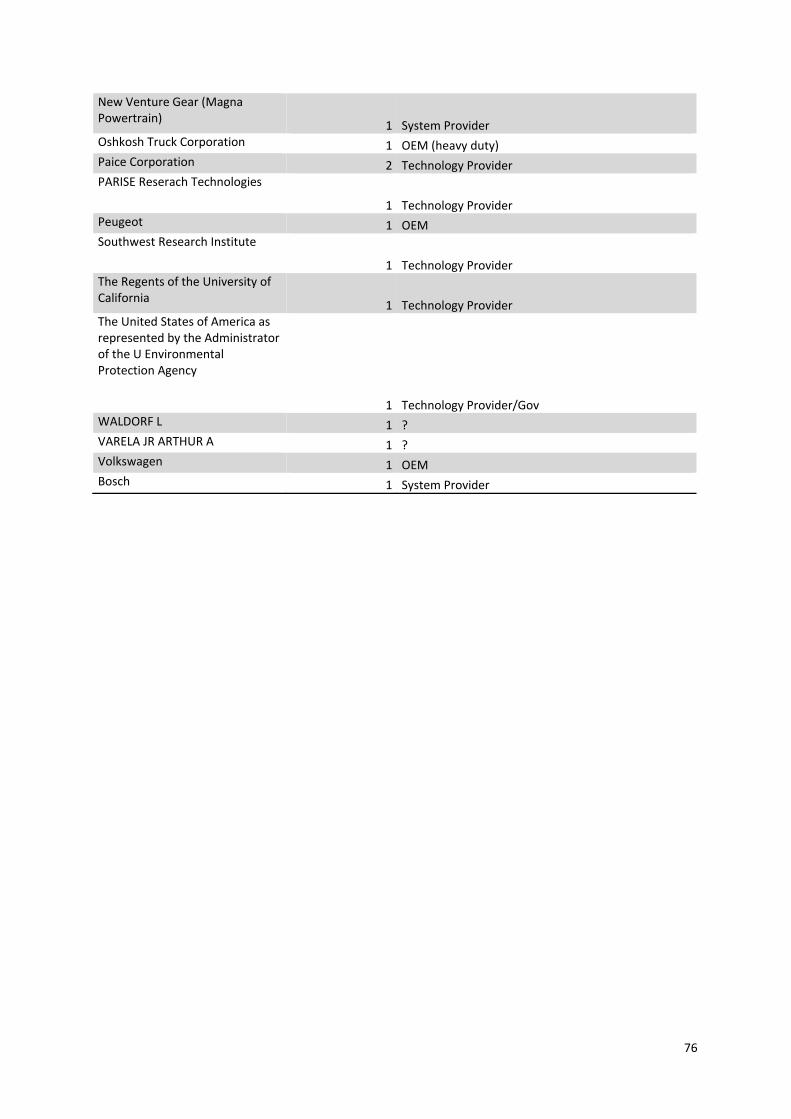
76
New Venture Gear (Magna Powertrain)
1 System Provider Oshkosh Truck Corporation 1 OEM (heavy duty) Paice Corporation 2 Technology Provider PARISE Reserach Technologies
1 Technology Provider Peugeot 1 OEM Southwest Research Institute
1 Technology Provider The Regents of the University of California
1 Technology Provider The United States of America as represented by the Administrator of the U Environmental Protection Agency
1 Technology Provider/Gov WALDORF L 1 ? VARELA JR ARTHUR A 1 ? Volkswagen 1 OEM Bosch 1 System Provider