Embed Size (px)
Citation preview
TECTONICS, VOL. 9, NO. 5, PA(iES 983-1014, ()I?'I'()BER 1990
LATE QUATERNARY DEFORMATION OF MARINE TERRACES ON THE CASCADIA SUBDUCTION ZONE
NEAR CAPE BLANCO, OREGON
Harvey M. Kelsey
Department of Geology, Western Washington University, Bellingham
Abstract. The Cape Blanco region of south coastal Oregon sits on the upper plate of the Cascadia subduction zone about 60-70 km east of the base of the
continental slope. Though the region has no historic coseismic deformation, late Quaternary deposits and landforms show
abundant evidence of uplift, folding, and faulting. A set of five late Quaternary marine terraces and one uplifted Holocene beach berm are preserved in the Cape Blanco region. Stratigraphic and altitudinal surveys of these physiographic features, combined with several numerical
and correlation age determinations, permit a reconstruction of tectonic deformation
near Cape Blanco in approximately the last 200,000 years. The most cogent aspects of the neotectonics in this part of the Cascadia subduction zone are that an east-
west trending anticline deforms the lower three terraces (80-125 ka) as well as accounting for uplift of the Holocene storm berm. Latest movement on the
anticline was no more than 2,000 years ago, but the anticline also deforms sediments as old as Middle Miocene. The
Copyright 1990 by the American Geophysical Union.
Paper number 90TC00665. 0278-7407/90/90TC-00665510.00
anticline is consistent with a north-south
principal contraction axis at Cape Blanco in about the last 100,000 years. An older terrace at Cape Blanco (approximately 200 ka) is offset by two reactivated faults whose movements prior to the Eocene served to suture several terranes to the North
American continent. Tectonic tilting in the older terrace is not consistent with a
north-south principle axis of contraction, but the axis of tilt is parallel to north- northwest striking structures developed in the Quaternary fold belt offshore on the continental shelf. The observed
deformation indicates that regional stress in the vicinity of Cape Blanco in the late Quaternary has been accommodated by a variable pattern of strain.
INTRODUCTION
Rates and styles of tectonic deformation along convergent margins vary both in space and time. Such variation has generally been documented at two quite different time scales--the historic time
scale, where resolution of deformation is
comparatively excellent; and the time scale recorded by plate motions, where resolution is limited by the magnetic reversal record on the sea floor to
millions of years. However, by studying
984 Kelsey' Deformation of Marine Terraces, Cape Blanco
deformed marine terraces along uplifted coastlines, both rates and styles of deformation along segments of convergent margins can be documented at an intermediary time scale less precise than measurements provided by the short historic record but more precise than estimates of deformation inferred from
recorded plate motions.
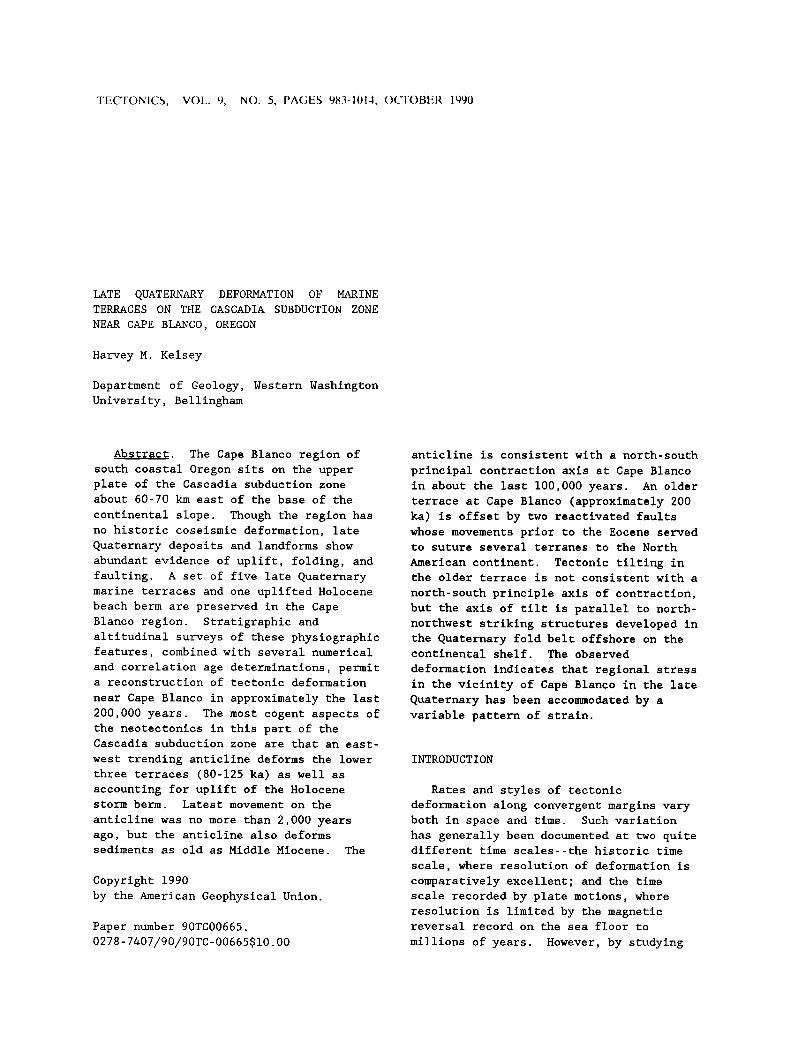
The purpose of this paper is to describe late Quaternary deformation in the vicinity of Cape Blanco, Oregon (Figure 1). Cape Blanco is the closest (60 km) point of land to the base of the continental slope that defines the leading edge of the North American plate (Figure 1). At times of high sea level in the
124ø30 ' 124ø1õ ' 1 •4 ø 43 ø :50' I 43ø50'
43o1õ '
43 ø 00'
0 ½ 6 coos BAY
CAPE
COQUILLE POINT
SOUTH SLOUGH 43015' SYNCLINE
NE
F-
FIGS. 2!, 9,10 43ø00 '
NORTH AMERICAN •, PLATE
42o45 '
PLATE
0 5 10KM I I • • , 1:30 ø
42ø:50 ' I 124ø:50 ' 124 ø 15' 124 ø
Fig. 1. Location map of the study area in south coastal Oregon in the context of the Cascadia subduction zone and the Pacific, Juan de Fuca, and North American plates. The triangles denote volcanoes of the Cascade Range.
late Quaternary [Bloom et al., 1974; Chappell and Shackleton, 1986] , wave erosion beveled a set of marine platforms at Cape Blanco and inland to the east. These platforms have been partially preserved due to tectonic uplift. Terrace sediments, 6.5-55 m thick, cover these
platforms. The younger (western) terraces are well preserved, and the older (eastern) terraces are only preserved as flat-topped benches or accordant ridge summits. Wave-cut platforms in south coastal Oregon show clear evidence of uplift, tilting and/or faulting. Because the shoreline angles of wave-cut platforms were roughly horizontal (in a shore- parallel sense) at times of formation, the
platforms are excellent marker horizons
for assessing deformation. I describe the distribution and age of
the late Quaternary marine terraces and marine deposits at Cape Blanco and the pattern of uplift and the degree of variability in uplift of these terraces and deposits. To do so, I present stratigraphic, pedologic, elevation and age data on the wave-cut platforms or the overlying sediments. On the basis of the observations, I discuss the late
Pleistocene and Holocene tectonic history of the Cascadia forearc in the vicinity of Cape Blanco.
GEOLOGY OF THE CAPE BLANCO AREA
The Cape Blanco area (Figure 1) is the northernmost portion of the Oregon coast where accreted Mesozoic rocks make up the coastal ranges [Wells and Peck, 1961; Dott, 1962, 1971; Koch, 1966; Brownfield et al., 1982; Blake et al., 1985; Bourgeois and Dott, 1985]. North of
Bandon (Figure 1), Eocene and younger rocks underlie the coastal ranges [Wells and Peck, 1961; Baldwin, 1974].
Therefore, marine terrace deformation at
Cape Blanco records the type of deformation near the north end of the
exposed Mesozoic accreted terrain in
coastal Oregon. Along the Oregon coast south of Port
Orford (Figure 1), Neogene deposits of significant extent are not present [Dott,
Kelsey: Deformation of Marine Terraces, Cape Blanco 985
1971]. However, between Port Orford and just north of Cape Blanco, sea cliffs expose the most complete section of late Cenozoic rocks found anywhere on the Oregon coast [Baldwin, 1945; Armentrout, 1980; Addicott, 1964, 1983; Leithold and
Bourgeois, 1984]. Within this extended exposure, several units, separated by at least three unconformities, dip to the
southeast with progressively shallower dips on the younger units. These deposits are in turn overlain unconformably by Late Pleistocene marine terrace sediments,
which dip approximately 0.4 ø to the southeast. The terrace sediments dip from a high point at Cape Blanco 9.75 km to the southeast where they merge with the modern beach at Garrison Lake (Figures 2 and 3). Thus, the Neogene and Quaternary sequence records progressive tilt with time. North of Cape Blanco, Miocene sandstones [Leithold and Bourgeois, 1984] tilt north and the overlying late Pleistocene wave- cut platform (cut unconformably on the Miocene rocks) tilts north and merges to the north with the modern beach at Floras
Lake, 9 km north of Cape Blanco. The Neogene and early Quaternary units, as well as the Late Pleistocene terrace
surfaces, are therefore deformed in an approximately east-west trending anticline whose axis passes through Cape Blanco (Figure 1) [R.J. Janda, unpublished manuscript, Field guide to Pleistocene sediments and landforms and soil
development in the Cape Arago-Cape Blanco area of Coos and Curry Counties, southern coastal Oregon, Friends of the Pleistocene, October 9-11, 1970; hereinafter referred to as (Janda, 1970)].
The late Quaternary expression of the anticline is evident from a shore-parallel profile of the late Quaternary marine terraces (Figure 3).
Griggs [1945] mapped five marine terraces in the Cape Arago-Bandon area, 35-55 km north of Cape Blanco (Figure 1), as part of a study of chromite-bearing black sand deposits that occur along the terrace backedges. Griggs [1945] named the lower three terraces in ascending order, the Whiskey Run, Pioneer, and Seven Devils terraces. Janda [1969], (1970)
defined four marine terrace platforms in the Cape Blanco vicinity differentiated on the basis of elevation, cover
stratigraphy, and soil development. Janda [1969] correlated the lower extensive marine surface at Cape Blanco with the Pioneer surface further north near Cape
Arago. Janda (1970) introduced new names for the three upper marine terraces east of Cape Blanco area: the Silver Butte, Indian Creek, and Poverty Ridge terraces.
The lowest terrace at Cape Blanco has been estimated to be 45-75 ka in age [Wehmiller et al., 1977] based on amino
acid data from mollusks at both Cape Blanco and Coquille Point near Bandon. The age estimate was a correlated age using a 230Th/234U age determination on the coral Balanophyllia eleEans from the cover sediments of the Whisky Run terrace at Coquille Point of 72.2 ñ 5.3 ka (unpublished date of T.-L. Ku cited in Kennedy et al. [1982]). However, the 231pa/253U ratio for this coral was greater than 1.00. which is discordant with the 230Th/23•U age [Muhs et al., 1990]. More recent age information is discussed below.
The terrace platform at Cape Blanco reportedly has the highest uplift rate of any marine platform on the Oregon coast [West and McCrumb, 1988]. This uplift rate was calculated employing the age estimates of Wehmiller et al. [1977]. I present evidence below for multiple reoccupation of the Cape Blanco flat surface by several high stands of sea level; recognition of reoccupation necessitates a reassessment of the number
of wave-cut platforms and of the pattern of uplift depicted by these platforms.
LATE QUATERNARY MARINE TERRACES IN THE VICINITY OF CAPE BLANCO
I identified and differentiated marine
terraces on the basis of elevation of the
terrace surface and recognition of terrace backedges, elevation of the underlying wave-cut platform (where exposed), stratigraphy of the marine sediments on the wave-cut platform, degree of soil development and correlated-age
986 124 ø
42"50' --
42 ø 40' 124035 '
BLACKLOCK POINT
Qcb
STORM BERM
124o30 '
FLORAS
124 ø 25'
FLORAS LK.
I'
Qpi
BEAVER CREEK FAULT ZONE
'X'
GARRISON LK.
Qic L
THE HEADS'
BATTLE ROCK FAULT ZONE
ROCKY POINT
COAL POINT
Qpr
,Qpr • i
/ /
!
o • • 3 Q I i i 537
KM H•.,•G MTN. I I 124 ø 30' 124025 '
42050 '
42o40 '
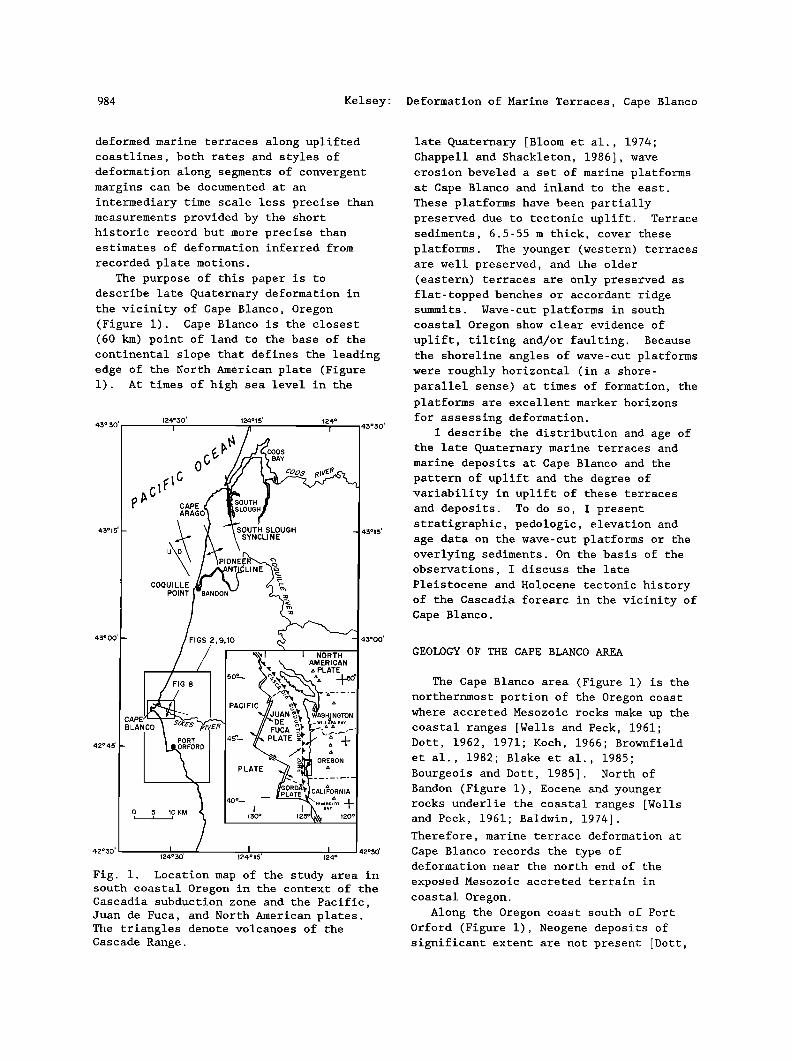
Fig. 2. Geologic map of late Quaternary marine terrace sediments in the vicinity of Cape Blanco, Oregon. The bold lines show the two major fault zones that offset geologic units of Quaternary age. Marine terrace sediments from youngest to oldest: Qcb, Cape Blanco terrace sediments; Qpi, Pioneer terrace sediments; Qsb, Silver Butte terrace sediments; Qic, Indian Creek terrace sediments; Qpr, Poverty Ridge terrace sediments. The heavier solid or dashed line at the eastern margin of each terrace is the estimated position of the backedge (shoreline angle) of the terrace. Note that the backedge contacts of Qcb-Qpi and Qpi-Qsb cannot be traced north of the Sixes River. These backedge contacts are subtle to non-existent because a single expansive wave-cut platform underlies units Qcb, Qpi and Qsb (see Figure 9). Solid circles are locations of measured stratigraphic sections in the terrace sediments (keyed by letter to the columns shown on Figures 6 and 7). Cross-sections X-X' and Y-Y' are shown in Figures 4 and 5 respectively.
Kelsey' Deformation of Marine Terraces, Cape Blanco 98?
42050 ' 42o45 '
I I
A.
FLORAS LK.
a.
/ Qcb WAVE- CUT PLATFORM
AT SEA LEVEL
CAPE n,' BLANCO •E-500 I.d
.... ro bJ
BACKEDGE OF BEHEADED BACKEDGE OF BACKEDGE OF CAPE BLANCO TRIBUTARY ELK PIONEER TERRACE INDIAN CK. TERRACE
TERRACE VALLEY RIVER / THE / ROCKY SIXES / VALLEY GARRISON LK. ( HEADS • POINT E-2OO RIVER
VALLEY Qcb Qcb• Qpi Qpi _ • A'"x _.. •.':•'•' '-'•.',oo "' ,_•, ,,/,., :..•_• .... •__ .•' Q,pi ,, \ ._/ .... ..... •,'-'.• ,_ ;. t;; - .:] -- r TM -
• N
I 42050 '
0 1 2 I .... , .... I I
KM
I 42045
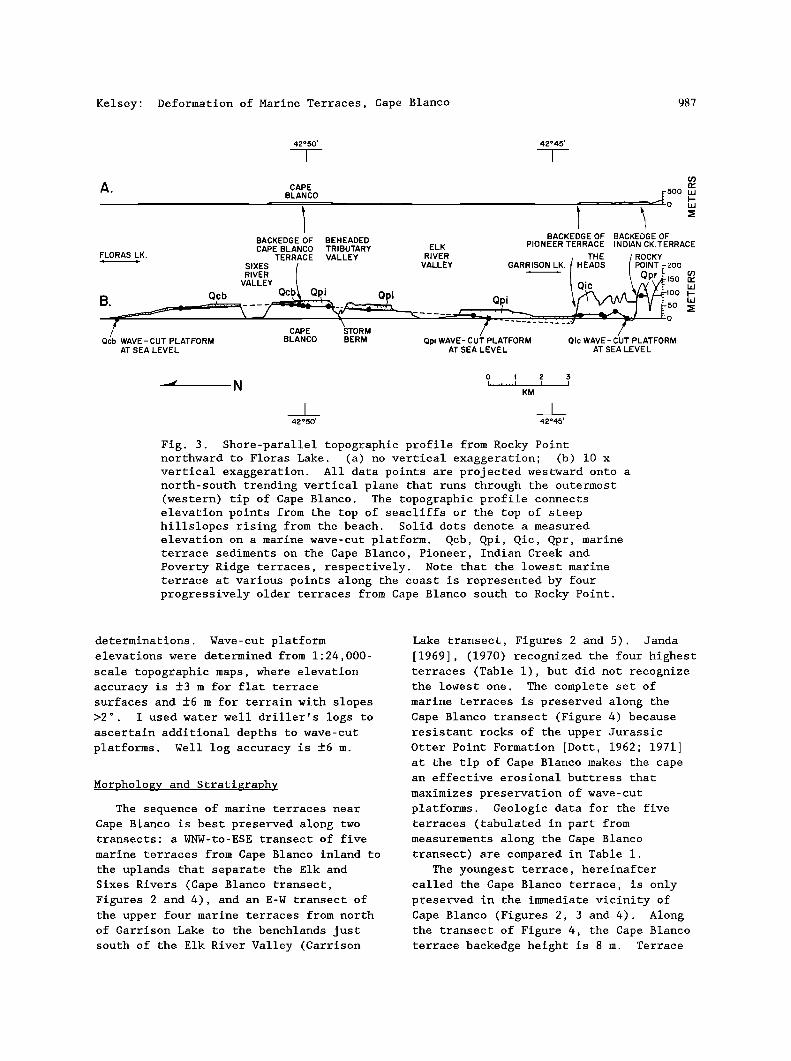
Fig. 3. Shore-parallel topographic profile from Rocky Point northward to Floras Lake. (a) no vertical exaggeration; (b) 10 x vertical exaggeration. All data points are projected westward onto a north-south trending vertical plane that runs through the outermost (western) tip of Cape Blanco. The topographic profile connects elevation points from the top of seacliffs or the top of steep hillslopes rising from the beach. Solid dots denote a measured elevation on a marine wave-cut platform. Qcb, Qpi, Qic, Qpr, marine terrace sediments on the Cape Blanco, Pioneer, Indian Creek and Poverty Ridge terraces, respectively. Note that the lowest marine terrace at various points along the coast is represented by four progressively older terraces from Cape Blanco south to Rocky Point.
determinations. Wave-cut platform elevations were determined from 1:24,000-
scale topographic maps, where elevation accuracy is ñ3 m for flat terrace surfaces and ñ6 m for terrain with slopes >2 ø . I used water well driller's logs to ascertain additional depths to wave-cut platforms. Well log accuracy is ñ6 m.
Morphology and Stratigraphy
The sequence of marine terraces near Cape Blanco is best preserved along two transects: a WNW-to-ESE transect of five
marine terraces from Cape Blanco inland to the uplands that separate the Elk and Sixes Rivers (Cape Blanco transect, Figures 2 and 4), and an E-W transect of the upper four marine terraces from north of Garrison Lake to the benchlands just south of the Elk River Valley (Garrison
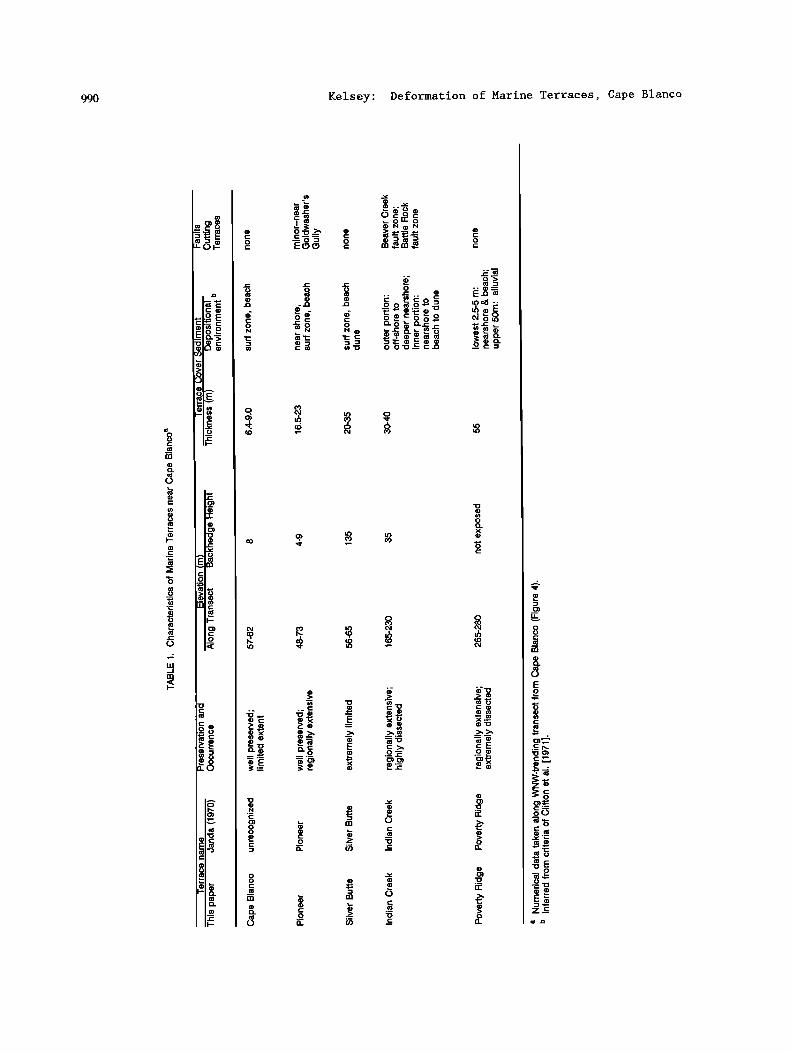
Lake transect, Figures 2 and 5). Janda [1969], (1970) recognized the four highest terraces (Table 1), but did not recognize the lowest one. The complete set of marine terraces is preserved along the Cape Blanco transect (Figure 4) because resistant rocks of the upper Jurassic Otter Point Formation [Dott, 1962; 1971] at the tip of Cape Blanco makes the cape an effective erosional buttress that
maximizes preservation of wave-cut platforms. Geologic data for the five terraces (tabulated in part from measurements along the Cape Blanco transect) are compared in Table 1.
The youngest terrace, hereinafter called the Cape Blanco terrace, is only preserved in the immediate vicinity of Cape Blanco (Figures 2, 3 and 4). Along the transect of Figure 4, the Cape Blanco terrace backedge height is 8 m. Terrace
988 Kelsey' Deformation of Marine Terraces, Cape Blanco
x
I CAPE I IBLANCO I I I I I I I I • I I I I
_=•Qcb I Qpi
o 1 z 3 I,,,tl,,,,I J J
l
• 10 X VERTICAL EXAGGERATION I CAPE BLANCO TERRACE BACKEDGE
I I SOIL_ ß SAND DEPOS T (BEACH) 4m 4m •'•"(•;L'QoP_"['":•'•,,•,•COBBLE DEPOSIT (SURF ZONE) PEBBLY SAND / SOIL _._ •>"_,_;..•-- I I
(BEACH) "'•R ED / ••0• • ............ c•v• RE• _ I 1%•._.••?71TS_AL.•BB.,LE_L_AY•ER_ ;-NO SHELLiS
..: .-."..: :.':'...' ':-'.?'. !: ' ß '.- - '. '. ß '...' '. '.'. '.'. '...' .'.'', - .' :..'.(VIEW TO N25E)-'.
KM _3,400 •-- I • ••-J (:2) øø
NO VERTICAL EXAGGERATION I I
PIONEER SILVER INDIAN OREEK I I BUTTE POVERTY i I
RIDGE "-•? I BEAVER CR. FZ Jl-
•- • œ Qic j • Qic -.- -" • • 150
• Qpi Q•b I00 ...... • •-- 50
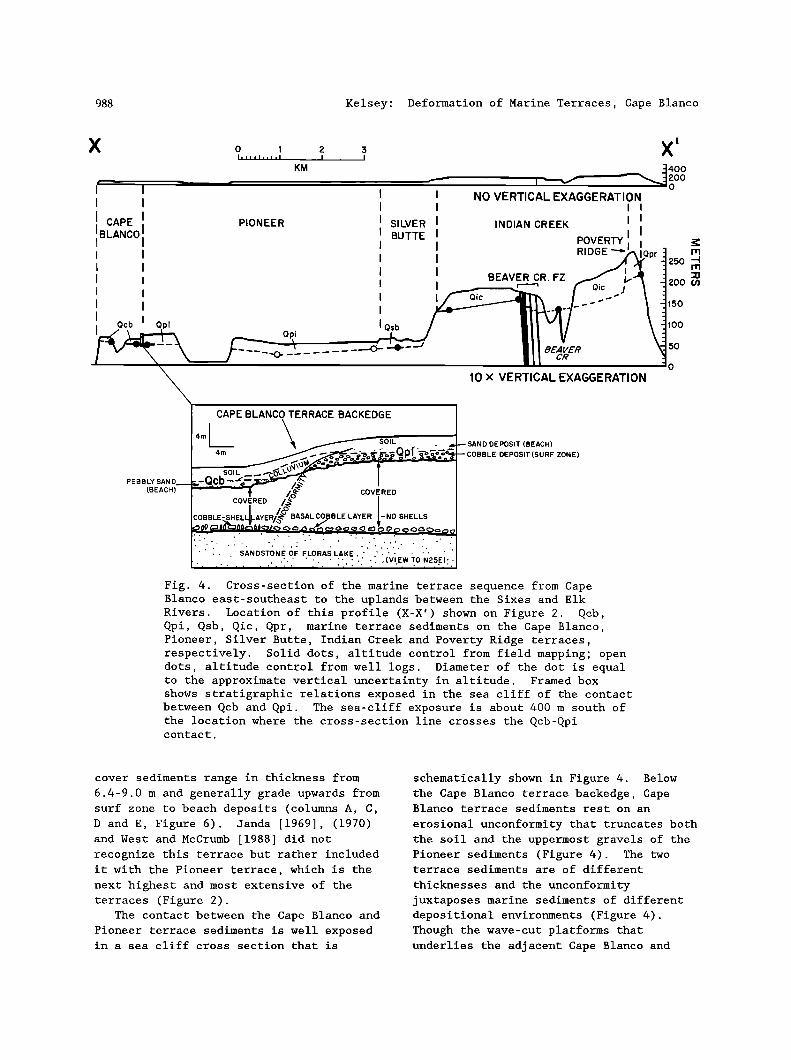
Fig. 4. Cross-section of the marine terrace sequence from Cape Blanco east-southeast to the uplands between the Sixes and Elk Rivers. Location of this profile (X-X') shown on Figure 2. Qcb, Qpi, Qsb, Qic, Qpr, marine terrace sediments on the Cape Blanco, Pioneer, Silver Butte, Indian Creek and Poverty Ridge terraces, respectively. Solid dots, altitude control from field mapping; open dots, altitude control from well logs. Diameter of the dot is equal to the approximate vertical uncertainty in altitude. Framed box shows stratigraphic relations exposed in the sea cliff of the contact between Qcb and Qpi. The sea-cliff exposure is about 400 m south of the location where the cross-section line crosses the Qcb-Qpi contact.
25O --I rrl
200 O3
cover sediments range in thickness from 6.4-9.0 m and generally grade upwards from surf zone to beach deposits (columns A, C, D and E, Figure 6). Janda [1969], (1970) and West and McCrumb [1988] did not
recognize this terrace but rather included it with the Pioneer terrace, which is the
next highest and most extensive of the terraces (Figure 2).
The contact between the Cape Blanco and Pioneer terrace sediments is well exposed in a sea cliff cross section that is
schematically shown in Figure 4. Below the Cape Blanco terrace backedge, Cape Blanco terrace sediments rest on an
erosional unconformity that truncates both the soil and the uppermost gravels of the Pioneer sediments (Figure 4). The two terrace sediments are of different
thicknesses and the unconformity juxtaposes marine sediments of different depositional environments (Figure 4). Though the wave-cut platforms that underlies the adjacent Cape Blanco and
Kelsey' Deformation of Marine Terraces, Cape Blanco 989
Y i
o 1 i i
KM
Qd Qsb
_ • 300 lOO
NO VERTICAL EXAGGERATION
O
Qic
250
2oo 03
Li.I I--
150 b.I
IO0
50
10 x VERTICAL EXAGGERATION
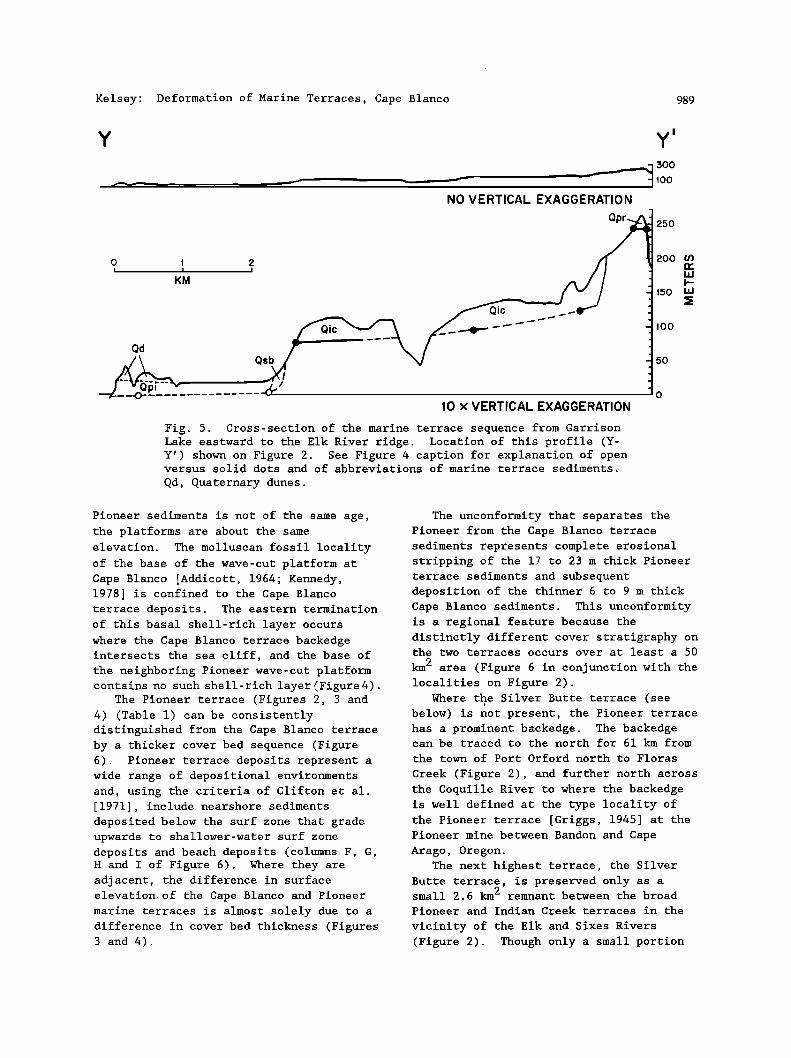
Fig. 5. Cross-section of the marine terrace sequence from Garrison Lake eastward to the Elk River ridge. Location of this profile (Y- Yf) shown on Figure 2. See Figure 4 caption for explanation of open versus solid dots and of abbreviations of marine terrace sediments.
Qd, Quaternary dunes.
Pioneer sediments is not of the same age, the platforms are about the same
elevation. The molluscan fossil locality of the base of the wave-cut platform at Cape Blanco [Addicott, 1964; Kennedy, 1978] is confined to the Cape Blanco terrace deposits. The eastern termination of this basal shell-rich layer occurs where the Cape Blanco terrace backedge intersects the sea cliff, and the base of
the neighboring Pioneer wave-cut platform contains no such shell-rich layer (Figure4) .
The Pioneer terrace (Figures 2, 3 and 4) (Table 1) can be consistently distinguished from the Cape Blanco terrace by a thicker cover bed sequence (Figure 6). Pioneer terrace deposits represent a wide range of depositional environments and, using the criteria of Clifton et al. [1971], include nearshore sediments deposited below the surf zone that grade upwards to shallower-water surf zone deposits and beach deposits (columns F, G, H and I of Figure 6). Where they are adjacent, the difference in surface elevation of the Cape Blanco and Pioneer marine terraces is almost solely due to a difference in cover bed thickness (Figures 3 and 4).
The unconformity that separates the Pioneer from the Cape Blanco terrace sediments represents complete erosional stripping of the 17 to 23 m thick Pioneer terrace sediments and subsequent deposition of the thinner 6 to 9 m thick Cape Blanco sediments. This unconformity is a regional feature because the distinctly different cover stratigraphy on the two terraces occurs over at least a 50
km 2 area (Figure 6 in conjunction with the localities on Figure 2).
Where the Silver Butte terrace (see below) is not present, the Pioneer terrace has a prominent backedge. The backedge can be traced to the north for 61 km from
the town of Port Orford north to Floras
Creek (Figure 2), and further north across the Coquille River to where the backedge is well defined at the type locality of the Pioneer terrace [Griggs, 1945] at the Pioneer mine between Bandon and Cape
Arago, Oregon. The next highest terrace, the Silver
Butte terrace, is preserved only as a small 2.6 km 2 remnant between the broad Pioneer and Indian Creek terraces in the
vicinity of the Elk and Sixes Rivers (Figure 2). Though only a small portion
990 Kelsey' Deformation of Marine Terraces, Cape Blanco
.•_
o
.o_
ß
c: o N
o
.
o o -•o
N
o
•o o o
o o
o o_ x
o
o
o o
o
o
o
._
Kelsey: Deformation of Marine Terraces, Cape Blanco 99!
of the Silver Butte terrace is preserved, the 100 m of relief characteristic of most
of the Pioneer terrace backedge (Figure 5) must have developed during the Silver Butte sea-level high stand because the Silver Butte and Pioneer wave-cut
platforms are essentially at the same elevation (Figures 4 and 5). Silver Butte sediments are only exposed in one road cut. Here, the marine sediments are mixed with late Pleistocene alluvial sediments
of the Sixes River (Column J, Figure 7). The stratigraphy at this site suggests alluvial progradation followed by submergence and then another cycle of progradation followed by submergence, and finally capped by surf zone and beach deposits.
The Indian Creek terrace, once a broad platform about as extensive as the Pioneer, is now highly dissected. Despite extensive erosion, flat terrace remnants
are moderately well preserved and are flanked on the east by an erosionally subdued backedge that along the two transects is 30-40 m high (Figures 4 and 5). Cuts along a county road that runs east-west across this terrace provide excellent exposures of the cover bed stratigraphy and the soils. The Indian Creek wave-cut platform has a thick 30-36 m marine sediment cover (columns K and L,
Figure 7). Near the outer edge, the terrace cover consists of offshore to
relatively deep nearshore deposits (Figure 7b). Four km further east adjacent to the backedge, terrace cover grades upward from nearshore to beach to eolian dune deposits (Janda, 1970).
The highest terrace in the area, the Poverty Ridge terrace (Figures 2, 3 and 4) (Table 1), has no distinct terrace
morphology, and is recognized by the sediment cover and the approximate elevational accordance of ridge summits underlain by the deposits. The terrace is about 30 m above the younger Indian Creek terrace. The Poverty Ridge terrace has the thickest sediment cover--
approximately 55 m. In some places, the eastern extent of the terrace is defined
by a subdued backedge. In the eastern (inland) portion of the terrace, approximately 2.5-5 m of interstratified
marine sand and pea gravel occur at the base (Janda, 1970), and the remainder of
the terrace deposit consists of pebble- cobble alluvium with all clasts derived
locally from the early Cretaceous Rocky Point Formation of Koch [1966]. The alluvium grades westward into marine sand and gravel. The Poverty Ridge terrace is distinctive in that alluvium, rather than
shallow marine sediments, constitute a
substantial part of the cover bed stratigraphy. However, the platform is a wave-cut strath because the basal
sediments are in all observed cases marine
(Janda, 1970).
Soils
I conducted a reconnaissance
investigation of soils on the lowest 4 of the 5 marine terraces, in order to
evaluate the relative age of the soils. The investigation consisted of one or two soil descriptions for each terrace. Presently, a more comprehensive study of the soils on all five of the Cape Blanco terraces is in progress and therefore soils data will be only briefly discussed in this paper. The following description is a product of my reconnaissance investigation and preliminary findings of the more comprehensive investigation (J.G. Bockheim, written communication,
September, 1989). Soils on the Cape Blanco, Pioneer,
Silver Butte, and Indian Creek surfaces
can be distinguished on the basis of solum thickness (combined thickness of the A and
B horizons), presence or absence of an E horizon, type of B horizon, thickness of B horizon, depth to oxidized parent material, and presence or absence of saprolite in the subsoil. The Cape Blanco and Pioneer soils are most similar in
degree of development. However, the Pioneer soil shows development of an E horizon and the Cape Blanco soil does not, and the Pioneer soil has more iron
cementation in the B horizon than the Cape Blanco soil. The Silver Butte soil is a
significantly better developed soil than either the Pioneer or the Cape Blanco soil, and the Indian Creek soil is
significantly better developed than the
992 Kelsey' Deformation of Marine Terraces, Cape Blanco
Silver Butte soil. Unlike the Silver
Butte soil, the Indian Creek soil is underlain by saprolitic material. The Poverty Ridge soil is underlain by a saprolite that is substantially thicker than the saprolite underlying the Indian Creek soil. The argillic (clay-enriched) B horizon thickens markedly from Cape Blanco through Poverty Ridge soils.
In summary, the soils on the Cape Blanco terraces show a clearly increasing relative age. The Pioneer soil is slightly older than the Cape Blanco soil. The Silver Butte and Indian Creek soils
can be differentiated from each other and
are older than the Pioneer soil. The
Poverty Ridge soil is by far the oldest soil.
Age
A revision of the estimated ages of marine wave-cut platforms in south coastal Oregon [Muhs et al., 1990] provides more reliable age control for the marine terrace sequence at Cape Blanco. A combination of a new uranium-series age determination for coral (Balanophyllia elegans) from the Whisky Run terrace at Coquille Point (Figure 1) and both amino acid and oxygen isotope data on mollusk shells collected at Coquille Point as well as on the two lowest terraces at Cape
Blanco suggest that the Cape Blanco terrace is correlative with the 80 ka high stand of sea and the Pioneer terrace is
correlative with the 105 ka high stand of
CAPE BLANCO TERRACE
SEAWARD) 10
AEOLIAN CAP
METERS :•]) SOIL
ABRASION'• SURFACE J O PLATFORM OTTER POINT ROCK TYPE
..•• SO•IL
5 5
OV RED
--J-'qi .............. SHELLS
O "'•"'"' ;'• O SAN DSTON E OF
FM (SAN DSTONE) FLORAS LAKE
SOIL
EOCENE SHALE
(SEAWARD
(SEAWARD =) • f SOIL SOIL • I 5
BURLED SOIL
o o
HOUSTENADEN CR. SANDSTONE OF FM (SANDSTONE) FLORAS LAKE
GRAIN SIZE i • ] I [ ] i [ [ [ [ i i [ i , [ [ ] ] ] I [ I [ ] i I [ [ I ! [ I I
o •o o • E o •o o m m • • m
A B C D E
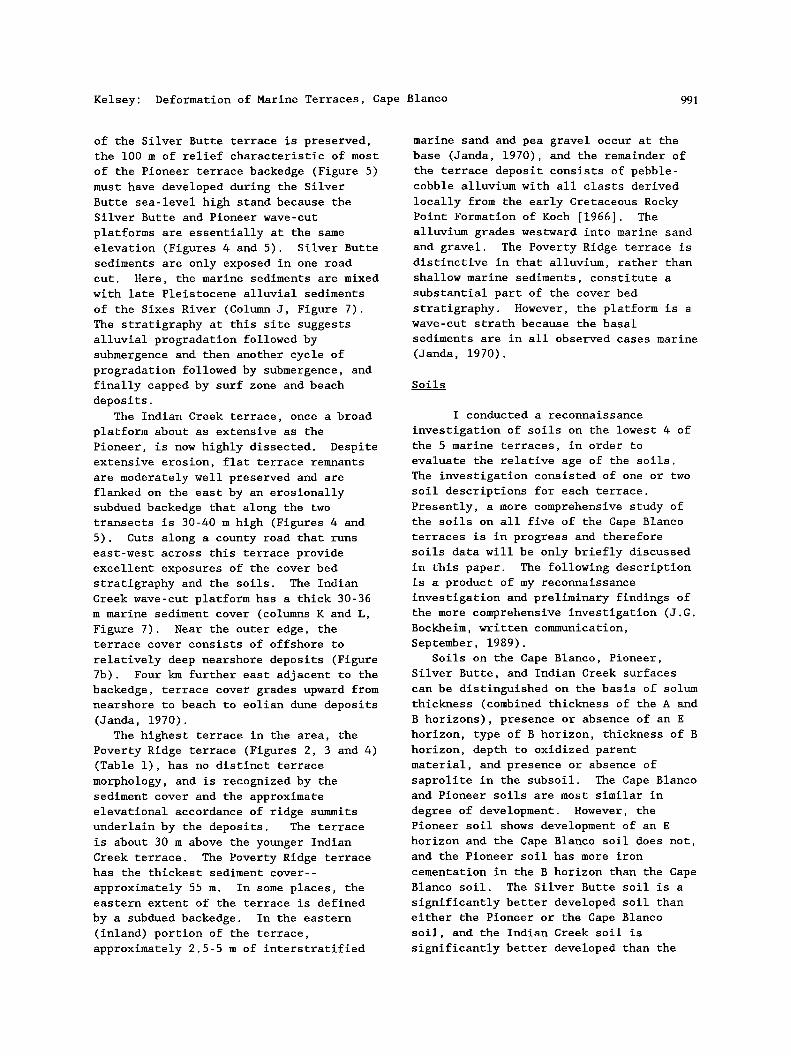
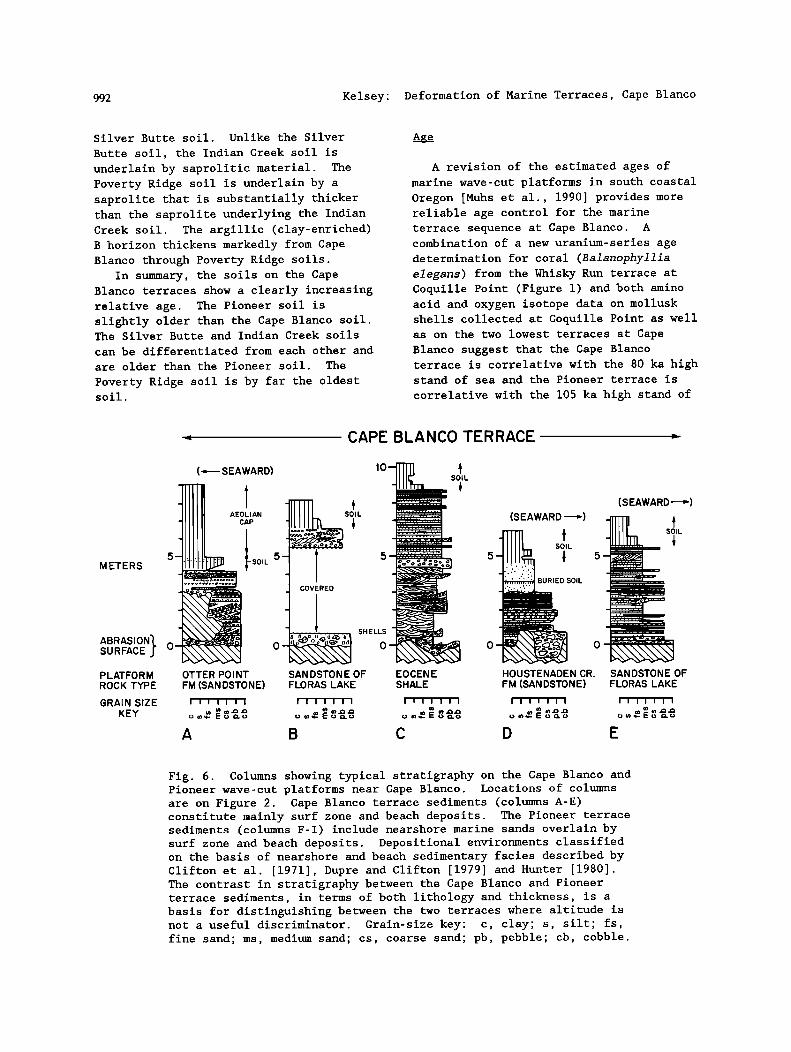
Fig. 6. Columns showing typical stratigraphy on the Cape Blanco and Pioneer wave-cut platforms near Cape Blanco. Locations of columns are on Figure 2. Cape Blanco terrace sediments (columns A-E) constitute mainly surf zone and beach deposits. The Pioneer terrace sediments (columns F-I) include nearshore marine sands overlain by surf zone and beach deposits. Depositional environments classified on the basis of nearshore and beach sedimentary facies described by Clifton et al. [1971], Dupre and Clifton [1979] and Hunter [1980]. The contrast in stratigraphy between the Cape Blanco and Pioneer terrace sediments, in terms of both lithology and thickness, is a basis for distinguishing between the two terraces where altitude is not a useful discriminator. Grain-size key: c, clay; s, silt; fs, fine sand; ms, medium sand; cs, coarse sand; pb, pebble; cb, cobble.
Kelsey' Deformation of Marine Terraces, Cape Blanco 993
PIONEER TERRACE (----SEAWARD)
10-
_
COVERED
lO-
_
SANDSTONE OF PORT ORFORD FLORAS LAKE FM (SAN DS)
I I I I I I I I I I I I I I
F G
• BURROWS
,,.
>;, .1• BURROWS
15
10
SOIL
BURROWS
PORT ORFORD FM (SANDS)
• I I I I I I
H
Fig. 6. (continued)
20
15
10
BURROWS
ELK RIVER BEDS(SANDS)
I i i i I I I
sea [Muhs et al., 1990]. The rationale for these age determinations is briefly discussed below. A thorough explanation of these age determinations is presented in a companion paper by Muhs et al. [1990]. The Cape Blanco terrace age determination is a correlation-age estimate because the extent of
epimerization of amino acids of Saxidomus
shells on the Cape Blanco terrace is the
same as the extent of epimerization of amino acids in shells of the same genus on the numerically-dated Whisky Run terrace at Coquille Point [Muhs et al., 1990]. The terminology of correlation-age versus numerical-age is after Colman et al. [1987]. The Pioneer terrace near Cape Blanco has a correlated-age estimate of 105 ka because the extent of epimerization of amino acids in $axidomus from this
994 Kelsey' Deformation of Marine Terraces, Cape Blanco
(a) SILVER BUTTE TERRACE
25
20
METERS
15
10
(B)
:55--
:50 ....
10
INDIAN CREEK TERRACE
S IL
;'•-' '-• 'g'i.'
•"'"'• 'r'• 20 COVERED
15
10
OTTER POINT OTTER POINT ROCKY POINT FM (SANDSTONE) FM (SANDSTONE) FM (SANDSTONE)
I I I I I I I I I I I I I I I I I I I I I
o •,,- o m.o o •,,..m E o m.o o •,,..m o m.o
j K L
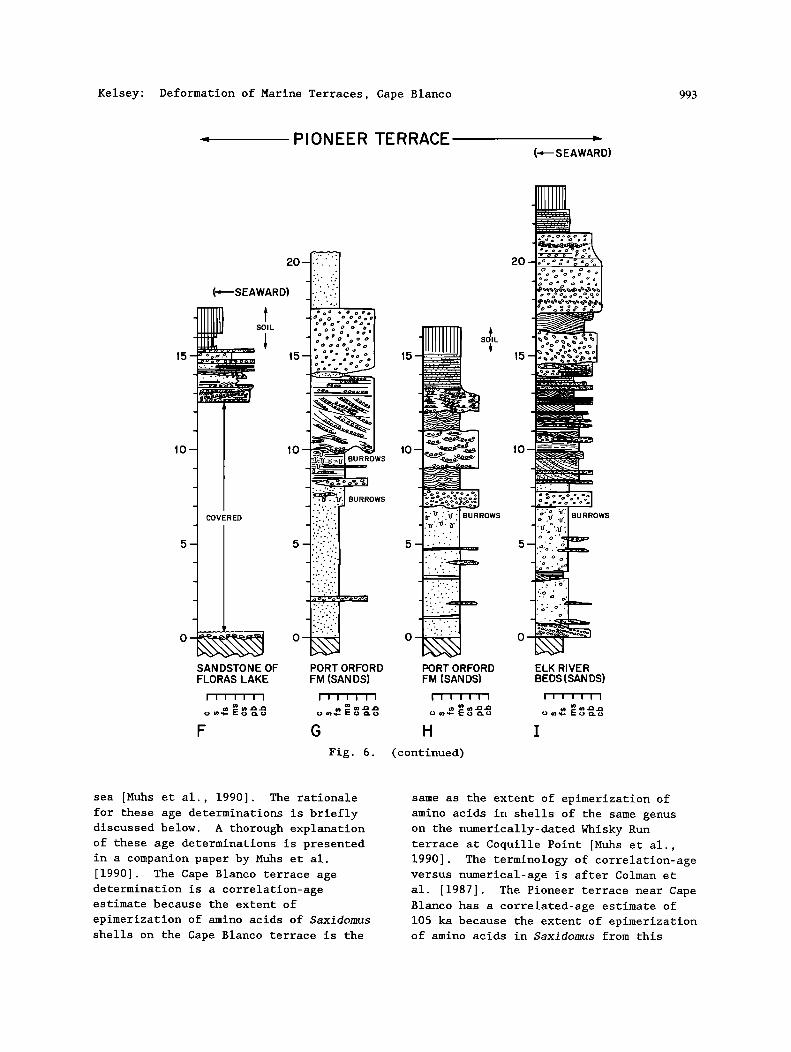
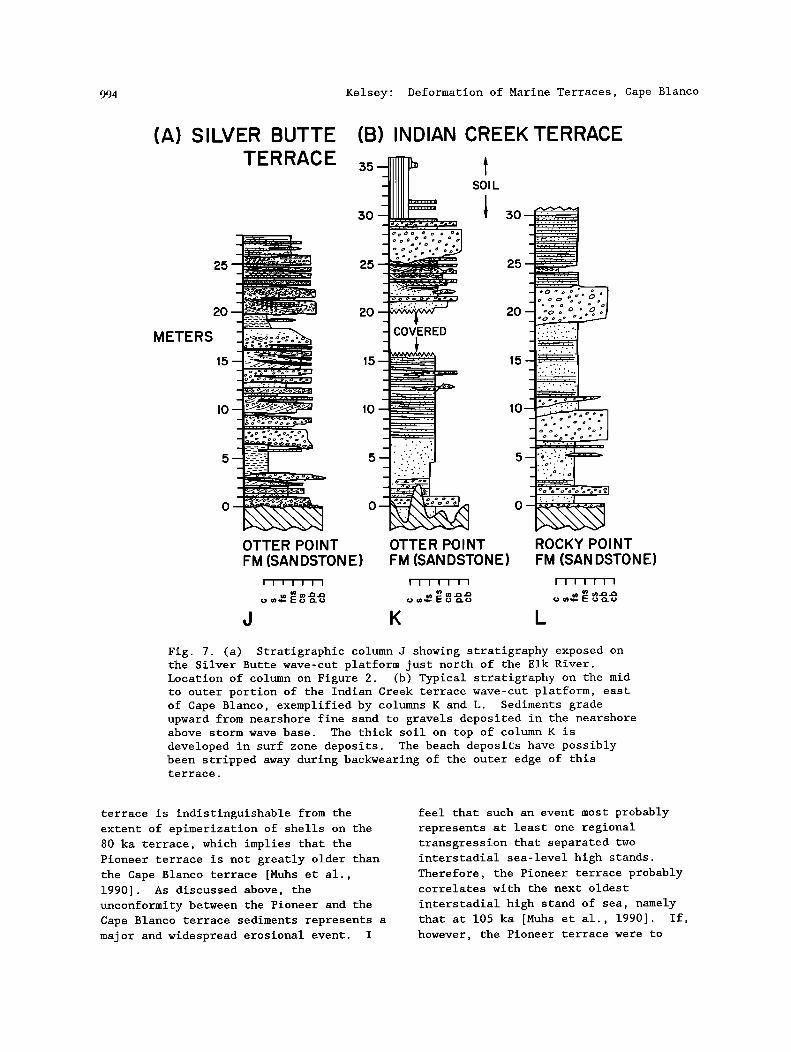
Fig. 7. (a) Stratigraphic column J showing stratigraphy exposed on the Silver Butte wave-cut platform just north of the Elk River. Location of column on Figure 2. (b) Typical stratigraphy on the mid to outer portion of the Indian Creek terrace wave-cut platform, east of Cape Blanco, exemplified by columns K and L. Sediments grade upward from nearshore fine sand to gravels deposited in the nearshore above storm wave base. The thick soil on top of column K is developed in surf zone deposits. The beach deposits have possibly been stripped away during backwearing of the outer edge of this terrace.
terrace is indistinguishable from the extent of epimerization of shells on the 80 ka terrace, which implies that the Pioneer terrace is not greatly older than the Cape Blanco terrace [Muhs et al., 1990]. As discussed above, the unconformity between the Pioneer and the Cape Blanco terrace sediments represents a major and widespread erosional event. I
feel that such an event most probably represents at least one regional transgression that separated two interstadial sea-level high stands. Therefore, the Pioneer terrace probably correlates with the next oldest
interstadial high stand of sea, namely that at 105 ka [Muhs et al., 1990]. If, however, the Pioneer terrace were to
Kelsey: Deformation of Marine Terraces, Cape Blanco 995
represent the 125 ka interglacial high stand of sea, then epimerization of amino acids from shells on the Pioneer terrace
should be distinguishable from epimerization of shells on the Cape Blanco terrace [Muhs et al., 1990].
No fossils were found in the Silver
Butte terrace deposits. However, I reason that the Silver Butte wave-cut platform was formed during the last interglacial at about 125 ka. These deposits are noticeably more weathered than the Pioneer and Cape Blanco terrace sediments, on the basis of soil observations. The Silver
Butte terrace could conceivably be older than 125 ka; if this is the case, then the
last interglacial is not represented in the marine terrace sequence at Cape Blanco.
The Indian Creek and Poverty Ridge terraces are not directly dated because no fossils were found. However, soils data indicate that they both clearly predate the last interglacial. The Indian Creek terrace is not likely younger than about 200 ka, because 200 ka is the next time
prior to 125 ka when a sea-level high stand attained a height approaching that of sea level at 125 ka [Mesolella et al., 1969; Harmon et al., 1983]. Also, I infer from the degree of soil development that the Indian Creek terrace is significantly older than the Silver Butte terrace.
The age of the Poverty Ridge terrace is unknown. Janda (1970) notes the presence of a lower Pleistocene Clinocardium fossil
in the Poverty Ridge deposits and assigns the Poverty Ridge terrace to an Early to Late Pleistocene age. The deep saprolite that underlies the Poverty Ridge soil makes an Early Pleistocene age feasible.
EMERGENT HOLOCENE MARINE DEPOSITS: BEACH
BERM SOUTH OF CAPE BLANCO
At numerous coastal sites on the
convergent plate margin throughout the Pacific basin, emergent Holocene wave-cut platforms or emergent Holocene beach berms attest to late Holocene tectonic uplift. In New Zealand, Alaska, Chile, Japan, and Mexico, historic coseismic coastal uplift has elevated such features [Wellman, 1967; Plafker, 1969, 1972; Matsuda et al., 1978•
Bodin and Klinger, 1986; Berryman et al, 1989]; and by association, many prehistoric Holocene emergent marine platforms or beach ridges probably owe their origin to co-seismic uplifts.
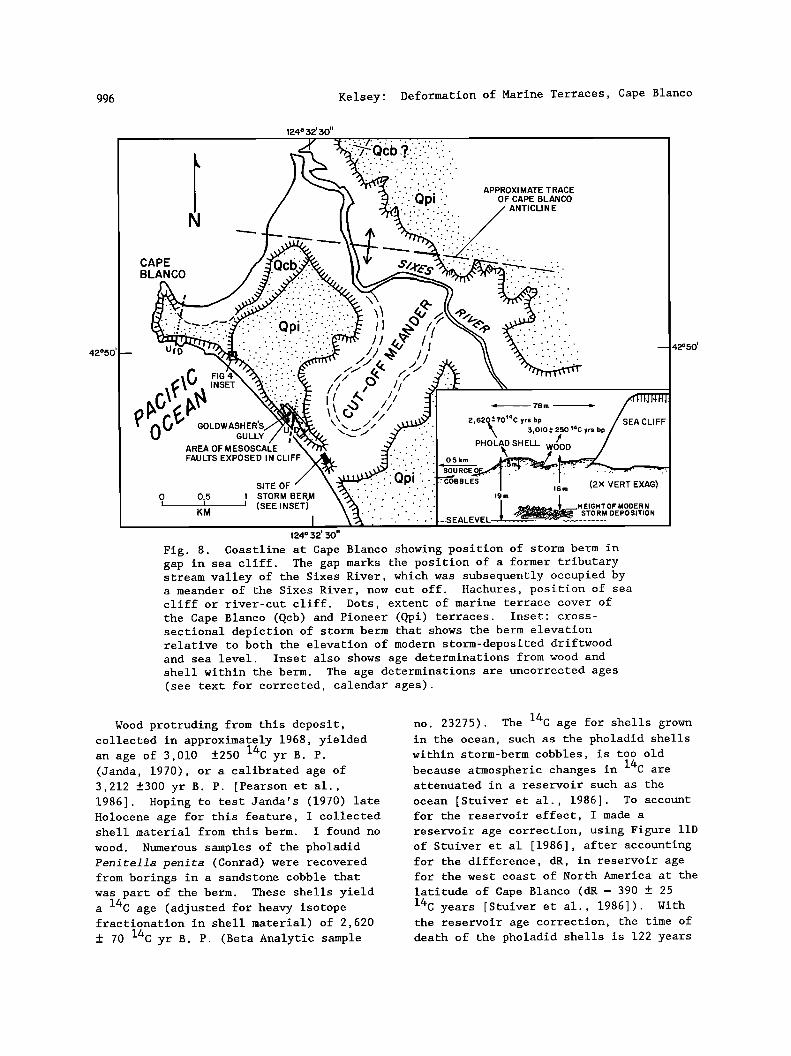
On the Oregon coast 2.2 km southeast of Cape Blanco, an elevated mound of sand
capped by cobbles occurs in a gap in an otherwise solid facade of sea cliffs (see
"storm berm", Figure 2). The gap is a former tributary valley to the Sixes River (Figure 8), beheaded by coastal retreat during the last marine transgression, filled with late Holocene sediment, and then blocked by sand dunes. In the latest Holocene, the former tributary valley has been occupied by an ox-bow meander (now cut off) of the Sixes River (Figure 8). The cobble berm in the gap is an elongate mound, 78 m (length) x 14 m (width) x 5 m (maximum relief), that parallels the
coast. The deposit rests on beach or dune sand and consists of sand with a 0.3-0.5 m
thick veneer of well-rounded cobbles
(Figure 8). The cobble deposit is composed of clasts of both resistant rock types (blueschist, diorite, metavolcanic) and weakly indurated sandstone. The resistant clasts are derived from the
conglomeratic lower Pleistocene Port Orford Formation of Baldwin [1945], which
is exposed only 0.5 km northwest along the beach. The weakly indurated sandstone clasts also are locally derived from Miocene units (described by Addicott [1983]) in the adjoining sea cliff and all such clasts have borings of pholadids, which are rock-boring clams. In a few places where the deposit can be seen in place, the deposit is clast-supported with a well developed landward-dipping imbrication. The deposit is most likely marine and I interpret it to be a beach storm berm, as was first suggested by Janda (1970).
The sea cliff gap is a reasonable site for preservation of a beach berm deposited by one or more great storms. In the gap, the berm would be less vulnerable to wave
attack during lesser storms and could be therefore preserved at its original depositional height for a prolonged period of time.
996 Kelsey' Deformation of Marine Terraces, Cape Blanco
42o50 '
124 ø 32' 30"
N
APPROXI MATE TRACE OF CAPE BLANCO
ANTICLINE
CAPE BLANCO
GULLY
AREA OF M EgOSCALE FAULTS EXPOSED IN CLIFF
.• 78m
2,62(•70t4C yrs bp 3,010 3 25014C yrs bp
PHOLAD SHELL WOOD
0.5
SITE OF ß ß
0 0.5 1 STORM BEAM • J (SEE INSET)
KM
I 12• 32'30"
Fig. 8. Coastline at Cape Blanco showing position of storm berm in gap in sea cliff. The gap marks the position of a former tributary stream valley of the Sixes River, which was subsequently occupied by a meander of the Sixes River, now cut off. Hachures, position of sea cliff or river-cut cliff. Dots, extent of marine terrace cover of the Cape Blanco (Qcb) and Pioneer (Qpi) terraces. Inset: cross- sectional depiction of storm berm that shows the berm elevation relative to both the elevation of modern storm-deposited driftwood and sea level. Inset also shows age determinations from wood and shell within the berm. The age determinations are uncorrected ages (see text for corrected, calendar ages).
"Qpi" ' BLES .... (2X VERT EXAG) ß ' 16m ß
ß .. ,•m .... • __HIGHOF MODERN ß
'. ß ß I ,,-.•• s•o,MoE,osmo, ß ß ß ß ALEVEL---•- .... '
42o50 '
Wood protruding from this deposit, collected in approximately 1968, yielded an age of 3,010 ñ250 14C yr B. P. (Janda, 1970), or a calibrated age of 3,212 ñ300 yr B. P. [Pearson et al., 1986]. Hoping to test Janda's (1970) late Holocene age for this feature, I collected shell material from this berm. I found no
wood. Numerous samples of the pholadid Penite12a penira (Conrad) were recovered from borings in a sandstone cobble that was part of the berm. These shells yield a 14C age (adjusted for heavy isotope fractionation in shell material) of 2,620
ñ 70 14C yr B. P. (Beta Analytic sample
no. 23275). The 14C age for shells grown in the ocean, such as the pholadid shells within storm-berm cobbles, is too old
14C are because atmospheric changes in attenuated in a reservoir such as the
ocean [Stuiver et al., 1986]. To account for the reservoir effect, I made a
reservoir age correction, using Figure lid of Stuiver et al [1986], after accounting for the difference, dR, in reservoir age for the west coast of North America at the
latitude of Cape Blanco (dR = 390 ñ 25 14C years [Stuiver et al., 1986]). With the reservoir age correction, the time of death of the pholadid shells is 122 years
Kelsey: Deformation of Marine Terraces, Cape Blanco 99?
A.D.+ 170 years, or 1,820 + 170 years B. P. The revised shell age indicates that the age of the berm based on the estimated time of death of the pholadids is about 900 - 1,850 year younger than the minimum age of the berm based on the calibrated wood age.
The two age determinations suggest that the berm formed between about 1,800 and 3,200 years B.P. The younger age is more likely to be correct because the pholadids probably were killed by berm deposition, whereas the wood is probably driftwood and killed an indeterminate time before
deposition in the berm. The storm berm deposit indicates
tectonic uplift because it is of marine origin yet is 19 m above mean sea level. The deposit is 16 m above the maximum height at which storms of the last few decades have deposited driftwood and 12.5 m higher than the height that the severest conceivable storm could have deposited material, had all of the beach been eroded
away. Assuming the berm was uplifted above sea level when the pholadids died 1,820 + 170 years B. P., assuming negligible rise in eustatic sea level in the last 3,000 years, and given the uncertainty as to the initial height of storm deposition, the storm berm has been tectonically uplifted at an average rate of 6-10 mm/yr in the late Holocene.
Another candidate explanation for the present elevation of the berm is
deposition at the present height by a tsunami. The highest run-up of a tsunami, as recorded by its gravel deposits, is 17 m above sea level on the island of Hawaii
[Moore and Moore, 1984]. Substantially higher waves, with run-ups greater than 300 m, have been documented [Moore and Moore, 1984], but the waves were probably induced by landslides originating on submarine topographic escarpments that have no counterpart off the Oregon coast. A tsunami origin for the berm dictates 12.5-19 m of tsunami run-up, but a gap in a sea cliff is an unlikely site for maximum tsunami run-up. The gap provides no topographic backstop to cause deposition of cobbles during tsunami wave advance or backflow. Thus, because of the
large run-up required and a coastal
morphology that makes such a run-up improbable, I feel deposition of the berm by tsunami, without subsequent tectonic uplift, is not a plausible explanation of origin.
I investigated the coastline shown in Figure 8 for any other evidence of emergent Holocene marine platforms or deposits. I found no such evidence. The
modern wave-cut platform at the Cape Blanco headland has an average relief of 1.5-2.0 m and is 100-220 m wide. If a
coseismic uplift event of several meters had occurred at Cape Blanco in the last few hundred years, it is likely the remnants of such an elevated platform would be apparent. However, wave energy is concentrated on the Cape Blanco headland and any emergent Holocene platform would be short-lived due to rapid coastal retreat. Due to a position in the sea-cliff gap, however, the storm berm would have a much higher preservation potential than a wave-cut platform uplifted by the same event.
MULTIPLE REOCCUPATION BY THE SEA OF THE
BROAD FLAT SURFACE AT CAPE BLANCO
Formerly horizontal wave-cut platforms in the vicinity of Cape Blanco are now tilted, warped and uplifted. At their time of formation, wave-cut platforms have about a 0.3ø-2.0 ø range of initial, non- tectonic seaward tilt, with the larger tilts evident only in the narrow (300-600 m) inshore segment [Bradley and Griggs, 1976]. The direction of tilt is
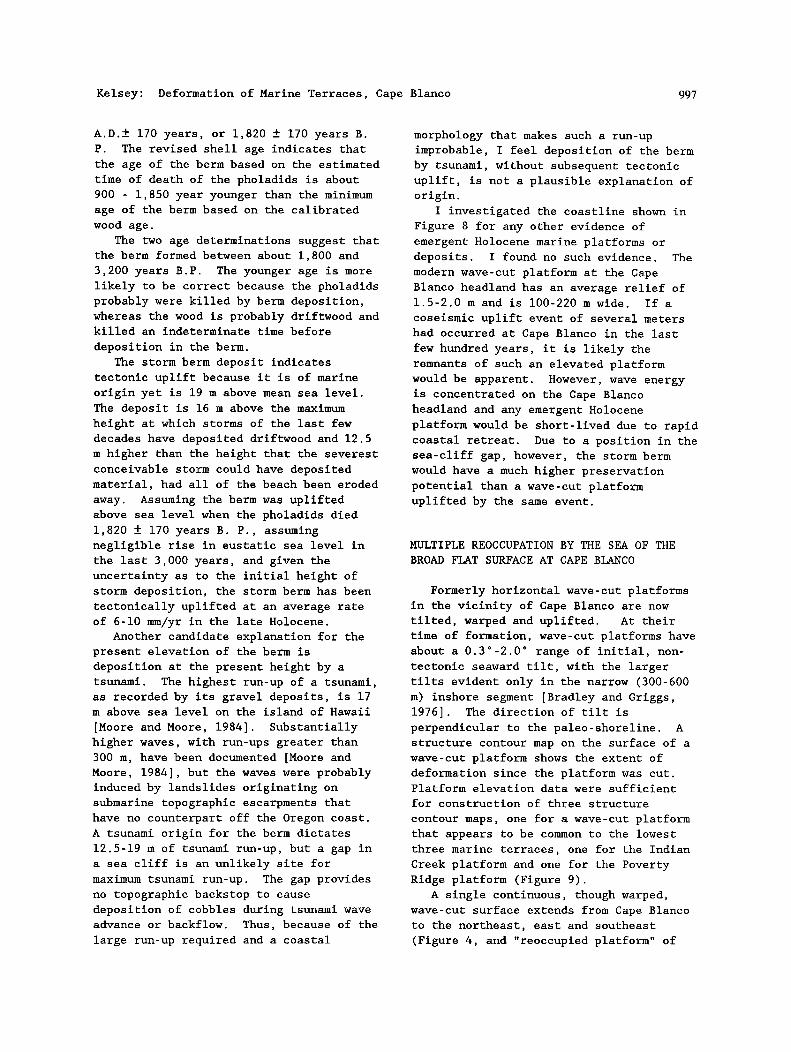
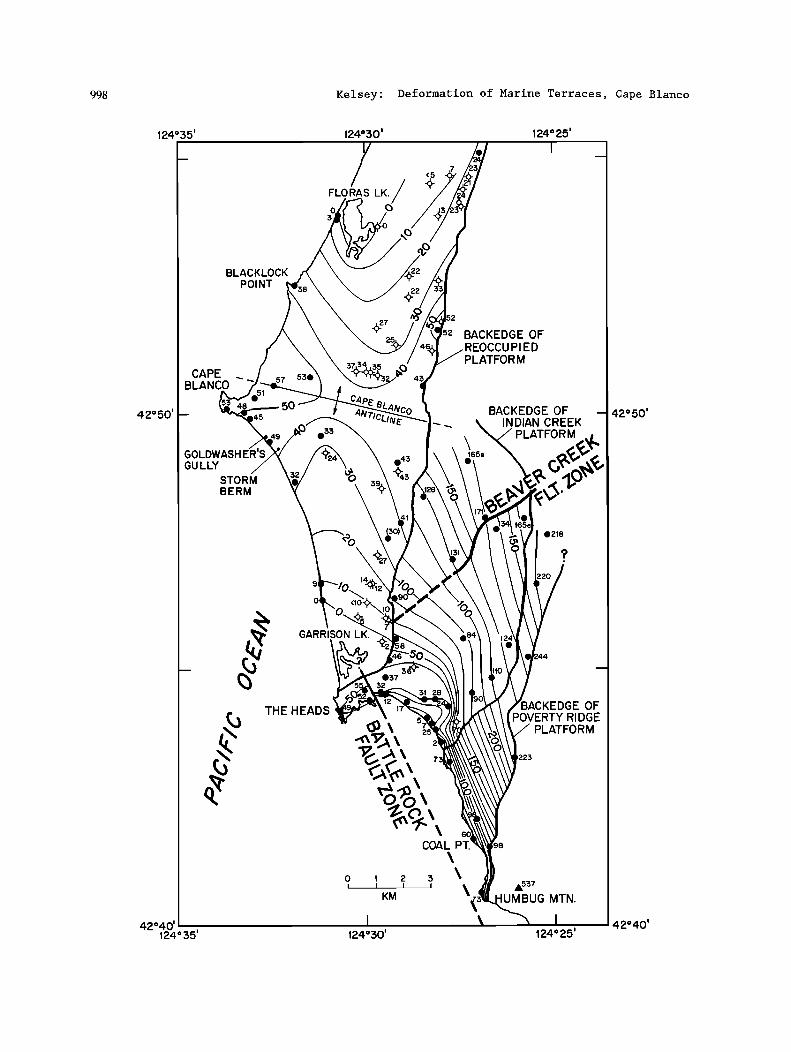
perpendicular to the paleo-shoreline. A structure contour map on the surface of a wave-cut platform shows the extent of deformation since the platform was cut. Platform elevation data were sufficient
for construction of three structure
contour maps, one for a wave-cut platform that appears to be common to the lowest three marine terraces, one for the Indian
Creek platform and one for the Poverty Ridge platform (Figure 9).
A single continuous, though warped, wave-cut surface extends from Cape Blanco to the northeast, east and southeast
(Figure 4, and "reoccupied platform" of
998 Kelsey' Deformation of Marine Terraces, Cape Blanco
124';55'
42*50' --
42*40' 124'$5'
BLACKLOCK POINT
CAPE BLANCO
,45
5O
GOLDWASH GULLY
STORM BERM
THE HEADS
124'$0'
FLORAS LK./ o (3
<5
.(•.27
GARRISON LK.
$37
o 1 2 i i I
KM
I 124'50'
124'25'
I
BACKEDGE OF REOCCUPIED PLATFORM
\ 165e
BACKEDGE OF INDIAN CREEK
P M
$218
? .
BACKEDGE OF POVERTY RIDGE
PLATFORM
,223
COAL PT.
, \ •37 UM BUG MTN.
124'25'
42*50'
42*40'

Kelsey: Deformation of Marine Terraces, Cape Blanco 999
Figure 9). The wave-cut surface contains three different ages of marine terrace deposits--from west to east: Cape Blanco, Pioneer and Silver Butte deposits (Figure 4). On the basis of the extent of these
three marine terrace deposits of different ages (Figure 2) and the underlying wave- cut platform elevations (Figures 3 and 9), I infer that the warped wave-cut platform extending from Cape Blanco to the prominent backedge east of Silver Butte ("backedge of reoccupied platform" in Figure 9) was cut in Silver Butte time (that is, the time immediately prior to deposition of the Silver Butte deposits) and was partially reoccupied by high stands of eustatic sea level in Pioneer
and Cape Blanco time. Evidence for reoccupation is that three
marine terrace deposits of different ages, morphologically separated by backedges and each characterized by distinctive marine sediments, all rest on one continuous
wave-cut platform (compare Figures 2, 6, 7, and 9). The bedrock platform is warped but shows no abrupt elevational discontinuity beneath the backedges, which are cut in the overlying Quaternary deposits. The stratigraphic relation at the Cape Blanco terrace backedge (near site B, Figure 2) demonstrates that the Cape Blanco and Pioneer terraces rest on the same wave-cut platform (Figure 4). An erosional unconformity separates the Pioneer and Cape Blanco deposits and there is no scarp in the wave-cut platform directly below this unconformity (Figure 4).
The contact between Pioneer and Silver
Butte marine terrace deposits, described by Janda (1970), runs along the 4- to 9- m-high Pioneer backedge cut entirely in Silver Butte deposits. The soil developed
on the Pioneer deposits to the west of this backedge is notably less developed than the soil developed on Silver Butte sediments to the east of the backedge, but water well stratigraphic logs show no abrupt elevation change in the wave-cut platform below the terrace backedge (Figures 4, 5 and 9).
The recognition of reoccupation by the sea of previously cut platforms is necessary for deciphering late Quaternary history at Cape Blanco. Misinterpretations have resulted from
assuming the broad flat surface extending east from Cape Blanco represents one sea level high stand. For instance, West and McCrumb [1988] made the above assumption and then assumed sequential surfaces separated by topographically prominent backedges represented sequential sea level high stands. By assigning a numerical age to the Cape Blanco molluscan fossil
locality (based on data in Kennedy et al. [1982]), West and McCrumb [1988] correlated the Cape Blanco terrace with the 60 ka high stand of sea and correlated the outer edge of the next highest surface (called the "120 m Cape Blanco terrace" [West and McCrumb, 1988]) with the 80 ka high stand of sea. The "120 m surface" of West and McCrumb [1988] is actually the outer edge of the Indian Creek terrace surface, which is not likely to be younger than about 200 ka (see discussion earlier).
DEFORMATION OF WAVE-CUT PLATFORMS
Late Quaternary Folding, Tilting and Uplift
The wave-cut platform common to the lowest three marine terraces is deformed
Fig. 9. Structure contour maps that define the configuration of tectonically deformed wave-cut platforms and late Quaternary faults near Cape Blanco. Contour interval is 10 meters. The three adjoining structure contour maps represent wave-cut platforms of different ages. The three platforms, separated by marine terrace backedges, are progressively younger towards the northwest. The northwesternmost platform (the reoccupied platform) was cut by more than one sea level high stand. See further discussion in text. Solid dot, altitude of wave-cut platform determined from field outcrop. Open dot with cross, altitude of wave-cut platform beneath a well site for which stratigraphic well log data was available.
1000 Kelsey: Deformation of Marine Terraces, Cape Blanco
by an east-west trending, doubly-plunging anticline (Figure 9), forming an antiformal depression that roughly coincides with the lowermost reaches of
the Sixes River. The axial trace
intersects the coast about 1-2 km north of
Cape Blanco. The deformed surface, defined by a structure contour map of the combined Cape Blanco-Pioneer-Silver Butte wave-cut platform, has a flattened, saddle shape (Figure 9). The Holocene storm berm is located on the landward-tilted western
flank of the saddle (Figure 9). The Cape Blanco anticline is also apparent on the along-coast topographic profile of marine terrace heights (Figure 3). The next two terraces above the reoccupied platform, the Indian Creek and Poverty Ridge terraces (Figure 2), are both tilted to the southwest (Figure 9).
The original non-tectonic tilt of the wave-cut platforms at Cape Blanco would have been about 0.3-1.0 ø seaward for the
offshore segment that starts about 300- 600 m seaward of the sea cliff [Bradley and Griggs, 1976]. The tilt is in a direction normal to the trend of the
backledge. Given this original tilt magnitude and direction, the magnitude and direction of tectonic tilt since platform cutting can be approximated from a map of present-day tilts calculated for selected locations on the platforms (Figure 10). These tilts are derived from the structure
contours in Figure 9. The length of the tilt arrows (Figure 10) denotes the map- distance length over which tilt was calculated. Most of the Poverty Ridge terrace is tilted seaward to the southwest
by several degrees in excess of the original, non-tectonic seaward tilt. However, the northeastern portion of this terrace tilts northeast, suggesting that the terrace is deformed into an anticline
(Figure 10). The Indian Creek terrace is tilted seaward to the southwest and the
magnitude of seaward tilt is also greater than the original tilt, though not as great as for the Poverty Ridge terrace (Figure 10). Seaward tilts on both the Poverty Ridge and Indian Creek terraces increase in proximity to the Battle Rock fault zone (Figures 9 and 10). From these observations, I infer that the Indian
Creek and Poverty Ridge platforms record progressive southwest-directed tilting with time and that the mechanism of
seaward tilt may possibly be in part block rotation during movement on the Battle Rock fault zone. It is possible that this southwest tilt represents the west flank of an anticlime, the axis of which is for
the most part east of the late Quaternary terraces (Figure 10).
On the reoccupied platform, the Cape Blanco anticline axis is tilted landward
0.3 ø in a direction roughly perpendicular to the backedge of the reoccupied platform (Figure 10). Assuming an original 0.3- 1.0 ø seaward tilt along this axial trend and a 105 ka age for the Pioneer platform on which the axial trace occurs, the landward tilt rate for the anticline axis
is 1.0-22 x 10 -8 rad yr -1 This tilt rate ß
compares favorably with present-day east- west tilt rates in southern and central
coastal Oregon, as calculated from geodetic leveling [Reilinger and Adams, 1982; Adams, 1984], though the geodetic tilt rate may be an inter-seismic tilt rate and as such not related to the long- term tilt rate deduced from marine terrace deformation.
The anticlinal deformation of the
reoccupied platform (Figure 9) results in a variety of tilt magnitudes and directions (Figure 10). However, the tilt magnitudes and directions preclude the possibility that the platform has been tectonically tilted seaward. Rather, the western portion of the reoccupied platform is tectonically tilted landward, and closer to the backedge the eastern portion has a tilt roughly equal to the original non-tectonic seaward tilt (Figure 10).
Comparison of Late Neogene and Early to Middle Quaternary Folding to Late Quaternary Folding
The style of folding of late Neogene and early to middle Quaternary sediments in the Cape Blanco vicinity is similar to that of the late Quaternary wave-cut platforms. The lower to middle Miocene sandstone of Floras Lake [Addicott, 1983; Leithold and Bourgeois, 1984] unconformably overlies both the Jurassic
Kelsey' Deformation of Marine Terraces, Cape Blanco 1001
124 ø 35' 124 ø $0'
42050 '
Tmfl 0.6•'•o BLACKLOCK
POINT 8ø • I I I
6 ø I I
I I
124 ø 25' I
BACKEDGE OF
REOCCUPIED PLATFORM
BACKEDGE Of
\ INDIAN CREEK __
•,,,•TFORM
THEH
42050 '
BACKEDGE OF
POVERTY RIDGE
PLATFORM
• I 124 ø 25'
42 ø 40' 42ø40 ' 124 ø 35' 124 ø 30'
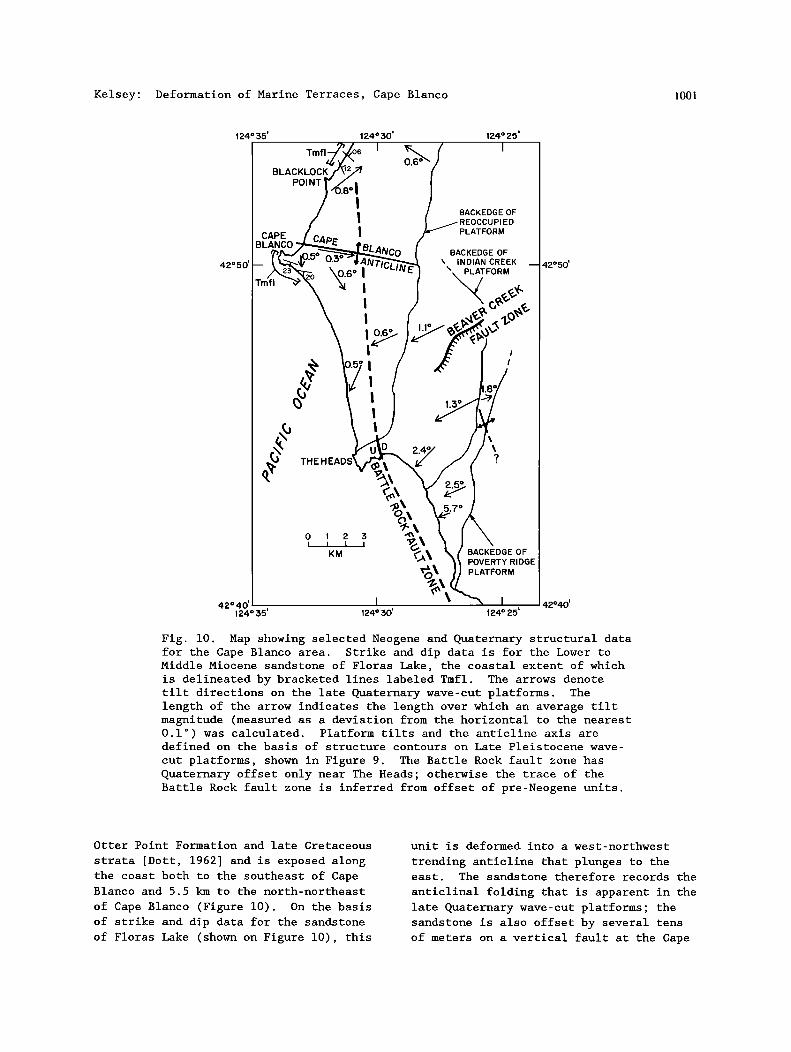
Fig. 10. Map showing selected Neogene and Quaternary structural data for the Cape Blanco area. Strike and dip data is for the Lower to Middle Miocene sandstone of Floras Lake, the coastal extent of which is delineated by bracketed lines labeled Tmfl. The arrows denote tilt directions on the late Quaternary wave-cut platforms. The length of the arrow indicates the length over which an average tilt magnitude (measured as a deviation from the horizontal to the nearest 0.1 ø) was calculated. Platform tilts and the anticline axis are defined on the basis of structure contours on Late Pleistocene wave-
cut platforms, shown in Figure 9. The Battle Rock fault zone has Quaternary offset only near The Heads; otherwise the trace of the Battle Rock fault zone is inferred from offset of pre-Neogene units.
Otter Point Formation and late Cretaceous
strata [Dott, 1962] and is exposed along the coast both to the southeast of Cape Blanco and 5.5 km to the north-northeast
of Cape Blanco (Figure 10). On the basis of strike and dip data for the sandstone of Floras Lake (shown on Figure 10), this
unit is deformed into a west-northwest
trending anticline that plunges to the east. The sandstone therefore records the
anticlinal folding that is apparent in the late Quaternary wave-cut platforms; the sandstone is also offset by several tens of meters on a vertical fault at the Cape
1002 Kelsey' Deformation of Marine Terraces, Cape Blanco
Blanco headland (Figure 8) [Dott, 1962], but the fault does not offset the
overlying wave-cut platform. Stratigraphically separating the
sandstone of Floras Lake from the late
Pleistocene marine terrace sediments, and
exposed along the beach between Cape Blanco and the mouth of the Elk River
(Figure 2), are three other unconformity- bounded late Neogene or Quaternary units [Roth, 1979' Armentrout, 1980; Addicott, 1983]. These units are, in decreasing age, the upper Miocene Empire Formation [Addicott, 1983], a Lower Pleistocene pebbly sandstone unit described by Baldwin [1945] as the lowermost Port Orford Formation and described as a separate formation by Roth [1979], and a Pleistocene sequence containing the Port Orford Formation and the overlying Elk River Beds [Baldwin, 1945' Addicott, 1964].
Cliff face exposures indicate that each successively older unconformity-bounded unit has a greater dip to the south or southeast. The precise strike and dip of these shallowly-dipping Pleistocene units is difficult to measure, but the dip direction of the units south of the cape must generally be to the south, because both the underlying Miocene units and the overlying late Quaternary wave-cut platforms have southerly tilts. I infer that each older unit records progressive tilting to the south or southeast on the south limb of the anticline defined by the sandstone of Floras Lake. On the basis of
the structural data, therefore, it is
likely that anticlinal deformation at Cape Blanco has been occurring at least since the Middle Miocene.
Late Quaternary Fault Zones
The Battle Rock fault zone offsets the
Indian Creek wave-cut platform in the vicinity of Port Orford (Figure 9). The fault zone offsets the headland at Port
Orford from the rest of the platform by approximately 20 m of west-side-up displacement. Indian Creek marine terrace sediments on top of the Battle Rock sea stack and adjacent sea cliffs within the Port Orford city limits are pervasively
cut by mesoscale faults with less than a few meters of offset. The Battle Rock
fault zone is the late Quaternary trace of the tectonostratigraphic terrane-bounding Whalehead fault zone of Blake et al.
[1985]. The Whalehead fault zone has probably accommodated major dextral strike-slip displacement in pre-Eocene time [Blake et al, 1985; Bourgeois and Dott, 1985] and may have accommodated further dextral offset since then [Dott, 1979]. The Battle Rock fault zone is therefore a Quaternary fault that occurs along a major crustal discontinuity separating different Mesozoic accreted terranes. On the basis of the strike-slip offset history of the Whalehead fault zone, I infer that the late Pleistocene movement on the Battle Rock fault zone
occurs on a steeply-dipping fault. Assuming that the Battle Rock fault
zone follows the trace of the Whalehead
fault zone to the north of Port Orford
[Blake et al., 1985] where it is buried by sediments of the Pioneer and Cape Blanco terraces, the Battle Rock fault zone intersects the coast north of Blacklock
Point, about 6 km north-northwest of Cape Blanco (Figure 10). Latest significant movement on the Battle Rock fault zone is
probably before cutting of the Pioneer wave-cut platform because the Pioneer backedge is not laterally offset and the Pioneer platform is not vertically offset by the fault zone, within the ñ6 m altitudinal resolution of the well log data.
The Beaver Creek fault zone (Janda,
1970) (Figures 2, 3, and 10) is the other major fault zone in the vicinity of Cape Blanco that has accommodated significant late Quaternary offset. The northeast- trending fault zone, which consists of at least six closely-spaced normal faults that dip 60o-75 ø to the southeast, offsets the Indian Creek terrace surface.
At least two of the faults cumulatively offset the B horizon of the marine terrace
soil by 4.5 m. A step in the wave-cut platform at the fault zone (Figures 4 and 9) indicates a maximum of approximately 40 m of northwest-side-up normal displacement on the Indian Creek surface since the
Indian Creek platform was cut.
Kelsey: Deformation of Marine Terraces, Cape Blanco 1003
Displacement along the fault zone decreases to the southwest (Figure 9). Latest movement on the Beaver Creek fault
zone is probably younger than latest movement on the Battle Rock fault zone
because the Indian Creek soil is offset
only in the case of the Beaver Creek fault zone.
The Beaver Creek fault zone has
accommodated a large but undetermined amount of total displacement because it separates the Jurassic-Cretaceous Sixes
River terrane from the Cretaceous Rocky Point Formation [Koch, 1966] of the Elk
subterrane [Blake et al., 1985]. Original movement on the fault predates the Eocene overlap assemblage of south coastal Oregon [Blake et al., 1985] and the trend of the fault reflects a discontinuity in Mesozoic accreted crust. The Beaver Creek fault is
notable as a forearc fault that has caused
net extension, not contraction, of the
crust underlying the Indian Creek marine terrace in late Pleistocene time.
Several mesoscale faults offset
Pleistocene strata in the vicinity of the storm berm and Goldwasher•s Gully (shaded area near Goldwasher•s Gully on Figure 8). All the faults trend N20øW to N14øE and
have vertical displacements op to 5 m. One of these faults, a reverse fault at
Goldwasher•s Gully (Figure 8), offsets the lower Pleistocene pebbly sandstone of Roth [1979] by 5 m but does not offset overlying strata. The other mesoscale faults, which occur in the sea cliff 150 m
southeast of Goldwasher•s Gully, trend parallel and subparallel to the trend of Goldwasherfs Gully and offset the Pioneer terrace sediments by several meters down- to-the-southwest on low angle (18•-29•) normal faults. At least one of the faults
offsets the soil on the Pioneer marine
terrace.
UPLIFT RATES AND CONSTRAINTS ON
REOCCUPATION
Late Quaternary Uplift Rates
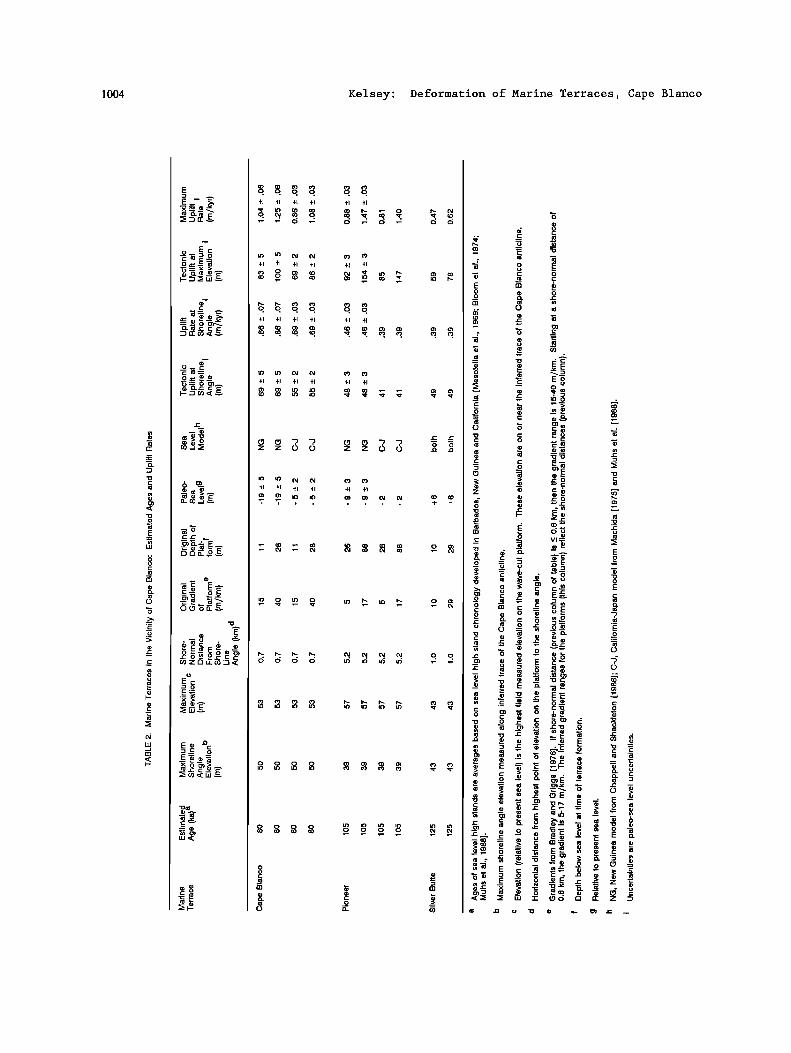
Calculation of uplift rates for wave- cut platforms requires age estimates for the platforms. As previously discussed, the age estimates for the three terraces
of the reoccupied platform are 80, 105, and 125 ka (Table 2). The ages of the sea level high stands are averages based on the marine terrace chronologies developed for Barbados, New Guinea and California
[Mesolella et al., 1969; Bloom et al., 1974; Chappell and Shackleton, 1986; Muhs et al., 1988].
Uncertainties for the paleo-sea level curve for coastal Oregon combined with the anticlinal deformation on the reoccupied platform pose several difficulties in calculating uplift rates. For seaward- dipping platforms, the point of maximum elevation coincides with a point on the shoreline angle, which is the angle formed by the junction of the wave-cut platform and the sea cliff. For landward-dipping platforms, the point of maximum elevation is seaward of the shoreline angle; and when the shoreline angle was cut, the point was below the interstadial or interglacial sea-level high stand elevation. The original depth of this point depends on the initial seaward tilt of the platform. Hence, estimates of
subsequent uplift of a point seaward of the shoreline angle must account for the paleo-water depth at this point, as well as for the paleo sea-level elevation. To
correct for the range of possible paleo depths, I have used measured gradients of modern wave-cut platforms in Bradley and Griggs [1976] . The approximate gradient of the modern platform offshore of Cape Blanco, from the coast out to about 3 km,
is 9-14 m/km, as measured from bathymetric contours on U. S. Geological Survey topographic maps. This gradient range is within the gradient range measured by Bradley and Griggs [1976] for the planar offshore segment (starting 300-600 m offshore), which is 5-17 m/km.
Another essential factor in calculating platform uplift rates is the paleo sea- level high stand elevations. I have employed two alternative late Pleistocene paleo sea-level models, the New Guinea model (using the revised data of Chappell and Shackleton [1986]) and the California- Japan model, which utilizes sea level data from Machida [1975] and Muhs et al. [1988] (Table 2).
1004 Kelsey' Deformation of Marine Terraces, Cape Blanco
q q q q +l +l +l +1 +l +l
--' --. o • d ,-: d .,.z d d
+1 +1 +1 +1 +1 +1
o q ß q +1 +1 +1 +[ +1 +1
ID ID OJ OJ •'• •'•
+[ +1 +1 +1 +1 +1
Z Z 0 0 Z Z 0 0 ..•
ID ID C• C• (9 ('3 +1 +1 +1 +1 +1 +1
, , , , , , , , --
,.: ,.: ,.: ,.: • • o.! • q q 0 0 0 0 •0 •0 •0 •0 •-
0 0 0 0 (3) (3) (3) 03 •3 ½')
8
Kelsey: Deformation of Marine Terraces, Cape Blanco 1005
Table 2 provides uplift and uplift rate data for two points on each terrace, the point of maximum elevation and the point of maximum elevation on the shoreline
angle. All of these points fall on the Cape Blanco anticline axis. The point of maximum uplift on each platform is located at varying shore-normal distances from the shoreline angle of the respective platform (Table 2). Because the anticline axis on
the reoccupied platform plunges to the east over most of its extent (Figure 9), the highest point on the wave-cut platform of each of the Cape Blanco and Pioneer terraces is at the western edge. For the Silver Butte terrace, the maximum platform elevation is near the center of the small
remnant of this platform. Because the anticline deforms all three platforms and uplift rate is more dependent on position within the anticline than on the age of formation of the platform, comparison of uplift rates among platforms using calculated maximum uplift rates cannot be used to detect any regional changes in uplift rate with successively younger platforms.
The ranges of possible maximum uplift rates for the three platforms are 0.8-1.3 m/ky for the Cape Blanco platform, 0.8-1.5 m/ky for the Pioneer platform, and 0.5-0.6 m/ky for the Silver Butte platform (Table 2). The large ranges reflect both paleo- water depth and paleo sea-level uncertainties for the platforms. The lower uplift rates and the lower ranges for the Silver Butte platform reflect the landward position of this terrace in the lowest portion of the anticline axis as well as an assumed +6 m [Ku et al., 1974; Harmon et al., 1983] elevation for the 125
ka interglacial sea-level high stand. The ranges of maximum uplift rates for the Cape Blanco and Pioneer terraces, which are similar, reflect both the position of the points of maximum elevation for both of these platforms on the anticline axis near Cape Blanco and a similar degree of uncertainty about paleo-water depths and sea- level elevations.
The uplift rates for the shoreline angle positions (Table 2), which are not dependent on estimates of platform gradient, show similar uplift rates for
the Silver Butte and Pioneer platforms and a significantly greater uplift rate for the Cape Blanco platform. The uplift rate variation is again a function of shoreline angle position relative to position along the anticline axis. The Cape Blanco shoreline angle is at Cape Blanco where the anticline axis is highest and the Pioneer and Silver Butte shoreline angles are in the eastern portion of the reoccupied platform where the anticline axis is relatively low.
The calculation of tectonic uplift at the shoreline angle (Column 10, Table 2) assumes the shoreline angle altitude is initially the same at all points on the shoreline and that this initial altitude
is given by the sea level model (Column 9, Table 2). However, the original altitude of the shoreline angle can vary locally by up to 4 m, depending on the geological factors and on the degree of embayment of the coastline [Wright, 1970; Trenhaile, 1980]. Accounting for this variation, tectonic uplift at the shoreline angle has an additional uncertainty of +2 m that is not incorporated into Table 2.
Reoccupation and Constraints on
Interstadial Uplift Rate
To what extent does the fact that the
lowest three wave-cut platforms at Cape Blanco merge into one surface (the reoccupied platform) impose constraints on
uplift or subsidence rates in the interstadial periods between sea-level high stands at 125 and 105 ka and at 105 and 80 ka? To answer this question, I assumed that for reoccupation to occur,
the point that is presently at the maximum elevation on a wave-cut platform (Column 4, Table 2) had to be, at the time of reoccupation, no higher than the shoreline angle elevation of the successive sea- level high stand. If this point was significantly higher, then the successive sea-level high stand would carve a sea cliff below that point and there would be clear spatial separation of the platforms. If this point was significantly lower, then the successive sea level high stand would carve a platform higher than the
1006 Kelsey: Deformation of Marine Terraces, Cape Blanco
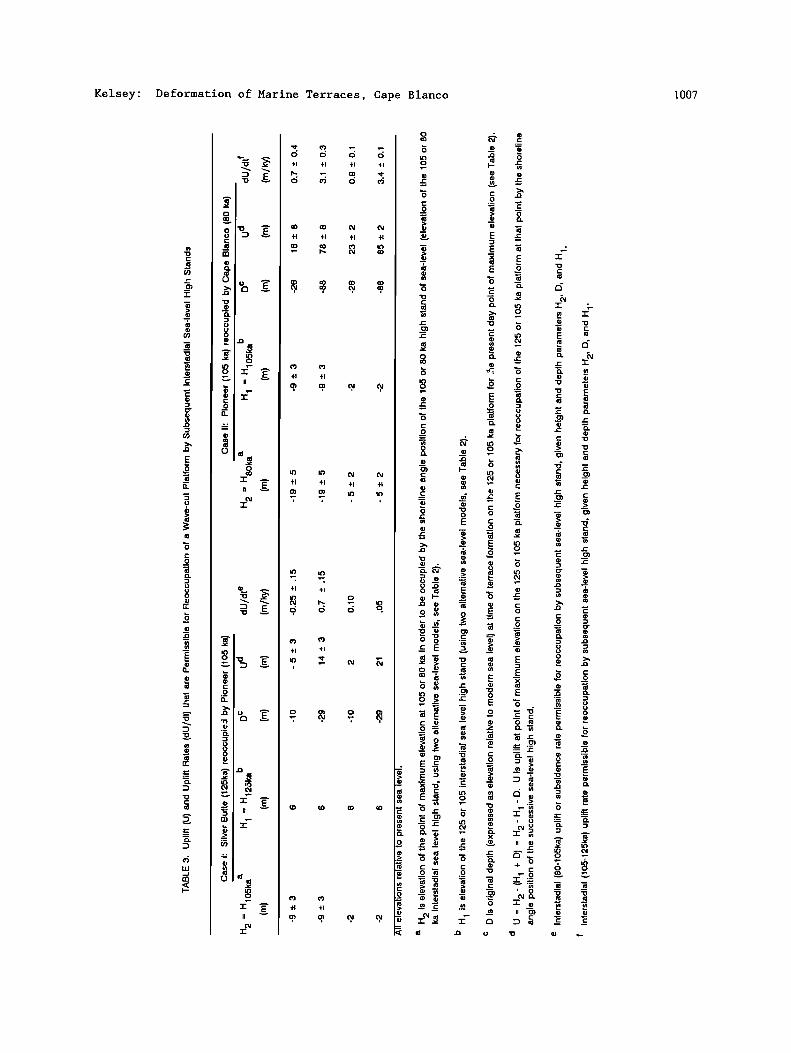
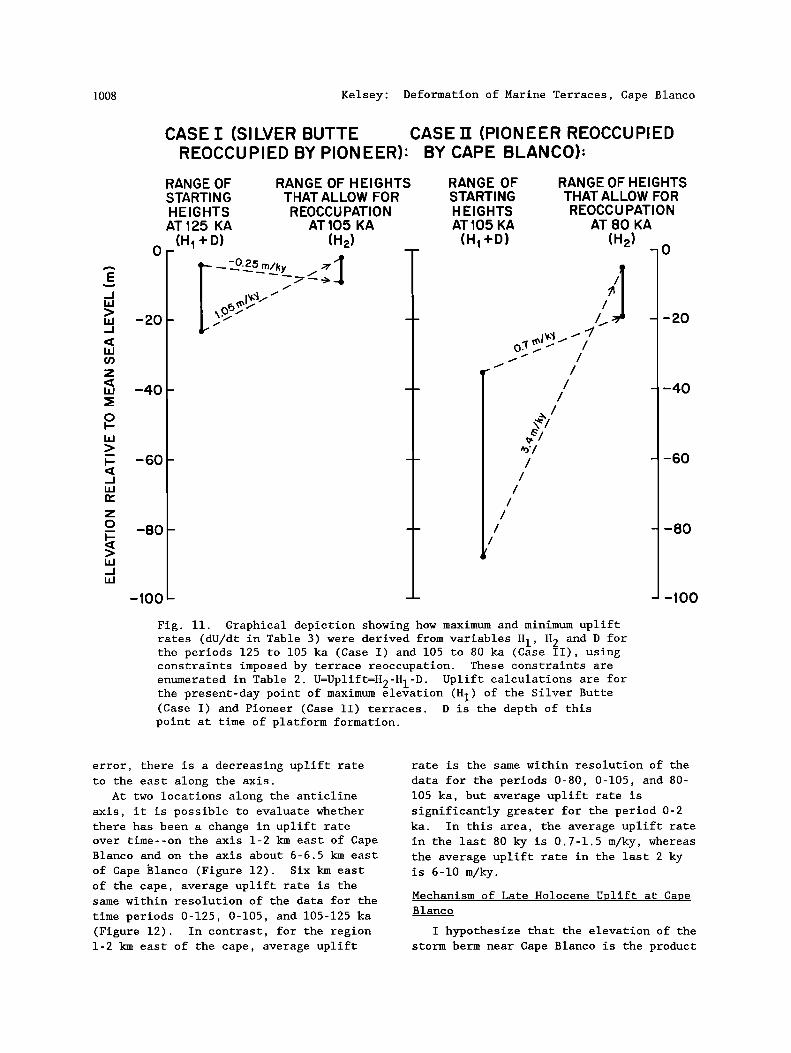
prior platform, burying or eroding the prior platform. Using this assumption, I calculated the uplift (or subsidence), U, necessary for the point of maximum elevation in order for this point to be in a position to be reoccupied by the subsequent sea level high stand,
U -- H 2 - (H I + D) = H 2 - H I - D
where H2, H 1 and D are defined in Table 3. I then calculated the intersradial uplift rate (or subsidence rate), dU/dt, permissible for reoccupation to occur for two cases: Silver Butte platform (125 ka) reoccupied by Pioneer sea-level high stand (105 ka, dr=20 ky), and Pioneer platform (105 ka) reoccupied by Cape Blanco sea- level high stand (80 ka, dr=25 ky) (Table 3). Figure 11 graphically depicts how uplift is the numerical difference between
H 2 and the sum (Hi+D) . Figure 11 also shows how the range of starting heights and the range of ending heights that allow for reoccupation together yield maximum and minimum possible uplift (or subsidence) magnitudes.
The magnitude of subsidence or uplift required for the first case, Silver Butte reoccupied by Pioneer, is -5 to 21 m (Table 3). The required magnitude of uplift required for the second case, Pioneer reoccupied by Cape Blanco, is 16 to 85 m (Table 3). The intersradial
uplift, or subsidence, rates required for reoccupation are -0.25 m/ky to 1.05 m/ky for Silver Butte reoccupied by Pioneer (105-125 ky) and 0.7 m/ky to 3.4 m/ky for Pioneer reoccupied by Cape Blanco (80-105 ky) (Table 3). The large range of these values reflect, again, both palco-depth uncertainties for the point of maximum uplift and palco-sea level uncertainties (Table 2).
Therefore, the two successive instances
of platform reoccupation could have occurred under conditions of subsidence
followed by uplift, no change in elevation followed by uplift, or persistent uplift. It is notable that even though the Cape Blanco sea-level high stand elevation was somewhere between 3-24 m lower than the
Pioneer sea-level high stand elevation (Tables 2 and 3), uplift is necessary
between 105 and 80 ka for the Pioneer
platform to have been reoccupied by the Cape Blanco sea-level high stand because of the original depth of the Pioneer platform (Column 7, Table 2). Because the reoccupation at 105 ka and 80 ka occurred at two different positions on the anticline axis, local deformation due to
continued growth of the anticline probably exerts a greater control on the calculated intersradial uplift rates, and hence on the possibility of reoccupation, than any regional change in uplift rate.
The above analysis shows that reoccupation of previously-cut marine platforms can occur under a range of conditions of platform gradient, palco-sea level high stand elevation and deformation history. Instances of reoccupation, such as at Cape Blanco, should not be unusual and should be evident on other coastlines
with negligible to moderate uplift and/or subsidence rates.
DISCUSSION
Local Structures and Temporal and Spatial Variations in Uplift
Maximum Late Pleistocene and Holocene
uplift occurs at the latitude of Cape Blanco. Subsidence is occurring along the coast only 10 km to the north and south of Cape Blanco (Figure 3). The storm berm, whose uplift rate is unusually high for the coast along the Cascadia subduction zone, occurs near the axis of the Cape Blanco anticline. This fold has been
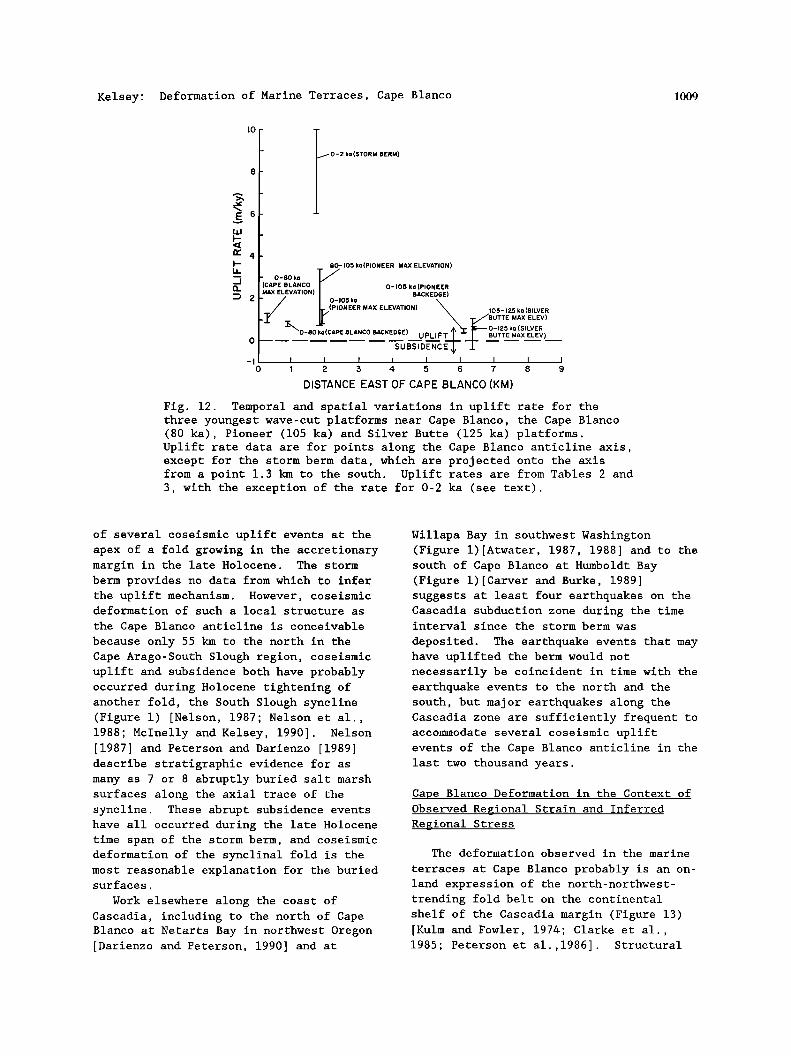
growing throughout the latest Pleistocene and Holocene. The uplift rate for the berm is characteristic only of the hinge region of this local structure. The Late Pleistocene folding has therefore generated significant spatial variation in uplift rate in the Cape Blanco area (Figures 3 and 9). Such spatial variation in uplift rate due to folding is also the case for wave-cut platforms in the Cape Arago region, 55 km to the north (Figure 1) [Mclnelly and Kelsey, 1990]. Figure 12 graphically shows spatial variation in uplift rate along the Cape Blanco anticline axis. Within the limits of
Kelsey' Deformation of Marine Terraces, Cape Blanco 1007
1008 Kelsey' Deformation of Marine Terraces, Cape Blanco
CASE I (SILVER BUTTE CASE TT (PIONEER REOCCUPIED REOCCUPIEDBYPIONEER)' BY CAPE BLANCO)'
•
-60
-190
RANGE OF RANGE OF HEIGHTS RANGE OF RANGE OF HEIGHTS STARTING THAT ALLOW FOR STARTING THAT ALLOW FOR H E I G HT S R EOCCU PATI 0 N H E I G HTS REOCC U PATI 0 N AT 12:5 KA AT 105 KA AT 105 KA AT 80 KA
(H• +D) (H•,) (H• +D) (H•,) -0
-100 -
/
/ /
/ /
/
-2O
-4O
-6O
- -80
- -lOO
Fig. 11. Graphical depiction showing how maximum and minimum uplift rates (dU/dt in Table 3) were derived from variables Hi, H 2 and D for the periods 125 to 105 ka (Case I) and 105 to 80 ka (Case II), using constraints imposed by terrace reoccupation. These constraints are enumerated in Table 2. U=Uplift=H2-H1-D. Uplift calculations are for the present-day point of maximum elevation (Hi) of the Silver Butte (Case I) and Pioneer (Case II) terraces. D is the depth of this point at time of platform formation.
error, there is a decreasing uplift rate to the east along the axis.
At two locations along the anticline axis, it is possible to evaluate whether there has been a change in uplift rate over time--on the axis 1-2 km east of Cape Blanco and on the axis about 6-6.5 km east
of Cape •lanco (Figure 12). Six km east of the cape, average uplift rate is the same within resolution of the data for the
time periods 0-125, 0-105, and 105-125 ka (Figure 12). In contrast, for the region 1-2 km east of the cape, average uplift
rate is the same within resolution of the
data for the periods 0-80, 0-105, and 80- 105 ka, but average uplift rate is significantly greater for the period 0-2 ka. In this area, the average uplift rate in the last 80 ky is 0.7-1.5 m/ky, whereas the average uplift rate in the last 2 ky is 6-10 m/ky.
Mechanism of Late Holocene Uplift at Cape Blanco
I hypothesize that the elevation of the storm berm near Cape Blanco is the product
Kelsey' Deformation of Marine Terraces, Cape Blanco ]009
10-
rr 4
0
0-2 ka (STORM BERM)
80-105 ka (PIONEER MAX ELEVATION)
0-80 ka CAPE BLANCO / 0-•0• ,o(P•ONEE. MAX ELEVATION) ! BACKEDGE)
__/ •/(PIONEER MAX ELEVATION) • 105-125 ka (SILVER
• 0-125 ka (SILVER O-8Oko(CAPE BLANCO BACKEDGE) UPLI BUTTE MAX ELEV)
-1 i i I ! i i i i i o 1 2. 5 4 5 6 7 8 9
DISTANCE EAST OF CAPE BLANCO (KM)
Fig. 12. Temporal and spatial variations in uplift rate for the three youngest wave-cut platforms near Cape Blanco, the Cape Blanco (80 ka), Pioneer (105 ka) and Silver Butte (125 ka) platforms. Uplift rate data are for points along the Cape Blanco anticline axis, except for the storm berm data, which are projected onto the axis from a point 1.3 km to the south. Uplift rates are from Tables 2 and 3, with the exception of the rate for 0-2 ka (see text).
of several coseismic uplift events at the apex of a fold growing in the accretionary margin in the late Holocene. The storm berm provides no data from which to infer the uplift mechanism. However, coseismic deformation of such a local structure as
the Cape Blanco anticline is conceivable because only 55 km to the north in the Cape Arago-South Slough region, coseismic uplift and subsidence both have probably occurred during Holocene tightening of another fold, the South Slough syncline (Figure 1) [Nelson, 1987; Nelson et al., 1988; Mclnelly and Kelsey, 1990]. Nelson [1987] and Peterson and Darienzo [1989] describe stratigraphic evidence for as many as 7 or 8 abruptly buried salt marsh surfaces along the axial trace of the syncline. These abrupt subsidence events have all occurred during the late Holocene time span of the storm berm, and coseismic deformation of the synclinal fold is the most reasonable explanation for the buried surfaces.
Work elsewhere along the coast of Cascadia, including to the north of Cape Blanco at Netarts Bay in northwest Oregon [Darienzo and Peterson, 1990] and at
Willapa Bay in southwest Washington (Figure 1)[Atwater, 1987, 1988] and to the south of Cape Blanco at Humboldt Bay (Figure 1)[Carver and Burke, 1989] suggests at least four earthquakes on the Cascadia subduction zone during the time interval since the storm berm was
deposited. The earthquake events that may have uplifted the berm would not necessarily be coincident in time with the earthquake events to the north and the south, but major earthquakes along the Cascadia zone are sufficiently frequent to accommodate several coseismic uplift events of the Cape Blanco anticline in the last two thousand years.
Cape Blanco Deformation in the Context of Observed Regional Strain and Inferred Regional Stress
The deformation observed in the marine
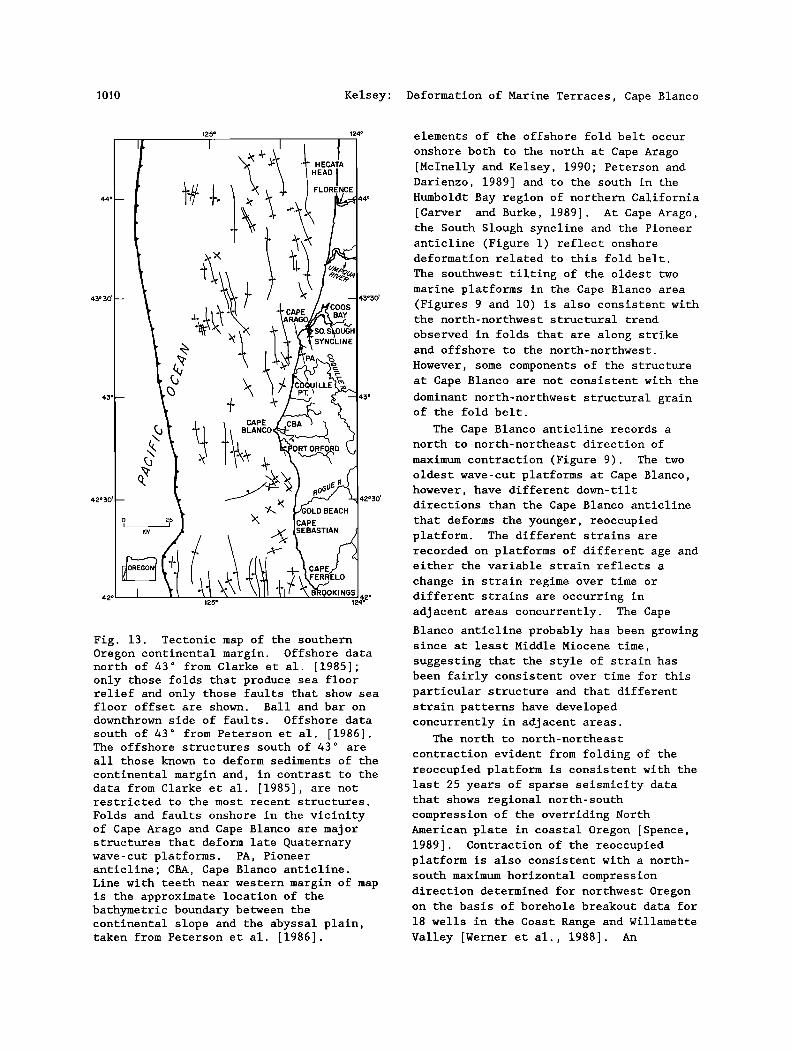
terraces at Cape Blanco probably is an on- land expression of the north-northwest- trending fold belt on the continental shelf of the Cascadia margin (Figure 13) [Kulm and Fowler, 1974; Clarke et al., 1985; Peterson et al.,1986]. Structural
1010 Ke!sey: Deformation of Marine Terraces, Cape Blanco
1•5 o 1•4 o
I I
44 ø • • , 44ø
45 ø 30' 43ø30 '
CAPE
42ø30' • 42ø30' • BEACH
o• 2• • CAPE KM • •SEBASTIAN
42 ø 125 ø
Fig. 13. Tectonic map of the southern Oregon continental margin. Offshore data north of 43 ø from Clarke et al. [1985]; only those folds that produce sea floor relief and only those faults that show sea floor offset are shown. Ball and bar on
downthrown side of faults. Offshore data
south of 43 ø from Peterson et al. [1986]. The offshore structures south of 43 ø are
all those known to deform sediments of the
continental margin and, in contrast to the data from Clarke et al. [1985], are not restricted to the most recent structures.
Folds and faults onshore in the vicinity of Cape Arago and Cape Blanco are major structures that deform late Quaternary wave-cut platforms. PA, Pioneer anticline; CBA, Cape Blanco anticline. Line with teeth near western margin of map is the approximate location of the bathymetric boundary between the continental slope and the abyssal plain, taken from Peterson et al. [1986].
elements of the offshore fold belt occur
onshore both to the north at Cape Arago [Mclnelly and Kelsey, 1990; Peterson and Darienzo, 1989] and to the south in the
Humboldt Bay region of northern California [Carver and Burke, 1989]. At Cape Arago, the South Slough syncline and the Pioneer anticline (Figure 1) reflect onshore deformation related to this fold belt.
The southwest tilting of the oldest two marine platforms in the Cape Blanco area (Figures 9 and !0) is also consistent with the north-northwest structural trend
observed in folds that are along strike and offshore to the north-northwest.
However, some components of the structure at Cape Blanco are not consistent with the
dominant north-northwest structural grain of the fold belt.
The Cape Blanco anticline records a north to north-northeast direction of
maximum contraction (Figure 9). The two oldest wave-cut platforms at Cape Blanco, however, have different down-tilt
directions than the Cape Blanco anticline that deforms the younger, reoccupied platform. The different strains are recorded on platforms of different age and either the variable strain reflects a
change in strain regime over time or different strains are occurring in adjacent areas concurrently. The Cape
Blanco anticline probably has been growing since at least Middle Miocene time,
suggesting that the style of strain has been fairly consistent over time for this particular structure and that different strain patterns have developed concurrently in adjacent areas.
The north to north-northeast
contraction evident from folding of the reoccupied platform is consistent with the last 25 years of sparse seismicity data that shows regional north-south compression of the overriding North American plate in coastal Oregon [Spence, 1989]. Contraction of the reoccupied platform is also consistent with a north- south maximum horizontal compression
direction determined for northwest Oregon on the basis of borehole breakout data for
18 wells in the Coast Range and Willamette Valley [Werner et al., 1988]. An
Kelsey: Deformation of Marine Terraces, Cape Blanco loll
unresolved question is whether this apparent north-south compression is indeed regional, as suggested by the sparse seismicity and borehole breakout data, or whether the compression is spatially variable. If the regional stress in coastal Oregon has a consistently north- south principle compression axis, then in the vicinity of Cape Blanco this stress is manifest by a variable strain that includes east-west-trending folding of the youngest platforms and north-northwest trending folding of the older platforms and the offshore fold belt.
CONCLUSIONS
Five elevated marine terraces occur in
the vicinity of Cape Blanco in south coastal Oregon. The youngest three terraces were formed during the 125, 105, and 80 ka high stands of sea and the deposits of these terraces rest on a single, deformed wave-cut platform. The 80 and 105 ka ages are correlated ages and have a greater degree of certainty than the 125 ka age, which is an inference based on the fact that a prominent sea- level high stand occurred at this time and the terrace soil is conceivably 125 ky old. The combined 80-105-125 ka wave-cut
platform is deformed into an east-west trending anticline with the axial trace passing just north of Cape Blanco. The fact that this platform was reoccupied twice by high stands of the sea after it was initially cut at 125 ka places broad constraints on the history of vertical deformation in the vicinity of the anticline axis. Either subsidence or
uplift could have occurred between 125 and 105 ka but uplift must have occurred between 105 and 80 ka in order for
platform reoccupation to have taken place. With the exception of the last 2 ky when maximum uplift rate is 6-10 m/ky, average maximum uplift rates since 125 ka are modest and on the order of 0.5-1.4 m/ky along the anticline axis. In addition to the possibility of nonuniform uplift rate in the late Quaternary, uplift rates are spatially variable as well. Cape Blanco has been uplifted to an elevation of 53 m
since 80 ka at the same time that
subsidence has been occurring along the coast less than 10 km to both the north
and south. A late Holocene storm berm
rests near the axis of the anticline and
the berm has been tectonically uplifted 12-16 m in the last 2,000 years. The elevation of the berm attests to late
Holocene growth of the anticline. Coseismic deformation has occurred
repeatedly along the Cascadia margin and it is possible that uplift of the berm occurs coseismically during earthquake events that further tighten the fold.
The late Pleistocene and Holocene
deformation at Cape Blanco is an on-land expression of a fold belt that trends north-northwest on the continental shelf
of Oregon. Folding of marine terraces at Cape Arago, 55 km to the north, and tilting of the oldest two marine terraces at Cape Blanco are both consistent with the deformation trend in this fold belt.
However, strain recorded by the Cape Blanco anticline in the latest Pleistocene
marine terraces is most consistent with a
north to north-northeast-oriented
principal axis of contraction. Strain recorded by the anticline is compatible with present-day north-south compression as deduced from seismicity and borehole breakout data in the western Oregon portion of the North American plate in the last few decades [Werner et al., 1988;
Spence, 1989]. If the regional stress in coastal Oregon has a north-south principle compression axis, then this stress is manifest by a variable pattern of strain in the general region of Cape Blanco.
Acknowledgments. Field work supported by U.S. Geological Survey Earthquake Hazards Reduction Program, contract 14-08- 0001-G1387, and National Science Foundation
grant EAR-8903470. Additional assistance from a Western Washington University Research Activities Grant and a Western
Washington University Summer Research Grant. R.M. Burke conducted the initial
soil investigation with me. J.G. Bockheim shared his preliminary results of a more thorough soils investigation being carried out in conjunction with this project. W. Miller III identified pholadid specimens in
1012 Kelsey' Deformation of Marine Terraces, Cape Blanco
the storm berm. Discussions with G.W.
McInelly and D.R. Muhs improved the manuscript. Reviewed by J. Adams, B.F. Atwater, I.P. Madin, D.R. Muhs, R.S. Yeats and one anonymous reviewer for Tectonics.
REFERENCES
Adams, J., Active deformation of the
Pacific northwest continental margin, Tectonics, •, 449-472, 1984.
Addicott, W. O., A late Pleistocene invertebrate fauna from southwestern
Oregon, J. Paleontol., 38, 650-661, 1964.
Addicott, W. 0., Biostratigraphy of the marine Neogene sequence at Cape Blanco, southwestern Oregon, U.S. Geol. Surv. Prof. Pap., 774-G, 19 pp, 1983.
Armentrout, J. M., Field trip road log for the Cenozoic stratigraphy of Coos Bay and Cape Blanco, southwestern Oregon, in Geologic Field Trips in Western Oregon and Southwestern Washington, Bull. Oreg. Dep. Geol. Miner. Ind., 101, 177-217, 1980.
Atwater, B. F., Evidence for great Holocene earthquakes along the outer coast of Washington, Science, 236, 942-944, 1987.
Atwater, B. F., Geologic studies of seismic
tectonic coast: New 230Th/234U dates from the Huon Peninsula, New Guinea,
Quat. Res., 4, 185-205, 1974.
Bodin, P. and T. Klinger, Coastal uplift and mortality of intertidal organisms caused by the September 1985 Mexico earthquakes, Science, 233, 1071-1073,1986.
Bourgeois, J., and R. H. Dott, Stratigraphy and sedimentology of the Upper Cretaceous rocks of southwest Oregon: evidence for wrench fault tectonics in a postulated accretionary terrane, Geol. Soc. Am. Bull., 96, 1007-1019, 1985.
Bradley, W. C., and G. B. Griggs, Form, genesis, and deformation of central California wave-cut platforms, Geol. Soc. Am. Bull., 87, 433-449, 1976.
Brownfield, M. E., R. L. Phillips, and R. L. Lent, Geologic map of the Langlois Quadrangle, Oregon, Oreg. Dep. Geol. Miner. Ind. Open-File Rep. 82-03, scale 1:31,250, 1982.
Carver, G. A., and R. M. Burke, Late
Holocene paleoseismicity of the Gorda segment of the Cascadia subduction zone, Geol. Soc. Am. Abstr. Programs,21, 64, 1989.
Chappell, J., and N.J. Shackleton, Oxygen isotopes and sealevel, Nature, 234, 137- 140, 1986.
zonation of the Puget lowland, U.S. Geol. Clarke, S. H., M. E. Field, and C. A. Surv. Open-File Rep.,88-16,120-133,1988.
Baldwin, E. M., Some revisions of the late
Cenozoic stratigraphy of the southern Oregon coast, J. Geol., 52, 35-46, 1945.
Baldwin, E. M., Eocene stratigraphy of southwest Oregon, Bull. Oreg. Dep. Geol. Miner. Ind., 83, 48 pp, 1974.
Berryman, K. R., Y. Ota, and A. G. Hull, Holocene paleoseismicity in the fold and thrust belt of the Hikurangi subduction zone, eastern North Island, New Zealand,
Tectonophysics, 163, 185-195, 1989.
Blake, M. C., D.C. Engebretsen, A. S. Jayko, and D. L. Jones, Tectonostratigraphic terranes in southwest Oregon, in Tectonostratigraphic Terranes of the Circum-Pacific Region, Circum-Pac. Coun. Energy Mine. Resour.• Earth Sci. Ser., 1, p. 147-157, 1985.
Bloom, A., W. S. Broecker, J. Chappell, R. K. Matthews, and K. J. Mesolella,
Quaternary sealevel fluctuations on a
Hirozawa, Reconnaissance geology and geologic hazards of the offshore Coos Bay basin, Oregon, U.S. Geol. Surv. Bull., 1645, 41 pp, 1985.
Clifton, H. E., R. E. Hunter, and R. L.
Phillips, Depositional structures and processes in the non-barred high-energy nearshore, J. Sediment. Petrol., 41, 651-
670, 1971. Colman, S. M., K. L. Pierce, and P. W.
Birkeland, Suggested terminology of Quaternary dating methods, Quat. Res., 28, 314-319, 1987.
Darienzo, M.E. and C.D. Peterson, Episodic tectonic subsidence of late Holocene salt
marshes, northern Oregon central Cascadia margin, Tectonics, •, 1-22, 1990.
Dott, R. H., Geology of the Cape Blanco area, southwest Oregon, Ore Bin, 24, 121- 133, 1962.
Dott, R. H., Geology of the southwestern Oregon coast west of the 124th meridian,
Kelsey' Deformation of Marine Terraces, Cape Blanco 1013
Bull. Oreg. Dep. Geol. Miner. Ind., 69, 63 pp, 1971.
Dott, R. H., Comment on Intracontinental
plate boundary east of Cape Mendocino, California, Geology, •, 322-323, 1979.
Dupre, W. R., and H. E. Clifton, Modern and ancient coastal sedimentary facies, Monterey Bay, California, in Field trip guidebook for the Geological Society of America Cordilleran section meeting at San Jose, California, April, 1979,50 pp, 1979.
Griggs, A. B., Chromite-bearing sands of
Kulm, L. D., and G. A. Fowler, Oregon continental margin structure and stratigraphy: a test of the imbricate thrust model, in The Geology of Continental Margins, edited by C.A. Burk and C.L. Drake, pp. 261-284• Springer- Verlag, New York, 1974.
Leithold, E. L., and J. Bourgeois, Characteristics of coarse graiq•d sequences deposited in nearshore, wave- dominated environments -- examples from the Miocene of south-west Oregon, Sedimentology, 31, 749-775, 1984.
the southern part of the coast of Oregon, Machida, H., Pleistocene sea-level of south U.S. Geol. Surv. Bull., 945-E, 113-150
and 11 plates, 1945. Harmon, R. S., R. M. Mitterer, N.
Kriausakul, L. S. Land, H. P. Schwarcz, P. Garrett, G. J. Larson, H. L. Vacher, and M. Rowe, U-series and amino-acid
racemization geochronology of Bermuda - implications for eustatic sea-level fluctuation over the past 250,000 years,
Kanto, Japan, analysed by tephrochronology, Bull. R. Soc. N. Z., 13, 215-222, 1975.
Matsuda, T., Y. Ota, M. Ando, and N.
Yonekura, Fault mechanism and recurrence
time of major earthquakes in southern Kanto district, Japan, as deduced from coastal terrace data, Geol. Soc. Am.
Bull., 89, 1610-1618, 1978.
Palaeogeog.• Palaeoclimatol. Palaeoecol., McInelly, G. W. and H. M. Kelsey, Late 44, 41-70, 1983. Quaternary tectonic deformation in the
Hunter, R. E., Depositional environments of some Pleistocene coastal terrace
deposits, southwestern Oregon -- case history of a progradational beach and dune sequence, Sediment. Geol., 27, 241- 262, 1980.
Janda, R. J., Age and correlation of marine terraces near Cape Blanco, Oregon, Geol. Soc. Am. Abstr. Program, •, 29-30, 1969.
Kennedy, G.L., Pleistocene ecology, zoogeography and geochronology of marine invertebrate faunas of the Pacific
northwest coast (San Francisco Bay to Puget Sound), Ph.D. thesis, 824 pp., Univ. of Calif., Davis, 1978.
Kennedy, G. L., K. R. Lajoie, and J. F. Wehmiller, Aminostratigraphy and faunal correlations of late Quaternary marine terraces, Pacific Coast, USA, Nature,
299, 545-547, 1982.
Koch, J. G., Late Mesozoic stratigraphy and tectonic history, Port Orford-Gold Beach area, southwestern Oregon coast, Am. Assoc. Pet. Geol. Bull., 50, 25-71, 1966.
Ku, T. L., M. A. Kimmel, W. H. Easton and
T.J. O'Neil, Eustatic sea level 120,000
years ago on Oahu, Hawaii, Science, 183, 959-962, 1974.
Cape Arago-Bandon region of coastal Oregon as deduced from wave-cut platforms, J. Geophys. Res., 95, 6699- 6713, 1990.
Mesolella, K. J., R. K. Matthews, W. S. Broecker, and D. L.Thurber, The
astronomical theory of climatic change: Barbados data,J. Geo.,77, 250-274,1969.
Moore, J. G. and G. W. Moore, Deposit from a giant wave on the island of Lanai, Hawaii, Science, 226, 1312-1315, 1984.
Muhs, D. R., G. L. Kennedy, and T. K. Rockwell, Uranium-series ages of corals from marine terraces, Pacific coast of
North America: Implications for the timing and magnitude of late Pleistocene sea level changes, Am. Quat. Assoc. Progam Abstr., 10th Biennial Meeting, 140, 1988.
Muhs, D. R., H. M. Kelsey, G. H. Miller, G. L. Kennedy, J. F. Whelan, and G. W. Mclnelly, Age estimates and uplift rates for late Pleistocene marine terraces:
southern Oregon portion of the Cascadia forearc,J.Geophys. Res., 95, 6685-6698, 1990.
Nelson, A. R., Apparent gradual rise in relative sea level in the south-central
1014 Kelsey' Deformation of Marine Terraces, Cape Blanco
Oregon coast during the late Holocene-- implications for the great Cascadia earthquake hypothesis (abstract), Eos Trans. AGU, 68, 1240, 1987.
Nelson, A. R., S. F. Personius and S. Rhea, Earthquake recurrence and Quaternary deformation in the Cascadia subduction
zone, coastal Oregon, U.S. Geol. Surv. Open-File Rep., 88-673, 492-497, 1988.
Pearson, G.W., J.R. Pilcher, M.G.L. Baillie, D.M. Corbett, and F. Qua, High- precision 14C measurement of Irish oaks to show the natural 14C variation from AD 1840 to 5210 BC, Radiocarbon, 28, 911- 934, 1986.
Peterson, C. D. and M. E. Darienzo,
Episodic, abrupt tectonic subsidence recorded in late Holocene deposits of the South Slough syncline' an on-land expression of shelf fold belt deformation from the southern Cascadia margin, Geo. Soc. Am. Abstr. Programs, 21, 129, 1989.
Peterson, C. P., L. D. Kulm, and J. J. Gray, Geologic map of the ocean floor off Oregon and the adjacent continental margin, scale 1'500,000, Oreg. Dep. Geo. Miner. Ind. Map GMS-42, 1986.
Plafker, G., Tectonics of the March 27, 1964 Alaskan earthquake, U.S. Geol. Sur. Prof. Pap., 543-I, 74 pp, 1969.
Plafker, G., Alaskan earthquake of 1964 and Chilean earthquake of 1960' Implications for arc tectonics, J. Geophys. Res., 77, 901-925, 1972.
Reilinger, R. E. and J. Adams, Geodetic evidence for active landward tilting of the Oregon and Washington coastal ranges, Geophys. Res. Lett., •, 401-403, 1982.
Roth, B., Late Cenozoic marine invertebrates from northwest California
and southwest Oregon, Ph.D. thesis, 803 pp., Univ. of Calif., Berkeley, 1979.
Spence, W., Stress origins and earthquake potentials in Cascadia, J. Geophys. Res., 9__4, 3076-3088, 1989.
Stuiver, M., G.W. Pearson, and T.
Brazinnas• Radiocarbon age calibration of
marine samples back to 9000 cal yr BP, ga. diocarbon, 2__8, 980-1021, 1986.
Trenhaile, A. S., Shore platforms' a neglected coastal feature, Prog. Phys. Geogr., •, 1-23, 1980.
Wehmiller, J. F., K. R. Lajoie, K. A. Kvenvolden, E. Peterson, D. F. Belknap,
G. L. Kennedy, W. O. Addicott, J. G. Vedder, and R. W. Wright, Correlation and chronology of Pacific coast marine terrace deposits by fossil amino acid stereochemistry-- techniques evaluation, relative ages, kinetic model ages, and geologic implications, U.S. Geol. Surv. Open-File Rep., 77-680, 196 pp, 1977.
Wellman, H. W., Til•e• marine beach ridges at Cape Turakirae, New Zealand, J. Geosci., Osaka City University, 10, 123- 129, 1967.
Wells, F. G., and D. L. Peck, Geologic map of Oregon west of the 121st meridian, U.S. Geol. Surv. Map 1-325, scale 1'500,000, 1961.
Werner, K. S., E. P. Graven, T. A. Berkman, and M. J. Parker, Direction of maximum
horizontal compression in northwestern Oregon as determined by borehole breakouts (abstract), Eos Trans. AGU, 69, 1455, 1988.
West, D. 0., and D. R. McCrumb, Coastline
uplift in Oregon and Washington and the nature of Cascadia subduction-zone
tectonics, Geology, 16, 169-172, 1988. Wright, L. W., Variation in the level of
the cliff/shore platform junction along the south coast of Great Britain, Mar.
Geol., •, 347-353, 1970.
H.M. Kelsey, Department of Geology, Western Washington University, Bellingham, WA 98225.
(Received October 17, 1989'
Revised February 20, 1990' Accepted March 9, 1990.)