Embed Size (px)
Citation preview

2293
TEFLUBENZURON (190)
The first draft was prepared by Dr Guibiao Ye, Institute for the Control of Agrochemicals, Ministry of Agriculture, Beijing China
EXPLANATION
Teflubenzuron is a benzoylurea insecticide, which act by inhibition of chitin synthesis and moulting of insects, hereby disrupting chitin deposition in the insect cuticle after ingestion. Teflubenzuron is active against a range of insects including codling moth (Laspeyresia pomonella), leafminers (Leucoptera scitella, Phyllonorycter blancardella, Phyllonorycter coryfolella), whiteflies (Trialeurodes vaporariorum) and caterpillars (Lepidoptera, Spodoptera exigua) in a wide range of crops including fruit trees, vines, vegetables, soya bean, oilseeds, maize, sugarcane and coffee.
Teflubenzuron was first ecvaluated by the JMPR in 1994 for toxicology and residues in 1996. Teflubenzuron was scheduled at the 47th session of the CCPR for Periodic Re-evaluation for residues and toxicology by the 2016 JMPR. An ADI of 0–0.005 mg/kg bw was established and an ARfD of was considered unnecessary.
The Meeting received information from the manufacturer on the metabolism of teflubenzuron in crops, rotational crop studies, metabolism in animals, environmental fate in soil, method of residue analysis, stability in stored analytical samples, GAP information, supervised residue trials, fate of residue during storage and processing, and livestock feeding studies.
IDENTITY
ISO common name: teflubenzuron
Chemical name
IUPAC: 1-(3,5-dichloro-2,4-difluorophenyl)-3-(2,6-difluorobenzoyl)urea
CA: N -[[(3,5-dichloro-2,4-difluorophenyl)amino]carbonyl]-2,6-difluorobenzamide
CAS Registry No: 83121-18-0
CIPAC No: 450
Synonyms and trade names: DART; NOMOLT; IMUNIT, CME 134, BAS 309 I
Molecular formula : C14H6Cl2F4N2O2
Structural fomular :
Molecular mass: 381.11
Physical and chemical properties
The information on chemical and physical properties of pure and technical material of teflubenzuron is shown in Table 1.

Teflubenzuron
2294
Table 1 The chemical and physical properties of teflubenzuron pure and technical material
Property Results Reference Melting point
218.8–221.7 °C (purity unspecified) 228.7ºC (pure) 229.9ºC (technical)
Van Helvoirt J.A.M.W. (1988) BASF no. TZ-303-001 Brachet A. (2003) BASF no. 2003/ 1011773
Boiling point Not applicable Temperature of decomposition of sublimation
Decomposition starts @ 225.3°C (pure) Decomposition starts @ 227.1ºCm (technical)
Brachet A. (2003) BASF no. 2003/ 1011773
Relative density 1.662 @ 22.7 ºC (technical)
Van Helvoirt J.A.M.W. (1988) BASF no. TZ-308-001
Vapour pressure 1.3 x 10⁻⁸ Pa @ 25 °C (technical)
Harteveld J.L.N. & Jager H. (1988) BASF no. TZ-306-001
Henry’s law constant 4.46 x 10⁻⁵ Pa.m3/mol @ 20 ºC (calculated value) Brachet A. (2003) BASF no. 2003/ 1011773
Colour and physical state white crystalline solid (pure) white crystalline solid (technical)
Brachet A. (2003) BASF no. 2003/ 1011773
Odour weak, unspecific odour (pure) weak, unspecific odour (technical)
Brachet A. (2003) BASF no. 2003/ 1011773
Solubility in water Solubility @ 20 °C: - in non-buffered water (pH 9): 0.05 mg/L, - in buffered water: < 0.01 mg/L at pH 5, < 0.01 mg/L at pH 7, = 0.11 mg/L at pH 9 (technical)
Cardinaals J.M. (1989) BASF no. TZ-312-001
Solubility in organic solvents Solubility @ 20 °C: - n-heptane: 0.01 g/L - toluene: 0.74 g/L - 1,2-dichloromethane: 1.51 g/L - methanol: 1.06 g/L - acetone: 8.85 g/L - ethyl acetate: 6.28 g/L (technical)
Brachet A. (2003) BASF no. 2003/1011767
n-Octanol/water partition coefficient
Log Pow > 4.3 (@ 20 ºC; phosphate buffer at pH 7.3) (pure)
Cardinaals J.M. (1988) BASF no. TZ-315-001
Log Pow = 5.0 (@ 20 ºC; acetate buffer at pH 4.7) (technical)
Brachet A. (2003) BASF no. 2003/1011766
Hydrolysis rate at pH 4,7 and 9 under sterile conditions in the absence of light
DT50 > 30 days @ 25º, pH 5, 7; DT50 = 10 days @ pH 9, 25 ºC (purity not relevant; radiolabelled material)
Hawkins D.R. et al. (1987) BASF no. TZ-322-001
Direct photo-transformation Stable for 7 days, then DT50 = 10 days (purity not relevant; radiolabelled material)
Hawkins D.R. et al. (1987) BASF no. TZ-322-002
DT50 = 375 ± 23 hours (pH5; 20ºC) (purity not relevant; radiolabelled material)
Knoch E. (1995) BASF no. TZ-324-001
Quantum yield of direct photo-transformation
4.91 x 10⁻⁹ (290-490 nm) (purity not relevant; radiolabelled material)
Knoch E. (1995) BASF no. TZ-324-001
Dissociation constant Experimental value determined in water /methanol mixture (33/67, v/v): 9.2 0.3 @ 20 °C (technical) Extrapolated value in water: 9.7 0.3 @ 20 °C (technical)
Brachet A. (2003) BASF no. 2003/1011765
Photochemical oxidative degradation
DT50 = 1.7 days (purity not relevant; calculation)
Flammability Not flammable (technical) Brachet A. (2003) BASF no. 2003/1011764
Auto-flammability Not auto-flammable up to its melting point (technical) Brachet A. (2003) BASF no. 2003/1011764
Flash point Not applicable Explosive properties Not explosive (no thermal and no mechanical
sensitivity by shock and friction) (technical) Brachet A. (2003) BASF no. 2003/

Teflubenzuron
2295
Property Results Reference 1014470
Surface Tension Not applicable Brachet A. (2003) BASF no. 2003/1014470
Oxidizing properties Not oxidizing (technical) Brachet A. (2003) BASF no. 2003/1014471
Formulations
Teflubenzuron is available as suspension concentrates containing 150 g ai/l (NOMOLT, and DART SC 15) or 75 g ai/1 (IMUNIT SC in mixture with alpha-cypermethrin).
METABOLISM AND ENVIRONMENTAL FATE
Radiolabel Position
Table 2 Radiolabel Position and Chemical Structure of Test Compound
1) [14C]- difluorodichloroaniline Teflubenzuron (BAS 309 I):
* indicates position of radiolabelling
2) [14C]- difluorobenzamide Teflubenzuron (BAS 309 I):
* indicates position of radiolabelling
Table 3 Metabolite Codes and Their Related Chemical Structures
Metabolite Code
Cheimcal name Chemical Structure Rat Goat Hen Environment
Metabolite II (rat); 3379
N-((3,5-dichloro-2,4-difluorophenyl)carbamoyl)-2,6-difluoro-4-hydroxybenzamide;
x x x
Metabolite III (rat); 3380: E114
1-(3,5-dichloro-2-fluoro-4-hydroxy-phenyl)-3-(2,6-difluorobenzoyl)urea Or
(3,5-dichloro-4-fluoro-2-hydroxy-; phenyl)-3-(2,6-difluorobenzoyl)urea
x x x x

Teflubenzuron
2296
Metabolite Code
Cheimcal name Chemical Structure Rat Goat Hen Environment
Metabolite I (rat); 3381, E115; CL902374
N-((3,5-dichloro-2,4-difluorophenyl)carbamoyl)-2,6-difluoro-3-hydroxybenzamide;
x x x
Metabolite IV (rat); CL902374; E15; CFPU
3,5-dichloro-2,4-difluorophenyl urea;
x x x
Metabolite V (rat); E14; CL902373; EMD
3,5-dichloro-2,4-difluoroaniline;
x x x x
CL245508 2,6-difluorobenzoic acid;
x x
2,6-difluorobenzoyl glycine
x
CL 211558 2,6-difluorobenzamide;
x x
2-amino-3,5-difluoro-4,6-dichlorophenyl sulfate
x
Cl
F
Cl F
NH
O
NH
F
F OH
O
F
C
F
OH
O

Teflubenzuron
2297
Metabolite Code
Cheimcal name Chemical Structure Rat Goat Hen Environment
2-amino-3,5-difluoro-4,6-dichlorophenyl glucuronide
x
4-amino-2,6-dichloro-3-fluorophenyl sulfate
x
4-acetamido-2,6-dichloro-3- fluorophenylsulfate
x
(3,5-dichloro-2-fluoro-4-phenylglucuronide)urea
x
*: no metabolite identified in plant metabolism studies due to insufficient amount.

Teflubenzuron
2298
Plant metabolism
The Meeting received information on the fate of teflubenzuron after foliar application to apple, spinach and potato.
Apple
The Meeting received one study on the metabolism of teflubenzuron in/on apple (Schlueter H., 1987 a, TZ-640-003). The apple fruit were treated with three applications of 14C-benzoyl labelled teflubenzuron at doses of 0.026, 0.067 and 0.086 mg/fruit at 21 day intervals. The apple leaves were treated with three applications at doses of 0.409, 0.269, 0.323 mg/leaf for tree number VII and 0.561, 1.007, and 1.078 mg/leaf for tree number VIII at 21 day intervals. Samples of fruit were taken just before the second and third treatments and at maturity (30 DALA). Leaf samples were taken at the last fruit sampling. Fruits were peeled and the peel and flesh samples homogenized and stored at -15 °C. Peel and flesh samples were extracted with acetone, methanol and methanol water (4:1 v/v). Leaf samples were washed with acetone followed by methanol and were then homogenised with methanol/water followed by water. The residue was freeze-dried. The radioactivity in sample extracts was measured by LSC. The residual samples were air-dried and radioactivity measured by LSC after combustion. Samples containing sufficient radioactivity were analysed by TLC and /or HPLC.
From peel 97.8–98.8% of the total radioactivity was extracted. 1.2–2.0% of TRR were extracted from the pulp. More than 99% of TRR in the leaves at the time of harvest could be extracted from the surface of the samples. Less than 0.1% was found in the residue following combustion. Up to 99% of the radioactivity was unchanged parent up to 72 days after the first application.
Table 4 Radioactive residues recovered from treated apple fruits
Table 5 Summary of partitioning of extracted radioactivity from apple fruits (in % total radioactive residue)
Number of days after application
Total residue µg parent equivalent
Apple Peel Apple Pulp Parent residues µg (% TRR)
Extracted (% TRR)
Non-extracted (% TRR)
Parent residues µg (% TRR)
Extracted (% TRR)
Non-extracted(% TRR)
1st application
5 d 6 d 6 d 21 d
12.34 13.09 14.78 18.68
12.09 (98.0) 12.64 (96.6) 14.42 (97.6) 18.38 (98.6)
97.9 96.5 97.3 98.6
0.1 < 0.1 0.2 < 0.1
0.24 (1.9) 0.45 (3.4) 0.36 (2.4) 0.26 (1.4)
1.9 3.4 2.3 1.4
< 0.1 ND 0.1 < 0.1
2nd application
15 d 21 d 21 d
64.38 77.54 60.91
63.45 (98.5) 76.59 (98.8) 60.32 (99.0)
98.5 98.7 99.0
< 0.1 < 0.1 0.1
0.93 (1.4) 0.94 (1.2) 0.58 (1.0)
1.4 1.2 0.9
ND ND <0.1
3rd application
Treat No. Days after appl.
Number of apples
g teflubenzuron equivalents (% total residue recovered from apples) Extracted residues Whole apple Peel Pulp Extracted Non-Extracted Total
1 21 4 14.37 (97.7)
0.32 (2.2)
14.69 (99.9)
0.02 (0.1)
14.71 (100)
2 21 3 66.75 (98.7)
0.82 (1.2)
67.57 (99.9)
0.04 (< 0.1)
67.61 (100)
3 30 3 125.2 (97.9)
2.52 (2.0)
127.75 (99.9)
0.14 (0.1)
127.9 (100)

Teflubenzuron
2299
Number of days after application
Total residue µg parent equivalent
Apple Peel Apple Pulp Parent residues µg (% TRR)
Extracted (% TRR)
Non-extracted (% TRR)
Parent residues µg (% TRR)
Extracted (% TRR)
Non-extracted(% TRR)
30 d 30 d 30 d
122.87 120.27 140.56
121.32 (98.7) 117.21 (97.5) 137.60 (97.9)
98.6 97.4 97.8
0.2 0.1 0.1
1.54 (1.2) 3.05 (2.5) 2.96 (2.1)
1.2 2.5 2.1
ND < 0.1 ND
Table 6 Radioactive residues recovered from treated leaves at the time of harvest (72 days after the first treatment)
Tree No. g teflubenzuron equivalents (% total residue recovered from leaves) Extracted Non extracted Total
VII 621.47 (99.95)
0.30 (0.05)
621.77 (100)
VIII 2326.84 (99.9)
1.09 (0.05)
2328.03 (100)
Potato
The Meeting received one study on metabolism of teflubenzuron in/on potato (Schlueter H., 1987 b, TZ-640-004). The potatoes were treated with either 4 foliar applications or 4 soil drenches of aniline (phenyl) ring labelled [14C] teflubenzuron at a rate of 90 g ai/ha at 2 week intervals, with the final treatment made at the beginning of flowering. Tuber and leaf samples were taken at maturity (63 days after first application). Samples of leaves, stems, tuber and tuber peels after feeze-drying were analysed by LSC following combustion. Samples containing sufficient radioactivity were analysed by TLC and/or HPLC.
Of the total radioactivity after the foliar application, 98.8% and 97.5% remained on the surface of leaves and stems. More than 99.7% of total radioactivity was extracted from treated potato tops at harvest and less than 0.25% was unextracted. No significant radioactive residues were detected in the tubers of leaf treated potatoes (< 0.001 mg eq/kg). Almost all the extracted residue was identified as unchanged teflubenzuron by TLC, HPLC and UV spectroscopy. Radioactive residues in potato tops and tubers after soil drench were 0.001–0.003 mg eq/kg. No identification of radioactive residues was conducted.
Table 7 Radioactive residues recovered from fresh leaves and stems of potato at 25 days after the last application (at harvest) following foliar application (percentage of sample radioactivity)
Sample Acetone surface wash solution Methanol/Water (4:1) extracts Un-extracted Fresh leaves 98.77 1.03 0.2 Fresh stems 97.48 2.42 0.09
ND: not detected (less than background equivalent to 0.004 mg/kg)
Table 8 Radioactive residues recovered from fresh and dry potato tops at 25 days after the last application (harvest) following foliar application
Container No.
Extracted residue Unextracted residue Total residue mg teflubenzuron equivalents/kg fresh weight
% of total recovered
mg teflubenzuron equivalents/kg fresh weight
% of total recovered
mg teflubenzuron equivalents /kg fresh weight
BL1 6.11 99.86 0.01 0.14 6.12 BL2 7.39 99.75 0.02 0.25 7.41 BL3 11.36 99.76 0.03 0.22 11.39

Teflubenzuron
2300
Table 9 Radioactive residues in potato tubers at 24 days after the last application (harvest) following foliar application
Container Nr.
mg teflubenzuron equivalents /kg fresh weight (%radioactivity recovered from treated tops) Peel Peeled tuber Total tuber
BL1 ND ND ND BL2 ND ND ND BL3 < 0.001
(0.01%) ND < 0.001
(0.01%)
ND: not detected (less than background equivalent to 0.004 mg/kg)
Table 10 Radioactive residues recovered from potato tops at the time of harvest (14 days after the last application) following soil treatment
Container Nr.
Total Radioactive Residue in potato top mg teflubenzuron equivalents /kg fresh weight % radioactivity applied to soil
BO1 0.02 0.13 BO2 0.04 0.28 BO3 0.03 0.20
Table 11 Radioactive residues recovered from potato tubers at the time of harvest (25 days after the last application) following soil treatment
Container Nr.
mg teflubenzuron equivalents /kg fresh weight in potato tuber (% radioactivity applied to the soil) Peel Peeled tuber Total tuber (*)
B01 0.016 (0.05)
0.001 (0.01)
0.003 (0.06)
B02 0.005 (0.02)
0.001 (0.01)
0.001 (0.03)
B03 0.006 (0.02)
0.001 (0.01)
0.001 (0.03)
(*) Values calculated on basis of fresh weights of total tubers determined immediately after harvest
Spinach
Two studies on the metabolism of teflubenzuron in/on spinach were received. In one non-GLP study conducted in 1984 (Schlueter H., 1985 b, TZ-640-005), spinach was treated with one foliar application of aniline (phenyl) ring labelled [14C] teflubenzuron at a rate of 0.06 kg ai/ha at 2–4 leaf stage (21 days after sowing). Samples were taken 0 (immediately after drying of the spray-wash), 8 and 15 days after treatment. Samples were analysed by LSC and TLC. Almost all the radioactivity in the leaves could be extracted from the surface of the samples (> 99%). The unextracted residues following combustion were less than 0.01% (< 0.001 mg eq/kg) in all samples. The unchanged teflubenzuron accounted for 94.8% on Day 0, 91.7% on Day 8 and 77.1% on Day 15. There were no single metabolites greater than 10% of the total radioactive residue.
Table 12 Distribution of radioactive residues in treated spinach samples (percentage of total radioactive residues, mean of 2 samples)
Day of Sampling Acetone Extract Methanol/Water Extract Unextracted residues 0 99.0 1.0 < 0.01 8 99.1 0.9 < 0.01 15 99.2 0.8 < 0.01

Teflubenzuron
2301
Table 13 Distribution of teflubenzuron and metabolites in treated spinach samples (percentage of total radioactive residues, mean of 2 samples)
Day of Sampling
Acetone Extract Methanol/Water Extract Total
teflubenzuron others teflubenzuron others teflubenzuron others 0 94.5 4.5 0.3 0.7 94.8 5.2 8 91.7 7.4 < 0.1 0.9 91.7 8.3 15 77.1 22.1 < 0.1 0.8 77.1 22.9
In a second study teflubenzuron radiolabelled at two different positions (difluorodichloroaniline ring A and difluorobenzamide ring B) was separately applied to spinach in one foliar application at 0.1 kg ai/ha at growth stage BBCH 11–13 (Chapleo S., Shankey M., 2011a 2011/1145202). Sampling of leaves was conducted 0, 15 and 30 days after treatment.
TRR levels (based on parent equivalents) in spinach leaves were highest immediately after application (<1 DAA) at 11.9–13.5 mg equiv./kg decreasing to 0.88–0.90 mg equiv./kg and 0.08-0.26 mg equiv./kg in the 15 and 30 DAA samples, respectively. Radioactive residues were found to be highly extractable with 98.6-100% of TRR being extracted. Parent teflubenzuron was the only significant residue found in spinach sampled up to 30 days after application accounting for 95.6–99.9% of the TRR. Minor unidentified metabolites (less than 3.2% of the TRR) were detected at 30 DAA. Therefore, no significant metabolism of teflubenzuron was observed in spinach. No cleavage of the molecule was observed.
Position of Radiolabel
Table 14 Extractability of radioactive residues in spinach leaves after foliar application of teflubenzuron (label A)
Total radioactive residues in spinach leaves(Difluorodichloroaniline label A)
Immature leaves 0 DAA
Immature leaves 15 DAA
Mature leaves 30 DAA
mg eq./kg %TRR mg eq./kg %TRR mg eq./kg %TRR TRR a 13.5 100 0.880 100 0.258 100 Extracted 13.5 100 0.877 99.7 0.254 98.8 Acetone rinse 12.6 93.6 0.828 94.1 0.183 71.1 Methanol extract 0.864 6.4 0.049 5.6 0.071 27.7 Water extract < 0.001 <0.1 < 0.001 <0.1 < 0.001 <0.1
PES < 0.001 <0.1 0.002 0.2 0.003 1.2 a Calculated as sum of extractable residues and post extraction solids analysed by LSC PES: Post extraction solids

Teflubenzuron
2302
Table 15 Extractability of radioactive residues in spinach leaves after foliar application of teflubenzuron (label B)
Total radioactive residues in spinach leaves(Difluorobenzamide label B) Immature leaves 0 DAA
Immature leaves 15 DAA
Mature leaves 30 DAA
mg eq./kg %TRR mg eq./kg %TRR mg eq./kg %TRR TRR a 11.9 100 0.904 100 0.084 100 Extracted 11.9 99.9 0.903 99.9 0.083 98.6 Acetone rinse 11.7 98.6 0.869 96.1 0.072 85.2 Methanol extract 0.119 1.0 0.034 3.8 0.011 13.4 Water extract < 0.001 <0.1 < 0.001 <0.1 < 0.002 <2.6 PES < 0.001 <0.1 < 0.001 0.1 0.001 1.5
a Calculated as sum of extractable residues and post extraction solids analysed by LSC PES: Post extraction solids
Table 16 Identification of radioactive residues in spinach leaves after foliar application of teflubenzuron (label A)
Total radioactive residues in spinach leaves (Difluorodichloroaniline label A) Immature leaves 0 DAA
Immature leaves 15 DAA
Mature leaves 30 DAA
mg eq./kg %TRR mg eq./kg %TRR mg eq./kg %TRR TRR a 13.5 100 0.880 100 0.258 100 Extracted 13.5 100 0.877 99.7 0.254 98.8 Teflubenzuron in acetone rinse 12.6 93.6 0.828 94.1 0.183 71.1 Teflubenzuron in methanol extract 0.840 6.2 0.049 5.6 0.063 24.5 Total identified 13.5 99.8 0.877 99.7 0.246 95.6 Unidentified compounds in acetone rinse 0.006 <0.1 — — 0.008 3.2 in methanol extract 0.017 0.1 — — — — in water extract 0.001 0.1 0.001 0.1 0.001 0.1 Total unidentified 0.023 0.1 0.001 0.1 0.008 3.2
a Calculated as sum of extractable residues and post extraction solids analysed by LSC
Table 17 Identification of radioactive residues in spinach leaves after foliar application of teflubenzuron (label B)
Total radioactive residues in spinach leaves Difluorobenzamide label B Immature leaves 0 DAA
Immature leaves 15 DAA
Mature leaves 30 DAA
mg eq./kg %TRR mg eq./kg %TRR mg eq./kg %TRR TRR a 11.9 100 0.904 100 0.084 100 Extracted 11.9 99.9 0.903 99.9 0.083 98.6 Teflubenzuron in acetone rinse 11.6 97.9 0.869 96.1 0.072 85.2 Teflubenzuron in methanol extract — — 0.034 3.8 0.011 13.0 Total identified 11.6 97.9 0.903 99.9 0.083 98.2 Unidentified compounds in acetone rinse 0.117 1.0 — — 0.001 0.4 in methanol extract 0.119 1.0 — — — — in water extract 0.001 0.1 0.001 0.1 0.002 2.6 Total unidentified 0.236 2.0 0.001 0.1 0.002 0.4
a Calculated as sum of extractable residues and post extraction solids analysed by LSC
Plant metabolism studies in apple, potato and spinach show that teflubenzuron remains on the surface of plants and is not readily translocated into the pulp of apple fruit (≤ 2.2% of TRR found in apple pulp) or from potato leaves to tubers (>9 7.5% TRR remaining in potato leaves and stems). The

Teflubenzuron
2303
radioactivity was highly extractable with solvents particularly acetone (> 96% apple fruit, > 71.1% spinach or 95.9% potato leaves) on 30 DAA. A very high level of the radioactivity was attributed to parent compound (>9 6.6% TRR in apple peel, 95.6–99.9% TRR in spinach leaves (two radiolabel study) and 99% TRR in potato tops) with no indication of the presence of metabolites or cleavage of the molecule.
Confined rotational crop studies
Two studies on confined rotational crop with teflubenzuron radiolabelled (14C) either in the aniline or benzoyl ring positions were provided to current Meeting. The molecular structures and the positions of the labels are shown below:
Table 18 Radiolabel Position and Chemical Structure of Test Compound
1) Label 1:Aniline
* indicates position of radiolabelling
2) Label 2:Benzoyl
Specific radioactivity:
Rotational crop study 1 1) 0.266 MBq/mg 2) 0.235 MBq/mg Radiochemical purity: Rotational crop study 1 1) 99% TLC) 2) 98% (TLC)
In a study carried out in Germany (Schlueter H., 1989 a, TZ-640-006), [14C] teflubenzuron (radiochemical purity > 99%) labelled in the aniline ring was applied at rate of 500 g ai/ha to a sandy loam soil in indoor plots from an acetone solution. The soil was aged under aerobic conditions for 30, 120 and 360 days. After completion of each ageing period, lettuce, carrots and wheat were cultivated on the treated soils (mixed with untreated soil at a ratio of 1:6.5 treated to untreated). Mature carrot roots and leaves, mature lettuce and mature wheat grain and straw were harvested.
TRR in all plant samples were determined by combustion followed by LSC. TRR in the crop samples at harvest declined with longer plantback intervals. In lettuce TRR were 0.007–0.002 mg eq/kg, in carrot roots 0.026–0.005 mg eq/kg, in wheat straw 0.244–0.035 mg eq/kg and in wheat grain 0.005–0.002 mg eq/kg.
Residues in 30 and 120 day straw were exhaustively extracted using solvents of increasing polarity (acetone, methanol/water 4:1 v/v and water). Extracts containing sufficient radioactivity were analysed by TLC. Non-extractable radioactivity was determined by combustion LSC. TLC characterisation of the radioactive material in 30 and 120 day planted straw showed it to be composed of several unknown polar compounds at concentrations < 0.05 mg/kg. Neither parent teflubenzuron, nor the two known soil metabolites 3, 5-dichloro-2,4-difluorophenyl urea and 3,5-dichloro-2,4-difluoroaniline were detected in the plants at levels > 0.01 mg/kg.
Table 19 Total radioactive residues (mg/kg) in following crops taken at harvest grown in soil treated with [14C] - aniline labelled teflubenzuron
Rotational Crop Residues (parent equivalents mg/kg) Ageing period (days) 30 120 360
Lettuce 0.007 0.006 0.002
Carrots: Peelings Peeled roots Total roots
0.080 0.013 0.026
0.053 0.006 0.013
0.017 0.002 0.005
Cl
F
Cl
F
N
N
F
F
O
O
*

Teflubenzuron
2304
Rotational Crop Residues (parent equivalents mg/kg) Ageing period (days) 30 120 360
Wheat: Straw Grain
0.244 0.005
0.088 0.003
0.035 0.002
Table 20 Partitioning of extractable residues in mature wheat straw grown in soil treated with [14C]-aniline labelled teflubenzuron
Extract 30 day ageing period 120 day ageing period %TRR mg eq./kg %TRR mg eq./kg
Total residue 100 0.244 100 0.088
Extracted with: Acetone Methanol/water (4:1) Water
8 40 12
0.019 0.097 0.029
7 53 13
0.007 0.047 0.011
Total extracted 59 0.145 73 0.065 Non-extractable 41 0.099 27 0.023
In the study carried out in Germany (Schlueter H., 1995 a TZ-640-008), teflubenzuron labelled in the benzoyl ring (radiochemical purity 98%) was applied at rate of 500 g ai/ha to a sandy loam soil in indoor plots in an acetone solution and incubated under aerobic conditions for 30, 121 and 365 days. After completion of each ageing period, lettuce, carrots and wheat were cultivated on the treated soils (mixed with untreated soil at a ratio of 1:6.5 treated: untreated). Mature carrot roots and leaves, mature lettuce, whole immature wheat at earing stage (GS ≈ 30) and mature wheat grain and straw were harvested.
Total radioactive residues (TRR) in all plant samples were determined by combustion followed by LSC. TRR in the crop samples at harvest were low (< 0.01 mg/kg) with the exception of straw (table 20). The highest total radioactive residue was found in the wheat straw (0.032, 0.014 and 0007 mg/kg at 30, 121 and 360 days respectively). Residues in 30 and 121 day straw were exhaustively extracted using solvents of increasing polarity (acetone, methanol/water 4:1 v/v and water). The extracts were subsequently partitioned using n-hexane and dichloromethane and then repeated with dichloromethane following acidification of the aqueous fraction with HCl. Finally the organic layers were analysed by TLC. Non-extracted radioactivity was determined by combustion LSC.No further characterisation was conducted.
Table 21 Total radioactive residues (mg/kg) in following crops taken at harvest grown in soil treated with [14C] - benzoyl labelled teflubenzuron
Rotational Crop Residues (parent equivalents mg/kg) Ageing period (days) 30 121 365
Lettuce 0.006 0.002 0.001
Carrots:
Leaves Peelings Peeled roots Total roots
0.006 0.008 0.002 0.003
0.003 0.003 0.001 0.002
0.001 0.001 0.001 0.001
Wheat: Green plants Straw Grain
0.006 0.032 0.012
0.003 0.014 0.006
0.001 0.007 0.002
Table 22 Partitioning of extractable residues in mature wheat straw grown in soil treated with [14C]- benzoyl labelled teflubenzuron
Extract 30 day ageing period 121 day ageing period %TRR mg/kg %TRR mg/kg
Total residue 100 0.032 100 0.014

Teflubenzuron
2305
Extract 30 day ageing period 121 day ageing period %TRR mg/kg %TRR mg/kg
Extracted with: Acetone Methanol/water (4:1) Water
18 38 12
0.006 0.012 0.004
24 61 21
0.003 0.009 0.003
Total extracted 69 0.022 106 0.015 Non-extracted 31 0.010 - -
Following application of teflubenzuron to soil and ageing to 30, 121 and 365 days, taking up of residues by the rotational crops was low, with residues generally below 0.01 mg/kg at all ageing periods. Neither parent nor the known soil metabolites dichloro-2,4-difluorophenyl urea and 3,5-dichloro-2,4-difluoroaniline were detected in the plants at levels > 0.01 mg/kg. Due to the very low levels of radioactivity, teflubenzuron and/or metabolites detected in confined rotational crops studies, it is concluded thatresidues above the LOQ would not be expected in rotational crops.
Animal metabolism
Lactating goats
Two studied on goat metabolism were available to the Meeting. In the study conducted in Scotland ( Cameron B.D. et al., 1987 a, TZ-440-011), aniline labelled [14C]-teflubenzuron was administered orally to two lactating goats twice daily for 7.5 days at a dose level of 1 mg/kg bw/day (equivalent to 25 ppm diet, based on a daily feed intake of 2 kg). Samples of urine and faeces were quantitatively collected for each 24 h period. Milk was collected twice daily. Milk from morning milking on Days 2, 5 and 8 was separated into the three commercial fractions (fat, curds and whey). Animals were sacrificed 8 hours after the final dose administration and tissues were collected for analysis (liver, kidney, three areas of skeletal muscle, renal fat, subcutaneous fat and skin).
Samples were analysed by TLC and HPLC. The TLC analysis consisted of a one-dimensional (1D) system using chloroform: diethyl ether: acetic acid (90: 10: 1 v/v/v). Samples analysed by HPLC were injected onto either Pellicular or Hypersil ODS columns at a flow rate of 3mL/minute in a mobile phase of acetonitrile: water (60: 40 v/v) using fraction collection (30 seconds for 15 minutes, 60 seconds for 5 minutes). UV Detection was at 300 nm.
The main route of elimination of total radioactivity was via faeces, accounting for more than 99% (actual values 104.42% and 99.44%) of the total radioactivity administered (including intestinal contents at post mortem). Milk levels of total radioactivity reached highest levels of total radioactivity in Day 5 evening milk (10-15 ng equiv./mL) and represented 0.002-0.005% of the cumulative administered dose up to that time point. Elimination of radioactivity in milk accounted for ca 0.03% of the total administered dose. In milk separated into fractions, the highest level of radioactivity was detected in the cream (ca 50%), and the lowest in whey. The excretion of radioactivity is summarized in Table below.
Table 23 Excretion of total radioactivity following oral administration of 14C-teflubenzuron twice daily for 7.5 days to lactating goats
Matrix Collection Timing [hours]
Aniline label % of dose mg eq./kg
Urine 0-176 0.91 0.15* Faeces Milk
0-176 0-176
91.95 0.03
14.7* 0.013
Muscle 0.003 0.01 Fat 0.023 0.08 Kidney 0.002 0.03 Liver 0.14 0.49 Skin LOQ - Stomach + gut contents 9.98 - Sum of tissues 10.2 Sum of Administered Dose (%) 103

Teflubenzuron
2306
* calculated by evaluator, not specified in original report
The radioactive residues in all tissues were low in relation to the total radioactive dose administered. Highest levels of total radioactivity were found in liver (0.49 mg equiv./kg)
corresponding to a mean of 0.14% of the total administered dose. Levels in muscle and skin were at or below the limit of reliable detection.
Analysis of milk extracts by TLC showed the presence of teflubenzuron and a large amount of polar material. Further attempts to resolve this material into separate compounds following acid hydrolysis produced no interpretable results due to the low amounts (< 0.015 mg eq./kg) of radioactivity present.
Goat liver extracts were analysed by TLC but due to the low levels of radioactivity present, identification of the radioactive species was inconclusive. Analysis by HPLC showed that the major radioactive peak in the liver extract was a polar compound retained at the origin. The enzyme digest sample showed traces of material which co-chromatographed with 1-(3,5-dichloro-2,4-difluorophenyl)-3-(2,6-difluro-3-hydroxy benzyl) urea (Metabolite 3381) in one TLC system. Further attempts were made to increase extraction efficiency using solvents, proteolytic digestion and acid hydrolysis; however success was limited and indicated that the radioactivity was bound to proteins within the liver. Overall extraction efficiency in liver was 58.3% of the total radioactivity.
Table 25 Summary of Characterization and Identification of Radioactive Residues in Goat Matrices Following Application of [Aniline-UL-14C] Teflubenzuron (%TRR)
Compound Liver extract (methano:water)
Liver extract deconjugating enzymes
Liver extract (0.1M sodium acetate, pH 5)
Milk (methanol: water)
Polar Unknown (RT 1-2.5 minutes)
80.9 78.6 83.0 82.5
E15 8.4 5.8 6.8 1.0* 3379 3.7 4.2 1.7 1.0 E14 & 3380 2.6 6.0 3.5 0.9* 3381 1.5 10 30.0 1.5 14C-teflubenzuron 1.6 2.2 3.5 6.5 Unknown (RT 11.5-20 minutes)
0.9 2.1 1.4 6.2
Total characterized 16.2 28.2 45.5 10.9 Total identified 99.6 108.9 129.9 99.6
* presence of E14 and E15 not confirmed by subsequent analysis
In a further study to idendify the metabolites in the goat (Cameron B.D. et al., 1989a, TZ-440-012), samples of faeces, liver and milk from the goat metabolism study (Cameron B. et al., 1987a) were further extracted and purified in an attempt to identify their major radioactive components by TLC and HPLC. The faeces extracts were analysed by MS. Radioactivity in the extracts was examined by TLC and HPLC, and quantified by LS. Analysis of the main radioactive component in goat faeces by mass spectrometry produced the characteristic spectrum of unchanged teflubenzuron. In the liver small traces of radioactive residues were found ca 0.5 mg/kg, corresponding to 0.14% total administered dose. The methanol liver extract showed the presence of an unidentified major polar compound retained at the origin of TLC systems and eluted with the solvent front of an HPLC system. The enzyme-digest and control sample showed traces of material which co-chromatographed with 1(3,5-dichloro-2,4-difluorophenyl)-3-(2,6-difluoro-3-hydroxybenzoyl)-urea in 1 TLC system. The percentages of radioactivity extracted using sequential solvents are given in table below. The characterisation of the extracts by TLC or HPLC was not successful.

Teflubenzuron
2307
Table 26 Extraction of radioactivity from goat liver using exhaustive serial extractions with different solvents, proteolytic digestion and acid hydrolysis
Solvent
Volumes used (mL)
% Total radioactivity extracted (from liver homogenate containing 0.14% of total administered dose present in whole liver)
% Equivalent of total administered dose
Total residue - - 0.140 Solvent extraction Acetone 3 x 100 29.7 0.042 Methanol/water (4+1) 3 x 100 8.9 0.012 Acetonitrile 1 x 100 0.2 < 0.001 Acetone/1M HCl (4+1) 3 x 100 1.5 0.002 Pepsin digestion 4.3 0.006 Acid hydrolysis 13.7 0.019 Non-extracted activity 41.7 0.058
Analysis by TLC of goat milk extracts showed the presence of teflubenzuron, and polar material. No interpretable results were obtained following acid hydrolysis of milk extracts due to insufficient levels of radioactivity in the samples. Further isolation of the extremely low traces of substances from goat faeces, liver and milk as well as their subsequent identification was not conducted.
Laying hens
A study on identification of metabolites in laying hens was available to the Meeting (Cameron B.D. et al., 1988a, TZ-440-010), Aniline-labelled [14C]-teflubenzuron was administered orally to eighteen laying hens, twice daily for seven and a half days at a dose rate of 1.25 mg/kg bw/day. The dose level was selected to be equivalent to a dietary concentration of 25 ppm of teflubenzuron (based on a daily feed intake of 100 g). Excreta were collected every 24 h at which time cages were washed and washings were retained. Eggs were collected twice daily from 6 hens throughout the dosing period and for 12 days after the final dose radioactivity was determined separately in each sample of white, yolk and shell. The hens were sacrificed 8 h after the final dose and tissues were retained for analysis.
Radioactivity in all samples was analysed by LSC. Excreta, liver, fat and egg yolk samples were extracted with methanol prior to analysis by HPLC or TLC. The TLC analysis consisted of a one-dimensional (1D) system using chloroform: diethyl ether: acetic acid (90: 10: 1 v/v/v). Samples analysed by HPLC were injected onto either Pellicular or Hypersil ODS columns at a flow rate of 3 mL/minute in a mobile phase of acetonitrile: water (60:40 v/v) using fraction collection (30 seconds for 15 minutes, 60 seconds for 5 minutes). UV Detection was at 300 nm.
Overall recovery of radioactivity was 95.6%; the bulk of the radioactivity was excreted (93.9%), with less than 0.01% in the eggs and less than 0.4% in the tissues. Total [14C] residues in the egg yolk and white (expressed as parent equivalent) reach a plateau after 9 days of 0.99 mg/kg and 0.013 mg/kg, respectively. Total [14C] residues in the tissues (expressed as parent equivalent) were 0.33, 1.0, 0.45 and 0.066 mg/kg in liver, fat, skin and muscle, respectively.
The major route of elimination of total radioactivity was via excreta (including intestine and crop contents at post mortem) accounting for 93.5% of the total administered dose.
The major component of the extractable radioactivity in the egg yolk was identified as the parent teflubenzuron representing 62.2% of the radioactivity present. Two further minor radioactive components were observed, each accounting for 4.8 and 6.6% of the TRR. Neither component had similar retention times to any of the standard substances. The remaining unextractable radioactivity in eggs yolk was 8% (0.008 mg/kg) of the total radioactivity present in eggs yolk. The major radioactive component in liver was parent teflubenzuron which accounted for 30.2% of the TRR. Two further radio-peaks were present each accounting for 12.7 and 8.5% of the TRR. In fat, teflubenzuron accounted for 79.1% TRR and a second radioactive component was observed that accounted for 8.7% TRR. The remaining unextracted radioactivity in liver and fat accounted for 30 and 6% (0.099 and

Teflubenzuron
2308
0.065 mg/kg) of the total radioactivity respectively. Radioactivity in muscle and egg white was not sufficiently high to enable any characterisation.
Further characterisation of the radioactivity was conducted by MS in the excreta and by TLC and HPLC in liver, fat, and egg yolk extracts, and quantified by LSC. The study confirmed the identity of the major radioactive component in faeces, yolk and fat as parent teflubenzuron. Liver extracts mainly contained parent teflubenzuron and a polar compound which was compared to an enzyme treated sample and shown not to be a conjugate. No material with chromatographic characteristics comparable to either 3,5-dichloro-2,4-difluoroalanine or dichloro-2,4-difluorophenyl urea were observed by both TLC and HPLC. Kidney extracts contained teflubenzuron and trace amounts (0.02 mg/kg) of a material which co-chromatographed on TLC and HPLC with 3,5-dichloro-2,4-difluorophenyl-urea (E15). Overall extraction efficiency in liver was > 75% and was > 90% in kidney, egg yolk and fat.
Table 27 Recovery of administered radioactivity to laying hens
Animal product and days after treatment
% AR
Extracted radioactivity (%)
Non-extracted radioactivity (%)
Identified as parent residues (%)
Total Excreted 93.9 - - -
Excreta 87.88 97 3 78.3-87.4
Cage wash 4.59 - - -
Intestine contents 0.92 - - -
Crop contents 0.46 - - -
Egg yolk mg eq/kg
Day 1 0
Day 2 0.001
Day 3 0.023
Day 4 0.091
Day 5 0.244
Day 6 0.381
Day 7 0.600
Day 8 0.854
Day 9 (depuration) 0.988
Day 10 (depuration) 0.0.940
Day 11 0.824
Day 12 0.747
Day 13 0.539
Day 14 0.377
Day 15 0.256
Day 16 0.162
Day 17 0.094
Day 18 0.065
Day 19 0.034
Day 20 0.029
Table 28 TRR levels in eggs and tissues following administration of aniline-Labelled [14C]-teflubenzuron to laying hens
Matrix TRR in mg eq/kg Extracted radioactivity (%)
Non-extracted radioactivity (%)
Identified as parent residues (%)
Egg Yolk (Day 9) 0.99 92 8 62.2 Egg white n.d. - - - Liver 0.33 70 30 35.2 Kidney 0.17 90 10 30.1 Muscle breast 0.026 - - -

Teflubenzuron
2309
Matrix TRR in mg eq/kg Extracted radioactivity (%)
Non-extracted radioactivity (%)
Identified as parent residues (%)
thigh 0.066 Fat omental Subcutaneous Abdominal pad
0.95 1.0 1.1
94 6 79.1
Skin 0.45
n.d. not detected
Table 29 Distribution of teflubenzuron and its possible metabolites in animal products as % of the total radioactivity
Compounds/elution time Liver extract (methano:water)
Liver extract deconjugating enzymes
Liver extract (0.1M sodium acetate, pH 5)
Kidney extract(methano:water)
York extratct(methano:water)
1.0-2.5min 33.0 36.1 24.8 46.9 4.7
3,5-dichloro-2,4-difluorophenyl urea (E15) (2.5-3.5 min)
3.4 7.9 10.1 12.8 5.4
1-(3,5-dichloro-2-fluoro-4-hydroxy-phenyl)-3-(2,6-difluorobenzyl) urea (3379) (3.5-5.0 min)
0 2.6 0.8 0 0.9
3,5-dichloro-2,4-difluoroalanine (E14) and 1-(3,5-dichloro-4-fluoro-2-hydroxy-phenyl)-3-(2,6-difluorobenzyl) urea (3380) ( 5.0 – 6.5min)
2.2 1.3 3.2 0 0.7
1-(3,5-dichloro-2,4-difluorophenyl)-3-(2,6-difluoro-3-hydroxybenzyl) urea (3381) (6.5 – 7.5 min)
6.8 1.5 3.6 4.5 7.1
teflubenzuron (CME 134) (10.0 – 11.5)
35.2 44.3 43.8 30.1 62.2
(11.5-20.0min)… 18.6 5.4 12.6 5.5 0.6
Table 30 Summary of Identified Components in Hen Matrices (Aniline Label) in %TRR (mg eq./kg)
Metabolite Code Structure Egg yolk Liver Kidney Fat
mg/kg 0.99 0.33 0.17 1.09
Parent
62.2 (0.53) 35.2 0.10)
30.1 0.009)
79.1 0.86)

Teflubenzuron
2310
Metabolite Code Structure Egg yolk Liver Kidney Fat
mg/kg 0.99 0.33 0.17 1.09
E14
0.7b (0.06) 2.2b (0.007) - 0.7b (0.008)
E15
5.4(0.05) 3.4a (0.01) 12.8( 0.02) -
3379
0.9 (0.08) - - 0.9 (0.01)
3380
- 2.2b (0.07) - 0.7b (0.008)
3381
7.1 (0.06) 6.8 (0.02) 4.5 (0.008) 7.1 (0.008)
a Liver extract value, for values after enzymatic deconjugation and control digest, refer to Table 29 b E14 and 3380 co-elute at same retention time
In laying hens dosed at 1.25 mg/kg bw/day (25 ppm diet) for 7.5 days, the majority of the radioactivity was recovered in excreta (93.9%); < 0.01% TRR was found in eggs and < 0.4% TRR in tissues. In liver, fat, skin and muscle, TRR of 0.0075 mg/kg, 0.0015 mg/kg, 0.0002 mg/kg and 0.00004 mg/kg were found. Extractable residues accounted for 97% TRR in faeces, 92% in eggs, 70% in liver and 94% in fat. The major component was identified as teflubenzuron in the majority of samples - egg yolk 62.2% TRR, liver 30.2% TRR and fat 79.1% TRR. After oral administration of teflubenzuron to hens, radioactivity was very rapidly excreted. Only small amounts of residues are transferred into tissues and eggs. Teflubenzuron and the very low levels of metabolites were detected all of which were also found in rat metabolism studies.

Teflubenzuron
2311
Fate and behaviour in the environment
Studies of teflubenzuron on degradation under aerobic and anaerobic condition, field dissipation, hydrolysis and photolysis were received. Teflubenzuron was stable to photolysis for up to 7 days at pH 5, the only metabolite observed was E30. The major extracted component in soils under both aerobic and anaerobic conditions was teflubenzuron, along with at least six other components. Teflubenzuron was hydrolysed at pH 9 with a half-life of 10 days. The metabolites of hydrolysis were 3,5-dichloro-2,4-difluorophenylurea, 3,5-dichloro-2,4-difluoroaniline, 2,6-difluorobenzoic acid, 2,6-difluorobenzamide, and N-(2,4-difluoro-3,5-dichlorobenzene)-5-fluoro[3H]-dihydroquinazoline-2,4-dione.
Fate and behaviour in soil
The aerobic and anaerobic degradation of aniline-labelled 14C-teflubenzuron was studied in a sandy loam soil at an application rate of 5 mg/kg (Schlueter H., 1985 c, TZ-620-004). The samples were kept at 22°C in the dark. Anaerobic conditions were achieved by flooding. Duplicate samples from the aerobic test were taken after 0, 3, 7, 14, 29, 58, 98, 235, and 343 days. Duplicate samples from the anaerobic test were taken after 0 (about 1 hour after application), 7, 14, 22, 35 and 59 days. Extracts were determined LSC and unextractable soil portions by combustion analysis. The metabolites were identified in the extracts by TLC and MS.
In the aerobic condition, recovery of radioactivity from the aerobic study declined slowly over the testing period, from 100% to 92.4% between Days 0 and 125, and then further decreased to 78.1% after 343 days (ca. 39% extractable, 33% bound and 7% in evolved CO2). Extractable radioactivity was shown to be composed mainly of parent (96% at day 0 to 29% at day 343), with two metabolites (3,5-dichloro-2,4-difluoroaniline and 3,5-dichloro-2,4-difluorophenylurea (CL902374)) and several products in trace amounts. The metabolite 3,5-dichloro-2,4-difluoroaniline amounted to a maximum of 5.4% AR after 29 days. Further radioactivity could be solubilised by treatment of the bound residues after 343 days with sodium hydroxide (10% AR) or ethanolamine (25% AR). 3,5-dichloro-2,4-difluoroaniline was found in both treatment, indicating that the bound residues were formed partly by the aniline metabolite or compounds still containing the aniline moiety. The metabolite 3,5-dichloro-2,4-difluorophenylurea amounted to a peak of 10.4% after 29 days. At least 8 unknown trace compounds could be extracted, the total of which reached a maximum of 13.4% AR after 58 days, then decreasing to 6.2% AR after 182 days. None exceeded individually 2% AR at any time of the study.
Table 31 Radioactivity recovered from aerobic soil samples as percentage of applied radioactivity (mean of 2 samples)
Days after application
Extracted residue
Non-extracted residue
Teflubenzuron 3,5-dichloro-2,4-difluoroaniline
3,5-dichloro-2,4-difluorophenylurea
Unknowns CO2 Total
0 99.8 0.1 96.9 < 0.1 < 0.1 3.0 < 0.1 100.0
3 98.0 0.7 91.6 0.8 3.1 2.5 < 0.1 98.8 7 95.0 1.8 85.4 0.8 5.6 3.2 < 0.1 96.8
14 90.8 3.5 79.3 2.3 7.6 1.6 <0.1 94.5 29 81.3 6.2 59.3 5.4 10.4 6.2 0.5 88.0
58 76.8 14.8 56.6 4.2 2.5 13.4 1.2 92.8 98 66.8 23.6 48.0 5.1 3.1 10.6 2.2 92.7
125 61.8 27.7 47.0 2.7 3.6 8.5 2.9 92.4 182 49.5 34.4 37.2 4.4 1.6 6.2 4.2 88.1
253 43.4 32.7 31.9 2.9 1.6 6.9 5.3 81.4 343 38.5 33.3 29.2 1.2 1.1 6.9 6.5 78.1
In the anaerobic condition, the recovery of radioactivity declined slowly from 100% to 89.5% between Days 0 and 59, with unextracted amounts increasing to 34.5% after 59 days. The extractable

Teflubenzuron
2312
radioactivity was composed mainly of the parent compound during the test, around 28% of the radioactivity was parent alongside the same two metabolites and trace products detected at the end of the testing period of 59 days.
The metabolite 3,5-dichloro-2,4-difluoroaniline amounted to a maximum of 1.0% AR after 22 days, decreasing to 0.6% AR at the end of the 59 day study. 3,5-dichloro-2,4-difluoroaniline was found in both treatments of the bound residues after 59 days by Bleidner distillation (20% AR) or ethanolamine (30% AR), indicating that the bound residues were formed partly by the aniline metabolite or compounds still containing the aniline moiety.
The metabolite 3,5-dichloro-2,4-diflurophenylurea increased to 22.5% AR after 7 days, reaching a maximum of 28.2% AR after14 days, decreasing thereafter to reach 15.6% AR at the end of the 59 day study.
At least 8 unknown trace compounds could be extracted, which in total reached a maximum of 13.4% AR after 35 days, then decreasing to 10.6% AR at the end of the study. None exceeded individually 2% AR at any time of the study.
Table 32 Radioactivity recovered from anaerobic soil samples as a percentage of applied radioactivity (mean of 2 samples)
Days after application
Extracted residue
Teflubenzuron 3,5-dichloro-2,4-difluoroaniline
3,5-dichloro-2,4-difluorophenylurea
Unknowns Unextracted residue
Total
0 99.9 85.6 < 0.1 2.4 11.9 0.1 100.0
7 97.5 68.1 0.7 22.5 6.2 5.1 102.6
14 84.9 49.9 0.8 28.2 6.0 10.1 95.0
22 82.5 48.7 1.0 27.9 4.8 16.0 98.5
35 67.0 41.2 0.7 19.2 5.9 26.7 93.7
59 55.0 28.1 0.6 15.6 10.7 34.5 89.5
The fate and behaviour of benzoyl ring-labelled14C-teflubenzuron under aerobic and anaerobic conditions was studied (Croucher A., Edwards V.T., 1990 a, TZ-620-012) in a silty clay loam soil 1. 25 µg of teflubenzuron was dispensed over 50 g of soil (0.5 mg/kg) in incubation flasks. The flasks were incubated under aerobic conditions in the dark at 22C for 30 days, when conditions in some of the flasks were made anaerobic by flooding with water and purging with nitrogen. For the aerobic part of the study, analyses were carried out on days 0, 7, 14, 30, 60, 90, 119 and 150 after application. In the anaerobic study samples were taken immediately after flooding and the on days 30, 60 and 90 after application. Soil samples were extracted by acetonitrile/water 7:3 v/v, acetonitrile and diethyl ether. Solutions were radioassayed using LSC and soil samples by combustion analysis. Extracts were concentrated and analysed by TLC and HPLC.
The degradation in aerobic soil was moderately rapid with a half-life (DT50) of 29 days and a DT90 of 108 days. The flooding of the soil at 30 days had little effect on the overall degradation rate, although qualitative differences were observed.
The nature of the radioactivity recovered at 90 days from the anaerobic soils differed to the aerobic soils. Only 3% of the applied radioactivity was evolved as 14CO2, compared to 24% from the aerobic soils during the same time period. Bound residues were also higher in the anaerobic soils compared to the aerobic samples.
The major extractable component in soils incubated under both conditions was teflubenzuron, along with at least six other components (60 day anaerobic sample), accounting for a total of 7% of the total applied radioactivity. Two of these components were identified as 1-(3,5-dichloro-2-fluoro-4-hydroxyphenyl)-3-(2,6-difluorobenzoyl)urea (E114) (1% AR) and 2,6-dichlorobenzoic acid (0.6% AR).

Teflubenzuron
2313
Table 33 Properties of the soil used to investigate degradation and metabolism of teflubenzuron
Soil designation Location 1 Origin Kent (UK) Soil type silty clay loam Textural analysis (USDA) (%) 2000 - 50 µm, sand 16 < 50 - 2 µm, silt 54 < 2 µm, clay 30 pH value Water 8.1
Organic C (%) 2.3
Cation exchange capacity (meq/100 g) 24.7 Maximum water holding capacity (g H20 for 100 g dry soil)
32.7
Microbial biomass
(mg microbial carbon/kg soil) 688 (T-0) 405 (T-150)
In the aerobic condition, the recovery of radioactivity was initially high (97.8%), gradually declined to 88% after 60 days, with no further decline to the end of the 150-day study. The main component of acetonitrile/water extracts from day 0 to day 30 was teflubenzuron
Table 34 Radioactivity recovered from aerobic samples as a percentage of applied radioactivity (mean of 2 samples)
Extract type Days after treatment 0 7 14 30 60 90 119 150
CO2 0.0 2.6 8.0 20.0 35.0 44.0 48.9 51.9 Aqueous Acetonitrile Teflubenzuron
96.9 82.8 70.3 49.1 24.9 14.7 9.0 6.4 96.9 82.2 69.6 48.4
0.01M CaCl2 NA NA NA 1.5 1.9 1.8 1.5 1.5 Unextracted 1.0 9.7 16.2 20.7 25.9 28.3 28.8 28.1 Total 97.9 95.1 94.5 91.3 87.7 88.8 88.2 87.9
NA – not applicable
Table 35 Analysis of acetonitrile/water extracts from Day 0 and Days 60 to 90 from aerobic soils partitioned by dichloromethane, as a percentage of applied radioactivity (mean of 2 samples)
Days after application Compound identified 0 60 90 120 150 Total in extract a 96.6 24.9 14.7 9.0 6.4 DCM soluble Teflubenzuron 96.6 22.5 13.6 8.0 5.5
Other 0.0 0.1 0.0 0.0 Water soluble 0.1 1.3 1.0 1.0 1.0
a Differences due to rounding of 2 values
In the anaerobic phase of the study (flooding of aerobic soils with water and purging with nitrogen), the recovery of radioactivity from Day 60 and Day 90 in the anaerobic soil was 4% and 10% of applied radioactivity (AR) lower than in the aerobic study. The reason for the lower recovery could be due to untrapped 14CO2, considering the high rate of 14CO2 evolution in the initial part of the study, or to the underestimation of the unextracted radioactivity.
Table 36 Radioactivity recovered from anaerobic samples as a percentage of applied radioactivity (mean of 2 samples)
Extract type Days after initial treatment 30 60 90
CO2 20.0 22.2 22.9 Flood water 2.5 4.3 3.1 Aqueous acetonitrile 48.6 24.3 17.0 0.01M CaCl2 1.2 2.0 1.4

Teflubenzuron
2314
Extract type Days after initial treatment 30 60 90
Unextracted 20.7 31.0 34.1 Total 93.0 83.8 78.5
Table 37 Analysis of acetonitrile/water extracts from anaerobic soils partitioned by dichloromethane as a percentage of applied radioactivity (mean of 2 samples)
Days after application
Compound identified
Immediately after flooding Anaerobic
30 60 90 Total in extracta 48.6 24.3 17.0 DCM soluble Teflubenzuron 46.8 17.3 15.3
Other 0.4 4.9 0.7 Water soluble 1.4 2.2 1.0
a Differences due to rounding of 2 values
Table 38 Characterisation of metabolites found in the initial acetonitrile/water extract of Day 60 anaerobic sample
Extract type % Applied Radioactivity Compound Dichloromethane phase 0.7 Unknown 1
1.0 Hydroxy a 18.7 Teflubenzuron 1.7 Unknown 2
Ethyl acetate phase 0.3 Unknown 3 0.2 Unknown 4 0.6 2,6- difluorobenzoic acid 0.5 Unknown 5
a 1-(3,5-dichloro-2-fluoro-4-hydroxyphenyl)-3-(2,6-difluorobenzoyl)urea
The major extractable radioactive component at all sampling times under aerobic and anaerobic conditions was teflubenzuron, but at least 7 other components were observed in extracts of Day 60 anaerobic soil accounting for a total of less than 5% of the applied radioactivity.
2,6-difluorobenzoic acid from cleavage of the [14C-benzoyl]-teflubenzuron was not observed under aerobic conditions, and trace amounts were identified in the anaerobic soil where the rate of degradation of the benzoyl ring was slower. Another minor degradation product identified under anaerobic conditions was formed by replacement of fluorine by hydroxyl in the 4-position of the aniline ring.
Alternatively reductive defluorination is a possible first step, followed by replacement of hydrogen by hydroxyl. Decarboxylation of 2,6-difluorobenzoic acid would also be expected. This provides good evidence for the mineralization of the bound residues under aerobic conditions.

Teflubenzuron
2315
Cl
F
Cl
F
N
N
F
F
O
O
Cl
F
Cl
F
N
NH 2
O
Cl
F
Cl
F
NH 2
Cl
F
Cl
F
NH 2
F
F
C
O
OH
F
F
C
O
NH 2
F
F
C
O
OH
F
F
+ CO 2 + NH 3
+ CO 2
Bound residues andfurther degradation
Anilino moiety
Benzoyl moiety
Further degradation
+ NH 3
+ CO 2
Teflubenzuron
2,6-difluorobenzoic acid
(CL 245508)
3,5-dichloro-2,4-difluorophenylurea
3,5-dichloro-2,4-difluoroaniline
(CL 902373)
2,6-difluorobenzamide
(CL 211558)
2,6-difluorobenzoic acid2,6-difluorobenzene
(CL 245508)
(CL 902374)
3,5-dichloro-2,4-difluoroaniline(CL 902373)
Figure 1 Proposed metabolic pathway for teflubenzuron in soil
Four field dissipation trial was conducted in Germany(Baumann J., 2003 a, 2003/1010909), Netherlands(Baumann J., 2003 b, 2003/1011770), Italy (Baumann J., 2003 c, 2003/1011775), and France (Baumann J., 2003 d, 2003/2003/1011774). 150 SC formulation of teflubenzuron was broadcast sprayed to bare soil surface at a rate of 0.36 kg a.s/ha. Soil samples were collected at 0-30cm depth and 30-60 cm depth at 0, 13–15, 28–31, 59–63, 90–97, 118–129, 179–180 and 239–243 days after the last application (DALA). The soil samples were extracted in acetone and acetone: water (80:20 v/v) and partitioned before analysis by HPLC. Residues of teflubenzuron were mainly in soil

Teflubenzuron
2316
of 0–10cm depth, with very low esidues in soil of 10–20cm depth. There were no residues in soil at depths of 20–30cm or more. Estimated DT50 and DT90 were 16.6–23.5 and 55.0–78.1 days, respectively.
Table 39 Field dissipation (0-20 cm layer) of teflubenzuron (SC 150 formulation) in various locations after application of 0.36 kg a.s./ha on bare soil (mg/kg)
Time point (days)
The residues of teflubenzruon in soil of 0-10cm
Germany (Baumann J., 2003 a, 2003/1010909)
Netherland (Baumann J., 2003 b, 2003/1011770)
Italy (Baumann J., 2003 c, 2003/1011775)
France (Baumann J., 2003 d, 2003/1011774)
- 2 hours ND ND 0.0075 0.0093
+ 3 hours 0.2636 0.1962 0.1939 0.1837 13-15 0.1060 0.0988 0.0519 0.0838
28-31 0.1184 0.0452 0.0266 0.0445
59-63 0.0130 0.0258 0.016 0.0102
90-97 0.0050 0.0118 0.0071 ND
118-129 0.0051 0.0077 0.0104 ND
179-180 0.0078 0.0074 0.0083 0.0081
239-243 0.0042 0.0056 0.0074 0.0060
Estimated DT50 16.6 days 23.5 20.7 17.1
Estimated DT90 55.0 days 78.1 68.7 56.9
ND: not determined
Behavior of teflubenzuron in different soils was studied (Heupt W., 1984 a, TZ-620-002), analytical standard solution of teflubenzuron was applied to humic sand and sandy loam at a concentration of 100 µg per 100 g of soil. Soil samples were taken and analysed by HPLC with UV detection. Degradation in the humic sand was relative fast with a half-life of approximately 2 weeks. Degradation was significantly slower in the sandy loam, where a half-life of around 6 weeks was calculated.
Table 40 Degradation of teflubenzuron in humic sand and sandy loam
Soil Type Day Percent of applied activity (%) Mean activity (%) Standard deviation (%)
Humic Sand 0 102.0, 98.3, 102.0,103.2, 100.7 101.2 1.87 3 88.9, 91.2, 89.5, 86.7, 88.9 89.0 1.61 13 44.7, 46.2, 55.7, 53.5, 46.9 49.4 4.88 20 36.4, 33.8, 40.9, 32.5, 33.2 35.4 3.43 27 29.7, 30.1, 44.3*, 29.7, 27.7 29.3 1.08 41 21.6, 21.6, 24.1, 29.5*, 22.0 22.3 1.20 DT50 Approximately 2 weeks
Sandy Loam 0 98.3, 97.0, 97.0, 100.7, 94.6 97.5 2.22 3 94.6, 95.7, 96.8, 98.0, 96.8 96.4 1.29 6 87.8, 93.4, 91.2, 91.2, 91.2 91.0 2.01 13 74.1, 81.4, 75.5, 85.8, 84.3 80.2 5.22 27 54.3, 64.0, 59.7, 55.9, 55.9 58.0 3.9 58 49.0, 44.9, 43.4, 54.2, 51.7 48.6 4.52 DT50 Approximately 6 weeks
*Outlier, not included in mean

Teflubenzuron
2317
Hydrolysis of teflubenzuron and its metabolite
The hydrolysis of aniline or benzoyl ring-labelled 14C- teflubenzuron was studied ( Hawkins D.R. et al., 1987 b, TZ-322-001) in buffered solutions at pH 5, 7 and 9 in the absence of light at 25 °C. Teflubenzuron was not hydrolysed at pH 5 and 7 after 30 days at 25 C. At pH 9, teflubenzuron was extensively hydrolysed with a half-life of 10 days calculated using data from both labels. The metabolites identified after 30 days at pH 9 were 3,5-dichloro-2,4-difluorophenylurea (61% from the aniline), 3,5-dichloro-2,4-difluoroaniline (12% from the aniline), 2,6-difluorobenzoic acid (62% from the benzoyl ring), 2,6-difluorobenzamide (12% from the benzoyl ring), and N-(2,4-difluoro-3,5-dichlorobenzene)-5-fluoro[3H]-dihydroquinazoline-2,4-dione (8% from the aniline and 5% from the benzoyl ring).
Hydrolysis of 3,5-dichloro-2,4-difluoro[14C]phenylurea( CL902374), a metabolite of teflubenzuron in sterilized buffered aqueous solutions was investigated at pH 4, 7 and 9 in the absence of light at 50 C 5 C (Baumann J., 2003e, 2003/1009579). Less than 10% of 3,5-dichloro-2,4-difluorophenylurea (CL 902374) was hydrolysed after 5 days at each of the three pHs. After five days, one degradation product was present at maximum levels of 8.9% (pH 4), 9.1% (pH 7) and 8.6% (pH 9). The product co-chromatographed with 3,5-dichloro-2,4-difluroaniline (metabolite E14), a known degradation product of the metabolite in the environment.3,5-dichloro-2,4-difluoro[14C]phenylurea can be considered to be hydrolytically stable. A proposed metabolic pathway for teflubenzuron in aquatic systems is presented in Figure 2.
Cl
F
Cl
F
N
N
F
F
O
O
Cl
F
Cl
F
N
NH 2
O
Cl
F
Cl
F
NH 2
F
F
C
O
OH
teflubenzuron
CO 2
3,5-dichloro-2,4-difluorophenylurea
(CL 902374)2,6-difluorobenzoic acid
(CL 245508)
3,5-dichloro-2,4-difluoroaniline
(CL 902373) Figure 2 Proposed metabolic pathway for teflubenzuron in aquatic systems
Teflubenzuron
2318
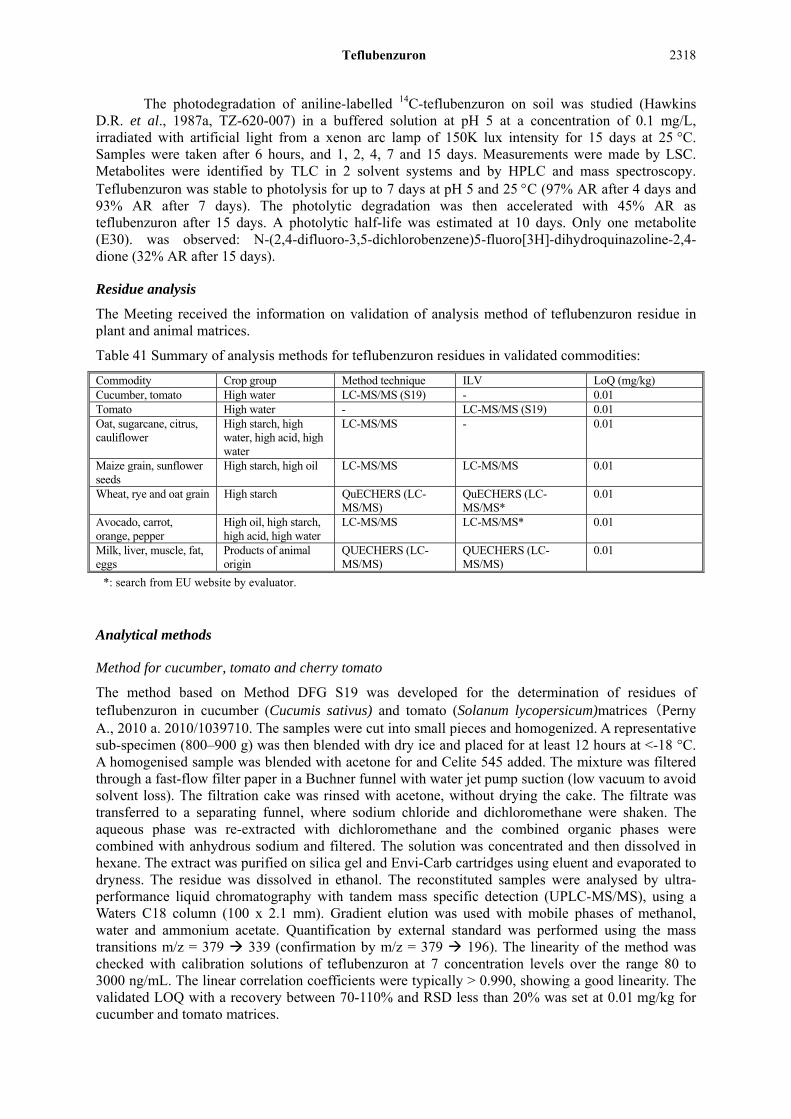
The photodegradation of aniline-labelled 14C-teflubenzuron on soil was studied (Hawkins D.R. et al., 1987a, TZ-620-007) in a buffered solution at pH 5 at a concentration of 0.1 mg/L, irradiated with artificial light from a xenon arc lamp of 150K lux intensity for 15 days at 25 °C. Samples were taken after 6 hours, and 1, 2, 4, 7 and 15 days. Measurements were made by LSC. Metabolites were identified by TLC in 2 solvent systems and by HPLC and mass spectroscopy. Teflubenzuron was stable to photolysis for up to 7 days at pH 5 and 25 C (97% AR after 4 days and 93% AR after 7 days). The photolytic degradation was then accelerated with 45% AR as teflubenzuron after 15 days. A photolytic half-life was estimated at 10 days. Only one metabolite (E30). was observed: N-(2,4-difluoro-3,5-dichlorobenzene)5-fluoro[3H]-dihydroquinazoline-2,4-dione (32% AR after 15 days).
Residue analysis
The Meeting received the information on validation of analysis method of teflubenzuron residue in plant and animal matrices.
Table 41 Summary of analysis methods for teflubenzuron residues in validated commodities:
Commodity Crop group Method technique ILV LoQ (mg/kg) Cucumber, tomato High water LC-MS/MS (S19) - 0.01 Tomato High water - LC-MS/MS (S19) 0.01 Oat, sugarcane, citrus, cauliflower
High starch, high water, high acid, high water
LC-MS/MS - 0.01
Maize grain, sunflower seeds
High starch, high oil LC-MS/MS LC-MS/MS 0.01
Wheat, rye and oat grain High starch QuECHERS (LC-MS/MS)
QuECHERS (LC-MS/MS*
0.01
Avocado, carrot, orange, pepper
High oil, high starch, high acid, high water
LC-MS/MS LC-MS/MS* 0.01
Milk, liver, muscle, fat, eggs
Products of animal origin
QUECHERS (LC-MS/MS)
QUECHERS (LC-MS/MS)
0.01
*: search from EU website by evaluator.
Analytical methods
Method for cucumber, tomato and cherry tomato
The method based on Method DFG S19 was developed for the determination of residues of teflubenzuron in cucumber (Cucumis sativus) and tomato (Solanum lycopersicum)matrices(Perny A., 2010 a. 2010/1039710. The samples were cut into small pieces and homogenized. A representative sub-specimen (800–900 g) was then blended with dry ice and placed for at least 12 hours at <-18 °C. A homogenised sample was blended with acetone for and Celite 545 added. The mixture was filtered through a fast-flow filter paper in a Buchner funnel with water jet pump suction (low vacuum to avoid solvent loss). The filtration cake was rinsed with acetone, without drying the cake. The filtrate was transferred to a separating funnel, where sodium chloride and dichloromethane were shaken. The aqueous phase was re-extracted with dichloromethane and the combined organic phases were combined with anhydrous sodium and filtered. The solution was concentrated and then dissolved in hexane. The extract was purified on silica gel and Envi-Carb cartridges using eluent and evaporated to dryness. The residue was dissolved in ethanol. The reconstituted samples were analysed by ultra-performance liquid chromatography with tandem mass specific detection (UPLC-MS/MS), using a Waters C18 column (100 x 2.1 mm). Gradient elution was used with mobile phases of methanol, water and ammonium acetate. Quantification by external standard was performed using the mass transitions m/z = 379 339 (confirmation by m/z = 379 196). The linearity of the method was checked with calibration solutions of teflubenzuron at 7 concentration levels over the range 80 to 3000 ng/mL. The linear correlation coefficients were typically > 0.990, showing a good linearity. The validated LOQ with a recovery between 70-110% and RSD less than 20% was set at 0.01 mg/kg for cucumber and tomato matrices.

Teflubenzuron
2319
Table 42 Summary of recoveries in cucumber and tomato
Analyte Matrix Fortification Level (mg/kg)
Mean recovery Percentage (%)
Standard deviation (SD) (%)
Relative standard deviation (%)
Number of fortified samples (n)
Teflubenzuron Cucumber 0.01 88.7 16.8 18.9 5 0.10 76.9 1.9 2.5 5 Overall 82.8 12.9 15.6 10
Teflubenzuron
Tomato 0.01 82.9 7.1 8.5 5 0.10 75.4 7.0 9.2 5 Overall 79.2 7.7 9.7 10
An independent laboratory validation (ILV) of the method for cherry tomato was carried out (Schoop T., 2010 a, 2010/1093285) by analysing two blank control samples, five replicates fortified at LOQ (0.01 mg/kg) and 10xLOQ (0.10 mg/kg). The average recovery rates ranged from 75% to 81% with a relative standard deviation of ≤ 6% for the primary mass transition( m/z = 379 339 ) and from 77% to 82% with a relative standard deviation of ≤ 5% for the confirmatory transition (confirmation by m/z = 379 196). Linearity was performed using calibration solutions in the range of 5.0 ng/mL to 120 ng/mL with correlation coefficients (r) ranging from 0.9997 to 0.9998. The method could be extrapolated to determine residues of teflubenzuron in high water matrices (tomato and cucumber).
Table 43 Summary of validation in cherry tomato – primary mass transition
Primary Mass Transition (m/z 378.9 - m/z 338.9) Fortification Level (mg/kg) ng/mL mg/kg Recovery (%)
0.01
7.1651 0.0072 72 7.6081 0.0076 76 7.3497 0.0073 73 7.5831 0.0076 76 7.6546 0.0077 77
Overall Average (n=5) 75 RSD (n=5) 3
0.10
84.2378 0.0842 84 85.9151 0.0859 86 78.6986 0.0787 79 75.5482 0.0755 76 82.2609 0.0823 82
Overall Average (n=5) 81 RSD (n=5) 5
Overall Average Overall average (n=10) 78 Overall RSD (n=10) 6
Table 44 Summary of validation in cherry tomato – confirmatory mass transition
Confirmatory Mass Transition (m/z 378.9 - m/z 358.9) Fortification Level (mg/kg) ng/mL mg/kg Recovery (%)
0.01
7.3973 0.0074 74 7.7914 0.0078 78 7.6365 0.0076 76 7.9666 0.0080 80 7.9361 0.0079 79
Overall Average (n=5) 77 RSD (n=5) 3
0.10
83.4884 0.0835 83 87.6652 0.0877 88 79.6794 0.0797 80 75.7682 0.0758 76 81.9031 0.0819 82
Overall Average (n=5) 82 RSD (n=5) 5

Teflubenzuron
2320
Confirmatory Mass Transition (m/z 378.9 - m/z 358.9) Fortification Level (mg/kg) ng/mL mg/kg Recovery (%)
Overall Average Overall average (n=10) 80 Overall RSD (n=10) 5
Method for oat, sugar cane, citrus and cauliflower
The HPLC/MS/MS method based on analytical methods LAADL MR008 ad RU 134/32/10-95 (SOP-PA.0250) for determination of teflubenzuron residues in oat (Avena sativa), sugarcane (Saccharum officinarum), citrus (Citrus sp.) and cauliflower (Brassica oleracea var. botryti )was validated (Dantas C.,Takahashi J., 2011a, 2011/1050141). The sample and acetone are combined, treated by sonication for 25 minutes and centrifuged for 5 minutes. An aliquot of the clear extract is transferred into a clean centrifuge tube. Water is added and residues are partitioned into hexane by shakeingon a laboratory shaker for 15 minutes. After centrifugation an aliquot of the upper hexane phase is evaporated to dryness and re-dissolved in the final sample solution acetonitrile/methanol/water (50:10:40; v/v/v). The reconstituted samples are analysed by HPLC with tandem mass specific detection (HPLC-MS/MS), using a Zorbax SB-C18 (30 × 2.1 mm, 3.5 μm). Gradient elution is used with mobile phases of water and acetonitrile. Quantification by external standard was performed using the mass transitions m/z = 379 339 (confirmation by m/z = 379 196).
Linearity between of 0.125–2.50 ng/m was demonstrated using five concentrations of external standard with correlation coefficients of 0.9973 for the primary transition and 0.9984 for the confirmatory transition. Recovery by five samples fortified at the LOQ and at 100 × LOQ for each matrix was 70–110%, with the relative standard deviations (RSD) less than 20%. The LOQ was validated to be 0.01 mg/kg for oat grain, sugarcane (stalks), citrus and cauliflower.
Table 45 Analytical method accuracy and precision data
Matrix Ion Transition (m/z)
Fortification Level (mg/kg)
Recoveries (%)
Mean Recovery (%)
RSD (%)
Oat (grain)
379 339 0.01 70, 70, 71, 72, 73 71 2 1.0 88, 95, 98, 104, 104 98 7 All levels – 85 17
379 196 0.01 70, 70, 70, 71, 75 71 3 1.0 85, 95, 98, 102, 104 97 8 All levels – 84 17
Sugarcane (stalks)
379 339 0.01* 70, 72, 80, 88, 90 80 11 1.0 84, 87, 90, 90, 92 89 4 All levels – 84 9
379 196 0.01* 78, 85, 89, 89, 91 86 6 1.0 86, 90, 91, 92, 93 90 3 All levels – 88 5
Citrus
379 339 0.01 75, 77, 79, 82, 87 80 6 1.0 88, 91, 90, 94, 104 93 7 All levels – 87 10
379 196 0.01 70, 83, 88, 89, 96 85 11 1.0 90, 91, 92, 93, 96 92 2 All levels – 89 9
Cauliflower
379 339 0.01* 78, 80, 96, 100, 105 92 13 1.0 87, 90, 92, 97, 102 94 6 All levels – 93 10
379 196 0.01* 79, 91, 96, 104, 112 96 13 1.0 84, 86, 88, 91, 91 88 4 All levels – 92 11
RSD Relative standard deviation
* One replicate excluded as an outlier, possible incomplete partitioning

Teflubenzuron
2321
Method for dry and oily crop
Independent laboratory validation (ILV) of BASF method L0160/01 for the determination of Teflubenzuron in maize grain (Zea mays) and sunflower seeds (Helianthus annuus) by LC-MS/MS was carried out (Przybylek A., 2011a, 2010/1221609).
Maize Grain fortified samples are homogenised with methanol/water (70:30; v/v) for 2 minutes at 6500 rpm. An aliquot is removed and centrifuged for 5 minutes at 4000 rpm. An aliquot of the supernatant is transferred to a culture tube containing water. Cyclohexane is added and the tube is shaken for 15 minutes. An aliquot of the cyclohexane phase is removed to another culture tube and the remaining organic phase is discarded. The cyclohexane partition with the aqueous phase in the original tube is repeated and a second aliquot of cyclohexane phase is combined with the first. The combined aliquots are evaporated to dryness under a stream of nitrogen and reconstituted with methanol/water (50:50 v/v; 1 - 2 mL).
Sunflower Seeds fortified samples are homogenised with isohexane and acetonitrile for 2 minutes at 6500 rpm, then centrifuged for 10 minutes at 13000 rpm. The sample is transferred to a separating funnel. The centrifuge tube is rinsed with acetonitrile and this is added to the separating funnel. The lower phase (acetonitrile) is run into a glass bottle through a cotton wool in a funnel. The upper layer (isohexane) is discarded. The acetonitrile phase is returned to the separating funnel along with an acetonitrile rinse of the glass bottle. Isohexane and formic acid are added and the funnel is shaken for 1 minute. The layers are allowed to separate and the lower (acetonitrile) layer is run into a volumetric flask with 2M NaO. The flask is made to volume with acetonitrile (if necessary, centrifuge an aliquot). An aliquot of the extract is evaporated to dryness under a stream of nitrogen at 50 °C and reconstituted with methanol/water, (50:50; v/v).
The reconstituted samples are syringe filtered if necessary (0.45 μm, 15 mm, PTFE or Nylon) and analysed by HPLC with tandem mass specific detection (LC MS/MS), using a Thermo Betasil C18 column (100 x 2.1 mm, 5 μm). Gradient elution is used with mobile phases of 0.1% formic acid in water and 0.1% formic acid in methanol. Quantification is performed using external standards. Two mass transition are monitored (m/z 379 339 and m/z 379 196).
Linearity between 0.05 to 1.0 ng/mL was demonstrated using eight concentrations of teflubenzuron external standard, with correlation coefficients (r) of 0.9999 for ion transition m/z 379 339, and 0.9998 for ion transition m/z 379 196. Recovery with five samples fortified at the LOQ and 10 x LOQ for each matrix and transition were within 70 - 110% with the relative standard deviations (RSD) less than 20%. The LOQ was validated to be 0.01 mg/kg for maize grain and sunflower seeds, the limit of detection was calculated to be 0.003 mg/kg for maize grain and sunflower seeds.
Table 46 ILV accuracy and precision data
Matrix Ion Transition (m/z)
Fortification Level (mg/kg)
Recoveries (%)
Mean Recovery (%)
RSD (%)
Corn (grain)
379 339 0.01 95, 95, 79, 91, 91 90 7 0.1 91, 99, 101, 103, 103 99 5 All levels – 95 8
379 196 0.01 94, 94, 79, 95, 94 91 7 0.1 90, 102, 103, 99, 101 99 5 All levels – 95 7
Sunflower (seeds)
379 339 0.01* 87, 94, 100, 72 89 14 0.1 94, 102, 92, 101, 68 91 15 All levels – 90 14
379 196 0.01* 86, 89, 97, 77 87 10 0.1 92, 98, 90, 98, 68 89 14 All levels – 88 12
RSD Relative standard deviation * One replicate excluded as an outlier, possible incomplete partitioning

Teflubenzuron
2322
QuEChERS method for determination of teflubenzuron residues in seeds of wheat (Triticum sp.), rye (Secale cereal) and oat (Avena sativa) by GC-MS/MS and LC-MS/MS was validated ( Hjorth K. et al., 2010 b, 2010/7018605). Milled samples fortified at levels of 0.01, 0.02 and 0.10 mg/kg were mixed with water/ice water and acetonitrile. Samples were shaken and a salt and buffer mixture added. Samples were centrifuged and the supernatant removed and transferred to a tube containing magnesium sulfate and PSA. After shaking and centrifugation, the final extract was analysed by HPLC-MS/MS. The parent ion for teflubenzuron was 379 m/z was monitored for two transitions, with daughter ions 339 m/z (daughter ion 1) and 196 m/z (daughter ion 2) used for quantification and confirmation respectively. At fortification levels of 0.01, 0.02 and 0.10 mg/kg, recoveries and RSDs for teflubenzuron by HPLC-MS/MS for wheat, rye and oats are of 70 to 120% with RSD of 3–18, while the recovery and RSD in wheat at level of 0.01 mg/kg are 53% and 30%, respectively.
Table 47 Teflubenzuron data – HPLC-MS/MS
Sample matrix Fortification level (mg/kg)
Recovery (%) RSD (%) LOQ (mg/kg)
Wheat 0.01 53 30 0.010 0.02 79 11 0.10 90 10
Oats 0.01 71 18 0.008 0.02 77 16 0.10 78 3
Rye 0.01 112 17 0.012 0.02 76 14 0.10 76 13
QuEChERS method followed by GC-QqQ/MS/MS and LC-QqQ/MS/MS for determination of teflubenzuron residues in Avocado (Persea Americana), carrot (Daucus carota subsp. sativus), orange (Citrus sp.) and pepper (Capsicum sp) was validated (Anonymous, 2015b, 2015/7000823). Samples were fortified and extracted using acetonitrile. Salts were added and the solutions shaken and centrifuged for phase separation. An aliquot of the organic phase was cleaned up with bulk sorbents (PSA) and anhydrous magnesium sulfate, to remove residual water. Extracts were vortex mixed and filtered before the addition of acetonitrile then analysed by HPLC-MS/MS. The parent ion for teflubenzuron was 379 m/z was monitored for two transitions, with daughter ions 141 m/z (daughter ion 1) and 158 m/z (daughter ion 2) used for quantification and confirmation respectively. Validation was performed on 5 replicates fortified at concentrations of 0.01 and 0.10 mg/kg alongside blank control samples.
Table 48 Teflubenzuron data – HPLC-MS/MS
Fortification level (mg/kg) Recovery (%) RSD (%) 0.01 96 31 0.10 103 14
The QuEChERS multi-residue method using HPLC-MS/MS was validated for the routine analysis of teflubenzuron in high oil, high starch, high acid and high water content commodities.
Methods for animal matrices
A method for the determination of teflubenzuron in bovine fat, muscle, liver, whole milk and poultry egg was developed and validated (Keenan D., Arndt T., 2015a, 2015/7001132).
The method was modified from the QuEChERS multiresidue method and validation was conducted using 5 replicates of fortified samples. Samples are weighed into centrifuge tubes and acetonitrile is added. Water is added (fat samples only) and the samples are extracted using Genogrinder-action shaking for 2 minutes at 1500 rpm. Magnesium sulfate, sodium chloride, sodium citrate dibasic sesquihydrate and sodium citrate tribasic dihydrate are added and the samples are

Teflubenzuron
2323
shaken and centrifuged for 5 minutes at 3000 rpm. Aliquots of the organic layer are cleaned up using PSA/ENVI-Carb cleanup tubes containing magnesium sulfate, Supelclean PSA and Supelclean ENVI-Carb. The samples are centrifuged for 5 minutes at 3000 rpm and filtered through nylon membrane filters (0.45 µm) for analysis. The samples are analysed by HPLC with tandem mass specific detection (HPLC-MS/MS) in negative polarity mode, using a Phenomenex Synergi MAX-RP column (50 mm x 2.0 mm, 4µm particle size) and gradient elution with mobile phases of 0.1% formic acid in water and 0.1% formic acid in acetonitrile. Quantification is performed using external standards. The ion transition m/z 379.0 > 339.0 is used for quantification and the 379.0 > 196.0 is used for confirmation. Linearity between 1.0 ng/mL to 200 ng/mL was demonstrated using at least 6 standard solutions. Recovery from five samples fortified at the LOQ and 10 × LOQ level for each matrix were of 70–120% with the relative standard deviations (RSD) less than 20%. The LOQ was validated to be 0.01 mg/kg, and the limit of detection (LOD) was calculated to be 0.002 mg/kg.
Table 49 Precision and Accuracy
Matrix Ion Transition (m/z) Fortification Level (mg/kg)
Recovery (%) Mean Recovery (%)
RSD (%)
Milk 379.0 > 339.0
0.01 107, 113, 112, 122, 119 115 5.2 0.10 106, 109, 108, 108, 106 107 1.3
379.0 > 196.0 0.01 101, 106, 104, 114, 112 107 5.1 0.10 97, 98, 98, 97, 96 97 0.9
Bovine Liver
379.0 > 339.0 0.01 113, 113, 114, 197*, 109 112 2.0 0.10 105, 106, 103, 103, 105 104 1.3
379.0 > 196.0 0.01 109, 108, 111, 189*, 106 109 1.9 0.10 99, 98, 98, 96, 99 98 1.2
Bovine Muscle
379.0 > 339.0 0.01 119, 110, 105, 106, 136 115 11.2 0.10 100, 97, 97, 101, 94 98 2.8
379.0 > 196.0 0.01 116, 106, 102, 101, 134 112 12.3 0.10 96, 92, 92, 97, 90 93 3.2
Bovine Fat 379.0 > 339.0
0.01 96, 98, 87, 87, 99 93 6.4 0.10 93, 92, 91, 93, 93 92 1.0
379.0 > 196.0 0.01 93, 95, 83, 85, 94 90 6.2 0.10 85, 85, 84, 86, 85 85 0.8
Poultry Eggs
379.0 > 339.0 0.01 102, 103, 106, 104, 104 104 1.4 0.10 107, 101, 101, 105, 104 104 2.5
379.0 > 196.0 0.01 99, 98, 102, 101, 99 100 1.6 0.10 101, 95, 95, 97, 96 97 2.6
* Identified as outlier using Dixon’s Q-test
Independent laboratory validation (ILV) of the modified QuEChERS method for the determination of teflubenzuron in bovine fat, muscle, liver, milk and poultry eggs using LC-MS/MS was carried out (Stanislowski T.,Richter S., 2015a, 2015/7006385) using 5 replicates of fortified samples. Linearity across the concentration range of 0.05 ng/mL to 10 ng/mL was demonstrated using 7 standard solutions. Recovery from five samples fortified at the LOQ and 10 × LOQ for each matrix were of 70–120% with the relative standard deviations (RSD) less than 20%. The LOQ was validated to be 0.01 mg/kg, and the limit of detection (LOD) was calculated to be 0.002 mg/kg.
Table 50 Precision and Accuracy Data
Matrix Ion Transition (m/z) Fortification Level (mg/kg)
Recovery (%) Mean Recovery (%)
RSD (%)
Milk 379.0 > 339.0
0.01 102, 101, 102, 100, 102 101 1 0.10 95, 98, 97, 100, 104 99 3
379.0 > 196.0 0.01 102, 102, 96, 96, 103 100 3 0.10 94, 99, 98, 97, 101 98 3
Bovine Liver
379.0 > 339.0 0.01 92, 100, 106, 100, 103 100 5 0.10 97, 101, 105, 105, 104 102 3
379.0 > 196.0 0.01 93, 102, 110, 109, 101 103 7 0.10 97, 101, 105, 107, 108 103 4
Bovine 379.0 > 339.0 0.01 59, 79, 73, 74, 70 71 11

Teflubenzuron
2324
Matrix Ion Transition (m/z) Fortification Level (mg/kg)
Recovery (%) Mean Recovery (%)
RSD (%)
Muscle
0.10 77, 77, 77, 76, 76 77 1
379.0 > 196.0 0.01 58, 80, 72, 74, 68 70 12 0.10 78, 77, 76, 77, 76 77 1
Bovine Fat 379.0 > 339.0
0.01 76, 83, 86, 83, 88 83 5 0.10 77, 80, 74, 83, 86 80 6
379.0 > 196.0 0.01 74, 83, 85, 79, 84 81 5 0.10 76, 81, 75, 80, 82 79 4
Poultry Eggs
379.0 > 339.0 0.01 69, 80, 77, 78, 84 78 7 0.10 70, 84, 80, 80, 80 79 6
379.0 > 196.0 0.01 70, 79, 78, 80, 84 78 7 0.10 71, 85, 78, 78, 80 79 6
Stability of residues in stored analytical sample
Plant matrices
The storage stability of residues of teflubenzuron in apple, tomato, orange, cotton seed, potato, cabbage and soya bean was investigated after up to 24 (Bixler T.A., 1992a, TZ-326-007) or 36 (Thorstenson J.H., 1990a, TZ-326-004) months of frozen storage at about -20 °C. Triplicate sample aliquots of all matrices were placed in air-tight French square jars and individually fortified at 0.20 mg/kg with teflubenzuron and stored in a freezer at about -20 ºC in the dark. Samples were analysed after 0, 3, 6, 12, 18, 24 and 36 months according to Huntingdon AS method A025.001. At each storage interval, the sample analysis included a non-fortified control sample and one control samples fortified at 0.20 mg/kg teflubenzuron. The stabilities are summarized in table 51.
Table 51 Freezer storage stability of residues of teflubenzuron in apple, tomato, orange, cotton seed, potato, cabbage and soya bean at a fortification level of 0.2 mg/kg up to 24 month
Crop Storage Interval days / months
Remain of teflubenzuron (%, Mean)
Procedural recoveries (%)
Apple
0 / 0 70, 76, 76 (74) 70 91 / 3 92, 84, 89 (88) 112 183 / 6 50, 130, 106 (95) 135 371 / 12 100, 105, 87 (97) 137 548 / 18 78, 88, 63 (76) 105 731 / 24 119, 85, 114 (106) 81
Tomato
0 / 0 98, 110, 95 (101) 98 91 / 3 62, 82, 74 (73) 61 183 / 6 93, 99, 97 (96) 120 371 / 12 103, 103, 122 (109) 149 548 / 18 69, 87, 103 (96) 94 731 / 24 108, 120, 119 (116) 103
Orange
0 / 0 81, 58, 84 (74) 81 91 / 3 92, 86, 70 (82) 81 182 / 6 58, 61, 52 (57) 71 364 / 12 128, 80, 107 (105) 106 546 / 18 95, 108, 109 (104) 95 728 / 24 94, 95, 92 (94) 71
Cotton (Seed)
0 / 0 94, 69, 93 (85) 94 91 / 3 112, 126, 122 (120) 124 182 / 6 104, 86, 103 (98) 122 364 / 12 115, 114, 111 (113) 104 573 / 19 126, 104, 108 (113) 122 728 / 24 129, 102, 103 (111) 116
Potato
0 / 0 88, 66, 91 (82) 88 91 / 3 80, 65, 62 (69) 77 183 / 6 116, 117, 105 (113) 61 371 / 12 111, 112, 102 (108) 95 548 / 18 88, 82, 88 (86) 86

Teflubenzuron
2325
Crop Storage Interval days / months
Remain of teflubenzuron (%, Mean)
Procedural recoveries (%)
731 / 24 93, 96, 58 (83) 78
Cabbage
0 / 0 96, 103 (99) 22.3* 91 / 3 108, 84, 65 (86) 80 183 / 6 105, 53, 85 (81) 84 371 / 12 81, 97, 99 (92) 83 548 / 18 93, 84, 120 (99) 82 731 / 24 118, 120, 116 (118) 110
Soya Bean
0 / 0 102, 69, 97 (89) 102 91 / 3 101, 70, 121 (97) 54 182 / 6 76, 78, 65 (73) 112 364 / 12 113, 114, 93 (107) 109 546 / 18 107, 99, 102 (103) 121 728 / 24 95, 116 (105) 95
* from original report
Table 52 Freezer storage stability of residues of teflubenzuron in apple, pear, cabbage and potato at a fortification level of 0.2 mg/kg up to 36 month
Crop Teflubenzuron Mean (%) after storage 3 months 6 months 12 months 28/24 months 36 months Mean Procedural
recovery Mean Procedural
recovery Mean Procedural
recovery Mean Procedural
recovery Mean Procedural
recovery Apple 115.0 102 101.3 99 95.0 92 222* 93 74.3 74 Pear 90.7 101 113.7 99 90.0 98 87 102 82.3 88 Potato 77.0 105 114.3 107 91.3 93 88 100 84.7 85 Cabbage 103.0 87 102.3 118 95.0 98 212* 173* 94.0 88
* Interferences during analysis precluded accurate determination of recovery, due to deterioration of HPLC column
The storage stability of residues of teflubenzuron in maize grain and sunflower seed was
investigated after up to 24 months of frozen storage at about -20 °C (Bender M., 2012a 2012/1163069). Duplicate sample aliquots of grain and seed were placed in polyethylene containers and individually fortified at 0.10 mg/kg (10 × the method LOQ) with teflubenzuron and stored in a freezer at about -20 ºC in the dark. Samples of maize grain were analysed with LC-MS/MS (BASF analytical method L0160/01) after 0, 28, 89, 173, 369, 543 and 725 days, samples of sunflower seeds were analysed after 0, 28, 89, 202, 368, 547 and 726 days. At each storage interval, the sample analysis included a non-fortified control sample and two control samples fortified at 0.10 mg/kg teflubenzuron. Recovery of teflubenzuron in maize grain was in the range of 86–115%, recovery in sunflower seed was in the range of 79–103%. Residues of teflubenzuron are stable in maize grain and sunflower seed for up to 726 days (24 months) when stored at about -20 ºC.
Table 53 Freezer storage stability of residues of teflubenzuron in maize grain and sunflower seed at fortification level of 0.1 mg/kg
Crop Storage Interval days / months
Recovery (%, mean) Procedural Recovery (%)
Maize (grain)
0 / 0 99, 97 (98) 97 28 / 1 93, 97 (95) 96 89 / 3 105, 107 (106) 103 173 / 6 115, 112 (114) 107 369 / 12 95, 91 (93) 100 543 / 18 86, 92 (89) 89 725 / 24 92, 86 (89) 100
Sunflower (seed)
0 / 0 94, 92 (93) 92 28 / 1 84, 89 (86) 90 89 / 3 89, 94 (92) 100 202 / 7 102, 103 (103) 102 368 / 12 82, 86 (84) 86 547 / 18 79, 82 (81) 85

Teflubenzuron
2326
Crop Storage Interval days / months
Recovery (%, mean) Procedural Recovery (%)
726 / 24 99, 94 (97) 96
USE PATTERN
Teflubenzuron have been registered mainly in South America and Europe to control insects in many crops. The information available to the Meeting on registered uses is summarized in Table 54.
Table 54 Registered uses of Teflubenzuron
Crop Country Formulation Application PHI remarks g ai./L
or g ai/kg
type Method Rate (g ai/ha)
g ai/hL Water L/ha No
(days)
Citrus fruit Citrus
Brazil 75 SC foliar spray or aerial application
30-37.5 1.5-1.875 2000 2 15 No application interval specified on label
Brazil 150 SC foliar spray 75-90 3.75-4.5 2000 2 28 No application interval specified on label
Central America(Guatemala, El Salvador, Honduras, Nicaragua Panama, Costa Rica, and Trinidad & Tobago)
150 SC Foliar spray or aerial application
- 6.75 Min 200 (foliar)
n/s 21 8-12 days between applications
Pome fruit Apple Brazil 150 SC Foliar spray 45-60 4.5-6 1000 3 1 No
application interval specified on label
Argentina 150 SC Foliar spray or aerial application
3.15-5.5 4.5-7.5 70-100 (foliar) min 10 (aerial)
n/s 21 20 days between applications
Uruguay 150 SC Foliar spray or aerial application
48 6 Min. 800 1 21 No application interval specified on label
Pear Brazil 150 SC Foliar spray 45-60 4.5-6 1000 3 15 No application interval specified on label
Berries and other small fruit Grapes Brazil 150 SC Foliar spray 9-48 4.5-6 200-800 3 7 No
application interval specified on label
Assorted tropical and sub-tropical fruits – inedible peel (Group 006) Pineapple Brazil 75 SC Foliar spray 15-240 15-30 100-800 1 7 No
application
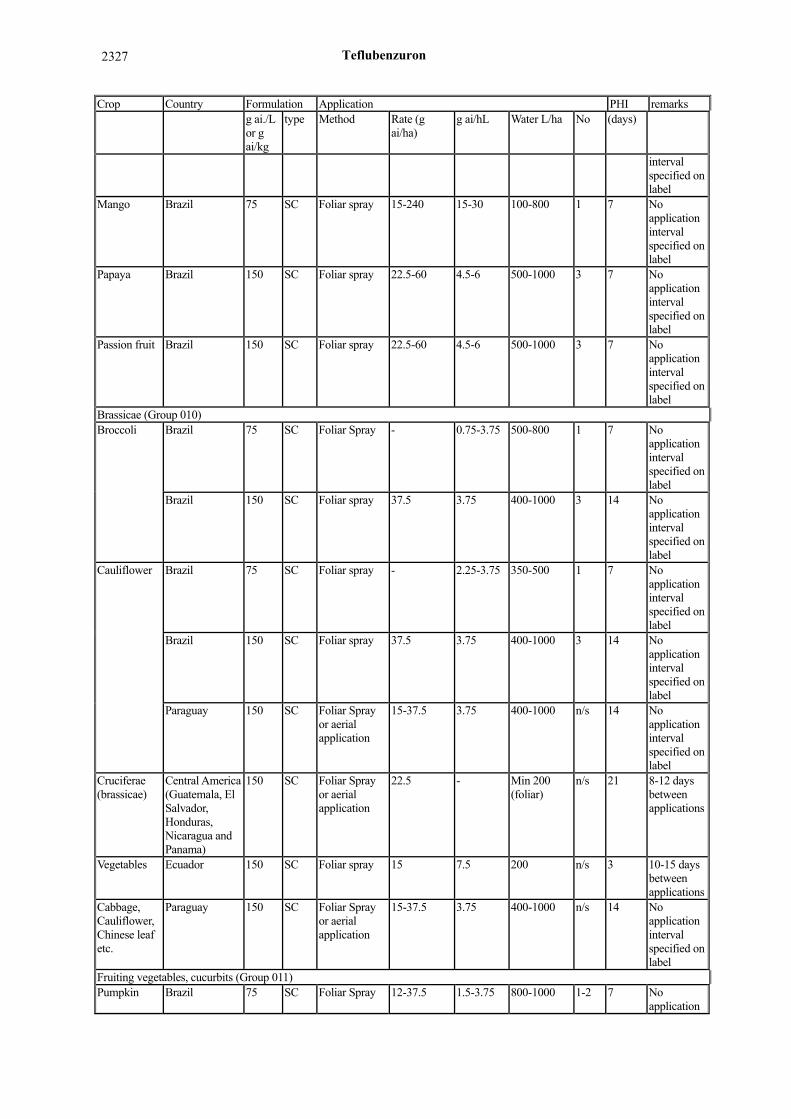
Teflubenzuron
2327
Crop Country Formulation Application PHI remarks g ai./L
or g ai/kg
type Method Rate (g ai/ha)
g ai/hL Water L/ha No
(days)
interval specified on label
Mango Brazil 75 SC Foliar spray 15-240 15-30 100-800 1 7 No application interval specified on label
Papaya Brazil 150 SC Foliar spray 22.5-60 4.5-6 500-1000 3 7 No application interval specified on label
Passion fruit Brazil 150 SC Foliar spray 22.5-60 4.5-6 500-1000 3 7 No application interval specified on label
Brassicae (Group 010) Broccoli Brazil 75 SC Foliar Spray - 0.75-3.75 500-800 1 7 No
application interval specified on label
Brazil 150 SC Foliar spray 37.5 3.75 400-1000 3 14 No application interval specified on label
Cauliflower Brazil 75 SC Foliar spray - 2.25-3.75 350-500 1 7 No application interval specified on label
Brazil 150 SC Foliar spray 37.5 3.75 400-1000 3 14 No application interval specified on label
Paraguay 150 SC Foliar Spray or aerial application
15-37.5 3.75 400-1000 n/s 14 No application interval specified on label
Cruciferae (brassicae)
Central America (Guatemala, El Salvador, Honduras, Nicaragua and Panama)
150 SC Foliar Spray or aerial application
22.5 - Min 200 (foliar)
n/s 21 8-12 days between applications
Vegetables Ecuador 150 SC Foliar spray 15 7.5 200 n/s 3 10-15 days between applications
Cabbage, Cauliflower, Chinese leaf etc.
Paraguay 150 SC Foliar Spray or aerial application
15-37.5 3.75 400-1000 n/s 14 No application interval specified on label
Fruiting vegetables, cucurbits (Group 011) Pumpkin Brazil 75 SC Foliar Spray 12-37.5 1.5-3.75 800-1000 1-2 7 No
application

Teflubenzuron
2328
Crop Country Formulation Application PHI remarks g ai./L
or g ai/kg
type Method Rate (g ai/ha)
g ai/hL Water L/ha No
(days)
interval specified on label
Courgette Brazil 75 SC Foliar Spray 12-37.5 1.5-3.75 800-1000 1-2 7 No application interval specified on label
Netherlands - SC Foliar Spray 75-225 15 500-1500 3 3 7 days between applications
Chayote Brazil 75 SC Foliar Spray 12-37.5 1.5-3.75 800-1000 1-2 7 No application interval specified on label
Cucumber Brazil 75 SC Foliar Spray 12-37.5 1.5-3.75 800-1000 1-2 7 No application interval specified on label
Netherlands - SC Foliar Spray 75-225 15 500-1500 3 3 7 days between applications
Melon Brazil 150 SC Foliar Spray 12-60 3-6 400-1000 3 7 No application interval specified on label
Gherkin Netherlands - SC Foliar Spray 75-225 15 500-1500 3 3 7 days between applications
Vegetables Ecuador 150 SC Foliar Spray 15 7.5 200 n/s 3 10-15 days between applications
Fruiting vegetables, other than cucurbits (Group 012) Tomato Brazil 150 SC Foliar spray 22.5-75 3.75 600-2000 3 4 5 days
between applications (whitefly only)
Brazil 75 SC Foliar Spray or aerial application
15-37.5 1.5-3.75 1000 5 4 No application interval specified on label
Bolivia 150 SC Foliar Spray or aerial application
11.25-15 - (200) 2 7 No application interval specified on label
Columbia 150 SC Foliar Spray or aerial application
4.5-11.25 (ground) 0.79-0.9 (aerial)
2.25 200-500 (ground) 35-40 (aerial)
n/s 4 5-12 days between applications
Argentina 150 SC Foliar Spray or aerial application
- 7.5 70-100 (foliar) min 10 (aerial)
n/s 7 No application interval specified on label
Central America 15 SC Foliar Spray 22.5 - Min 200 n/s 21 8-12 days

Teflubenzuron
2329
Crop Country Formulation Application PHI remarks g ai./L
or g ai/kg
type Method Rate (g ai/ha)
g ai/hL Water L/ha No
(days)
(Guatemala, El Salvador, Honduras, Nicaragua, Panama, Costa Rica and Trinidad & Tobago)
or aerial application
(foliar) between applications
Mexico 150 SC Foliar spray 30-45 - 350-450 2 3 7 days between applications
Paraguay 150 SC Foliar Spray or aerial application
15-37.5 3.75 400-1000 n/s 7 7 days between applications
Uruguay 150 SC Foliar Spray or aerial application
75 - 70-100 (foliar) <30 (aerial)
2 7 No application interval specified on label
Venezuela - SC Foliar Spray or aerial application
37.5-60 7.5-15 - 2 4 7 days between applications
Tomato (including cherry tomato)
Netherlands - SC Foliar Spray 37.5-225 15 500-1500 1-3 3 7 days between applications
Tomatillo Mexico 150 SC Foliar spray 30-45 - 350-450 2 3 7 days between applications
Aubergine (eggplant)
Brazil 75 SC Foliar spray - 0.75-3.75 400-800 1-4 14 No application interval specified on label
Netherlands - SC Foliar Spray 37.5-225 15 500-1500 1-3 3 7 days between applications
Mexico 150 SC Foliar spray 30-45 - 350-450 2 3 7 days between applications
Gilo Brazil 75 SC Foliar spray - 0.75-3.75 400-800 1-4 14 No application interval specified on label
Peppers (bell) Brazil 75 SC Foliar spray - 0.75-3.75 400-800 1-4 14 No application interval specified on label
Netherlands - SC Foliar Spray 37.5-225 15 500-1500 1-3 3 7 days between applications
Mexico 150 SC Foliar spray 30-45 - 350-450 2 3 7 days between applications
Chillies Netherlands - SC Foliar Spray 37.5-225 15 500-1500 1-3 3 7 days between applications
Mexico 150 SC Foliar spray 30-45 - 350-450 2 3 7 days between

Teflubenzuron
2330
Crop Country Formulation Application PHI remarks g ai./L
or g ai/kg
type Method Rate (g ai/ha)
g ai/hL Water L/ha No
(days)
applicationsOkra Brazil 75 SC Foliar spray - 0.75-3.75 400-800 1-4 14 No
application interval specified on label
Vegetables Ecuador 150 SC Foliar spray 15 7.5 200 n/s 3 10-15 days between applications
Pulses (Group 015) Soya bean Brazil 150 SC Foliar Spray
or aerial application
7.5 - 20-40 (aerial)
2 30 No application interval specified on label
Brazil 75 SC Foliar Spray or aerial application
7.5-15 - 100-200 2 30 No application interval specified on label
Columbia 150 SC Foliar Spray or aerial application
22.5-30 - 200-500 (foliar) 35-40 (aerial)
n/a 30 5-12 days between applications
Bolivia 150 SC Foliar Spray or aerial application
15-18.75 - 5-50 2 30 No application interval specified on label
Bolivia 75 SC Foliar Spray or aerial application
15-18.75 - 100-200 (foliar) 20-40 (aerial)
2 30 No application interval specified on label
Argentina 75 SC Foliar Spray or aerial application
11.25-15 - 70-100 (foliar) min 10 (aerial)
n/a 14 No application interval specified on label
Central America (Guatemala, El Salvador, Honduras, Nicaragua and Panama)
15 SC Foliar Spray or aerial application
22.5-33.75 - min 200 (foliar)
n/s 21 8-12 days between applications
Paraguay 150 SC Foliar Spray or aerial application
7.5-12 - 5-50 (foliar) 20-40 (aerial)
2 30 10-15 days between applications
Uruguay 150 SC Foliar Spray or aerial application
10.5-22.5 - 70-100 (foliar) 30 (aerial)
1 21 No application interval specified on label
Uraguay 75 SC Foliar Spray or aerial application
11.25-18.75 - 100 (foliar) 40 (aerial)
1 14 No application interval specified on label
Cereals (Group 020) Field corn Brazil 150 SC Foliar Spray or 7.5-15 - - 2 45 No

Teflubenzuron
2331
Crop Country Formulation Application PHI remarks g ai./L
or g ai/kg
type Method Rate (g ai/ha)
g ai/hL Water L/ha No
(days)
aerial application
application interval specified on label
Brazil 75 SC Foliar Spray or aerial application
11.25-12.75 - 300 2 45 No application interval specified on label
Bolivia 150 SC Foliar Spray or aerial application
15-18.75 - 5-50 2 45 No application interval specified on label
Bolivia 75 SC Foliar Spray or aerial application
18.75-22.5 - 100-200 (foliar) 20-40 (aerial)
2 45 No application interval specified on label
Columbia 150 SC Foliar Spray or aerial application
37.5-45 - 200-500 (foliar) 35-40 (aerial)
n/s 45 5-12 days between applications
Argentina 150 SC Foliar Spray or aerial application
15 - 70-100 (foliar) min 10 (aerial)
n/s 85 No application interval specified on label
Central America (Guatemala, El Salvador, Honduras, Nicaragua, Panama, Costa Rica and Trinidad & Tobago)
15 SC Foliar spray 22.5-30 - Min 200 (foliar)
n/s 21 8-12 days between applications
Ecuador 150 SC Foliar spray 45-60 - - n/s 15 10-15 days between applications
Mexico 150 SC Foliar spray 37.5-45 - 350-450 2 30 7 days between applications
Paraguay 150 SC Foliar Spray or aerial application
9-12 - 5-50 (foliar) 20-40 (aerial)
1 45 No application interval specified on label
Uruguay 150 SC Foliar Spray or aerial application
10.5-22.5 - 70-100 (foliar) 30 (aerial)
1 21 No application interval specified on label
Uruguay 75 SC Foliar Spray or aerial application
11.25-15 - 100 (foliar) 40 (aerial)
1 14 No application interval specified on label
Venezuela - SC Foliar Spray or aerial application
15-22.5 - - 2 4 7 days between applications

Teflubenzuron
2332
Crop Country Formulation Application PHI remarks g ai./L
or g ai/kg
type Method Rate (g ai/ha)
g ai/hL Water L/ha No
(days)
Oats Brazil 75 SC Foliar Spray or aerial application
7.5-11.25 - 150-200 2 14 No application interval specified on label
Barley Brazil 75 SC Foliar Spray or aerial application
7.5-11.25 - 150-200 2 14 No application interval specified on label
Wheat Brazil 75 SC Foliar Spray or aerial application
7.5-11.25 - 150-200 2 14 No application interval specified on label
Grasses for sugar or syrup production (Group 021) Sugarcane Brazil 150 SC Foliar Spray
or aerial application
18-22.5 - 150 2 40 No application interval specified on label
Oilseeds (Group 023) Sunflower Brazil 75 SC Foliar Spray
or aerial application
7.5-11.25 - 200 2 7 No application interval specified on label
Uruguay 75 SC Foliar Spray or aerial application
11.25-15 - 100 (foliar) 40 (aerial)
1 30 No application interval specified on label
Seed for beverages and sweets (Group 024) Coffee Brazil 150 SC Foliar spray 37.5 - - 2 30 14 days
between applications
n/s = not specified
RESULTS OF SUPERVISED RESIDUE TRIALS ON CROPS
The Meeting received information on supervised field trials following foliar applications of teflubenzuron to the following crops: citrus fruit, pome fruit, berries, mango, papaya, pineapple, vegetable, maize, sugarcane and coffee.
The supervised trials received were documented with laboratory and field reports. Laboratory reports included method validation including procedural recoveries with spiking at residue levels similar to those occurring in samples from the supervised trials. Dates of analyses or duration of residue sample storage were also provided. Although trials included control plots, no control data are recorded in the tables unless residues in control samples exceeded the LOQ. In such cases, the residues found are noted as “c=nn mg/kg” in the Reference and Comments columns. Residue data are recorded unadjusted for recovery.
Results from replicated field plots are presented as individual values. When residues were not detected they are shown as ND. Residues and application rates have been reported as provided in the study reports, although the results from trials used for the estimation of maximum residue levels (underlined) have been rounded to two significant digits (or if close to the LOQ, rounded to one significant digit) in the Appraisal.

Teflubenzuron
2333
In some trials, samples were taken just before the final application and then, again on the same day after the spray had dried. The notation for these two sampling times in the data tables is '-0' and '0' respectively.
When multiple applications were made to a crop, the application rate, spray concentration and spray volume were not always identical from one application to the next. In most trials, the actual treatment rates were within 10% of the listed ‘target’ application rates, but if not, the actual treatment rates are listed.
The analytical methods used in the field trials were capable of analysing teflubenzuron.
Citrus Fruit
Oranges
Decline and final residue trials of teflubenzuron were conducted on orange under field conditions during 2008-2012 in Brazil (Dantas C., 2011a, 2010/1151830; Jones B. andAlves M., 2012a, 2012/3000937; Dantas C. and Alves M., 2012a, 2012/3005363; Guimaraes S.F. and Chanes J., 2013a, 2013/3000621), Costa Rica and two in Honduras (Gehl J., 2013a, 2012/7003873). The oranges were treated with two applications of 37.5-120 g ai/ha at 15-17 days application interval. The last application was performed 13–15/28 days before normal commercial harvest. Orange samples were collected at 0, 5, 10, 15, 20 or 21, 28, 35, 42 days after the last application. Samples were analysed with LC-MS/MS method (SOP-PA.0250). The LOQ of the method was 0.01 mg/kg. Procedural recoveries at fortification levels of 0.01 mg/kg and 1.0 mg/kg were in the range of 78% to 123%. Samples were stored for a maximum of 23 months until analysis. The residue results in orange are summarized in Table 55.
Table 55 Teflubenzuron residues in orange resulting from supervised trials conducted in Brazil, Costa Rica and Honduras during 2008-2012 (SC formulation)
Orange Application DALT Commodity Teflubenzuron (mg/kg)
Reference
Trial Country, year (Variety)
g ai/ha Water (L/ha)
No days
GAP for oranges in Brazil 75-90 2000 2 28
G080199 Santo Antonio de Posse (SP), Brazil, 2008 (Pera)
75.0 2000 2 0 5 10 15 20
whole fruit 0.08 0.05 0.04 0.01 0.04
Dantas C. 2011a; Report No. 331417 DocID 2010/1151830
G080200 Estiva Gerbi (SP), Brazil, 2008 (Valencia)
75.0 2000 2 13 whole fruit 0.08
G080201 Mogi Mirim (SP), Brazil, 2008 (Valencia)
75.0 2000 2 13 whole fruit 0.14
G080257 Senador Canedo (GO), Brazil, 2008 (Pera)
75.0 2000 2 0 5 10 15 20
whole fruit 0.09 0.05 0.08 0.07 0.04
G100626 Santo Antonio de Posse (SP), Brazil, 2011 (Pêra-Coroa)
37.5 2000 2 0 5 10 14 20
whole fruit 0.23 0.17 0.16 0.14 0.14
Jones, Alves. 2012; Report No. 376601_1 DocID 2012/3000937

Teflubenzuron
2334
Orange Application DALT Commodity Teflubenzuron (mg/kg)
Reference
Trial Country, year (Variety)
g ai/ha Water (L/ha)
No days
G100627 Jaboticabal (SP), Brazil, 2011 (Pêra)
37.5 2000 2 0 5 10 15 20
whole fruit 0.09 0.03 0.04 0.02 0.01
G100628 Tamarana (PR), Brazil, 2011 (Pêra Rio)
37.5 2000 2 13 whole fruit 0.04
G100629* Mogi Mirim (SP), Brazil, 2011 (Pêra-Coroa)
37.5 2000 2 14 whole fruit 0.08
G100163** Mogi Mirim (SP), Brazil, 2011 (Pêra-Coroa)
120 2000 2 21 28 35
whole fruit 0.02 0.02 0.02
Dantas, Alves. 2012; Report No. 380641 DocID 2012/3005363
G100164 Santo Antonio de Posse (SP), Brazil, 2010 (Pêra-Coroa)
120 2000 2 21 28 35
whole fruit 0.03 0.03 0.03
G100165 Londrina (PR), Brazil, 2010 (Pêra Rio)
120 2000 2 28 whole fruit 0.02
G100166 Jaboticabal (SP), Brazil, 2011 (Pêra)
120 2000 2 28 whole fruit 0.04
R100218 Pavones, Los Chiles, Alajuela, Costa Rica, 2011 (Pineapple)
37 - 38 1985 - 2001 2 15 whole fruit 0.05 a Gehl; Report No. S10-01411 BASF DocID 2012/7003873
R100219 Pavones, Los Chiles, Alajuela, Costa Rica, 2011 (Pineapple)
38 2000 2 15 whole fruit 0.05 a
R100220 Trujillo, Aldea Rigores Colón, Honduras, 2011 (Valencia Roja)
37 - 38 1978 - 2006 2 15 whole fruit 0.03 a
R100221 Trujillo, Aldea Rigores Colón, Honduras, 2011 (Valencia Roja)
37 - 38 1981–2031 2 15 whole fruit 0.02 a
G120032 Jaboticabal (SP), Brazil, 2012 (Pêra)
120 2000 2 21 28 28 28 35 42
whole fruit peel pulp whole fruit whole fruit whole fruit
0.17 0.45 < 0.01 0.12 0.08 0.08
Guimarães, Chanes. 2013; Report No. 402452 BASF DocID 2013/3000621
G120033 Santo Antônio da Posse (SP), Brazil, 2012 (Hamelin)
120 2000 2 21 28 28 28 35 42
whole fruit peel pulp whole fruit whole fruit whole fruit
0.26 a 0.99 < 0.01 0.25 a 0.26 a 0.23
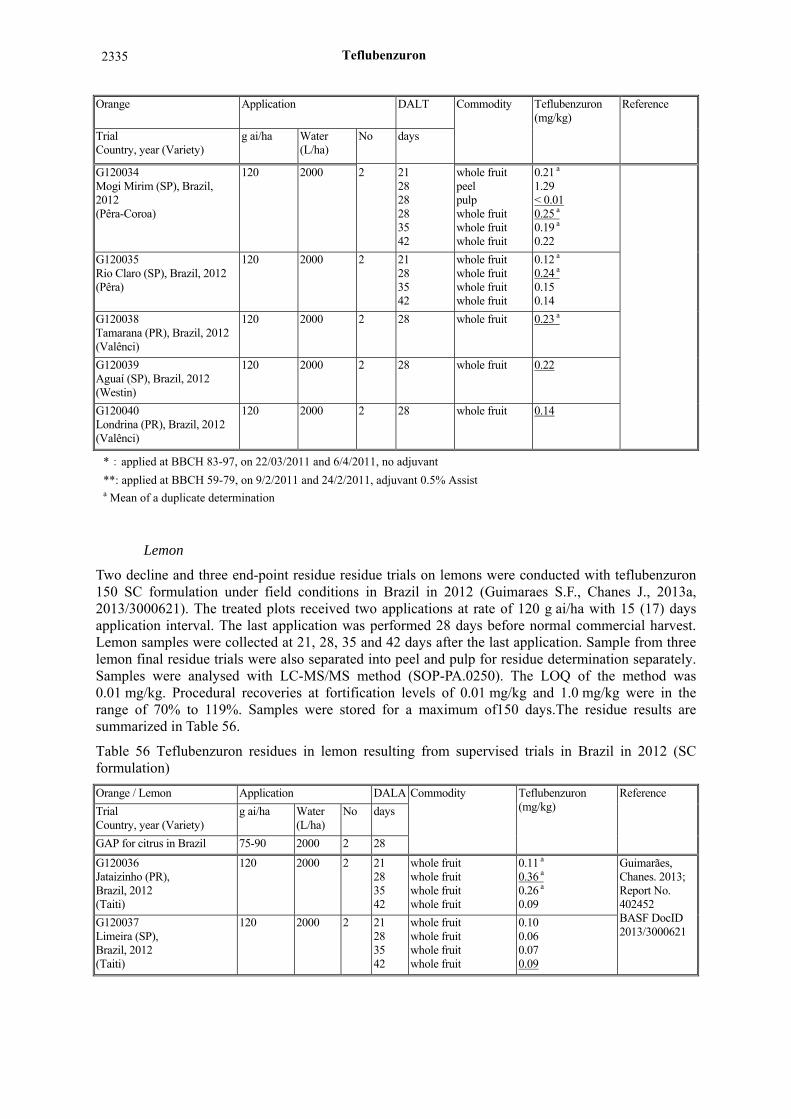
Teflubenzuron
2335
Orange Application DALT Commodity Teflubenzuron (mg/kg)
Reference
Trial Country, year (Variety)
g ai/ha Water (L/ha)
No days
G120034 Mogi Mirim (SP), Brazil, 2012 (Pêra-Coroa)
120 2000 2 21 28 28 28 35 42
whole fruit peel pulp whole fruit whole fruit whole fruit
0.21 a 1.29 < 0.01 0.25 a 0.19 a 0.22
G120035 Rio Claro (SP), Brazil, 2012 (Pêra)
120 2000 2 21 28 35 42
whole fruit whole fruit whole fruit whole fruit
0.12 a 0.24 a 0.15 0.14
G120038 Tamarana (PR), Brazil, 2012 (Valênci)
120 2000 2 28 whole fruit 0.23 a
G120039 Aguaí (SP), Brazil, 2012 (Westin)
120 2000 2 28 whole fruit 0.22
G120040 Londrina (PR), Brazil, 2012 (Valênci)
120 2000 2 28 whole fruit 0.14
*:applied at BBCH 83-97, on 22/03/2011 and 6/4/2011, no adjuvant
**: applied at BBCH 59-79, on 9/2/2011 and 24/2/2011, adjuvant 0.5% Assist a Mean of a duplicate determination
Lemon
Two decline and three end-point residue residue trials on lemons were conducted with teflubenzuron 150 SC formulation under field conditions in Brazil in 2012 (Guimaraes S.F., Chanes J., 2013a, 2013/3000621). The treated plots received two applications at rate of 120 g ai/ha with 15 (17) days application interval. The last application was performed 28 days before normal commercial harvest. Lemon samples were collected at 21, 28, 35 and 42 days after the last application. Sample from three lemon final residue trials were also separated into peel and pulp for residue determination separately. Samples were analysed with LC-MS/MS method (SOP-PA.0250). The LOQ of the method was 0.01 mg/kg. Procedural recoveries at fortification levels of 0.01 mg/kg and 1.0 mg/kg were in the range of 70% to 119%. Samples were stored for a maximum of150 days.The residue results are summarized in Table 56.
Table 56 Teflubenzuron residues in lemon resulting from supervised trials in Brazil in 2012 (SC formulation)
Orange / Lemon Application DALA Commodity Teflubenzuron (mg/kg)
Reference
Trial Country, year (Variety)
g ai/ha Water (L/ha)
No days
GAP for citrus in Brazil 75-90 2000 2 28
G120036 Jataizinho (PR), Brazil, 2012 (Taiti)
120 2000 2 21 28 35 42
whole fruit whole fruit whole fruit whole fruit
0.11 a 0.36 a 0.26 a 0.09
Guimarães, Chanes. 2013; Report No. 402452 BASF DocID 2013/3000621
G120037 Limeira (SP), Brazil, 2012 (Taiti)
120 2000 2 21 28 35 42
whole fruit whole fruit whole fruit whole fruit
0.10 0.06 0.07 0.09
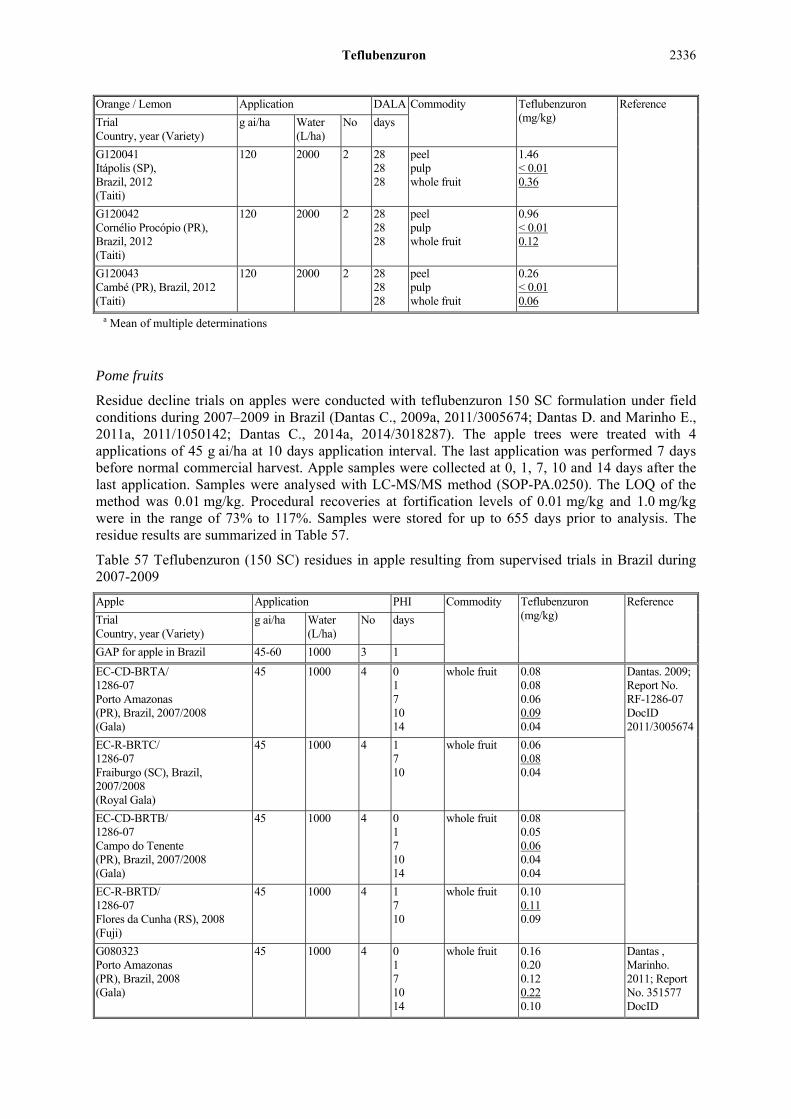
Teflubenzuron
2336
Orange / Lemon Application DALA Commodity Teflubenzuron (mg/kg)
Reference
Trial Country, year (Variety)
g ai/ha Water (L/ha)
No days
G120041 Itápolis (SP), Brazil, 2012 (Taiti)
120 2000 2 28 28 28
peel pulp whole fruit
1.46 < 0.01 0.36
G120042 Cornélio Procópio (PR), Brazil, 2012 (Taiti)
120 2000 2 28 28 28
peel pulp whole fruit
0.96 < 0.01 0.12
G120043 Cambé (PR), Brazil, 2012 (Taiti)
120 2000 2 28 28 28
peel pulp whole fruit
0.26 < 0.01 0.06
a Mean of multiple determinations
Pome fruits
Residue decline trials on apples were conducted with teflubenzuron 150 SC formulation under field conditions during 2007–2009 in Brazil (Dantas C., 2009a, 2011/3005674; Dantas D. and Marinho E., 2011a, 2011/1050142; Dantas C., 2014a, 2014/3018287). The apple trees were treated with 4 applications of 45 g ai/ha at 10 days application interval. The last application was performed 7 days before normal commercial harvest. Apple samples were collected at 0, 1, 7, 10 and 14 days after the last application. Samples were analysed with LC-MS/MS method (SOP-PA.0250). The LOQ of the method was 0.01 mg/kg. Procedural recoveries at fortification levels of 0.01 mg/kg and 1.0 mg/kg were in the range of 73% to 117%. Samples were stored for up to 655 days prior to analysis. The residue results are summarized in Table 57.
Table 57 Teflubenzuron (150 SC) residues in apple resulting from supervised trials in Brazil during 2007-2009
Apple Application PHI Commodity Teflubenzuron (mg/kg)
Reference
Trial Country, year (Variety)
g ai/ha Water (L/ha)
No days
GAP for apple in Brazil 45-60 1000 3 1
EC-CD-BRTA/ 1286-07 Porto Amazonas (PR), Brazil, 2007/2008 (Gala)
45 1000 4 0 1 7 10 14
whole fruit 0.08 0.08 0.06 0.09 0.04
Dantas. 2009; Report No. RF-1286-07 DocID 2011/3005674
EC-R-BRTC/ 1286-07 Fraiburgo (SC), Brazil, 2007/2008 (Royal Gala)
45 1000 4 1 7 10
whole fruit 0.06 0.08 0.04
EC-CD-BRTB/ 1286-07 Campo do Tenente (PR), Brazil, 2007/2008 (Gala)
45 1000 4 0 1 7 10 14
whole fruit 0.08 0.05 0.06 0.04 0.04
EC-R-BRTD/ 1286-07 Flores da Cunha (RS), 2008 (Fuji)
45 1000 4 1 7 10
whole fruit 0.10 0.11 0.09
G080323 Porto Amazonas (PR), Brazil, 2008 (Gala)
45 1000 4 0 1 7 10 14
whole fruit 0.16 0.20 0.12 0.22 0.10
Dantas , Marinho. 2011; Report No. 351577 DocID

Teflubenzuron
2337
Apple Application PHI Commodity Teflubenzuron (mg/kg)
Reference
Trial Country, year (Variety)
g ai/ha Water (L/ha)
No days
G080324 Campo do Tenente (PR), Brazil, 2008/2009 (Gala)
45 1000 4 0 1 7 10 14
whole fruit 0.16 0.14 0.11 0.14 0.13
2011/1050142
G080325 Flores da Cunha (RS), Brazil, 2009 (Fuji)
45 1000 4 0 1 7 10 14
whole fruit 0.15 0.14 0.18 0.15 0.14
G080326 Antônio Prado (RS), Brazil, 2009 (Fuji)
45 1000 4 0 1 7 10 14
whole fruit 0.19 0.16 0.18 0.21 0.16
G080327 Porto Amazonas (PR), Brazil, 2008 (Gala)
45 1000 4 1 7 10
whole fruit 0.17 0.11 0.08
G080328 Campo do Tenente (PR), Brazil, 2008/2009 (Gala)
45 1000 4 1 7 10
whole fruit 0.10 0.14 0.10
G080329 Flores da Cunha (RS), Brazil, 2009 (Fuji)
45 1000 4 1 7 10
whole fruit 0.21 0.29 0.09
G080330 Antônio Prado (RS), 2009 (Fuji)
45 1000 4 1 7 10
whole fruit 0.20 0.21 0.12
Berries and other small fruits
Residue decline and end-point trials on grapes were conducted with teflubenzuron 150 SC formulation under field conditions in Brazil in 2010-2012 (Dantas C. and Cardoso B., 2012a, 2012/3005364; Guimaraes S.F. and Ramiro M.S.P., 2013a,2013/3000824). The grapes were treated with 3 applications of 75 g ai/ha at 6-7 days application interval. The last application was performed 7 days before normal commercial harvest. Grape samples were collected at 0, 7, 15 and 21 daysafter the last application. Samples were analysed with LC-MS/MS method (SOP-PA.0250). The LOQ of the method was 0.01 mg/kg. Procedural recoveries at fortification levels of 0.01 mg/kg and 1.0 mg/kg were in the range of 80% to 123%. Samples were stored for up to 464 days prior to analysis. The residue results are summarized in Table 58.
Table 58 Teflubenzuron residues in grapes resulting from supervised trials in Brazil in during 2010-2012(150SC)
Grapes Application DALA Commodity Teflubenzuron (mg/kg)
Reference
Trial No. location Country, year (Variety)
Rate(g ai/ha)
Water (L/ha)
No days
GAP for grapes in Brazil 9-48 200-800 3 7
G100159 Jundiaí (SP), Brazil, 2010 (Niagara Rosada)
75 1000 3 0 7 15 21
berries 0.14 0.12 0.12 0.12
Dantas, Cardoso 2012; Report No. 374912 BASF

Teflubenzuron
2338
Grapes Application DALA Commodity Teflubenzuron (mg/kg)
Reference
Trial No. location Country, year (Variety)
Rate(g ai/ha)
Water (L/ha)
No days
G100160 Ponta Grossa (PR), Brazil, 2010/2011 (Niagara Branca)
75 1000 3 0 7 15 21
berries 0.89 0.62 0.50 0.57
DocID 2012/3005364
G100161 Petrolina (PE),2010/2011 Brazil (Italia)
75 1000 3 7 15
berries 0.31 0.31
G100162 Londrina (PR), Brazil, 2010/2011 (Benitaka)
75 1000 3 7 15
berries 0.08 0.15
G110188 Jundiaí (SP), Brazil, 2011/12 (Niagara Rosada)
75 1000 3 0 7 15 21
berries 0.31 0.23 0.24 0.26
Freitas Guimarães, Scamardi Pinto Ramiro, 2013; Report No. 374966 BASF DocID 2013/3000824
G110189 Ponta Grossa (PR), Brazil, 2011/12 (Niagara Branca)
75 1000 3 0 7 15 21
berries 0.49 0.45 0.49 0.20
G110190 Rolândia (PR), Brazil, 2012 (Isabel)
75 1000 3 0 7 15 21
berries 0.01 < 0.01 0.01 0.02
G110191 Ibiporã (PR), Brazil, 2012 (Niagara)
75 1000 3 0 7 15 21
berries 0.09 a 0.04 0.04 0.04
G110192 Petrolina (PE), Brazil, 2012 (Itália)
75 1000 3 7 15
berries 0.37 0.22 1)
G110193 Cambé (PR), Brazil, 2012 (Niagara)
75 1000 3 7 15
berries 0.15 0.09
G110194 São Sebastião da Amoreira (PR), Brazil, 2012 (Benitaka)
75 1000 3 7 15
berries 0.11 a) 0.10
G110195 Londrina (PR), Brazil, 2012 (Rubi)
75 1000 3 7 15
berries 0.06 a 0.06 a
a Mean of a multiple (2–3) determination
Assorted tropical and sub-tropical fruit – inedible peel
Mango
Two reversed decline trials and two end-point residue trials on mango were conducted with teflubenzuron 75 SC formulation under field conditions in Brazil in 2011 (Porto F., 2012a, 2012/3005740). The treated plots received 3 applications at rate of 300 g ai/ha with 6-8 days application interval. The last application was performed 15 days before normal commercial harvest. Mango samples were collected at 0, 7, 15 and 21 days for the decline trials and at 7 and 15 days for the final residue trials. Samples were analysed with LC-MS/MS method (SOP-PA.0250). The LOQ of the method was 0.01 mg/kg. Procedural recoveries at fortification levels of 0.01 mg/kg and 1.0 mg/kg

Teflubenzuron
2339
were in the range of 70% to 91%. Samples were stored for up to 163 days prior to analysis. The residue results are summarized in Table 59.
Table 59 Teflubenzuron (75 SC) residues in mango resulting from supervised trials in Brazil in 2011
Mango Application DALA Commodity Teflubenzuron (mg/kg)
Reference
Trial, Country, year (Variety)
Rate (g ai/ha)
Water (L/ha)
No days
GAP for mango in Brazil 15-240 100-800 1 7
G100493 Petrolina (PE), Brazil, 2011 (Tommy Atkins)
300 1000 3 0 7 15 21
fruit 0.67 0.51 0.46 0.45
Port, F. 2012; Report No. 375383 BASF DocID 2012/3005740
G100494 Sobradihno (BA), Brazil, 2011 (Tommy Atkins)
300 1000 3 0 7 15 21
fruit 0.49 0.30 0.41 0.29
G100495 Taquaritinga (SP), Brazil, 2011 (Palmer)
300 1000 3 7 15
fruit 0.44 0.46
G100500 Itapolis (Sp), Brazil, 2011 (Plamer)
300 1000 3 7 15
fruit 0.49 0.48
Papaya
Two decline trials and two end-point residue trials on papaya were conducted with teflubenzuron 150 SC formulation under field conditions in Brazil in 2011 (Porto F., 2012a, 2012/3005740). The treated plots received 3 applications at rate of 75 g ai/ha with 6-8 days application interval. The last application was performed 7 days before normal commercial harvest. Papaya samples were collected at 0, 7, 14 and 21 days for the decline trials and at 7 and 14 days for the final residue trials. Samples were analysed with LC-MS/MS method (SOP-PA.0250). The LOQ of the method was 0.01 mg/kg. Procedural recoveries at fortification levels of 0.01 mg/kg and 1.0 mg/kg were in the range of 70% to 96%. Samples were stored for up to 317 days prior to analysis. The residue results are summarized in Table 60.
Table 60 Teflubenzuron ( 150 SC) residues in papaya resulting from supervised trials in Brazil in 2011
Papaya Application DALA Commodity Teflubenzuron (mg/kg)
Reference
Trial, Country, year (Variety)
Rate (g ai/ha) Water (L/ha) No days
GAP for papaya in Brazil
60 500-1000 3 7
G110052 Sooretama (ES), Brazil, 2011 (Rubi)
75 1000 3 0 7 14 21
fruit 0.14 0.16 0.18 0.11
Porto, Cardoso 2012; Report No. 374916 BASF DocID 2012/3005365 G110053
Linhares (ES), Brazil, 2011 (Goldem)
75 1000 3 0 7 14 21
fruit 0.13 0.13 0.11 0.12
G110054 Bela Vista do Paraíso (PR), Brazil, 2011 (Formosa)
75 1000 3 7 14
fruit 0.03 0.04

Teflubenzuron
2340
Papaya Application DALA Commodity Teflubenzuron (mg/kg)
Reference
Trial, Country, year (Variety)
Rate (g ai/ha) Water (L/ha) No days
G110055 Pinheiros (ES), Brazil, 2011 (THB)
75 1000 3 7 14
fruit 0.19 0.19
Pineapples
Decline and end-point residue trials on pineapples were conducted with teflubenzuron 75 SC formulation(mixture with alpha-cypermethrin) under field conditions in Brazil in 2011-2012 (Guimaraes S.F. and Chanes J., 2012a, 2012/3005488; Guimaraes S.F. and Goes Menezes E.M. de, 2013a, 2013/3000383) . The pineapples were treated with 3 applications of 300 g ai/ha at 6-8 days application interval. The last application was performed 15 days before normal commercial harvest. Pineapple samples were collected at 0, 7, 15 and 21 days after the last application. Samples were analysed with LC-MS/MS method (SOP-PA.0250). The LOQ of the method was 0.01 mg/kg. Procedural recoveries at fortification levels of 0.01 mg/kg and 1.0 mg/kg were in the range of 70% to 123%. Samples were stored for up to 261 days prior to analysis. The residue results are summarized in Table 61.
Table 61 Teflubenzuronresidues in pineapple resulting from supervised trials in Brazil in 2011-2012 (75 SC)
Pineapples Application DALA Commodity Teflubenzuron (mg/kg)
Reference
Trial, Country, year (Variety)
Rare (g ai/ha) Water (L/ha)
No days
GAP for pineapples in Brazil
240 100-800 1 7
G100459 Itápolis (SP), Brazil, 2010/2011 (Hawaí)
300 1000 3 0 7 15 21
fruit 0.22 0.21 0.36 0.23
Freitas Guimarães, Chanes 2012; Report No. 375387 BASF DocID 2012/3005488
G100464 Tabatinga (SP), Brazil, 2010/2011 (Hawaí)
300 1000 3 0 7 15 21
fruit 0.32 0.27 0.26 0.24
G100465 Itaberaba (BA), Brazil, 2011 (Pérola)
300 1000 3 7 15
fruit 0.30 0.14
G100466 Vazante (BA), Brazil, 2011 (Pérola)
300 1000 3 7 15
fruit 0.48 0.35
G120115 Cambará (PR), Brazil, 2012 (Smooth Cayenne)
300 1000 3 0 7 15 15 15 21
whole fruit whole fruit peel pulp whole fruit whole fruit
0.04 0.04 0.08 < 0.01 0.05 0.07
Freitas Guimarães, Marinho de Menezes Góes 2013; Report No. 427472 BASF DocID 2013/3000383
G120116 Tabatinga (SP), Brazil, 2012 (Hawaí)
300 1000 3 0 7 15 15 15 21
whole fruit whole fruit peel pulp whole fruit whole fruit
0.21 0.24 0.94 0.01 0.35 0.20

Teflubenzuron
2341
Pineapples Application DALA Commodity Teflubenzuron (mg/kg)
Reference
Trial, Country, year (Variety)
Rare (g ai/ha) Water (L/ha)
No days
G120117 Japira (PR), Brazil, 2012 (Smooth Cayenne)
300 1000 3 7 15 15 15
whole fruit peel pulp whole fruit
0.34 1.11 < 0.01 0.23
G120118 Itaberaba (BA), Brazil, 2012 (Pérola)
300 1000 3 7 15 15 15
whole fruit peel pulp whole fruit
0.24 0.56 0.01 0.23
Brassica
Broccoli Brassica oleracea var. italic)
Eight field trials (two decline and six end-point) were conducted on broccoli with teflubenzuron 150 SC formulation in Guatemala, Honduras and Costa Rica during the 2010 growing season (Mickelson K.R., 2012a, 2011/7005231). The treated plots received 2 applications at rate of 37.5 g ai/ha with 7 days application interval. The last application was performed 14 days before normal commercial harvest. Broccoli samples were collected at 0, 7, 14, 17 and 21 days for the decline trials and at 14 days for at end-point trials. Samples were analysed with LC-MS/MS method (SOP-PA.0250). The LOQ of the method was 0.01 mg/kg. Procedural recoveries at fortification levels of 0.01 mg/kg and 1.0 mg/kg for peel, pulp and whole fruit were in the range of 86% to 128%. Samples were stored for up to 278 days prior to analysis. The residue results are summarized in Table 62.
Table 62 Teflubenzuron (150 SC) residues in broccoli resulting from supervised trials in Guatemala, Honduras and Costa Rica in 2010
Broccoli Application DALA Commodity Teflubenzuron (mg/kg)
Reference
Trial, Country, year (Variety)
g ai/ha Water (L/ha) No days
GAP for broccoli in Brazil
37.5 400-1000 3 14
R100137 Patzicia, Chimaltenango, Guatemala, 2010 (Avenger)
39.0/ 37.6 208/201 2 0 7 14 17 21
inflorescence 0.16 0.09 0.07 0.08 0.03
Mickelson. 2012; Report No. 380458 DocID 2011/7005231
R100139 La Esperanza, Honduras, 2010 (Domador)
37.5 200 2 14 inflorescence < 0.01
R100140 La Esperanza, Honduras, 2010 (Avenger)
37.5 200 2 0 7 14 17 21
inflorescence 0.17 0.06 < 0.01 0.04 0.01
R100141 La Esperanza, Honduras, 2010 (Avenger)
37.5 200 2 14 inflorescence < 0.01
R100279 La Hortensias, Honduras, 2010 (Marathon)
37.6/ 37.5 200 2 14 inflorescence 0.08

Teflubenzuron
2342
Broccoli Application DALA Commodity Teflubenzuron (mg/kg)
Reference
Trial, Country, year (Variety)
g ai/ha Water (L/ha) No days
R100280 La Drazno, Honduras, 2010 (Avenger)
37.8/ 37.6 201/201 2 14 inflorescence 0.05
R100142 Llano Grande, Costa Rica, 2010 (Marathon)
36.8/ 37.8 196/202 2 14 inflorescence < 0.01
R100143 Paso Ancho, Pacayas, Costa Rica, 2010 (Legacy)
37.4/ 37.6 199/200 2 14 inflorescence < 0.01
Cauliflower
Eight residue trials (two decline and six end-point) were conducted on cauliflower with teflubenzuron 150 SC formulation in Guatemala, Costa Rica and Honduras during the 2010 growing season (Mickelson K.R., 2012b, 2011/7005230). The treated plots received 3 applications at rate of 22.5 g ai/ha with 6-8 days application interval. The last application was made 21 days before commercial harvest. Cauliflower samples were collected at 0/7, 14, 21, 25 and 30 days for the decline trials and at 20/21 days for at end-point trials. Samples were analysed with LC-MS/MS method (SOP-PA.0250). The LOQ of the method was 0.01 mg/kg. Procedural recoveries at fortification levels of 0.01 mg/kg and 1.0 mg/kg for peel, pulp and whole fruit were in the range of 84% to 139%. Samples were stored for up to 242 days prior to analysis. The residue results are summarized in Table 63.
Table 63 Teflubenzuron (150 SC) residues in cauliflower resulting from supervised trials in Guatemala, Honduras and Costa Rica in 2010
Cauliflower Application DALA Commodity Teflubenzuron (mg/kg)
Reference
Trial, Country, year (Variety)
Rate (g ai/ha)
Water (L/ha)
No days
GAP for cuciferae in Central America
22.5 Min 200 n/s 21
R100023a San Andres, Guatemala, 2010 (Sky Walker)
22.5-23.1 200-205 3 21 inflorescence < 0.01 Mickelson. 2012; Report No. 380459 DocID 2011/7005230 R100024a
San Andres, Guatemala, 2010 (Sky Walker)
22.1-22.8 196-203 3 7 14 21 25 30
inflorescence < 0.01 < 0.01 < 0.01 < 0.01 < 0.01
R100025 Patzicia, Guatemala, 2010 (Alpine)
22.6-25.7 200-228 3 21 inflorescence < 0.01
R100026 Llano Grande, Costa Rica, 2010 (Incline)
22.4-22.6 199-201 3 21 inflorescence < 0.01
R100027 San Gerardo, Costa Rica, 2010 (Incline)
22.5 200 3 21 inflorescence < 0.01
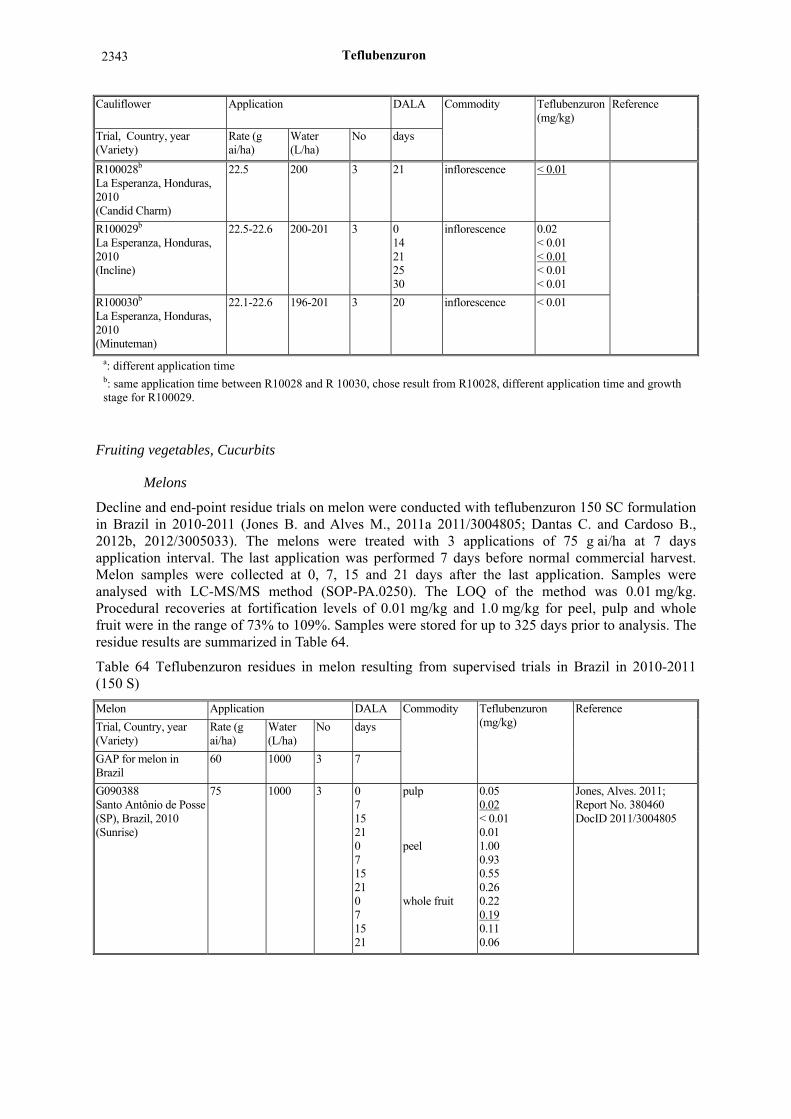
Teflubenzuron
2343
Cauliflower Application DALA Commodity Teflubenzuron (mg/kg)
Reference
Trial, Country, year (Variety)
Rate (g ai/ha)
Water (L/ha)
No days
R100028b La Esperanza, Honduras, 2010 (Candid Charm)
22.5 200 3 21 inflorescence < 0.01
R100029b La Esperanza, Honduras, 2010 (Incline)
22.5-22.6 200-201 3 0 14 21 25 30
inflorescence 0.02 < 0.01 < 0.01 < 0.01 < 0.01
R100030b
La Esperanza, Honduras, 2010 (Minuteman)
22.1-22.6 196-201 3 20 inflorescence < 0.01
a: different application time b: same application time between R10028 and R 10030, chose result from R10028, different application time and growth stage for R100029.
Fruiting vegetables, Cucurbits
Melons
Decline and end-point residue trials on melon were conducted with teflubenzuron 150 SC formulation in Brazil in 2010-2011 (Jones B. and Alves M., 2011a 2011/3004805; Dantas C. and Cardoso B., 2012b, 2012/3005033). The melons were treated with 3 applications of 75 g ai/ha at 7 days application interval. The last application was performed 7 days before normal commercial harvest. Melon samples were collected at 0, 7, 15 and 21 days after the last application. Samples were analysed with LC-MS/MS method (SOP-PA.0250). The LOQ of the method was 0.01 mg/kg. Procedural recoveries at fortification levels of 0.01 mg/kg and 1.0 mg/kg for peel, pulp and whole fruit were in the range of 73% to 109%. Samples were stored for up to 325 days prior to analysis. The residue results are summarized in Table 64.
Table 64 Teflubenzuron residues in melon resulting from supervised trials in Brazil in 2010-2011 (150 S)
Melon Application DALA Commodity Teflubenzuron (mg/kg)
Reference
Trial, Country, year (Variety)
Rate (g ai/ha)
Water (L/ha)
No days
GAP for melon in Brazil
60 1000 3 7
G090388 Santo Antônio de Posse (SP), Brazil, 2010 (Sunrise)
75 1000 3 0 7 15 21 0 7 15 21 0 7 15 21
pulp peel whole fruit
0.05 0.02 < 0.01 0.01 1.00 0.93 0.55 0.26 0.22 0.19 0.11 0.06
Jones, Alves. 2011; Report No. 380460 DocID 2011/3004805

Teflubenzuron
2344
Melon Application DALA Commodity Teflubenzuron (mg/kg)
Reference
Trial, Country, year (Variety)
Rate (g ai/ha)
Water (L/ha)
No days
G090389 Mossoro (RN), Brazil, 2010 (Goldex)
75 1000 3 7 15 7 15 7 15
pulp peel whole fruit
< 0.01 < 0.01 0.17 0.06 0.04 0.02
G090440 Senador Canedo (GO), Brazil, 2010 (Melody)
75 1000 3 7 15 7 15 7 15
pulp peel whole fruit
0.02 0.01 0.44 0.70 0.06 0.07
G090456 Ibiporã (PR), Brazil, 2010 (Louis)
75 1000 3 0 7 15 21 0 7 15 21 0 7 15 21
pulp peel whole fruit
0.02 < 0.01 0.01 < 0.01 0.71 0.15 0.22 0.16 0.19 0.04 0.06 0.04
G100168 Londrina (PR), Brazil, 2010/2011 (Louvis)
75 1000 3 0 7 14 21
whole fruit 0.05 0.07 0.09 0.05
Dantas, Cardoso, 2012; Report No. 374918 BASF DocID 2012/3005033
G100682 Ibiporá (PR), Brazil, 2010/2011 (Sunrise)
75 1000 3 0 7 14 21
whole fruit 0.01 0.08 0.11 0.08
G100169 Artur Nogueira (SP), Brazil, 2010 (Sunrise)
75 1000 3 7 15
whole fruit 0.05 0.03
G100170 Assai (PR), Brazil, 2011 (Louvis)
75 1000 3 7 15
whole fruit 0.08 0.09
Cucumbers
Decline and end-point residue trials on cucumber were conducted with teflubenzuron 150 SC formulation under greenhouse conditions in the Netherlands in 2000 (Oostingh C., 2001a, 2001/5003686), France and Greece in 2009 (Perny A., 2010a, 2010/1055083). The cucumbers were treated with 2 applications of 225-270 g ai/ha at 7 (±1) days application interval. The last application was performed 3 days before harvest. Cucumber fruits were collected at 0, 3 and 7± 1 days after the last application. Samples from trials in Netherland were analysed with HPLC-UV method (MEREFLUFE - rev. 01 of 19 September 2001). The LOQ of the method was 0.05 mg/kg. Procedural recoveries at fortification levels of 0.05 mg/kg and 0.5 mg/kg were in the range of 74% to 98%. Samples were stored for 333 – 463 days prior to analysis. Samples from trials in France and Greece were analysed with HPLC-MS/MS method (Anadiag method A9185). The LOQ of the method was 0.05 mg/kg. Procedural recoveries at fortification levels of 0.01, 0.1 mg/kg and 1.0 mg/kg were in the range of 71% to 108%. Samples were stored for 148–194 days prior to analysis. The residue results are summarized in Table 65.

Teflubenzuron
2345
Table 65 Teflubenzuron residues in greenhouse cucumber resulting from supervised trials in Netherlands in 2000, France and Greece in 2009 (150 SC)
Cucumber Application DALA Commodity Teflubenzuron (mg/kg)
Reference
Trial, Country, year (Variety) Rate (g ai/ha)
Water (L/ha)
No days
GAP for cucumber in The Netherlands
225 500-1500 3 3
00-N05-01 2671 LM Naaldwijk The Netherlands, 2010 (Hurona)
274 NR 2 3 whole fruit 0.12 Oostingh C., 2001a; Report No. CYN 2000-N05 BASF DocID 2001/5003686 00-N05-02*
2665 MJ Bleiswijk The Netherlands, 2010 (Accolade)
267 274
1800 2 3 whole fruit 0.05
00-N05-03** 2636 BC Schipluiden The Netherlands, 2010 (Fjord)
284 270
1800 2 3 whole fruit 0.10
00-N05-04* 2665 KV Bleiswijk The Netherlands, 2010 (Euphoria)
269 270
1800 2 3 whole fruit 0.10
00-N05-05** 2636 BC Schipluiden The Netherlands, 2010 (Accolada)
274 282
1800 2 3 whole fruit 0.16
A9182 AN1 67203 Oberschaeffolsheim Northern France (Loustic)
225 1000 3 3 whole fruit 0.06 Perny A., 2010a Report No. R A9182 BASF DocID 2010/1055083 A9182 TL1
31620 Fronton Southern France(Loustic)
225 1000 3 0 1 3 7
whole fruit 0.52 0.46 0.33 0.24
A9182 GR1 59100 Agia Marina Greece (Skoteinos)
225 1000 3 0 1 3 8
whole fruit 0.20 0.24 0.05 0.04
* and **: different application times
Gherkin
Four decline trials on gherkins were conducted with teflubenzuron 150 SC formulation under greenhouse conditions in Poland, Spain and France in 2009 (Perny A., 2010b, 2010/1044755). The treated plots received 3 applications at rate of 225 g ai/ha with 7 (±1) days application interval. The last application was performed 3 days before harvest. Gherkin samples were collected at 0, 1, 3 and 7±1 days after application. Samples were analysed with HPLC-MS/MS method (Anadiag method A9185). The LOQ of the method was 0.01 mg/kg. Procedural recoveries at fortification levels of 0.01, 0.1 mg/kg and 1.0 mg/kg were in the range of 77% to 104%. Samples were stored for 92–203 days prior to analysis. The residue results are summarized in Table 66.

Teflubenzuron
2346
Table 66 Teflubenzuron (150 SC) residues in greenhouse gherkin resulting from supervised trials in Poland, Spain and France in 2009
Gherkin Application DALA Commodity Teflubenzuron (mg/kg)
Reference
Trial, Country, year (Variety)
Rate (g ai/ha)
Water (L/ha)
No days
GAP for gherkin in The Netherlands
225 1500 3 3
A9183 PL1 99120 Piatik, Poland (Lazuryt)
225 1000 3 0 1 3 6
whole fruit 0.28 0.46 0.20 0.23
Perny A., 2010b Report No. R A9183 BASF DocID 2010/1044755 A9183 PL2
99120 Piatik, Poland (Lazuryt)
225 1000 3 0 1 3 6
whole fruit 0.39 0.18 0.08 0.05
A9183 ES1 04700 El Ejido, Spain (Ubeda)
225 1000 3 0 1 3 8
whole fruit 0.76 0.51 0.55 0.26
A9183 DR1 47120 Duras, Southern France (Petit Vert de Paris)
225 1000 3 0 1 3 7
whole fruit 0.29 0.34 0.42 0.16
Fruiting vegetables, other than cucurbits
Tomato
Decline and end-point residue trials were conducted with teflubenzuron 150 SC formulation on field tomatoes in Chile in 1996 (Steling C., 1998 a, 1998/1007441), in Brazil in 2001 (Dantas C., 2001 a, 2001/1028276), and in the Netherlands in 2003 (Enriquez M., 2003c, 2003/1018192). The tomatoes were treated with 11 applications of 12 and 15 or 3 applications of 37.5/225 g ai/ha at the growth stage BBCH 87–89 at 7/14 days application interval. The last application was performed 3 days before harvest. Tomato samples were collected at 0, 1, 3, 7, 14 and 28 days after the last application. Samples from trials in Chile and Brazil were analysed with HPLC-UV method (LAADL R0004.01, or RU 134/32/10-95 and). The LOQ of the method was 0.05 mg/kg. Procedural recoveries at fortification levels of 0.05 and 0.5 were in the range of 75–94%. Samples were stored for up to a maximum of 574 days prior to analysis. Sampls from trials in Netherland were analysed with HPLC method with UV detection at 254 nm (RLA 12483.00V). The LOQ was 0.01 mg/kg. The average recovery from fortified samples of tomato was 93%. The residue results are summarized in Table 67.
Table 67 Teflubenzuron residues in Tomato under field condition in Chile in 1996, Brazil in 2001 and Netherland in 2003 (150SC)
Tomato Application DALA Commodity Teflubenzuron (mg/kg)
Reference
Trial, Country, year (Variety)
Rate (g ai/ha)
Water (L/ha)
No days
GAP for tomato in the Netherlands
37.5-225 500-1500 3 3
Quillota Chile, 1996 (RJ-146-42) /F4 144
12 - 11 1 3 7 14
whole fruit 0.142 0.122 0.174 0.092
Steling, 1998a BASF DocID 1998/1007441
Quillota Chile, 1996 (RJ-146-42) /F4 144
15 - 11 1 3 7 14
whole fruit 0.139 0.178 0.191 0.091

Teflubenzuron
2347
Tomato Application DALA Commodity Teflubenzuron (mg/kg)
Reference
Trial, Country, year (Variety)
Rate (g ai/ha)
Water (L/ha)
No days
São Paulo Brazil, 2001 (0499 RJ 184 26)
37.5 - 3 0 7 14 28
whole fruit 0.05 0.05 0.08 0.05
Dantas, 2001a BASF DocID 2001/1028276
FA-49-03-27/01 Koningslust, The Netherlands, 2003 (Cedrico)
225 - 3 3 whole fruit 0.49 Enriquez, 2003a; BASF DocID 2003/1018192
FA-49-03-27/02 Meijel, Netherlands, 2003 (Cedrico)
225 - 3 3 whole fruit 0.32
The decline and magnitude of residue trials on tomatoes were conducted with teflubenzuron 150 SC formulation under glasshouse conditions in the Netherlands in 2000 (Oostingh C., 2001 d, 2001/5003684), in Italy in 2002 (Bass R.V., 2003 c, 2003/1011759), in Spain in 2002 (Bass R.V., 2003 d, 2003/1011760). Three foliar applications at growth stages BBCH 85-89 were made at a rate of 225-270 g ai/ha at 7 day intervals. The last application was 3 days before normal harvest. Samples of whole fruits were taken at 3 days after the last treatment at harvest. Samples from trials in Netherland were analysed using HPLC-DAD (diode array detection) method Number MEREFLUFE-rev 1 of September 19, 2001. The LOQ was 0.05 mg/kg. Procedural recoveries at fortification levels of 0.05 mg/kg and 0.5 mg/kg were in the range of 78% to 131%. Samples were stored for a maximum of 465 days prior to analysis. Samples from trials in Italy and Spain were analysed with HPLC-UV (method BASF/RE 201777/2000, with LOQ of 0.01 mg/kg and procedural recoveries of 92.5-96.5%).Samples were stored for a maximum of 219 days prior to analysis. The residue results are summarized in Table 68.
Table 68 Teflubenzuron residues in glasshouse tomatoes resulting from supervised trials Netherlands in 2000, in Spain and Italy in 2002 (150SC)
Tomato Application DALA Commodity Teflubenzuron (mg/kg)
Reference
Trial, Country, year (Variety) Rate (g ai/ha) Water (L/ha)
No days
GAP for tomato in the Netherlands
37.5-225 500-1500 3 3
00-N04-01 Berkel en Rodenrijs, The Netherlands, 1999/2000, (Rapsody)
270 1800 3 3 whole fruit 0.35 Oostingh., 2001b; 2001/5003684 Pigeon, 2001b; Report No. 20177BASF DocID 2001/5003681
00-N04-02 Berkel en Rodenrijs, The Netherlands, 1999/2000, (Spranko)
270 1800 3 3 whole fruit 0.33
00-N04-03 Pijnacker, The Netherlands, 1999/2000, (Voyager)
270 1800 3 3 whole fruit 0.36
FA-49-02-67/01 Casona Pizzo, 20060, Mediglia, Italy, 2002, (Marmande)
225 1533 3 0 1 3 5
whole fruit 0.11 0.10 0.07 0.05
Bass, 2003c; Report No. FA-49-02-67 BASF DocID 2003/1011759 FA-49-02-67/02
Regione Arroscia, 17031, Albenga, Italy, 2002, (Cuore Di Bue
225 1462 3 3 whole fruit 0.07

Teflubenzuron
2348
Tomato Application DALA Commodity Teflubenzuron (mg/kg)
Reference
Trial, Country, year (Variety) Rate (g ai/ha) Water (L/ha)
No days
FA-49-02-66/01 Dos Hemanas, 41700 Sevilla, Spain, 2002, (Bond)
225 1020 3 0 1 3 5
whole fruit 0.13 0.10 0.09 0.05
Bass, 2003b; Report No. FA-49-02-6 BASF DocID 2003/1011760 FA-49-02-66/02
Los Palacios 41720, Sevilla Spain, 2002, (Estoril)
225 1050 3 3 whole fruit 0.07
Cherry tomato
Two end-point and two decline residue trials on cherry tomatoes were conducted with teflubenzuron 150 SC formulation under greenhouse conditions in France, Spain and Italy in 2009 (Perny A., 2010e, 2010/1055084). The treated plots received three applications at rate of 225 g ai/ha with 7 (±1) days interval. The last application was performed 3 days before maturity of the crop (harvest). Samples of cherry tomato fruits were collected 3 days after the application for end-point trials and 0, 1, 3 and 7 days after application for decline trials. Samples were analysed by HPLC-MS/MS method (Anadiag method A9185). The limit of quantitation was 0.01 mg/kg. Procedural recoveries at fortification levels of 0.01 mg/kg, 0.10 mg/kg and 1.0 mg/kg gave recoveries in the range of 72.5% to 109.9%. Samples were stored for 102–217 days prior to analysis. The residue results are summarized in Table 69.
Table 69 Teflubenzuron (150SC) residues in cherry tomato resulting from supervised trials in France, Spain and Italy
Cherry Tomato Application DALA Commodity Teflubenzuron (mg/kg)
Reference
Trial, Country, year (Variety)
Rate (g ai/ha)
Water (L/ha)
No days
Netherlands GAP for tomato 225 1500 3 3
A9184 AN1 67203 Oberschaeffolsheim Northern France (Pepe)
225 1000 3 3 whole fruit 0.42 Perny A., 2010c Report No. R A9184 BASF DocID 2010/1055084 A9184 DR1
47120 Duras Southern France (Sweet)
225 1000 3 0 1 3 7
whole fruit 0.44 0.51 0.26 0.25
A9184 ES1 18612 Itrabo Spain (Catalina)
225 1000 3 3 whole fruit 0.88
Sweet peppers
Four end-point residue trials on sweet pepper were conducted with teflubenzuron 150SC formulation under greenhouse conditions in the Netherlands in 2000 (Oostingh C., 2001e, 2001/5003685, Pigeon O., 2001e, 2001/5003683). The treated plots received 3 applications at the rate between 266.89 g ai/ha and 283.78 g ai/ha with an interval of 7 days between each application. The last application was performed 3 days before harvest of the crop. Sweet pepper samples were collected 3 days after the application. Samples were analysed with HPLC-DAD (method RLA 12483.00 V). The LOQ was 0.05 mg/kg. Procedural recoveries at fortification levels of 0.05 mg/kg and 0.50 mg/kg gave recoveries in the range of 82% to 105%. Samples were stored for 392–458 days prior to analysis. The residue results are summarized in Table 70.

Teflubenzuron
2349
Table 70 Teflubenzuron (150 SC) residues in sweet pepper resulting from supervised trials in The Netherlands in 2000
Pepper Application DALA Commodity Teflubenzuron (mg/kg)
Reference
Trial, Country, year (Variety)
g ai/ha Water (L/ha)
No days
GAP for pepper in The Netherlands
225 1500 3 3
00-N06-01 2678 LV de Lier The Netherlands (Spirit)
270 1800 3 3 whole fruit 0.61 Pigeon O., 2001c; Report No. CYN 2000-N06 BASF DocID 2001/5003685 00-N06-02*
2665 LA Bleiswijk The Netherlands (Spirit)
270 1800 3 3 whole fruit 0.41
00-N06-03 2661 GP Bergschenhoek The Netherlands (Fiesta)
270 1800 3 3 whole fruit 0.46
00-N06-04* 2665 LJ Bleiswijk The Netherlands (Fiesta)
270 1800 3 3 whole fruit 0.46
*: not independent tials, higher residue was considered only.
Pulses
Decline and end-point residue trials on soya bean were conducted with teflubenzuron 150 SC formulation in 1984/1985( Eichler D. 1985c, TZ-720-001; 1985d, TZ-720-002 ), 1989 (Weitzel R., 1991e, TZ-720-004), 2009/2010(Jones B.,Cardoso B., 2011b, 2012/3003361), in 2010/2011(Jones B.,Alves M., 2012b,2012/3003364), 2009-2012 (Guimaraes S.F., 2013 b, 2013/3000941) in Brazil, and in 2010/2011 in Argentina (Carringer S.J., 2012c, 2012/7000229).
The soya beans were treated with 3 applications of 30–90 g ai/ha at 9–12 days interval. The last application was performed 21–28 days before normal harvest. Samples were collected 0, 6 (7), 14, 21 and 27/28, 30 or 53 days after the last application. Samples from trial in 1980s were analysed with HPLC with UV detection (method RU 134/32/10-95), the limit of quantification was 0.05 mg/kg. The recoveries were 104%, 81% and 76% at fortification levels of 0.05, 0.20 and 1.0 mg/kg. Samples were stored for up to 607 days prior to analysis. Samples from trials in 2009-2012 were analysed with HPLC-MS/MS method (SOP-PA.0250). The LOQ was 0.01 mg/kg. Procedural recoveries at fortification levels of 0.01 mg/kg and 1.0 mg/kg gave recoveries in the range of 73% to 130%. Samples were stored for up to 350 days prior to analysis. The residue results are summarized in Table71.
Table 71 Teflubenzuron residues in soya resulting from supervised trials in Argentina and Brazil (150 SC)
Soya Application DALA Commodity Teflubenzuron (mg/kg)
Reference
Trial, Country, year (Variety)
Rate (g ai/ha)
Water (L/ha)
No days
GAP for soya in Central America
34 200 n/s 21
G090404 Senador Canedo (GO), Brazil, 2009/2010, (M SOY RR 7908)
34 150 3 0 7 14 21 28
beans < 0.01 < 0.01 < 0.01 < 0.01 < 0.01
Jones, Cardoso. 2011; Report No. 376627 DocID 2011/3003361

Teflubenzuron
2350
Soya Application DALA Commodity Teflubenzuron (mg/kg)
Reference
Trial, Country, year (Variety)
Rate (g ai/ha)
Water (L/ha)
No days
G090403 Santo Antônio de Posse (SP), Brazil, 2009/2010 (CD 219 RR)
34 150 3 0 6 14 21 28
beans 0.15 0.08 0.05 0.03 < 0.01
G100624 Senador Canedo (GO), Brazil, 2010/2011 (BRSGO 7560)
34 150 3 0 7 14 21 28
beans 0.03 0.01 0.01 < 0.01 < 0.01
Jones, Alves. 2012; Report No. 376627_1 DocID 2011/3003364
G100625 Anápolis (GO), Brazil, 2010/2011, (BRSGO 7560)
34 150 3 21 beans < 0.01
G100703 Ponta Grossa (PR), Brazil, 2010/2011 (Inox)
34 150 3 0 7 14 21 28
beans 0.05 0.04 0.03 0.02 0.01
R100251 Gahan, Buenos Aires, Argentina, 2011 (DM 4670)
34 150 3 21 beans 0.01 Carringer, 2012; Report No. 376630 BASF DocID 2012/7000229 R100252
Tacuari, Buenos Aires, Argentina, 2011 (Pioneer 94M40)
34 150 3 21 beans 0.02
R100253 Ines Indart, Buenos Aires, Argentina, 2011 (DM 3700)
34 150 3 21 beans 0.01
G120110 Santo Antônio de Posse (SP), Brazil, 2011/2012 (CD 229 RR)
34 150 3 0 7 14 21 21 27
beans beans beans beans AGF beans
0.03 < 0.01 < 0.01 < 0.01 1.93 < 0.01
Freitas Guimarães 2013; Report No. 427475 BASF DocID 2013/3000941
G120111 Ibipora (PR), Brazil, 2009/2010 (CD 219 RR)
34 150 3 0 7 14 21 21 28
beans beans beans beans AGF beans
0.02 0.03 0.02 0.01 1.39 0.01
T2-A60304-001 Cosmopolis (SP), Brazil, 1984/1985 (Santa Rosa)
30 250 1 53 53
seed hull
< 0.05 0.17
Eichler D 1985; BASF DocID TZ-720-001
T2-A60304-002 Cosmopolis (SP), Brazil, 1984/1985 (Santa Rosa)
90 250 1 53 53
seed hull
< 0.05 0.29
Eichler D 1985; BASF DocID TZ-720-002
I/RES/SO/01B/88 Londrina (PR), Brazil, 1989 (Davis)
15 250 2 21 30
Green pods Green pods
< 0.05 < 0.05
Weitzel R., 1991; Report No. TZ-720-004 BASF DocID 2001/5003686
30 250 2 21 30
Green pods Green pods
< 0.05 < 0.05
I/RES/SO/02B/88 Passo Fundo (RS), Brazil, 1989 (Planalto and BR 12)
15 100 2 21 30
Green pods Green pods
< 0.05 < 0.05
30 100 2 21 30
Green pods Green pods
< 0.05 < 0.05

Teflubenzuron
2351
Cereals grains
Maize (Zea mays)
Decline and end-point residue trials on maize were conducted with teflubenzuron 150 SC formulation in Brazil in(Steling C.1998e, 1998/1007438; Steling C., 1998f, 1998/1007437) in (Borges Z., 2004b, 2004/1038254), 2007/2008 (Dantas C.,Souza C., 2008d, 2011/3004486), 2008/2009 (Jones B.,Marinho E., 2011b, 2011/1140705), and in USA (Carringer S.J., 2012d, 2012/7003484). The maize was treated with 2–4 applications at rates of 22.5/45, or 115, or 75/150 g ai/ha at 7 days interval. The maize was sampled at 0, 3, 7, 15, 21, 30, 45 and 60 days after the final treatment. In trials 1998/1007438 and 1998/1007437, Samples were analysed with HPLC-UV (method LAADL R0004.01). The LOQ was 0.1 mg/kg for corn. The procedural recovery at fortification level of 0.1 mg/kg was 81–100%. Samples were stored for up to a maximum of 433 days prior to analysis. In trials of Borges, samples were analysed with HPLC-MS/MS method (SOP-PA. 0250). The LOQ was 0.01/0.05 mg/kg and the limit of detection was 0.01 mg/kg for corn. The procedural recovery at fortification levels of 0.05 and 5.0 mg/kg were of 89%. Samples were stored for up to a maximum of 433 days prior to analysis. In trials of 2011/3004486, 2011/1140705 and 2012/7003484, Maize grain samples obtained from exaggerated application were further processed to grits, meal, flour, starch and refined oil.Samples were analysed with HPLC-MS/MS method (SOP-PA.0250). The LOQ was 0.01 mg/kg. The procedural recoveries at fortification levels of 0.01 mg/kg and 1.0 mg/kg were in the range of 80% to 138%. Samples were stored for 164–444 days prior to analysis. The residue results are summarized in Table72.
Table 72: Teflubenzuron residues in maize resulting from supervised trials in Brazil and USA (150 SC)
Maize Application DALA Commodity Teflubenzuron (mg/kg)
Reference
Trial, Country, year (Variety)
Rate (g ai/ha) Water (L/ha)
No days
GAP for maize in Brazil, Bolivia
22.5 - 2 45
BR-326-97-77 B1 Passo Fundo Brazil (Braskalb)
75 260 2 45 grain 0.1 Steling C., 1998b; Report No. RES 0098-98 BASF DocID 1998/1007438
BR-326-97-77 B1 Passo Fundo Brazil (Braskalb)
150 260 2 45 grain 0.1
BR-326-97-77 I1 Campo Grande Brazil (BR 201)
75 400 2 43 grain 0.1 Steling C., 1998c Report No. RES 0097-98BASF DocID 1998/1007437
BR-326-97-77 I1 Campo Grande Brazil (BR 201)
150 400 2 43 grain 0.1
CD/I/2003/801/BRV Iraí de Minas Brazil (C333B MONSANTO)
22.5 2 0 15 30 45 60
grain Grain Grain Grain Grain
0.01 0.01 0.01 0.01 0.01
Borges Z., 2004a Report No. RFR-AR-723-03 BASF DocID 2004/1038254
R/I/2003/802/ BRV Iraí de Minas Brazil (C333B MONSANTO)
22.5 1 45 Grain 0.01
45 1 45 Grain 0.01
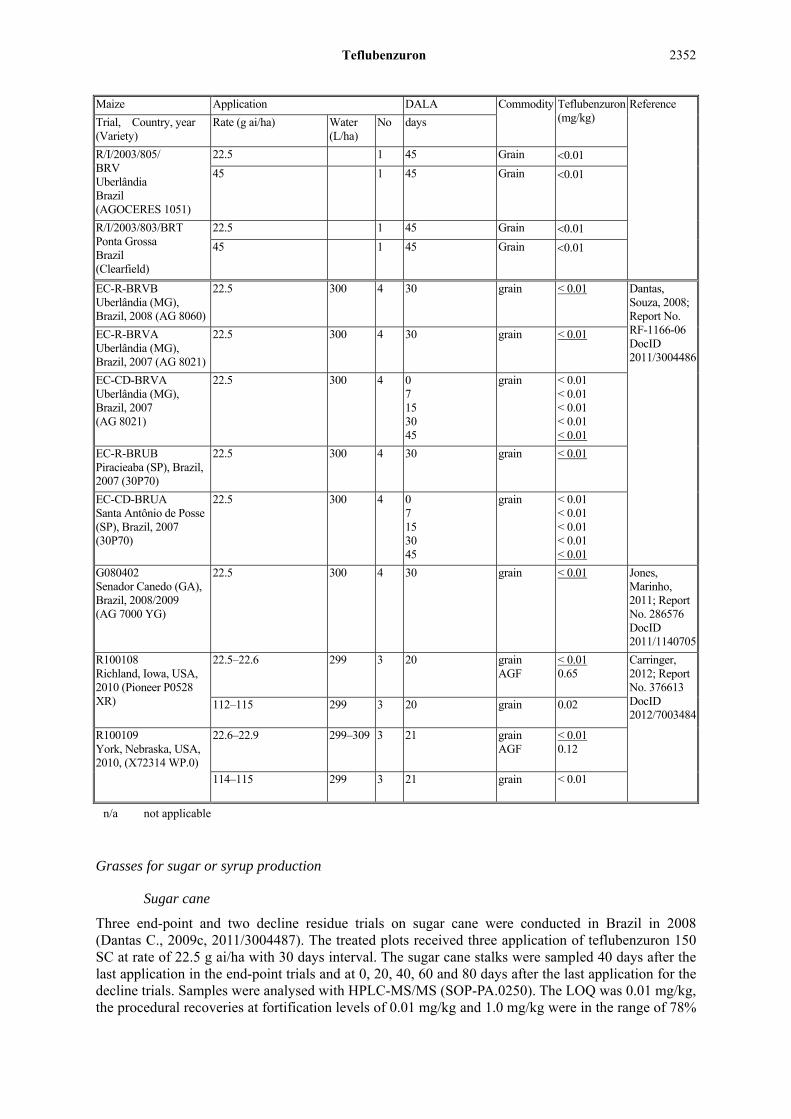
Teflubenzuron
2352
Maize Application DALA Commodity Teflubenzuron (mg/kg)
Reference
Trial, Country, year (Variety)
Rate (g ai/ha) Water (L/ha)
No days
R/I/2003/805/ BRV Uberlândia Brazil (AGOCERES 1051)
22.5 1 45 Grain 0.01
45 1 45 Grain 0.01
R/I/2003/803/BRT Ponta Grossa Brazil (Clearfield)
22.5 1 45 Grain 0.01
45 1 45 Grain 0.01
EC-R-BRVB Uberlândia (MG), Brazil, 2008 (AG 8060)
22.5 300 4 30 grain < 0.01 Dantas, Souza, 2008; Report No. RF-1166-06 DocID 2011/3004486
EC-R-BRVA Uberlândia (MG), Brazil, 2007 (AG 8021)
22.5 300 4 30 grain < 0.01
EC-CD-BRVA Uberlândia (MG), Brazil, 2007 (AG 8021)
22.5 300 4 0 7 15 30 45
grain < 0.01 < 0.01 < 0.01 < 0.01 < 0.01
EC-R-BRUB Piracieaba (SP), Brazil, 2007 (30P70)
22.5 300 4 30 grain < 0.01
EC-CD-BRUA Santa Antônio de Posse (SP), Brazil, 2007 (30P70)
22.5 300 4 0 7 15 30 45
grain < 0.01 < 0.01 < 0.01 < 0.01 < 0.01
G080402 Senador Canedo (GA), Brazil, 2008/2009 (AG 7000 YG)
22.5 300 4 30 grain < 0.01 Jones, Marinho, 2011; Report No. 286576 DocID 2011/1140705
R100108 Richland, Iowa, USA, 2010 (Pioneer P0528 XR)
22.5–22.6 299 3 20 grain AGF
< 0.01 0.65
Carringer, 2012; Report No. 376613 DocID 2012/7003484
112–115 299 3 20 grain 0.02
R100109 York, Nebraska, USA, 2010, (X72314 WP.0)
22.6–22.9 299–309 3 21 grain AGF
< 0.01 0.12
114–115 299 3 21 grain < 0.01
n/a not applicable
Grasses for sugar or syrup production
Sugar cane
Three end-point and two decline residue trials on sugar cane were conducted in Brazil in 2008 (Dantas C., 2009c, 2011/3004487). The treated plots received three application of teflubenzuron 150 SC at rate of 22.5 g ai/ha with 30 days interval. The sugar cane stalks were sampled 40 days after the last application in the end-point trials and at 0, 20, 40, 60 and 80 days after the last application for the decline trials. Samples were analysed with HPLC-MS/MS (SOP-PA.0250). The LOQ was 0.01 mg/kg, the procedural recoveries at fortification levels of 0.01 mg/kg and 1.0 mg/kg were in the range of 78%

Teflubenzuron
2353
to 93%. Samples were stored for 175–360 days prior to analysis. The residue results are summarized in Table 73.
Table 73 Teflubenzuron 150 SC residues in sugar cane resulting from supervised trials in Brazil in 2008
Sugar Cane Application DALA Commodity Teflubenzuron (mg/kg)
Reference
Trial, Country, year (Variety) Rate (g ai/ha)
Water (L/ha)
No days
GAP for sugar cane in Brazil 22.5 150 2 40
G080173 Santo Antônio de Posse (SP), Brazil, 2008, (SP 801816)
22.5 20 3 0 20 40 60 80
stalks < 0.01 < 0.01 < 0.01 < 0.01 < 0.01
Dantas, 2009; Report No. RF-1289-07 DocID 2011/3004487
G080174 Senador Canedo (GO), Brazil, 2008 (IAC 86-2480)
22.5 20 3 40 stalks < 0.01
G080175 Piracicaba (SP), Brazil, 2008 (SP 801816)
22.5 20 3 40 stalks < 0.01
G080253* Uberlândia (MG), Brazil, 2008 (unknown)
22.5 20 3 0 20 40 60 80
stalks < 0.01 < 0.01 < 0.01 < 0.01 < 0.01
G080311* Uberlândia (MG), Brazil, 2008 (unknown)
22.5 20 3 40 stalks < 0.01
*: not independent trials, choose higher one.
Oilseeds
Sunflower seed
Two decline trials and two reduced decline trials were conducted on sunflower in Brazil in 2009/2010 (Porto F. and Marinho E., 2010b, 2012/3003363), and four trials in Uruguay and Argentina in 2010/2011 (Carringer S.J., 2012e, 2012/7003872). The treated plots received two applications of teflubenzuron 75 SC formulation (mixture with alpha cypermethrin) at a rate of 12.75 g with 14–15 days interval. The last application was performed 7 days before normal harvest. Samples were collected 0, 3, 7, 15 and 21 days after the last application for the decline trials and 7 and 15 days after the last application for the reduced decline trials and end-point trials. Samples were analysed with HPLC-MS/MS (SOP-PA.0250). The LOQ was 0.01 mg/kg. The procedural recoveries at fortification levels of 0.01 mg/kg and 1.0 mg/kg were in the range of 70% to 118%.Samples were stored for up to 366 days prior to analysis. The residue results are summarized in Table 74.
Table 74 Teflubenzuron 75SC residues in sunflower resulting from supervised trials in Brazil in 2010
Sunflower Application DALA Commodity Teflubenzuron Reference
Trial, Country, year (Variety)
Rate (g as/ha)
Water (L/ha)
No days mg/kg
GAP for sunflower in Brazil
11.25 200 2 7

Teflubenzuron
2354
Sunflower Application DALA Commodity Teflubenzuron Reference
Trial, Country, year (Variety)
Rate (g as/ha)
Water (L/ha)
No days mg/kg
G090210 Ponta Grossa (PR), Brazil, 2010 (Clear Field)
12.75 200 2 0 3 7 15 21
seeds 0.08 0.21 0.05 0.13 0.09
Porto, Marinho, 2010; Report No. 326303_1 DocID 2012/3003363
G090211 Senador Canedo (GO), Brazil, 2010 (AG 963)
12.75 200 2 0 3 7 15 21
seeds 0.02 0.02 < 0.01 < 0.01 < 0.01
G090212 Santo Antônio de Posse (SP), Brazil, 2010, (Helios 358)
12.75 200 2 7 15
seeds < 0.01 < 0.01
G090213 Londrina (PR), Brazil, 2010, (IAC–Uruguai)
12.75 200 2 7 15
seeds 0.08 0.06
R100228 San José, Uruguay, 2011, (Neo G-09 CL)
13.2 / 12.8 207 / 189 2 7 15
seeds 0.01 < 0.01
Carringer, 2012; Report No. 376786 DocID 2012/7003872
R100229 Montevideo, Uruguay, 2011, (Neo G-09 CL)
12.8 / 12.3 193 / 190 2 6 15
seeds < 0.01 < 0.01
R100230 Canelones, Uruguay, 2011, (Neo G-09 CL)
12.8 / 13.1 197 / 192 2 8 15
seeds < 0.01 < 0.01
R100254 Buenos Aires, Argentina, 2011, (Paraiso 103 CL)
12.9 / 12.8 199 / 196 2 7 14
seeds < 0.01 < 0.01
Seed for beverages and sweets (crop group 024)
Coffee beans
Decline and end-point residue trials were conducted on coffee in Brazil in 1997 (Steling C., 1998g, TZ-790-004), in 2007(Dantas C.,Souza C., 2008e, 2011/3004485), in 2008 (Dantas C.and Takahashi J., 2010b, 2012/3003365), in 2010 (Jones B.,Alves M., 2011c, 2012/3003683), in 2012 (Guimaraes S.F.,Almeida B.C. de, 2013b, 2013/3000826) and in Guatemala in 2011(Mickelson K.R., 2012d 2012/7004241). The coffee plants were treated with 2–4 application of teflubenzuron 150 SC at 37.5–187.5 g ai/ha with 30/31 days interval. Coffee bean samples were collected at 0, 5, 10, 15, 20 and 30 days after the last treatment for decline trials. Samples from trials of TZ-790-004 were analysed with HPLC-UV(LAADL R0004.01). The LOQ was 0.1 mg/kg. The procedural recovery at the method LOQ was 81%. Samples were stored for up to 327 days prior to analysis. Samples from other trials were analysed with HPLC-MS/MS (SOP-PA.0250). The LOQ was 0.01 mg/kg. The procedural recoveries at fortification levels of 0.01 mg/kg and 1.0 mg/kg were in the range of 78% to 126%.

Teflubenzuron
2355
Samples were stored for a maximum of 439 days prior to analysis. The residue results are summarized in Table 75.
Table 75 Teflubenzuron residues in coffee beans resulting from supervised trials in Brazil and Guatemala
Coffee Application DALA Commodity Teflubenzuron (mg/kg)
Reference
Trial, Country, year (Variety) Rate (g ai/ha)
Water (L/ha)
No days
GAP for coffee in Brazil 37.5 - 2 30
BRA 89 I 068 01 Iraí de Minas (MG), Brazil, 1997, Variety not reported
37.5 300 2 30 Fresh beans <0.1 Steling, 1998; Report No. Res. 0105-98 TZ-790-004
75 300 2 30 Fresh beans <0.1
EC-R-BRVB/1109-06 Araguari (MG), Brazil, 2007 (Catuaí)
37.5 400 2 15 Fresh beans < 0.01 Dantas, Souza, 2008; Report No. RF-1109-06DocID 2011/3004485
EC-R-BRVA/1109-06 Iraí de Minas (MG), Brazil, 2007, (Catuaí)
37.5 400 2 15 Fresh beans < 0.01
EC-CD-BRVA/1109-06 Araguari (MG), Brazil, 2007 (Catuaí)
37.5 400 2 0 5 10 15 20
Fresh fresh beans
< 0.01 < 0.01 < 0.01 < 0.01 < 0.01
EC-R-BRUB/1109-06 Muzambinho (SP), Brazil, 2007, (Catuaí)
37.5 400 2 15 Fresh beans < 0.01
EC-CD-BRUA/1109-06 Santo Antônio de Posse (SP), Brazil, 2007 (Catuaí)
37.5 400 2 0 5 10 15 20
Fresh beans < 0.01 < 0.01 < 0.01 < 0.01 < 0.01
G080149 Araguari (MG), Brazil, 2008 (Catuaí)
45 500 4 0 10 20 30 35
Fresh beans < 0.01 0.01 < 0.01 0.01 < 0.01
Dantas, Takahashi, 2010; Report No. RF-1408-07DocID 2012/3003365 G0801151
Santo, Antônio do, Jardim (SP), Brazil,2008, (Mundo Novo)
45 500 4 0 10 20 30 35
Fresh beans 0.02 < 0.01 0.06 0.03 0.03
G080225 Mogi Guaçu(SP), Brazil, 2008, (Obatá)
45 500 4 30 Fresh beans < 0.01
G080251 Conceição, dos Ouros, (MG), Brazil, 2007, (Acaiá)
45 500 4 30 Fresh beans 0.06
G090162 Cambé (PR), Brazil, 2010 (Mundo Novo)
75 400 2 0 10 20 30 35
Dry beans 0.28 0.43 0.27 0.26 0.29
Jones, Alves, 2011; Report No. 286570_1 BASF DocID 2012/3003683
G090163 Londrina (PR), Brazil, 2010 (Tupi)
75 400 2 0 10 20 30 35
Dry beans 1.08 0.24 0.17 0.20 0.29

Teflubenzuron
2356
Coffee Application DALA Commodity Teflubenzuron (mg/kg)
Reference
Trial, Country, year (Variety) Rate (g ai/ha)
Water (L/ha)
No days
G090164 Mogi Guaçu (SP), Brazil, 2010 (Obatã)
75 400 2 30 Dry beans 0.08
G090165 Araguari (MG), Brazil, 2010 (Catuaí)
75 400 2 30 Dry beans < 0.01
R100257* Santa Rosa, Guatemala, 2011 (Caturra)
37.8–38.9 202 - 207 2 30 Dry beans < 0.01 Mickelson , 2012; Report No. 376611 BASF DocID 2012/7004241
R100258* Santa Rosa, Guatemala, 2011 (Caturra)
37.6 200 - 201 2 30 Dry beans < 0.01
G110309 Araguari (MG), Brazil, 2012 (Catuai)
75 400 2 0 10 20 30 35
Dry beans 0.03 0.03 0.03 0.01 0.01
Freitas Guimarães, Cardoso de Almeida, 2013; Report No. 286552 BASF DocID 2013/3000826
G110310 Santo Antônio do Jardim (SP),Brazil, 2012 (Mundo Novo)
75 400 2 30 Dry beans 0.01
G110311 Cambé (PR), Brazil, 2012 (Catuai)
75 400 30 Dry beans < 0.01
*: not independent trials, choose higher one.
FATE OF RESIDUES IN STORAGE AND PROCESSING
Hydrolysis
Hydrolysis experiments were conducted by Ginzburg in 2006 (Ginzburg N., 2007a, 006/1037728). Three test solutions at half the saturation concentration of teflubenzuron, at approximately 5 mg/L in a mixture of acetonitrile-dioxan and aqueous buffer solutions were incubated at 90 C, pH 4 for 20 minutes to simulate pasteurisation. At the end of the incubation period, flasks were cooled and the pH measured. Acetonitrile was added and an aliquot of each solution analysed by HPLC with UV detection.
A further three test solutions, at half the saturation concentration of teflubenzuron at approximately 5 mg/L in a mixture of acetonitrile-dioxan and aqueous buffer solutions were incubated at 120 C, pH 6 for 25 minutes to simulate the sterilisation process. A portion of each solution was transferred to glass tubes and sealed with aluminium foil to be autoclaved. An additional glass tube was filled with buffer at pH 6 and placed alongside the sealed tubes, to be used for checking pH post autoclave and incubation. At the end of the incubation period, the test solutions were mixed with acetonitrile and aliquots injected onto the HPLC for analysis.
The residues of teflubenzuron are stable under hydrolysis conditions representing sterilisation and pasteurisation with the recovery of 88.7% and 94%, respectively, and remained as unchanged parent. Recovery of teflubenzuron in the solutions before and after incubation simulating pasteurisation and sterilisation are summarized below.

Teflubenzuron
2357
Table 76 Recovery of teflubenzuron in test solutions before and after pasteurisation (pH 4, 90 C)
Test Solutions Target Concentration (µg/mL)
Before pasteurisation After pasteurisation
Measured Concentration (µg/mL)
Recovery (%) Measured Concentration (µg/mL)
Recovery (%)
A 5.00 4.41 88.2 4.13 82.6 B 5.00 5.18 103.6 4.60 92.1 C 5.00 5.01 100.1 4.57 91.5 Mean 97.3 88.7 SD 8 5 RSD 8 6 n 3 3
Table 77 Recovery of teflubenzuron in test solutions before and after sterilisation (pH 6, 120 C)
Test Solutions Target Concentration (µg/mL)
Before pasteurisation After pasteurisation
Measured Concentration (µg/mL)
Recovery (%) Measured Concentration (µg/mL)
Recovery (%)
D 5.00 4.98 99.7 4.68 93.5 E 5.00 5.04 100.8 4.96 99.2 F 5.00 4.80 95.9 4.47 89.3 Mean 98.8 94.0 SD 3 5 RSD 3 5 n 3 3
Processing of oranges
Two end-point trials were conducted in the United States (NAFTA regions 3 and 10) in 2010 (Belcher T.I., Riley M., 2012a 2012/7004699) to determine the residues levels of teflubenzuron in Orange (RAC, Citrus sinensis, variety: Hamlin, Valencia) and processed fractions. Two applications by airblast were done with teflubenzuron 150 SC formulation at an exaggerated application rate of 187.5 g ai/ha. Samples were collected 15 days after application (PHI according to GAP). Processed fractions of fresh juice, orange oil and dried pulp were produced using simulated commercial processing procedures.
RAC oranges were batch-tub washed and transferred to the modified Hobart Abrasive Peeler for scarifying. Approximately 2.31 kg of washed oranges per batch were abraded to scarify the flavedo (peripheral surface) for oil production. The scarified fruit was weighed and retained for juice processing.
Orange oil
The collected flavedo and oil-water emulsion was passed through a 180 µm screen to separate the flavedo fragments from the oil-water emulsion. The scarified flavedo was retained for later addition to the shredded peel. The oil-water emulsion was processed through the cream separator and centrifuge to separate the oil. The free oil was removed and the volume was recorded. After a freezing/thawing cycle of residual emulsion additional oil was removed by centrifugation. Oil samples were combined and stored frozen until analysis.
Orange juice
An aliquot of the scarified orange fruit was transferred to the Hollymatic Juice Extractor to recover the juice from the peel. The collected juice was screened using a 1.19 mm screen to remove solids (vesicular membranes, seeds, segment membranes, peel fragments) from the juice. The collected

Teflubenzuron
2358
solids were set aside for later addition to the shredded peel. A representative aliquot of the fresh juice was stored frozen until analysis.
Dried pulp
The peel obtained from juice production was shredded and combined with the screened solids and the scarified flavedo obtained from the oil production to generate wet peel. Lime was added and the sample was mixed with a Hobart mixer. The pH was adjusted to > 8.0 using additional lime and water. The lime peel was pressed in a fruit press and the expressed liquid was discarded. The wet peel pulp was dried to below 10% moisture. The resulting dried pulp was milled and a representative sample of the dried pulp was stored frozen until analysis.
Samples were analysed according to BASF S.A–SOP-PA. 0250 with determination of residues of teflubenzuron in various cultures by LC/MS/MS”. Subsamples of RAC fruit, juice and dried pulp were extracted by homogenisation with acetone. The extract was centrifuged and an aliquot was diluted with water. Residues were partitioned into hexane and centrifugation. An aliquot of the hexane phase was evaporated to dryness and residues were re-dissolved in acetonitrile/methanol/water (50/10/40; v/v/v) for LC-MS/MS determination.
Modification of the analytical method for orange oil: Subsamples of orange oil were extracted with acetone. The extract was centrifuged and an aliquot was diluted with water. Residues were partitioned into hexane and centrifugation. An aliquot of the hexane phase was passed through a pre-conditioned silica gel cartridge. After elution with a hexane/acetone mixture, eluates were evaporated to dryness and residues were re-dissolved in acetonitrile/methanol/water (50/10/40; v/v/v) for LC-MS/MS determination.
Procedural recoveries for teflubenzuron at fortification levels of 0.01 and 1.0 mg/kg were 74–122%, 74–114% and 83–117% for RAC fruit, juice and dried pulp, respectively. Due to high residues in orange oil, the working range was extended and fortification levels of 0.01, 1.0 and 200 mg/kg gave recoveries in the range of 80–118%.
Samples of RAC fruits were stored frozen, from collection to extraction for analysis, for up to 639 days, (20 months). Samples of processed commodities were stored frozen, from collection to extraction for analysis, for up to 465 days (15 months) for juice, 694 days (22 months) for orange oil and for up to 570 days (18 months) for dried pulp.
Residues of teflubenzuron do carry through to orange juice but slightly concentrate in dried pulp and significantly concentrate in orange oil.The residue results is summarized in Table 78.
Table 78 Summary of residue levels in orange processed fractions and processing transfer factors
Location and Reference
Winter Garden, FL, USA Ref. R100222
Orosi, CA, USA Ref. R100223
Mean processing factor Analyte
Processed fraction
Application rate 189.1 g ai/ha (2 treatments)
Application rate 188.3-190.1 g ai/ha (2 treatments)
Residue concentration (mg/kg)
Processing factor
Residue concentration (mg/kg)
Processing factor
Teflu-benzuron
Fruit (RAC) Juice Oil Dried pulp
0.34 a < 0.01 140 0.47
— < 0.03 413 1.4
0.20 a < 0.01 18.2 0.13
— < 0.05 91 0.7
— < 0.04 252 1.1
a mean of 3-4 individual sample results
Apples
The study was conducted to analyse apple (Malus domestica) raw agricultural commodities (RAC) and processed fractions (Bixler T.A., 1993a, TZ-711-055).
Information on field trials and process details are needed. Following treatment at rates of 700 and 1400 g/ha with teflubenzuron

Teflubenzuron
2359
Whole apple, pomace and juice processed fractions were received frozen and stored frozen until analysis. Weighed samples were placed in blending jars and if appropriate fortified. Acetone was added and the mixture blended (2 minutes). Celite was added and the mixture re-blended, filtered and re-extracted with further acetone. The acetone extract was combined with distilled water saturated sodium chloride and hexane; this mixture was shaken and transferred to a separating funnel. The aqueous layer was removed and the organic phase passed through sodium sulphate. The aqueous phase was repartitioned against further hexane and the organic phase combined with the previous organic phase. The hexane phase was concentrated to dryness under vacuum and the residue reconstituted in toluene. This concentrated extract was passed through a silica gel column, the column washed with further toluene and toluene: ethyl acetate (95: v/v). The eluent was concentrated and dissolved in acetonitrile, reduced under nitrogen and reconstituted in acetonitrile.
Samples were analysed according to the method outlined in Huntingdon AS final report A025.001, “HPLC Determination of Teflubenzuron (CME 134) in 1987 Crops”. Procedural recoveries for teflubenzuron at fortification levels of 0.05 mg/kg (RAC, wet pomace and juice) and 0.5 mg/kg (RAC and dry pomace) were 71–89%, 94–111%, 60–68% and 108% for RAC fruit, dry pomace, wet pomace and juice, respectively. Samples of RAC fruits were stored frozen, from receipt for analysis, for up to 39 days. Samples of processed commodities were stored frozen, from receipt for analysis, for up to 79 days for dry pomace and wet pomace and for up to 60 days for juice.
Results showed the majority of the residues from treated fruit were found in the dry pomace processed fraction (0.08 to 9.14 mg/kg). Relatively low levels were found in the wet pomace (0.07 to 0.68 mg/kg) and levels in apple juice were below the LOQ ( 0.05 mg/kg). The residues in whole fruit, wet and dry pomace and apple juice is summarized in Table 79.
Table 79 Summary of residue levels in apple whole fruit and processed fractions
Sample Treatment rate 700 g as/ha Treatment rate 1400 g as/ha
Mean Residues (mg/kg) Processing factor Mean Residues (mg/kg)
Processing factor
Whole fruit 0.33 - 1.41 -
Dry pomace 1.98 (1.73, 2.22)
6 9.7 (9.14, 10.2)
6.9
Wet pomace a 0.58 (0.68, 0.47)
1.8 .. …
Juice 0.05 < 0.15 0.05 < 0.035 a Wet pomace samples from the 1400 g/ha treatment rate were not received at the analytical laboratory
Another study on residues in RAC and its processed products was conducted (Pelz S., 1994b, TZ-711-056). Three applications were made at 21day intervals at a rate of approximately 160 g ai/ha during the growth stage 77 to 79 (BBA). Samples taken 14 days after the last application from the control and treated plots were used to prepare processing samples. The initial weight of sample taken was approximately 11 kg. Samples of washed fruit, juice, wet pomace, puree and dried apple were prepared. Apple puree was prepared by heating pieces of fruit under gentle heat for 20 minutes. Dried apple was prepared by drying slices of fruit at 60 °C. All samples were prepared within 3 days of harvest and stored at ≤ -18 °C until analysis. The samples were analysed using analytical test method DFG Method S 19. Specimens were extracted with acetone: water (2:1 v/v), partitioned into dichloromethane and the organic phase evaporated. The residue was cleaned up using gel permeation chromatography on BIO beads S-X3 polystyrene gel using cyclohexane: ethyl acetate (1:1 v/v) as mobile phase followed by further clean up using silica gel. Analysis was by GC with electron capture detection. The routine LOQ for all matrices was 0.01 mg/kg. The average recovery from fortified samples was 89.9% (SD = 13%, CV = 14, n = 26). No residues were found in any of the control samples (LOQ 0.01 mg/kg).
Residues in the processed products suggest that the residue remains on the fruit peel as no residues were detected in the juice and very low residues detected in the puree. Drying the fruit does

Teflubenzuron
2360
not lead to losses of teflubenzuron from the fruit. Therefore teflubenzuron residues are not lost, metabolized or degraded during processing.The residue results are summarized in Table 80.
Table 80 Teflubenzuron in Apples and Processed Products from Apples
Sample Days after last Application
Teflubenzuron (results of 2 or 3 injections)(mg/kg)
Mean Teflubenzuron (mg/kg)
Processing Factor
Apple Fruit 14 0.12, 0.12 0.12 - Washed Apples 14 0.19, 0.19 0.19 1.58 Apple Juice 14 < 0.01, < 0.01 < 0.01 < 0.08 Apple Wet Pomace 14 0.46, 0.46, 0.45 0.46 3.83 Apple Puree 14 0.03, 0.03 0.03 0.25 Dried Apples 14 1.44, 1.43, 1.46 1.44 12
Grapes
Four at-harvest trials were conducted under field conditions in northern and southern Europe (N-France, Germany, 2 × S-France) in 2012 to determine the residues levels of teflubenzuron in RAC grapes (Vitis euvitis, variety: Auxerrois, Sauvignon, Merlot, Blauer Spätburgunder (Pinot noir)) and fractions of wine processing (Perny A., 2013 b, 2013/1037926). One foliar application was carried out with teflubenzuron SC formulation at an exaggerated application rate of 675 g ai/ha. Grape bunches were harvested with a PHI of 7 days. Processed fractions of must, wet pomace, dried pomace, wine after fermentation, lees and young wine were produced using commercial processing procedures.
Red wine
One balance (S-France) and one follow-up trial (Germany) were performed. Grapes were removed from the stems and crushed by machine. The wet pomace was transferred into fermentation vat and sulphites and yeast were added. During alcoholic fermentation, density and temperature were daily monitored. Also a daily agitation of the must (must aeration) was performed. After fermentation, supernatant wine was removed and wet pomace was pressed and dried. Supernatant wine and pressed wine were combined in a fermentation vat for malolactic fermentation by bacteria. After completion of fermentation, the wine was racked and sulphite was added. Lees were removed from the vat. After cold stabilisation (min. 10 days at +4 °C) the wine was clarified and bottled. Sediments were separated.
White wine
One balance (N-France) and one follow-up trial (S-France) were performed. Grapes were pressed as whole bunches (containing the stems). For clarification of the juice pectolytic enzymes and sulphite were added. After at least 12 hours, the lees were discarded and the clear juice was transferred into a vat for alcoholic fermentation. During alcoholic fermentation, density and temperature were monitored. After completion of fermentation, the wine was racked and sulphite was added. Lees were removed from the vat. After cold stabilisation (min. 10 days at +4 °C) the wine was clarified and bottled. Sediments were separated.
Samples were analysed according to DFG method S19. Subsamples of RAC fruit, must, wet pomace, dried pomace, wine after fermentation, lees and young wine were extracted by homogenisation with acetone. After filtration and solvent evaporation, the extract is purified by liquid/liquid partitioning into dichloromethane. Further purification is performed by solid phase extraction (SPE) on silica gel and CarboPrep®. The final extract is analysed by liquid chromatography with mass/mass specific detection (LC/MS-MS). Procedural recoveries for teflubenzuron were performed as follows:
Grapes (RAC): 77–108%; range of fortification 0.01–2.0 mg/kg
Lees: 84–91%; range of fortification 0.01–1.0 mg/kg

Teflubenzuron
2361
Must: 80–108%; range of fortification 0.01–2.0 mg/kg
Stems: 71–107%; range of fortification 0.01–4.0 mg/kg
Pomace (wet): 72–108%; range of fortification 0.01–4.0 mg/kg
Pomace (dry): 100%; fortification level 2.0 mg/kg
Wine (after fermentation): 80–110%; fortification level 0.01 mg/kg
Wine (young): 74–97%; range of fortification 0.01–0.1 mg/kg
Samples of RAC fruit, must, wet pomace, dried pomace, wine after fermentation, lees and young wine were stored frozen, from collection to extraction for analysis, for up to 91 days (3 months).
Residues of teflubenzuron do not concentrate in young wine, wine after alcoholic and malolactic fermentation and in lees, but concentrate in wet and dry pomace. The residue results is summarized in the table below.
Table 81 Summary of residue levels in grape processed fractions and processing transfer factors
Trial Sample Residue of teflubenzuron (mg/kg)
Processing Factor
B2208 MA1 (white wine)
Grapes (RAC) Must Wet pomace Dry pomace Wine after alcoholic fermentation Lees Young wine
0.23 0.10 0.38 0.34 < 0.01 < 0.01 < 0.01
— 0.4 1.7 1.5 < 0.04 < 0.04 < 0.04 a
B2208 DR1 (red wine)
Grapes (RAC) Stems Must Wet pomace Dry pomace Wine after alcoholic fermentation Wine after malolactic fermentation Lees Young wine
1.14 3.19 1.50 2.00 1.64 0.06 0.03 0.19 0.03
— 2.8 1.3 1.8 1.4 0.1 0.03 0.2 0.03
B2208 DR2 (white wine)
Grapes (RAC) Young wine
0.51 0.01
— 0.02
B2208 GE1 (red wine)
Grapes (RAC) Young wine
0.32 < 0.01
— < 0.03 a
Median processing factor Young wine 0.03 a for calculation of the median, PFs were assumed to be at maximum level of 0.03 and 0.04
Tomatoes
Two trials were carried out on mature glasshouse tomato plants with ripening fruits (Enriquez M., 2003b, 2003/1018192). The Teflubenzuron 150 SC formulation was applied 3 times at 7-day intervals at rates of 0.225 kg ai/ha. Triplicate samples of tomatoes were harvested 3 days after the last application. One aliquot was retained at ambient conditions for use in the processing study, one sample was deep-frozen before shipment and used to measure the magnitude of residues, and one retained frozen. The samples were processed into unwashed fruits, juice, wet pomace, puree, peeled tomatoes, peel and canned tomatoes. From the specimens, one balance study and three follow up studies were performed.
Tomato juice and pomace
The tomatoes were washed in tap water. The tomatoes were crushed in a Hobart mixer and the juice separated from the pomace by sieving through a Hobart rotating sieve (2 mm diameter). Wet pomace

Teflubenzuron
2362
was retained and stored frozen (<-18 ºC), an aliquat wet pomace was dried in an over for 4 hours at 90 ºC to produce dry pomace. An aliquot of juice was boiled in a stainlesskettle until the dry matter content measured with a refractometer was greater than or equal to 14.
Peeled and Canned tomatoes
Tomatoes were put into boiling tap water for 1 min then plunged into cold tap water to loosen the peel. The peel was removed with a knife. The canned tomatoes were sterilized at 100 for 15 mins.
The homogenised samples were analysed using analytical test method RLA 12483.00V. Specimens were extracted with acetone, partitioned into dichloromethane after addition of saturated sodium chloride solution, the organic phase cleaned through SPE cartridges, evaporated and re-constituted in the HPLC mobile phase. Analysis was by reverse phase HPLC with UV detection at 254 nm. The LOQ was 0.01 mg/kg. The average recovery from fortified samples of tomato was 93% (n = 14). No residues were found in any of the control samples (LOQ 0.01 mg/kg).
The majority of the residue remaining was still on the surface of the fruits as this was detected in the peel (2.5 mg/kg) and the tomato wet pomace (0.69 mg/kg). Low residues were found in the fractions in which the peel had been removed, tomato juice (0.07 mg/kg) and peeled tomatoes (0.03 mg/kg). Samples in which further processing took place (tomato puree and canned tomatoes) indicate a small loss in the percentage transference due to the heating process. The results are summarized in Table 82.
Table 82 Teflubenzuron in Tomato Processed Products (PHI = 3 days)
Sample
Teflubenzuron Concentration (mg/kg)
Mean Teflubenzuron Concentration (mg/kg) Processing Factor Trial No 1 Trial No 2
Unwashed Tomato Samples 0.28, 0.27 0.57, 0.60 0.43 - Tomato Juice 0.06, 0.05 0.08, 0.10 0.07 0.17 Tomato Wet Pomace 0.52, 0.76 0.78, 0.69 0.69 1.78 Tomato Puree 0.16, 0.14 0.24, 0.18 0.18 0.45 Peeled Tomatoes 0.04, 0.02 0.02, 0.05 0.03 0.08 Tomato Peel 3.67, 3.70 1.38, 1.27 2.50 7.73 Canned Tomatoes 0.02, 0.01 0.05, 0.05 0.03 0.07
Soya bean (crop group legumes)
Two end-point trials were conducted in Brazil in 2010/2011 to determine the residues levels of teflubenzuron in soya bean (seeds) and processed fractions (Jones B., Cardoso B., 2013 b, 13/3000442). A teflubenzuron 150 SC formulation was applied 3 times at exaggerated application rates of 170 g ai/ha with intervals of ten days and a PHI of 21 days. Processed fractions of hulls, shelled soya bean, laminated soya bean, defatted meal, roasted defatted meal and oil were produced using simulated commercial processing procedures.
Soya beans were dried in a ventilated oven at 60 ºC, for approximately 5 hours, after drying beans were manually separated from impurities.
Hulls
The soya beans of each sample were peeled before lamination and hulls were separated.
Laminated soya bean
The shelled soya beans were laminated by rolling in a press type expeller. Approximately 5% of the oil was removed during this process.

Teflubenzuron
2363
Extraction with hexane
Laminated soya bean were extracted three times with pre-heated hexane (45–50 °C) by reflux for 15–20 minutes.
Defatted soya bean meal
For production of defatted soya bean meal, the extractors were heated with indirect steam for 20 minutes and for 5 minutes with direct steam at reduced pressure.
Toasted defatted soya bean meal
Defatted meal was toasting by treatment with direct steam for 20 minutes and at reduced pressure for two minutes to inactivate enzymes.
Soya bean oil
The previously mentioned hexane extract was evaporated at normal pressure for 30–40 minutes for removal of the solvent. Finally vacuum was applied and the oil sample was heated for another 1.5–2 hours to remove almost all residual solvent.
Samples were analysed according to BASF S.A. – SOP-PA.0250. Subsamples of beans, hulls, shelled soya bean, laminated soya bean, defatted meal and roasted defatted meal were extracted by homogenisation with acetone. The extract was centrifuged and an aliquot was diluted with water. Residues were partitioned into hexane and centrifugation. An aliquot of the hexane phase was evaporated to dryness and residues were re-dissolved in acetonitrile/methanol/water (50/10/40; v/v/v) for LC-MS/MS determination.
Modification of the analytical method for soya oil: Subsamples of orange oil were extracted with acetone by sonication. The extract was centrifuged and an aliquot was diluted with water. Residues were partitioned into hexane and centrifugation. An aliquot of the hexane phase was passed through a pre-conditioned silica gel cartridge. After elution with a hexane/acetone mixture, eluates were evaporated to dryness and residues were re-dissolved in acetonitrile/methanol/water (50/10/40; v/v/v) for LC-MS/MS determination.
Procedural recoveries for teflubenzuron at fortification levels of 0.01 and 1.0 mg/kg were 75–91%, 82–90%, 72–92%, 92–99%, 87–88% and 87–112% for beans, shelled soya beans, hulls, laminated beans, defatted meal and toasted defatted meal, respectively. Due to expected high residues in soya oil the working range was extended and fortification levels of 0.01, 1.0 and 5.0 mg/kg gave recoveries in the range of 70–100%.
Samples of beans were stored frozen, from collection to extraction for analysis, for up to 840 days, (27 months). Samples of processed commodities were stored frozen, from collection to extraction for analysis, for up to 889 days (29 months) for hulls, 840 days (27 months) for shelled beans and defatted meal, 834 days (27 months) for laminated beans and roasted defatted meal and for up to 820 days (26 months) for oil.
Residues of teflubenzuron do not concentrate in shelled soya bean, laminated soya bean, defatted meal, roasted defatted meal and oil but concentrate in hulls. The residue results is summarized in Table 83.

Teflubenzuron
2364
Table 83 Summary of residue levels in soya bean processed fractions and processing transfer factors
Location and Reference
Ponta Grossa (PR), Brazil Ref. G100072
Anápolis (GO), Brazil Ref. G100073
Mean processing factor Analyte Processed fraction
Application rate 170 g ai/ha (3 treatments)
Application rate 170 g ai/ha (3 treatments)
Residue concentration (mg/kg)
Processing factor
Residue concentration (mg/kg)
Processing factor
Teflu-benzuron
beans hulls soya bean without hull laminated soya bean defatted meal roasted defatted meal oil
0.09 1) 0.58 2) 0.01 1) < 0.01 < 0.01 < 0.01 0.03
— 6.4 0.1 < 0.1 < 0.1 < 0.1 0.3
0.26 a 0.71 b 0.04 a 0.05 0.01 < 0.01 0.16
— 2.7 0.2 0.2 0.04 < 0.04 0.6
— 4.6 0.1 0.2 0.1 < 0.1 0.5
a mean of a duplicate determination b mean of 4 individual sample results
Sunflower seed
Two end-point trials were conducted in the United States (NAFTA regions 5 and 7) in 2010 to determine the residues levels of teflubenzuron in sunflower (Helianthus annuus L.) seeds (RAC) and processed fractions (Devine J.M.,Cenni M., 2012 b, 2012/7005353). Two broadcast foliar spray applications were done with teflubenzuron 150 SC formulation at exaggerated rates of 64 g ai/ha with an interval of 14–16 days and a PHI of 7 days. Processed fractions of sunflower meal, crude sunflower oil and refined-bleached-deodorized (RBD) oil were produced using simulated commercial processing procedures. Sunflower seed subsamples were dried in a Steelman Industries oven at 54–71 °C until the moisture reached 7–10%. Following drying, samples were cleaned by aspiration and screening. Hulls were removed from the kernels by aspiration after mechanically cracking. Kernels were moisture conditioned to 12% and heated to 88–104 °C.
Production of crude oil and meal
Moisture conditioned kernel were expelled in a Komet expeller to liberate a first fraction of crude oil. The press cake containing residual oil was further treated by solvent extraction to liberate the remaining oil. The press cake was extracted three times by submerging in hexane at 49–60 °C for 30 minutes. All extracts were separated from the press cake and combined. After removing residual solvent from the press cake by heating to 93–99 °C, sunflower meal was obtained. Solvent extracted oil was evaporated under reduced pressure and subsequent heated to 88–96 °C to remove the solvent. Crude oil obtained from the expelling and the solvent extraction was filtered and combined.
Production of refined oil
A weight amount of crude oil and sodium hydroxide was stirred in a water bath for 90 minutes at 20–24 °C followed by stirring for 12 minutes at 63–67 °C. Neutralised oil was separated into alkali refined oil and soap-stock by centrifugation, decanting and filtration. Alkali refined oil was heated to 40–50 °C, activated bleaching earth was added and the sample evaporated under vacuum. The temperature was increased to 85–100 °C for 10 to 15 minutes. Bleached oil was filtered and heated to 220–230 °C under vacuum for 28–32 minutes. During the cooling process a small amount of citric acid solution was added to obtain deodorised refined oil.
Samples were analysed according to BASF S.A.–SOP-PA.0250. Subsamples of sunflower seed and meal were extracted by homogenisation with acetone. The extract was centrifuged and an aliquot was diluted with water. Residues were partitioned into hexane and centrifugation. An aliquot of the hexane phase was evaporated to dryness and residues were re-dissolved in acetonitrile/methanol/water (50/10/40; v/v/v) for LC-MS/MS determination.
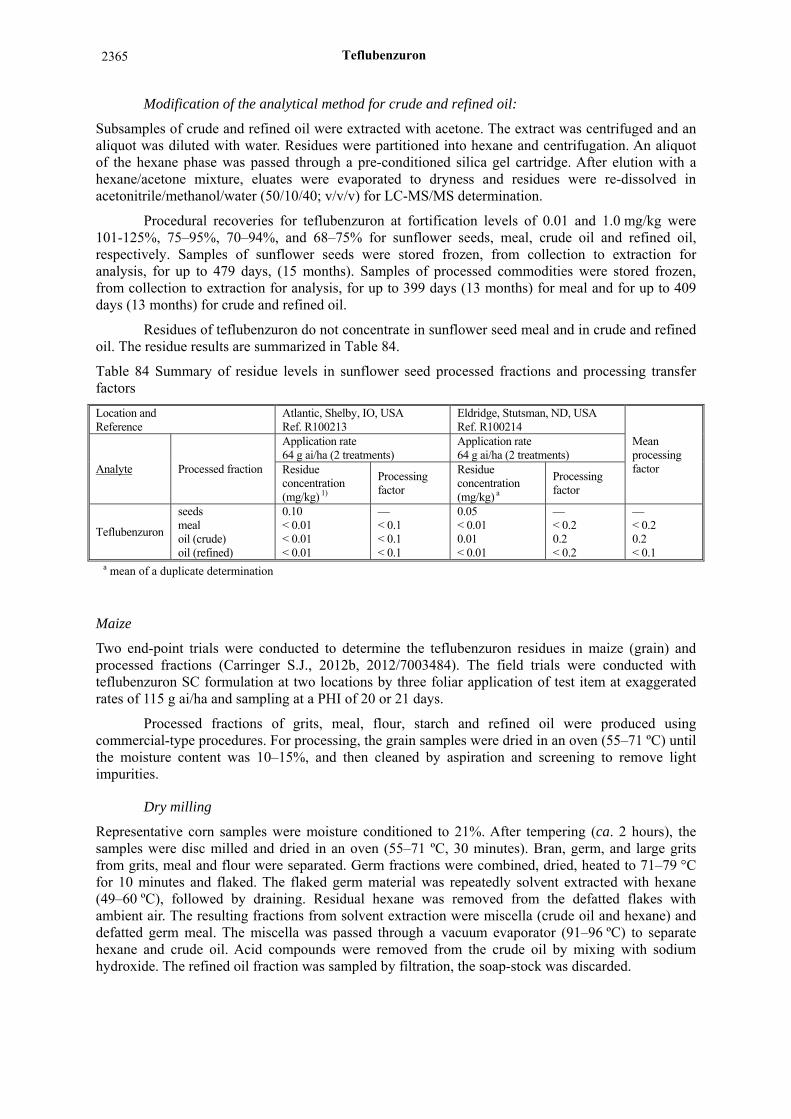
Teflubenzuron
2365
Modification of the analytical method for crude and refined oil:
Subsamples of crude and refined oil were extracted with acetone. The extract was centrifuged and an aliquot was diluted with water. Residues were partitioned into hexane and centrifugation. An aliquot of the hexane phase was passed through a pre-conditioned silica gel cartridge. After elution with a hexane/acetone mixture, eluates were evaporated to dryness and residues were re-dissolved in acetonitrile/methanol/water (50/10/40; v/v/v) for LC-MS/MS determination.
Procedural recoveries for teflubenzuron at fortification levels of 0.01 and 1.0 mg/kg were 101-125%, 75–95%, 70–94%, and 68–75% for sunflower seeds, meal, crude oil and refined oil, respectively. Samples of sunflower seeds were stored frozen, from collection to extraction for analysis, for up to 479 days, (15 months). Samples of processed commodities were stored frozen, from collection to extraction for analysis, for up to 399 days (13 months) for meal and for up to 409 days (13 months) for crude and refined oil.
Residues of teflubenzuron do not concentrate in sunflower seed meal and in crude and refined oil. The residue results are summarized in Table 84.
Table 84 Summary of residue levels in sunflower seed processed fractions and processing transfer factors
Location and Reference
Atlantic, Shelby, IO, USA Ref. R100213
Eldridge, Stutsman, ND, USA Ref. R100214
Mean processing factor Analyte Processed fraction
Application rate 64 g ai/ha (2 treatments)
Application rate 64 g ai/ha (2 treatments)
Residue concentration (mg/kg) 1)
Processing factor
Residue concentration (mg/kg) a
Processing factor
Teflubenzuron
seeds meal oil (crude) oil (refined)
0.10 < 0.01 < 0.01 < 0.01
— < 0.1 < 0.1 < 0.1
0.05 < 0.01 0.01 < 0.01
— < 0.2 0.2 < 0.2
— < 0.2 0.2 < 0.1
a mean of a duplicate determination
Maize
Two end-point trials were conducted to determine the teflubenzuron residues in maize (grain) and processed fractions (Carringer S.J., 2012b, 2012/7003484). The field trials were conducted with teflubenzuron SC formulation at two locations by three foliar application of test item at exaggerated rates of 115 g ai/ha and sampling at a PHI of 20 or 21 days.
Processed fractions of grits, meal, flour, starch and refined oil were produced using commercial-type procedures. For processing, the grain samples were dried in an oven (55–71 ºC) until the moisture content was 10–15%, and then cleaned by aspiration and screening to remove light impurities.
Dry milling
Representative corn samples were moisture conditioned to 21%. After tempering (ca. 2 hours), the samples were disc milled and dried in an oven (55–71 ºC, 30 minutes). Bran, germ, and large grits from grits, meal and flour were separated. Germ fractions were combined, dried, heated to 71–79 °C for 10 minutes and flaked. The flaked germ material was repeatedly solvent extracted with hexane (49–60 ºC), followed by draining. Residual hexane was removed from the defatted flakes with ambient air. The resulting fractions from solvent extraction were miscella (crude oil and hexane) and defatted germ meal. The miscella was passed through a vacuum evaporator (91–96 ºC) to separate hexane and crude oil. Acid compounds were removed from the crude oil by mixing with sodium hydroxide. The refined oil fraction was sampled by filtration, the soap-stock was discarded.

Teflubenzuron
2366
Wet milling
Representative corn samples were steeped in 49–54 ºC water containing 0.1–0.2% sulfur dioxide for 22–48 hours. Thereafter, the whole grain was disc milled and a majority of the germ and hulls were removed by water centrifuge and dried at 74–91 ºC to 5–10% moisture content. Separation of germ and hulls was done by aspiration and screening. The process water was separated from the cornstock by screening and further separated into starch and protein by centrifugation. The starch was dried in a dehydrator oven at 54–71 ºC to a moisture content of <15.0%. The germ samples, described above, were moisture conditioned to 12%, heated to 88–104 ºC, flaked, and pressed in an expeller to produce crude oil and presscake with residual oil. The presscake was extracted with hexane and the residual hexane was removed with ambient air yielding solvent extracted presscake (germ cake). The miscella (crude oil and hexane) were further processed as described above for dry milling to produce crude and refined oil.
Samples of were analysed according to BASF S.A.–SOP-PA.0250. Samples of grain, grits, meal, flour and starch (5 ± 0.1 g) were extracted using acetone (100 mL). The extract is centrifuged and an aliquot is transferred to another centrifuge tube containing water. Hexane is added and the extract is partitioned and centrifuged. An aliquot of the organic phase is evaporated to dryness and dissolved in acetonitrile/methanol/water (50/10/40; v/v/v) for LC-MS/MS determination.
Refined oil samples were extracted using acetone. The extract is centrifuged and an aliquot is transferred to another centrifuge tube containing water. Hexane is added and the extract is partitioned and centrifuged. An aliquot of the organic phase is passed through a silica cartridge, previously conditioned with hexane and a hexane/ acetone mixture (95/5; v/v). The active is eluted from the cartridge with hexane/ acetone (85/15 v/v) and then evaporated to dryness and dissolved in acetonitrile/ methanol/water (50/10/40; v/v/v) for LC-MS/MS determination.
Procedural recoveries for teflubenzuron at fortification levels of 0.01 and 1.0 mg/kg were 76–119% and 74–138%, respectively. Samples of corn (RAC grain) and processed commodities were stored frozen, from collection to extraction for analysis, for 312–435 days, (10.3–14.3 months).
Residues of teflubenzuron concentrate very slightly in corn refined oil (dry milling) and are reduced in grits, meal, flour, starch and refined oil (wet milling). The residue results are summarized in Table 85.
Table 85 Summary of residue levels in corn fractions and processing transfer factors
Location and Reference
Richland, Iowa, USA Ref. R100108
York, Nebraska, USA Ref. R100109
Processed fraction
Application rate 112–115 g ai/ha (3 treatments)
Application rate 114–115 g ai/ha (3 treatments)
Residue (mg/kg)
Processing factor
Residue (mg/kg)
Processing factor
Maize (grain) Grits Meal Flour Refined oil (dry milling) Starch Refined oil (wet milling)
0.02 < 0.01 < 0.01 0.02 0.03 < 0.01 0.02
— < 0.5 < 0.5 1.0 1.5 < 0.5 1.0
< 0.01 < 0.01 < 0.01 < 0.01 < 0.01 < 0.01 < 0.01
— n/a n/a n/a n/a n/a n/a
n/a - not applicable
Sugar cane
Two end-point trials were conducted in Brazil in 2010 and 2011 to determine the residues levels of teflubenzuron in sugar cane (stalks, Saccharum officinarum) and processed fractions (Jones B., Cardoso B., 2012b, 2012/3006061). Teflubenzuron 150 SC formulation was applied three times at an exaggerated rate of 112.5 g ai/ha (nominal). Samples were collected at a PHI of 40 days. Processed

Teflubenzuron
2367
fractions of bagasse, molasses and sugar were produced using simulated commercial processing procedures.
Pressing
The cane juice was extracted by means of milling a 3 tender through two passages, generating bagasse (crushed stalks after extraction) as a by-product.
Clarification
Process used for removal of impurities from the sugar cane juice for the manufacture of white crystal sugar. Sulfurous acid was added to the sugarcane juice to adjust the pH to between 3.8 and 4.3. The mixture was heated to 60 ºC and calcium hydroxide was added until a pH between 7.2–7.5 was reached. The sample was heated to 92–95 °C. During this process, impurities were removed by decanting the sample after flocculation and subsequent sedimentation for one hour. Polymers (PVPP, 2–3 mg/L) were added for further agglomeration of impurities, increasing the speed of sedimentation. Two fractions were obtained: clarified juice, which was further processed, and impurities ("sludge") which were discarded after compressing and reducing the formed sludge volume.
Concentration:
The juice after clarification is a hot, variable coloured and transparent aqueous solution that is concentrated by evaporation of 83–86% of the water to obtain a very viscous liquid (70 to 75º Brix).
Cooking
During this process the Brix-degree is enhanced to 86° obtaining a semi-solid highly viscose product.
Crystallisation
The semi-solid highly viscose product was seeded with small sugar crystals. After growing of the seed crystals to a desired size the process was stopped by centrifugation generating a humid sugar fraction and molasses as a by-product. Finally, the humid sugar fraction was dried.
Samples of were analysed according to BASF S.A.–SOP-PA.0250. Subsamples of stalks, bagasse, molasses and sugar (5 ± 0.1 g) were extracted by homogenisation for 5 minutes with acetone. The extract was centrifuged and an aliquot was diluted with water. Residues were partitioned into hexane by mechanical shaking for 15 minutes and centrifugation. An aliquot of the hexane phase was evaporated to dryness and residues were re-dissolved in acetonitrile/methanol/water (50/10/40 v/v/v; 4 mL) for LC-MS/MS determination. Procedural recoveries for teflubenzuron at fortification levels of 0.01 and 1.0 mg/kg were 84–128% and 74–148%, respectively. The high procedural recovery at 148% can be regarded as acceptable since this is occurring in a sugar sample fortified at 1.0 mg/kg whereas residues in sugar were all <LOQ (0.01 mg/kg). Samples of sugar cane stalks were stored frozen, from collection to extraction for analysis, for up to 619 days, (20 months). Samples of processed commodities were stored frozen, from collection to extraction for analysis, for up to 62 days (2 months).
Residues of teflubenzuron inn sugar cane do not concentrate in bagasse, molasses and sugar. The residue results is summarized in Table 86.
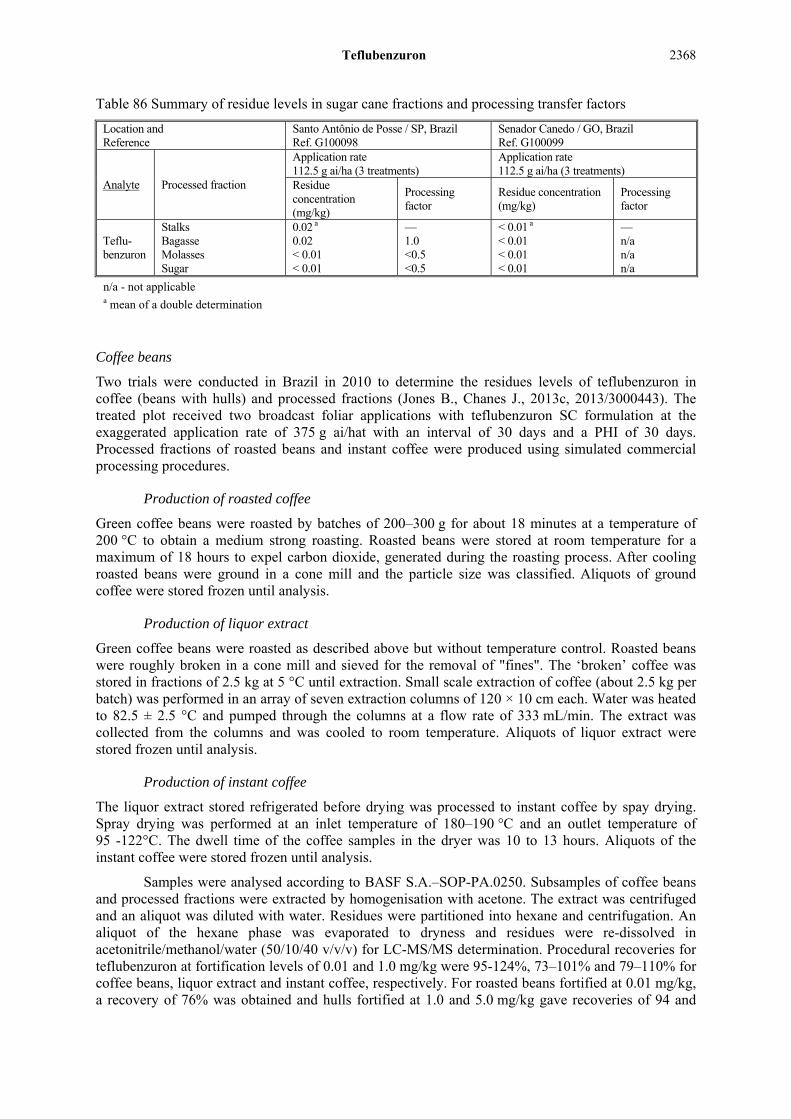
Teflubenzuron
2368
Table 86 Summary of residue levels in sugar cane fractions and processing transfer factors
Location and Reference
Santo Antônio de Posse / SP, Brazil Ref. G100098
Senador Canedo / GO, Brazil Ref. G100099
Analyte Processed fraction
Application rate 112.5 g ai/ha (3 treatments)
Application rate 112.5 g ai/ha (3 treatments)
Residue concentration (mg/kg)
Processing factor
Residue concentration (mg/kg)
Processing factor
Teflu-benzuron
Stalks Bagasse Molasses Sugar
0.02 a 0.02 < 0.01 < 0.01
— 1.0 <0.5 <0.5
< 0.01 a < 0.01 < 0.01 < 0.01
— n/a n/a n/a
n/a - not applicable a mean of a double determination
Coffee beans
Two trials were conducted in Brazil in 2010 to determine the residues levels of teflubenzuron in coffee (beans with hulls) and processed fractions (Jones B., Chanes J., 2013c, 2013/3000443). The treated plot received two broadcast foliar applications with teflubenzuron SC formulation at the exaggerated application rate of 375 g ai/hat with an interval of 30 days and a PHI of 30 days. Processed fractions of roasted beans and instant coffee were produced using simulated commercial processing procedures.
Production of roasted coffee
Green coffee beans were roasted by batches of 200–300 g for about 18 minutes at a temperature of 200 °C to obtain a medium strong roasting. Roasted beans were stored at room temperature for a maximum of 18 hours to expel carbon dioxide, generated during the roasting process. After cooling roasted beans were ground in a cone mill and the particle size was classified. Aliquots of ground coffee were stored frozen until analysis.
Production of liquor extract
Green coffee beans were roasted as described above but without temperature control. Roasted beans were roughly broken in a cone mill and sieved for the removal of "fines". The ‘broken’ coffee was stored in fractions of 2.5 kg at 5 °C until extraction. Small scale extraction of coffee (about 2.5 kg per batch) was performed in an array of seven extraction columns of 120 × 10 cm each. Water was heated to 82.5 ± 2.5 °C and pumped through the columns at a flow rate of 333 mL/min. The extract was collected from the columns and was cooled to room temperature. Aliquots of liquor extract were stored frozen until analysis.
Production of instant coffee
The liquor extract stored refrigerated before drying was processed to instant coffee by spay drying. Spray drying was performed at an inlet temperature of 180–190 °C and an outlet temperature of 95 -122°C. The dwell time of the coffee samples in the dryer was 10 to 13 hours. Aliquots of the instant coffee were stored frozen until analysis.
Samples were analysed according to BASF S.A.–SOP-PA.0250. Subsamples of coffee beans and processed fractions were extracted by homogenisation with acetone. The extract was centrifuged and an aliquot was diluted with water. Residues were partitioned into hexane and centrifugation. An aliquot of the hexane phase was evaporated to dryness and residues were re-dissolved in acetonitrile/methanol/water (50/10/40 v/v/v) for LC-MS/MS determination. Procedural recoveries for teflubenzuron at fortification levels of 0.01 and 1.0 mg/kg were 95-124%, 73–101% and 79–110% for coffee beans, liquor extract and instant coffee, respectively. For roasted beans fortified at 0.01 mg/kg, a recovery of 76% was obtained and hulls fortified at 1.0 and 5.0 mg/kg gave recoveries of 94 and

Teflubenzuron
2369
90%. Samples of coffee beans (with and without hulls) were stored frozen, from collection to extraction for analysis, for up to 759 days, (25 months). Samples of processed commodities were stored frozen, from collection to extraction for analysis for up to 38 days for roasted beans, for up to 18 days for liquor extract, for up to 16 days for instant coffee and for 60 days for hulls.
Teflubenzuron residues in coffee do not concentrate in roasted beans, liquor extract and instant coffee. The residue results are summarized in Table 87.
Table 87 Summary of residue levels in coffee processed fractions and processing transfer factors
Location and Reference
Mogi Guaçu (SP), Brazil Ref. G100096
Araguari (MG), Brazil Ref. G100097
Analyte Processed fraction
Application rate 375 g ai/ha (2 treatments)
Application rate 375 g ai/ha (2 treatments)
Residue concentration (mg/kg)
Processing factor
Residue concentration (mg/kg)
Processing factor
Teflu-benzuron
beans with hulls beans without hulls hulls roasted beans liquor extract instant coffee
0.63 — 3.38 < 0.01 < 0.01 < 0.01
— — 5.4 < 0.2 < 0.2 < 0.2
— 0.09 — < 0.01 < 0.01 < 0.01
— — — < 0.1 < 0.1 < 0.1
Table 88: The summary of processing factors obtained in the processing studies
Raw agricultural commodity (RAC)
Processed commodity
Name Name Processing factor (median or best estimate)
Oranges Juice < 0.03, 0.05 < 0.04 Oil 413, 91 252 Dry pulp 1.4, 0.7 1.1
Apples Washed apple 1.58 1.58 Juice <0.15, < 0.035, < 0.08 < 0.035 Dried pomace 6, 6.9, 6.5 Wet pomace 1.8, 3.83 2.4 Apple puree 0.25 0.25 Dry apple 12 12
Grapes Stem 2.8 2.8 Must 1.3, 0.4 1.3 Wet pomace 1.8, 1.7 1.8 Dry pomace 1.4, 1.5 1.4 Wine after alcoholic fermentation 0.1, < 0.04 0.1 Wine after malolactic fermentation 0.03, 0.03 Lees 0.2, < 0.04 0.2 Yong wine 0.02, 0.03, < 0.03, < 0.04 0.03
Tomatoes Tomato peer 7.73 Peeled tomatoes 0.08 Juice 0.17 Wet pomace 1.78 Puree 0.45 Canned tomatoes 0.07
Soya beans Hull 6.4, 2.7 4.6 Soya bean without hull 0.1, 0.2 0.15 Laminated soya bean <0.1, 0.2 0.2 Defatted meal <0.1, 0.04 0.1 Roasted defatted meal <0.1, < 0.04 <0.1 Oil 0.3, 0.6 0.5
Sunflowers Meal <0.1, <0.2 <0.2 Oil (crude) <0.1, 0.2 0.2 Oil (refined) <0.1, <0.1 <0.1
Maizes Grits <0.5, n/a <0.5 Meal <0.5, n/a <0.5

Teflubenzuron
2370
Raw agricultural commodity (RAC)
Processed commodity
Name Name Processing factor (median or best estimate)
Flour 1.0, n/a 1.0 Starch <0.5, n/a <0.5 Refined oil (dry milling) 1.5, n/a 1.5 Refined oil (wet milling) 1.0, n/a 1.0
Sugarcane Bagasse 1.0, n/a 1.0 Molasses <0.5, n/a <0.5 Sugar <0.5, n/a <0.5
Coffee Roasted beans <0.1 Liquor extract <0.1 Instant coffee <0.1
n/a not applicable
RESIDUES IN ANIMAL COMMODITIES
Direct animal treatment
Teflubenzuron is registered to control sea lice in salmonidae in European Union. The teflubenzuron was admixed with pelleted diet at a level of 2 g/kg. The intended dosage level of tefulbenzuron is 10 mg/kg bw administered once daily for 7 consecutive days.
The 2015 JECFA Meeting (81st meeting, Rome, 17–26 November 2015) evaluated the toxixity and residues in fish of teflubenzuron as veterinary drugs. An ADI of 0–5 μg/kg body weight was established and the MRL of 0.4 mg/kg for muscle plus skin in natural proportion of salmon fish. Moreever, an MRL of 0.5mg/kg was established in the EU for muscle and skin in natural proportions of Salmonidae (EMEA/MRL/221/97-Final).
Farm animal feeding studies
The storage periods and conditions of samples of milk, eggs and animal tissues was not specified in the study reports. The interval between analysis and sampling in feeding studies on cows and hens is estimated at about 2.5 months.
Dairy cows
The study was conducted to determine residues in tissues and milk in dairy cows (Cameron D.M., Puglis J.M., 1989a, TZ-705-001). Teflubenzuron was administered orally to dairy cows (Bos taurus) as a liquid preparation in corn oil by adding individual measured doses to each concentrate feed for four weeks at dose rates of 200, 600 and 2000 mg/animal/day (equivalent to total dietary residues of 10, 30 and 100 ppm). Three control cows received the same amount of corn oil. The cows were fed 2.0 kg of concentrate ration twice daily during milking. The cows were allocated to treatments as per the following table. The dosing period was of 4 weeks duration. Three cows in each test group were sacrificed on the day after the final dose administration. Cows 13 and 14 of the high dose level were maintained on basal diet for 7 and 14 days after the end of dosing and then sacrificed.
Table 89 Treatment schedule
Treatment Group Animal number Treatment (mg/animal/day)
Days of dosing Day of sacrifice Withdrawal time (days)
A 1,2,3 0 (Control) 1 – 27 28 0 B 4,6 200 1 – 28 29 0+ B 5 1 – 29 30 0+ C 8 600 1 – 28 29 0+ C 7,9 1 – 29 30 0+ D 10 2000 1 – 28 29 0+ D 11,12 1 – 29 30 0+ D 13 1 – 28 36 7

Teflubenzuron
2371
Treatment Group Animal number Treatment (mg/animal/day)
Days of dosing Day of sacrifice Withdrawal time (days)
D 14 1 – 28 43 14
0+ animals sacrificed approximately 17-24 h after the final dose
Milk samples were quantitatively collected for each 24 h period from Day – 3 to termination. On Days 14 and 28, additional 200 mL samples were retained from the production of each cow and separated into cream and skim milk. At sacrifice the following tissues were retained: subcutaneous fat, skeletal muscle (pooled from pectoralis/adductor muscle of thigh), peritoneal fat (perirenal/omental pooled sample), liver and kidney. Analytical method HAS No. A025.006 (essentially the same as Testing Specification RU 134/53/80) was used to determine residues of teflubenzuron. Residues were extracted with methanol (tissue) or acetonitrile (milk and fats). The fat of high fat samples was removed in a cooling process. The extracts were cleaned up in a partition step with n-hexane followed by gel permeation and silica gel chromatography. Quantification was by reverse phase HPLC with UV detection. The limit of quantification was 0.01 mg/kg. Method HAS No. A025.008 was used to analyse liver samples for the metabolite 1-(3,5-dichloro-2,4-difluorophenyl)-3-(2,6-difluoro-3-hydroxybenzoyl)-urea (E115). Residues of the metabolite were extracted from liver samples into aqueous methanol. Conjugates were cleaved by heating with hydrochloric acid. E-115 was extracted into methylene chloride, concentrated and purified by gel permeation chromatography, partition and Sep-Pak clean-up. Quantification was by HPLC using UV detection. The LOQ was 0.05 mg/kg. The average of all milk recoveries were 79.1% (54.8–105.2%, n = 15). The average of all kidney recoveries was 84.8% (69.5–101.2%, n = 3). The liver recovery was 115.6% (n = 1). The average liver recovery for metabolite E-115 was 92.8% (77.1–129.7%, n = 4).
Oral in-feed administration of teflubenzuron to lactating dairy cows at levels of 200, 600 and 2000 mg/animal/day for 4 weeks produced no adverse effects on clinical health, bodyweight, food consumption or milk production. No teflubenzuron was found in any of the milk samples assayed at an LOQ of 0.01 mg/kg. Teflubenzuron was detected in peritoneal fat in most animals and in a small number of individual samples of liver, kidney and subcutaneous fat, however all at values < 0.05 mg/kg, close to the LOQ of 0.01 mg/kg. No detectable residues of the metabolite 1-(3,5-dichloro-2,4-difluorophenyl)-3-(2,6-difluoro-3-hydroxybenzoyl)-urea (E115) were seen in liver at an LOQ of 0.05 mg/kg. However low level residues were detected in liver, kidney,fat from control animals, and most detected residue levels from treated animals were comparlable to residues in control, the residues in milk and tissues was not expected.
Table 90 Residues of teflubenzuron (mg/kg) in tissues of dairy cows (LOQ 0.01 mg/kg)
Group Cow No.
Kidney Liver Muscle Peritoneal fat Subcutaneous fat Milk
A Control
1 0.015 < 0.01 < 0.01 0.026 < 0.01 < 0.01 2 < 0.01 < 0.01 < 0.01 < 0.01 < 0.01 < 0.01 3 < 0.01 0.017 < 0.01 0.024 < 0.01 < 0.01
B 200 mg/animal/day
4 0.018 0.025 < 0.01 0.015 < 0.01 < 0.01 5 < 0.01 < 0.01 < 0.01 < 0.01 < 0.01 < 0.01 6 < 0.01 < 0.01 < 0.01 0.028 < 0.01 < 0.01
C 600 mg/animal/day
7 < 0.01 < 0.01 < 0.01 0.015 < 0.01 < 0.01 8 < 0.01 < 0.01 < 0.01 0.017 < 0.01 < 0.01 9 < 0.01 < 0.01 < 0.01 < 0.01 < 0.01 < 0.01
D 2000 mg/animal/day
10 < 0.01 < 0.01 < 0.01 0.011 0.010 < 0.01 11 < 0.01 < 0.01 < 0.01 0.015 0.015 < 0.01 12 0.017 < 0.01 < 0.01 0.015 < 0.01 < 0.01 13 0.041 < 0.01 < 0.01 0.016 < 0.01 < 0.01 14 < 0.01 < 0.01 < 0.01 0.020 0.016 < 0.01

Teflubenzuron
2372
Laying hens
Residues of Teflubenzuron in eggs and tissues of laying hen (Gallus gallus domesticus) was studied(Cameron D.M. et al., 1989a, TZ-705-002). Groups of hens (10 per group) were treated with teflubenzuron orally via the diet at rates of 0.5, 1.5 and 5 ppm over a period of 28 days. Egg production was recorded daily during the study. Total and mean egg weights per group were also recorded. Birds in the groups without withdrawal periods were sacrificed at the end of the 28 day period, animals in the groups with withdrawal periods were sacrificed at 35 and 42 days (7 and 14 days after treatment end). Samples of skin and subcutaneous fate, skeletal muscle (pooled from breast and thigh), abdominal fat, liver and kidneys were taken and pooled within subgroups to give three samples of each tissue. In addition, duplicate samples of muscle were taken from individual birds.
Table 91 Treatment schedule
Group Treatment rate (mg/kg) No of birds Days of dosing No. of days withdrawal
A Control 10 - 0 B 0.5 10 28 0 C 1.5 10 28 0 D1 5.0 10 28 0 D2 5.0 10 28 7 D3 5.0 10 28 14
Analytical method HAS No. A025.005 was used to determine residues of teflubenzuron. Residues were extracted with methanol (tissue) or acetonitrile (egg and fats). The fat, of high fat samples, was removed in a cooling process. The extracts were cleaned up in a partition step with n-hexane followed by gel permeation and silica gel chromatography. Quantification was by reverse phase HPLC with UV detection. The LOQ was 0.01 mg/kg. The average of all egg recoveries were 91.3%. The average kidney recovery was 81.5% (57.8–95.6%, n = 3). The liver recovery was 84.8% (55.9–132%, n = 3). Muscle recovery was 90% (58.7–114.8%, n = 4), abdominal fat recovery was 109.5% (81.6–160%, n = 4) and subcutaneous fat recovery was 93.1% (69.9–119.2%, n = 4).
Method HAS No. A025.008 was used to analyse liver samples for the metabolite 1-(3,5-dichloro-2,4-difluorophenyl)-3-(2,6-difluoro-3-hydroxybenzoyl)-urea (E115). Residues of the metabolite were extracted from liver samples into aqueous methanol. Conjugates were cleaved by heating with hydrochloric acid. E-115 was extracted into methylene chloride, concentrated and purified by gel permeation chromatography, partition and Sep-Pak clean-up. Quantification was by HPLC using UV detection. The LOQ was 0.01 mg/kg. The average liver recovery was 91% (68.0–129.7%).
Eggs
Residues of teflubenzuron in egg were found in all treated groups and a dose-related trend was noted, with peak concentrations detected in the high dose group on day 26 of dosing (0.34 mg/kg). Residues declined during the withdrawal period and were no longer detectable after 14 days of withdrawal (day 42). No residues were detected in any of the control egg samples.
Tissues
Residues of teflubenzuron in tissues were found in all treated groups and a dose-related trend was noted. The highest residues found occurred in abdominal fat. Mean residues in the high dose group (D1) in abdominal fat, skin and subcutaneous fat, liver, kidney and muscle were 0.697, 0.315, 0.081, 0.036 and 0.038 mg/kg, respectively. Results from the high dose groups with withdrawal periods showed that residues persisted in liver at both 7 and 14 days after withdrawal, but in all other tissues declined to undetectable levels at 14 days post withdrawal. No residues were detected in any of the control tissue samples apart from liver.
Liver samples were analysed for metabolite E115, (1-(3,5-dichloro-2,4-difluorophenyl)-3-(2,6-difluoro-3-hydroxybenzyl)-urea). All residues were below the LOQ (0.05 mg/kg).

Teflubenzuron
2373
Residue levels in eggs and tissues analysed are summarized in Tables 92 and 93.
Table 92 Mean residues of teflubenzuron (mg/kg) in eggs
Day of study Group (Treatment rate ppm diet) A (Control)
B (0.5)
C (1.5)
D1 (5.0)
D2 (5.0)
-1 < 0.01 < 0.01 < 0.01 < 0.01 - 3 0.03 5 0.11 7 < 0.01 < 0.01 < 0.01 0.14 10 0.16 14 < 0.01 0.04 0.06 0.28 17 0.29 21 < 0.01 0.03 0.08 0.20 24 0.29 26 0.34 28 < 0.01 0.03 0.08 0.22 30 0.17 35 (7 day withdrawal) 0.08 42 (14 day withdrawal) < 0.01
Table 93 Minimun, maximum and mean residues of teflubenzuron (mg/kg) in tissues of hens
Group Dose (ppm diet)
Kidney Liver Muscle Peritoneal fat Subcutaneous fat
A Control Min < 0.01 0.034 < 0.01 < 0.01 < 0.01
Max < 0.01 0.039 < 0.01 < 0.01 < 0.01
Mean < 0.01 0.037 < 0.01 < 0.01 < 0.01
B 0.5 Min 0.011 0.029 < 0.01 0.069 0.022
Max 0.021 0.058 0.011 0.086 0.037
Mean 0.015 0.041 < 0.01 0.077 0.028
C 1.5 Min 0.012 0.035 0.013 0.201 0.056
Max 0.025 0.057 0.016 0.245 0.121
Mean 0.016 0.043 0.014 0.228 0.081
D1 5.0 Min 0.021 0.067 0.022 0.389 0.237
Max 0.051 0.095 0.063 1.210 0.389
Mean 0.036 0.081 0.038 0.697 0.315
D2 5.0 Min < 0.01 0.076 < 0.01 0.013 < 0.01
Max 0.011 0.099 < 0.01 0.020 < 0.01
Mean < 0.01 0.086 < 0.01 0.016 < 0.01
D3 5.0 Min 0.012 0.060 < 0.01 < 0.01 < 0.01
Max 0.015 0.120 0.014 0.012 < 0.01
Mean 0.014 0.092 < 0.01 < 0.01 < 0.01
APPRAISAL
Teflubenzuron (1-(3,5-dichloro-2,4-difluorophenyl)-3-(2,6-difluorobenzoyl)urea) is a benzoylurea insecticide to control a range of insects including codling moth, leaf miners, whiteflies and caterpillars in a wide range of crops including fruit trees, vegetables, soya beans, oilseeds, maize, sugar cane and coffee. Teflubenzuron was first evaluated by JMPR in 1994 (toxicology) and in 1996 (residues). Teflubenzuron was scheduled at the 47th Session of the CCPR for Periodic Re-evaluation for residues and toxicology by the 2016 JMPR.

Teflubenzuron
2374
The Meeting received information from the manufacturer on physical and chemical
properties, metabolism studies on plants and animals, rotational crop studies, environmental fate in soil, analytical method and stability in stored analytical samples, use patterns and supervised residue trials, processing studies, and livestock feeding studies.
The metabolism and distribution of teflubenzuron in plants and animals was studied using the aniline or benzoyl 14C-labelled compound. The following abbreviations are used for the metabolites or degradation products discussed below:
3379 3380; E114 3381; E115; CL902374 CL902374; E15; CFPU
N-((3,5-dichloro-2,4-difluorophenyl)carbamoyl)-2,6-difluoro-4-hydroxybenzamide;
1-(3,5-dichloro-2-fluoro-4-hydroxy-phenyl)-3-(2,6-difluorobenzoyl)urea Or
1-(3,5-dichloro-4-fluoro-2-hydroxy-; phenyl)-3-(2,6-difluorobenzoyl)urea
N-((3,5-dichloro-2,4-difluorophenyl)carbamoyl)-2,6-difluoro-3-hydroxybenzamide
3,5-dichloro-2,4-difluorophenyl urea
E14; CL902373; EMD CL245508 CL 211558 E30
3,5-dichloro-2,4-difluoroaniline;
2,6-difluorobenzoic acid;
2,6-difluorobenzamide; N-(2,4-difluoro-3,5-dichlorobenzene)-5-fluoro[3H]-dihydroquinazoline-2,4-dione;
Plant metabolism
The metabolism of teflubenzuron has been studied with [14C]teflubenzuron on apples, potatoes and spinach. The study designs of the plant uptake parts reflect the registered use patterns with several foliar applications.
Following foliar applications, there was little translocation from treated foliage to other parts of the plants, which is consistent with its properties (log Pow> 4). In the studies on apples, the
Cl
Cl
NH
O
NH
O
F
F
F
OH
F
C
F
OH
O

Teflubenzuron
2375
teflubenzuron residues remained predominantly associated with the peel (98–99% TRR), low residues (1.2–2.0% of TRR) were extracted from the pulp. In foliage, > 99% TRR was extracted from the surface of leaves. Teflubenzuron was identified as the major component in fruits and leaves (97–99% TRR).
In the studies on potatoes, more than 99% TRR was extracted from treated potato tops at harvest after foliar application. Low radioactive residues (< 0.001 mg/kg) were detected in the tubers. Almost all extracted residues in surfaces of leaves and stems (99% and 98% TRR) were identified as parent teflubenzuron. Radioactive residues in potato tops and tubers after soil drench were 0.001–0.003 mg/kg. Identification of these radioactive residues was not conducted.
In studies on spinach, no significant metabolism of teflubenzuron was observed. The TRR levels in spinach leaves were highest immediately after foliar application at 12–14 mg eq/kg, and decreased to 0.88–0.90 mg eq/kg and 0.08–0.26 mg eq/kg in the 15 and 30 DAA. Most radioactive residues (99–100% TRR) were extracted in leaves, of which 96–100% TRR was identified as parent teflubenzuron in samples from 30 days after application. Minor unidentified metabolites (< 3.2% of the TRR) were detected at 30 DAA.
Plant metabolism studies in apples, potatoes and spinach show that most of teflubenzuron residue remains on the surface of plants and is not readily translocated into the pulp of apple fruit (< 2.2% of TRR translocated into apple pulp) or from potato leaves to tubers (> 98% TRR remaining in potato leaves and stems). A very high level of the radioactivity was attributed to parent compound (> 97% TRR in apple peel, 96–100% TRR in spinach leaves and 99% TRR in potato tops) with no indication of the presence of metabolites or cleavage products.
Confined rotational crop studies
Two studies on confined rotational crops with [14C]teflubenzuron radiolabelled either in the aniline or benzoyl moiety were provided to the Meeting. [14C]teflubenzuron was applied at a rate of 0.5 kg ai/ha to a sandy loam soil in indoor plots, which covered most application scenarios. The TRR in the crop samples at harvest declined with longer plant back intervals. The TRRs in lettuce after 30, 120, and 360 days of plant back interval were 0.007–0.001 mg eq/kg, 0.026–0.001 mg eq/kg in carrot roots, 0.24–0.007 mg eq/kg in wheat straw and 0.012–0.002 mg eq/kg in wheat grain. The TRR in the crops at harvest were low (< 0.01 mg eq/kg) with the exception of wheat straw. Characterisation of the radioactive residues in wheat straw after 30 and 120 days of plant back intervals showed several polar unknowns at concentrations < 0.05 mg/kg. Neither teflubenzuron, nor the two known soil metabolites 3, 5-dichloro-2, 4-difluorophenyl urea and 3,5-dichloro-2,4-difluoroaniline were detected in the plants at levels > 0.01 mg/kg.
The Meeting concluded that due to the very low levels of radioactive residues of teflubenzuron and metabolites detected in confined rotational crops studies, no residues above the limit of quantitation (LOQ) would be expected in rotational crops.
Animal metabolism
Studies were submitted on the metabolism of teflubenzuron in lactating goats. The aniline labelled [14C]teflubenzuron was administered orally to two lactating goats twice daily for 7.5 days at a dose of 1 mg/kg bw/day (equivalent to 25 ppm diet, based on a daily feed intake of 2 kg). More than 93% of the total radioactivity administered was excreted via faeces and urine. Highest levels of total radioactivity were found in liver (0.49 mg eq/kg) corresponding to 0.14% of the total administered dose. Levels in kidney and fat were 0.03 and 0.08 mg eq/kg, respectively. Levels in muscle and skin were at or below the limit of detection. 58% of TRR in liver was extracted. Identification of radioactive residues in liver showed that the major components (81% TRR) were the polar unknowns, along with low levels of metabolite 3379 (3.7% TRR), parent compound (1.6% TRR) and metabolite 3381(1.5% TRR). The TRR in milk was close to the limit of detection; the highest levels of total radioactivity in milk were found in Day 5 evening milk (0.01–0.015 mg eq/kg) and accounted for 0.002–0.005% of the cumulative administered dose. Analysis of milk extracts showed the presence of teflubenzuron (6.5% TRR), metabolite 3381 (1.5% TRR) and polar unknowns (82.5% TRR). Further

Teflubenzuron
2376
attempts to separate compounds produced no interpretable results due to the low amounts (< 0.015 mg eq/kg) of radioactivity.
A study on identification of metabolites in laying hens was available to the Meeting. The aniline-labelled [14C]teflubenzuron was administered orally to eighteen laying hens twice daily for 7.5 days at a dose of 1.25 mg/kg bw /day (equivalent to 25 ppm diet, based on a daily feed intake of 100 g). 88% of the total administered radioactivity was excreted, with less than 0.01% in the eggs and less than 0.4% in the tissues. The radioactive residues in egg yolk reached a maximum of 0.99 mg eq/kg on Day 9. 92% TRR in egg yolk was extracted with methanol, and more than 62% TRR was identified as parent teflubenzuron. Low levels of metabolite E15 (5.4% TRR) and 3381(7.1% TRR) were observed in yolk extracts. The radioactive residues in the tissues (expressed as parent equivalent) were 0.33 mg eq/kg in liver, 0.17 mg eq/kg in kidney, 0.95–1.1 mg eq/kg in fat, 0.45 mg eq/kg in skin, and 0.026–0.066 mg eq/kg in muscle. 70% TRR in liver, 90% TRR in kidney and 94% TRR in fat were extracted with methanol; 35% TRR in liver, 30.1% TRR in kidney and 79% TRR in fat were identified as parent teflubenzuron. Metabolites 3381 and E15 were observed at low levels in liver (6.8% TRR, 3.4% TRR) and kidney (4.5% TRR, 13% TRR). The radioactive residues in muscle were not sufficiently high to enable characterisation.
Metabolism studies performed on goats and hens have shown that teflubenzuron is poorly absorbed and metabolized with more than 88% of total administered radioactivity excreted. The major residues in milk and goat liver were polar unknowns. The most prominent residue in egg yolk and hen tissues (liver and kidney) was parent teflubenzuron. The main metabolites found were metabolite E15 with highest amounts in kidneys of hens (13% TRR) and metabolite 3381 with highest amounts in livers of goats (30% TRR).
Environmental fate
Studies on the degradation of aniline and benzoyl labelled [14C]teflubenzuron under aerobic conditions, field dissipation, hydrolysis and photolysis were received. The [14C]teflubenzuron was applied to sandy loam soil at a rate of 5 mg/kg and silty clay loam at rate of 0.5 mg/kg. The major part of the radioactive residues in soil was from parent teflubenzuron (97% AR on Day 0 to > 48% AR on Day 30) under aerobic conditions. Major metabolites identified were 3,5-dichloro-2,4-difluoroaniline (maximum of 28% AR after 14 days), 3,5-dichloro-2,4-difluorophenylurea (CL902374, maximum of 10% AR after 29 days). Up to 52% AR was mineralized to CO2 in silty clay soil after 150 days. Cleavage of the [14C-benzoyl]-teflubenzuron into 2,6-difluorobenzoic acid was not observed under aerobic conditions.
Four field dissipation trials at a rate of 0.36 kg ai/ha showed DT50 and DT90 values of 17–24 and 55–78 days for teflubenzuron. Degradation of teflubenzuron in the humic sand was relatively fast with a half-life of approximately 2 weeks, and significantly slower in the sandy loam where a half-life of around 6 weeks was calculated.
The hydrolysis of aniline or benzoyl labelled [14C]teflubenzuron was studied in buffered solutions of 0.04 mg/L at pH 5, 7 and 9 in the absence of light at 25 C. The teflubenzuron is stable to hydrolysis at pH 5–7 after 30 days at 25 C. At pH 9, teflubenzuron was extensively hydrolysed with a half-life of 10 days. The major metabolites identified after 30 days at pH 9 were 3,5-dichloro-2,4-difluorophenylurea (61% from the aniline labelled), 3,5-dichloro-2,4-difluoroaniline (12% from the aniline labelled), 2,6-difluorobenzoic acid (62% from the benzoyl labelled) and 2,6-difluorobenzamide (12% from the benzoyl labelled). No other metabolites were at levels above 10% AR.
The study on photo-degradation of aniline labelled [14C]teflubenzuron on soil estimated a photolytic half-life time of approximately 10 days. The only metabolite identified was N-(2,4-difluoro-3,5-dichlorobenzene)5-fluoro[3H]-dihydroquinazoline-2,4-dione (32% AR after 15 days).
The Meeting concluded that teflubenzuron is stable to hydrolysis under neutral and acidic conditions, and photolysis might contribute significantly to degradation of teflubenzuron. In soil its degradation is moderately quick, indicating no potential for accumulation.

Teflubenzuron
2377
Methods of analysis
The Meeting received descriptions and validation data for analytical methods for residues of teflubenzuron in plant matrices (avocadoes, peppers, cucumbers, tomatoes, cherry tomatoes, oats, sugar cane, citrus, cauliflowers, maize, sunflowers, wheat and rye) and animal commodities (milk, liver, muscle, fat and egg). The homogenized samples were extracted with acetone and purified with silica gel for cucumbers, tomatoes, oats, sugar cane, citrus and cauliflowers; extracted with methanol and purified with PSA for maize grain; and extracted with isohexane and acetonitrile purified with formic acid for sunflower seeds. Samples of animal tissues, egg and milk were extracted with acetonitrile and purified with PSA. The determination of teflubenzuron used LC-MS/MS for plants and animal matrices. Typical LOQs achieved for plant and animal commodities were 0.01 mg/kg. The recoveries were within the range of 70–120%, and RSD was within 20%. Methods have been subjected to independent laboratory validation. Multiple residue method of QuEChERS was validated for analysis of teflubenzuron in plant commodities and animal commodities.
Stability of pesticide residues in stored analytical samples
Information was received on the freezer storage stability of teflubenzuron in plant commodities. Studies on stability showed that teflubenzuron residues were stable under freezer condition (-20 C) in spiked samples of apples, pears, potatoes and cabbage for at least 36 months, and in samples of tomatoes, oranges, cotton seeds, soya bean, maize and sunflower seeds for at least 24 months. No information on storage stability of animal commodities were available.
Definition of the residue
In plant metabolism studies performed on fruits (apples), leafy crops (spinach) and tuber crops (potatoes) similar metabolic behaviour was observed. The parent compound teflubenzuron is the dominant component of the residues in plant commodities and ranged from 96–99% TRR in apples, potato tops and spinach leaves. No individual metabolite occurred at a level of > 0.05 mg eq/kg.
The Meeting concluded that teflubenzuron was the major residue in all primary treated plants. No significant residues are expected in rotational crops following application of the active substance. Analytical single- and multi-residue methods are available to measure teflubenzuron in plant matrices. The Meeting decided that the residue definition for plants (compliance with MRLs and dietary intake purposes) is parent teflubenzuron.
Low levels of TRR were detected in milk (< 0.01 mg eq/kg) and tissues of goats (< 0.01 in muscle to 0.49 mg eq/kg in liver). The major components (81% TRR) of radioactive residues in liver were polar unknowns. Minor levels of teflubenzuron (1.6% TRR), metabolite 3379 (3.7% TRR) and 3381 (1.5% TRR) were observed in livers of goats.
Teflubenzuron was the major compound observed in eggs (66% TRR), livers (35% TRR), kidneys (30%TRR), and fat (79%) of hens. TRR levels in muscles were too low to be characterized. Minor metabolites 3381and E15 were observed in livers (6.8% TRR, 3.4% TRR) and kidneys (4.5% TRR, 13% TRR). The parent teflubenzuron serves as a suitable marker for poultry commodities.
The Meeting concluded that teflubenzuron was the major residue in poultry tissues and eggs and present in goat matrices at levels sufficient for identification. No other compounds were suitable for markers in animal commodities. The Meeting decided that the residue definition for animals (compliance with MRLs and dietary intake purposes) is parent teflubenzuron.
Teflubenzuron has a log Pow of 4.2. In feeding studies on hens, the teflubenzuron residues in fat were 8.3–18 times higher than residues in muscle. The Meeting decided that the residue of teflubenzuron is fat soluble.
Definition of the residue (for compliance with the MRL and for estimation of dietary intake) for plant and animal commodities: Teflubenzuron.
The residue is fat soluble.

Teflubenzuron
2378
Results of supervised residue trials on crops
The Meeting received supervised residue trial data for citrus fruits, apples, grapes, mangoes, papaya, pineapples, broccoli, cauliflower, melons, cucumbers, gherkins, tomatoes, sweet peppers, pulse, maize and coffee. If two field samples were taken or results of two replicate plots were submitted, the mean value was calculated. When two or more trials were carried out side-by-side, the higher residue was chosen.
Oranges, Sweet, Sour
The critical GAP in Brazil is two foliar applications on citrus at a rate of 0.09 kg ai/ha with a PHI of 28 days. No trials matched GAP.
Field trials conducted at 2 × 0.12 kg ai/ha were taken into account by applying the proportionality principle (scaling factor of 0.75; 0.09 kg ai/ha ÷ 0.12 kg ai/ha). In 11 supervised trials conducted on oranges in Brazil at a rate of 2 × 0.12 kg ai/ha in Brazil, teflubenzuron residues in whole fruit of oranges at 28 DALA were: 0.02, 0.02, 0.03, 0.04, 0.12, 0.14, 0.22, 0.23, 0.24, 0.25 and 0.26 mg/kg (n = 11). The residues in pulp were: < 0.01 mg/kg (n = 3). The residues in whole fruits after scaling according to the factor of 0.75 were: 0.015, 0.015, 0.023, 0.03, 0.09, 0.11, 0.17, 0.17, 0.18, 0.19 and 0.20 mg/kg (n = 11).
Based on residues after scaling, the Meeting estimated an STMR of 0.11 mg/kg, an HR of 0.2 mg/kg, and a maximum residue level of 0.5 mg/kg for teflubenzuron on oranges. The Meeting noted that the residues in orange pulp from three trials and lemon pulps from three trials were < 0.01 mg/kg. Based on the residues in pulp of oranges and lemons, the Meeting estimated an STMR of 0.01 mg/kg and an HR of 0.01 mg/kg for teflubenzuron on oranges for dietary estimation.
The Meeting noted that the GAP in Brazil is for citrus, and agreed to extrapolate the estimation from orange to the subgroups of oranges (sweet and sour).
The Meeting estimated an STMR of 0.01 mg/kg, an HR of 0.01 mg/kg and recommended a group maximum residue level of 0.5 mg/kg for teflubenzuron on the sub-group of oranges (sweet and sour).
Lemons
The critical GAP for citrus in Brazil is two foliar applications at a rate of 0.09 kg ai/ha with a PHI of 28 days. No trials on lemons matched GAP. Five trials on lemons conducted in Brazil at 2 ×0.12 kg ai/ha were taken into account by applying the proportionality principle. The teflubenzuron residues in whole fruit of lemons were: 0.06, 0.09, 0.12, 0.36 and 0.36 mg/kg, the residues in pulp were < 0.01 mg/kg (n = 3). The residues after scaling according to the factor of 0.75 were: 0.045, 0.068, 0.09, 0.27 and 0.27 mg/kg.
The Meeting recommended the maximum residue level of 0.5 mg/kg for teflubenzuron on lemons. Based on the residues in pulps of lemons and oranges, the Meeting estimated an STMR of 0.01 mg/kg and an HR of 0.01 mg/kg for teflubenzuron on lemons for dietary estimation.
The Meeting noted that the GAP in Brazil is for citrus, and agreed to extrapolate the estimation from lemon to the sub-groups of lemons and limes.
The Meeting estimated an STMR of 0.01 mg/kg, an HR of 0.01 mg/kg and recommended a group maximum residue level of 0.5 mg/kg for teflubenzuron on the sub-groups of lemons and limes.
Apples
Teflubenzuron is registered for foliar spray application on apples in Brazil at a rate of 3 × 0.045–0.060 kg ai/ha with a PHI of 1 day. In 12 supervised trials conducted in Brazil at a rate of 4 × 0.045 kg ai/ha at 10 days interval, the teflubenzuron residues in whole fruits at 1 DALA were: 0.06, 0.08, 0.09, 0.11, 0.14, 0.14, 0.17, 0.18, 0.21, 0.21, 0.22 and 0.29 mg/kg (n = 12).
Teflubenzuron
2379
The Meeting noted that the application number in supervised trials is one more than the GAP. The Meeting also noted that the total application rate in field trials was 0.18 kg ai/ha, same as the maximum rate for GAP. Metabolism studies and decline trials indicated no decrease of teflubenzuron, which is expected to be a stable surface residue. Therefore, the Meeting agreed that the supervised trials with four applications approximately matched the Brazilian GAP.
The Meeting estimated an STMR of 0.16 mg/kg, and recommended a maximum residue level of 0.5 mg/kg for teflubenzuron on apples. The previous recommendation of 1 mg/kg for Pome fruits is withdrawn, as no supporting data was provided.
Plums
The Meeting agreed the previous recommendation of a maximum residue level of 0.1 mg/kg for plums (FS 0014) should be withdrawn as no supporting data was provided.
Grapes
The GAP for grapes in Brazil is three foliar applications of up to 0.048 kg ai/ha with a PHI of 7 days. No trials matching GAP were submitted. However, in 12 supervised trials conducted on grapes in Brazil at rates of 3 0.075 kg ai/ha at 6–7 days interval, the teflubenzuron residue in berries at 7 DALA were: 0.02, 0.04, 0.06, 0.11, 0.12, 0.15, 0.15, 0.26, 0.31, 0.37, 0.49 and 0.62 mg/kg. The Meeting agreed to use the proportionality approach according to the scaling factor of 0.64 (0.048 kg ai/ha/0.075 kg ai/ha). The rank order of scaled residues was: 0.013, 0.026, 0.038, 0.07, 0.077, 0.096, 0.096, 0.17, 0.20, 0.24, 0.31 and 0.40 mg/kg (n = 12).
The Meeting estimated an STMR of 0.096 mg/kg, and recommended a maximum residue level of 0.7 mg/kg for teflubenzuron on grapes.
Assorted tropical and sub-tropical fruit-inedible peel
Mango
Teflubenzuron is registered for one foliar spray application on mangoes in Brazil at a rate of 0.015 to a maximum of 0.24 kg ai/ha with a PHI of 7 days. There were no supervised trials provided (3 × 0.30 kg ai/ha) matching GAP.
Papaya
Teflubenzuron is registered for foliar application on papaya in Brazil at a rate of 3 × 0.06 kg ai/ha with a PHI of 7 days. In four supervised trials conducted in Brazil at a rate of 3 × 0.075 kg ai/ha at 6–8 days interval, teflubenzuron residues in fruit at 7 DALA were: 0.04, 0.13, 0.18 and 0.19 mg/kg.
The Meeting agreed to estimate an STMR of 0.16 mg/kg, and recommended a maximum residue level of 0.4 mg/kg for teflubenzuron on papaya.
Pineapples
The registered use of teflubenzuron on pineapples in Brazil is one foliar application of 0.24 kg ai/ha with a PHI of 7 days. There were no supervised trials provided (3 × 0.3 kg ai/ha) matching GAP.
Brassica (cole or cabbage) vegetables, Head cabbages, Flowerhead cabbages
Broccoli
Teflubenzuron is registered for three foliar applications on broccoli in Brazil at rate of 0.0375 kg ai/ha with a PHI of 14 days. No trials were provided that matched GAP.

Teflubenzuron
2380
Cauliflower
Teflubenzuron is registered for foliar spray applications on cruciferae (Brassicae) in Central America (Guatemala, El Salvador, Honduras, Nicaragua and Panama)at a rate of 0.0225 kg ai/ha with a PHI of 21 days. In seven supervised trials conducted in Guatemala, Costa Rica and Honduras at a rate of 3 × 0.0225 kg ai/ha with 6–8 days interval, teflubenzuron residues in the inflorescence at 21 days after the last application were < 0.01 mg/kg (n = 7).
The Meeting noted that the number of applications is not specified in the GAP in Central America. However, since three treatments in the supervised field trials did not result in residues above the LOQ in cauliflower, the additional previous applications are considered unlikely to contribute significantly to the terminal residues. Therefore, the Meeting agreed that the supervised trials matched the GAP irrespective of the number of applications.
The Meeting estimated an STMR of 0.01 mg/kg, and recommended a maximum residue level of 0.01* mg/kg for teflubenzuron on cauliflowers.
Brussels sprouts
The current MRL of 0.5 mg/kg for Brussels sprouts (VB 0402) should be withdrawn as no supporting data was provided.
Cabbages, Head
The current MRL of 0.1 mg/kg for cabbages, head (VB 0041) should be withdrawn as no supporting data was provided.
Potatoes
The current MRL of 0.05 mg/kg for potatoes (VR 0589) should be withdrawn as no supporting data was provided.
Fruiting vegetables, Cucurbits
Melon
Teflubenzuron is registered for three foliar applications on melons in Brazil at a rate of up to 0.06 kg ai/ha with a PHI of 7 days. In eight supervised trials conducted in Brazil at rates of 3 × 0.075 kg ai/ha at 7 days interval, teflubenzuron residues in whole fruit at 7 DALA were: 0.04, 0.05, 0.06, 0.07, 0.09, 0.09, 0.11 and 0.19mg/kg (n = 8), the teflubenzuron residues in pulp were: < 0.01, < 0.01, 0.02 and 0.02 mg/kg.
The Meeting recommended a maximum residue level of 0.3 mg/kg for teflubenzuron on melons. The Meeting estimated an STMR of 0.01 mg/kg based on residues in pulp for dietary estimation.
Cucumber
Teflubenzuron is registered for three foliar applications on cucumbers (field and greenhouse) in the Netherlands, at a rate of up to 0.225 kg ai/ha with a PHI of 3 days.
In three supervised trials conducted in France and Greece matching the critical GAP, the residues in fruit were: 0.05, 0.06 and 0.33 mg/kg.
In five trials conducted in the Netherland at a rate of two applications of 0.27 kg ai/ha, the residues in fruit were: 0.05, 0.10, 0.10, 0.12 and 0.16 mg/kg.
The Meeting noted that the first application of GAP was 20 days before last application. As cucumbers in greenhouses grow quickly from flowering to harvest, the Meeting concluded that the fruits are unlikely to ever receive three treatments. The Meeting agreed that two applications in trials approximated the GAP.

Teflubenzuron
2381
The residues in eight trials were: 0.05, 0.05, 0.06, 0.10, 0.10, 0.12, 0.16 and 0.33 mg/kg (n = 8).
The Meeting estimated an STMR of 0.10 mg/kg, and recommended a maximum residue level of 0.5 mg/kg for teflubenzuron on cucumbers.
Gherkins
Teflubenzuron is registered for three foliar applications on gherkins in the Netherlands at a rate of 0.225 kg ai/ha with a PHI of 3 days.
The teflubenzuron residues in whole fruit from four supervised trials conducted in France,Poland and Spain matching GAP were: 0.08, 0.23, 0.42 and 0.55 mg/kg (n = 4).
The Meeting estimated an STMR of 0.33 mg/kg, and recommended a maximum residue level of 1.5 mg/kg for teflubenzuron on gherkins.
Fruiting vegetables, other than Cucurbits
Tomato
The critical GAP of teflubenzuron for tomatoes (field and greenhouse) in the Netherlands with three foliar applications, at a rate of 0.225 kg ai/ha and a PHI of 3 days.
The teflubenzuron residues in whole fruit (field) from two supervised trials conducted in the Netherlands matching the critical GAP were (n = 2): 0.32 and 0.49mg/kg.
The teflubenzuron residues in whole fruit (greenhouse) from 10 supervised trials on tomatoes conducted in France, the Netherlands and Spain matching the critical GAP were (n = 10): 0.07, 0.07, 0.07, 0.09, 0.26, 0.33, 0.35, 0.36, 0.42 and 0.88 mg/kg
Based on tomatoes grown in greenhouses, the Meeting estimated an STMR of 0.30 mg/kg, and recommended a maximum residue level of 1.5 mg/kg for teflubenzuron on tomatoes.
Sweet pepper
The critical GAP of teflubenzuron for peppers (bell) in the Netherlands with three foliar spray applications, at a rate of 0.225 kg ai/ha and a PHI of 3 days.
In trials conducted in the Netherlands at the rate of 3 × 0.27 kg ai/ha, the teflubenzuron residues in whole fruit were: 0.46, 0.46 and 0.61 mg/kg.
The Meeting considered three trials to be insufficient to make any recommendations for sweet peppers.
Soya bean
Teflubenzuron is registered for foliar applications on soya beans in Central America (Guatemala, El Salvador, Honduras, Nicaragua and Panama) at a rate of 0.025–0.03375 kg ai/ha with a PHI of 21 days.
The teflubenzuron residues at 21 DALA in soya beans from 10 supervised trials conducted at a rate of 3 0.034 kg ai/ha with 10 days interval in Argentina and Brazil were (n = 10): < 0.01(4), 0.01(3), 0.02 (2) and 0.03 mg/kg. The Meeting noted that the GAP in Central America did not specify the application number, and the early applications are unlikely to contribute significantly to residues at harvest. Therefore, The Meeting agreed that the trials approximated the GAP of Central America.
The Meeting estimated an STMR of 0.01 mg/kg and recommended a maximum residue level of 0.05 mg/kg for teflubenzuron on soya beans.

Teflubenzuron
2382
Maize
Teflubenzuron is registered for two foliar spray applications on maize in Bolivia at a rate of 0.018–0.0225 kg ai/ha with a PHI of 45 days.
In nine trials conducted at a rate of 1–4 0.0225 kg ai/ha, the teflubenzuron residues in grain at 30 or 45 DALA were (n = 9) all < 0.01 mg/kg.
The Meeting estimated an STMR of 0.01 mg/kg and recommended a maximum residue level of 0.01* mg/kg for teflubenzuron on maize.
Sugar cane
Teflubenzuron is registered for two foliar spray applications on sugar cane in Brazil at a rate of 0.0225 kg ai/ha with a PHI of 40 days.
In four trials conducted at a rate of 3 0.0225 kg ai/ha, the teflubenzuron residues in stalks at 40 DALA were (n = 4) < 0.01 mg/kg.
The Meeting estimated an STMR of 0 mg/kg, and recommended a maximum residue level of 0.01* mg/kg for teflubenzuron on sugar cane.
Sunflower seed
Teflubenzuron is registered for two foliar spray applications on sunflowers in Brazil at a rate of 0.0075–0.01125 kg ai/ha with a PHI of 7 days.
In eight trials conducted at rate of 2 0.01275–0.0132 kg ai/ha, the teflubenzuron residues in seeds at 7 DALA were (n = 8): < 0.01(6), 0.08 and 0.13 mg/kg.
The Meeting estimated an STMR of 0.01 mg/kg and recommended a maximum residue level of 0.2 mg/kg for teflubenzuron on sunflower seeds.
Coffee beans
Teflubenzuron is registered for two foliar spray applications on coffee in Brazil at a rate of 0.0375 kg ai/ha with a PHI of 30 days.
The teflubenzuron residues in dry beans from one supervised trial conducted in Brazil matching the GAP was < 0.01 mg/kg. The Meeting noted that coffee cherries were mechanically pulped and dried at room temperature for about 2 weeks in trials on dry beans.
Since one trial is insufficient for estimation, the Meeting took into consideration seven trials conducted at a rate of 0.075 kg ai/ha using the proportionality approach. The teflubenzuron residues in dry beans were: < 0.01, < 0.01, 0.01, 0.01, 0.08, 0.29 and 0.29 mg/kg. The scaled (using the factor of 0.0375/0.075 = 0.5) residue data was: < 0.005(2), 0.005(2), 0.004, 0.15 and 0.15 mg/kg (n = 7).
The data set available for estimation was: < 0.005(2), 0.005(2), < 0.01, 0.004, 0.15 and 0.15 mg/kg (n = 8).
Based on the data above, the Meeting estimated an STMR of 0.01 mg/kg and recommended a maximum residue level of 0.3 mg/kg for teflubenzuron on coffee beans.
Fate of residues during processing
The Meeting received information on hydrolysis studies and on the fate of teflubenzuron residues during the processing of oranges to juice, oil and dry pulp; of apples to juice, puree, dried pomace and wet pomace; of grapes to juice, must, wine, dry pomace and wet pomace; of tomatoes to juice, canned tomatoes, puree and wet pomace; of soya beans to meal and oil; of sunflowers to meal and oil; of maize to grits, meal, flour, oil and starch; of sugar cane to bagasse, molasses and sugar; and of coffee to roasted beans and instant coffee.

Teflubenzuron
2383
Studies on hydrolysis in solutions simulating pasteurization and sterilization (pH 6, incubation for 25 minutes at 120 °C) showed that teflubenzuron is stable under hydrolysis conditions representing sterilisation and pasteurisation (recoveries of 89% and 94% remained as unchanged parent).
The processing factors obtained in the processing studies and estimated STMR-P and HR-P values are summarized below.
Raw agricultural commodity (RAC)
Processed commodity
Name STMR (mg/kg)
Name Processing factor (median or best estimate)
STMR-P (mg/kg)
Oranges 0.11 Juice < 0.03, 0.05 < 0.04 0.0044 Oil 413, 91 252 28 Dry pulp 1.4, 0.7 1.1 0.12 Apples 0.16 Juice < 0.15, < 0.035, < 0.08 < 0.035 0.0056 Dried pomace 6, 6.9, 6.5 1.0 Wet pomace 1.8, 3.83 2.4 0.38 Apple puree 0.25 0.25 0.04 Dry apple 12 12 1.9 Grapes 0.096 Must 1.3, 0.4 1.3 0.12 Wet pomace 1.8, 1.7 1.8 0.17 Dry pomace 1.4, 1.5 1.4 0.13 Young wine 0.02, 0.03, < 0.03, < 0.04 0.03 0.0029 Tomatoes 0.30 Peeled tomatoes 0.08 0.024 Juice 0.17 0.051 Wet pomace 1.78 0.534 Puree 0.45 0.135 Canned tomatoes 0.07 0.021 Soya bean 0.01 Hull 6.4, 2.7 4.6 0.046 Meal < 0.1, 0.04 0.1 0.001 Oil 0.3, 0.6 0.5 0.005 Sunflower 0.01 meal < 0.1, < 0.2 < 0.2 0.002 Oil (refined) < 0.1, < 0.1 < 0.1 0.001 Maize 0.01 Grits < 0.5, n/a < 0.5 0.005 Meal < 0.5, n/a < 0.5 0.005 Flour 1.0, n/a 1.0 0.01 Starch < 0.5, n/a < 0.5 0.005 Refined oil (dry milling) 1.5, n/a 1.5 0.015 Refined oil (wet milling) 1.0, n/a 1.0 0.01 Sugar cane 0 Bagasse 1.0, n/a 1.0 0 Molasses < 0.5, n/a < 0.5 0 Sugar < 0.5, n/a < 0.5 0 Coffee 0.01 Roasted beans < 0.1 0.001 Liquor extract < 0.1 0.001 Instant coffee < 0.1 0.001
The Meeting noted that teflubenzuron concentrated during processing in orange pomace and oil. Based on the recommended MRL of 0.5 mg/kg for teflubenzuron residues in oranges and the processing factor of 252, the Meeting estimated a maximum residue level of 126 mg/kg for orange oil (252 0.5 = 126).
The Meeting noted that teflubenzuron concentrated during processing in hulls of soya beans. The Meeting estimated a maximum residue level of 0.2 mg/kg for soya bean hulls based on the processing factor of 4.6 and recommended a MRL of 0.05mg/kg for soya beans.

Teflubenzuron
2384
The Meeting noted that teflubenzuron concentrated during processing in refined oil (dry milling) of maize. Based on the recommended MRL of 0.01 mg/kg for teflubenzuron residues in maize and the processing factor of 1.5, the Meeting estimated a maximum residues level of 0.015 mg/kg for maize oil.
Residues in animal commodities
Farm animal dietary burden
The Meeting estimated the dietary burden of teflubenzuron in farm animals on the basis of the diets listed in Appendix XIV of the 2016 Edition of the JMPR Manual. The calculations were made according to the livestock diets from Australia, the EU, Japan and US-Canada in the OECD Table. Because the calculation is mainly based on the STMR-P values of the processed by-products, the maximum and mean burden is identical. The dietary burden calculated for the beef cattle, dairy cattle, broilers and laying poultry are summarized below.
Summary of livestock dietary burden (ppm of dry matter diet) US-Canada EU Australia Japan
max mean max mean max mean max mean Beef cattle 0.027 0.027 0.51 0.51 0.54 A 0.54 C 0.01 0.01 Dairy cattle 0.26 0.26 0.026 0.026 0.36 B 0.36 D 0.01 0.01 Poultry-broiler 0.011 0.011 0.015 E 0.015 F 0.004 0.004 0.008 0.008 Poultry-layer 0.011 0.011 0.012 G 0.012 H 0.004 0.004 0.009 0.009
A Highest maximum beef or dairy cattle dietary burden suitable for MRL estimates for mammalian meat B Highest maximum dairy cattle dietary burden suitable for MRL estimates for mammalian milk C Highest mean beef or dairy cattle dietary burden suitable for STMR estimates for mammalian meat D Highest mean dairy cattle dietary burden suitable for STMR estimates for mammalian milk E Highest maximum poultry dietary burden suitable for MRL estimates for poultry meat and eggs F Highest mean poultry dietary burden suitable for STMR estimates for poultry meat and eggs G Highest mean poultry dietary burden suitable for MRL estimates for poultry eggs H Highest mean poultry dietary burden suitable for STMR estimates for poultry eggs
For beef and dairy cattle, the calculated maximum and mean dietary burden is 0.54 ppm and 0.36 ppm dry weight of feed respectively. For poultry, the calculated maximum and mean dietary burden is 0.015 ppm and 0.012 ppm dry weight of feed respectively.
Farm animal feeding studies
The Meeting received feeding studies on dairy cows and laying hens. It was noted that the storage period for milk, egg and tissues samples was about 2.5 months.
Lactating dairy cows were orally fed with teflubenzuron at levels of 10, 30 and 100 ppm in the feed for 4 weeks. Cows were sacrificed at 29–30, 36 and 43 days after first dosing. No teflubenzuron residues above LOQ (0.01 mg/kg) were found in any of the milk samples. Since occasional residues up to 0.026 mg/kg found in tissues of animals in the control group were unrelated to doses, no teflubenzuron residues above LOQ (0.01 mg/kg) were expected in tissues (muscle, liver, kidney and fat).
The Meeting note that the highest animal burden (0.54 ppm) is much less than the lowest feed level (10 ppm), and estimated the maximum residue levels of 0.01* mg/kg and STMRs of 0.01 mg/kg for milk and milk fat, mammalian meat, edible offal and mammalian fat (other than fat from milk).
Laying hens were treated with teflubenzuron orally via the diet at 0.5, 1.5 and 5 ppm for 28 days. Birds without withdrawal periods were sacrificed at the end of 28 days, birds with withdrawal periods were sacrificed at 35 and 42 days (7 and 14 days after treatment end). Residues of teflubenzuron in eggs were found at the highest level (0.34 mg/kg) in the 5 ppm dose group on Day 26. Highest residues of teflubenzuron in tissues were found in the 5 ppm dose group with 0.70 mg/kg

Teflubenzuron
2385
in abdominal fat, 0.32 mg/kg in skin and subcutaneous fat, 0.081 mg/kg in liver, 0.036 mg/kg in kidney and 0.038 mg/kg in muscle.
The calculation used to estimate highest total residues for use in estimating maximum residue levels, STMR and HR values for poultry matrices is shown below.
Feed level ppm) for egg residues
Residues (mg/kg) in eggs
Feed level (ppm) for tissue residues
Residues (mg/kg) kidney liver Muscle Fat
MRL (mg/kg) Feeding study 0.5 0.04 0.5 0.021 0.058 0.011 0.086 Dietary burden and high residue estimation
0.015 0.0012 0.015 0.0063 0.0017 0.0033 0.0026
STMR (mg/kg) Feeding study 0.5 0.04 0.5 0.015 0.041 < 0.01 0.077 Dietary burden and median residue estimated
0.012 0.00096 0.012 0.00036 0.00098 < 0.00024 0.0018
The Meeting noted that the LOQ for egg and poultry tissues is 0.01 mg/kg. The Meeting estimated maximum residue levels and an STMR of 0.01* mg/kg respectively for eggs, poultry meat, fat and edible offal.
RECOMMENDATIONS
On the basis of the data from supervised trials the Meeting concluded that the residue levels listed below are suitable for establishing maximum residue limits and for IEDI and IESTI assessment.
Definition of the residue (for compliance with the MRL and for estimation of dietary intake) for plant and animal commodities: teflubenzuron.
The residue is fat soluble.
MRL recommendations and dietary intake
Commodity MRL, mg/kg STMR or STMR-P CCN Name Proposed previous mg/kg FP 0226 Apple 0.5 0.16 VB 0402 Brussels sprouts W 0.5 VB 0041 Cabbage, head W 0.1 VB 0404 Cauliflower 0.01* 0.01 SB 0716 Coffee beans 0.3 0.01 VC 0424 Cucumber 0.5 0.1 MO 0105 Edible offal (mammalian) 0.01* 0.01 PE 0112 Eggs 0.01* 0.05 VC0425 Gherkin 1.5 0.33 FB 0269 Grapes 0.7 0.096 GC 0645 Maize 0.01* 0.01 OR 0645 Maize oil, edible 0.015 0.015 MF 0100 Mammalian fats (except milk fats) 0.01* 0.01 MM 0095 Meat from mammals (other than marine
mammals) 0.01* 0.01
VC 0046 Melons, except watermelon 0.3 0.01 FM 0183 Milk fats 0.01* 0.01 ML 0107 Milk of cattle, goats and sheep 0.01* 0.01 Orange oil 126 28 FI 0350 Papaya 0.4 0.16 FS 0014 Plums (including prunes) W 0.1 FP 0009 Pome fruits W 1.0 VR 0589 Potato W 0.05 PF 0111 Poultry fats 0.01* 0.01

Teflubenzuron
2386
Commodity MRL, mg/kg STMR or STMR-P CCN Name Proposed previous mg/kg PM 0100 Poultry meat 0.01* 0.01 PE0111 Poultry, Edible offal of 0.01* 0.01 VD 0541 Soya bean (dry) 0.05 0.01 AB 0541 Soya bean, hulls 0.2 0.046 FC 0002 Lemons and limes (includes all
commodities in this subgroup) 0.5 0.01
FC 0004 Oranges, Sweet and Sour (includes all commodities in this subgroup)
0.5 0.01
GS 0659 Sugar cane 0.01* 0 SO 0702 Sunflower seed 0.3 0.01 VO 0448 Tomato 1.5 0.3
W: The recommendation is withdrawn.
*:LOQ
Dietary intake only
CCN Processed commodity STMR-P (mg/kg) JF 0004 Orange juice 0.0044 Orange oil 28 Orange, dry pulp 0.12 JF 0226 Apple juice 0.0056 AF0226 Apple pomace, dry 1.0 Apple wet pomace 0.38 Apple puree 0.04 Grape must 0.12 Grape wet pomace 0.17 AG 0269 Grape pomace, dry 0.13 Grape young wine 0.0029 Peeled tomatoes 0.024 JF 0448 Tomato juice 0.051 Tomato wet pomace 0.53 Tomato puree 0.14 Canned tomatoes 0.021 OR 0541 Soya bean oil, Refined 0.005 AB1265 Soya bean meal 0.001 Sunflower meal 0.002 OC0702 Sunflower oil, crude 0.002 0R 0702 Sunflower oil, Edible 0.001 Maize grits 0.005 CF 0645 Maize meal 0.005 CF 1255 Maize flour 0.01 Maize starch 0.005 Sugar cane bagasse 0. DM 0659 Sugar cane molasses 0 Sugar cane sugar 0 SM 0716 Coffee beans, roasted 0.001 Coffee liquor extract 0.001 Instant coffee 0.001
DIETARY RISK ASSESSMENT
Long-term intake
The International Estimated Dietary Intakes (IEDIs) of teflubenzuron were calculated for the 17 GEMS/Food cluster diets using STMRs and STMR-Ps estimated by the current Meeting (Annex 3 of the 2016 Report). The ADI is 0–0.005 mg/kg bw and the calculated IEDIs were 1–30% of the

Teflubenzuron
2387
maximum ADI. The Meeting concluded that the long-term exposure to residues of teflubenzuron resulting from the uses considered by the current JMPR is unlikely to present a public health concern.
Short-term intake
The 2016 JMPR decided that ARfD for teflubenzuron was unnecessary. The Meeting therefore concluded that the short-term intake of residues of teflubenzuron resulting from uses that have been considered by the Meeting is unlikely present a public health concern.

Teflubenzuron
2388
REFERENCES
Code Author Year Title 2015/7000823
Anonymous 2015 b EURL-FV - Multiresidue method using QuEChERS followed by GC-QqQ/MS/MS and LC-QqQ/MS/MS for fruits and vegetables. EURL Centrexpe, Angerville, France. Unpublished
TZ-360-001
Anonymous 985 b CME 134, analytical standard 1341 - Infrared, ultravoilet and H-nuclear magnetic resonance spectrum. Boehringer Ingelheim KG, Ingelheim am Rhein, Germany Fed.Rep. Unpublished
2003/1011759
Bass R.V. 2003 c Decline and magnitude of residues of BAS 309 I (Teflubenzuron) in tomatoes following three applications of Nomolt 150 g/L SC under glass/plastic house conditions (Italy - Season 2002). Battelle, Carouge, Switzerland. Unpublished
2003/1011760
Bass R.V. 2003 d Decline and magnitude of residues of BAS 309 I (Teflubenzuron) in tomatoes following three applications of Nomolt 150 g/L SC under glass/plastic house conditions (Spain - Season 2002). Battelle, Carouge, Switzerland. Unpublished
2003/1010909
Baumann J. 2003 a Dissipation of BAS 309 I (Teflubenzuron) following the application of Nomolt 150 SC in a field trial in Germany. Battelle, Carouge, Switzerland. Unpublished
2003/1011770
Baumann J. 2003 b Dissipation of BAS 309 I (Teflubenzuron) following the application of Nomolt 150 SC in a field trial in the Netherlands. Battelle, Carouge, Switzerland. Unpublished
2003/1011775
Baumann J. 2003 c Dissipation of BAS 309 I (Teflubenzuron) following the application of Nomolt 150 SC in a field trial in Italy. Battelle, Carouge, Switzerland. Unpublished
2003/1011774
Baumann J. 2003 d Dissipation of BAS 309 I (Teflubenzuron) following the application of Nomolt 150 SC ina field in southern France. Battelle, Carouge, Switzerland. Unpublished
2003/1009579
Baumann J. 2003 e (3,5-Dichloro-2,4-difluorophenyl)urea (CL902374) - Hydrolysis Battelle, Carouge, Switzerland. Unpublished
2012/7004699
Belcher T.I. and Riley M.E.
2012 a Magnitude of the residue of BAS 309 07 I in citrus processed commodities. Eurofins Agroscience Services Inc., Forsyth GA, United States of America. Unpublished
2012/1163069
Bender M. 2012 a Investigation of the storage stability of BAS 309 I (Reg.No.187664) in plant matrices BASF SE, Limburgerhof, Germany Fed.Rep. Unpublished
TZ-326-007
Bixler T.A. 1992 a Freezer storage stability of Teflubenzuron (CME-134) in support of crop residue field trials. Huntingdon Analytical Services, Middleport NY, United States of America. Unpublished
TZ-711-055
Bixler T.A. 1993 a The HPLC determination of Teflubenzuron (CME 134) in apple RAC and processed fractions. Huntingdon Analytical Services, Middleport NY, United States of America. Unpublished
2004/1038254
Borges Z. 2004 b Study of residues of Teflubenzuron in corn (grain) after treatment with Nomolt 150 (BAS 309 01 I) in Brazil. BASF SA, Resende, Brazil. Unpublished
2003/1014470
Brachet A 2003 f Amended report - Determination of explosive properties and surface tension of technical Teflubenzuron. Battelle, Carouge, Switzerland. Unpublished
2003/1011773
Brachet A. 2003 a Determination of physical-chemical properties of Teflubenzuron and technical Teflubenzuron, Battelle, Carouge, Switzerland. Unpublished
2003/1011773
Brachet A. 2003 a Determination of physical-chemical properties of Teflubenzuron and technical Teflubenzuron, Battelle, Carouge, Switzerland. Unpublished
2003/1011773
Brachet A. 2003 a Determination of physical-chemical properties of Teflubenzuron and technical Teflubenzuron. Battelle, Carouge, Switzerland. Unpublished
2003/1011773
Brachet A. 2003 a Determination of physical-chemical properties of Teflubenzuron and technical Teflubenzuron. Battelle, Carouge, Switzerland. Unpublished
2003/1011773
Brachet A. 2003 a Determination of physical-chemical properties of Teflubenzuron and technical Teflubenzuron. Battelle, Carouge, Switzerland. Unpublished
2003/1011773
Brachet A. 2003 a Determination of physical-chemical properties of Teflubenzuron and technical Teflubenzuron. Battelle, Carouge, Switzerland. Unpublished
2003/1011773 Brachet A. 2003 a Determination of physical-chemical properties of Teflubenzuron and technical Teflubenzuron. Battelle, Carouge, Switzerland. Unpublished
2003/1011767
Brachet A. 2003 b Determination of the solubility of technical Teflubenzuron in organic solvents. Battelle, Carouge, Switzerland. Unpublished
2003/1011764
Brachet A. 2003 e Determination of flammability and auto-flammability of technical Teflubenzuron Battelle, Carouge, Switzerland. Unpublished
2003/1011764 Brachet A. 2003 e Determination of flammability and auto-flammability of technical Teflubenzuron. Battelle, Carouge, Switzerland. Unpublished
2003/1014470
Brachet A. 2003 f Amended report - Determination of explosive properties and surface tension of technical Teflubenzuron. Battelle, Carouge, Switzerland. Unpublished
2003/1014471 Brachet A. 2003 g Determination of oxidizing properties of technical Teflubenzuron. Battelle,

Teflubenzuron
2389
Code Author Year Title Carouge, Switzerland. Unpublished 2003/1011766 Brachet A. 2003 h Determination of n-octanol/water partition coefficient of Teflubenzuron.
Battelle, Carouge, Switzerland. Unpublished 2003/1011765
Brachet A. 2003 i Dissociation in water of Teflubenzuron. Battelle, Carouge, Switzerland. Unpublished
TZ-440-011
Cameron B. et al.
1987 a The disposition of [14C]-CME 134 in the lactating goat (Nature of residue studies to EPA guidelines). IRI - Inveresk Research International Ltd., Musselburgh East Lothian EH21 7UB, United Kingdom. Unpublished
TZ-440-012
Cameron B. et al.
1989 a Further identification of [14C]-CME 134 metabolites in the goat. IRI - Inveresk Research International Ltd., Musselburgh East Lothian EH21 7UB, United Kingdom. Unpublished
TZ-440-009
Cameron B.D. et al.
1987 a The disposition of [14C]-CME 134 in the laying hen (Nature of residue studies to EPA guidelines). IRI - Inveresk Research International Ltd., Musselburgh East Lothian EH21 7UB, United Kingdom. Unpublished
TZ-440-010
Cameron B.D. et al.
1988 a Further identification of [14C]-CME 134 metabolites in the hen IRI - Inveresk Research International Ltd., Musselburgh East Lothian EH21 7UB, United Kingdom. Unpublished
TZ-705-001
Cameron D.M. and Puglis J.M.
1989 a Residues of CME 134 (Teflubenzuron) in milk and tissues of dairy cows. Huntingdon Research Centre Ltd., Huntingdon Cambridgeshire PE18 6ES, United Kingdom. Unpublished
TZ-705-002
Cameron D.M. et al.
1989 a Residues of CME 134 (Teflubenzuron) in eggs and tissues of laying hens. Huntingdon Research Centre Ltd., Huntingdon Cambridgeshire PE18 6ES, United Kingdom. Unpublished
TZ-315-001
Cardinaals J.M. 1988 b Determination of the partition coefficient of CME 134 (analytical standard). RCC Notox BV, s-Hertogenbosch, Netherlands. Unpublished
TZ-312-001
Cardinaals J.M. 1989 a Determination of the solubility of CME 134 in different solvents. RCC Notox BV, s-Hertogenbosch, Netherlands. Unpublished
2012/7003484
Carringer S.J. 2012 b Magnitude of the residue of Teflubenzuron in or on field corn aspirated grain fractions and processed commodities following three foliar applications of BAS 309 07 I. The Carringers Inc., Apex NC, United States of America. Unpublished
2012/7000229
Carringer S.J. 2012 c Magnitude of the residue of Teflubenzuron in or on soybean raw agricultural commodities following three foliar applications of BAS 309 07 I. The Carringers Inc., Apex NC, United States of America. Unpublished
2012/7003484
Carringer S.J. 2012 d Magnitude of the residue of Teflubenzuron in or on field corn aspirated grain fractions and processed commodities following three foliar applications of BAS 309 07 I. The Carringers Inc., Apex NC, United States of America. Unpublished
2012/7003872
Carringer S.J. 2012 e Magnitude of the residue of Teflubenzuron in or on sunflower raw agricultural commodities following two foliar applications of BAS 309 07 I. The Carringers Inc., Apex NC, United States of America. Unpublished
2011/1145202
Chapleo S. and Shankey M
2011 a The metabolism 14C-Teflubenzuron (BAS 309 I, Reg.No. 187664) in spinach. Charles River, Tranent EH33 2NE, United Kingdom. Unpublished
TZ-620-012
Croucher A. and Edwards V.T.
1990 a Teflubenzuron [14C-benzoyl ring] - Degradation in soil under aerobic and anaerobic conditions. Shell Research Ltd., Sittingbourne Kent ME9 8AG, United Kingdom. Unpublished
2001/1028276
Dantas C. 2001 a Estudo de residuo de Teflubenzuron (CL 291898) em tomato (fruto total) do Brasil. LARAL - Laboratorio Agro de Residuos da America Latina, Rio de Janeiro, Brazil. Unpublished
2011/3005674
Dantas C. 2009 a Study of Teflubenzuron residues in apple (fruits) after treatment with BAS 309 07 I under field conditions in Brazil. BASF SA, Guaratingueta, Brazil. Unpublished
2011/3004487
Dantas C. 2009 c Study of Teflubenzuron residues in sugarcane (stalks) after treatment with BAS 309 07 I under field conditions in Brazil. BASF SA, Guaratingueta, Brazil. Unpublished
2010/1151830
Dantas C. 2011 a Study of residues of Alpha-Cypermethrin and Teflubenzuron in citrus (fruits), after treatment with BAS 325 01 I, under field conditions in Brazil. BASF SA, Guaratingueta, Brazil. Unpublished
2014/3018287
Dantas C. 2014 a Amendment 02 - Study of residues of Teflubenzuron in apple (fruits) after treatment with BAS 309 07 I under field conditions in Brazil. BASF SA, Guaratingueta, Brazil. Unpublished
2012/3005363
Dantas C. and Alves M.
2012 a Residue study of Teflubenzuron in citrus (fruits) after treatment with BAS 309 07 I under field conditions in Brazil. BASF SA, Guaratingueta, Brazil. Unpublished
2012/3005364
Dantas C. and Cardoso B.
2012 a Residue study of Teflubenzuron in grape (fruits) after treatment with BAS 309 07 I under field conditions in Brazil. BASF SA, Guaratingueta, Brazil. Unpublished
2012/3005033 Dantas C. and 2012 b Residue study of Teflubenzuron in melon (fruits) after treatment with BAS 309
Teflubenzuron
2390
Code Author Year Title Cardoso B. 07 I under field condition in Brazil. BASF SA, Guaratingueta, Brazil.
Unpublished 2011/3004486
Dantas C. and Souza C.
2008 d Study of Teflubenzuron residues in corn (grains) after treatment with BAS 309 07 I under field conditions in Brazil. BASF SA, Guaratingueta, Brazil. Unpublished
2011/3004485
Dantas C. and Souza C.
2008 e Study of Teflubenzuron residues in coffee (grains) after treatment with BAS 309 07 I under field conditions in Brazil. BASF SA, Guaratingueta, Brazil. Unpublished
2012/3003365
Dantas C. and Takahashi J.
2010 b Residue study of Teflubenzuron in coffee (grains), after treatment with BAS 309 07 I under field conditions in Brazil. BASF SA, Guaratingueta, Brazil. Unpublished
2011/1050141
Dantas C. and Takahashi J.
2011 a Validation study of the SOP-PA.0250 for the determination of Teflubenzuron (BAS 309 I) residues in oat, sugarcane, citrus and cauliflower by HPLC/MS/MS. BASF SA, Guaratingueta, Brazil. Unpublished
2011/1050142
Dantas D. and Marinho E.
2011 a Study of residues of Teflubenzuron in apple (fruits) after treatment with BAS 309 07 I under field conditions in Brazil. BASF SA, Guaratingueta, Brazil. Unpublished
2012/7005353
Devine J.M. and Cenni M.
2012 b Residues of Teflubenzuron in sunflower seed, meal and raw and refined oil after treatment with BAS 309 07 I. SynTech Research Inc., Sanger CA, United States of America. Unpublished
TZ-720-001
Eichler D. 1985 c Report on plant protection residue trial - CME 134 in soyabean. Celamerck GmbH & Co. KG, Ingelheim, Germany Fed.Rep. Unpublished
TZ-720-002
Eichler D. 1985 d Report on plant protection residue trial - CME 134 in soyabean. Celamerck GmbH & Co. KG, Ingelheim, Germany Fed.Rep. Unpublished
2003/1018192
Enriquez M. 2003 b Processing study for the determination of BAS 309 I (Teflubenzuron) in tomato processed products following three applications of Nomolt 150 g/L SC under glass/plastic house conditions. Battelle, Carouge, Switzerland. Unpublished
2003/1018192
Enriquez M. 2003 c Processing study for the determination of BAS 309 I (Teflubenzuron) in tomato processed products following three applications of Nomolt 150 g/L SC under glass/plastic house conditions. Battelle, Carouge, Switzerland. Unpublished
2012/7003873
Gehl J. 2013 a Magnitude of the residue of Teflubenzuron on citrus (orange): Raw Commodities (whole fruit). Eurofins do Brasil, Indaiatuba, Brazil. Unpublished
2006/1037728
Ginzburg N. 2007 a Hydrolysis of Teflubenzuron at high temperatures and controlled pH conditions Battelle, Carouge, Switzerland. Unpublished
2013/3000941
Guimaraes S.F. 2013 b Study of Teflubenzuron residues in soybean (grains and aspirated grain AGF), after treatment with BAS 309 07 I, under field conditions in Brazil. BASF SA, Guaratingueta, Brazil. Unpublished
2013/3000826
Guimaraes S.F. and Almeida B.C. de
2013 b Study of Teflubenzuron residues in coffee (grains) after treatment with BAS 309 07 I under field conditions in Brazil. BASF SA, Guaratingueta, Brazil. Unpublished
2012/3005488
Guimaraes S.F. and Chanes J.
2012 a Study of Teflubenzuron and Alpha-Cypermethrin residues in pineapple (fruits) after treatment with Imunit under field conditions in Brazil. BASF SA, Guaratingueta, Brazil. Unpublished
2013/3000621
Guimaraes S.F. and Chanes J.
2013 a Study of Teflubenzuron residues in citrus (fruits), after treatment with BAS 309 07 I, under field conditions in Brazil. BASF SA, Guaratingueta, Brazil. Unpublished
2013/3000383
Guimaraes S.F. and Goes Menezes E.M. de
2013 a Study of Teflubenzuron and Alpha-Cypermethrin residues in pineaple (fruits) after treatment with Imunit under field conditions in Brazil. BASF SA, Guaratingueta, Brazil. Unpublished
2013/3000824
Guimaraes S.F. and Ramiro M.S.P.
2013 a Study of Teflubenzuron residues in grape (fruits), after treatment with BAS 309 07 I, under field conditions in Brazil. BASF SA, Guaratingueta, Brazil. Unpublished
TZ-306-001
Harteveld J.L.N. and Jager H.
1988 a The vapour pressure of Teflubenzuron. TNO, Rijswijk, The Netherlands. Unpublished
TZ-322-001
Hawkins D.R. et al.
1987 a The hydrolysis of 14C-CME 134. Huntingdon Research Centre Ltd., Huntingdon Cambridgeshire PE18 6ES, United Kingdom. Unpublished
TZ-322-002
Hawkins D.R. et al.
1987 b The photodegradation of 14C-CME 134 in aqueous solution. Huntingdon Research Centre Ltd., Huntingdon Cambridgeshire PE18 6ES, United Kingdom. Unpublished
TZ-620-007
Hawkins D.R. et al.
1987 a The photodegradation of 14C-CME 134 on soil. Huntingdon Research Centre Ltd., Huntingdon Cambridgeshire PE18 6ES, United Kingdom. Unpublished
TZ-322-001
Hawkins D.R. et al.
1987 b The hydrolysis of 14C-CME 134. Huntingdon Research Centre Ltd., Huntingdon Cambridgeshire PE18 6ES, United Kingdom. Unpublished
TZ-303-001 Helvoirt 1988 a Determination of the melting point/melting range of CME 134 RCC Notox BV,

Teflubenzuron
2391
Code Author Year Title J.A.M.W. van s-Hertogenbosch, Netherlands. Unpublished 2010/7018605
Hjorth K. et al. 2010 b Validation report 6 - Determination of pesticide residues in cereals by GC-MS/MS and LC-MS/MS - (QuEChERS method). CRL for Cereals and Feeding stuff - National Food Institute - Technical University of Denmark, Copenhagen, Denmark. Unpublished
2011/3004805
Jones B. and Alves M.
2011 a Study of Teflubenzuron residues in melon (pulp and peel) after treatment with BAS 309 07 I under field conditions in Brazil. BASF SA, Guaratingueta, Brazil. Unpublished
2012/3003683
Jones B. and Alves M.
2011 c Residue study of Teflubenzuron in coffee (grains) after treatment with BAS 309 07 I under field conditions in Brazil. BASF SA, Guaratingueta, Brazil. Unpublished
2012/3000937
Jones B. and Alves M.
2012 a Study of Teflubenzuron and Alpha-cypermethrin residues in citrus (fruits) after treatment with Imunit under field conditions in Brazil. BASF SA, Guaratingueta, Brazil. Unpublished
2012/3003364
Jones B. and Alves M.
2012 b Residue study of Teflubenzuron in soybean (grains) after treatment with BAS 309 07 I under field conditions in Brazil. BASF SA, Guaratingueta, Brazil. Unpublished
2012/3003361
Jones B. and Cardoso B.
2011 b Residue study of Teflubenzuron in soybean (grains) after treatment with BAS 309 07 I under field conditions in Brazil. BASF SA, Guaratingueta, Brazil. Unpublished
2012/3006061
Jones B. and Cardoso B.
2012 b Study of Teflubenzuron residues in sugarcane (stalks) and processed fractions after treatment with BAS 309 07 I under field conditions in Brazil for import tolerance BASF SA, Guaratingueta, Brazil. Unpublished
2013/3000442
Jones B. and Cardoso B.
2013 b Study of Teflubenzuron residues in soybean (grains and processed fractions) after treatment with BAS 309 07 I under field conditions in Brazil for import tolerance BASF SA, Guaratingueta, Brazil. Unpublished
2013/3000443
Jones B. and Chanes J.
2013 c Study of Teflubenzuron residues in coffee (beans and processed fractions) after treatment with BAS 309 07 I under field conditions in Brazil for import tolerance BASF SA, Guaratingueta, Brazil. Unpublished
2011/1140705
Jones B. and Marinho E.
2011 b Study of residues of Teflubenzuron in corn (grains), after treatment with BAS 309 07 I, under field conditions in Brazil. BASF SA, Guaratingueta, Brazil. Unpublished
TZ-360-007
Jones M.T. et al.
1995 a Teflubenzuron (CL 291,898) spectral database. American Cyanamid Co., Princeton NJ, United States of America. Unpublished
2015/7001132
Keenan D. and Arndt T.
2015 a Development and validation of a method for the determination of Teflubenzuron in bovine fat, muscle, liver, whole milk and poultry egg. PTRL West Inc., Hercules CA, United States of America. Unpublished
TZ-324-001
Knoch E. 1995 a Determination of the direct phototransformation of 14C-Teflubenzuron in a buffered medium at pH 5. Institut Fresenius Chemische und Biologische Laboratorien GmbH, Taunusstein, Germany Fed. Rep. Unpublished
TZ-324-001
Knoch E. 1995 a Determination of the direct phototransformation of 14C-Teflubenzuron in a buffered medium at pH 5. Institut Fresenius Chemische und Biologische Laboratorien GmbH, Taunusstein, Germany Fed. Rep. Unpublished
2011/7005231
Mickelson K.R.
2012 a Study of BAS 309 I residues in broccoli after application of BAS 309 07 I under field conditions in Costa Rica, Guatemala and Honduras for import tolerance. International Agricultural Research Inc., Santa Fe NM, United States of America. Unpublished
2011/7005230
Mickelson K.R.
2012 b Study of BAS 309 I residues in cauliflower after application of BAS 309 07 I under field conditions in Costa Rica, Guatemala and Honduras for import tolerance. International Agricultural Research Inc., Santa Fe NM, United States of America. Unpublished
2012/7004241
Mickelson K.R.
2012 d Study of BAS 309 I residues in coffee processed fractions after application of BAS 309 07 I under field conditions for import tolerance. BASF SA, Guaratingueta, Brazil. Unpublished
2001/5003686
Oostingh C. 2001 a Teflubenzuron (AC 291, 898) 150 g a.s./L (CF 08295), SC - At harvest residue study on Teflubenzuron in cucumber, field phase - The Netherlands, 2000 (greenhouse study). BASF Agro, Breda, Netherlands. Unpublished
2001/5003684
Oostingh C. 2001 d Teflubenzuron (AC 291898) 150 g a.s./L (CF 08295), SC - At harvest residue study on Teflubenzuron in tomatoes, field phase - The Netherlands, 2000 (greenhouse study). BASF Agro, Breda, Netherlands. Unpublished
2001/5003685
Oostingh C. 2001 e Teflubenzuron (AC 291898) 150 g a.s./L (CF 08295), SC - At harvest residue study on Teflubenzuron in sweet pepper, field phase - The Netherlands, 2000 (greenhouse study). BASF Agro, Breda, Netherlands. Unpublished

Teflubenzuron
2392
Code Author Year Title TZ-711-056
Pelz S. 1994 b Determination of residues of Teflubenzuron in apples and their processed products and in pears after application of SAG 134 06 I. Dr. Specht & Partner Chemische Laboratorien GmbH, Hamburg, Germany Fed.Rep.. Unpublished
2010/1039710
Perny A. 2010 a Validation of the analytical method for the determination of Teflubenzuron residues in tomato and cucumber. Anadiag SA, Haguenau, France. Unpublished
2010/1055083 Perny A. 2010 a Determination of Teflubenzuron residues in cucumbers following treatments with BAS 309 07 I (Teflubenzuron 150 g/L SC) under greenhouse conditions in 2009. Anadiag SA, Haguenau, France. Unpublished
2010/1044755
Perny A. 2010 b Determination of Teflubenzuron residues in gherkins following treatments with BAS 309 07 I (Teflubenzuron 150 g/L SC) under greenhouse conditions in 2009. Anadiag SA, Haguenau, France. Unpublished
2010/1055084
Perny A. 2010 e Determination of Teflubenzuron residues in cherry tomatoes following treatments with BAS 309 07 I (Teflubenzuron 150 g/L SC) under greenhouse conditions in 2009. Anadiag SA, Haguenau, France. Unpublished
2013/1037926
Perny A. 2013 b Determination of Teflubenzuron residues in grapes RAC and in processed fractions following one application with BAS 309 07 I under field conditions in Northern and Southern Europe in 2012. Anadiag SA, Haguenau, France. Unpublished
2001/5003682
Pigeon O. 2001 a Determination of residues of Teflubenzuron (BAS 309 I) in cucumber growing in greenhouse after treatments with CF 08295 (analytical phase). CRA - Centre de Recherches agronomiques de Gembloux, Gembloux, Belgium. Unpublished
2001/5003681
Pigeon O. 2001 d Determination of residues of Teflubenzuron (BAS 309 I) in tomatoes growing in greenhouse after treatments with CF 08295 - Analytical Phase. CRA - Centre de Recherches agronomiques de Gembloux, Gembloux, Belgium. Unpublished
2001/5003683
Pigeon O. 2001 e Determination of residues of Teflubenzuron (BAS 309 I) in sweet pepper growing in greenhouse after treatments with CF 08295 (analytical phase). CRA - Centre de Recherches agronomiques de Gembloux, Gembloux, Belgium. Unpublished
2012/3005740
Porto F. 2012 a Study of residues of Teflubenzuron and Alphacypermethrin in mango (fruits) after treatment with Imunit under field conditions in Brazil. BASF SA, Guaratingueta, Brazil. Unpublished
2012/3005365 Porto F. and Cardoso B.
2012 a Residue study of Teflubenzuron in papaya (fruits) after treatment with BAS 309 07 I under field conditions in Brazil. BASF SA, Guaratingueta, Brazil. Unpublished
2012/3003363
Porto F. and Marinho E.
2010 b Study of residues of Teflubenzuron and Alphacypermethrin in sunflower (seeds) after treatment with BAS 325 01 I under field conditions in Brazil. BASF SA, Guaratingueta, Brazil. Unpublished
2010/1221609
Przybylek A. 2011 a Teflubenzuron (BAS 309 I, Reg.No. 187664): Independent laboratory validation (ILV) of BASF method L0160/01 for the determination of Teflubenzuron in dry and oily crops by LC-MS/MS. PTRL Europe, Ulm, Germany Fed.Rep. Unpublished
TZ-901-013
Puglis J.M. et al.
1989 a The HPLC determination of Teflubenzuron (CME 134) residues apples and process fractions, cabbage, pears and potatoes including processed fractions in 1987. Huntingdon Analytical Services, Middleport NY, United States of America. Unpublished
TZ-640-005
Schlueter H. 1985 b Investigations on the metabolism of CME 134 in spinach. Celamerck GmbH & Co. KG, Ingelheim, Germany Fed.Rep. Unpublished
TZ-620-004
Schlueter H. 1985 c Aerobic and anaerobic degradation of CME 134 in a sandy loam soil. Celamerck GmbH & Co. KG, Ingelheim, Germany Fed.Rep. Unpublished
TZ-640-003
Schlueter H. 1987 a 14C-CME 134 - Metabolism and kinetics in apple. Celamerck GmbH & Co. KG, Ingelheim, Germany Fed.Rep. Unpublished
TZ-640-004
Schlueter H. 1987 b 14C-CME 134 - Metabolism and kinetics in potato plants. Shell Agrar GmbH & Co. KG, Ingelheim, Germany Fed.Rep. Unpublished
TZ-640-006
Schlueter H. 1989 a CME 134 (anilin ring-U-14C) - Confined accumulation study on rotational crops Shell Forschung GmbH, Ingelheim, Germany Fed.Rep. Unpublished
TZ-640-008
Schlueter H. 1995 a Teflubenzuron (CME 134) [benzoyl ring 14C]: Confined accumulation study on rotational crops. Cyanamid Forschung GmbH, Schwabenheim, Germany Fed.Rep. Unpublished
2010/1093285
Schoop T. 2010 a Teflubenzuron: Independent laboratory validation (ILV) of an analytical method for the determination of Teflubenzuron in/on cherry tomato. Harlan Laboratories Ltd., Itingen, Switzerland. Unpublished
2015/7006385
Stanislowski T. and Richter S.
2015 a Independent laboratory validation (ILV) of a method for the determination of Teflubenzuron in various foodstuffs of animal origin using LC-MS/MS. PTRL Europe, Ulm, Germany Fed.Rep. Unpublished
1998/1007441 Steling C. 1998 a Determination of CL 291898 residues in tomato pulp samples from Chile.

Teflubenzuron
2393
Code Author Year Title LAADL - Laboratorio de Desenvolvimento de Produtos Agricolas da America
Latina, Rio de Janeiro, Brazil. Unpublished 1998/1007438
Steling C. 1998 e Determination of CL 291898 (Teflubenzuron) residues in corn samples from Brazil. LAADL - Laboratorio de Desenvolvimento de Produtos Agricolas da America Latina, Rio de Janeiro, Brazil. Unpublished
1998/1007437
Steling C. 1998 f Determination of CL 291898 (Teflubenzuron) in corn samples from Brazil. LAADL - Laboratorio de Desenvolvimento de Produtos Agricolas da America Latina, Rio de Janeiro, Brazil. Unpublished
TZ-790-004
Steling C. 1998 g CL 291, 898: Determination of CL 291, 898 (Teflubenzuron) in coffee samples from Brazil. LAADL - Latin America Agricultural Development Laboratory, Rio de Janeiro, Brazil. Unpublished
TZ-326-004
Thorstenson J.H.
1990 a Determination of frozen storage stability of CME-134 in various crops. IRDC - International Research and Development Corp., Mattawan MI, United States of America. Unpublished
TZ-308-001
Van Helvoirt J.A.M.W.
1988 b Determination of the density of CME 134. RCC Notox BV, s-Hertogenbosch, Netherlands. Unpublished
TZ-720-004
Weitzel R. 1991 e Teflubenzuron: Residues of CME 134 in soyabeans grown in Brazil in 1989 after application of a diluted suspension cocentrate Nomolt 150 SC. Shell Forschung GmbH, Schwabenheim, Germany Fed.Rep. Unpublished