Embed Size (px)
Citation preview
TEKLA LIFE SCIENCES INVESTORS
Semiannual ReportMarch 31, 2017
(Unaudited)
Merrill Corp - Tekla Life Sciences Investors Semi-Annual Report [Funds] 811-06565 03-31-2017 ED [AUX] | thunt | 23-May-17 11:00 | 17-11960-1.aa | Sequence: 1CHKSUM Content: 37040 Layout: 30120 Graphics: 38605 CLEAN
JOB: 17-11960-1 CYCLE#;BL#: 9; 0 TRIM: 5.375" x 8.375" COMPOSITECOLORS: Black, PANTONE 342 U, ~note-color 2 GRAPHICS: dna_pms342_logo.eps, flask_pms342_logo.eps, microscop_pms342_logo.eps V1.5
TEKLA LIFE SCIENCES INVESTORS Distribution policy: The Fund has implemented a managed distribution policy (the Policy) thatprovides for quarterly distributions at a rate set by the Board of Trustees. Under the current Policy,the Fund intends to make quarterly distributions at a rate of 2% of the Fund’s net assets to share-holders of record. The Policy would result in a return of capital to shareholders if the amount ofthe distribution exceeds the Fund’s net investment income and realized capital gains. A return ofcapital may occur, for example, when some or all of the money that you invested in the Fund ispaid back to you. A return of capital distribution does not necessarily reflect the Fund’s investmentperformance and should not be confused with “yield” or “income.”
The amounts and sources of distributions reported in the Fund’s notices pursuant to Section 19(a) ofthe Investment Company Act of 1940 are only estimates and are not being provided for tax report-ing purposes. The actual amounts and sources of the amounts for tax reporting purposes will de-pend upon the Fund’s investment experience during its fiscal year and may be subject to changesbased on tax regulations. The Fund will send you a Form 1099-DIV for the calendar year that tellsyou how to report distributions for federal income tax purposes.
You should not draw any conclusions about the Fund’s investment performance from the amountof distributions pursuant to the Policy or from the terms of the Policy. The Policy has been estab-lished by the Trustees and may be changed or terminated by them without shareholder approval.The Trustees regularly review the Policy and the frequency and rate of distributions consideringthe purpose and effect of the Policy, the financial market environment, and the Fund’s income,capital gains and capital available to pay distributions. The suspension or termination of the Policycould have the effect of creating a trading discount or widening an existing trading discount. Atthis time there are no reasonably foreseeable circumstances that might cause the Trustees to ter-minate the Policy.
Consider these risks before investing: As with any investment company that invests in equitysecurities, the Fund is subject to market risk—the possibility that the prices of equity securities willdecline over short or extended periods of time. As a result, the value of an investment in theFund’s shares will fluctuate with the market generally and market sectors in particular. You couldlose money over short or long periods of time. Political and economic news can influence market-wide trends and can cause disruptions in the U.S. or world financial markets. Other factors may beignored by the market as a whole but may cause movements in the price of one company’s stockor the stock of companies in one or more industries. All of these factors may have a greater impacton initial public offerings and emerging company shares. Different types of equity securities tendto shift into and out of favor with investors, depending on market and economic conditions. Theperformance of funds that invest in equity securities of Healthcare Companies may at times bebetter or worse than the performance of funds that focus on other types of securities or that havea broader investment style.
Merrill Corp - Tekla Life Sciences Investors Semi-Annual Report [Funds] 811-06565 03-31-2017 ED [AUX] | thunt | 23-May-17 11:00 | 17-11960-1.aa | Sequence: 2CHKSUM Content: 35995 Layout: 40741 Graphics: No Graphics CLEAN
JOB: 17-11960-1 CYCLE#;BL#: 9; 0 TRIM: 5.375" x 8.375" COMPOSITECOLORS: Black, PANTONE 342 U, ~note-color 2 GRAPHICS: none V1.5
TEKLA LIFE SCIENCES INVESTORS
Dear Shareholders,
Dating back to the early 1980’s, many of us in the drug developmentworld have felt that we have been in the midst of a revolution in thediscovery, development and use of a new generation of medicinalproducts. It had only been in the 1970s that key cloning and similartechniques were developed that allowed the subsequent creation ofbiological and antibody based products capable of dramatically changingthe nature of drug therapy. These new technologies were seen ashaving the potential to cure numerous diseases or improve the qualityand extent of life for many individuals with a myriad of diseases. Thisprophecy has come to pass. There are few who would say that theworld has not materially benefitted from biotechnology or genomictechnologies since their late twentieth century advent. Nearly everydrug discovery and development effort in academics, in government,and in the private sector uses and benefits from these technologies. Inthe last 30 or so years we have seen the creation of new medicaltherapies that have saved or extended lives and/or have turnedotherwise lethal conditions into manageable situations. This has beenmost obvious to us in the areas of cancer and rare diseases, but isevident in nearly every area of medicine.
Progress, however, has not always been smooth or straight upwards toinevitable success. The 80’s saw the development of many drugs whichreplaced proteins/enzymes that were deficient in patients with diseasessuch as diabetes or conditions such as anemia; but in this period, wealso experienced tough economic times which slowed progress. Thedevelopment of antibody based products, a remarkably effectiveapproach to drug development, became common after approval of thefirst such product in 1986. And the genomic age began. While there weremany other positive developments, the 90’s ended with just a handful ofprofitable biotech companies but also with the creation of a spate ofInitial Public Offerings (IPOs), that augured a new generation ofbiotech/pharma developments, many based on the promise of genomicsthat would further change the pace and nature of new medical productdevelopment. Some of these companies have gone on to do great things;others though were more speculative and were slow to reach theirpotential or did not get there at all. During this period of great success,the biotech industry also faced challenges. For example, the U.S. Presidentand the UK Prime Minister suggested in the 2000 timeframe that maybewe didn’t need traditional patent protection for novel inventions. Thishas been thought by some as being a cause of the 70% drawdown of the
1
Merrill Corp - Tekla Life Sciences Investors Semi-Annual Report [Funds] 811-06565 03-31-2017 ED [AUX] | bjasper | 23-May-17 14:18 | 17-11960-1.ba | Sequence: 1CHKSUM Content: 14870 Layout: 38364 Graphics: No Graphics CLEAN
JOB: 17-11960-1 CYCLE#;BL#: 10; 0 TRIM: 5.375" x 8.375" COMPOSITECOLORS: Black, PANTONE 342 U, ~note-color 2 GRAPHICS: none V1.5
biotech sector in the early part of the twenty-first century. The sectorrebounded a bit in the mid-2000s but was heartily challenged, as was theentire U.S. economy, by the Great Recession of the 2008-9 timeframe.
Since its 2009 nadir, the biotech and healthcare sectors have reboundedimpressively. Returns through mid-2015 were notable, with the biotechand healthcare sectors each substantively outperforming the broadS&P 500® Index* (“SPX”) as a host of new and novel products may cameto market. These successes spawned a second large group of IPOs thatfunded a wave of biotech and other healthcare companies poised todevelop new and notable products in the areas of immuno-oncology,orphan diseases, antibiotics, gene therapy, gene editing and a host ofother scientific areas.
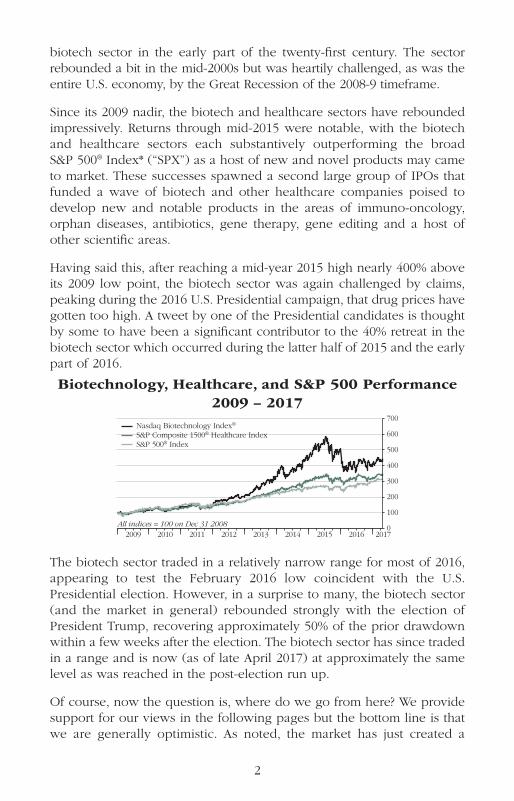
Having said this, after reaching a mid-year 2015 high nearly 400% aboveits 2009 low point, the biotech sector was again challenged by claims,peaking during the 2016 U.S. Presidential campaign, that drug prices havegotten too high. A tweet by one of the Presidential candidates is thoughtby some to have been a significant contributor to the 40% retreat in thebiotech sector which occurred during the latter half of 2015 and the earlypart of 2016.
Biotechnology, Healthcare, and S&P 500 Performance2009 – 2017
The biotech sector traded in a relatively narrow range for most of 2016,appearing to test the February 2016 low coincident with the U.S.Presidential election. However, in a surprise to many, the biotech sector(and the market in general) rebounded strongly with the election ofPresident Trump, recovering approximately 50% of the prior drawdownwithin a few weeks after the election. The biotech sector has since tradedin a range and is now (as of late April 2017) at approximately the samelevel as was reached in the post-election run up.
Of course, now the question is, where do we go from here? We providesupport for our views in the following pages but the bottom line is thatwe are generally optimistic. As noted, the market has just created a
700
500
400
600
300
200
100
02012201120102009 2013 2014 2016 20172015
Nasdaq Biotechnology Index®
S&P Composite 1500® Healthcare IndexS&P 500® Index
All indices = 100 on Dec 31 2008
2
Merrill Corp - Tekla Life Sciences Investors Semi-Annual Report [Funds] 811-06565 03-31-2017 ED [AUX] | bjasper | 23-May-17 14:18 | 17-11960-1.ba | Sequence: 2CHKSUM Content: 31111 Layout: 55635 Graphics: 17325 CLEAN
JOB: 17-11960-1 CYCLE#;BL#: 10; 0 TRIM: 5.375" x 8.375" COMPOSITECOLORS: Black, PANTONE 342 U, ~note-color 2 GRAPHICS: 11960-1_NBI_09_highlights_L.eps V1.5
generation of well funded new public companies with many interestingproducts in development. The existing profitable biotech companies aregrowing faster than the broad market and we expect them to continue todo so. The Food and Drug Administration (FDA) continues to approveproducts at a relative elevated rate and the new Administration speaks ofbeing business friendly. No less important, after the recent sector pullback,the profitable biotech sector is at a lower valuation than the broad market.Many things can change or unexpected problems can occur, especiallyin the short term. But, given our emphasis on fundamentals, we leantowards optimism in our view of the future.
As always, we thank you for your consideration of the Tekla Funds. Pleasecall our investor support services agent Destra Capital or us if you haveany questions.
Be well,
Daniel R. Omstead. Ph.D.President and Portfolio Manager
3
Merrill Corp - Tekla Life Sciences Investors Semi-Annual Report [Funds] 811-06565 03-31-2017 ED [AUX] | bjasper | 23-May-17 14:18 | 17-11960-1.ba | Sequence: 3CHKSUM Content: 20956 Layout: 10219 Graphics: 31406 CLEAN
JOB: 17-11960-1 CYCLE#;BL#: 10; 0 TRIM: 5.375" x 8.375" COMPOSITECOLORS: Black, PANTONE 342 U, ~note-color 2 GRAPHICS: Daniel_Omstead_k_New.eps, daniel_r_omstead_pms342_sig.eps V1.5
Perspective on the Biotechnology and Healthcare Sectors
Since President Trump’s election, there has been a rebound in both thebroad market and the biotech and healthcare sectors after a significantdownturn in late 2015 and early 2016. In fact, as of late April 2017, thebiotech sector has regained approximately 50% of the decline seen inthe first two months of 2016.
The question now is what to think about the biotech and healthcaresectors going forward? Will we see continued politicization of healthcarewith a focus on drug pricing and uncertainty about how/whether torepeal/replace Obamacare? Or will we see reduced rhetoric and a focuson the fundamentals of the sector? Is there an opportunity to see thesector move forward or will continued uncertainty hold the sector back?In order to come to a conclusion, we take into consideration the followingfundamentals.
We note that healthcare spending, both in the U.S. and throughout theOrganisation for Economic Co-operation and Development (OECD)countries, continues to grow as a percentage of the Gross DomesticProduct (GDP). We also note that healthcare represents a significantportion of the broad SPX. One cannot exclude the possibility that otherfactors will dominate the markets, but we are generally optimistic aboutthe intermediate and long term future of healthcare in general and biotechin particular.
4
Merrill Corp - Tekla Life Sciences Investors Semi-Annual Report [Funds] 811-06565 03-31-2017 ED [AUX] | bjasper | 23-May-17 14:18 | 17-11960-1.ba | Sequence: 4CHKSUM Content: 53986 Layout: 40253 Graphics: No Graphics CLEAN
JOB: 17-11960-1 CYCLE#;BL#: 10; 0 TRIM: 5.375" x 8.375" COMPOSITECOLORS: Black, ~note-color 2 GRAPHICS: none V1.5
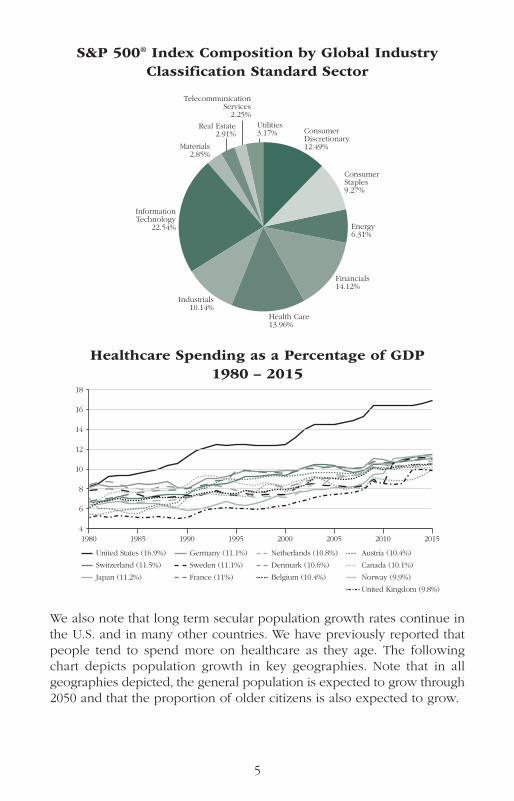
S&P 500® Index Composition by Global IndustryClassification Standard Sector
Healthcare Spending as a Percentage of GDP1980 – 2015
We also note that long term secular population growth rates continue inthe U.S. and in many other countries. We have previously reported thatpeople tend to spend more on healthcare as they age. The followingchart depicts population growth in key geographies. Note that in allgeographies depicted, the general population is expected to grow through2050 and that the proportion of older citizens is also expected to grow.
1980 1985 1990 20151995 2000 2005 2010
United States (16.9%)
Switzerland (11.5%)
Japan (11.2%)
Germany (11.1%)
Sweden (11.1%)
France (11%)
Denmark (10.6%)
Belgium (10.4%)
Netherlands (10.8%) Austria (10.4%)
Canada (10.1%)
Norway (9.9%)
United Kingdom (9.8%)
4
6
8
12
10
14
16
18
ConsumerDiscretionary12.49%
Utilities3.17%
ConsumerStaples9.27%
Energy6.31%
Financials14.12%
Health Care13.96%
Industrials10.14%
InformationTechnology
22.54%
Materials2.85%
Real Estate2.91%
TelecommunicationServices
2.25%
5
Merrill Corp - Tekla Life Sciences Investors Semi-Annual Report [Funds] 811-06565 03-31-2017 ED [AUX] | bjasper | 23-May-17 14:18 | 17-11960-1.ba | Sequence: 5CHKSUM Content: 4749 Layout: 44360 Graphics: 59558 CLEAN
JOB: 17-11960-1 CYCLE#;BL#: 10; 0 TRIM: 5.375" x 8.375" COMPOSITECOLORS: Black, PANTONE 342 U, ~note-color 2 GRAPHICS: 11960-1_SP500_comp_P.eps, 11960-1_spending_L.eps V1.5
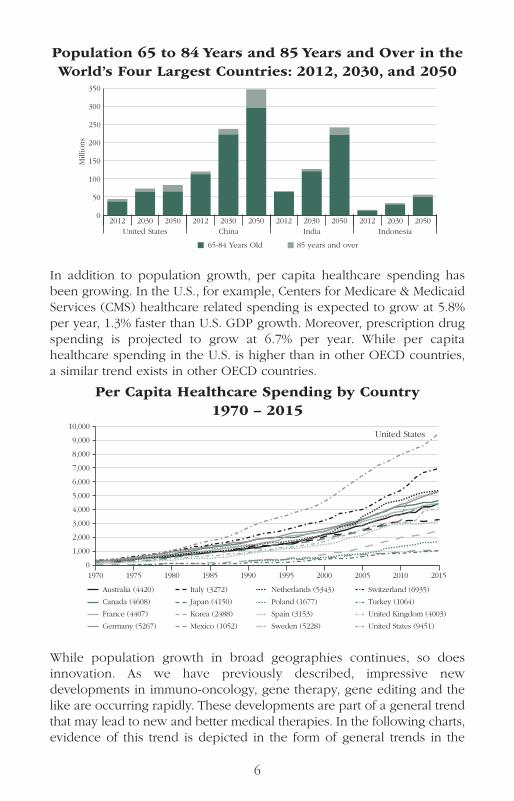
Population 65 to 84 Years and 85 Years and Over in theWorld’s Four Largest Countries: 2012, 2030, and 2050
In addition to population growth, per capita healthcare spending hasbeen growing. In the U.S., for example, Centers for Medicare & MedicaidServices (CMS) healthcare related spending is expected to grow at 5.8%per year, 1.3% faster than U.S. GDP growth. Moreover, prescription drugspending is projected to grow at 6.7% per year. While per capitahealthcare spending in the U.S. is higher than in other OECD countries,a similar trend exists in other OECD countries.
Per Capita Healthcare Spending by Country1970 – 2015
While population growth in broad geographies continues, so doesinnovation. As we have previously described, impressive newdevelopments in immuno-oncology, gene therapy, gene editing and thelike are occurring rapidly. These developments are part of a general trendthat may lead to new and better medical therapies. In the following charts,evidence of this trend is depicted in the form of general trends in the
1970 1975 1980 1985 1990 20151995 2000 2005 2010
Australia (4420)
Canada (4608)
France (4407)
Germany (5267)
Italy (3272)
Japan (4150)
Mexico (1052)
Korea (2488)
Netherlands (5343)
Poland (1677)
Spain (3153)
Sweden (5228)
Switzerland (6935)
Turkey (1064)
United Kingdom (4003)
United States (9451)
0
1,000
2,000
4,000
3,000
5,000
6,000
7,000
8,000
9,000
10,000United States
0
50
100
150
200
300
250
350M
illio
ns
United States China India Indonesia2012 2030 2050 2012 2030 2050 2012 2030 2050 2012 2030 2050
65-84 Years Old 85 years and over
6
Merrill Corp - Tekla Life Sciences Investors Semi-Annual Report [Funds] 811-06565 03-31-2017 ED [AUX] | bjasper | 23-May-17 14:18 | 17-11960-1.ba | Sequence: 6CHKSUM Content: 24641 Layout: 60686 Graphics: 16594 CLEAN
JOB: 17-11960-1 CYCLE#;BL#: 10; 0 TRIM: 5.375" x 8.375" COMPOSITECOLORS: Black, PANTONE 342 U, ~note-color 2 GRAPHICS: 11960-1_OECD_spend_L.eps, 11960-1_population_B.eps V1.5
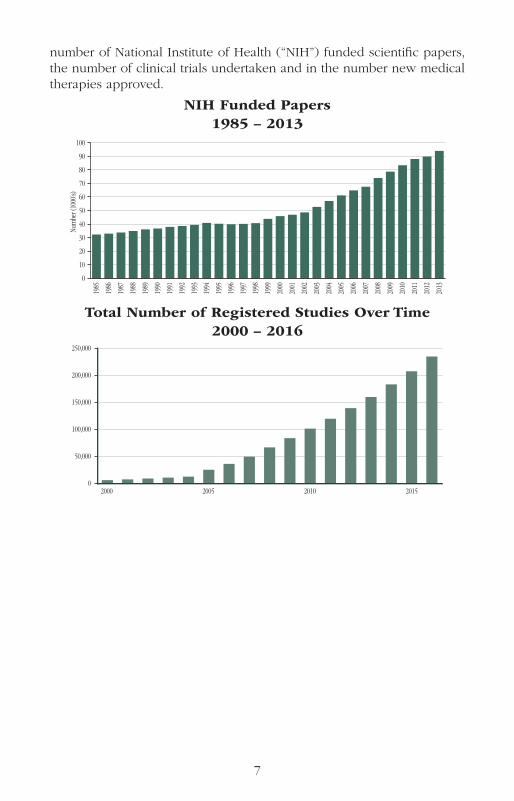
number of National Institute of Health (“NIH”) funded scientific papers,the number of clinical trials undertaken and in the number new medicaltherapies approved.
NIH Funded Papers1985 – 2013
Total Number of Registered Studies Over Time2000 – 2016
20000
50,000
100,000
150,000
200,000
250,000
2005 2010 2015
0
10
20
30
40
50
60
70
80
90
100
1985
Num
ber (
1000
’s)
1986
1987
1988
1989
1990
1991
1992
1993
1994
1995
1996
1997
1998
1999
2000
2001
2002
2003
2004
2005
2006
2007
2008
2009
2010
2011
2012
2013
7
Merrill Corp - Tekla Life Sciences Investors Semi-Annual Report [Funds] 811-06565 03-31-2017 ED [AUX] | bjasper | 23-May-17 14:18 | 17-11960-1.ba | Sequence: 7CHKSUM Content: 37964 Layout: 53632 Graphics: 60953 CLEAN
JOB: 17-11960-1 CYCLE#;BL#: 10; 0 TRIM: 5.375" x 8.375" COMPOSITECOLORS: Black, PANTONE 342 U, ~note-color 2 GRAPHICS: 11960-1_papers_B.eps, 11960-1_reg_studies_B.eps V1.5
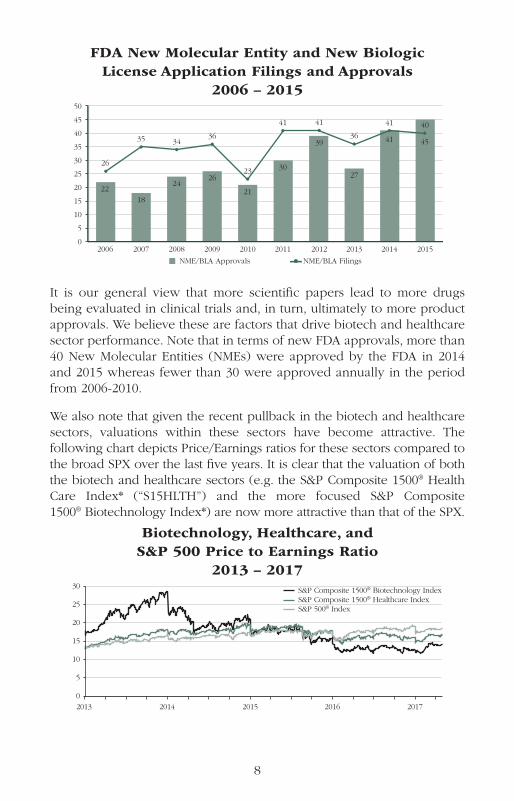
FDA New Molecular Entity and New Biologic License Application Filings and Approvals
2006 – 2015
It is our general view that more scientific papers lead to more drugsbeing evaluated in clinical trials and, in turn, ultimately to more productapprovals. We believe these are factors that drive biotech and healthcaresector performance. Note that in terms of new FDA approvals, more than40 New Molecular Entities (NMEs) were approved by the FDA in 2014and 2015 whereas fewer than 30 were approved annually in the periodfrom 2006-2010.
We also note that given the recent pullback in the biotech and healthcaresectors, valuations within these sectors have become attractive. Thefollowing chart depicts Price/Earnings ratios for these sectors compared tothe broad SPX over the last five years. It is clear that the valuation of boththe biotech and healthcare sectors (e.g. the S&P Composite 1500® HealthCare Index* (“S15HLTH”) and the more focused S&P Composite1500® Biotechnology Index*) are now more attractive than that of the SPX.
Biotechnology, Healthcare, and S&P 500 Price to Earnings Ratio
2013 – 201730
25
20
15
10
5
0
2013 2014 2016 20172015
S&P Composite 1500® Biotechnology IndexS&P Composite 1500® Healthcare IndexS&P 500® Index
0
5
10
15
20
25
30
35
40
45
50
2006 2007 2008 2009 2010 2011 2012 2013 2014 2015
NME/BLA Approvals NME/BLA Filings
22
26
18
2426
21
30
39
27
41 4535 3436
23
41 41
36
41 40
8
Merrill Corp - Tekla Life Sciences Investors Semi-Annual Report [Funds] 811-06565 03-31-2017 ED [AUX] | bjasper | 23-May-17 14:18 | 17-11960-1.ba | Sequence: 8CHKSUM Content: 15077 Layout: 16780 Graphics: 30214 CLEAN
JOB: 17-11960-1 CYCLE#;BL#: 10; 0 TRIM: 5.375" x 8.375" COMPOSITECOLORS: Black, PANTONE 342 U, ~note-color 2, ~watermark GRAPHICS: 11960-1_NME_BLA_B.eps, 11960-1_PE_Ratio_L.eps V1.5
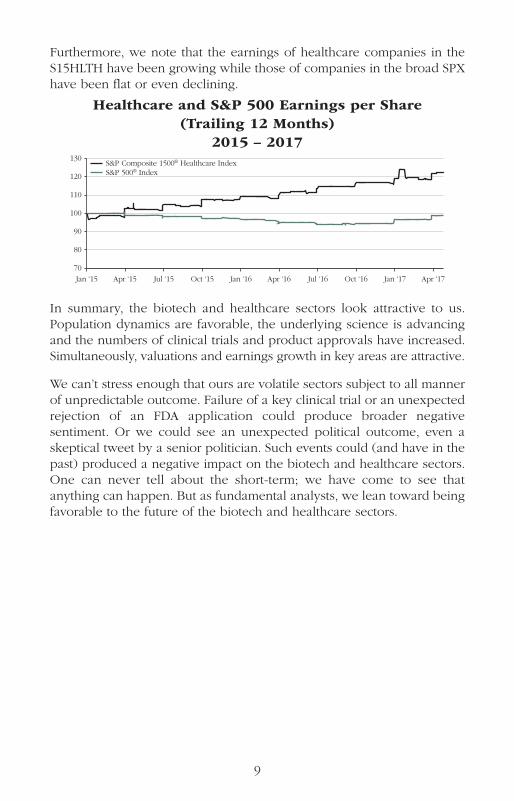
Furthermore, we note that the earnings of healthcare companies in theS15HLTH have been growing while those of companies in the broad SPXhave been flat or even declining.
Healthcare and S&P 500 Earnings per Share (Trailing 12 Months)
2015 – 2017
In summary, the biotech and healthcare sectors look attractive to us.Population dynamics are favorable, the underlying science is advancingand the numbers of clinical trials and product approvals have increased.Simultaneously, valuations and earnings growth in key areas are attractive.
We can’t stress enough that ours are volatile sectors subject to all mannerof unpredictable outcome. Failure of a key clinical trial or an unexpectedrejection of an FDA application could produce broader negativesentiment. Or we could see an unexpected political outcome, even askeptical tweet by a senior politician. Such events could (and have in thepast) produced a negative impact on the biotech and healthcare sectors.One can never tell about the short-term; we have come to see thatanything can happen. But as fundamental analysts, we lean toward beingfavorable to the future of the biotech and healthcare sectors.
130
120
110
100
90
80
70
Jan ‘15 Apr ‘15 Jan ‘16 Apr ‘16 Jul ‘16 Oct ‘16 Jan ‘17 Apr ‘17Jul ‘15 Oct ‘15
S&P Composite 1500® Healthcare IndexS&P 500® Index
9
Merrill Corp - Tekla Life Sciences Investors Semi-Annual Report [Funds] 811-06565 03-31-2017 ED [AUX] | bjasper | 23-May-17 14:18 | 17-11960-1.ba | Sequence: 9CHKSUM Content: 13015 Layout: 40068 Graphics: 11731 CLEAN
JOB: 17-11960-1 CYCLE#;BL#: 10; 0 TRIM: 5.375" x 8.375" COMPOSITECOLORS: Black, PANTONE 342 U, ~note-color 2 GRAPHICS: 11960-1_Index_Earn_L.eps V1.5
TEKLA LIFE SCIENCES INVESTORS
10
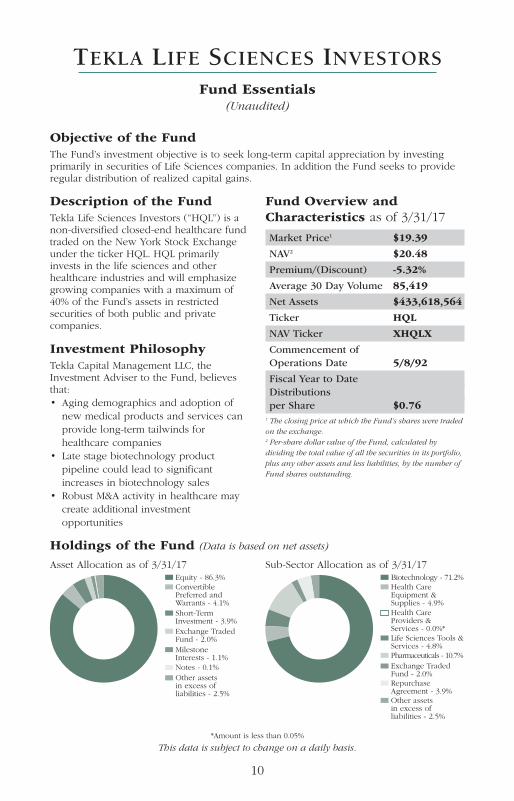
Description of the FundTekla Life Sciences Investors (“HQL”) is anon-diversified closed-end healthcare fundtraded on the New York Stock Exchangeunder the ticker HQL. HQL primarilyinvests in the life sciences and otherhealthcare industries and will emphasizegrowing companies with a maximum of40% of the Fund’s assets in restrictedsecurities of both public and privatecompanies.
Investment PhilosophyTekla Capital Management LLC, theInvestment Adviser to the Fund, believesthat:• Aging demographics and adoption of
new medical products and services canprovide long-term tailwinds forhealthcare companies
• Late stage biotechnology productpipeline could lead to significantincreases in biotechnology sales
• Robust M&A activity in healthcare maycreate additional investmentopportunities
Fund Overview andCharacteristics as of 3/31/17
Market Price1 $19.39
NAV2 $20.48
Premium/(Discount) -5.32%
Average 30 Day Volume 85,419
Net Assets $433,618,564
Ticker HQL
NAV Ticker XHQLX
Commencement ofOperations Date 5/8/92
Fiscal Year to DateDistributionsper Share $0.76
1 The closing price at which the Fund’s shares were tradedon the exchange.2 Per-share dollar value of the Fund, calculated bydividing the total value of all the securities in its portfolio,plus any other assets and less liabilities, by the number ofFund shares outstanding.
Holdings of the Fund (Data is based on net assets)
Asset Allocation as of 3/31/17 Sub-Sector Allocation as of 3/31/17Equity - 86.3%ConvertiblePreferred andWarrants - 4.1%Short-TermInvestment - 3.9%Exchange TradedFund - 2.0%
Notes - 0.1%Other assetsin excess ofliabilities - 2.5%
MilestoneInterests - 1.1%
Biotechnology - 71.2%Health CareEquipment &Supplies - 4.9%Health CareProviders &Services - 0.0%*Life Sciences Tools &Services - 4.8%Pharmaceuticals - 10.7%Exchange TradedFund - 2.0%RepurchaseAgreement - 3.9%Other assetsin excess ofliabilities - 2.5%
*Amount is less than 0.05%
This data is subject to change on a daily basis.
Fund Essentials(Unaudited)
Objective of the FundThe Fund’s investment objective is to seek long-term capital appreciation by investingprimarily in securities of Life Sciences companies. In addition the Fund seeks to provideregular distribution of realized capital gains.
Merrill Corp - Tekla Life Sciences Investors Semi-Annual Report [Funds] 811-06565 03-31-2017 ED [AUX] | bjasper | 23-May-17 14:18 | 17-11960-1.ba | Sequence: 10CHKSUM Content: 22799 Layout: 47800 Graphics: 51817 CLEAN
JOB: 17-11960-1 CYCLE#;BL#: 10; 0 TRIM: 5.375" x 8.375" COMPOSITECOLORS: Black, PANTONE 342 U, ~note-color 2 GRAPHICS: 11960-1 ast allo_P.eps, 11960-1 sub sect allo_P.eps V1.5
TEKLA LIFE SCIENCES INVESTORS
Largest Holdings by Issuer(Excludes Short-Term Investments)
As of March 31, 2017(Unaudited)
% of NetIssuer – Sector Assets Biogen Inc. – Biotechnology 7.4%Gilead Sciences, Inc. – Biotechnology 6.9%Celgene Corporation – Biotechnology 6.9%Amgen Inc. – Biotechnology 6.8%Incyte Corporation – Biotechnology 6.0%Regeneron Pharmaceuticals, Inc. – Biotechnology 4.9%Vertex Pharmaceuticals Incorporated – Biotechnology 4.8%Alexion Pharmaceuticals, Inc. – Biotechnology 4.5%Illumina, Inc. – Life Sciences Tools & Services 2.9%BioMarin Pharmaceutical Inc. – Biotechnology 2.9%IDEXX Laboratories, Inc. – Health Care Equipment & Supplies 2.0%SPDR S&P Biotech ETF – Exchange Traded Funds 1.9%Jazz Pharmaceuticals plc – Pharmaceuticals 1.9%Galapagos NV – Biotechnology 1.6%Mylan NV – Pharmaceuticals 1.6%Neurocrine Biosciences, Inc. – Biotechnology 1.6%Global Blood Therapeutics, Inc. – Biotechnology 1.5%Veniti, Inc. – Health Care Equipment & Supplies 1.3%Akorn, Inc. – Pharmaceuticals 1.3%Ardelyx, Inc. – Biotechnology 0.9%
Fund Performance
HQL is a closed-end fund which invests predominantly in life sciencecompanies. Subject to regular consideration, the Trustees of HQL haveinstituted a policy of making quarterly distributions to shareholders. TheFund seeks to make such distributions in the form of long-term capitalgains.
The Fund considers investments in companies of all sizes and in all lifescience subsectors, including but not limited to, biotechnology,pharmaceuticals, healthcare equipment, healthcare supplies, life sciencetools and services, healthcare distributors, managed healthcare, healthcaretechnology, and healthcare facilities. The Fund emphasizes innovation,investing both in public and pre-public venture companies. The Fundconsiders its venture investments to be a differentiating characteristic.Among the various healthcare subsectors, HQL has considered the
11
Merrill Corp - Tekla Life Sciences Investors Semi-Annual Report [Funds] 811-06565 03-31-2017 ED [AUX] | bjasper | 23-May-17 14:18 | 17-11960-1.ba | Sequence: 11CHKSUM Content: 51414 Layout: 41318 Graphics: No Graphics CLEAN
JOB: 17-11960-1 CYCLE#;BL#: 10; 0 TRIM: 5.375" x 8.375" COMPOSITECOLORS: Black, PANTONE 342 U, ~note-color 2 GRAPHICS: none V1.5
biotechnology subsector, including both pre-public and public companies,to be a key contributor to the healthcare sector. The Fund holds biotechassets, including both public and pre-public, often representing 65-75%of net assets.
There is no commonly published index which matches the investmentstrategy of HQL. The S15HLTH consists of more than 160 companiesrepresenting most or all of the healthcare subsectors in which HQLtypically invests; biotechnology often represents 15-20% of this index. Bycontrast, the NASDAQ Biotechnology Index®* (“NBI”), which containsapproximately 180 securities, is much more narrowly constructed. Thevast majority of this index is comprised of biotechnology, pharmaceuticaland life science tools companies. In recent years, biotechnology has oftenrepresented 72-82% of the NBI. Neither the S15HLTH nor NBI indicescontain any material amount of pre-public company assets.
We present both NAV and stock returns for the Fund in comparison toseveral commonly published indices. One index, the SPX is a commonlyconsidered broad based index; this index is broadly comprised ofcompanies in many areas of the economy, including, but not limited tohealthcare. As described above, the NBI is a healthcare index mostlyfocused in three healthcare sectors with a uniquely high level ofbiotechnology comparison. The S15HLTH contains a wider representationof healthcare subsectors, but typically contains a much lowerbiotechnology composition.
HQL generally invests in a combination of large cap growth-oriented andearlier stage innovative healthcare companies with a focus on thebiotechnology sector. Generally, HQL targets biotechnology exposurebelow that of the NBI. HQL generally targets a higher biotechnologyexposure than does the S15HLTH. We note that in recent periods,biotechnology has been a significant contributor to returns (both positiveand negative) associated with those indices. We believe this sectorcontinues to still have significant potential for growth in the future.
Fund Performance for the Period Ended March 31, 2017
Period HQL NAV HQL MKT NBI S15HLTH SPX
6 month 6.77 7.94 1.63 4.34 10.121 year 23.46 19.76 13.04 12.22 17.165 year 16.86 17.03 19.54 16.92 13.2910 year 12.92 12.69 15.18 10.70 7.51
12
Merrill Corp - Tekla Life Sciences Investors Semi-Annual Report [Funds] 811-06565 03-31-2017 ED [AUX] | bjasper | 23-May-17 14:18 | 17-11960-1.ba | Sequence: 12CHKSUM Content: 2162 Layout: 62136 Graphics: No Graphics CLEAN
JOB: 17-11960-1 CYCLE#;BL#: 10; 0 TRIM: 5.375" x 8.375" COMPOSITECOLORS: Black, ~note-color 2 GRAPHICS: none V1.5
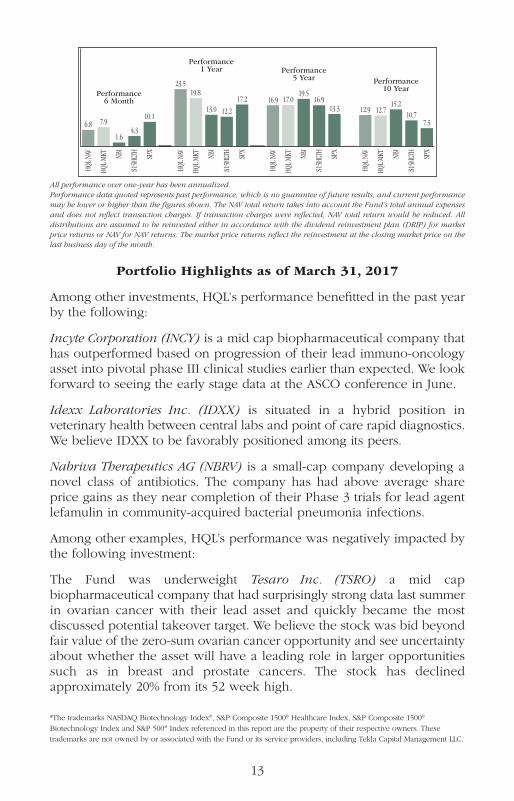
All performance over one-year has been annualized.Performance data quoted represents past performance, which is no guarantee of future results, and current performancemay be lower or higher than the figures shown. The NAV total return takes into account the Fund’s total annual expensesand does not reflect transaction charges. If transaction charges were reflected, NAV total return would be reduced. Alldistributions are assumed to be reinvested either in accordance with the dividend reinvestment plan (DRIP) for marketprice returns or NAV for NAV returns. The market price returns reflect the reinvestment at the closing market price on thelast business day of the month.
Portfolio Highlights as of March 31, 2017
Among other investments, HQL’s performance benefitted in the past yearby the following:
Incyte Corporation (INCY) is a mid cap biopharmaceutical company thathas outperformed based on progression of their lead immuno-oncologyasset into pivotal phase III clinical studies earlier than expected. We lookforward to seeing the early stage data at the ASCO conference in June.
Idexx Laboratories Inc. (IDXX) is situated in a hybrid position inveterinary health between central labs and point of care rapid diagnostics.We believe IDXX to be favorably positioned among its peers.
Nabriva Therapeutics AG (NBRV) is a small-cap company developing anovel class of antibiotics. The company has had above average shareprice gains as they near completion of their Phase 3 trials for lead agentlefamulin in community-acquired bacterial pneumonia infections.
Among other examples, HQL’s performance was negatively impacted bythe following investment:
The Fund was underweight Tesaro Inc. (TSRO) a mid capbiopharmaceutical company that had surprisingly strong data last summerin ovarian cancer with their lead asset and quickly became the mostdiscussed potential takeover target. We believe the stock was bid beyondfair value of the zero-sum ovarian cancer opportunity and see uncertaintyabout whether the asset will have a leading role in larger opportunitiessuch as in breast and prostate cancers. The stock has declinedapproximately 20% from its 52 week high.
6.8 7.9
1.6
Performance6 Month
4.3
10.1
23.519.8
13.0 12.2
17.2 16.9 17.019.5
16.913.3 12.9 12.7
15.210.7
7.5
Performance1 Year Performance
5 Year Performance10 Year
HQL N
AV
HQL M
KT NBI
S15H
LTH
SPX
HQL N
AV
HQL M
KT NBI
S15H
LTH
SPX
HQL N
AV
HQL M
KT NBI
S15H
LTH
SPX
HQL N
AV
HQL M
KT NBI
S15H
LTH
SPX
13
*The trademarks NASDAQ Biotechnology Index®, S&P Composite 1500® Healthcare Index, S&P Composite 1500®
Biotechnology Index and S&P 500® Index referenced in this report are the property of their respective owners. Thesetrademarks are not owned by or associated with the Fund or its service providers, including Tekla Capital Management LLC.
Merrill Corp - Tekla Life Sciences Investors Semi-Annual Report [Funds] 811-06565 03-31-2017 ED [AUX] | bjasper | 23-May-17 14:18 | 17-11960-1.ba | Sequence: 13CHKSUM Content: 19219 Layout: 20779 Graphics: 43898 CLEAN
JOB: 17-11960-1 CYCLE#;BL#: 10; 0 TRIM: 5.375" x 8.375" COMPOSITECOLORS: Black, PANTONE 342 U, ~note-color 2 GRAPHICS: 11960-1_fund_perf_B.eps V1.5
14
The accompanying notes are an integral part of these Financial Statements.
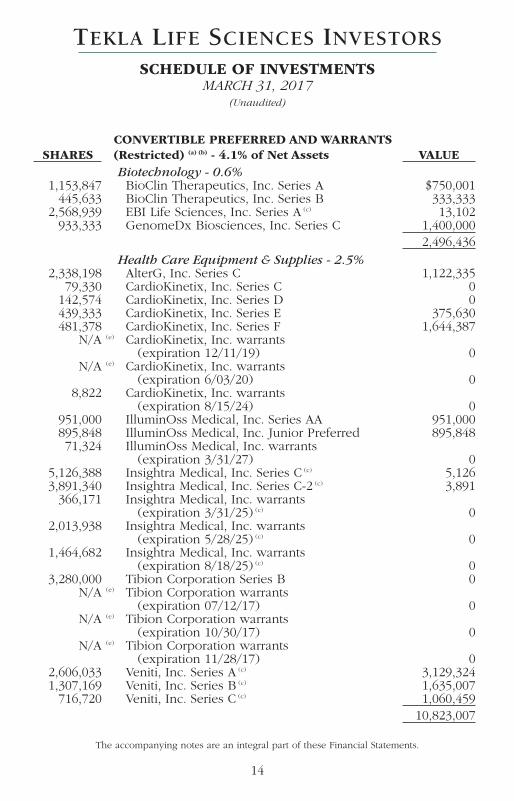
CONVERTIBLE PREFERRED AND WARRANTS SHARES (Restricted) (a) (b) - 4.1% of Net Assets VALUE Biotechnology - 0.6% 1,153,847 BioClin Therapeutics, Inc. Series A $750,001 445,633 BioClin Therapeutics, Inc. Series B 333,333 2,568,939 EBI Life Sciences, Inc. Series A (c) 13,102 933,333 GenomeDx Biosciences, Inc. Series C 1,400,000 2,496,436 Health Care Equipment & Supplies - 2.5% 2,338,198 AlterG, Inc. Series C 1,122,335 79,330 CardioKinetix, Inc. Series C 0 142,574 CardioKinetix, Inc. Series D 0 439,333 CardioKinetix, Inc. Series E 375,630 481,378 CardioKinetix, Inc. Series F 1,644,387 N/A (e) CardioKinetix, Inc. warrants
(expiration 12/11/19) 0 N/A (e) CardioKinetix, Inc. warrants
(expiration 6/03/20) 0 8,822 CardioKinetix, Inc. warrants
(expiration 8/15/24) 0 951,000 IlluminOss Medical, Inc. Series AA 951,000 895,848 IlluminOss Medical, Inc. Junior Preferred 895,848 71,324 IlluminOss Medical, Inc. warrants
(expiration 3/31/27) 0 5,126,388 Insightra Medical, Inc. Series C (c) 5,126 3,891,340 Insightra Medical, Inc. Series C-2 (c) 3,891 366,171 Insightra Medical, Inc. warrants
(expiration 3/31/25) (c) 0 2,013,938 Insightra Medical, Inc. warrants
(expiration 5/28/25) (c) 0 1,464,682 Insightra Medical, Inc. warrants
(expiration 8/18/25) (c) 0 3,280,000 Tibion Corporation Series B 0 N/A (e) Tibion Corporation warrants
(expiration 07/12/17) 0 N/A (e) Tibion Corporation warrants
(expiration 10/30/17) 0 N/A (e) Tibion Corporation warrants
(expiration 11/28/17) 0 2,606,033 Veniti, Inc. Series A (c) 3,129,324 1,307,169 Veniti, Inc. Series B (c) 1,635,007 716,720 Veniti, Inc. Series C (c) 1,060,459 10,823,007
TEKLA LIFE SCIENCES INVESTORS
SCHEDULE OF INVESTMENTSMARCH 31, 2017
(Unaudited)
Merrill Corp - Tekla Life Sciences Investors Semi-Annual Report [Funds] 811-06565 03-31-2017 ED [AUX] | thunt | 23-May-17 11:00 | 17-11960-1.ca | Sequence: 1CHKSUM Content: 50251 Layout: 41232 Graphics: No Graphics CLEAN
JOB: 17-11960-1 CYCLE#;BL#: 9; 0 TRIM: 5.375" x 8.375" COMPOSITECOLORS: Black, PANTONE 342 U, ~note-color 2 GRAPHICS: none V1.5
15
The accompanying notes are an integral part of these Financial Statements.
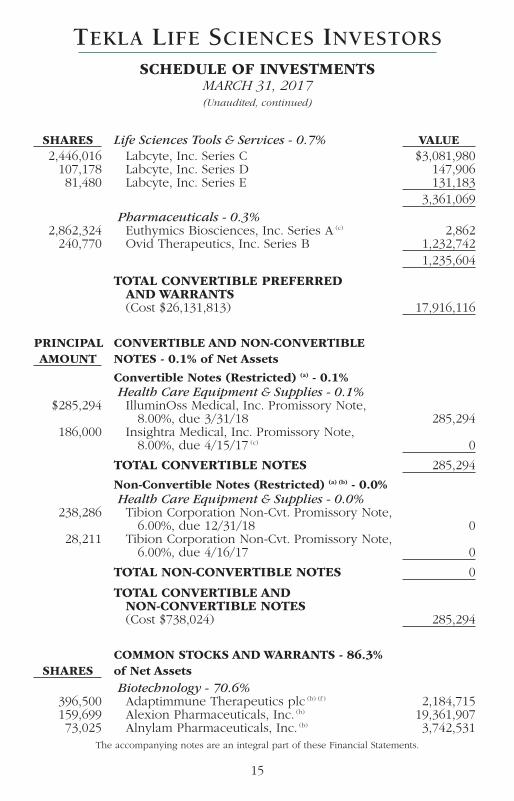
SHARES Life Sciences Tools & Services - 0.7% VALUE 2,446,016 Labcyte, Inc. Series C $3,081,980 107,178 Labcyte, Inc. Series D 147,906 81,480 Labcyte, Inc. Series E 131,183 3,361,069 Pharmaceuticals - 0.3% 2,862,324 Euthymics Biosciences, Inc. Series A (c) 2,862 240,770 Ovid Therapeutics, Inc. Series B 1,232,742 1,235,604
TOTAL CONVERTIBLE PREFERRED AND WARRANTS(Cost $26,131,813) 17,916,116
PRINCIPAL CONVERTIBLE AND NON-CONVERTIBLE AMOUNT NOTES - 0.1% of Net Assets
Convertible Notes (Restricted) (a) - 0.1% Health Care Equipment & Supplies - 0.1% $285,294 IlluminOss Medical, Inc. Promissory Note,
8.00%, due 3/31/18 285,294 186,000 Insightra Medical, Inc. Promissory Note,
8.00%, due 4/15/17 (c) 0
TOTAL CONVERTIBLE NOTES 285,294
Non-Convertible Notes (Restricted) (a) (b) - 0.0% Health Care Equipment & Supplies - 0.0% 238,286 Tibion Corporation Non-Cvt. Promissory Note,
6.00%, due 12/31/18 0 28,211 Tibion Corporation Non-Cvt. Promissory Note,
6.00%, due 4/16/17 0
TOTAL NON-CONVERTIBLE NOTES 0
TOTAL CONVERTIBLE AND NON-CONVERTIBLE NOTES(Cost $738,024) 285,294
COMMON STOCKS AND WARRANTS - 86.3% SHARES of Net Assets Biotechnology - 70.6% 396,500 Adaptimmune Therapeutics plc (b) (f ) 2,184,715 159,699 Alexion Pharmaceuticals, Inc. (b) 19,361,907 73,025 Alnylam Pharmaceuticals, Inc. (b) 3,742,531
TEKLA LIFE SCIENCES INVESTORS
SCHEDULE OF INVESTMENTSMARCH 31, 2017(Unaudited, continued)
Merrill Corp - Tekla Life Sciences Investors Semi-Annual Report [Funds] 811-06565 03-31-2017 ED [AUX] | thunt | 23-May-17 11:00 | 17-11960-1.ca | Sequence: 2CHKSUM Content: 24966 Layout: 32467 Graphics: No Graphics CLEAN
JOB: 17-11960-1 CYCLE#;BL#: 9; 0 TRIM: 5.375" x 8.375" COMPOSITECOLORS: Black, PANTONE 342 U, ~note-color 2 GRAPHICS: none V1.5
16
The accompanying notes are an integral part of these Financial Statements.
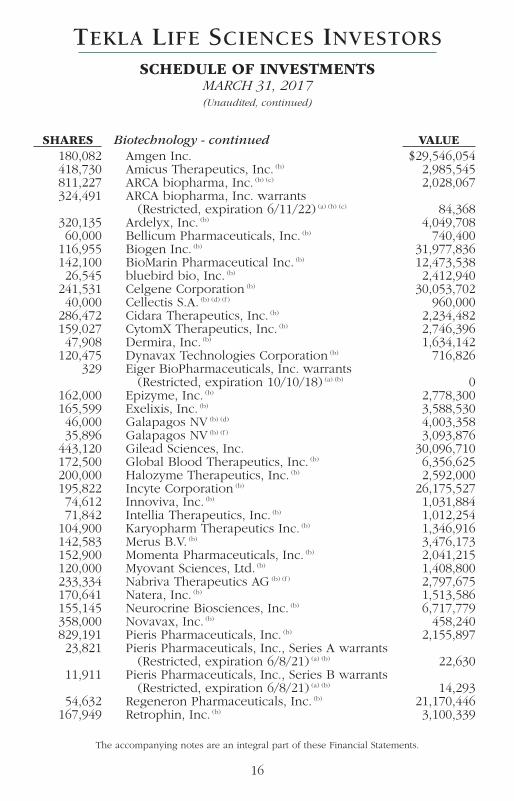
SHARES Biotechnology - continued VALUE 180,082 Amgen Inc. $29,546,054 418,730 Amicus Therapeutics, Inc. (b) 2,985,545 811,227 ARCA biopharma, Inc. (b) (c) 2,028,067 324,491 ARCA biopharma, Inc. warrants
(Restricted, expiration 6/11/22) (a) (b) (c) 84,368 320,135 Ardelyx, Inc. (b) 4,049,708 60,000 Bellicum Pharmaceuticals, Inc. (b) 740,400 116,955 Biogen Inc. (b) 31,977,836 142,100 BioMarin Pharmaceutical Inc. (b) 12,473,538 26,545 bluebird bio, Inc. (b) 2,412,940 241,531 Celgene Corporation (b) 30,053,702 40,000 Cellectis S.A. (b) (d) (f ) 960,000 286,472 Cidara Therapeutics, Inc. (b) 2,234,482 159,027 CytomX Therapeutics, Inc. (b) 2,746,396 47,908 Dermira, Inc. (b) 1,634,142 120,475 Dynavax Technologies Corporation (b) 716,826 329 Eiger BioPharmaceuticals, Inc. warrants
(Restricted, expiration 10/10/18) (a) (b) 0 162,000 Epizyme, Inc. (b) 2,778,300 165,599 Exelixis, Inc. (b) 3,588,530 46,000 Galapagos NV (b) (d) 4,003,358 35,896 Galapagos NV (b) (f ) 3,093,876 443,120 Gilead Sciences, Inc. 30,096,710 172,500 Global Blood Therapeutics, Inc. (b) 6,356,625 200,000 Halozyme Therapeutics, Inc. (b) 2,592,000 195,822 Incyte Corporation (b) 26,175,527 74,612 Innoviva, Inc. (b) 1,031,884 71,842 Intellia Therapeutics, Inc. (b) 1,012,254 104,900 Karyopharm Therapeutics Inc. (b) 1,346,916 142,583 Merus B.V. (b) 3,476,173 152,900 Momenta Pharmaceuticals, Inc. (b) 2,041,215 120,000 Myovant Sciences, Ltd. (b) 1,408,800 233,334 Nabriva Therapeutics AG (b) (f ) 2,797,675 170,641 Natera, Inc. (b) 1,513,586 155,145 Neurocrine Biosciences, Inc. (b) 6,717,779 358,000 Novavax, Inc. (b) 458,240 829,191 Pieris Pharmaceuticals, Inc. (b) 2,155,897 23,821 Pieris Pharmaceuticals, Inc., Series A warrants
(Restricted, expiration 6/8/21) (a) (b) 22,630 11,911 Pieris Pharmaceuticals, Inc., Series B warrants
(Restricted, expiration 6/8/21) (a) (b) 14,293 54,632 Regeneron Pharmaceuticals, Inc. (b) 21,170,446 167,949 Retrophin, Inc. (b) 3,100,339
TEKLA LIFE SCIENCES INVESTORS
SCHEDULE OF INVESTMENTSMARCH 31, 2017(Unaudited, continued)
Merrill Corp - Tekla Life Sciences Investors Semi-Annual Report [Funds] 811-06565 03-31-2017 ED [AUX] | thunt | 23-May-17 11:00 | 17-11960-1.ca | Sequence: 3CHKSUM Content: 25779 Layout: 7253 Graphics: No Graphics CLEAN
JOB: 17-11960-1 CYCLE#;BL#: 9; 0 TRIM: 5.375" x 8.375" COMPOSITECOLORS: Black, PANTONE 342 U, ~note-color 2 GRAPHICS: none V1.5
17
The accompanying notes are an integral part of these Financial Statements.
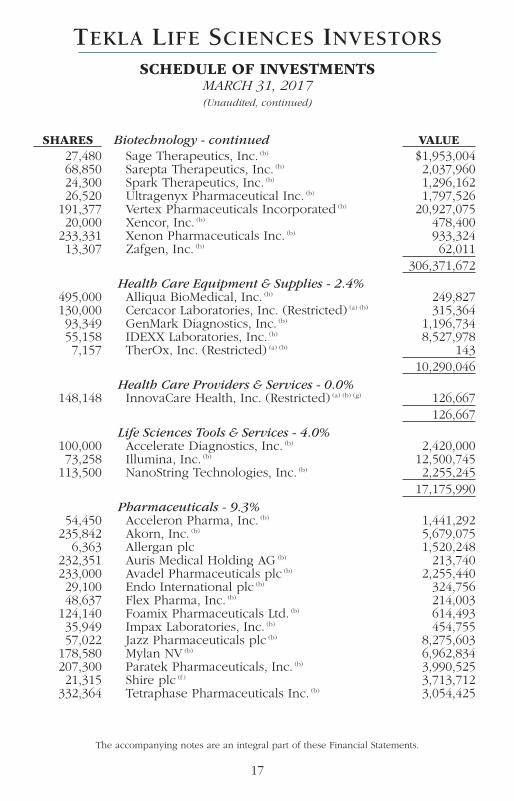
SHARES Biotechnology - continued VALUE 27,480 Sage Therapeutics, Inc. (b) $1,953,004 68,850 Sarepta Therapeutics, Inc. (b) 2,037,960 24,300 Spark Therapeutics, Inc. (b) 1,296,162 26,520 Ultragenyx Pharmaceutical Inc. (b) 1,797,526 191,377 Vertex Pharmaceuticals Incorporated (b) 20,927,075 20,000 Xencor, Inc. (b) 478,400 233,331 Xenon Pharmaceuticals Inc. (b) 933,324 13,307 Zafgen, Inc. (b) 62,011 306,371,672 Health Care Equipment & Supplies - 2.4% 495,000 Alliqua BioMedical, Inc. (b) 249,827 130,000 Cercacor Laboratories, Inc. (Restricted) (a) (b) 315,364 93,349 GenMark Diagnostics, Inc. (b) 1,196,734 55,158 IDEXX Laboratories, Inc. (b) 8,527,978 7,157 TherOx, Inc. (Restricted) (a) (b) 143 10,290,046 Health Care Providers & Services - 0.0% 148,148 InnovaCare Health, Inc. (Restricted) (a) (b) (g) 126,667 126,667 Life Sciences Tools & Services - 4.0% 100,000 Accelerate Diagnostics, Inc. (b) 2,420,000 73,258 Illumina, Inc. (b) 12,500,745 113,500 NanoString Technologies, Inc. (b) 2,255,245 17,175,990 Pharmaceuticals - 9.3% 54,450 Acceleron Pharma, Inc. (b) 1,441,292 235,842 Akorn, Inc. (b) 5,679,075 6,363 Allergan plc 1,520,248 232,351 Auris Medical Holding AG (b) 213,740 233,000 Avadel Pharmaceuticals plc (b) 2,255,440 29,100 Endo International plc (b) 324,756 48,637 Flex Pharma, Inc. (b) 214,003 124,140 Foamix Pharmaceuticals Ltd. (b) 614,493 35,949 Impax Laboratories, Inc. (b) 454,755 57,022 Jazz Pharmaceuticals plc (b) 8,275,603 178,580 Mylan NV (b) 6,962,834 207,300 Paratek Pharmaceuticals, Inc. (b) 3,990,525 21,315 Shire plc (f ) 3,713,712 332,364 Tetraphase Pharmaceuticals Inc. (b) 3,054,425
TEKLA LIFE SCIENCES INVESTORS
SCHEDULE OF INVESTMENTSMARCH 31, 2017(Unaudited, continued)
Merrill Corp - Tekla Life Sciences Investors Semi-Annual Report [Funds] 811-06565 03-31-2017 ED [AUX] | thunt | 23-May-17 11:00 | 17-11960-1.ca | Sequence: 4CHKSUM Content: 47527 Layout: 47394 Graphics: No Graphics CLEAN
JOB: 17-11960-1 CYCLE#;BL#: 9; 0 TRIM: 5.375" x 8.375" COMPOSITECOLORS: Black, PANTONE 342 U, ~note-color 2 GRAPHICS: none V1.5
18
The accompanying notes are an integral part of these Financial Statements.
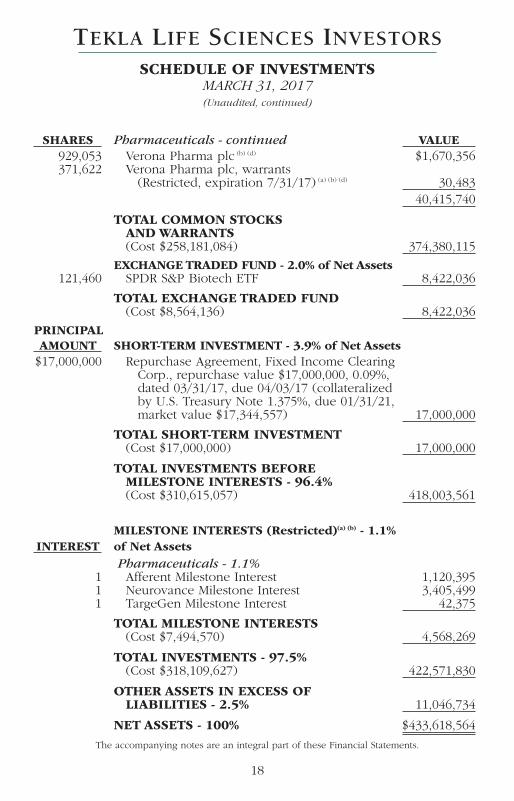
SHARES Pharmaceuticals - continued VALUE 929,053 Verona Pharma plc (b) (d) $1,670,356 371,622 Verona Pharma plc, warrants
(Restricted, expiration 7/31/17) (a) (b) (d) 30,483 40,415,740
TOTAL COMMON STOCKS AND WARRANTS(Cost $258,181,084) 374,380,115
EXCHANGE TRADED FUND - 2.0% of Net Assets 121,460 SPDR S&P Biotech ETF 8,422,036
TOTAL EXCHANGE TRADED FUND(Cost $8,564,136) 8,422,036
PRINCIPAL AMOUNT SHORT-TERM INVESTMENT - 3.9% of Net Assets $17,000,000 Repurchase Agreement, Fixed Income Clearing
Corp., repurchase value $17,000,000, 0.09%, dated 03/31/17, due 04/03/17 (collateralized by U.S. Treasury Note 1.375%, due 01/31/21, market value $17,344,557) 17,000,000
TOTAL SHORT-TERM INVESTMENT(Cost $17,000,000) 17,000,000
TOTAL INVESTMENTS BEFORE MILESTONE INTERESTS - 96.4%(Cost $310,615,057) 418,003,561
MILESTONE INTERESTS (Restricted)(a) (b) - 1.1% INTEREST of Net Assets Pharmaceuticals - 1.1% 1 Afferent Milestone Interest 1,120,395 1 Neurovance Milestone Interest 3,405,499 1 TargeGen Milestone Interest 42,375
TOTAL MILESTONE INTERESTS(Cost $7,494,570) 4,568,269
TOTAL INVESTMENTS - 97.5%(Cost $318,109,627) 422,571,830
OTHER ASSETS IN EXCESS OFLIABILITIES - 2.5% 11,046,734
NET ASSETS - 100% $433,618,564
TEKLA LIFE SCIENCES INVESTORS
SCHEDULE OF INVESTMENTSMARCH 31, 2017(Unaudited, continued)
Merrill Corp - Tekla Life Sciences Investors Semi-Annual Report [Funds] 811-06565 03-31-2017 ED [AUX] | thunt | 23-May-17 11:00 | 17-11960-1.ca | Sequence: 5CHKSUM Content: 17343 Layout: 57151 Graphics: No Graphics CLEAN
JOB: 17-11960-1 CYCLE#;BL#: 9; 0 TRIM: 5.375" x 8.375" COMPOSITECOLORS: Black, PANTONE 342 U, ~note-color 2 GRAPHICS: none V1.5
19
The accompanying notes are an integral part of these Financial Statements.
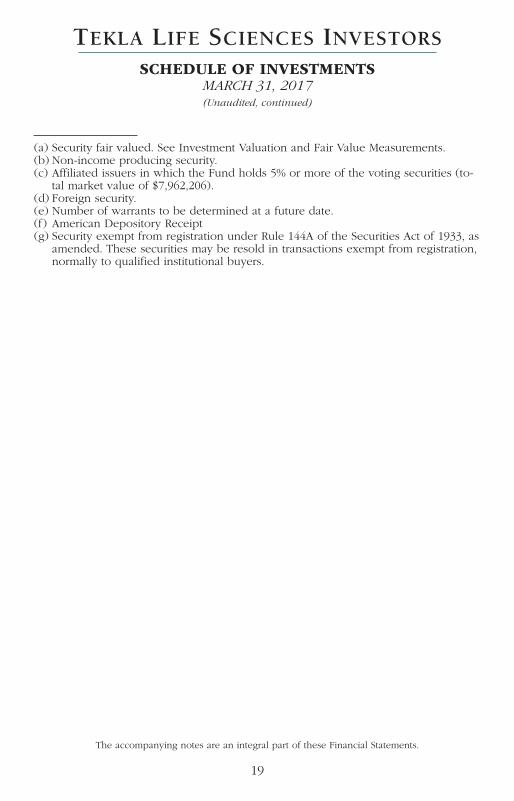
(a) Security fair valued. See Investment Valuation and Fair Value Measurements.(b) Non-income producing security.(c) Affiliated issuers in which the Fund holds 5% or more of the voting securities (to-
tal market value of $7,962,206).(d) Foreign security.(e) Number of warrants to be determined at a future date.(f) American Depository Receipt(g) Security exempt from registration under Rule 144A of the Securities Act of 1933, as
amended. These securities may be resold in transactions exempt from registration,normally to qualified institutional buyers.
TEKLA LIFE SCIENCES INVESTORS
SCHEDULE OF INVESTMENTSMARCH 31, 2017(Unaudited, continued)
Merrill Corp - Tekla Life Sciences Investors Semi-Annual Report [Funds] 811-06565 03-31-2017 ED [AUX] | thunt | 23-May-17 11:00 | 17-11960-1.ca | Sequence: 6CHKSUM Content: 22567 Layout: 7261 Graphics: No Graphics CLEAN
JOB: 17-11960-1 CYCLE#;BL#: 9; 0 TRIM: 5.375" x 8.375" COMPOSITECOLORS: Black, PANTONE 342 U, ~note-color 2 GRAPHICS: none V1.5
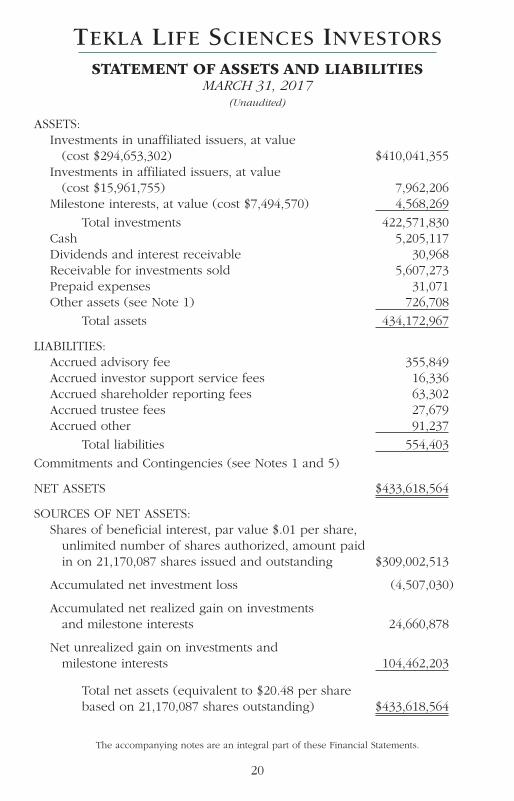
ASSETS:Investments in unaffiliated issuers, at value
(cost $294,653,302) $410,041,355Investments in affiliated issuers, at value
(cost $15,961,755) 7,962,206Milestone interests, at value (cost $7,494,570) 4,568,269
Total investments 422,571,830Cash 5,205,117Dividends and interest receivable 30,968Receivable for investments sold 5,607,273Prepaid expenses 31,071Other assets (see Note 1) 726,708
Total assets 434,172,967
LIABILITIES:Accrued advisory fee 355,849Accrued investor support service fees 16,336Accrued shareholder reporting fees 63,302Accrued trustee fees 27,679Accrued other 91,237
Total liabilities 554,403
Commitments and Contingencies (see Notes 1 and 5)
NET ASSETS $433,618,564
SOURCES OF NET ASSETS:Shares of beneficial interest, par value $.01 per share,
unlimited number of shares authorized, amount paid in on 21,170,087 shares issued and outstanding $309,002,513
Accumulated net investment loss (4,507,030)
Accumulated net realized gain on investments and milestone interests 24,660,878
Net unrealized gain on investments and milestone interests 104,462,203
Total net assets (equivalent to $20.48 per share based on 21,170,087 shares outstanding) $433,618,564
The accompanying notes are an integral part of these Financial Statements.
TEKLA LIFE SCIENCES INVESTORS
STATEMENT OF ASSETS AND LIABILITIESMARCH 31, 2017
(Unaudited)
20
Merrill Corp - Tekla Life Sciences Investors Semi-Annual Report [Funds] 811-06565 03-31-2017 ED [AUX] | thunt | 23-May-17 11:00 | 17-11960-1.da | Sequence: 1CHKSUM Content: 63113 Layout: 61905 Graphics: No Graphics CLEAN
JOB: 17-11960-1 CYCLE#;BL#: 9; 0 TRIM: 5.375" x 8.375" COMPOSITECOLORS: Black, PANTONE 342 U, ~note-color 2 GRAPHICS: none V1.5
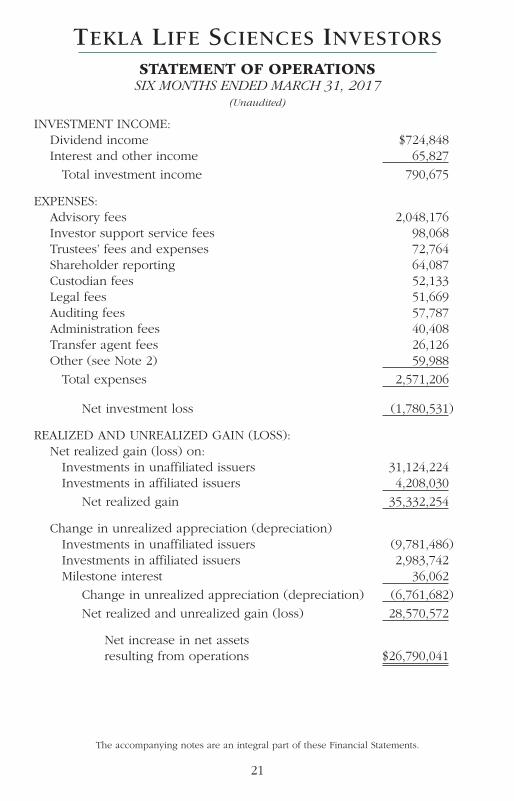
INVESTMENT INCOME:Dividend income $724,848Interest and other income 65,827
Total investment income 790,675
EXPENSES:Advisory fees 2,048,176Investor support service fees 98,068Trustees’ fees and expenses 72,764Shareholder reporting 64,087Custodian fees 52,133Legal fees 51,669Auditing fees 57,787Administration fees 40,408Transfer agent fees 26,126Other (see Note 2) 59,988
Total expenses 2,571,206
Net investment loss (1,780,531)
REALIZED AND UNREALIZED GAIN (LOSS):Net realized gain (loss) on:
Investments in unaffiliated issuers 31,124,224Investments in affiliated issuers 4,208,030
Net realized gain 35,332,254
Change in unrealized appreciation (depreciation)Investments in unaffiliated issuers (9,781,486)Investments in affiliated issuers 2,983,742Milestone interest 36,062
Change in unrealized appreciation (depreciation) (6,761,682)
Net realized and unrealized gain (loss) 28,570,572
Net increase in net assets resulting from operations $26,790,041
The accompanying notes are an integral part of these Financial Statements.
TEKLA LIFE SCIENCES INVESTORS
STATEMENT OF OPERATIONSSIX MONTHS ENDED MARCH 31, 2017
(Unaudited)
21
Merrill Corp - Tekla Life Sciences Investors Semi-Annual Report [Funds] 811-06565 03-31-2017 ED [AUX] | thunt | 23-May-17 11:00 | 17-11960-1.da | Sequence: 2CHKSUM Content: 10751 Layout: 4494 Graphics: No Graphics CLEAN
JOB: 17-11960-1 CYCLE#;BL#: 9; 0 TRIM: 5.375" x 8.375" COMPOSITECOLORS: Black, PANTONE 342 U, ~note-color 2 GRAPHICS: none V1.5
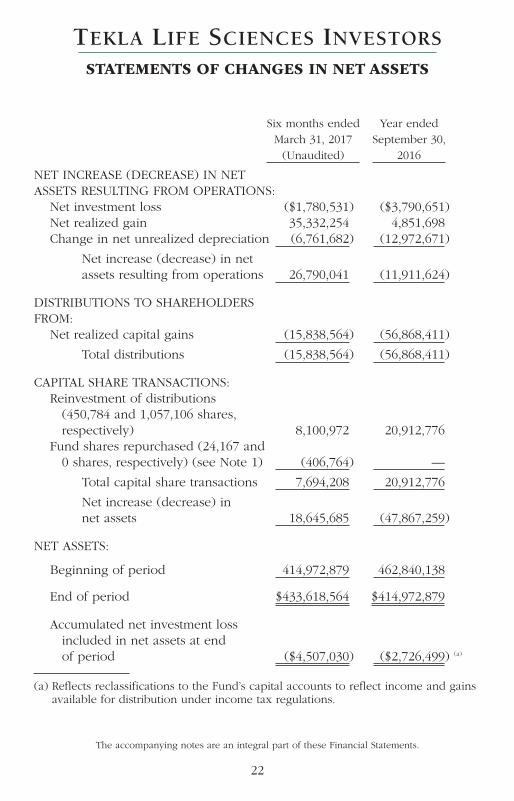
Six months ended Year ended March 31, 2017 September 30, (Unaudited) 2016 NET INCREASE (DECREASE) IN NET ASSETS RESULTING FROM OPERATIONS:
Net investment loss ($1,780,531) ($3,790,651)Net realized gain 35,332,254 4,851,698Change in net unrealized depreciation (6,761,682) (12,972,671)
Net increase (decrease) in net assets resulting from operations 26,790,041 (11,911,624)
DISTRIBUTIONS TO SHAREHOLDERS FROM:
Net realized capital gains (15,838,564) (56,868,411) Total distributions (15,838,564) (56,868,411)
CAPITAL SHARE TRANSACTIONS:Reinvestment of distributions
(450,784 and 1,057,106 shares, respectively) 8,100,972 20,912,776
Fund shares repurchased (24,167 and 0 shares, respectively) (see Note 1) (406,764) —
Total capital share transactions 7,694,208 20,912,776 Net increase (decrease) in net assets 18,645,685 (47,867,259)
NET ASSETS:
Beginning of period 414,972,879 462,840,138
End of period $433,618,564 $414,972,879
Accumulated net investment loss included in net assets at end of period ($4,507,030) ($2,726,499) (a)
(a) Reflects reclassifications to the Fund’s capital accounts to reflect income and gainsavailable for distribution under income tax regulations.
The accompanying notes are an integral part of these Financial Statements.
TEKLA LIFE SCIENCES INVESTORS
STATEMENTS OF CHANGES IN NET ASSETS
22
Merrill Corp - Tekla Life Sciences Investors Semi-Annual Report [Funds] 811-06565 03-31-2017 ED [AUX] | thunt | 23-May-17 11:00 | 17-11960-1.da | Sequence: 3CHKSUM Content: 51600 Layout: 49297 Graphics: No Graphics CLEAN
JOB: 17-11960-1 CYCLE#;BL#: 9; 0 TRIM: 5.375" x 8.375" COMPOSITECOLORS: Black, PANTONE 342 U, ~note-color 2 GRAPHICS: none V1.5
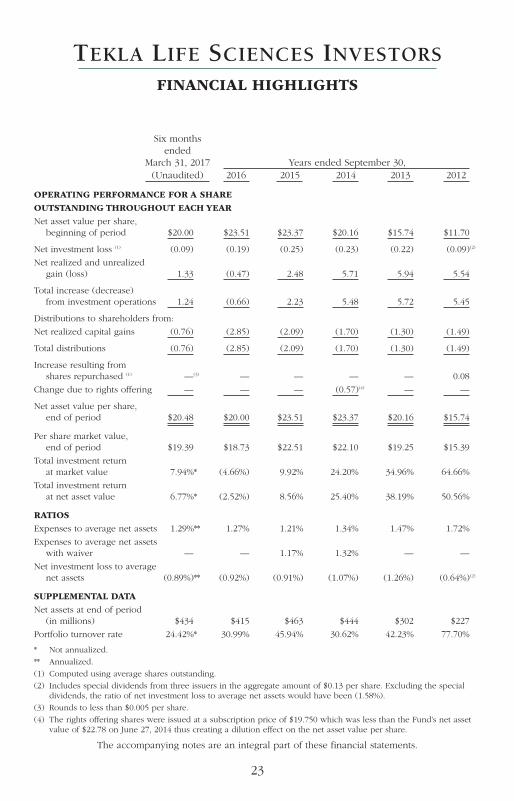
Six months ended March 31, 2017 Years ended September 30, (Unaudited) 2016 2015 2014 2013 2012
OPERATING PERFORMANCE FOR A SHARE
OUTSTANDING THROUGHOUT EACH YEAR
Net asset value per share, beginning of period $20.00 $23.51 $23.37 $20.16 $15.74 $11.70
Net investment loss (1) (0.09) (0.19) (0.25) (0.23) (0.22) (0.09)(2)
Net realized and unrealized gain (loss) 1.33 (0.47) 2.48 5.71 5.94 5.54
Total increase (decrease) from investment operations 1.24 (0.66) 2.23 5.48 5.72 5.45
Distributions to shareholders from:
Net realized capital gains (0.76) (2.85) (2.09) (1.70) (1.30) (1.49)
Total distributions (0.76) (2.85) (2.09) (1.70) (1.30) (1.49)
Increase resulting from shares repurchased (1) —(3) — — — — 0.08
Change due to rights offering — — — (0.57)(4) — —
Net asset value per share, end of period $20.48 $20.00 $23.51 $23.37 $20.16 $15.74
Per share market value, end of period $19.39 $18.73 $22.51 $22.10 $19.25 $15.39
Total investment return at market value 7.94%* (4.66%) 9.92% 24.20% 34.96% 64.66%
Total investment return at net asset value 6.77%* (2.52%) 8.56% 25.40% 38.19% 50.56%
RATIOS
Expenses to average net assets 1.29%** 1.27% 1.21% 1.34% 1.47% 1.72%
Expenses to average net assets with waiver — — 1.17% 1.32% — —
Net investment loss to average net assets (0.89%)** (0.92%) (0.91%) (1.07%) (1.26%) (0.64%)(2)
SUPPLEMENTAL DATA
Net assets at end of period (in millions) $434 $415 $463 $444 $302 $227
Portfolio turnover rate 24.42%* 30.99% 45.94% 30.62% 42.23% 77.70%
* Not annualized.
** Annualized.
(1) Computed using average shares outstanding.
(2) Includes special dividends from three issuers in the aggregate amount of $0.13 per share. Excluding the specialdividends, the ratio of net investment loss to average net assets would have been (1.58%).
(3) Rounds to less than $0.005 per share.
(4) The rights offering shares were issued at a subscription price of $19.750 which was less than the Fund’s net assetvalue of $22.78 on June 27, 2014 thus creating a dilution effect on the net asset value per share.
The accompanying notes are an integral part of these financial statements.
TEKLA LIFE SCIENCES INVESTORS
FINANCIAL HIGHLIGHTS
23
Merrill Corp - Tekla Life Sciences Investors Semi-Annual Report [Funds] 811-06565 03-31-2017 ED [AUX] | thunt | 23-May-17 11:00 | 17-11960-1.ea | Sequence: 1CHKSUM Content: 23847 Layout: 56439 Graphics: No Graphics CLEAN
JOB: 17-11960-1 CYCLE#;BL#: 9; 0 TRIM: 5.375" x 8.375" COMPOSITECOLORS: Black, PANTONE 342 U, ~note-color 2 GRAPHICS: none V1.5
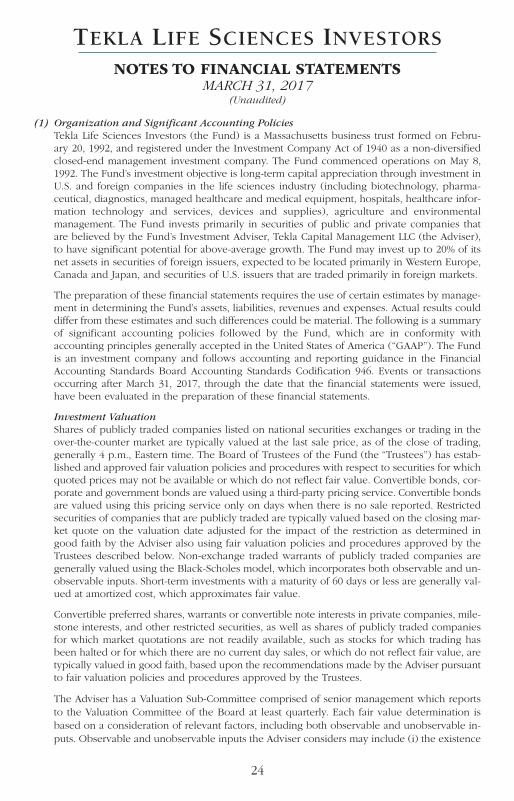
(1) Organization and Significant Accounting PoliciesTekla Life Sciences Investors (the Fund) is a Massachusetts business trust formed on Febru-ary 20, 1992, and registered under the Investment Company Act of 1940 as a non-diversifiedclosed-end management investment company. The Fund commenced operations on May 8,1992. The Fund’s investment objective is long-term capital appreciation through investment inU.S. and foreign companies in the life sciences industry (including biotechnology, pharma-ceutical, diagnostics, managed healthcare and medical equipment, hospitals, healthcare infor-mation technology and services, devices and supplies), agriculture and environmentalmanagement. The Fund invests primarily in securities of public and private companies thatare believed by the Fund’s Investment Adviser, Tekla Capital Management LLC (the Adviser),to have significant potential for above-average growth. The Fund may invest up to 20% of itsnet assets in securities of foreign issuers, expected to be located primarily in Western Europe,Canada and Japan, and securities of U.S. issuers that are traded primarily in foreign markets.
The preparation of these financial statements requires the use of certain estimates by manage-ment in determining the Fund’s assets, liabilities, revenues and expenses. Actual results coulddiffer from these estimates and such differences could be material. The following is a summaryof significant accounting policies followed by the Fund, which are in conformity with accounting principles generally accepted in the United States of America (“GAAP”). The Fundis an investment company and follows accounting and reporting guidance in the Financial Accounting Standards Board Accounting Standards Codification 946. Events or transactionsoccurring after March 31, 2017, through the date that the financial statements were issued,have been evaluated in the preparation of these financial statements.
Investment ValuationShares of publicly traded companies listed on national securities exchanges or trading in theover-the-counter market are typically valued at the last sale price, as of the close of trading,generally 4 p.m., Eastern time. The Board of Trustees of the Fund (the “Trustees”) has estab-lished and approved fair valuation policies and procedures with respect to securities for whichquoted prices may not be available or which do not reflect fair value. Convertible bonds, cor-porate and government bonds are valued using a third-party pricing service. Convertible bondsare valued using this pricing service only on days when there is no sale reported. Restrictedsecurities of companies that are publicly traded are typically valued based on the closing mar-ket quote on the valuation date adjusted for the impact of the restriction as determined ingood faith by the Adviser also using fair valuation policies and procedures approved by theTrustees described below. Non-exchange traded warrants of publicly traded companies aregenerally valued using the Black-Scholes model, which incorporates both observable and un-observable inputs. Short-term investments with a maturity of 60 days or less are generally val-ued at amortized cost, which approximates fair value.
Convertible preferred shares, warrants or convertible note interests in private companies, mile-stone interests, and other restricted securities, as well as shares of publicly traded companiesfor which market quotations are not readily available, such as stocks for which trading hasbeen halted or for which there are no current day sales, or which do not reflect fair value, aretypically valued in good faith, based upon the recommendations made by the Adviser pursuantto fair valuation policies and procedures approved by the Trustees.
The Adviser has a Valuation Sub-Committee comprised of senior management which reportsto the Valuation Committee of the Board at least quarterly. Each fair value determination isbased on a consideration of relevant factors, including both observable and unobservable in-puts. Observable and unobservable inputs the Adviser considers may include (i) the existence
TEKLA LIFE SCIENCES INVESTORS
NOTES TO FINANCIAL STATEMENTSMARCH 31, 2017
(Unaudited)
24
Merrill Corp - Tekla Life Sciences Investors Semi-Annual Report [Funds] 811-06565 03-31-2017 ED [AUX] | thunt | 23-May-17 11:00 | 17-11960-1.fa | Sequence: 1CHKSUM Content: 22765 Layout: 44126 Graphics: No Graphics CLEAN
JOB: 17-11960-1 CYCLE#;BL#: 9; 0 TRIM: 5.375" x 8.375" COMPOSITECOLORS: Black, PANTONE 342 U, ~note-color 2 GRAPHICS: none V1.5
of any contractual restrictions on the disposition of securities; (ii) information obtained fromthe company, which may include an analysis of the company’s financial statements, the com-pany’s products or intended markets or the company’s technologies; (iii) the price of the sameor similar security negotiated at arm’s length in an issuer’s completed subsequent round of fi-nancing; (iv) the price and extent of public trading in similar securities of the issuer or ofcomparable companies; or (v) a probability and time value adjusted analysis of contractualterms. Where available and appropriate, multiple valuation methodologies are applied to con-firm fair value. Significant unobservable inputs identified by the Adviser are often used in thefair value determination. A significant change in any of these inputs may result in a significantchange in the fair value measurement. Due to the uncertainty inherent in the valuation process,such estimates of fair value may differ significantly from the values that would have beenused had a ready market for the investments existed, and differences could be material. Addi-tionally, changes in the market environment and other events that may occur over the life ofthe investments may cause the gains or losses ultimately realized on these investments to bedifferent from the valuations used at the date of these financial statements.
Options on SecuritiesAn option contract is a contract in which the writer (seller) of the option grants the buyer ofthe option, upon payment of a premium, the right to purchase from (call option) or sell to(put option) the writer a designated instrument at a specified price within a specified periodof time. Certain options, including options on indices, will require cash settlement by theFund if the option is exercised. The Fund enters into option contracts in order to hedgeagainst potential adverse price movements in the value of portfolio assets, as a temporarysubstitute for selling selected investments, to lock in the purchase price of a security orcurrency which it expects to purchase in the near future, as a temporary substitute for pur-chasing selected investments, or to enhance potential gain or to gain or hedge exposure to fi-nancial market risk.
The Fund’s obligation under an exchange traded written option or investment in an exchange-traded purchased option is valued at the last sale price or in the absence of a sale, the meanbetween the closing bid and asked prices. Gain or loss is recognized when the option contractexpires, is exercised or is closed.
If the Fund writes a covered call option, the Fund foregoes, in exchange for the premium, theopportunity to profit during the option period from an increase in the market value of the un-derlying security above the exercise price. If the Fund writes a put option it accepts the riskof a decline in the market value of the underlying security below the exercise price. Over-the-counter options have the risk of the potential inability of counterparties to meet the terms oftheir contracts. The Fund’s maximum exposure to purchased options is limited to the premiuminitially paid. In addition, certain risks may arise upon entering into option contracts includingthe risk that an illiquid secondary market will limit the Fund’s ability to close out an optioncontract prior to the expiration date and that a change in the value of the option contract maynot correlate exactly with changes in the value of the securities or currencies hedged.
All options on securities and securities indices written by the Fund are required to be covered.When the Fund writes a call option, this means that during the life of the option the Fundmay own or have the contractual right to acquire the securities subject to the option or maymaintain with the Fund’s custodian in a segregated account appropriate liquid securities in anamount at least equal to the market value of the securities underlying the option. When the
TEKLA LIFE SCIENCES INVESTORS
NOTES TO FINANCIAL STATEMENTSMARCH 31, 2017
(continued)
25
Merrill Corp - Tekla Life Sciences Investors Semi-Annual Report [Funds] 811-06565 03-31-2017 ED [AUX] | thunt | 23-May-17 11:00 | 17-11960-1.fa | Sequence: 2CHKSUM Content: 39579 Layout: 11209 Graphics: No Graphics CLEAN
JOB: 17-11960-1 CYCLE#;BL#: 9; 0 TRIM: 5.375" x 8.375" COMPOSITECOLORS: Black, PANTONE 342 U, ~note-color 2 GRAPHICS: none V1.5
Fund writes a put option, this means that the Fund will maintain with the Fund’s custodian ina segregated account appropriate liquid securities in an amount at least equal to the exerciseprice of the option.
Milestone InterestThe Fund holds a financial instrument which reflects the current value of future milestone pay-ments the Fund may receive as a result of contractual obligations from other parties. The valueof such payments are adjusted to reflect the estimated risk based on the relative uncertainty ofboth the timing and the achievement of individual milestones. A risk to the Fund is that themilestones will not be achieved and no payment will be received by the Fund. The milestoneinterests were received as part of the proceeds from the sale of three private companies. Anypayments received are treated as a reduction of the cost basis of the milestone interest withpayments received in excess of the cost basis treated as a realized gain. The contractual obli-gations with respect to the Afferent Milestone Interest, Neurovance Milestone Interest and theTargeGen Milestone Interest provide for payments at various stages of the development of Af-ferent’s, Neurovance’s and TargeGen’s principal product candidate as of the date of the sale.
The following is a summary of the impact of the milestone interests on the financial statementsas of and for the six months ended March 31, 2017:
Statement of Assets and Liabilities, Milestone interests, at value $4,568,269
Statement of Assets and Liabilities, Net unrealized loss on investmentsand milestone interests $(2,926,301)
Statement of Operations, Change in unrealized appreciation (depreciation)on milestone interests $36,062
Other AssetsOther assets in the Statement of Assets and Liabilities consists of amounts due to the Fund atvarious times in the future in connection with the sale of investments in five private companies.
Investment Transactions and IncomeInvestment transactions are recorded on a trade date basis. Gains and losses from sales of in-vestments are recorded using the identified cost method. Interest income is recorded on theaccrual basis, adjusted for amortization of premiums and accretion of discounts. Dividend in-come is recorded on the ex-dividend date, less any foreign taxes withheld. Upon notificationfrom issuers, some of the dividend income received may be redesignated as a reduction ofcost of the related investment if it represents a return of capital.
The aggregate cost of purchases and proceeds from sales of investment securities (other thanshort-term investments) for the six months ended March 31, 2017 totaled $92,981,244 and$112,387,611, respectively.
Repurchase AgreementsIn managing short-term investments the Fund may from time to time enter into transactions inrepurchase agreements. In a repurchase agreement, the Fund’s custodian takes possession ofthe underlying collateral securities from the counterparty, the market value of which is at leastequal to the principal, including accrued interest, of the repurchase transaction at all times. Inthe event of default or bankruptcy by the other party to the agreement, realization and/or re-tention of the collateral by the Fund may be delayed. The Fund may enter into repurchasetransactions with any broker, dealer, registered clearing agency or bank. Repurchase agreement
TEKLA LIFE SCIENCES INVESTORS
NOTES TO FINANCIAL STATEMENTSMARCH 31, 2017
(continued)
26
Merrill Corp - Tekla Life Sciences Investors Semi-Annual Report [Funds] 811-06565 03-31-2017 ED [AUX] | thunt | 23-May-17 11:00 | 17-11960-1.fa | Sequence: 3CHKSUM Content: 52398 Layout: 55653 Graphics: No Graphics CLEAN
JOB: 17-11960-1 CYCLE#;BL#: 9; 0 TRIM: 5.375" x 8.375" COMPOSITECOLORS: Black, PANTONE 342 U, ~note-color 2 GRAPHICS: none V1.5
transactions are not counted for purposes of the limitations imposed on the Fund’s investmentin debt securities.
Distribution PolicyPursuant to a Securities and Exchange Commission exemptive order, the Fund may make pe-riodic distributions that include capital gains as frequently as 12 times in any one taxable yearin respect of its common shares, and the Fund has implemented a managed distribution policy(the Policy) providing for quarterly distributions at a rate set by the Board of Trustees. Underthe current Policy, the Fund intends to make quarterly distributions at a rate of 2% of theFund’s net assets to shareholders of record. The Fund intends to use net realized capital gainswhen making quarterly distributions, if available, but the Policy would result in a return ofcapital to shareholders if the amount of the distribution exceeds the Fund’s net investment in-come and realized capital gains. If taxable income and net long-term realized gains exceedthe amount required to be distributed under the Policy, the Fund will at a minimum make dis-tributions necessary to comply with the requirements of the Internal Revenue Code. The Policyhas been established by the Trustees and may be changed by them without shareholder ap-proval. The Trustees regularly review the Policy and the frequency and rate of distributionconsidering the purpose and effect of the Policy, the financial market environment, and theFund’s income, capital gains and capital available to pay distributions.
The Fund’s policy is to declare quarterly distributions in stock. The distributions are automat-ically paid in newly-issued full shares of the Fund unless otherwise instructed by the share-holder. Fractional shares will generally be settled in cash, except for registered shareholderswith book entry accounts of the Fund’s transfer agent who will have whole and fractionalshares added to their accounts. The Fund’s transfer agent delivers an election card and in-structions to each registered shareholder in connection with each distribution. The number ofshares issued will be determined by dividing the dollar amount of the distribution by thelower of net asset value or market price on the pricing date. If a shareholder elects to receivea distribution in cash, rather than in shares, the shareholder’s relative ownership in the Fundwill be reduced. The shares reinvested will be valued at the lower of the net asset value ormarket price on the pricing date. Distributions in stock will not relieve shareholders of anyfederal, state or local income taxes that may be payable on such distributions. Additional dis-tributions, if any, made to satisfy requirements of the Internal Revenue Code may be paid instock, as described above, or in cash.
Share Repurchase ProgramIn March 2017, the Trustees approved the renewal of the repurchase program to allow theFund to repurchase up to 12% of its outstanding shares in the open market for a one year pe-riod ending July 14, 2018. Prior to this renewal, in March 2016, the Trustees approved the re-newal of the share repurchase program to allow the Fund to repurchase up to 12% of itsoutstanding shares for a one year period ending July 10, 2017. The share repurchase programis intended to enhance shareholder value and potentially reduce the discount between themarket price of the Fund’s shares and the Fund’s net asset value.
During the six months ended March 31, 2017 the Fund repurchased 24,167 shares at a totalcost of $406,764. The weighted average discount per share between the cost of repurchaseand net asset value applicable to such shares at the date of repurchase was 8.33%.
TEKLA LIFE SCIENCES INVESTORS
NOTES TO FINANCIAL STATEMENTSMARCH 31, 2017
(continued)
27
Merrill Corp - Tekla Life Sciences Investors Semi-Annual Report [Funds] 811-06565 03-31-2017 ED [AUX] | thunt | 23-May-17 11:00 | 17-11960-1.fa | Sequence: 4CHKSUM Content: 51699 Layout: 11209 Graphics: No Graphics CLEAN
JOB: 17-11960-1 CYCLE#;BL#: 9; 0 TRIM: 5.375" x 8.375" COMPOSITECOLORS: Black, PANTONE 342 U, ~note-color 2 GRAPHICS: none V1.5
During the year ended September 30, 2016 the Fund did not repurchase any shares throughthe repurchase program.
Federal TaxesIt is the Fund’s policy to comply with the requirements of the Internal Revenue Code applicableto regulated investment companies and to distribute to its shareholders substantially all of itstaxable income and its net realized capital gains, if any. Therefore, no Federal income orexcise tax provision is required.
As of March 31, 2017, the Fund had no uncertain tax positions that would require financialstatement recognition or disclosure. The Fund’s federal tax returns are subject to examinationby the Internal Revenue Service for a period of three years.
DistributionsThe Fund records all distributions to shareholders on the ex-dividend date. Such distributionsare determined in conformity with income tax regulations, which may differ from GAAP. Thesedifferences include temporary and permanent differences from losses on wash sale transac-tions, installment sale adjustments and ordinary loss netting to reduce short term capital gains.Reclassifications are made to the Fund’s capital accounts to reflect income and gains availablefor distribution under income tax regulations.
Commitments and ContingenciesUnder the Fund’s organizational documents, its officers and Trustees may be indemnifiedagainst certain liabilities and expenses arising out of the performance of their duties to theFund. Additionally, in the normal course of business, the Fund enters into agreements withservice providers that may contain indemnification clauses. The Fund’s maximum exposureunder these agreements is unknown as this would involve future claims that may be madeagainst the Fund that have not yet occurred. However, based on experience, the Fund expectsthe risk of loss to be remote.
Investor Support ServicesThe Fund has retained Destra Capital Investment LLC to provide investor support services inconnection with the ongoing operation of the Fund. The Fund will pay Destra a fee in an annualamount equal to 0.05% of the average aggregate daily value of the Fund’s Managed Assets fromJanuary 1, 2017 through the remaining term of the investor support services agreement.
(2) Investment Advisory and Other Affiliated FeesThe Fund has entered into an Investment Advisory Agreement (the Advisory Agreement) withthe Adviser. Pursuant to the terms of the Advisory Agreement, the Fund pays the Adviser amonthly fee at the rate when annualized of (i) 2.50% of the average net assets for the month ofits venture capital and other restricted securities up to 25% of net assets and (ii) for all other netassets, 0.98% of the average net assets up to $250 million, 0.88% of the average net assets for thenext $250 million, 0.80% of the average net assets for the next $500 million and 0.70% of the av-erage net assets thereafter. The aggregate fee may not exceed a rate when annualized of 1.36%.
The Fund has entered into a Services Agreement (the Agreement) with the Adviser. Pursuantto the terms of the Agreement, the Fund reimburses the Adviser for certain services related toa portion of the payment of salary and provision of benefits to the Fund’s Chief ComplianceOfficer. During the six months ended March 31, 2017, these payments amounted to $18,074and are included in the other category in the Statement of Operations, together with insurance
TEKLA LIFE SCIENCES INVESTORS
NOTES TO FINANCIAL STATEMENTSMARCH 31, 2017
(continued)
28
Merrill Corp - Tekla Life Sciences Investors Semi-Annual Report [Funds] 811-06565 03-31-2017 ED [AUX] | thunt | 23-May-17 11:00 | 17-11960-1.fa | Sequence: 5CHKSUM Content: 20431 Layout: 55653 Graphics: No Graphics CLEAN
JOB: 17-11960-1 CYCLE#;BL#: 9; 0 TRIM: 5.375" x 8.375" COMPOSITECOLORS: Black, PANTONE 342 U, ~note-color 2 GRAPHICS: none V1.5
and other expenses incurred to unaffiliated entities. Expenses incurred pursuant to the Agree-ment as well as certain expenses paid for by the Adviser are allocated to the Fund in an eq-uitable fashion as approved by the Trustees of the Fund.
The Fund pays compensation to Independent Trustees in the form of a retainer, attendancefees, and additional compensation to Board and Committee chairpersons. The Fund does notpay compensation directly to Trustees or officers of the Fund who are also officers of the Adviser.
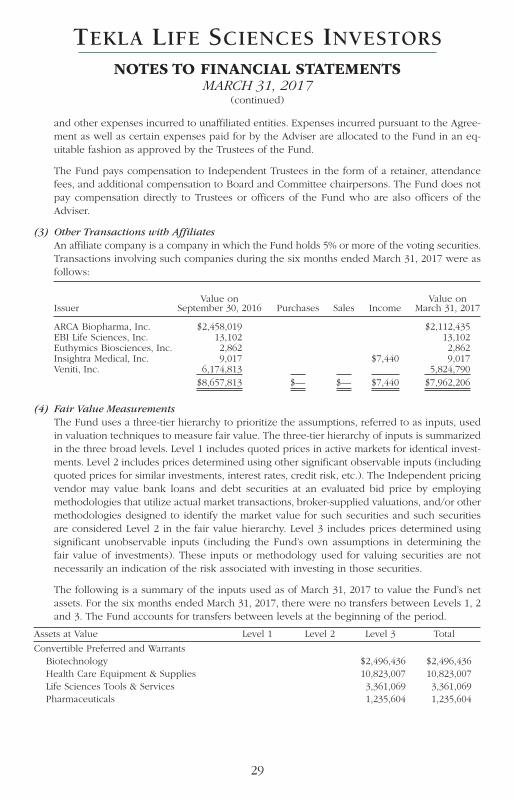
(3) Other Transactions with AffiliatesAn affiliate company is a company in which the Fund holds 5% or more of the voting securities.Transactions involving such companies during the six months ended March 31, 2017 were asfollows:
Value on Value onIssuer September 30, 2016 Purchases Sales Income March 31, 2017
ARCA Biopharma, Inc. $2,458,019 $2,112,435EBI Life Sciences, Inc. 13,102 13,102Euthymics Biosciences, Inc. 2,862 2,862Insightra Medical, Inc. 9,017 $7,440 9,017Veniti, Inc. 6,174,813 5,824,790
$8,657,813 $— $— $7,440 $7,962,206
(4) Fair Value MeasurementsThe Fund uses a three-tier hierarchy to prioritize the assumptions, referred to as inputs, usedin valuation techniques to measure fair value. The three-tier hierarchy of inputs is summarizedin the three broad levels. Level 1 includes quoted prices in active markets for identical invest-ments. Level 2 includes prices determined using other significant observable inputs (includingquoted prices for similar investments, interest rates, credit risk, etc.). The Independent pricingvendor may value bank loans and debt securities at an evaluated bid price by employingmethodologies that utilize actual market transactions, broker-supplied valuations, and/or othermethodologies designed to identify the market value for such securities and such securitiesare considered Level 2 in the fair value hierarchy. Level 3 includes prices determined usingsignificant unobservable inputs (including the Fund’s own assumptions in determining thefair value of investments). These inputs or methodology used for valuing securities are notnecessarily an indication of the risk associated with investing in those securities.
The following is a summary of the inputs used as of March 31, 2017 to value the Fund’s netassets. For the six months ended March 31, 2017, there were no transfers between Levels 1, 2and 3. The Fund accounts for transfers between levels at the beginning of the period.
Assets at Value Level 1 Level 2 Level 3 Total
Convertible Preferred and WarrantsBiotechnology $2,496,436 $2,496,436Health Care Equipment & Supplies 10,823,007 10,823,007Life Sciences Tools & Services 3,361,069 3,361,069Pharmaceuticals 1,235,604 1,235,604
TEKLA LIFE SCIENCES INVESTORS
NOTES TO FINANCIAL STATEMENTSMARCH 31, 2017
(continued)
29
Merrill Corp - Tekla Life Sciences Investors Semi-Annual Report [Funds] 811-06565 03-31-2017 ED [AUX] | thunt | 23-May-17 11:00 | 17-11960-1.fa | Sequence: 6CHKSUM Content: 62037 Layout: 32282 Graphics: No Graphics CLEAN
JOB: 17-11960-1 CYCLE#;BL#: 9; 0 TRIM: 5.375" x 8.375" COMPOSITECOLORS: Black, PANTONE 342 U, ~note-color 2 GRAPHICS: none V1.5
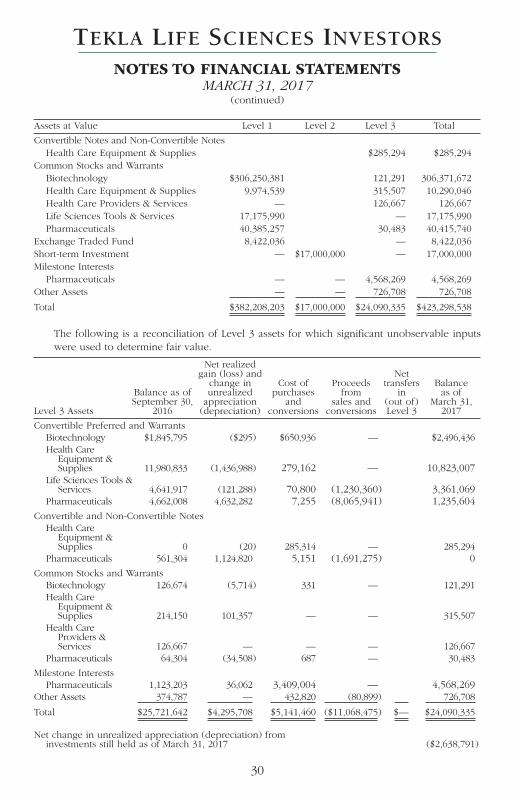
Assets at Value Level 1 Level 2 Level 3 Total
Convertible Notes and Non-Convertible NotesHealth Care Equipment & Supplies $285,294 $285,294
Common Stocks and WarrantsBiotechnology $306,250,381 121,291 306,371,672Health Care Equipment & Supplies 9,974,539 315,507 10,290,046Health Care Providers & Services — 126,667 126,667Life Sciences Tools & Services 17,175,990 — 17,175,990Pharmaceuticals 40,385,257 30,483 40,415,740
Exchange Traded Fund 8,422,036 — 8,422,036Short-term Investment — $17,000,000 — 17,000,000Milestone Interests
Pharmaceuticals — — 4,568,269 4,568,269Other Assets — — 726,708 726,708
Total $382,208,203 $17,000,000 $24,090,335 $423,298,538
The following is a reconciliation of Level 3 assets for which significant unobservable inputswere used to determine fair value.
Net realized gain (loss) and Net change in Cost of Proceeds transfers Balance Balance as of unrealized purchases from in as of September 30, appreciation and sales and (out of) March 31,Level 3 Assets 2016 (depreciation) conversions conversions Level 3 2017
Convertible Preferred and WarrantsBiotechnology $1,845,795 ($295) $650,936 — $2,496,436Health Care
Equipment & Supplies 11,980,833 (1,436,988) 279,162 — 10,823,007
Life Sciences Tools & Services 4,641,917 (121,288) 70,800 (1,230,360) 3,361,069
Pharmaceuticals 4,662,008 4,632,282 7,255 (8,065,941) 1,235,604Convertible and Non-Convertible Notes
Health Care Equipment & Supplies 0 (20) 285,314 — 285,294
Pharmaceuticals 561,304 1,124,820 5,151 (1,691,275) 0Common Stocks and Warrants
Biotechnology 126,674 (5,714) 331 — 121,291Health Care
Equipment & Supplies 214,150 101,357 — — 315,507
Health Care Providers & Services 126,667 — — — 126,667
Pharmaceuticals 64,304 (34,508) 687 — 30,483
Milestone InterestsPharmaceuticals 1,123,203 36,062 3,409,004 — 4,568,269
Other Assets 374,787 — 432,820 (80,899) 726,708
Total $25,721,642 $4,295,708 $5,141,460 ($11,068,475) $— $24,090,335
Net change in unrealized appreciation (depreciation) from investments still held as of March 31, 2017 ($2,638,791)
TEKLA LIFE SCIENCES INVESTORS
NOTES TO FINANCIAL STATEMENTSMARCH 31, 2017
(continued)
30
Merrill Corp - Tekla Life Sciences Investors Semi-Annual Report [Funds] 811-06565 03-31-2017 ED [AUX] | thunt | 23-May-17 11:00 | 17-11960-1.fa | Sequence: 7CHKSUM Content: 14370 Layout: 65048 Graphics: No Graphics CLEAN
JOB: 17-11960-1 CYCLE#;BL#: 9; 0 TRIM: 5.375" x 8.375" COMPOSITECOLORS: Black, PANTONE 342 U, ~note-color 2 GRAPHICS: none V1.5
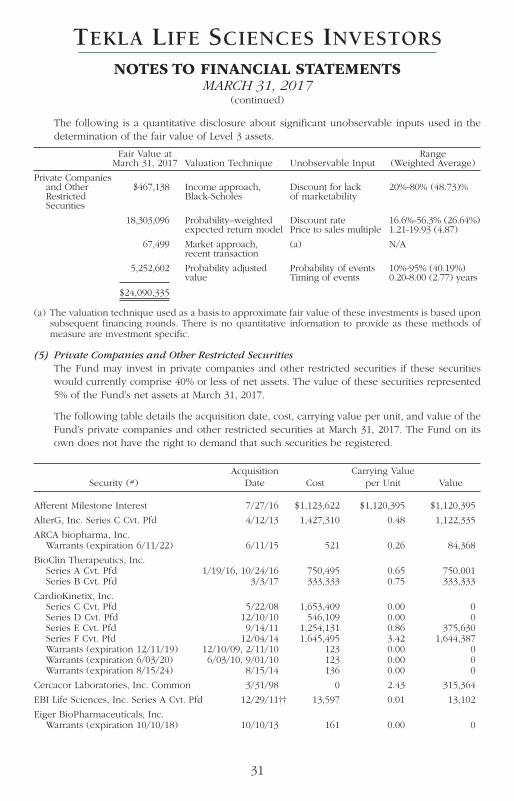
The following is a quantitative disclosure about significant unobservable inputs used in thedetermination of the fair value of Level 3 assets.
Fair Value at Range March 31, 2017 Valuation Technique Unobservable Input (Weighted Average)
Private Companies and Other $467,138 Income approach, Discount for lack 20%-80% (48.73)%Restricted Black-Scholes of marketability Securities
18,303,096 Probability–weighted Discount rate 16.6%-56.3% (26.64%) expected return model Price to sales multiple 1.21-19.93 (4.87)
67,499 Market approach, (a) N/A recent transaction
5,252,602 Probability adjusted Probability of events 10%-95% (40.19%) value Timing of events 0.20-8.00 (2.77) years
$24,090,335
(a) The valuation technique used as a basis to approximate fair value of these investments is based uponsubsequent financing rounds. There is no quantitative information to provide as these methods ofmeasure are investment specific.
(5) Private Companies and Other Restricted SecuritiesThe Fund may invest in private companies and other restricted securities if these securitieswould currently comprise 40% or less of net assets. The value of these securities represented5% of the Fund’s net assets at March 31, 2017.
The following table details the acquisition date, cost, carrying value per unit, and value of theFund’s private companies and other restricted securities at March 31, 2017. The Fund on itsown does not have the right to demand that such securities be registered.
Acquisition Carrying ValueSecurity (#) Date Cost per Unit Value
Afferent Milestone Interest 7/27/16 $1,123,622 $1,120,395 $1,120,395
AlterG, Inc. Series C Cvt. Pfd 4/12/13 1,427,310 0.48 1,122,335
ARCA biopharma, Inc.Warrants (expiration 6/11/22) 6/11/15 521 0.26 84,368
BioClin Therapeutics, Inc.Series A Cvt. Pfd 1/19/16, 10/24/16 750,495 0.65 750,001Series B Cvt. Pfd 3/3/17 333,333 0.75 333,333
CardioKinetix, Inc.Series C Cvt. Pfd 5/22/08 1,653,409 0.00 0Series D Cvt. Pfd 12/10/10 546,109 0.00 0Series E Cvt. Pfd 9/14/11 1,254,131 0.86 375,630Series F Cvt. Pfd 12/04/14 1,645,495 3.42 1,644,387Warrants (expiration 12/11/19) 12/10/09, 2/11/10 123 0.00 0Warrants (expiration 6/03/20) 6/03/10, 9/01/10 123 0.00 0Warrants (expiration 8/15/24) 8/15/14 136 0.00 0
Cercacor Laboratories, Inc. Common 3/31/98 0 2.43 315,364
EBI Life Sciences, Inc. Series A Cvt. Pfd 12/29/11†† 13,597 0.01 13,102
Eiger BioPharmaceuticals, Inc.Warrants (expiration 10/10/18) 10/10/13 161 0.00 0
TEKLA LIFE SCIENCES INVESTORS
NOTES TO FINANCIAL STATEMENTSMARCH 31, 2017
(continued)
31
Merrill Corp - Tekla Life Sciences Investors Semi-Annual Report [Funds] 811-06565 03-31-2017 ED [AUX] | thunt | 23-May-17 11:00 | 17-11960-1.fa | Sequence: 8CHKSUM Content: 2212 Layout: 8436 Graphics: No Graphics CLEAN
JOB: 17-11960-1 CYCLE#;BL#: 9; 0 TRIM: 5.375" x 8.375" COMPOSITECOLORS: Black, PANTONE 342 U, ~note-color 2 GRAPHICS: none V1.5
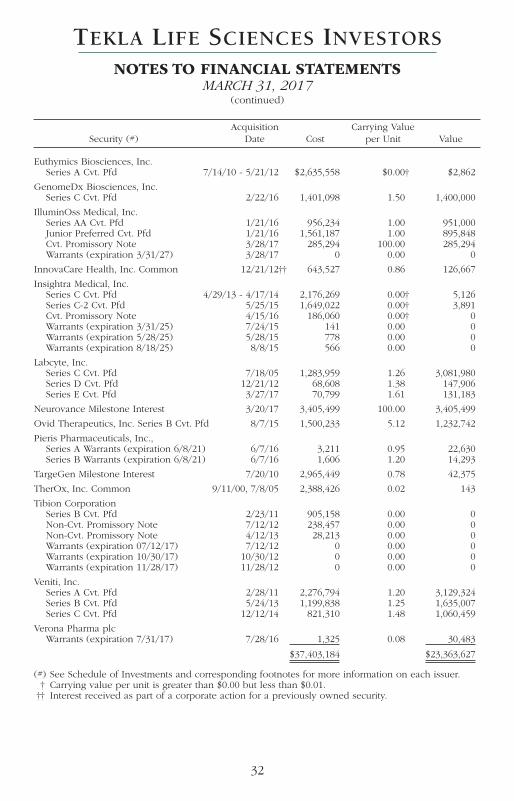
Acquisition Carrying ValueSecurity (#) Date Cost per Unit Value
Euthymics Biosciences, Inc.Series A Cvt. Pfd 7/14/10 - 5/21/12 $2,635,558 $0.00† $2,862
GenomeDx Biosciences, Inc.Series C Cvt. Pfd 2/22/16 1,401,098 1.50 1,400,000
IlluminOss Medical, Inc.Series AA Cvt. Pfd 1/21/16 956,234 1.00 951,000Junior Preferred Cvt. Pfd 1/21/16 1,561,187 1.00 895,848Cvt. Promissory Note 3/28/17 285,294 100.00 285,294Warrants (expiration 3/31/27) 3/28/17 0 0.00 0
InnovaCare Health, Inc. Common 12/21/12†† 643,527 0.86 126,667
Insightra Medical, Inc.Series C Cvt. Pfd 4/29/13 - 4/17/14 2,176,269 0.00† 5,126Series C-2 Cvt. Pfd 5/25/15 1,649,022 0.00† 3,891Cvt. Promissory Note 4/15/16 186,060 0.00† 0Warrants (expiration 3/31/25) 7/24/15 141 0.00 0Warrants (expiration 5/28/25) 5/28/15 778 0.00 0Warrants (expiration 8/18/25) 8/8/15 566 0.00 0
Labcyte, Inc.Series C Cvt. Pfd 7/18/05 1,283,959 1.26 3,081,980Series D Cvt. Pfd 12/21/12 68,608 1.38 147,906Series E Cvt. Pfd 3/27/17 70,799 1.61 131,183
Neurovance Milestone Interest 3/20/17 3,405,499 100.00 3,405,499
Ovid Therapeutics, Inc. Series B Cvt. Pfd 8/7/15 1,500,233 5.12 1,232,742
Pieris Pharmaceuticals, Inc.,Series A Warrants (expiration 6/8/21) 6/7/16 3,211 0.95 22,630Series B Warrants (expiration 6/8/21) 6/7/16 1,606 1.20 14,293
TargeGen Milestone Interest 7/20/10 2,965,449 0.78 42,375
TherOx, Inc. Common 9/11/00, 7/8/05 2,388,426 0.02 143
Tibion CorporationSeries B Cvt. Pfd 2/23/11 905,158 0.00 0Non-Cvt. Promissory Note 7/12/12 238,457 0.00 0Non-Cvt. Promissory Note 4/12/13 28,213 0.00 0Warrants (expiration 07/12/17) 7/12/12 0 0.00 0Warrants (expiration 10/30/17) 10/30/12 0 0.00 0Warrants (expiration 11/28/17) 11/28/12 0 0.00 0
Veniti, Inc.Series A Cvt. Pfd 2/28/11 2,276,794 1.20 3,129,324Series B Cvt. Pfd 5/24/13 1,199,838 1.25 1,635,007Series C Cvt. Pfd 12/12/14 821,310 1.48 1,060,459
Verona Pharma plcWarrants (expiration 7/31/17) 7/28/16 1,325 0.08 30,483
$37,403,184 $23,363,627
(#) See Schedule of Investments and corresponding footnotes for more information on each issuer. † Carrying value per unit is greater than $0.00 but less than $0.01.†† Interest received as part of a corporate action for a previously owned security.
TEKLA LIFE SCIENCES INVESTORS
NOTES TO FINANCIAL STATEMENTSMARCH 31, 2017
(continued)
32
Merrill Corp - Tekla Life Sciences Investors Semi-Annual Report [Funds] 811-06565 03-31-2017 ED [AUX] | thunt | 23-May-17 11:00 | 17-11960-1.fa | Sequence: 9CHKSUM Content: 38672 Layout: 44535 Graphics: No Graphics CLEAN
JOB: 17-11960-1 CYCLE#;BL#: 9; 0 TRIM: 5.375" x 8.375" COMPOSITECOLORS: Black, PANTONE 342 U, ~note-color 2 GRAPHICS: none V1.5
The Investment Advisory Agreement (the Advisory Agreement) between the Fund and theAdviser provides that the Advisory Agreement will continue in effect so long as its continu-ance is approved at least annually by (i) the Trustees of the Fund or the shareholders by af-firmative vote of a majority of the outstanding shares and (ii) a majority of the Trustees ofthe Fund who are not interested persons (the Independent Trustees), by vote cast in personat a meeting called for the purpose of voting on such approval.
After considering the matter in a meeting held on March 23, 2017, the Board, and the Inde-pendent Trustees voting separately, determined that the terms of the Advisory Agreementare fair and reasonable and approved the continuance of the Advisory Agreement as beingin the best interests of the Fund and its shareholders. In making its determination, the Boardconsidered materials that were specifically prepared by the Adviser at the request of theBoard and Fund counsel for purposes of the contract review process, including comparisonsof (i) the Fund’s performance to its primary benchmark, the NASDAQ Biotech Index® (NBI),and to other investment companies, (ii) the Fund’s expenses and expense ratios to those ofa peer group of other investment companies, and (iii) the Adviser’s profitability with respectto its services for the Fund to the profitability of other investment advisers. The Trusteestook into account that the Adviser presently provides investment management services onlyto the Fund and to Tekla Healthcare Investors, Tekla Healthcare Opportunities Fund andTekla World Healthcare Fund and does not derive any significant benefit from its relationshipwith the Fund other than receipt of advisory fees pursuant to the Advisory Agreement, marketresearch and potential marketing exposure for the Adviser. The Board also received and re-viewed information throughout the year about the portfolio performance, the investmentstrategy, the portfolio management team and the fees and expenses of the Fund.
In approving the Advisory Agreement, the Board considered, among other things, the nature,extent, and quality of the services to be provided by the Adviser, the investment performanceof the Fund and the Adviser, the costs of services provided and profits realized by the Adviserand its affiliates, and whether fee levels reflect any economies of scale for the benefit ofFund shareholders and the extent to which economies of scale would be realized as theFund grows. The Board reviewed information about the foregoing factors and consideredchanges, if any, in such information since its previous approval. The Board also evaluatedthe financial strength of the Adviser and the capability of the personnel of the Adviser, specif-ically the strength and background of its investment analysts. Fund counsel provided theBoard with the statutory and regulatory requirements for approval and disclosure of invest-ment advisory agreements. The Board, including the Independent Trustees, evaluated all ofthe foregoing and, considering all factors together, determined in the exercise of its businessjudgment that the continuance of the Advisory Agreement is in the best interests of the Fundand its shareholders. The following provides more detail on certain factors considered bythe Trustees and the Board’s conclusions with respect to each such factor.
The nature, extent and quality of the services to be provided by the Adviser. On a regular basisthe Board considers the roles and responsibilities of the Adviser as a whole, along with spe-cific portfolio management, support and trading functions the Adviser provides to the Fund.The Trustees considered the nature, extent and quality of the services provided by the Adviserto the Fund. The Trustees continue to be satisfied with the quality and value of the investmentadvisory services provided to the Fund by the Adviser, and, in particular, the managementstyle and discipline followed by the Adviser and the quality of the Adviser’s research, trading,portfolio management, compliance and administrative personnel. The Trustees also took intoaccount the Adviser’s significant investment in its business through the addition of portfoliomanagement and administrative staff in recent years and the Adviser’s commitment to con-tinue to build out its infrastructure as future circumstances require.
TEKLA LIFE SCIENCES INVESTORS
INVESTMENT ADVISORY AGREEMENT APPROVAL
33
Merrill Corp - Tekla Life Sciences Investors Semi-Annual Report [Funds] 811-06565 03-31-2017 ED [AUX] | thunt | 23-May-17 11:00 | 17-11960-1.ga | Sequence: 1CHKSUM Content: 31663 Layout: 34977 Graphics: No Graphics CLEAN
JOB: 17-11960-1 CYCLE#;BL#: 9; 0 TRIM: 5.375" x 8.375" COMPOSITECOLORS: Black, PANTONE 342 U, ~note-color 2 GRAPHICS: none V1.5
The investment performance of the Fund and the Adviser. On a regular basis the Board reviewsperformance information for the Fund and discusses the Fund’s investment strategy with theAdviser. The Trustees reviewed performance information for the Fund and, in particular, per-formance information for the past one-, three-, five- and ten-year periods; comparisons ofthe Fund’s performance to its benchmark, NBI and other investment companies; and infor-mation relating to the performance of the Fund’s venture capital portfolio. The Trusteesnoted that the performance information reviewed reflects a view only of the Fund’s perform-ance as of a certain date, and that the results might be significantly different if a differentdate is selected to generate the performance information. Additionally, the Trustees recog-nized that the longer periods of performance for the Fund may be adversely and dispropor-tionately affected by significant underperformance in one more recent period, and that suchunderperformance may be caused by a small number of investment decisions or positions.
In considering the Fund’s relative performance, the Trustees noted that, although an inde-pendent service provider had been engaged to help identify the appropriate benchmark andpeer group for the Fund, the Fund’s unique strategy presents challenges when comparingthe Fund’s performance to a single benchmark or a peer group, as no single benchmark orfund within the peer group contains this same strategy. In particular, the Trustees observedthat the Fund’s strategy includes a meaningfully lower allocation to biotechnology comparedto the primary benchmark (the NBI) and the funds in the peer group. The Trustees notedthat, as a result, all other things being equal, in periods when biotechnology performs well,the Fund might be expected to underperform that index (or the peer group), and vice versa.Additionally, the Fund has a meaningful allocation to venture and restricted securities,whereas neither the NBI nor the funds in the peer group have a similar allocation to such se-curities. In light of these differences, the Trustees recognized the more limited usefulness ofthese performance comparisons for the Fund.
With respect to the performance of the Fund against its primary benchmark, the Trusteesnoted that although the benchmark’s performance generally exceeded the Fund’s returnsmeasured by net asset value over the five- and ten-year periods, the Fund’s performance ex-ceeded that of the benchmark for the one- and three-year periods. With respect to the netasset value performance of the Fund against a peer group, the Trustees noted that the Fundhas lagged its peer group over the one- and three-year periods, but compared well over thelonger five- and ten-year periods.
The Trustees also observed that the Fund had historically achieved its objective of generatingperformance sufficient to support its targeted dividend, although they acknowledged thatthere could be no assurance this would continue in future periods.
The Trustees continue to be satisfied with the long-term investment performance of the Fundand the Adviser.
The costs of services to be provided and profits to be realized by the Adviser from its relationshipwith the Fund. The Trustees considered the various services provided by the Adviser to theFund and reviewed comparative information regarding the expenses and expense ratios ofthe Fund and a peer group of other investment companies. The Trustees noted that the Ad-viser’s fees are within the range of fees presented in the comparative information and notedthat a portion of the Fund’s investment portfolio is invested in venture and restricted securities,a portfolio management service that can warrant higher management fees than those chargedby the Adviser pursuant to the Advisory Agreement. The Trustees also considered financialinformation provided by the Adviser, including financial statements of the Adviser and acomparison of the Adviser’s profitability with respect to its services for the Fund to the profitability of other investment advisers. Based on the information provided to and evaluated
TEKLA LIFE SCIENCES INVESTORS
INVESTMENT ADVISORY AGREEMENT APPROVAL(continued)
34
Merrill Corp - Tekla Life Sciences Investors Semi-Annual Report [Funds] 811-06565 03-31-2017 ED [AUX] | thunt | 23-May-17 11:00 | 17-11960-1.ga | Sequence: 2CHKSUM Content: 57268 Layout: 37243 Graphics: No Graphics CLEAN
JOB: 17-11960-1 CYCLE#;BL#: 9; 0 TRIM: 5.375" x 8.375" COMPOSITECOLORS: Black, PANTONE 342 U, ~note-color 2 GRAPHICS: none V1.5
by the Trustees, the Trustees concluded that the fees charged by the Adviser are fair and rea-sonable in light of the quality and nature of the services provided by the Adviser and thatthe profitability of the Adviser’s relationship with the Fund has not been excessive. The feescharged by the Adviser are within a reasonable range of fees as compared to fees chargedby other investment advisers, and the services provided by the Adviser and the amountspaid under the Advisory Agreement are sufficiently favorable in comparison to the servicesrendered and fees charged by others for similar services to warrant a finding that fees to bepaid by the Fund are fair.
Whether fee levels reflect economies of scale and the extent to which economies of scale wouldbe realized as the Fund grows. The Trustees considered the fee schedule in the AdvisoryAgreement and noted that it provides for breakpoints that would reduce the effective fee tothe extent the Fund’s net assets should increase, allowing the Fund to share in the benefitsof any economies of scale that would inure to the Adviser as the Fund’s assets increase.Given the closed-end structure of the Fund, its current asset size, and the fact that anyeconomies of scale are modest at current Fund asset levels, the Trustees determined that theFund’s advisory fee schedule is satisfactory and fair.
TEKLA LIFE SCIENCES INVESTORS
INVESTMENT ADVISORY AGREEMENT APPROVAL(continued)
35
Merrill Corp - Tekla Life Sciences Investors Semi-Annual Report [Funds] 811-06565 03-31-2017 ED [AUX] | thunt | 23-May-17 11:00 | 17-11960-1.ga | Sequence: 3CHKSUM Content: 53614 Layout: 34977 Graphics: No Graphics CLEAN
JOB: 17-11960-1 CYCLE#;BL#: 9; 0 TRIM: 5.375" x 8.375" COMPOSITECOLORS: Black, PANTONE 342 U, ~note-color 2 GRAPHICS: none V1.5
PRIVACY NOTICE: If you are a registered shareholder of the Fund, the Fund and TeklaCapital Management LLC, the Fund’s investment adviser, may receive nonpublic personal in-formation about you from the information collected by the transfer agent from your transac-tions in Fund shares. Any nonpublic personal information is not disclosed to third parties,except as permitted or required by law. In connection with servicing your account and ef-fecting transactions, the information received may be shared with the investment adviserand non-affiliates, including transfer agents, custodians or other service companies. Accessto your nonpublic personal information is restricted to employees who need to know thatinformation to provide products or services to you. To maintain the security of your nonpublicpersonal information, physical, electronic, and procedural safeguards are in place that complywith federal standards. The policies and practices described above apply to both current andformer shareholders.
If your Fund shares are held in “street name” at a bank or brokerage, we do not have accessto your personal information and you should refer to your bank’s or broker’s privacy policiesfor a statement of the treatment of your personal information.
FOR MORE INFORMATION: A description of the Fund’s proxy voting policies and pro-cedures and information on how the Fund voted proxies relating to portfolio securitiesduring the most recent 12-month period ended June 30 is available (i) without charge, uponrequest by calling 1-800-451-2597; (ii) by writing to Tekla Capital Management LLC at 100Federal Street, 19th Floor, Boston, MA 02110; (iii) on the Fund’s website atwww.Teklacap.com; and (iv) on the SEC’s website at http://www.sec.gov.
The Fund’s complete Schedule of Investments for the first and third quarters of its fiscal yearwill be filed quarterly with the SEC on Form N-Q. A link to this Schedule of Investments willalso be available on the Fund’s website at www.Teklacap.com, or the SEC’s website athttp://www.sec.gov. The Fund’s Form N-Q may be reviewed and copied at the SEC’s PublicReference Room in Washington, DC or by calling 1-800-SEC-0330.
You can find information regarding the Fund at the Fund’s website, www.teklacap.com. TheFund regularly posts information to its website, including information regarding daily sharepricing and distributions and press releases, and maintains links to the Fund’s SEC filings.The Fund currently publishes and distributes quarterly fact cards, including performance,portfolio holdings and sector information for each fiscal quarter. These fact cards will beavailable on the Fund’s website and by request from the Fund’s marketing and investor sup-port services agent, Destra Capital Investments, at 1-877-855-3434.
DISTRIBUTION POLICY: The Fund has a managed distribution policy as described inthe Notes to Financial Statements. For more information contact your financial adviser.
SHARE REPURCHASE PROGRAM: In March 2017, the Trustees reauthorized the sharerepurchase program to allow the Fund to repurchase up to 12% of its outstanding shares fora one year period ending July 14, 2018.
PORTFOLIO MANAGEMENT: Daniel R. Omstead, Ph.D., Jason C. Akus, M.D./M.B.A., TimothyGasperoni, M.B.A, Ph.D., Christian M. Richard, M.B.A, M.S., Christopher Abbott, Robert Benson,CFA, CAIA, Amanda Birdsey-Benson, Ph.D., Alan Kwan, M.B.A, Ph.D. and Joshua A.W. Mosberg,Ph.D. are members of a team that analyzes investments on behalf of the Fund. Dr. Omsteadexercises ultimate decision making authority with respect to investments.
HOUSEHOLDING: A number of banks, brokers and financial advisers have instituted“householding”. Under this practice, which has been approved by the SEC, only one copy ofshareholder documents may be delivered to multiple shareholders who share the same ad-dress and satisfy other conditions. Householding is intended to reduce expenses and elimi-nate duplicate mailings of shareholder documents. If you do not want the mailing of yourshareholder documents to be combined with those of other members of your household,please contact your bank, broker or financial adviser.
TEKLA LIFE SCIENCES INVESTORS
36
Merrill Corp - Tekla Life Sciences Investors Semi-Annual Report [Funds] 811-06565 03-31-2017 ED [AUX] | thunt | 23-May-17 11:00 | 17-11960-1.ga | Sequence: 4CHKSUM Content: 44450 Layout: 25797 Graphics: No Graphics CLEAN
JOB: 17-11960-1 CYCLE#;BL#: 9; 0 TRIM: 5.375" x 8.375" COMPOSITECOLORS: Black, PANTONE 342 U, ~note-color 2 GRAPHICS: none V1.5
TEKLA LIFE SCIENCES INVESTORS
New York Stock Exchange Symbol: HQLNAV Symbol: XHQLX
100 Federal Street, 19th FloorBoston, Massachusetts 02110
(617) 772-8500www.teklacap.com
OfficersDaniel R. Omstead, Ph.D., President
Laura Woodward, CPA, Chief Compliance Officer,Secretary and Treasurer
TrusteesMichael W. Bonney
Rakesh K. Jain, Ph.D.Daniel R. Omstead, Ph.D.
Oleg M. Pohotsky, M.B.A., J.D.William S. Reardon, CPAUwe E. Reinhardt, Ph.D.Lucinda H. Stebbins, CPA
Investment AdviserTekla Capital Management LLC
Administrator & CustodianState Street Bank and Trust Company
Transfer AgentComputershare, Inc.
Legal CounselDechert LLP
Shareholders with questions regarding share transfers may calltheir bank, broker or financial adviser or the Transfer Agent at
1-800-426-5523.
Daily net asset value may be obtained fromour website (www.teklacap.com) or by calling
(617) 772-8500
Merrill Corp - Tekla Life Sciences Investors Semi-Annual Report [Funds] 811-06565 03-31-2017 ED [AUX] | thunt | 23-May-17 11:00 | 17-11960-1.za | Sequence: 1CHKSUM Content: 45292 Layout: 16073 Graphics: No Graphics CLEAN
JOB: 17-11960-1 CYCLE#;BL#: 9; 0 TRIM: 5.375" x 8.375" COMPOSITECOLORS: Black, PANTONE 342 U, ~note-color 2 GRAPHICS: none V1.5


![TEKLA LIFE SCIENCES NVESTORS - Tekla Capital … · TEKLA LIFE SCIENCES INVESTORS Annual Report 2 0 1 6 Merrill Corp - Tekla Life Sciences Investors Annual Report [Funds] 811-06565](https://img.pdfslide.net/doc/110x75/5b444ed17f8b9a81058b9313/tekla-life-sciences-nvestors-tekla-capital-tekla-life-sciences-investors-annual.jpg)