Embed Size (px)
Citation preview

TELECOM CUSTOMER SEGMENTATION AND PRECISE PACKAGE DESIGN BY USING DATA MINING
Zhang Tianyuan (Victor)
Dissertation submitted as partial requirement for the conferral of
Master in Business Administration
Supervisor: Prof. Luís Martins, ISCTE Business School, Departamento de Marketing,Operações e
Gestão Geral (IBS)
October 2018

AN
D P
RE
CIS
E P
AC
KA
GE
DE
SIG
N
DE
SIG
N
CU
ST
OM
ER
SE
GM
EN
TA
TIO
N
BY
US
ING
DA
TA
MIN
ING
Zhan
g T
ian
yu
an (
Vic
tor)
TE
LE
CO
M

ACKNOWLEDGEMENT
My deepest gratitude goes first and foremost to Professor Luís Martins, my supervisor, for his
constant support and guidance. Without his inclusive attitude and meticulous guidance, this
dissertation could not have reached its present form. He is my important guide, encouraging me to
go through all the difficulties in the thesis writing process.
I would also like to thank all the professors who have taught me in ISCTE. Your hard work and
selfless help me quickly integrate into an unfamiliar environment, learned the knowledge that will
benefit me forever, and laid a solid foundation for future work.
To my classmates, I also expressed my deepest gratitude. At ISCTE, I deeply understood the
importance of teamwork. Their full cooperation and help made me grow rapidly.
Finally, I would like to thank my parents and family members. They are my strongest backing,
giving me selfless dedication and great support. Without them, I have no chance to pursue my
dreams and see such a wonderful world. I will always love them!

ABSTRACT
Changes in the form of communication have prompted the telecommunications industry to flourish.
In the "big data era" of information explosion, as one of the leading industries in the information
age, the development of the telecommunications industry depends not only on communication
technology, but also on the ability of enterprises to optimize resource allocation. At present, the
information resources owned by telecom companies mainly come from customers. During the
development process, they have accumulated a large amount of customer data, which truly and
objectively reflects the behavior of consumers.
This paper is dedicated to combining data mining technology with the rich data resources of the
telecom industry and the latest marketing theories, not only effectively helping subdivide the
telecommunications customer market, but also supporting telecommunications companies in
developing more accurate and efficient marketing strategies. In addition, data analysis method such
as factor analysis, regression analysis and discriminant analysis are used to analyze the
demographic, business, SMS messages and expense characteristics of telecom customers, providing
a new vision and reference for the telecom industry to achieve accurate packaging design. Based on
the above research results, a discriminant model for the loss of telecom customers is constructed,
which will help telecommunications companies to obtain a control method for telecom customer
management risk. At last, data mining technology is used to optimize the combination design of
telecommunication services, which offer effective advice on precise telecom package design to
telecommunications companies.
Key words: Telecom, Customer segmentation, data mining, targeted marketing, package design
JEL: M10 and C12

INDEX
GLOSSARY .......................................................................................................................... 7
TABLES INDEX ................................................................................................................... 8
FIGURES INDEX .................................................................................................................. 9
APPENDIX INDEX ............................................................................................................. 10
Chapter 1 Introduction ....................................................................................................... 11
1.1 Framework and research motivation ......................................................................................................11
1.2 Objectives of the investigation ................................................................................................................ 12
1.3 Thesis structure ........................................................................................................................................ 12
Chapter 2 Contextualization ............................................................................................. 14
Chapter 3 Literature Review............................................................................................... 16
3.1 The application of marketing in the field of telecommunications ....................................................... 16
3.2 Client subdivision..................................................................................................................................... 18
3.3 Application of data mining in the field of telecommunications............................................................ 20
3.4 Basic concept of marketing ..................................................................................................................... 20
3.4.1 Basic concept of marketing ............................................................................................................. 20
3.4.2 Marketing classic theory ................................................................................................................. 22
3.5 Customer segmentation ........................................................................................................................... 23
3.5.1 The main method of customer segmentation .................................................................................. 23
3.5.2 Definition of Customer Segmentation ............................................................................................ 24
3.5.3 Customer Segmentation Technology .............................................................................................. 26
3.5.4 The implementation model of Customer Segmentation .................................................................. 29
3.5.5 Customer segmentation in telecom marketing ................................................................................ 29
Chapter 4 Data Analysis by Applying SPSS Software ...................................................... 31
4.1 Design analysis and research hypotheses ............................................................................................... 31
4.2 Steps of the Investigation ........................................................................................................................ 33
4.3 Paradigm and Data Collection Methodology ........................................................................................ 34
4.4 The Exploratory study and methodological options ............................................................................. 34
4.5 Demographic characteristics of telecom customers .............................................................................. 35
4.5.1 Sex characteristics........................................................................................................................... 35
4.5.2 Age characteristics .......................................................................................................................... 35
4.6 Business information of telecom customers ........................................................................................... 36
4.6.1 Information about packages ............................................................................................................ 36
4.6.2 Information about CRBT service .................................................................................................... 37
4.6.3 Information about interactive world flow ....................................................................................... 38
4.7 Factor analysis results of SMS of telecom customers ........................................................................... 39
4.7.1 Variables selection of factor analysis for SMS ............................................................................... 39

4.7.2 KMO and Bartlett’s test of sphericity (Testing the Research Hypotheses) ..................................... 39
4.7.3 Common factor variance ................................................................................................................. 40
4.7.4 Total variance of interpretation ....................................................................................................... 41
4.7.5 Component matrix .......................................................................................................................... 43
4.8 Pearson correlation regression analysis of telecom customer expense information .......................... 44
4.9 Regression analysis and chi-square analysis results of telecom package ............................................ 48
4.9.1 Regression analysis results of telecom package ............................................................................. 48
4.9.2 Chi-square analysis results of telecom package .............................................................................. 49
Chapter 5 Discriminant Model for the Loss of Telecom Customers .................................. 51
5.1 The importance of the construction of the discriminant model for the loss of telecom customers 51
5.2 Bayesian linear discriminant model based on Fisher linear discriminant analysis ........................ 51
5.3 Empirical analysis for the discriminant model of telecom customers loss ....................................... 52
5.3.1 Selection of discriminant attributes ................................................................................................ 52
5.3.2 Result analysis of discriminant model ............................................................................................ 52
Chapter 6 Accurate Package Design Method ..................................................................... 57
6.1 Package design ......................................................................................................................................... 58
6.2 Tariff Calculation ..................................................................................................................................... 58
Chapter 7 Conclusions ...................................................................................................... 61
7.1 Main conclusions ...................................................................................................................................... 61
7.2 Limitations and expectations .................................................................................................................. 64
REFERENCES ................................................................................................................... 65
APPENDIX ........................................................................................................................ 68

GLOSSARY
Items Meaning of expression
MOU Minutes Of Usage
CRBT Color Ring Back Tone
MMS Multimedia Messaging Service
SMS Short Message Service
Local cost The cost generated by customers using local call service
Roaming cost The cost generated by customers using the mobile phone roaming
service
Unicom intranet cost The cost generated by customers using China Unicom intranet
service
Cost with China Mobile The cost generated by customers using China Mobile service
Cost with fixed line The cost generated by customers using fixed line
Monthly fixed cost The customers’ monthly fixed fee
Monthly total called MOU The total minutes of customers are called monthly
Monthly total caller MOU The total minutes of customers calling someone else
Total long-distance MOU The total minutes of customers making long-distance call

TABLES INDEX
Table 1-Summary of the Research Hypotheses .......................................................................... 31
Table 2-KMO and Bartlett’s test ................................................................................................. 39
Table 3-Common factor variance ............................................................................................... 40
Table 4-Total variance of interpretation ..................................................................................... 41
Table 5-Component score coefficient matrix .............................................................................. 43
Table 6-Pearson correlation coefficient intensity ....................................................................... 44
Table 7-Pearson correlation regression analysis result ............................................................... 44
Table 8-Pearson correlation regression analysis result ............................................................... 44
Table 9-Pearson correlation regression analysis result ............................................................... 45
Table 10-Pearson correlation regression analysis result ............................................................. 45
Table 11-Pearson correlation regression analysis result ............................................................. 46
Table 12-Pearson correlation regression analysis result ............................................................. 46
Table 13-Pearson correlation regression analysis result ............................................................. 47
Table 14-Multivariate “logistic” regression analysis results ...................................................... 48
Table 15-Chi-square analysis results of telecom package .......................................................... 49
Table 16-Eigenvalues .................................................................................................................. 52
Table 17-Lambda of Wilks ......................................................................................................... 53
Table 18-Classification function coefficients ............................................................................. 54
Table 19-Meaning of Independent variable ................................................................................ 55
Table 20-Discriminant result checklist ....................................................................................... 56
Table 21-one telecom company A package design framework .................................................. 58
Table 22-Initial calculation parameters of A package ................................................................ 59
Table 23-Target customer range assumptions for each grade package ...................................... 60
Table 24-combo charges calculated result .................................................................................. 60

FIGURES INDEX
Figure 1-“customer pyramid” subdivision figure ....................................................................... 26
Figure 2-clustering algorithm understand schemes .................................................................... 27
Figure 3-decision tree algorithm for example figure .................................................................. 28
Figure 4-the figure of customer segmentation function model based on data mining ................ 29
Figure 5-Conceptual Model and Research Hypotheses .............................................................. 33
Figure 6-Information about the selected packages of customers ................................................ 36
Figure 7-Consumer expenditure information about CRBT service ............................................ 37
Figure 8-Consumption information about interactive world flow .............................................. 38
Figure 9-Scree plot ...................................................................................................................... 41
Figure 10-precision package design business flow chart ............................................................ 57

APPENDIX INDEX
APPENXID 1-Sex ratio characteristics ...................................................................................... 68
APPENDIX 2-Characteristics of age distribution ...................................................................... 68

Chapter 1 Introduction
1.1 Framework and research motivation
With the rapid development of computer technology and Internet technology, people's lives have
undergone earth-shaking changes. Changes in the form of communication have prompted the
telecommunications industry to flourish. In the "big data era" of information explosion, as one of
the leading industries in the information age, the development of the telecom industry depends not
only on communication technology, but also on the resource optimization and configuration
capabilities of enterprises, and the management of huge information and data resources becomes a
enterprise. The key to improving competitiveness. Using data mining technology to improve the
effectiveness of telecom enterprise information processing, from the perspective of the company's
marketing level, in line with the internal needs of customer segmentation. The so-called customer
segmentation mainly refers to the behavior of dividing an existing customer of an enterprise into
different customer groups according to specific criteria.
Most traditional customer segmentation methods are based on criteria such as demographics and
socioeconomics. For example, the customer base is divided according to the customer's age, gender,
geographic location, occupation, social class and consumer behavior. However, the complexity of
customer data makes customer segmentation increasingly difficult. Telecom operators have
accumulated a large amount of customer information and consumption data during their
development. These data truly and objectively reflect the behavior of consumers. Combining data
mining technology with the rich data resources of the telecom industry can effectively segment
telecommunications customers and help telecommunications companies develop more accurate,
efficient and effective marketing strategies.
This study aims to understand the related concepts and theories of telecommunication industry,
telecom customers, market segmentation and data mining technology. On this basis, statistical
analysis software is used to descriptive statistical analysis of telecom customers' demographic
characteristics, business information and SMS usage. Then factor analysis, regression analysis and
discriminant analysis are used to analyze the SMS messages and expense characteristics of telecom

customers, providing a new vision and reference for the telecom industry to achieve accurate
packaging design. Based on the above research results, a discriminant model for the loss of telecom
customers is constructed, which will help telecommunications companies to obtain a control
method for telecom customer management risk. At last, data mining technology is used to optimize
the combination design of telecommunication services, which offer effective advice on precise
telecom package design to telecommunications companies. Part of it lays the theoretical foundation.
1.2 Objectives of the investigation
The main purpose of this research survey and analysis is to:
(1) Review the concepts of market theory, relevant research status of telecommunication industry
and data mining theory, and provide guidance for the direction of research, and lay a theoretical
foundation for the smooth development of the following research;
(2) Conduct literature survey and summary on the research status of market segmentation,
telecommunications industry and data mining technology, and seek methods and breakthrough
points for this research;
(3) Conduct customer characteristics analysis on the telecom market to understand the inherent laws
of the telecom market business and customer development;
(4) Using data mining technology to construct a telecom customer churn discriminant model, and
then obtain a control method for telecom customer management risk;
(5) Based on the above research results, data mining technology is used to optimize the combination
design of telecommunication services, which provides reference for customer segmentation
efficiency and business development in the telecom market.
1.3 Thesis structure
This research mainly includes nine parts, which are introduction, context, literature review, market
segmentation theory part, data mining technology theory part, telecom customer data analysis part,
customer churn discriminant model, business portfolio design optimization part and conclusion part.
A brief introduction to these nine sections is now available:
(1) Introduction: This part mainly introduces the main contents of the research, including the
research background and motivation, the purpose of the investigation and the main structure of the

article, laying the framework for the following;
(2) Contextualization: This part mainly introduces the development background of data mining
technology and the development background of the telecom market, and provides an environmental
basis for overall research;
(3) Literature review: This part mainly investigates and summarizes the research situation of
telecom customer market management and data mining development and application in recent
years, and provides reference for improving the research framework;
(4) Market segmentation theory part: This part mainly introduces the basic concepts and related
theories of market management and market segmentation, and provides support for telecom
customer feature analysis and telecommunication service analysis;
(5) Theoretical part of data mining technology: This part mainly introduces the basic concepts,
technical principles, applications and other aspects of data mining, and provides support for the
application analysis of data mining technology below;
(6) Telecom customer data analysis part: This part mainly uses statistical analysis software to
analyze the internal law of telecom customer data;
(7) Customer churn discriminant model construction part: This part mainly discusses the specific
application of data mining technology in discriminating customer churn;
(8) Business portfolio design optimization part: This part mainly studies how to use data mining
technology to integrate telecom services, thereby improving the utilization rate of telecom customer
resources;
(9) Conclusion: This part is a brief summary of this study.

Chapter 2 Contextualization
Nowadays, the informationization degree in the world is increasing, and all kinds of information
play a more and more important role in people's production and life. People not only enjoy the great
convenience brought by information technology, but also have to face the inconvenience caused by
too much information redundancy. Data mining technology is generated and developed in such a
context, it has solved this problem to a certain extent, people also can use information more
efficiently.
2.1 The emergence of data mining
In the information society, people face a huge amount of data, which makes people feel confused,
and even unable to start, on the other hand, many valuable and meaningful data are buried in them,
it is difficult to play its role. With the progress of science and technology, people find the solution
to this problem, through data mining technology, people can select valuable information from the
huge data, find out the law hidden in the data. With the continuous development of data mining
technology, it has played an important role in all walks of life, and promoted the development of
society.
2.2 The development process of data mining
In the 1980s, data mining technology emerged, and initially the technology was applied to the
commercial field.
In 1989, people held a conference in Detroit to discuss the development of data mining technology,
which was the first officially proposed data mining concept in the world.
At present, data mining technology has become a topic of increasing concern, and the research on
this technology is still ongoing, and the data mining system has been put into practical production
and application, and plays an important role. Data mining technology will still be greatly improved
in the future (Gangquan Si,Kai Zheng,Zhou Zhou, 2018).
2.3 definition of data mining
Data mining technology refers to the process of extracting hidden, meaningful, useful information
and conclusions from huge, incomplete, incomplete and random data. Therefore, future trends and

behaviors can be predicted and forward-looking and knowledge-based decisions can be made. Data
mining requires a variety of analytical methods and tools that can handle large amounts of data at
the same time.
2.4 What can data mining do?
Data mining can find the association between data, and some rules existing between variables. Data
can be classified, set up different categories and the corresponding classification criteria according
to the attributes of the data. Data mining can directly classify the source data, and do not need to set
up different categories, and only need to be classified according to the approximation between the
data. This method is called clustering analysis. Data mining can be used to model to collect past
data, get the change rule, as long as inputting the existing data, we can assess its future value range.
This paper build customer loss model through the historical data of the telecom customers to
determine the size of the possibility of the loss of telecom customers, and the accuracy rate reached
75%. In addition, data mining can analyze some special values, outliers and extreme values, and
find out the potential law of deviation from the conventional data. This method is called deviation
analysis. There are many methods of data mining, such as factor analysis and chi square analysis.
They can play a huge role in revealing the laws of data and extracting useful information (Wen-Yu
Chiang, 2017).
Chapter 3 Literature Review
With the rapid development of the information age, the telecommunications industry faces a more
complex competitive environment, but also faces the task of transforming internal resources and
technological innovation. In the current information explosion, how to make good use of all kinds
of information resources inside and outside the enterprise, inside and outside the industry, and mine
the content that is conducive to the development of the enterprise in the infinite data, provide an
effective basis for the improvement of the marketing strategy of the enterprise, and become the
modernization of the telecom enterprise. An important topic that cannot be evaded in development
(Yin Mao, 2018).
3.1 The application of marketing in the field of telecommunications
The emergence and development of marketing is an important foundation for all industries to
occupy superior resources and obtain comprehensive competitiveness. For the telecommunications
field, an in-depth understanding of marketing theory, adopting advanced and targeted marketing
strategies, will help promote the development of the telecommunications industry and its enterprises
(Feng Jiang, 2018). At present, the application research for marketing in the field of
telecommunications mainly focuses on marketing value analysis, marketing strategy analysis and
marketing development trend analysis.
And others used Pakistan's telecom business market as an example to conduct a relatively
comprehensive analysis of Pakistan's telecommunications development environment. Research
shows that the development of Pakistan's telecommunications business has become a rigid demand,
mainly due to the growing development of Pakistan. At the same time, the implementation of
China's “One Belt, One Road” strategy has also contributed to the vigorous development of
Pakistan's telecommunications business. On the basis of good development, the author also
emphasizes the development status of Pakistan's national economy. He believes that in the context
of the overall low level of national income, the development of telecommunication services should
pay more attention to economics. Therefore, in the formulation of marketing strategies, The price
strategy is not core(Syed Yasir Imtiaz,2015).
Some studies conducted a comprehensive evaluation of the customer value of the
telecommunications industry in the study, and completed the company's marketing objectives
through customer value analysis. The research indicates that in the marketing of the
telecommunications industry, it is necessary to maximize the lifetime value of customers, and at the
same time, build a model based on the customer's purchasing behavior, and use the fuzzy analytic
hierarchy process and the weighted RFM value TOPSIS method to rank the customer's lifetime
value. Provide a basis for the formulation of marketing strategies. The author uses the customer
value indicator to point out the direction of the marketing strategy of the telecom enterprise, and
largely follows the principles of the relevant theory of the consumer market. It also conforms to the
characteristics of the current social development and meets the essential needs of consumers.
However, in the process of customer value evaluation, the study did not take into account the
individual differences of customers, and lacked the division of customer types, resulting in one-
sided evaluation of customer lifetime value( Azadnia, A.H.,2011).
Some researches further analyzed the customer value in marketing in the study. Research shows
that customer value is an important reference factor in the process of formulating marketing
strategies. Different types of customers have different determinants of their value. At the same time,
different customers' value contributes to marketing performance. . Therefore, in the process of
customer value evaluation, enterprises should first classify customers, and can conduct research on
customer value contribution by means of model processing methods and system engineering
models. However, although the authors emphasized the value of the customer in the study,
especially the importance of the value of the group's customers, there was no detailed analysis of
the contribution of such high-value customers (Mikko Pynnonen, Paavo Ritala, and Jukka
Hallikas,2011).
After analyzing the consumer demand of Japanese mobile communication business customers,
realized that adult users have personal privacy protection and personalized differentiated services
for communication services, and suggested that communication providers strengthen product
innovation in user privacy protection service. (Yoshihiro Yamamoto ,2012)
And others believe that in the field of next-generation mobile communications, the differentiation of
product differences between enterprises will be further narrowed. To win market competitiveness,
enterprises can only work hard on services. At the same time, they also pointed out that as users'
demand for social services increases, how operators can meet the social needs of users will be one
of the deciding factors. (Claudio Feijoo, 2016)

3.2 Client subdivision
Customer segmentation is a segmentation strategy in which customer value is the core of marketing.
Enterprises usually develop marketing strategies based on customer segments with different values,
thereby improving the overall benefits of marketing. Customer segmentation has a long history of
research and development. Therefore, the concepts, methods, and systems of customer
segmentation have been basically improved, stabilized, and widely used.
Some researches proposed to identify and segment customers in the context of lifestyle. Related
research on lifestyle segmentation also stems from the assumption that the more you know about
customers, the more effective marketing tools you can take. Although this lifestyle subdivision
emphasizes the systematic nature of lifestyle, it still does not regulate its content. ( Lazer,1963)
Published an article in the year that the three subdivision theories of geographic subdivision,
demographic subdivision and sales subdivision dominated the market segmentation method to a
certain extent. However, because these three theories are too dependent on descriptive factors and
not causal factors, they cannot effectively predict the direction of customers' behavior in the future.
Therefore, a method of a new multiple criteria decision aiding approach for market segmentation
that integrates preference analysis and segmentation decision within a unified framework is
proposed. (Jiapeng Liu,2018)
Researchers use attitude-function methods to segment the market, provide services to each
individual's attitude, and identify groups to design a specific marketing mix for each functional
profile. This approach is a qualitative assessment of the attitudes of consumers in their physical
health and the development of a tool to identify the distribution of attitude functions. (Obinna O.
Obilo,2018)
Based on the mathematical planning method, some scholars have studied the market segmentation
strategy of the demand side platform, and established the selection model of the group real-time
bidding advertising market granularity, which serves as the basis for the market segmentation
strategy adjustment. (Rui Qin,2017)
Some researchers have explored the market segmentation needs of different market stages, and
proposed a multi-stage market segmentation and an empirical model of subdivision alignment to
strategically adjust the potential of multi-stage markets. (Thomas,2016)
Some studies proposed the RFM analysis method, which is a customer segmentation method widely

used in database marketing. It is based on three variables: consumer time interval, frequency and
monetary. Identify customers. R refers to the time interval since the customer's last consumption
behavior has occurred. The shorter the interval, the larger the R is. F refers to the number of times
the consumer behavior occurs in a certain period. The more times the customer is, the more likely it
is that the customer will reach a new transaction with the company; M refers to the amount of
consumption during a certain period of time. The larger the M, the more likely it is that the
customer is more likely to enter into a new transaction with the company. The RFM analysis scores
each indicator for each customer, then calculates the product of the three indicators, and then sorts
the results. Based on this, all customers are classified according to 20%, 60%, and 20%, and
implemented for different customers. Different strategies. The three influencing factors are
relatively easy for companies with databases to predict customer buying behavior. Predicting a
customer's purchase behavior with recent behavior is more accurate and effective than predicting
with either factor. (Hughes,1994)
Some researched argues that the right customer segmentation can effectively reduce costs while
gaining a stronger, more profitable market penetration. Enterprises focus on investing limited
resources into customers who have value and contribution to the company. Choosing and
determining those customers that the company should retain is very important for effective
customer retention and enhancing corporate profitability. Therefore, he believes that customers are
fine. Points are the key to a company's ability to successfully implement customer retention.
(Soper,2002)
Some studies points out that customer segmentation is based on relational and relationship costs.
Effective customer segmentation relies on relevant, efficient, and implementable, homogeneous
market segmentation, seeking a range of variables. To describe the behavioral needs of all aspects.
(Stringfellow,2004)
Some researched proposes that the customer market segmentation is conducive to the company's
products and production capacity to meet customer needs more closely and effectively, that is, to
facilitate the rational allocation of resources in potentially profitable market segments. (Albrecht,
2007)
It can be seen that market segmentation based on customer characteristics is widely recognized as
the main way to improve marketing efficiency and helps to improve the rational allocation of
resources.

3.3 Application of data mining in the field of telecommunications
The concept of data mining was first proposed at the first KDD International Academic Conference.
Among them, KDD is the English abbreviation for knowledge discovery in the database. KDD is a
specific process of discovering knowledge from a large data set, and data mining is the foundation
of KDD. Since the concept and idea of data mining, people have done a lot of application research
on data mining, and various academic discussions and research topics have also stimulated people's
research enthusiasm. In particular, the "Data Processing" special report launched by the famous
"science" magazine in the United States promotes the progress and development of data mining
technology. Data mining applications are mainly for the storage, analysis and processing of large-
scale data sets, and have high requirements on the computing performance of machines. In order to
reduce the performance requirements of data mining for computing machines, Google has
developed a parallel computing algorithm mechanism for processing big data through distributed
clusters, and released the famous Map Reduce computing model. The Map function defined in Map
Reduc first converts the data sequence into a data stream with a key-value pair structure, and then
reduces the size of the data stream by the Reduce function, which aggregates the key-value pairs
with the same key, reducing the data size. Provides the computing performance of the system.
Artur Rocha(2018) used the combined experimental data of the EU E-COMPARED Depression
Test to explore the expressive power of multi-relational inductive logic programming (ILP) data
mining methods. Vandana P. Janeja (2018) provides a mechanism for extracting task-related data
using master data management (MDM) from a clinical trial database, distributed across multiple
domain datasets; at the same time, researchers provide classification, aggregation Class and
association rule mining.
3.4 Basic concept of marketing
3.4.1 Basic concept of marketing
Marketing is a value activity or an activity. Achieving product sales (or exchange) is the core value
goal of marketing. Through marketing, the relationship between enterprises and consumers is built,
which is conducive to enhancing consumers' perception of enterprises and products. Second,
marketing is a process of information transfer. In this process, not only the transmission of
information between enterprises and potential consumers is realized, but also the communication of

information in enterprises, partners, consumers and even the whole society. Third, marketing
involves many links, including pricing, promotion, distribution, market research, etc. It is a
systematic project. Fourth, marketing is closely linked to corporate management. It can even be said
that marketing is the most important management behavior of an enterprise (Rick Ferguson, Bill
Brohaugh,2018). Based on this understanding, the author defines marketing as “enterprise in order
to realize the transmission of information about enterprises and products or services with
consumers, partners and the whole society, and use this communication to achieve sales of
enterprise products and obtain expected benefits. A series of active management activities around
market research, pricing, promotion, distribution and other activities.
The strategy is considered to be “a set of plans to achieve the goal”, or as a “comprehensive
combination of various strategies based on strategic objectives and development according to the
situation.” Marketing must pay attention to certain strategies. It is generally believed that the
marketing strategy refers to “the enterprise is based on the market conditions and the actual
situation of the enterprise, focusing on the strategic objectives of the enterprise, and starting from
the customer needs as much as possible, based on the experience of the previous market, combined
with the macroeconomic development situation and industry development. Prospects, etc., planned
design includes a series of strategic combinations including products, prices, channels and
promotion strategies.” Marketing strategy is an important path and guarantee for achieving
marketing objectives (Long Zhao, Qian Gao, XiangJun Dong, Aimei Dong, 2018). In other words,
the question to be solved by the marketing strategy is: how to meet the needs of consumers and
society? What measures need to be taken? How to make these measures effective marketing
strategies are mainly divided into product strategy, price strategy, channel strategy, and promotion
strategy. With the development of modern marketing practices, service strategies and brand
strategies have also received great attention. The product strategy aims to solve the problems of
“what products are needed in the market” and “what products can be provided by enterprises”; the
price strategy is to answer “business-to-product pricing and profit expectations”; the channel
strategy is to ensure the channel of the enterprise. Security, maintain channel security, so as to
better achieve marketing objectives; promotion strategy to solve "how to promote", "how to attract
consumers and put products into the market as soon as possible"; service strategy is for recent years
of service The importance of corporate marketing is enhanced to improve the customer's service
experience and win consumer loyalty; the brand strategy is aimed at the needs of brand competition

and plan how to promote corporate brand awareness as soon as possible. In addition to these
marketing strategies, there are communication strategies, customer strategies, and associated
strategies. It should be pointed out that there are many marketing strategies (Jiantao Wang; Caifeng
He; Yijun Liu, 2017). In the actual design of marketing strategies, enterprises often do not use a
single strategy, but a combination of multiple strategies. For example, a combination of products,
prices, channels, and promotional strategies. The combination strategy is the most basic trend in the
actual marketing strategy.
3.4.2 Marketing classic theory
(1)4Ps Marketing Theory. 4Ps marketing as a classic marketing theory, first developed by
American marketing scholar Jerome? Presented by Jerome McCarthy. 4Ps marketing theory
believes that product, price, pass and promotion are the four main factors affecting marketing
effectiveness. Among the four elements, the product is considered the basic element. The 4Ps
theory emphasizes that only products that meet market needs can gain an advantage in marketing. In
order to meet the needs of the market, companies are required to strengthen their product image
through reasonable product mix, product packaging and brand marketing. With the increasingly
fierce competition among modern enterprises, product personalization strategies or differentiation
strategies have been upgraded to strategic heights. Price is an economic factor that affects
marketing. In general, the higher the price, the more unfavorable the marketing. If the product has
strong brand influence or innovation, such as Apple's mobile phone, consumers are still willing to
pay a higher price for the product. Affected by the diffusion of technology, product homogeneity
between enterprises has become more and more prominent, and the role of channels in marketing
has also become increasingly prominent. Even “the channel has the world” has been widely
recognized in marketing theory and corporate practice. The more diverse and secure the channels,
the more beneficial it is to achieve the marketing goals of the company. Promotions are considered
narrowly defined marketing for a long time. Promotions can be applied to new product promotion,
market possession, elimination (or slow-moving) products to inventory, etc. It should be pointed out
that with the development of marketing, the four elements of 4Ps continue to expand, and there
have been 6Ps, 7Ps, 8Ps and other theories. . These theories integrate services, brands and other
elements into the marketing concept. In addition, according to the 4Ps theory, theories such as 4Cs

and 4Rs have also been born. 4Cs emphasizes that the marketing of enterprises is from the
perspective of consumers, and the essence is “4Ps theory based on consumer perspective”. The 4Rs
theory also emphasizes the need to establish positive relationships with consumers, aiming to
achieve the company's value goals by meeting consumer needs. Although there are differences in
the expression of these theories, the essential ideas are basically the same: not only through the
regulation of marketing factors such as products, prices, channels and promotions, but also to
achieve the corporate goals to achieve the strategic intentions of the enterprise (M. Ruiz; M.
Germán; L.M. Contreras; L. Velasco,2016).
(2)Integrated marketing theory. Following the 4Ps theory, marketing academics and major
companies have continuously summarized various theories according to marketing practices, such
as STP theory, network marketing theory, brand marketing theory and so on. The factors affecting
marketing are increasing. From a realistic perspective, the integration of various marketing elements
has become a fundamental trend in the development of marketing theory and practice. Therefore,
integrated marketing has been highly valued. The essence of integrated marketing is that “enterprise
can integrate various resources that are conducive to achieving its goals according to its own
strategic goals and actual disposable resources to maximize the benefits of the company.” In other
words, integrated marketing is to fully mobilize all kinds of positive Elements to achieve the goal of
corporate unity. According to the integrated marketing theory, consumers are at the core of
marketing, and companies must do their best to meet the needs of consumers (Vishal Mahajan,
Richa Misra, Renuka Mahajan, 2015). With the development of integrated marketing, it is currently
believed that integrated marketing includes at least two contents: First, the integration of marketing
functions, such as organic integration of brand building, after-sales service, market research and
product development. Second, the functional integration of relevant departments requires not only
the marketing department to actively participate in marketing, but also the cooperation of
production, R&D and finance departments.
3.5 Customer segmentation
3.5.1 The main method of customer segmentation
Everyone is different, and the things they like are different. Therefore, there are huge differences
between customers. A company cannot be liked by all customers. The customer’s loyalty to the
brand is not constant. . Therefore, in order to make users loyal to a certain brand according to value

marketing, the most important thing is to carry out customer segmentation work and analyze the
customers that can bring sustainable profits to the enterprise, so that the enterprise can guarantee
long-term profit and sustainable development. The methods to achieve customer segmentation are
as follows:
(1) Customer feature segmentation. The customer's socio-economic basis determines the customer's
needs, so when the customer's feature segmentation, the customer's socio-economic basis can be
subdivided, and the socio-economic foundation has many relevant elements, including geographic
elements, such as the customer's home address. , administrative districts, etc.; social factors, such as
age range, economic income, work industry, education level, etc.; psychological factors, such as
personality, lifestyle, etc.; and consumer behavior, such as home ownership, brand loyalty (Hui Li,
Di Wu, Gao-Xiang Li, Yi-Hao Ke,2015).
(2) Customer value interval segmentation. The value that customers can provide to the business is
different. Companies need to divide different value ranges and identify high-value customers that
can sustain growth for the business. The customer value range is sorted from high to low, and the
value interval is assigned to the segmented customer group according to the characteristics of the
customer. When developing a customer value interval, the segmentation attributes can be customer
responsiveness, customer loyalty, customer profit contribution, and so on.
(3) Customer common needs segmentation. Focus on customer segmentation and customer value
segmentation, identify the common needs reflected by the highest value customer segmentation, as
the wind vane and market main point of the business process, and develop differentiated marketing
solutions for the segmented customer market.
3.5.2 Definition of Customer Segmentation
In the mid-1950s, American scholar Wendell Smith first proposed the concept of customer
segmentation based on the heterogeneity theory of customer demand. He believes that market
resources are limited, and enterprises conduct market on this basis. Competition, so companies must
clarify the direction of business and development model, according to customer behavior attributes,
consumption practices, consumption concepts, potential needs, etc. to complete group
segmentation, in order to design targeted products and services in the actual market competition. In
terms of researching customer needs, different customers have different needs. Only by providing
differentiated products and services to meet the diverse needs of customers, can we make all

customers feel as satisfied as possible, and the entire customer. Group segmentation of group
characteristics is a prerequisite for meeting the diverse heterogeneity needs. Studying customer
value, different customers, the value brought to the enterprise is different, according to the amount
of value that the customer can bring to the enterprise, the customer group is divided into high-value
customers, low-value customers, potential value customers, etc., so customer segmentation Play an
extremely important role in business management (Junhai Ma, Tiantong Xu, Wandong Lou, 2018).
To study the ability of enterprises to deal with resources, the resources of enterprises are limited.
How to allocate resources to customers reasonably and maximize the benefits of resources is a
problem that enterprises need to seriously consider, so the statistics, analysis and subdivision of
customer groups are at this time. It has become particularly important to rely on research results for
resource allocation, which determines the operational efficiency of the company. Reasonable and
effective resource allocation, based on the characteristics of each type of customer group, the
implementation of targeted marketing activities, can maximize the value of each type of customer
groups, deepen potential profit points, help companies provide decision-making basis, reduce
operations Cost, improve management efficiency. The customer segmentation clarifies that
consumers themselves are also diverse and cannot respond to all consumers with a single strategy
(Kochetov Vadim, 2018). Customer segmentation can quickly improve the management level of the
organization, find the corresponding customer market, and then adopt different marketing strategies
for customers in different market segments.
Customer segmentation is a scientific analysis method. It divides customers into different customer
bases. In the customer base, the customer's communication needs, consumption characteristics, and
customer response to marketing are very similar. Different customer bases are independent of each
other, and the characteristics vary greatly. Telecommunications companies can adopt corresponding
marketing methods for each customer base, provide products or services that meet this customer
base, and greatly increase marketing efficiency.
The segmentation of "Customer Pyramid" is a segmentation type in customer segmentation, as
shown in the following figure: (Russell S.Winer, 2001)

Figure 1-“customer pyramid” subdivision figure
Source: California Management Review Summer, 2001
3.5.3 Customer Segmentation Technology
(1)Clustering algorithm
For the clustering of samples, the hierarchical clustering method is the most widely used one in
statistical clustering analysis. The basic principles of system clustering are as follows:
1. set each of the n samples or indicator as a single cluster, resulting in n clusters;
2. Calculate the degree of closeness between the samples (or indicators), which is their distance;
3. Combine the two clusters with the highest degree of closeness (the closest distance) into one
cluster, forming a new cluster;
4. Consider the degree of closeness between the merged cluster and other cluster, and then merge
again. Repeat this process. After n-1times of merging, all samples (or indicators) become a cluster;
5. Determine the number of clusters and obtain the corresponding cluster analysis result from the
above steps
The schematic diagram of clustering algorithms in data mining is shown in Figure 2: (Jukka
Kainulainen, 2002)

Figure 2-clustering algorithm understand schemes
Source: Clustering Algorithms: Basics and Visualization, 2002
(2)Decision tree
A decision tree is a tree structure that is similar to a flowchart, in which each internal node of the
tree represents a test of an attribute's value. Its branch represents the result of the test, and each leaf
node of the tree represents a category. The highest node of the tree is the root node. A path from the
root node to the leaf node of the decision tree forms the category prediction for the corresponding
object. Decision trees can be easily converted to classification rules.
Data classification operations of the decision tree usually are made of two steps:
1) Find a suitable representation model of the mapping function H: f (X) → C representation model
based on the given training set. This step is often referred to as the model training phase.
2) Use the category of the function model completed in the previous step to predict the type of data,
or use this function model to describe each type of data in the data set to form a classification rule.
The following figure shows the application of the decision tree algorithm in data mining: (Yishay
Mansour, 2011)

Figure 3-decision tree algorithm for example figure
Source: Decision Tree: Building, 2011
(3) Factor analysis
① The creation of Factor analysis
In 1904, Charles put forward the theory of factor analysis as he studied the theory of factor analysis
all his life and achieved great results. The development of factor analysis theory is based on
principal component analysis theory, the principle of which is to conclude different variables into
several factors, and then to study the influence of these factors on indicators that can be measured,
so that factors can be regarded as the basis of the variables classification. (Dimitris Panaretos,
George Tzavelas, Malvina Vamvakari, Demosthenes Panagiotakos, 2017)
② The mathematical model of factor analysis
First we have to measure the correlation coefficient matrix between different variables, and the
correlation between them. Then we have to select the factors and the requirement is that they can
represent all the variables and the number is limited. Then we group the variables and the variables
of the same group have high correlation. Any variable can be shown using a linear combination of
common factors. In this way, the number of variables is reduced, and all variables can be analyzed
using several factors.
③ Notes for factor analysis
The larger the amount of sample of the factor analysis, the better, as the conclusion obtained is
more reliable. The number of samples is at least five times the number of variables. If it's more than
ten times, better analysis results can be gained.
Each variable has a direct and strong correlation with others. It is a condition for factor analysis.

The Bartlett sphere test can be used to detect the correlation between factors. (Anna B. Costello,
Jason W. Osborne, 2005)
3.5.4 The implementation model of Customer Segmentation
Figure 4 is a model diagram of a customer segmentation function based on data mining. (Yun Chen,
Guozheng Zhang, Dengfeng Hu, Shanshan Wang, 2006)
Figure 4-the figure of customer segmentation function model based on data mining
Source: Customer segmentation in customer relationship management based on data mining, 2006
3.5.5 Customer segmentation in telecom marketing
(1) Group characteristics of telecom customers. The market of the telecommunications industry is
customer-centric, and the behavioral attributes of users are very characteristic. Only by first
understanding the characteristics of telecom customers can they be subdivided into group.
①Telecommunications companies need to maintain users with sustainable spending power because
of their sustainability, which is a particularly important feature of the telecommunications industry.
②The difference in customer consumption of telecom companies is obvious, covering two broad
categories, the first is based on customer groups and the second is distributed users. These two types
of users differ in nature and effectiveness, and service strategies are different.
③The telecommunications industry is rather special, and there are differences in the content that

telecom companies need to analyze, such as customer spending behavior, customer value, and
customer loyalty. (Salman Ahmad Awan & Muzafar Said, 2011)
(2) Telecommunications customer segmentation design goal based on data mining. In the design
process of telecommunications customer segmentation based on data mining, the objectives can be
summarized as follows:
①Customer classification: There are differences in customer groups. Different customers bring
great difference to the company's revenue. Identifying various customer groups can complete group
classification according to their consumption behaviors and habits, and can understand the overall
composition of customers. And characteristics.
②Feature Analysis: Collect customer behavior data to help companies conduct business analysis,
such as the ratio of new customers to old customers, brand recognition of different levels of
customers to the company, and contribution to the company's revenue.
③Market Forecast: Establishing a forecasting model to predict the future consumption behavior of
customers will help guide marketers to develop more accurate market strategies. The statistical tools
in the model are usually used to analyze the customer's consumption behavior attributes, predict the
next market actions that consumers may carry out, and carry out targeted marketing activities.
④ Auxiliary marketing: deepen the real needs of customers, meet customer expectations of sales
services, mobilize sales channels to develop marketing strategies to maximize customer value.
⑤Targeted Services: Understand customer preferences for products and provide products and
services to customers.
⑥ Price Positioning: Many customers are sensitive to price. Companies need to understand the
customer's ideas and use price strategies to respond to customer needs. (S.M.H. Jansen, 2007)

Chapter 4 Data Analysis by Applying SPSS Software
This graduation project adopted SPSS software to analyze the usage in telecom customers. Data
sources mainly included 5 Excel spreadsheets: Basic information, call information, short messages
(SMS) information, cost information and other business information in the targeted telecom
customers.
4.1 Design analysis and research hypotheses
Descriptive statistics, factor analysis, cluster analysis, discriminant analysis and other methods were
adopted to analyze relevant data of telecom customers in this paper, so as to obtain the demographic
characteristics of current telecom customers in our country and service features of SMS, customized
ring back tone (CRBT), etc. Furthermore, it is expected to provide operators with reasonable
suggestions for business improvement and potential customer discovery. In addition, the customer
loss model was established to determine the possibility of customer loss. Besides, several
characteristics of the lost telecom customers and related reasons for the loss were understood
through this model.
On this section will be made the sum of all the research hypotheses. Later on, at the results analysis
section, these hypotheses will be set for evaluation and discussion.
Table 1-Summary of the Research Hypotheses
Hypotheses Description
H1 SMS data of telecom customers are suitable for factor analysis.
(The data of telecom customers’ SMS can be used for factor analysis and
can achieve good results )
H2 The discriminant function for the loss of telecom customers is established.
(The discriminant equation for the loss of telecom customers is valid and
can effectively explain the reasons for telecom customers loss)
H3 The monthly total traffic MOU has a positive impact on the monthly total
receivable expense.
(The longer customers call monthly, the higher their total expense will be).
H4 Local cost has a positive impact on the monthly total receivable expense.

(The more customers use local call service, the higher their total expense
will be).
H5 Roaming cost has a positive impact on the monthly total receivable
expense.
(The more customers use the mobile phone roaming service, the higher their
total expense will be).
H6 Unicom intranet cost has a positive impact on the monthly total receivable
expense.
(The more customers use China Unicom intranet service, the higher their
total expense will be).
H7 Cost with China Mobile has a positive impact on the monthly total
receivable expense.
(The more customers use China Mobile service, the higher their total
expense will be).
H8 Cost with fixed line has a positive impact on the monthly total receivable
expense.
(The more customers use fixed line, the higher their total expense will be).
H9 Monthly total caller MOU has a positive impact on the monthly total
receivable expense.
(The longer customers call someone else, the higher their total expense will
be).
Source: The Author, 2018

Figure 5-Conceptual Model and Research Hypotheses
Source: The Author, 2018
4.2 Steps of the Investigation
The methodological options used at each step of the investigation were as follows:
(1)the descriptive statistics was adopted to analyze the customers’ demographic and business
information characteristics; (2)the factor analysis was used to analyze the customers’ SMS
information; (3)Pearson correlation regression analysis was adopted to test the impact of various
business characteristics of customers on the customers’ expense; (4)chi-square analysis was used to
study the impact of customers' age, gender and other attributes on the selection of package of the
customers; (5)at last, discriminant analysis was adopted to build the customers loss model to predict
if customers will be lost or retained.
The investigation began with the literature review to learn about the similar research in the field of
telecommunications concerning the same issue. The reason for this is to make more effective and
scientific suggestions for the development of telecom companies.

Then, it was important to select suitable analysis method according to the characteristics of the data
and verify the analysis results to ensure the accuracy of the conclusions. Therefore, defining the
field of analyze, the sample, the observation and data collection instruments was necessary. The
study aspired to better understand the inherent laws of the telecom market business and obtain a
control method for telecom customer management risk.
Building the observation instruments (data collection) was oriented by the data analysis methods
such as descriptive statistics and factor analysis, as on one hand the goal was to get a deeper
analysis of the topic in case and on the other hand to establish generalizations to other universes.
4.3 Paradigm and Data Collection Methodology
The data samples of the study were mainly from China's two major telecomm companies: China
Mobile and China Unicom. From the two companies, 4126 data samples were collected, which
consisted of 2942 male samples and 1184 female samples. And the data range mainly covered the
basic information, SMS, call, cost and other business information of telecom customers, which
provided a good data foundation for studying the demographic characteristics and business
characteristics of telecom customers.
For this research descriptive statistics, factor analysis, regression analysis and chi-square analysis
were used.
Maike Rahn (2013) stated that variable relationships for complex concepts such as socioeconomic
status or psychological scales can be investigated effectively by factor analysis, which allows
researchers to investigate concepts that are not easily measured directly.
According to Amy Gallo (2015), regression analysis is an effective way to sort out which of those
variables does indeed have an impact. The questions such as “which factors matter most?” and
“how do those factors interact with each other?” can be answered.
Therefore, for this investigation, descriptive statistics, factor analysis, regression analysis and chi-
square analysis were adopted to study the demographic characteristics and business characteristics
of telecom customers.
4.4 The Exploratory study and methodological options
Britt Hallingberg (2018) refers that “Exploratory studies, often termed pilot and feasibility studies,
are a key step in assessing the feasibility and value of progressing to an effectiveness study”.

G McLachlan (2004) stated that discriminant analysis was mainly concerned with the relationship
between a categorical variable and a set of interrelated variables which would enable the researcher
to examine whether significant differences exist among the groups, in terms of the predictor
variables.
The purpose of this study was to analyze the key factors that determine whether customers will be
lost or retained by using discriminant analysis, these factors were mainly: (1) Non-fixed monthly
fee; (2) Fixed monthly fee; (3) Monthly total called MOU; (4) Total long-distance and roaming
MOU; (5) Point-to-point SMS; (6) China Unicom MMS.
The exploratory study combined a discriminant analysis and an accuracy test. The discriminant
analysis s intention was to build a customer loss model to predict if customers will be lost or
retained. And the purpose of accuracy test was to verify the accuracy of the discriminant model.
4.5 Demographic characteristics of telecom customers
4.5.1 Sex characteristics
The sex ratio characteristics of telecom customers were shown in Table 1 in APPENDIX 1. As
shown in Table 2, among the enrolled 4,126 telecom customers, there were 1,184 females and 2,942
males, accounting for 28.7% and 71.3% of the total subjects, respectively. ③From this perspective,
the majority of telecom customers were males. The proportion of males was about 2 times that of
females.
4.5.2 Age characteristics
The age distribution characteristics of telecom customers were shown in Table 1 and Figure 1 in
APPENDIX 2. It could be found that among the 4,126 telecom customers, the age of customers was
concentrated in 20-60 years old, with 3,919 customers accounting for 95% of the total subjects; the
proportion of customers, aged just 40, accounted for the largest percentage, with 165 cases (4%).
The youngest customers were 9 years old, and the oldest was 107 years old, with one case in each
group. In view of this, telecom customers were mainly youth and middle-and-old-aged people. The
proportion of children and the elderly was relatively small in the included subjects.

4.6 Business information of telecom customers
4.6.1 Information about packages
Figure 6-Information about the selected packages of customers
Source: The Author, 2018
The information about packages selected by telecom customers was shown in Figure 6. Among the
4,126 telecom customers, GSHW10 package was the major choice and topped the list, with 1,036
people accounting for 25.11% of the total number, followed by the selection of GVIP10-2 package,
with 590 subjects (14.3%). In this regard, telecom customers had a clear preference for the selection
of packages, of which GSHW10, GVIP10-2 and other kinds of packages were most popular.
However, there were also corresponding customers groups in favor of the remaining packages with
a small proportion.

4.6.2 Information about CRBT service
Figure 7-Consumer expenditure information about CRBT service
Source: The Author, 2018
Figure 7 provided the consumer expenditure information about CRBT service of telecom customers
per month. Among the 4,126 telecom customers, there were 3,271 people who did not order the
CRBT service, with the largest proportion accounting for 79.28%. There were 546 people who
spent CNY 6 per month to order the CRBT service, with the second proportion accounting for
13.23%. The remaining 7.49% subscribers spent money, ranging from CNY 1 to CNY 46, to order
the CRBT service monthly with relatively uniform distributions. Therefore, most of the telecom
customers were not keen on the CRBT service. Only a small number of people were the fans of the
CRBT service, suggesting that the potential market of the business is huge and operators can further
develop the market of this service.

4.6.3 Information about interactive world flow
Figure 8-Consumption information about interactive world flow
Source: The Author, 2018
Figure 8 presented consumer information about interactive world flow of telecom customers per
month. Among the 4,126 telecom customers, the majority did not use interactive world flow with
898 people accounting for 21.76%. Coming in second, there were 311 (7.5%) users who spent CYN
1 on interactive world flow. The remaining 70.74% users spent money, ranging from CNY 2 to
CNY 99, on interactive world flow per month with relatively uniform distributions. Obviously,
most of the telecom customers used the interactive world flow, however, there were significant
difference in the consumer habits of different users. It indicates that the consumer habits need to be
cultivated. However, it is necessary to add that the consumption habits of telecom customers have
changed dramatically due to the stale data. Besides, the above conclusion was obtained based on the
data mined from the existing data.

4.7 Factor analysis results of SMS of telecom customers
4.7.1 Variables selection of factor analysis for SMS
In order to further analyze the related characteristics of cost factors, SPSS19 software was adopted
for factor analysis. The 5 selected variables were: ①The number of China Unicom's SMS, ②The
number of China Mobile’s SMS, ③The number of China Telecom’s SMS, ④The number of China
Unicom's MMS, and ⑤CRBT.
4.7.2 KMO and Bartlett’s test of sphericity (Testing the Research Hypotheses)
H1: SMS data of telecom customers are suitable for factor analysis
Table 2-KMO and Bartlett’s test
Value of test items
Kaiser-Meyer-Olkin measurement of
sampling sufficient degree 0.567
Bartlett’s test of sphericity
Approximate Chi-square value 636.772
df 10
Sig. 0
Source: The Author, 2018
In order to test whether the data were suitable for factor analysis, KMO test and Bartlett’s sphericity
test were carried out in SPSS software. When the value of KMO test is more than 0.5 or the P-value
of Bartlett’s sphericity test is less than 0.05, it indicates that data are suitable for factor analysis.
Table 4 provided the results of KMO and Bartlett’s sphericity test for the SMS data of telecom
customers. As shown in Table 2, the KMO test value of the selected data was 0.567>0.5, which
belonged to an acceptable range that was suited for factor analysis. It is suitable for factor analysis
when Sig=0.000<0.05. Therefore, hypothesis 1 confirms.

4.7.3 Common factor variance
Table 3-Common factor variance
Initial Extraction
The number of China Unicom's SMS 1 0.58
The number of China Mobile’s SMS 1 0.594
The number of China Telecom’s SMS 1 0.545
The number of China Unicom's MMS 1 0.556
CRBT 1 0.629
Extraction method: Principal component analysis
Source: The Author, 2018
One of the major tasks of factor analysis is to concentrate the original variables. Table 3 showed the
common factor variance of the common factor for the original variable. As shown in Table 3, the
common factor extracted was higher than 50% for the original information. The results revealed
that the overall effect was ideal, and the loss rate of information was rarely low in each variable,
indicating that the analysis results were scientific and representative.

4.7.4 Total variance of interpretation
Table 4-Total variance of interpretation
Ingredi
ent
Initial eigenvalues
Extraction sums of squared
loadings
Rotation sums of square
loadings
Total
% of
variance
Cumulativ
e % Total
% of
variance
Cumulativ
e % Total
% of
variance
Cumulative
%
1 1.458 29.151 29.151 1.458 29.151 29.151 1.313 26.265 26.265
2 1.047 20.937 50.087 1.047 20.937 50.087 1.191 23.822 50.087
3 0.971 19.423 69.51
4 0.815 16.291 85.801
5 0.71 14.199 100
Source: The Author, 2018
As illustrated in Table 4, the cumulative variance contribution rate of the first two factors reached
50.087%, suggesting that the represented information had been able to fully display the majority of
the original observed variables. Therefore, the first two common factors of F1 and F2 were selected
as the common factors to replace most of the original information.
Figure 9-Scree plot
Source: The Author, 2018
Scree plot of the characteristic roots was shown in Figure 9. From the scree plot, the characteristic

root of the first two common factors was greater than 1, showing the feasibility of selecting the first
two common factors for analysis.

4.7.5 Component matrix
Table 5-Component score coefficient matrix
Component
1 2
The number of China Unicom's SMS 0.596 -0.106
The number of China Mobile’s SMS 0.57 0.035
The number of China Telecom’s SMS 0.295 -0.034
The number of China Unicom's MMS 0.011 0.614
CRBT -0.12 0.685
Extraction method: Principal component analysis
Rotation method: The orthogonal rotation method with Kaiser standardization.
Source: The Author, 2018
Component score coefficient matrix was shown in Table 5. In the matrix presented in Table 5, the
second factor F2 had a larger load in the number of China Unicom's MMS and CRBT. Therefore,
the second factor F2 could be summed up as the factor reflecting MMS and CRBT. Furthermore,
there was a larger load of the first factor F1 in the number of China Unicom's SMS, the number of
China Mobile’s SMS, and the number of China Telecom’s SMS. Therefore, the first factor F1 could
be interpreted as the number of SMS.
Therefore, we were able to draw the conclusion with confidence: The SMS attributes of telecom
customers could be characterized by F5 (Common factor of SMS) and F6 (Common factor of China
Unicom's MMS). The calculation formulas of F5 and F6 were as follows:
F5= 0.596*The number of China Unicom's SMS+0.570*The number of China Mobile’s
SMS+0.295*The number of China Telecom’s SMS+0.011*The number of China Unicom's
MMS-0.120*CRBT
F6= -0.106*The number of China Unicom's SMS+0.035*The number of China Mobile’s
SMS-0.034*The number of China Telecom’s SMS+0.614*The number of China Unicom's
MMS-0.685*CRBT

4.8 Pearson correlation regression analysis of telecom customer expense information
In order to analyze the relationship between the variables proposed on the model and test the
research hypotheses it was used the Pearson correlation coefficients. Its values measure the
relationship between the variables set for study and vary between 1 (perfect direct relationship) and
– 1 (perfect inverse relationship); in cases which they are null (0), it means that there isn t any
association between the components in question.
The intensity of the Pearson correlation coefficient is as following:
Table 6-Pearson correlation coefficient intensity
Intensity Interval
Non - 0.09 to 0.0 0.0 to 0.09
Low - 0.3 to - 0.1 0.1 to 0.3
Medium - 0.5 to - 0.3 0.3 to 0.5
High - 1.0 to - 0.5 0.5 to 1.0
Source: The Author, 2018
Next, the research hypotheses tests will be settled in order to validate the conceptual model in study.
H3: The monthly total traffic MOU has a positive impact on the monthly total receivable
expense.
Table 7-Pearson correlation regression analysis result
the monthly total receivable expense
R P
monthly total traffic MOU 0.747 0.000
Source: The Author, 2018
The concept of “monthly total traffic MOU” means that the total time of customer’s call monthly.
(MOU is the abbreviation of “minutes of usage”) The high intensity of the Pearson correlation
coefficient (0.747 is between 0.5 and 1.0) and sig = 0.000 < 0.05 demonstrates a positive
relationship between the monthly total traffic MOU and the monthly total receivable expense.
Therefore, Hypothesis 3 confirms, which means the longer customers call monthly, the higher their
total expense will be.
H4: Local cost has a positive impact on the monthly total receivable expense.
Table 8-Pearson correlation regression analysis result
the monthly total receivable expense
R P
local cost 0.614 0.000

Source: The Author, 2018
“Local cost” refers to the expenses incurred by the customer when using the local call service,
mainly including the local calls. Table 8 tests the hypothesis of association between local cost and
the monthly total receivable expense. The high intensity of the Pearson value (0.614) and sig
=0.000 < 0.05 demonstrates the existence of a positive correlation between local cost and the
monthly total receivable expense. Hypothesis 4 is also confirmed, which means the more customers
use local call service, the higher their total expense will be.
H5: Roaming cost has a positive impact on the monthly total receivable expense.
Table 9-Pearson correlation regression analysis result
the monthly total receivable expense
R P
roaming cost 0.687 0.000
Source: The Author, 2018
The concept of “roaming cost” refers to the cost of the call generated by the customer using the
mobile phone roaming service. Through the observation of the table 9, it is possible to conclude that
there is a correlation between the roaming cost and the monthly total receivable expense. The high
intensity of the Pearson value (0.687) and sig =0.000 < 0.05 demonstrates the existence of a positive
correlation between the roaming cost and the monthly total receivable expense. Hypothesis 5 is also
confirmed, which means the more customers use the mobile phone roaming service, the higher their
total expense will be.
H6: Unicom intranet cost has a positive impact on the monthly total receivable expense.
Table 10-Pearson correlation regression analysis result
the monthly total receivable expense
R P
Unicom intranet cost 0.681 0.000
Source: The Author, 2018
“Unicom intranet cost” means cost incurred by customers using China Unicom intranet service.
According to table 10, there is a positive association between the Unicom intranet cost and the
monthly total receivable expense. The high intensity of the Pearson value (0.681) and sig =0.000 <
0.05 demonstrates the existence of a positive correlation between the Unicom intranet cost and the
monthly total receivable expense. Hypothesis 6 is also confirmed, which shows the more customers
use China Unicom intranet service, the higher their total expense will be.

H7: Cost with China Mobile has a positive impact on the monthly total receivable expense.
Table 11-Pearson correlation regression analysis result
the monthly total receivable expense
R P
cost with China Mobile 0.824 0.000
Source: The Author, 2018
The concept of “cost with China Mobile” means cost generated by customers using China Mobile
service. Concerning the hypothesis of association between the cost with China Mobile and the
monthly total receivable expense, it is possible to conclude, from the analysis of table 11 that cost
with China Mobile has a positive impact on the monthly total receivable expense. The high intensity
of the Pearson value (0.824) and sig =0.000 < 0.05 demonstrates the existence of a positive
correlation between cost with China Mobile and the monthly total receivable expense. Hypothesis 7
is also confirmed, which shows that the more customers use China Mobile service, the higher their
total expense will be.
H8: Cost with fixed line has a positive impact on the monthly total receivable expense.
Table 12-Pearson correlation regression analysis result
the monthly total receivable expense
R P
cost with fixed line 0.709 0.000
Source: The Author, 2018
The concept of “cost with fixed line” means cost incurred by customers using fixed line. Table 12
displays the hypothesis of association between the cost with fixed line and the monthly total
receivable expense. The high intensity of the Pearson value (0.709) and sig =0.000 < 0.05
demonstrates the existence of a positive correlation between the cost with fixed line and the
monthly total receivable expense. Hypothesis 8 is also confirmed, which shows that the more
customers use fixed line, the higher their total expense will be.

H9: Monthly total caller MOU has a positive impact on the monthly total receivable expense.
Table 13-Pearson correlation regression analysis result
the monthly total receivable expense
R P
monthly total caller MOU 0.742 0.000
Source: The Author, 2018
The concept of “monthly total caller MOU” means that the total time of customers calling other
people monthly. (MOU is the abbreviation of “minutes of usage”) Through the observation of the
table 13, it is possible to conclude that there is a correlation between the monthly total caller MOU
and the monthly total receivable expense. The high intensity of the Pearson value (0.742) and sig
=0.000 < 0.05 demonstrates the existence of a positive correlation between the monthly total caller
MOU and the monthly total receivable expense. Hypothesis 9 is also confirmed, which means that
the longer customers call someone else, the higher their total expense will be.

4.9 Regression analysis and chi-square analysis results of telecom package
4.9.1 Regression analysis results of telecom package
Table 14-Multivariate “logistic” regression analysis results
B S.E. Wald P OR
monthly fixed cost -0.264 0.01 720.534 0 0.768
local cost 0.011 0.002 31.326 0 1.011
Unicom intranet cost 0.012 0.004 11.74 0.001 1.012
cost with fixed line 0.012 0.003 13.032 0 1.012
the number of China Unicom point-to-point
SMS messages
0.003 0.001 20.083 0 1.003
the number of China Mobile point-to-point SMS
messages
0.003 0 51.2 0 1.003
monthly total caller MOU -0.009 0.001 146.646 0 0.991
monthly total called MOU -0.002 0 18.517 0 0.998
total long-distance MOU 0.005 0.001 18.148 0 1.005
total roaming MOU -0.023 0.009 6.997 0.008 0.977
Constant 0.917 0.073 159.156 0 2.502
Source: The Author, 2018
The introduction of multivariate“logistic” regression analysis is to better explore the impact of
each independent variable on telecom package. Taking the telecom package as the dependent
variable, the variables were screened by the “Backward Stepwise” method, and the hypothesis test
was performed by the “wald” method. Table 14 shows that the impact of monthly fixed cost, local
cost, Unicom intranet cost, cost with fixed line, the number of China Unicom point-to-point SMS
messages, the number of China Mobile point-to-point SMS messages, monthly total caller MOU,
monthly total called MOU, total long-distance MOU and total roaming MOU on telecom package
selection were statistically significant (P<0.05).
In this paper, Y was used to represent the telecom package selection of customer and each
independent variables were represented by X1, X2...X10, respectively. The multivariate “logistic”
regression equation was as follows.
Y=0.917-0.264*X1+0.011*X2+0.012*X3+0.012*X4+0.003*X5+0.003*X6-0.009*X7
-0.002*X8+0.005*X9-0.023*X10
This results mean the more customers use local service, the more customers use China Unicom
intranet service, the more customers use fixed line, the more customers send China Unicom point-
to-point SMS messages, the more customers send China Mobile point-to-point SMS messages, the
longer customers make long-distance call, then the possibility of customers choosing G-type

package was greater (OR>1, indicating there is a positive correlation between the independent
variables and the dependent variable). On the contrary, the higher the customers’ monthly fixed fee
are, the longer customers call someone else, the longer customers are called, the more customers
use the mobile phone roaming service, then the possibility of customers choosing other types of
packages was greater (OR<1, indicating there is a negative correlation between the independent
variables and the dependent variable).
4.9.2 Chi-square analysis results of telecom package
Table 15-Chi-square analysis results of telecom package
Telecom package name
Other
packages
G-type packages χ2 P
Gender Male 744 25.3% 2198 74.7% 20.697 0.000
Female 382 32.3% 802 67.7%
Age Young people 405a 27.4% 1073a 72.6% 42.358 0.000
middle-aged people 559a 24.9% 1690a 75.1%
Elderly people 162b 40.6% 237b 59.4%
Telecom business
brand name
8044 48a 14.1% 292a 85.9% 580.09 0.000
8100 774b 22.8% 2626b 77.2%
8381 304c 78.8% 82c 21.2%
Source: The Author, 2018
According to the results of χ2 chi-square analysis, in the gender dimension, there was the largest
number of male chose G-type packages, with 2198 subjects accounting for 74.7% of the total males.
There were 802 females chose G-type packages, accounting for 67.7% of the total females.
Considering the above, both male and female telecom customers prefer G-type packages. Apart
from that, χ2=20.697, P<0.05, which means the difference in package selection between different
genders was statistically significant. Compared with women, men chose G-type packages more.
In the age dimension, G-type packages were still the priority selections for customers of all ages,
with 1690 middle-aged people accounting for 75.1% of the total middle-aged people, 1073 young
people accounting for 72.6% of the total young people, followed by the elderly people, with 237
subjects(59.4%). In this regard, telecom customers of all ages had a clear preference for the
selection of packages, of which G-type packages was most popular. Besides, χ2=42.358, P<0.05,
which shows the difference in package selection at different age stages was statistically significant.
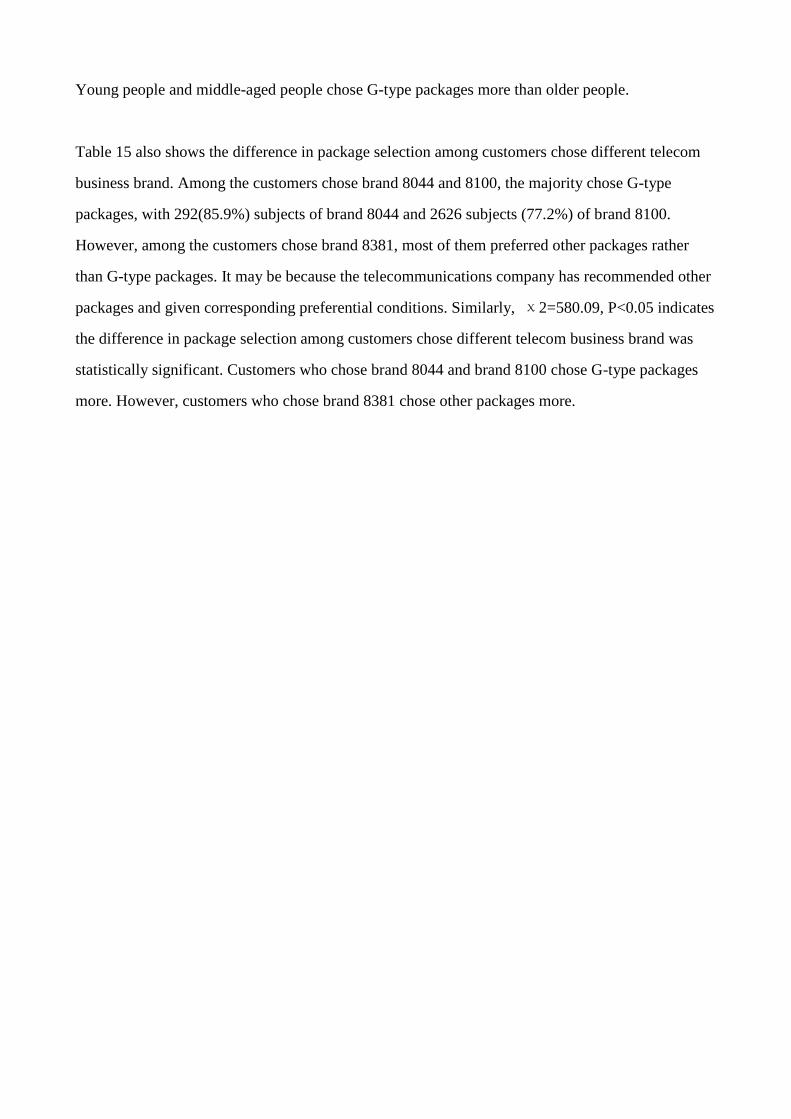
Young people and middle-aged people chose G-type packages more than older people.
Table 15 also shows the difference in package selection among customers chose different telecom
business brand. Among the customers chose brand 8044 and 8100, the majority chose G-type
packages, with 292(85.9%) subjects of brand 8044 and 2626 subjects (77.2%) of brand 8100.
However, among the customers chose brand 8381, most of them preferred other packages rather
than G-type packages. It may be because the telecommunications company has recommended other
packages and given corresponding preferential conditions. Similarly, χ2=580.09, P<0.05 indicates
the difference in package selection among customers chose different telecom business brand was
statistically significant. Customers who chose brand 8044 and brand 8100 chose G-type packages
more. However, customers who chose brand 8381 chose other packages more.

Chapter 5 Discriminant Model for the Loss of Telecom
Customers
5.1 The importance of the construction of the discriminant model for the loss of telecom
customers
Fisher (1936) proposed the concept of discriminant analysis, but there was no theoretical support at
that time. In 1950s, with the advent of Bayesian discrimination, the rationality of Fisher's
discrimination was confirmed as well. The two discriminant analysis was called Fisher discriminant
analysis collectively. Analysis of historical samples and construction of discriminant models can
contribute to determining the division of existing samples.
Customers are extremely important to telecom operators. Customers are both the object of service
and the source of income. Therefore, it is essential to understand and analyze the satisfaction of
customers and establish a discriminant model for telecom customer loss. Through substituting the
attribute of the customer into the discriminant equation, it may conducive to the judgment of the
possibility of customers loss in the study, and further promoting the adoption of targeted measure to
avoid the loss of customers.
5.2 Bayesian linear discriminant model based on Fisher linear discriminant analysis
Bayesian statistics refers that when there is a certain understanding to the object of study, prior
probability distribution can be adopted for description. Then samples can be used to correct the
previous results. The posterior probability distribution is thus obtained in this way. Accordingly,
various analyses can be carried out through the posterior probability distribution. Bayesian
discriminant is a typical case of adopting this discriminant analysis.
The projection is the basic method of Fisher discrimination. For certain point x= (x1, x2, x3,„, xp)
in the P dimensional space, a linear function y (x) can be established to reduce to a one-dimensional
value.
jj xCx y (1)
Then, the totality of the known categories and the sample belonging to category to be distinguished
are reduced to one-dimensional data by the established linear function y(x). Furthermore, according
to their affinities, the points of sample are further taken into consideration to determine their
categories. The linear function y (x) needs to be used for dimension reduction of every point in the

P dimensional space, so as to achieve a better discriminant effect.
Corresponding advantages are listed as follows:
(1) There is always a certain projection direction that can remain the linear separability of samples
after dimension reduction. Samples with centralized distribution are all the same type of samples,
and those with far-distance distribution are samples with different types.
(2) Fisher method can directly solve the weight vector*w ;
(3) Fisher’s linear discriminant function can be extended to a variety of cases, and is applicable to
cases of stochastic models.
5.3 Empirical analysis for the discriminant model of telecom customers loss
5.3.1 Selection of discriminant attributes
Discriminant analysis is to build an appropriate discriminant model according to the existing and
classified historical data, so as to to determine the source accordingly by giving a new data.
Distance discrimination refers to such an idea of discriminating according to the distance relation
between the sample and the parent. First, the distance discriminant of the sample on the parent is
established through historical data. Then, data of each sample are substituted into the distance
discriminant to calculate the distance. The sample belongs to the nearest parent.
5.3.2 Result analysis of discriminant model
(1) Eigenvalues of the discriminant function
Table 16-Eigenvalues
Function
Eigenvalues
% of
variance
Cumulative
% Regular correlation
1 .030a 100 100 0.171
Source: The Author, 2018
a. The first one typical discriminant function was used in the analysis.
The larger the eigenvalue of the discriminant function suggests higher discriminating judgment
power of the function. The last column indicated the canonical correlation coefficient. It represented
the square root of the ratio of the sum of squares between groups to the sum of the total square sum,
indicating the degree of correlation between the fraction of discriminant function and the group.
The discriminant function's eigenvalue was 0.030, and the canonical correlation was 0.171, which
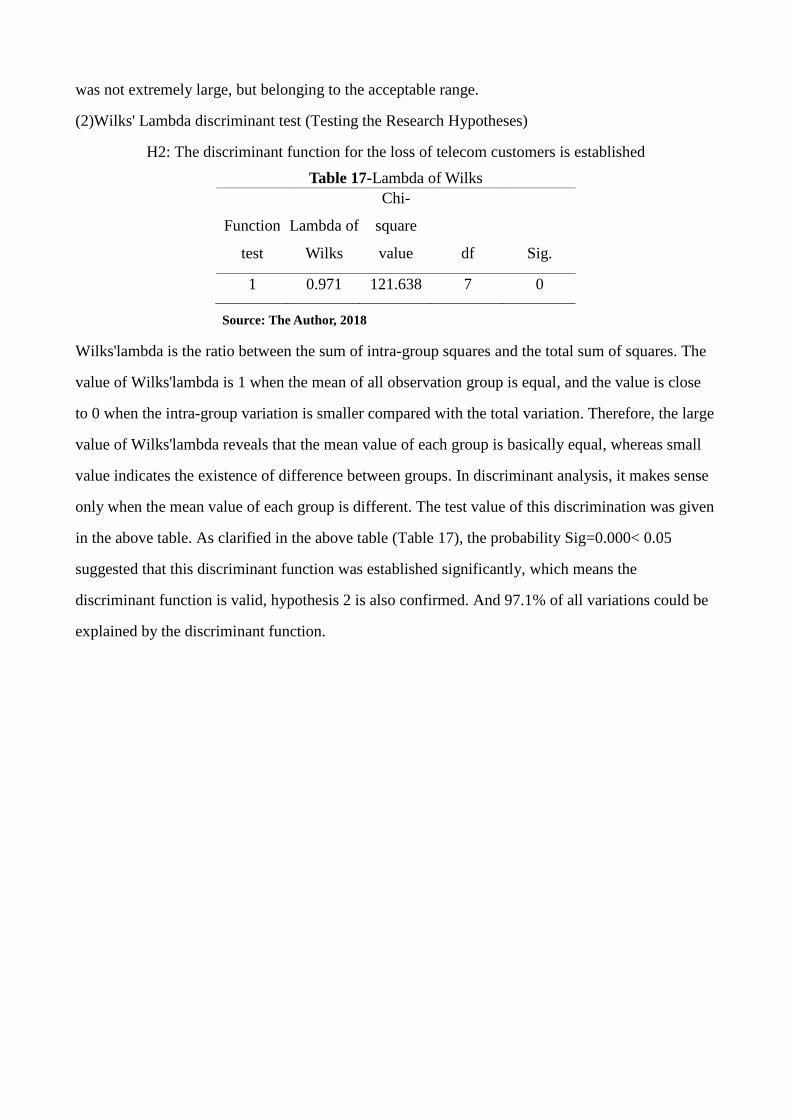
was not extremely large, but belonging to the acceptable range.
(2)Wilks' Lambda discriminant test (Testing the Research Hypotheses)
H2: The discriminant function for the loss of telecom customers is established
Table 17-Lambda of Wilks
Function
test
Lambda of
Wilks
Chi-
square
value df Sig.
1 0.971 121.638 7 0
Source: The Author, 2018
Wilks'lambda is the ratio between the sum of intra-group squares and the total sum of squares. The
value of Wilks'lambda is 1 when the mean of all observation group is equal, and the value is close
to 0 when the intra-group variation is smaller compared with the total variation. Therefore, the large
value of Wilks'lambda reveals that the mean value of each group is basically equal, whereas small
value indicates the existence of difference between groups. In discriminant analysis, it makes sense
only when the mean value of each group is different. The test value of this discrimination was given
in the above table. As clarified in the above table (Table 17), the probability Sig=0.000< 0.05
suggested that this discriminant function was established significantly, which means the
discriminant function is valid, hypothesis 2 is also confirmed. And 97.1% of all variations could be
explained by the discriminant function.
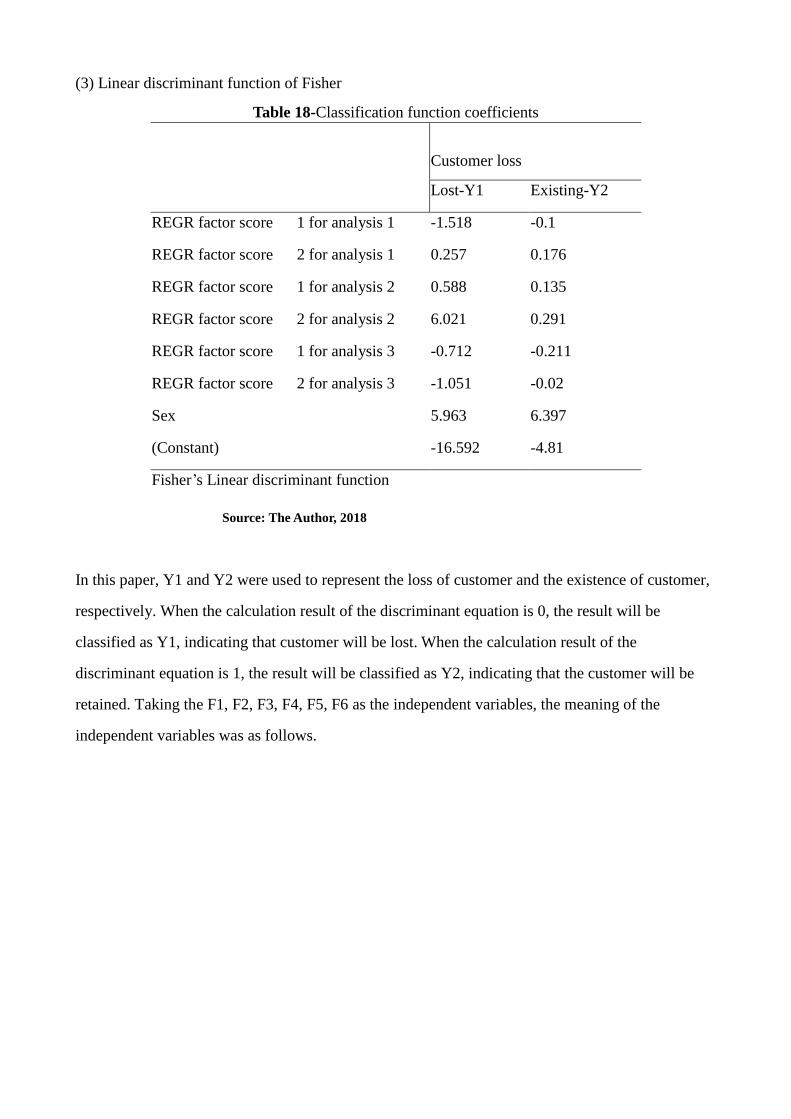
(3) Linear discriminant function of Fisher
Table 18-Classification function coefficients
Customer loss
Lost-Y1 Existing-Y2
REGR factor score 1 for analysis 1 -1.518 -0.1
REGR factor score 2 for analysis 1 0.257 0.176
REGR factor score 1 for analysis 2 0.588 0.135
REGR factor score 2 for analysis 2 6.021 0.291
REGR factor score 1 for analysis 3 -0.712 -0.211
REGR factor score 2 for analysis 3 -1.051 -0.02
Sex 5.963 6.397
(Constant) -16.592 -4.81
Fisher’s Linear discriminant function
Source: The Author, 2018
In this paper, Y1 and Y2 were used to represent the loss of customer and the existence of customer,
respectively. When the calculation result of the discriminant equation is 0, the result will be
classified as Y1, indicating that customer will be lost. When the calculation result of the
discriminant equation is 1, the result will be classified as Y2, indicating that the customer will be
retained. Taking the F1, F2, F3, F4, F5, F6 as the independent variables, the meaning of the
independent variables was as follows.

Table 19-Meaning of Independent variable
Independent variable Meaning of Independent variable
F1 Non-fixed monthly fee
(The total cost generated by customers using
local call service, the mobile phone roaming
service, China Unicom intranet service,
China Mobile service and fixed line)
F2 Fixed monthly fee
(The customers’ monthly fixed fee)
F3 Monthly total called MOU
(The total minutes of customers are called
monthly)
F4 Total long-distance and roaming MOU
(The total minutes of customers making
long-distance call and using the mobile
phone roaming service)
F5 Point-to-point SMS
(The sum of point-to-point SMS of China
Mobile, China Unicom and China Telecom
sent by the customers)
F6 China Unicom MMS
(The China Unicom MMS sent by the
customer)
Source: The Author, 2018
According to the data characteristics, since the independent variables were continuous data, the
Fisher discriminant function was selected.
The corresponding independent variables and dependent variables data were imported into the SPSS
software, and the Fisher discriminant analysis method was selected, then the specific Fisher
discriminant equation was obtained as follows.
Y1=-16.592-1.518*F1+0.257*F2+0.588*F3+6.021*F4-0.712*F5-1.051*F6+5.963*Sex
Y2=-4.810-0.100*F1+0.176*F2+0.135*F3+0.291*F4-0.211*F5-0.020*F6+6.397*Sex

The discriminant equation shows the key factors (F1, F2, F3, F4, F5 and F6) that determine whether
the telecom customer will be lost or not. The telecom company can import the customers’ cost, call,
SMS and MMS data into the discriminant equation to predict whether the customer will be lost or
retained. If the final calculation result is 0, it will be classified as Y1, indicating that the customer
will be lost. If the final calculation result is 0, it will be classified as Y2, indicating that the
customer will be retained.
Therefore, the telecom company can effectively predict the loss of customers, and then avoid
customer loss by taking measures such as reducing monthly fixed fees or increasing the number of
SMS messages in the customer package.
(4)Accuracy test of discriminant function
A total of 100 samples from January 2015 to March 2015 were selected to conduct the statistical
test. The specific results of the prediction were as follows.
Table 20-Discriminant result checklist
Items Existing
customers
Lost
customers Total
Discriminant
results 50 50 100
Correct
discriminant 36 39 75
Wrong
discriminant 14 11 25
Accuracy rate 0.72 0.78 0.75
Source: The Author, 2018
The above table (Table 20) showed the specific analysis results. It could be seen from the table that
among 100 test samples, there were a total of 100 actually lost customers and existing customers.
According to Fisher's linear discriminant function, 14 were “lost” and 36 remained “existing” among
50 actually existing customers with the accuracy rate of 72%. While among 50 actually lost customers,
39 were “lost” and 11 remained “existing” with the accuracy rate reaching 78% based on Fisher's
linear discriminant function 1. Overall, of the 100 customers, 75 were correctly judged, and 25 were
incorrect. Therefore, the accuracy of the discriminant equation is 75%, which is an acceptable range.

Chapter 6 Accurate Package Design Method
Precise package design refers to the targeted design and pricing of package through customer
classification obtained from customer segmentation. It maximizes customer acceptance of package
within a manageable risk range, while increase the company's business volume and revenue.
In general, the precise package design process is nested within the targeted marketing process in
actual applications. In addition to refining the package design process, the latter also includes analysis
of previous business issues, the marketing and design execution of the marketing plan and marketing
evaluation processes.
The following business process flow illustrates the implementation steps of the precise package
design:
Figure 10-precision package design business flow chart
Source: The Author, 2018

6.1 Package design
In the following example, we use the local service package (hereinafter abbreviated as A package)
integrated by a telecom company's fixed line and mobile phone as an example to introduce the
package design and the method for calculating the tariff.
A package includes business / product content: fixed-line service, mobile local service, fixed-line
caller ID, mobile phone caller ID, and fixed-line ringtone, mobile free answering;
A package model: basis + Free Usage + Metering.
It leads to the combo design framework; see Table Table 21 one telecom company A package design
framework
Table 21-one telecom company A package design framework
Source: The Author, 2018
After that, all pending parameters “XX” in the table are determined through tariff measurement.
6.2 Tariff Calculation
The tariff calculation refers to the historical behavior data of customers using the services of
telecommunication companies. If customers use this package, we measure changes in customer
expenses and income of telecommunications companies, so as to forecast the real impact of the launch
of the package. In the course of designing the package, the accuracy of pricing is increased, and the
attractiveness to customers is maximized. At the same time, the income decrease of the
telecommunication companies can be effectively controlled and the probability of increase in revenue
is increased.
The tariff measurement is usually divided into three steps: First, determine the initial measurement

parameters based on business experience; second, determine the tariff calculation formula according
to the tariff design framework; third, the historical behavior data of the targeted customers is put into
the formula to calculate. Parameters have to be adjusted according to the calculation results. Then
repeat the third step until the results meet the requirements. The following example uses the A
package as an example to introduce how to calculate the tariff.
First, determine the initial calculation parameters as shown in Table 22.
Table 22-Initial calculation parameters of A package
Source: The Author, 2018
Then, based on the package design framework, we have to determine several tariff calculation
formulas : a. customer spending before using the package = fixed monthly fee + fixed local time
duration * fixed local unit price + fixed value-added service fee + local time duration of the mobile *
Mobile local unit price + mobile value-added service fee; b. Telecom company income before the
package = fixed monthly fee + fixed local time duration * fixed local unit price + fixed value-added
service fee + (phone local time duration * mobile local unit price + Mobile value-added service fees)
*10%; c. Customer spending after using the package = Telecom company income after using the
package = Package fee + Fixed line local overtime period * unit price for the extra part of Fixed line
+ Mobile local overtime duration * Mobile phone over unit price; d. Change rate in customer spending
before and after using the package = (Customer spending after using the package - Customer spending
before using the package) / Customer spending before using the package; e. Change rate of income
of the telecommunication company before and after using the package = (Telecom company revenue
after using the package - Telecom company income before the package) / Telecom company income
before using the package.
Among them, the paid calculation formula implies two assumptions: a. According to the market
conditions, the local telecommunication company's local mobile business accounts for about 10% of
all customers' local mobile business; b. After the customer uses the package, all the amounts of local
mobile business is transferred to the telecommunication company; In addition, according to the initial
calculation parameters of the package, it is necessary to make assumptions about the range of target

customers that will use all grades of package, as shown in Table 23.
Table 23-Target customer range assumptions for each grade package
Source: The Author, 2018
Based on the tariff calculation formula and the above assumptions, the calculation of each measured
index can be performed by substituting the historical behavior data of each grade target customer into
the formula. Tariff calculation usually cannot gain the optimal package plan in one time, so it is a
process of repeated index calculation and parameter adjustment. The goal of A package design in this
paper is to protect and enhance the income of the telecommunication company. The final tariff
calculation results are shown in Table 24. Among them, before/after the use of the package is referred
to as “pre/post”, customer spending after using each grade of package decreased by an average of
2.42 yuan, 4.54 yuan and 6.34 yuan respectively, with the decreasing ratio of 3.38%, 4.84%, and
5.48%; The company's income increased by 12.16 yuan, 19.93 yuan, and 28.05 yuan on average after
the customers used each grade of package, and the increase rate was 21.29%, 28.75%, and 34.53%
respectively, which means that the customer's spending decreased slightly while the goal of
significantly increase the income of the telecommunication company was met.
Table 24-combo charges calculated result
Source: The Author, 2018

Chapter 7 Conclusions
7.1 Main conclusions
This paper carries out an analysis of the characteristics of telecom customers by SPSS software. After
pretreatment of data sources, an in-depth study was conducted concerning the demographic, business,
SMS messages and expense characteristics of telecom customers with the adoption of methods such
as descriptive statistics, factor analysis, cluster analysis and discriminant analysis to establish a
customer loss model. Then precise combo was designed through customer classification obtained
from customer segmentation. It maximizes customer acceptance of telecom package within a
manageable risk range, while increase the company's business volume and revenue. At last, the tariff
was calculated to forecast the real impact of the launch of the telecom package, increase the accuracy
of pricing, maximize the attractiveness to customers and the control the income decrease of the
telecommunication companies. The main conclusions are as follows:
1. The results of frequency analysis indicated that firstly, most telecom customers were males, about
twice as many as female customers; besides, the telecom customers were dominated by youth and
middle-and-old-aged people, whereas children and the elderly accounted for only a small
proportion; moreover, packages such as GSHW10 and GVIP10-2 were the most accepted while
other packages though had their corresponding customers groups, but the proportion was small;
additionally, the potential market for CRBT service was huge and could be further developed for
business by operators; lastly, although most telecom customers were using interactive world flow,
different customers had different consumption habits.
2. The telecom customers' SMS attributes can be characterized by F5 (common factor of SMS) and
F6 (common factor of China Unicom's MMS).
Formulas for F5 and F6 are as follows:
F5= 0.596*The number of China Unicom's SMS+0.570*The number of China Mobile’s
SMS+0.295*The number of China Telecom’s SMS+0.011*The number of China Unicom's
MMS-0.120*CRBT
F6= -0.106*The number of China Unicom's SMS+0.035*The number of China Mobile’s SMS-
0.034*The number of China Telecom’s SMS+0.614*The number of China Unicom's MMS-
0.685*CRBT.
3. Moreover, multiple linear regression equations for telecom customer expense information is
constructed to study the relationship between the expense and the call、SMS message of telecom
customers.
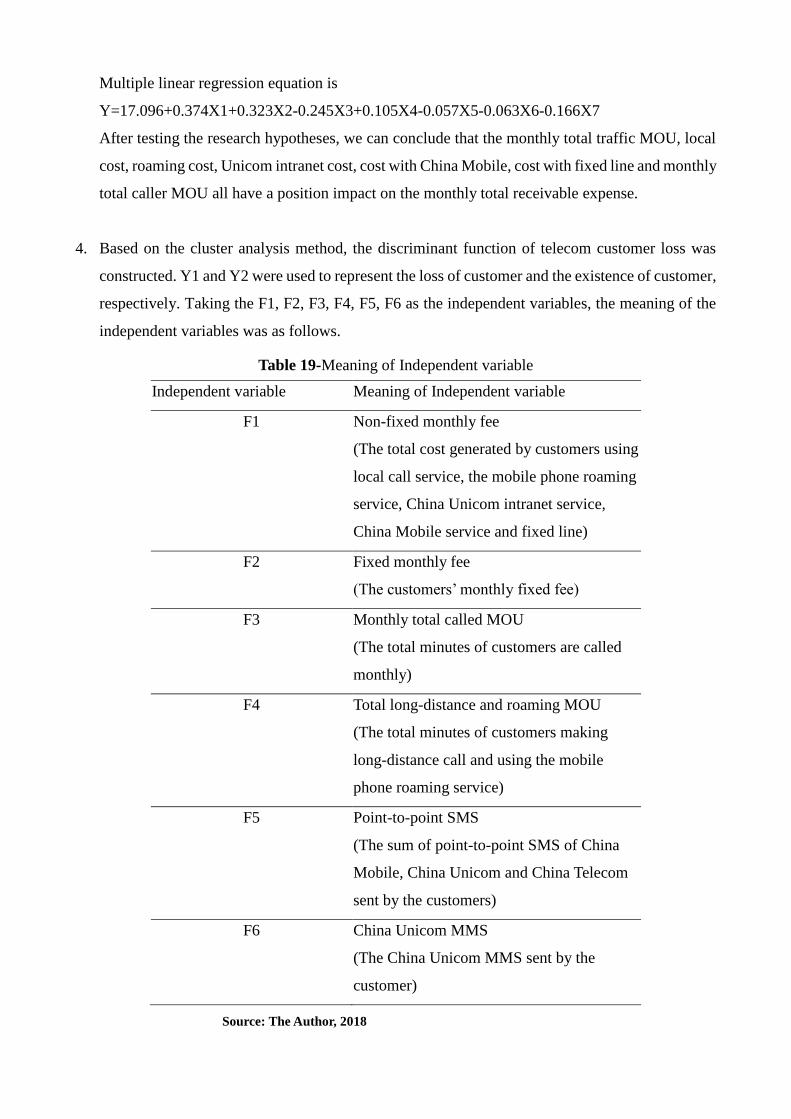
Multiple linear regression equation is
Y=17.096+0.374X1+0.323X2-0.245X3+0.105X4-0.057X5-0.063X6-0.166X7
After testing the research hypotheses, we can conclude that the monthly total traffic MOU, local
cost, roaming cost, Unicom intranet cost, cost with China Mobile, cost with fixed line and monthly
total caller MOU all have a position impact on the monthly total receivable expense.
4. Based on the cluster analysis method, the discriminant function of telecom customer loss was
constructed. Y1 and Y2 were used to represent the loss of customer and the existence of customer,
respectively. Taking the F1, F2, F3, F4, F5, F6 as the independent variables, the meaning of the
independent variables was as follows.
Table 19-Meaning of Independent variable
Independent variable Meaning of Independent variable
F1 Non-fixed monthly fee
(The total cost generated by customers using
local call service, the mobile phone roaming
service, China Unicom intranet service,
China Mobile service and fixed line)
F2 Fixed monthly fee
(The customers’ monthly fixed fee)
F3 Monthly total called MOU
(The total minutes of customers are called
monthly)
F4 Total long-distance and roaming MOU
(The total minutes of customers making
long-distance call and using the mobile
phone roaming service)
F5 Point-to-point SMS
(The sum of point-to-point SMS of China
Mobile, China Unicom and China Telecom
sent by the customers)
F6 China Unicom MMS
(The China Unicom MMS sent by the
customer)
Source: The Author, 2018
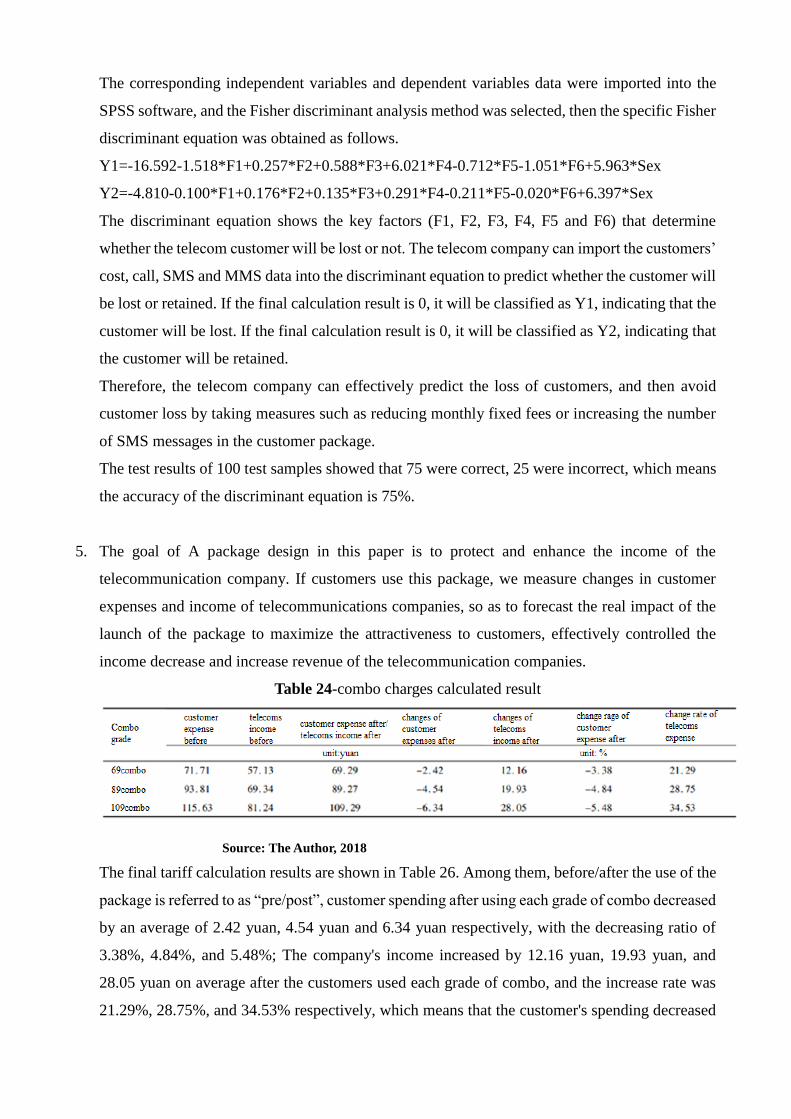
The corresponding independent variables and dependent variables data were imported into the
SPSS software, and the Fisher discriminant analysis method was selected, then the specific Fisher
discriminant equation was obtained as follows.
Y1=-16.592-1.518*F1+0.257*F2+0.588*F3+6.021*F4-0.712*F5-1.051*F6+5.963*Sex
Y2=-4.810-0.100*F1+0.176*F2+0.135*F3+0.291*F4-0.211*F5-0.020*F6+6.397*Sex
The discriminant equation shows the key factors (F1, F2, F3, F4, F5 and F6) that determine
whether the telecom customer will be lost or not. The telecom company can import the customers’
cost, call, SMS and MMS data into the discriminant equation to predict whether the customer will
be lost or retained. If the final calculation result is 0, it will be classified as Y1, indicating that the
customer will be lost. If the final calculation result is 0, it will be classified as Y2, indicating that
the customer will be retained.
Therefore, the telecom company can effectively predict the loss of customers, and then avoid
customer loss by taking measures such as reducing monthly fixed fees or increasing the number
of SMS messages in the customer package.
The test results of 100 test samples showed that 75 were correct, 25 were incorrect, which means
the accuracy of the discriminant equation is 75%.
5. The goal of A package design in this paper is to protect and enhance the income of the
telecommunication company. If customers use this package, we measure changes in customer
expenses and income of telecommunications companies, so as to forecast the real impact of the
launch of the package to maximize the attractiveness to customers, effectively controlled the
income decrease and increase revenue of the telecommunication companies.
Table 24-combo charges calculated result
Source: The Author, 2018
The final tariff calculation results are shown in Table 26. Among them, before/after the use of the
package is referred to as “pre/post”, customer spending after using each grade of combo decreased
by an average of 2.42 yuan, 4.54 yuan and 6.34 yuan respectively, with the decreasing ratio of
3.38%, 4.84%, and 5.48%; The company's income increased by 12.16 yuan, 19.93 yuan, and
28.05 yuan on average after the customers used each grade of combo, and the increase rate was
21.29%, 28.75%, and 34.53% respectively, which means that the customer's spending decreased
slightly while the goal of significantly increase the income of the telecommunication company
was met.
7.2 Limitations and expectations
The sample data used in this paper are historical data from around 2007, and it has been nearly 10
years since then. Due to the rapid development of the communications industry, various telecom
products keep changing with each passing day. Therefore, the market has undergone great changes,
and the relevant analysis results may not apply to the current market any more.
Due to the lack of completeness of sample data, this paper has encountered great difficulties in
multivariable analysis, especially when the corresponding meanings of some codes, such as telecom
customers’ information on careers and packages, were not clearly defined. Moreover, the lost
information cannot be speculated from the final results. Therefore, results of multivariate analysis are
not presented in this paper. If more complete sample data can be obtained in the future, this part will
be further studied and analyzed.
Through the theoretical analysis and empirical study of the demographic characteristics and business
information features of telecom customers, this study has successfully established a discriminant
model of customer loss based on the telecom customer data. In future researches, the model can be
further improved from the following aspects to achieve an increase in the accuracy of the forecast.
(1) To improve the effectiveness of model prediction by the method of repeated data testing year by
year and repeated data entering of telecom customer data to produce samples.
(2) Data involved in this study is from only one operator. If accurate and real data from other operators
become available in future studies, the reliability of this model can be further examined.
(3) In order to further improve the timeliness and practicability of the model, some forward-looking
predictive indicators can be applied into the study of the model to improve its predictability.
Additionally, the choice of parameters in this paper is made on the basis of the past experience of
relevant literature. The specific meaning behind each parameter needs to be further understood. At
the current stage, the practical use of the model is achieved but the theory and mechanism behind it
are not fully understood, and in my opinion, this is where further studies are needed in my research
career. Therefore, the frequency analysis, factor analysis and customer loss discriminant model in
this paper can only be applied to this sample data and cannot provide a reference for any other data
sources for the time being. If new samples need to be studied, the parameters should be changed and
a new analysis should be conducted.
Therefore, in future studies, more updated data will be collected for further analysis to obtain research
results that are more consistent with the current telecommunications market.

REFERENCES
Albrecht (2007), “16-MDCT Angiography of Aortoiliac and Lower Extremity Arteries: Comparison
with Digital Subtraction Angiography”, American Journal of Roentgenology, Vol.189.
Artur Rocha, Rui Camacho, Jeroen Ruwaard, Heleen Riper (2018), “Using multi-relational data
mining to discriminate blended therapy efficiency on patients based on log data”,Internet
Interventions, Vol.12, pp.135-138.
Azadnia, A.H (2011), “Supplier Selection: A Hybrid Approach Using ELECTRE and Fuzzy
Clustering”, Communications in Computer and Information Science, Vol.252.
Britt Hallingberg (2018), “Exploratory studies to decide whether and how to proceed with full-scale
evaluations of public health interventions: a systematic review of guidance”, 2018.
Claudio Feijoo (2016), “Techno-economic implications of the mass-market uptake of mobile data
services: Requirements for next generation mobile networks”, Telematics and Informatics, Vol.33,
Issue 2, pp.600-612.
Dimitris Panaretos, George Tzavelas, Malvina Vamvakari, Demosthenes Panagiotakos (2017),
“Repeatability of dietary patterns extracted through multivariate statistical methods: a literature
review in methodological issues”, International Journal of Food Sciences and Nutrition, Vol.68,
Issue 4.
Feng Jiang (2018), “Wood‐Based Nanotechnologies toward Sustainability”, Advanced Materials,
Vol.30, Issue1.
Fisher (1936), “The use of multiple measurements in taxonomic problems”, 1936.
Gangquan Si, Kai Zheng, Zhou Zhou (2018), “Three-dimensional piecewise cloud representation for
time series data mining”, Neurocomputing, Vol.316.
G McLachlan (2004), “Discriminant analysis and statistical pattern recognition”, 2004.
Hughes (1994), “Evidence for executive dysfunction in autism”, Neuropsychologia, Vol.32, Issue 4,
pp.477-492.
Hui Li;Di Wu;Gao-Xiang Li;Yi-Hao Ke (2015), “ Enhancing Telco Service Quality with Big Data
Enabled Churn Analysis: Infrastructure, Model, and Deployment”, Journal of Computer Science
and Technology, Vol.30 (6), pp.1201-1214.
Jiantao Wang; Caifeng He; Yijun Liu (2017), “Efficient alarm behavior analytics for telecom
networks”, Information Sciences, Vol.402, pp.1-14.
Jiapeng Liu, Xiuwu Liao, Wei Huang, Xianzhao Liao (2018), “Market segmentation: A multiple
criteria approach combining preference analysis and segmentation decision”, Omega, Vol.110,
pp.324-326.
Junhai Ma;Tiantong Xu;Wandong Lou (2018), “ Research on a Triopoly Dynamic Game with Free
Market and Bundling Market in the Chinese Telecom Industry”, Discrete Dynamics in Nature and
Society, Vol.2018.
Joseph T. Plummer (1974), “The Concept and Application of Life Style Segmentation”, Journal of
Marketing, Vol. 38, No. 1, pp. 33-37.
Kochetov Vadim (2018), “Overview of different approaches to solving problems of Data Mining”,
Procedia Computer Science, Vol.123, pp.234-239.
Long Zhao; Qian Gao; XiangJun Dong; Aimei Dong; Xue Dong (2018), “ K- local maximum
margin feature extraction algorithm for churn prediction in telecom”, Cluster Computing, Vol.20
(2), pp.1401-1409.
M. Ruiz; M. Germán; L.M. Contreras; L. Velasco (2016), “Big Data-backed video distribution in
the telecom cloud”, Computer Communications,Vol.84, pp.1-11.
Mikko Pynnonen, Paavo Ritala, and Jukka Hallikas (2011), “The new meaning of customer value: a
systemic perspective”, Journal of Business Strategy, Vol. 32, Issue 1, pp.51-57.
Obinna O. Obilo, Bruce L. Alford (2018), “Market segmentation via attitudinal functions: a multi-
method approach”, Qualitative Market Research: An International Journal, Vol.21, pp.145-
148.
Rick Ferguson,;Bill Brohaugh (2018), “ Telecom's search for the ultimate customer loyalty
platform”, Journal of Consumer Marketing, Vol.25 (5), pp.314-318.
Rui Qin, Yong Yuan, Fei-Yue Wang (2018), “A Pareto Optimal Mechanism for Demand-Side
Platforms in Real Time Bidding Advertising Markets”, Information Sciences, Vol.78, pp.117-121.
Russell S.Winer (2001), “A Framework for Customer Relationship Management”, the regents of the
California CMR, Vol.43, issue 4, pp.89-105.

Soper (2002), “Pathology of hepatocellular carcinoma and its precursors using proton magnetic
resonance spectroscopy and a statistical classification strategy”, Pathology, Vol.34, Issue 5.
Stringfellow (2004), “Post Hatching Development: a Novel System for Extended in Vitro Culture of
Bovine Embryos”, Biology of Reproduction, Vol.71, Issue 6, pp.2048–2055.
Syed Yasir Imtiaz (2015), “Telecom sector of Pakistan: Potential, challenges and business
opportunities”, Telematics and Informatics, Vol.32, Issue 2, pp.254-258.
Vandana P. Janeja (2018), “Collaborative data mining for clinical trial analytics”, Intelligent Data
Analysis, Vol. 22, no. 3, pp. 491-513.
Vishal Mahajan; Richa Misra; Renuka Mahajan (2015), “Review of Data Mining Techniques for
Churn Prediction in Telecom”, Journal of Information and Organizational Sciences, Vol.39 (2).
Wei-Chao Lin; Chih-Fong Tsai; Shih-Wen Ke (2015), “Dimensionality and data reduction in
telecom churn prediction”, Kybernetes, Vol.43 (5), pp.737-749.
Wen-Yu Chiang (2017), “Applying data mining for online CRM marketing strategy”, British Food
Journal, Vol.120 (3), pp.665-675.
Wen-Yu Chiang (2017), “Discovering customer value for marketing systems: an empirical case
study”, International Journal of Production Research, Vol.55.
Yun Chen, Guozheng Zhang, Dengfeng Hu, Shanshan Wang (2006), “Customer Segmentation in
Customer Relationship Management Based on Data Mining”, International Conference on
Programming Languages for Manufacturing, Vol.207, pp 288-293.
Yuxia Lei, Yushu Yan, Yonghua Han, Feng Jiang, Tianyong Hao (2018), “The Hierarchies of
Multivalued Attribute Domains and Corresponding Applications in Data Mining”, Wireless
Communications and Mobile Computing, Vol.20, pp.221-225.
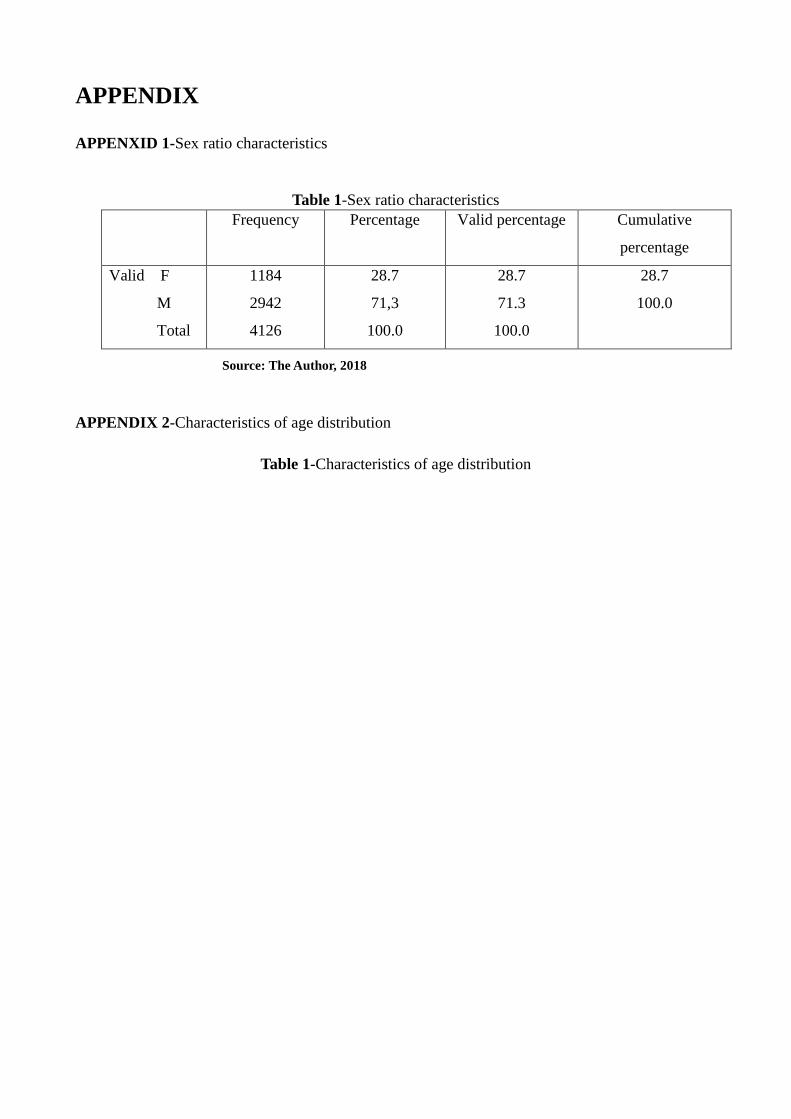
APPENDIX
APPENXID 1-Sex ratio characteristics
Table 1-Sex ratio characteristics
Frequency Percentage Valid percentage Cumulative
percentage
Valid F
M
Total
1184
2942
4126
28.7
71,3
100.0
28.7
71.3
100.0
28.7
100.0
Source: The Author, 2018
APPENDIX 2-Characteristics of age distribution
Table 1-Characteristics of age distribution
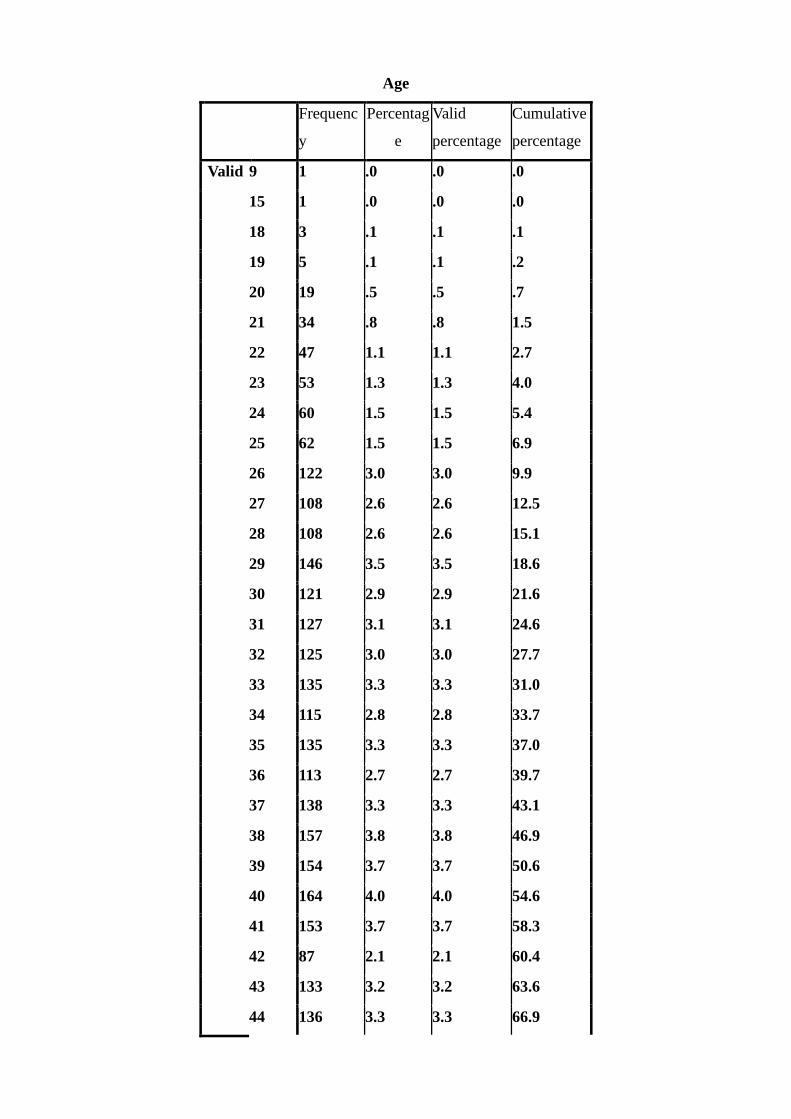
Age
Frequenc
y
Percentag
e
Valid
percentage
Cumulative
percentage
Valid 9 1 .0 .0 .0
15 1 .0 .0 .0
18 3 .1 .1 .1
19 5 .1 .1 .2
20 19 .5 .5 .7
21 34 .8 .8 1.5
22 47 1.1 1.1 2.7
23 53 1.3 1.3 4.0
24 60 1.5 1.5 5.4
25 62 1.5 1.5 6.9
26 122 3.0 3.0 9.9
27 108 2.6 2.6 12.5
28 108 2.6 2.6 15.1
29 146 3.5 3.5 18.6
30 121 2.9 2.9 21.6
31 127 3.1 3.1 24.6
32 125 3.0 3.0 27.7
33 135 3.3 3.3 31.0
34 115 2.8 2.8 33.7
35 135 3.3 3.3 37.0
36 113 2.7 2.7 39.7
37 138 3.3 3.3 43.1
38 157 3.8 3.8 46.9
39 154 3.7 3.7 50.6
40 164 4.0 4.0 54.6
41 153 3.7 3.7 58.3
42 87 2.1 2.1 60.4
43 133 3.2 3.2 63.6
44 136 3.3 3.3 66.9

45 149 3.6 3.6 70.6
46 161 3.9 3.9 74.5
47 84 2.0 2.0 76.5
48 73 1.8 1.8 78.3
49 87 2.1 2.1 80.4
50 79 1.9 1.9 82.3
51 87 2.1 2.1 84.4
52 69 1.7 1.7 86.1
53 69 1.7 1.7 87.7
54 65 1.6 1.6 89.3
55 61 1.5 1.5 90.8
56 50 1.2 1.2 92.0
57 49 1.2 1.2 93.2
58 25 .6 .6 93.8
59 50 1.2 1.2 95.0
60 28 .7 .7 95.7
61 17 .4 .4 96.1
62 22 .5 .5 96.6
63 13 .3 .3 96.9
64 16 .4 .4 97.3
65 14 .3 .3 97.7
66 13 .3 .3 98.0
67 6 .1 .1 98.1
68 12 .3 .3 98.4
69 4 .1 .1 98.5
70 14 .3 .3 98.9
71 12 .3 .3 99.2
72 6 .1 .1 99.3
73 3 .1 .1 99.4
74 5 .1 .1 99.5
75 4 .1 .1 99.6
76 2 .0 .0 99.6

77 3 .1 .1 99.7
79 1 .0 .0 99.7
80 3 .1 .1 99.8
81 1 .0 .0 99.8
82 3 .1 .1 99.9
84 1 .0 .0 99.9
101 1 .0 .0 100.0
103 1 .0 .0 100.0
107 1 .0 .0 100.0
Total 4126 100.0 100.0
Source: The Author, 2018
Figure 1-Characteristics of age distribution
Source: The Author, 2018


![Optical Navigation Divisionleos.unipv.it/slides/lecture/AgrestiPDF[1].pdf · 2009-11-23 · Datacom – telecom networks Pluggable solutions 10 Gb platforms and segmentation within](https://img.pdfslide.net/doc/110x75/5e9ec2378ff0726eff2d1ba7/optical-navigation-1pdf-2009-11-23-datacom-a-telecom-networks-pluggable.jpg)