Embed Size (px)
Citation preview
See important disclosures at the end of this report Powered by EFATM
Platform 1
Sector Update, 17 December 2014
Telecommunications Overweight (from Neutral)
Time To Check Back In
Macro
2
Risks
2
Growth
2
Value
2
Quarterly industry revenue and growth
Source: Bloomberg
Industry regulatory cost to service revenue
Source: Bloomberg
Industry 3G penetration rate
Source: Company, RHB
Veena Naidu License No. 24418, 66 2862 9752
Jeffrey Tan +603 9207 7633
Vikran Lumyai (Research Assistant)
P/E (x) P/B (x) Yield (%)
Dec-15F Dec-15F Dec-15F
Advanced Info Services THB240.00 THB278.94 16.9 14.3 5.9 BUY
Jasmine International THB6.80 THB8.72 13.1 3.5 3.5 BUY
Total Access Communications THB95.50 THB132.92 16.6 10.9 8.6 BUY
Company Name Price Target Rating
Source: Company data, RHB
We upgrade the Thai telco sector to OVERWEIGHT from Neutral given the sector’s improved risk-to-reward profile. The better economic outlook and a critical mass of smartphone users achieved should drive robust data growth allowing for greater regulatory cost savings. Our Top Pick for the sector remains Total Access Communications (DTAC), as the market has under-appreciated its internet strategy, with the stock being a major sector and SET laggard.
Recovery in sight. We believe the weakness in the industry’s mobile
service revenue (-0.9% for 9M14) has bottomed out, setting the stage for a stronger 2015. Overall industry revenue grew 6.2% YoY in 3Q14 vs a contraction of 1% in 1H14 – the strongest since 2Q13. Our economics team expects Thailand’s real GDP growth to pick up momentum in 4Q14 vs +0.6% in 3Q14 and +0.4% in 2Q14, with 2015 GDP growth projected at 4% from 0.9% in 2014, driven by the recovery in domestic demand and a sustained rebound in exports. This should drive a projected 3-5% growth in mobile service revenue for 2015 from 1-2% in 2014.
Rising smartphone adoption. We project 3G subscriber penetration to
reach 90% by end-2015 (4Q14: 84%) with >50m subscribers on smartphones vs 46% in 4Q14. This should drive non-voice revenue contribution to 49% of industry service revenue (excluding interconnection charge) in 2015.
Fixed broadband (FBB) take-up on the rise. Despite the entry of new
operators, the FBB market in Thailand remains underserved. We expect FBB penetration rate to rise to 40% over the next five years from 27% in 3Q14. This augurs well for Jasmine International and Advanced Info Services (AIS). We are positive on AIS’ fibre-to-the-home (FTTH) ambitions, given its lower cost to serve and the opportunity to bundle a triple play offering across its 3G base.
Lower fees would underpin sector earnings. Regulatory cost as a
percentage of service revenue has fallen to 15.3% in 3Q14 from 25.1% in 2Q13 as more 2G subs migrate to 3G. We project regulatory cost to decline further to 10% and 15% for AIS and DTAC respectively in 2015 (3Q14: 15.6% and 21.6%), which should drive our 2015F earnings growth of 10.7% and 25% for AIS and DTAC.
Spectrum auction. Although the NBTC has signalled its intention to
restart the auction process in Jan 2015, we do not rule out further regulatory setbacks that could derail the process amidst the restructuring challenges faced by the state-owned agencies. We gather that DTAC is exploring the option of returning the unused 25MHz spectrum ahead of the auction in 3Q15.
OVERWEIGHT. While we have BUYs on AIS and DTAC, we prefer the
latter as that it has the lowest spectrum risk and commands a superior FY14F-16F earnings CAGR of 23% alongside an attractive dividend yield of 6.5%-7%, which is one of the highest among its regional peers.
Telecommunications 16 December 2014
See important disclosures at the end of this report 2
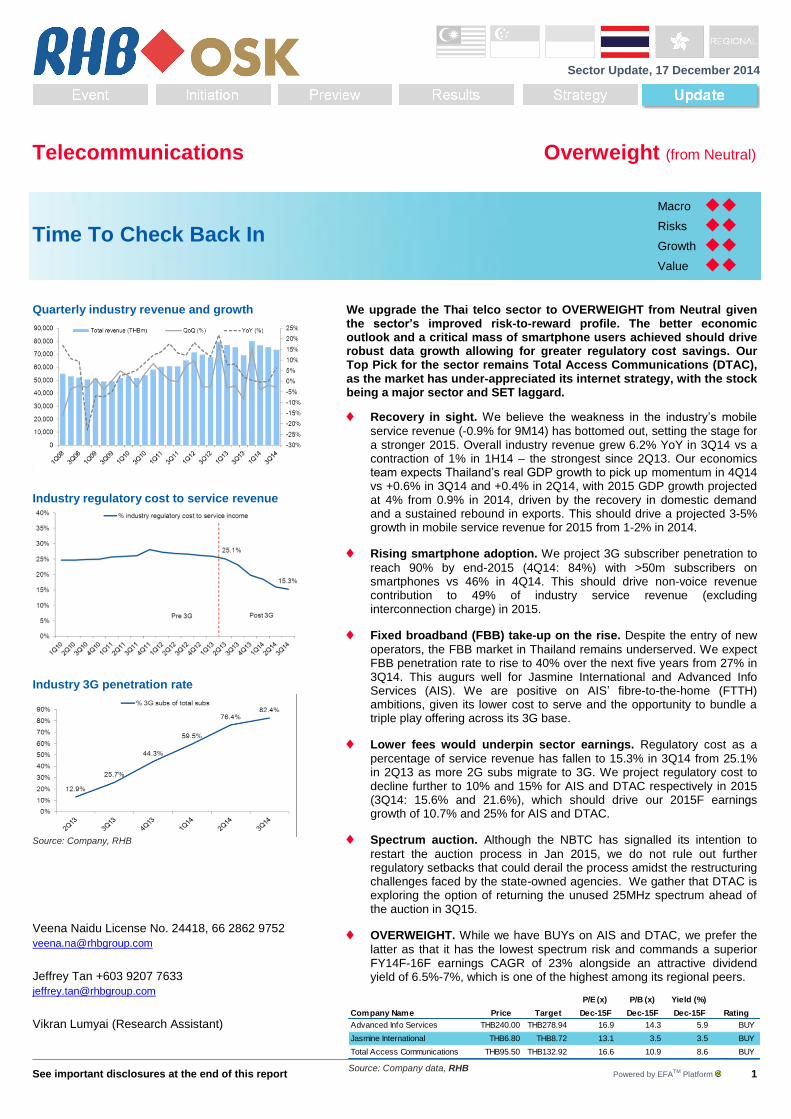
Key Highlights Seeing the inflection. We believe the weakness in the industry’s mobile service
revenue (-0.9% for 9M14) has bottomed out, with a more meaningful recovery in 4Q14 service revenue setting the stage for a stronger rebound in revenue momentum going into 2015. Our economics team expects Thailand’s real GDP growth to pick up further in 4Q14 vs +0.6% YoY in 3Q14 and +0.4% in 2Q14 with 2015 GDP growth projected at 4% from 0.9% in 2014, driven by the recovery in domestic demand and a sustained rebound in exports. We project AIS’ and DTAC’s service revenue (excluding interconnect) to grow by 4-6% in FY15 and FY16 from -2 to +2% growth in FY14, underpinned by robust data revenue growth of 46-50%, offsetting the projected voice revenue decline of 15-19%. Figure 1: Industry service revenue (THBm) and YoY growth
Source: RHB Competition to remain intense but the telcos should reap greater regulatory cost benefits. We expect competition in the market to remain intense in 2015 as the
telcos race to move their remaining 2G subscribers to the licensed 3G network. This comes ahead of the expiry of the 1800/900MHz concession in 3Q15, for which the outcome remains difficult to predict. We expect the telcos to bundle more attractive handsets to lure subscribers, especially those in the upcountry areas, to switch to 3G. This should boost 3G smartphone adoption to an estimated 59% by end-2015 and 71% by end 2016 from 40% (as at 3Q14), resulting in a more significant decrease in regulatory costs for the industry. We expect part of the savings in regulatory costs to be passed on to subscribers in the form of greater bundling discounts on handsets, although the positive impact on earnings may be somewhat diluted by the anticipated rise in sales and marketing costs. All in, we project the telcos to post a combined core earnings CAGR of 14.6% for FY14F-16F on the back of a service revenue CAGR of 4.8% over the same period. 4G is not a game changer. 4G services have been commercially launched by DTAC
and True, with the latter being the more aggressive in promoting the service and acquiring customers. We do not expect 4G to be a game changer in the Thai mobile market in the short to medium terms, given the spotty coverage and the lack of 4G smartphones/devices which are typically priced at a premium. 4G services are currently confined to the Bangkok Metropolitan area (BMA) and in adjacent towns vs the near-90% population coverage of 3G service, which is supported by a thriving handset eco-system. Our channel checks indicate that there are 5m-6m 4G handsets in the market, which represent only 5% of total handsets in distribution. DTAC is utilising a 5MHz block of its 2100MHz spectrum for 4G while True has set aside 10MHz. We gather the telcos are looking to further expand 4G street coverage with DTAC having set aside THB10bn for the construction of 6,500 new (3G/4G) base stations across 30 major cities (~300 4G sites in 3Q14) in 1Q15 capable of supporting 500,000 4G subscribers. Meanwhile, True recently allocated THB10bn for 7,000 new 4G sites (from 2,000 currently) to cater to up to 800,000 4G subscribers. We estimate 4G spending will account for almost 40% of True’s FY15 capex vs the 15% at DTAC.
Mobile revenue growth is poised for a stronger recovery in 2015
Competition in the mobile market should remain fairly intense in 2015 albeit to a rational extent
The limited 4G coverage and lack of devices should see
Telecommunications 16 December 2014
See important disclosures at the end of this report 3
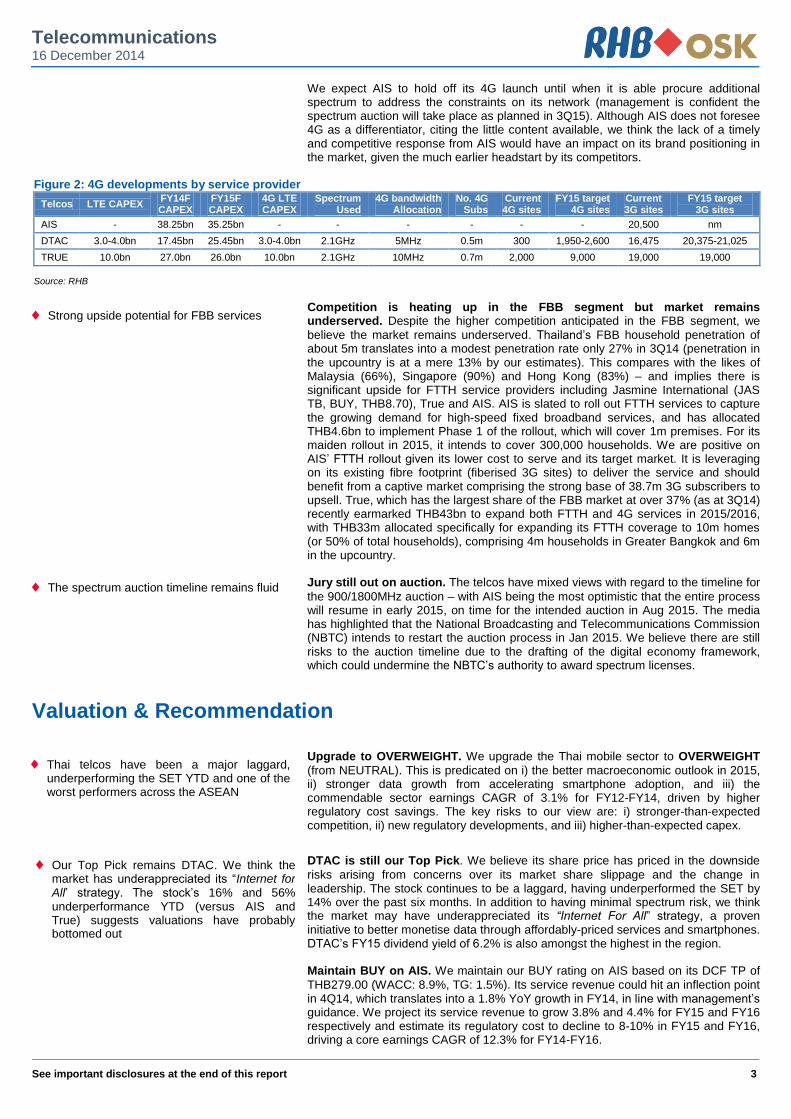
We expect AIS to hold off its 4G launch until when it is able procure additional spectrum to address the constraints on its network (management is confident the spectrum auction will take place as planned in 3Q15). Although AIS does not foresee 4G as a differentiator, citing the little content available, we think the lack of a timely and competitive response from AIS would have an impact on its brand positioning in the market, given the much earlier headstart by its competitors.
Figure 2: 4G developments by service provider
Telcos LTE CAPEX FY14F CAPEX
FY15F CAPEX
4G LTE CAPEX
Spectrum Used
4G bandwidth Allocation
No. 4G Subs
Current 4G sites
FY15 target 4G sites
Current 3G sites
FY15 target 3G sites
AIS - 38.25bn 35.25bn - - - - - - 20,500 nm
DTAC 3.0-4.0bn 17.45bn 25.45bn 3.0-4.0bn 2.1GHz 5MHz 0.5m 300 1,950-2,600 16,475 20,375-21,025
TRUE 10.0bn 27.0bn 26.0bn 10.0bn 2.1GHz 10MHz 0.7m 2,000 9,000 19,000 19,000
Source: RHB
Competition is heating up in the FBB segment but market remains underserved. Despite the higher competition anticipated in the FBB segment, we
believe the market remains underserved. Thailand’s FBB household penetration of about 5m translates into a modest penetration rate only 27% in 3Q14 (penetration in the upcountry is at a mere 13% by our estimates). This compares with the likes of Malaysia (66%), Singapore (90%) and Hong Kong (83%) – and implies there is significant upside for FTTH service providers including Jasmine International (JAS TB, BUY, THB8.70), True and AIS. AIS is slated to roll out FTTH services to capture the growing demand for high-speed fixed broadband services, and has allocated THB4.6bn to implement Phase 1 of the rollout, which will cover 1m premises. For its maiden rollout in 2015, it intends to cover 300,000 households. We are positive on AIS’ FTTH rollout given its lower cost to serve and its target market. It is leveraging on its existing fibre footprint (fiberised 3G sites) to deliver the service and should benefit from a captive market comprising the strong base of 38.7m 3G subscribers to upsell. True, which has the largest share of the FBB market at over 37% (as at 3Q14) recently earmarked THB43bn to expand both FTTH and 4G services in 2015/2016, with THB33m allocated specifically for expanding its FTTH coverage to 10m homes (or 50% of total households), comprising 4m households in Greater Bangkok and 6m in the upcountry. Jury still out on auction. The telcos have mixed views with regard to the timeline for
the 900/1800MHz auction – with AIS being the most optimistic that the entire process will resume in early 2015, on time for the intended auction in Aug 2015. The media has highlighted that the National Broadcasting and Telecommunications Commission (NBTC) intends to restart the auction process in Jan 2015. We believe there are still risks to the auction timeline due to the drafting of the digital economy framework, which could undermine the NBTC’s authority to award spectrum licenses.
Valuation & Recommendation
Upgrade to OVERWEIGHT. We upgrade the Thai mobile sector to OVERWEIGHT
(from NEUTRAL). This is predicated on i) the better macroeconomic outlook in 2015, ii) stronger data growth from accelerating smartphone adoption, and iii) the commendable sector earnings CAGR of 3.1% for FY12-FY14, driven by higher regulatory cost savings. The key risks to our view are: i) stronger-than-expected competition, ii) new regulatory developments, and iii) higher-than-expected capex.
DTAC is still our Top Pick. We believe its share price has priced in the downside
risks arising from concerns over its market share slippage and the change in leadership. The stock continues to be a laggard, having underperformed the SET by 14% over the past six months. In addition to having minimal spectrum risk, we think the market may have underappreciated its “Internet For All” strategy, a proven initiative to better monetise data through affordably-priced services and smartphones. DTAC’s FY15 dividend yield of 6.2% is also amongst the highest in the region. Maintain BUY on AIS. We maintain our BUY rating on AIS based on its DCF TP of
THB279.00 (WACC: 8.9%, TG: 1.5%). Its service revenue could hit an inflection point in 4Q14, which translates into a 1.8% YoY growth in FY14, in line with management’s guidance. We project its service revenue to grow 3.8% and 4.4% for FY15 and FY16 respectively and estimate its regulatory cost to decline to 8-10% in FY15 and FY16, driving a core earnings CAGR of 12.3% for FY14-FY16.
Strong upside potential for FBB services
The spectrum auction timeline remains fluid
Thai telcos have been a major laggard, underperforming the SET YTD and one of the worst performers across the ASEAN
Our Top Pick remains DTAC. We think the market has underappreciated its “Internet for All’ strategy. The stock’s 16% and 56% underperformance YTD (versus AIS and True) suggests valuations have probably bottomed out
Telecommunications 16 December 2014
See important disclosures at the end of this report 4
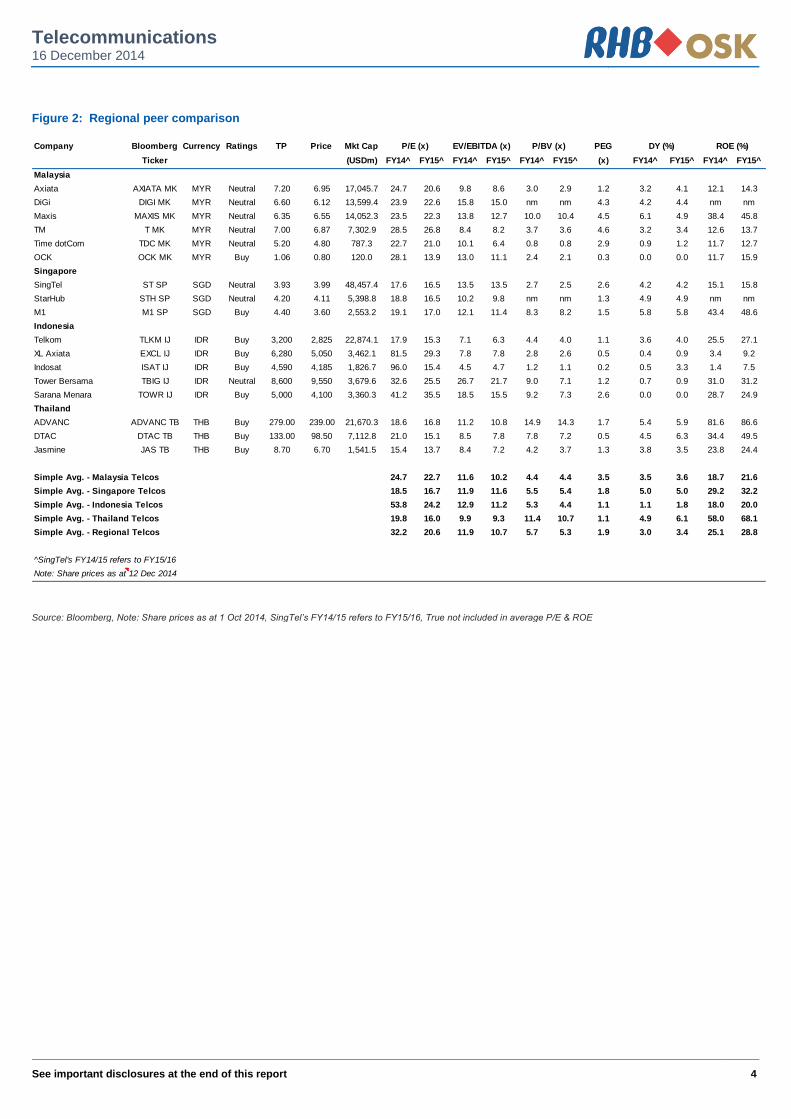
Figure 2: Regional peer comparison
Company Bloomberg Currency Ratings TP Price Mkt Cap PEG
Ticker (USDm) FY14^ FY15^ FY14^ FY15^ FY14^ FY15^ (x) FY14^ FY15^ FY14^ FY15^
Malaysia
Axiata AXIATA MK MYR Neutral 7.20 6.95 17,045.7 24.7 20.6 9.8 8.6 3.0 2.9 1.2 3.2 4.1 12.1 14.3
DiGi DIGI MK MYR Neutral 6.60 6.12 13,599.4 23.9 22.6 15.8 15.0 nm nm 4.3 4.2 4.4 nm nm
Maxis MAXIS MK MYR Neutral 6.35 6.55 14,052.3 23.5 22.3 13.8 12.7 10.0 10.4 4.5 6.1 4.9 38.4 45.8
TM T MK MYR Neutral 7.00 6.87 7,302.9 28.5 26.8 8.4 8.2 3.7 3.6 4.6 3.2 3.4 12.6 13.7
Time dotCom TDC MK MYR Neutral 5.20 4.80 787.3 22.7 21.0 10.1 6.4 0.8 0.8 2.9 0.9 1.2 11.7 12.7
OCK OCK MK MYR Buy 1.06 0.80 120.0 28.1 13.9 13.0 11.1 2.4 2.1 0.3 0.0 0.0 11.7 15.9
Singapore
SingTel ST SP SGD Neutral 3.93 3.99 48,457.4 17.6 16.5 13.5 13.5 2.7 2.5 2.6 4.2 4.2 15.1 15.8
StarHub STH SP SGD Neutral 4.20 4.11 5,398.8 18.8 16.5 10.2 9.8 nm nm 1.3 4.9 4.9 nm nm
M1 M1 SP SGD Buy 4.40 3.60 2,553.2 19.1 17.0 12.1 11.4 8.3 8.2 1.5 5.8 5.8 43.4 48.6
Indonesia
Telkom TLKM IJ IDR Buy 3,200 2,825 22,874.1 17.9 15.3 7.1 6.3 4.4 4.0 1.1 3.6 4.0 25.5 27.1
XL Axiata EXCL IJ IDR Buy 6,280 5,050 3,462.1 81.5 29.3 7.8 7.8 2.8 2.6 0.5 0.4 0.9 3.4 9.2
Indosat ISAT IJ IDR Buy 4,590 4,185 1,826.7 96.0 15.4 4.5 4.7 1.2 1.1 0.2 0.5 3.3 1.4 7.5
Tower Bersama TBIG IJ IDR Neutral 8,600 9,550 3,679.6 32.6 25.5 26.7 21.7 9.0 7.1 1.2 0.7 0.9 31.0 31.2
Sarana Menara TOWR IJ IDR Buy 5,000 4,100 3,360.3 41.2 35.5 18.5 15.5 9.2 7.3 2.6 0.0 0.0 28.7 24.9
Thailand
ADVANC ADVANC TB THB Buy 279.00 239.00 21,670.3 18.6 16.8 11.2 10.8 14.9 14.3 1.7 5.4 5.9 81.6 86.6
DTAC DTAC TB THB Buy 133.00 98.50 7,112.8 21.0 15.1 8.5 7.8 7.8 7.2 0.5 4.5 6.3 34.4 49.5
Jasmine JAS TB THB Buy 8.70 6.70 1,541.5 15.4 13.7 8.4 7.2 4.2 3.7 1.3 3.8 3.5 23.8 24.4
Simple Avg. - Malaysia Telcos 24.7 22.7 11.6 10.2 4.4 4.4 3.5 3.5 3.6 18.7 21.6
Simple Avg. - Singapore Telcos 18.5 16.7 11.9 11.6 5.5 5.4 1.8 5.0 5.0 29.2 32.2
Simple Avg. - Indonesia Telcos 53.8 24.2 12.9 11.2 5.3 4.4 1.1 1.1 1.8 18.0 20.0
Simple Avg. - Thailand Telcos 19.8 16.0 9.9 9.3 11.4 10.7 1.1 4.9 6.1 58.0 68.1
Simple Avg. - Regional Telcos 32.2 20.6 11.9 10.7 5.7 5.3 1.9 3.0 3.4 25.1 28.8
^SingTel's FY14/15 refers to FY15/16
Note: Share prices as at 12 Dec 2014
P/E (x) EV/EBITDA (x) P/BV (x) DY (%) ROE (%)
Source: Bloomberg, Note: Share prices as at 1 Oct 2014, SingTel’s FY14/15 refers to FY15/16, True not included in average P/E & ROE
See important disclosures at the end of this report Powered by EFATM
Platform 5
Company Update,17 December 2014
Advanced Info Services (ADVANC TB) Buy (Maintained) Communications - Telecommunications Target Price: THB279.00
Market Cap: USD21,629m Price: THB240.00
Highest Revenue Likely In 4Q14
Macro
2.00
Risks
2.00
Growth
2.00
Value
2.00
78
83
88
93
98
103
108
113
118
180
190
200
210
220
230
240
250
260
Advanced Info Services (ADVANC TB)Price Close Relative to Stock Exchange of Thailand Index (RHS)
5
10
15
20
25
30
35
40
De
c-1
3
Feb
-14
Apr-
14
Jun-1
4
Aug-1
4
Oct-
14
Vol m
Source: Bloomberg
Avg Turnover (THB/USD) 1,267m/38.3m
Cons. Upside (%) 4.2
Upside (%) 16.25
52-wk Price low/high (THB) 187 - 250
Free float (%) 51
Share outstanding (m) 2,973
Shareholders (%)
InTouchPlc Holdings 42.5
SingTelapore Telecommunications
21.3
Share Performance (%)
YTD 1m 3m 6m 12m
Absolute 20.3 1.3 14.3 4.8 17.6
Relative 3.6 5.2 17.5 1.9 3.6
Shariah compliant
Jeffrey Tan +603 9207 7633
Veena Naidu License No. 24418, 66 2862 9752
Vikran Lumyai +66 2862 9999 Ext 2028
Forecasts and Valuations Dec-11 Dec-12 Dec-13 Dec-14F Dec-15F
Total turnover (THBm) 126,437 141,568 144,851 144,975 147,859
Reported net profit (THBm) 22,218 34,883 36,274 38,147 42,234
Recurring net profit (THBm) 26,600 34,883 36,274 38,147 42,234
Recurring net profit growth (%) 20.3 31.1 4.0 5.2 10.7
Recurring EPS (THB) 9.0 11.7 12.2 12.8 14.2
DPS (THB) 8.4 10.9 12.1 12.8 14.2
Recurring P/E (x) 26.8 20.5 19.7 18.7 16.9
P/B (x) 18.2 16.5 15.6 14.9 14.3
P/CF (x) 15.1 14.1 14.0 13.2 12.0
Dividend Yield (%) 3.5 4.5 5.1 5.3 5.9
EV/EBITDA (x) 12.7 11.6 11.4 11.1 10.1
Return on average equity (%) 55.2 84.5 81.4 81.6 86.6
Net debt to equity (%) 7.4 net cash 25.3 65.5 94.5
Our vs consensus EPS (adjusted) (%) 3.4 3.0
Source: Company data, RHB
We estimate FY14F-16F earnings to grow by a CAGR of 12.3% on 19.5% non-voice growth and a 22.6% drop in regulatory fees. Upgrade to BUY, with a DCF-based THB279.00 TP (from THB249.00) implying 16.3% upside (WACC: 8.9%, TG: 1.5%). We expect 4Q14 to be the best quarter with revenue growth of 3.8% QoQ on better economic outlook and seasonality. Moreover, the lower regulatory cost and the fixed-broadband launch could support the stronger earnings next year.
Strong 4Q14 revenue. Advanced Info Services’ (AIS) revenue could hit
an inflection point in 4Q14. We expect a strong uplift of 3.8% QoQ to THB36.7bn in 4Q14 from improved consumer sentiment and seasonality. We estimate service revenue to grow 3.8% YoY to THB123.17bn next year due to strong data revenue growth. The 3G and smartphone penetration could reach 94% and 65% by 2015 (3Q14: 88.3% and 43.4%) respectively, which ought to boost data penetration to 46.1% in 2015 (3Q14: 38.8%) and lower regulatory fees to 10% (3Q14: 15%) of mobile services revenue. As a result, we estimate FY15 earnings to grow 10.5% YoY while EBITDA margins expand 4.8ppts to 51.5% from 46.7% this year.
Building up a platform. AIS is expanding into the high speed fixed-
broadband (FBB) area. It targets 80,000 subscribers in 2015, covering 250,000 premises via an initial THB1bn investment and expanding to 1m premises, passed with a collective THB4.6bn investment. As subscriber numbers will likely ramp up to 300,000 over the next 2-3 years, AIS may benefit from lower churn rates from an established convergence platform and revenue upside potential (3Q14’s FBB penetration rate was 26.9%).
Back-up plans. We believe the overloaded bandwidth issue from
delayed spectrum auctions should be minimal as AIS declared two back-up plans which are: i) a combination of cell splitting and small cells, and ii) a short-term bandwidth rental agreement with TOT Plc. With these solutions, the maximum capacity is able to expand to 50m subs.
BUY. We upgrade to BUY (from Neutral) with a DCF-based THB279.00
TP (WACC: 8.9%, TG: 1.5%) by lowering our WACC assumption on the back of its strong operations. YTD, it underperformed the SET by 2.8%, and 18% and 14% vs the banking and property indexes. We believe investors will move towards the stock, as it is a laggard big-cap play supported by 5-6% yields.
Advanced Info Services (ADVANC TB)
17 December 2014
See important disclosures at the end of this report 6
Key Catalysts And Risks 3G devices to grow 50% to 28.5m units. With the popularity of its house brand
smartphone, smartphone penetration has accelerated to 49% (19m units) off a 38.7m 3G base in 3Q14, according to AIS. As mid-tier models become cheaper, we confidently forecast for smartphone subscription to reach 20m and 28.5m units by end-2014 and 2015 respectively. This will result in a significant drop in regulatory expenses paid to the National Broadcasting and Telecommunications Commission (NBTC), ie lower to 5.25% of the service revenue from 25%. Thus, the overall regulatory cost to mobile services revenue ought to decline to 10% in 2015 from 15% in 2014. As a result, we project a core earnings growth of 11.5% YoY to THB40.86bn.
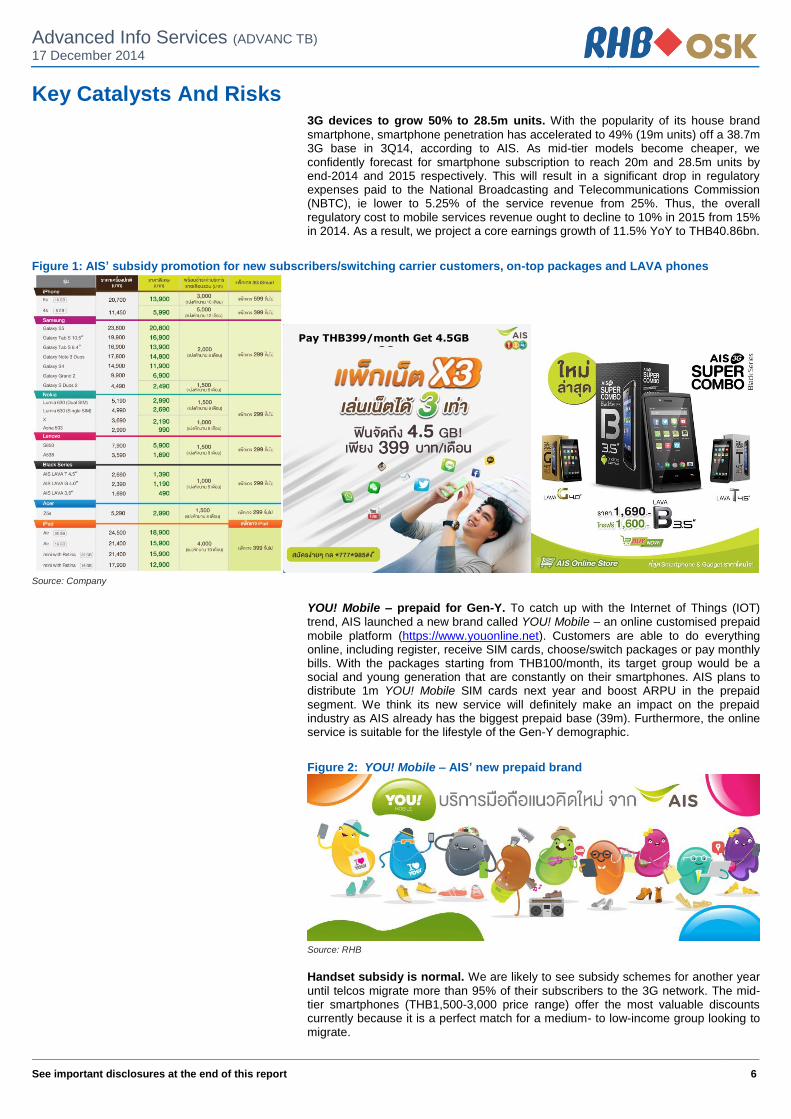
Figure 1: AIS’ subsidy promotion for new subscribers/switching carrier customers, on-top packages and LAVA phones
Source: Company
YOU! Mobile – prepaid for Gen-Y. To catch up with the Internet of Things (IOT) trend, AIS launched a new brand called YOU! Mobile – an online customised prepaid
mobile platform (https://www.youonline.net). Customers are able to do everything online, including register, receive SIM cards, choose/switch packages or pay monthly bills. With the packages starting from THB100/month, its target group would be a social and young generation that are constantly on their smartphones. AIS plans to distribute 1m YOU! Mobile SIM cards next year and boost ARPU in the prepaid segment. We think its new service will definitely make an impact on the prepaid industry as AIS already has the biggest prepaid base (39m). Furthermore, the online service is suitable for the lifestyle of the Gen-Y demographic.
Figure 2: YOU! Mobile – AIS’ new prepaid brand
Source: RHB
Handset subsidy is normal. We are likely to see subsidy schemes for another year
until telcos migrate more than 95% of their subscribers to the 3G network. The mid-tier smartphones (THB1,500-3,000 price range) offer the most valuable discounts currently because it is a perfect match for a medium- to low-income group looking to migrate.
Pay THB399/month Get 4.5GB -3G
Advanced Info Services (ADVANC TB)
17 December 2014
See important disclosures at the end of this report 7
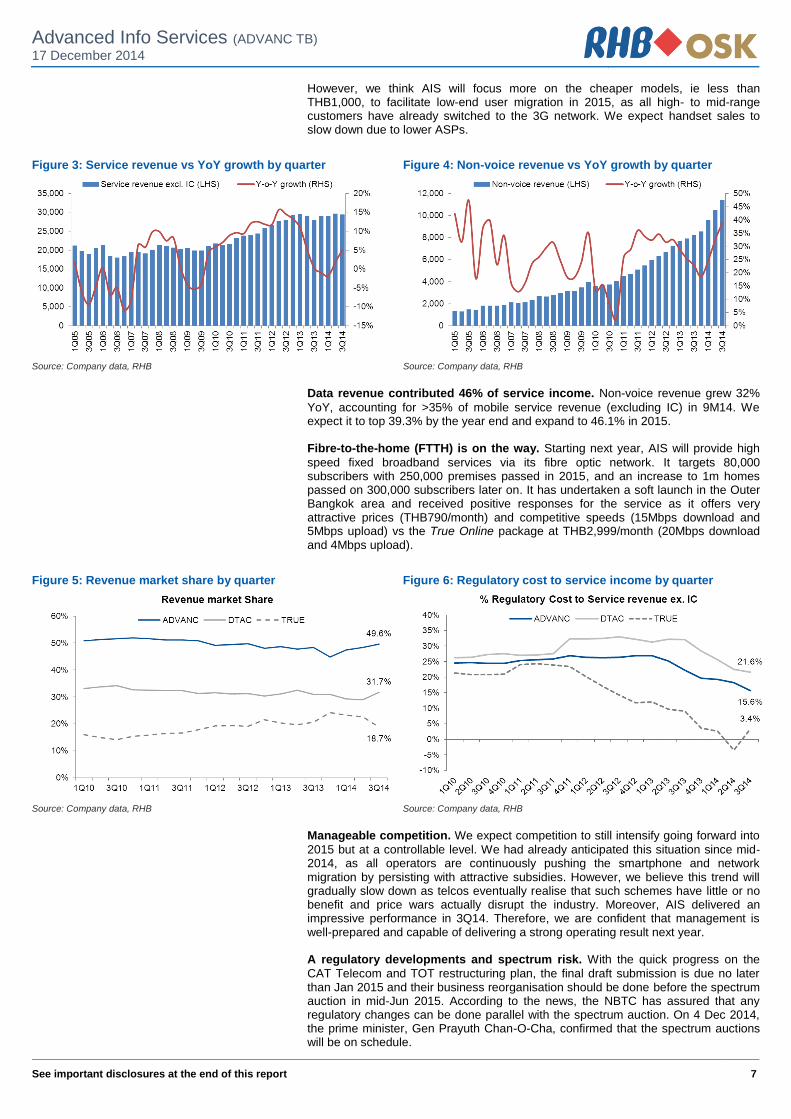
However, we think AIS will focus more on the cheaper models, ie less than THB1,000, to facilitate low-end user migration in 2015, as all high- to mid-range customers have already switched to the 3G network. We expect handset sales to slow down due to lower ASPs.
Figure 3: Service revenue vs YoY growth by quarter Figure 4: Non-voice revenue vs YoY growth by quarter
Source: Company data, RHB Source: Company data, RHB
Data revenue contributed 46% of service income. Non-voice revenue grew 32%
YoY, accounting for >35% of mobile service revenue (excluding IC) in 9M14. We expect it to top 39.3% by the year end and expand to 46.1% in 2015. Fibre-to-the-home (FTTH) is on the way. Starting next year, AIS will provide high
speed fixed broadband services via its fibre optic network. It targets 80,000 subscribers with 250,000 premises passed in 2015, and an increase to 1m homes passed on 300,000 subscribers later on. It has undertaken a soft launch in the Outer Bangkok area and received positive responses for the service as it offers very attractive prices (THB790/month) and competitive speeds (15Mbps download and 5Mbps upload) vs the True Online package at THB2,999/month (20Mbps download and 4Mbps upload).
Figure 5: Revenue market share by quarter Figure 6: Regulatory cost to service income by quarter
Source: Company data, RHB Source: Company data, RHB
Manageable competition. We expect competition to still intensify going forward into
2015 but at a controllable level. We had already anticipated this situation since mid-2014, as all operators are continuously pushing the smartphone and network migration by persisting with attractive subsidies. However, we believe this trend will gradually slow down as telcos eventually realise that such schemes have little or no benefit and price wars actually disrupt the industry. Moreover, AIS delivered an impressive performance in 3Q14. Therefore, we are confident that management is well-prepared and capable of delivering a strong operating result next year. A regulatory developments and spectrum risk. With the quick progress on the
CAT Telecom and TOT restructuring plan, the final draft submission is due no later than Jan 2015 and their business reorganisation should be done before the spectrum auction in mid-Jun 2015. According to the news, the NBTC has assured that any regulatory changes can be done parallel with the spectrum auction. On 4 Dec 2014, the prime minister, Gen Prayuth Chan-O-Cha, confirmed that the spectrum auctions will be on schedule.
Advanced Info Services (ADVANC TB)
17 December 2014
See important disclosures at the end of this report 8
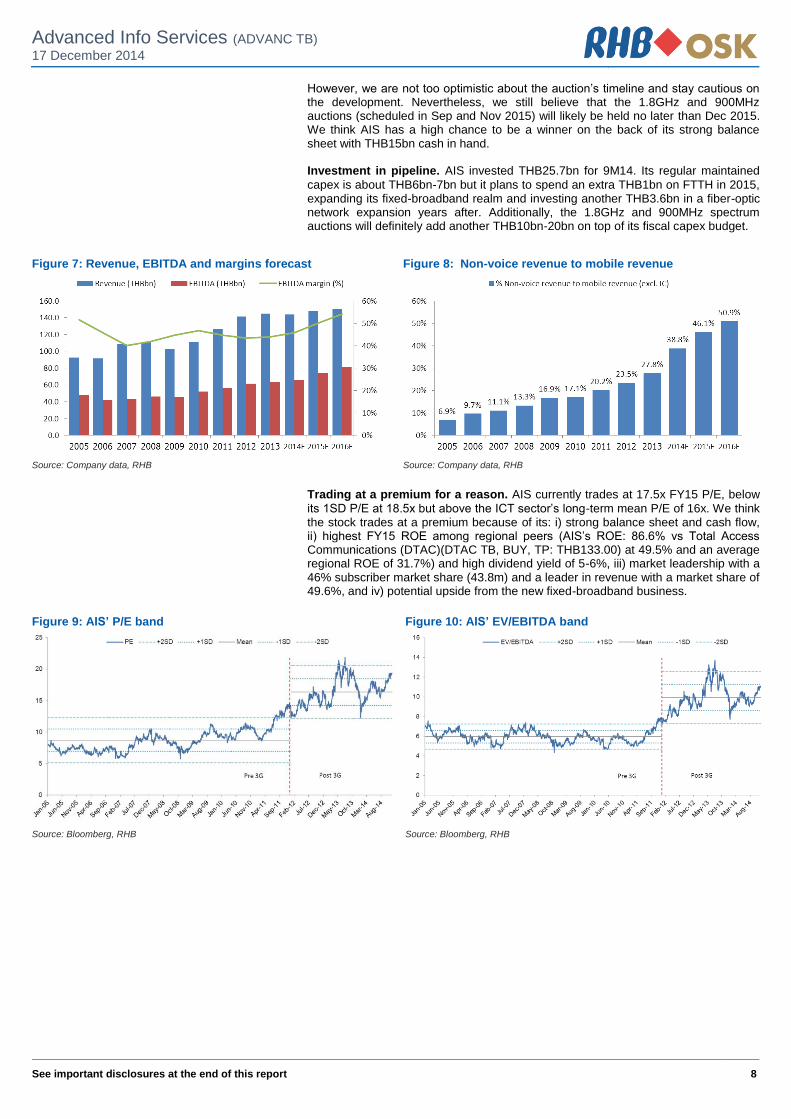
However, we are not too optimistic about the auction’s timeline and stay cautious on the development. Nevertheless, we still believe that the 1.8GHz and 900MHz auctions (scheduled in Sep and Nov 2015) will likely be held no later than Dec 2015. We think AIS has a high chance to be a winner on the back of its strong balance sheet with THB15bn cash in hand. Investment in pipeline. AIS invested THB25.7bn for 9M14. Its regular maintained
capex is about THB6bn-7bn but it plans to spend an extra THB1bn on FTTH in 2015, expanding its fixed-broadband realm and investing another THB3.6bn in a fiber-optic network expansion years after. Additionally, the 1.8GHz and 900MHz spectrum auctions will definitely add another THB10bn-20bn on top of its fiscal capex budget.
Figure 7: Revenue, EBITDA and margins forecast Figure 8: Non-voice revenue to mobile revenue
Source: Company data, RHB Source: Company data, RHB
Trading at a premium for a reason. AIS currently trades at 17.5x FY15 P/E, below
its 1SD P/E at 18.5x but above the ICT sector’s long-term mean P/E of 16x. We think the stock trades at a premium because of its: i) strong balance sheet and cash flow, ii) highest FY15 ROE among regional peers (AIS’s ROE: 86.6% vs Total Access Communications (DTAC)(DTAC TB, BUY, TP: THB133.00) at 49.5% and an average regional ROE of 31.7%) and high dividend yield of 5-6%, iii) market leadership with a 46% subscriber market share (43.8m) and a leader in revenue with a market share of 49.6%, and iv) potential upside from the new fixed-broadband business.
Figure 9: AIS’ P/E band Figure 10: AIS’ EV/EBITDA band
Source: Bloomberg, RHB Source: Bloomberg, RHB
Advanced Info Services (ADVANC TB)
17 December 2014
See important disclosures at the end of this report 9
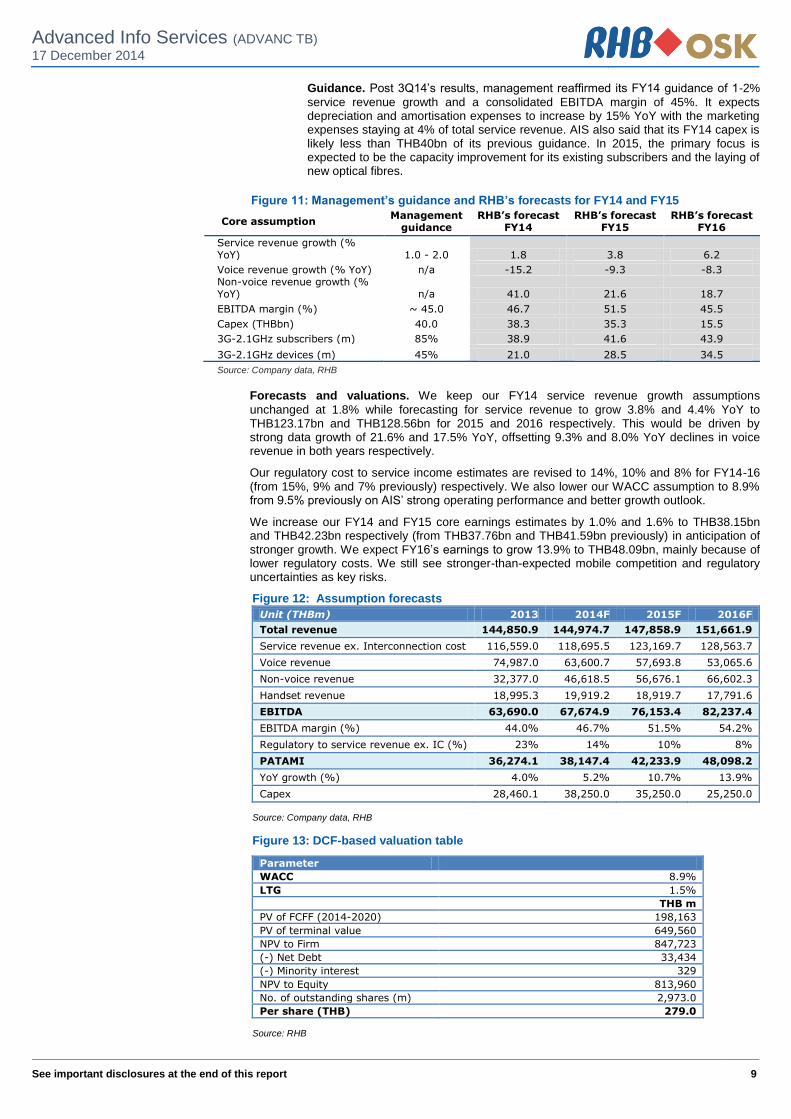
Guidance. Post 3Q14’s results, management reaffirmed its FY14 guidance of 1-2%
service revenue growth and a consolidated EBITDA margin of 45%. It expects depreciation and amortisation expenses to increase by 15% YoY with the marketing expenses staying at 4% of total service revenue. AIS also said that its FY14 capex is likely less than THB40bn of its previous guidance. In 2015, the primary focus is expected to be the capacity improvement for its existing subscribers and the laying of new optical fibres.
Figure 11: Management’s guidance and RHB’s forecasts for FY14 and FY15
Core assumption Management
guidance RHB’s forecast
FY14 RHB’s forecast
FY15 RHB’s forecast
FY16
Service revenue growth (% YoY) 1.0 - 2.0 1.8 3.8 6.2
Voice revenue growth (% YoY) n/a -15.2 -9.3 -8.3 Non-voice revenue growth (% YoY) n/a 41.0 21.6 18.7
EBITDA margin (%) ~ 45.0 46.7 51.5 45.5
Capex (THBbn) 40.0 38.3 35.3 15.5
3G-2.1GHz subscribers (m) 85% 38.9 41.6 43.9
3G-2.1GHz devices (m) 45% 21.0 28.5 34.5
Source: Company data, RHB
Forecasts and valuations. We keep our FY14 service revenue growth assumptions
unchanged at 1.8% while forecasting for service revenue to grow 3.8% and 4.4% YoY to THB123.17bn and THB128.56bn for 2015 and 2016 respectively. This would be driven by strong data growth of 21.6% and 17.5% YoY, offsetting 9.3% and 8.0% YoY declines in voice revenue in both years respectively.
Our regulatory cost to service income estimates are revised to 14%, 10% and 8% for FY14-16 (from 15%, 9% and 7% previously) respectively. We also lower our WACC assumption to 8.9% from 9.5% previously on AIS’ strong operating performance and better growth outlook.
We increase our FY14 and FY15 core earnings estimates by 1.0% and 1.6% to THB38.15bn and THB42.23bn respectively (from THB37.76bn and THB41.59bn previously) in anticipation of stronger growth. We expect FY16’s earnings to grow 13.9% to THB48.09bn, mainly because of lower regulatory costs. We still see stronger-than-expected mobile competition and regulatory uncertainties as key risks.
Figure 12: Assumption forecasts
Unit (THBm) 2013 2014F 2015F 2016F
Total revenue 144,850.9 144,974.7 147,858.9 151,661.9
Service revenue ex. Interconnection cost 116,559.0 118,695.5 123,169.7 128,563.7
Voice revenue 74,987.0 63,600.7 57,693.8 53,065.6
Non-voice revenue 32,377.0 46,618.5 56,676.1 66,602.3
Handset revenue 18,995.3 19,919.2 18,919.7 17,791.6
EBITDA 63,690.0 67,674.9 76,153.4 82,237.4
EBITDA margin (%) 44.0% 46.7% 51.5% 54.2%
Regulatory to service revenue ex. IC (%) 23% 14% 10% 8%
PATAMI 36,274.1 38,147.4 42,233.9 48,098.2
YoY growth (%) 4.0% 5.2% 10.7% 13.9%
Capex 28,460.1 38,250.0 35,250.0 25,250.0
Source: Company data, RHB
Figure 13: DCF-based valuation table
Parameter
WACC 8.9%
LTG 1.5%
THB m
PV of FCFF (2014-2020) 198,163
PV of terminal value 649,560
NPV to Firm 847,723
(-) Net Debt 33,434
(-) Minority interest 329
NPV to Equity 813,960
No. of outstanding shares (m) 2,973.0
Per share (THB) 279.0
Source: RHB
Advanced Info Services (ADVANC TB)
17 December 2014
See important disclosures at the end of this report 10
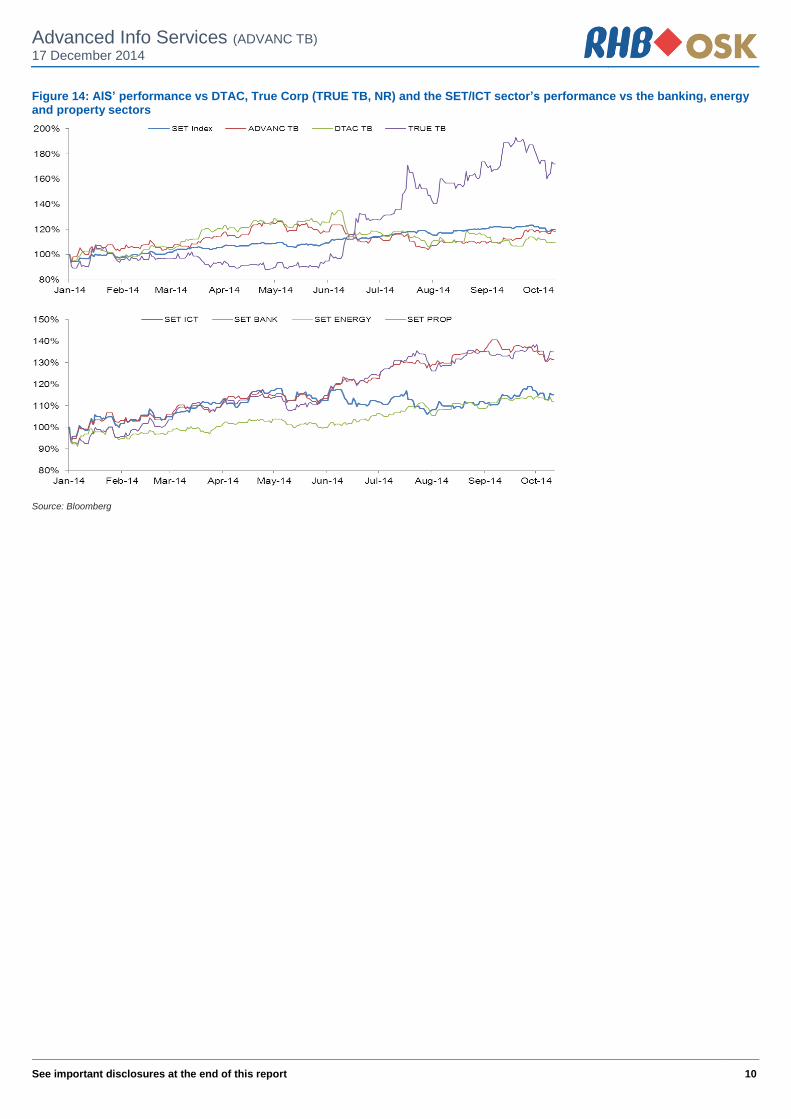
Figure 14: AIS’ performance vs DTAC, True Corp (TRUE TB, NR) and the SET/ICT sector’s performance vs the banking, energy and property sectors
Source: Bloomberg
Advanced Info Services (ADVANC TB)
17 December 2014
See important disclosures at the end of this report 11
Financial Exhibits
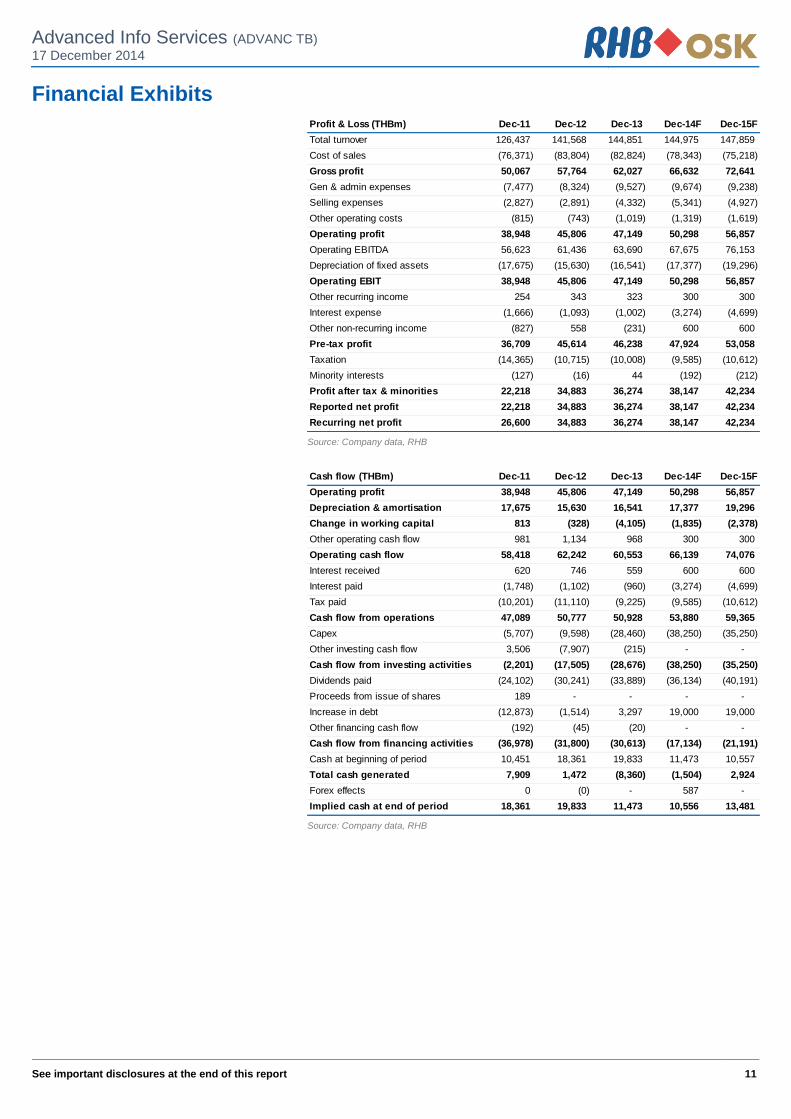
Profit & Loss (THBm) Dec-11 Dec-12 Dec-13 Dec-14F Dec-15F
Total turnover 126,437 141,568 144,851 144,975 147,859
Cost of sales (76,371) (83,804) (82,824) (78,343) (75,218)
Gross profit 50,067 57,764 62,027 66,632 72,641
Gen & admin expenses (7,477) (8,324) (9,527) (9,674) (9,238)
Selling expenses (2,827) (2,891) (4,332) (5,341) (4,927)
Other operating costs (815) (743) (1,019) (1,319) (1,619)
Operating profit 38,948 45,806 47,149 50,298 56,857
Operating EBITDA 56,623 61,436 63,690 67,675 76,153
Depreciation of fixed assets (17,675) (15,630) (16,541) (17,377) (19,296)
Operating EBIT 38,948 45,806 47,149 50,298 56,857
Other recurring income 254 343 323 300 300
Interest expense (1,666) (1,093) (1,002) (3,274) (4,699)
Other non-recurring income (827) 558 (231) 600 600
Pre-tax profit 36,709 45,614 46,238 47,924 53,058
Taxation (14,365) (10,715) (10,008) (9,585) (10,612)
Minority interests (127) (16) 44 (192) (212)
Profit after tax & minorities 22,218 34,883 36,274 38,147 42,234
Reported net profit 22,218 34,883 36,274 38,147 42,234
Recurring net profit 26,600 34,883 36,274 38,147 42,234
Source: Company data, RHB
Cash flow (THBm) Dec-11 Dec-12 Dec-13 Dec-14F Dec-15F
Operating profit 38,948 45,806 47,149 50,298 56,857
Depreciation & amortisation 17,675 15,630 16,541 17,377 19,296
Change in working capital 813 (328) (4,105) (1,835) (2,378)
Other operating cash flow 981 1,134 968 300 300
Operating cash flow 58,418 62,242 60,553 66,139 74,076
Interest received 620 746 559 600 600
Interest paid (1,748) (1,102) (960) (3,274) (4,699)
Tax paid (10,201) (11,110) (9,225) (9,585) (10,612)
Cash flow from operations 47,089 50,777 50,928 53,880 59,365
Capex (5,707) (9,598) (28,460) (38,250) (35,250)
Other investing cash flow 3,506 (7,907) (215) - -
Cash flow from investing activities (2,201) (17,505) (28,676) (38,250) (35,250)
Dividends paid (24,102) (30,241) (33,889) (36,134) (40,191)
Proceeds from issue of shares 189 - - - -
Increase in debt (12,873) (1,514) 3,297 19,000 19,000
Other financing cash flow (192) (45) (20) - -
Cash flow from financing activities (36,978) (31,800) (30,613) (17,134) (21,191)
Cash at beginning of period 10,451 18,361 19,833 11,473 10,557
Total cash generated 7,909 1,472 (8,360) (1,504) 2,924
Forex effects 0 (0) - 587 -
Implied cash at end of period 18,361 19,833 11,473 10,556 13,481
Source: Company data, RHB
Advanced Info Services (ADVANC TB)
17 December 2014
See important disclosures at the end of this report 12
Financial Exhibits
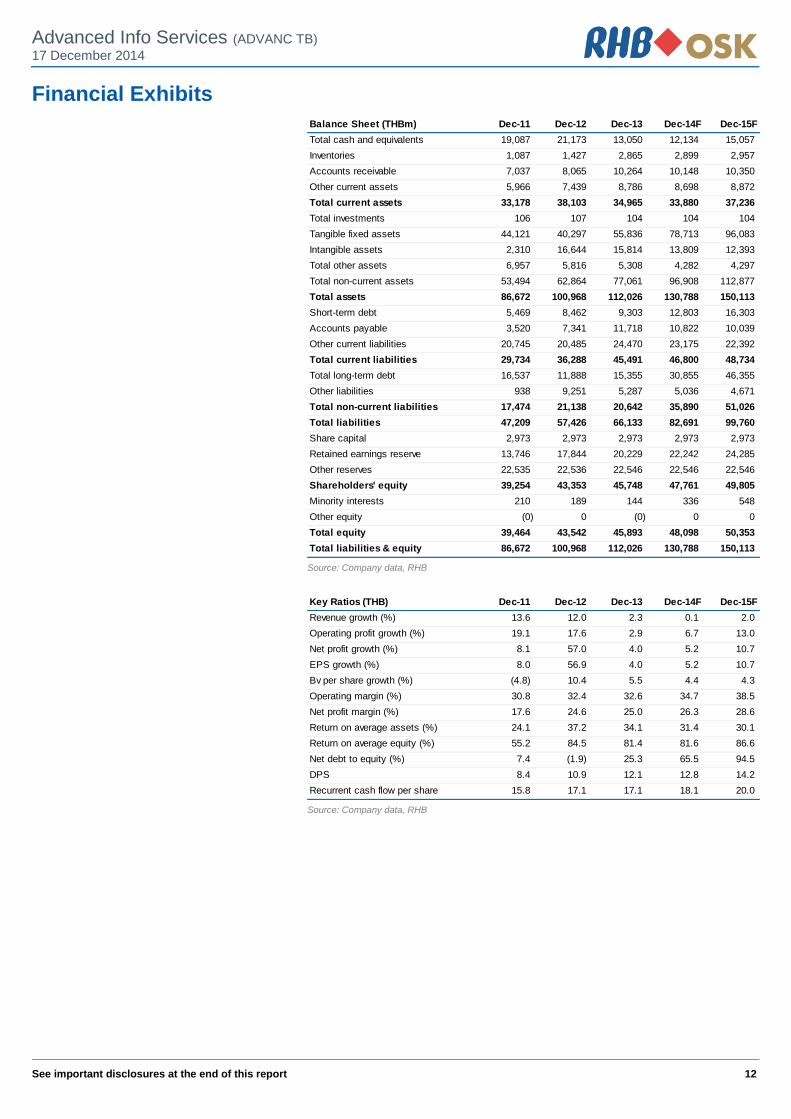
Balance Sheet (THBm) Dec-11 Dec-12 Dec-13 Dec-14F Dec-15F
Total cash and equivalents 19,087 21,173 13,050 12,134 15,057
Inventories 1,087 1,427 2,865 2,899 2,957
Accounts receivable 7,037 8,065 10,264 10,148 10,350
Other current assets 5,966 7,439 8,786 8,698 8,872
Total current assets 33,178 38,103 34,965 33,880 37,236
Total investments 106 107 104 104 104
Tangible fixed assets 44,121 40,297 55,836 78,713 96,083
Intangible assets 2,310 16,644 15,814 13,809 12,393
Total other assets 6,957 5,816 5,308 4,282 4,297
Total non-current assets 53,494 62,864 77,061 96,908 112,877
Total assets 86,672 100,968 112,026 130,788 150,113
Short-term debt 5,469 8,462 9,303 12,803 16,303
Accounts payable 3,520 7,341 11,718 10,822 10,039
Other current liabilities 20,745 20,485 24,470 23,175 22,392
Total current liabilities 29,734 36,288 45,491 46,800 48,734
Total long-term debt 16,537 11,888 15,355 30,855 46,355
Other liabilities 938 9,251 5,287 5,036 4,671
Total non-current liabilities 17,474 21,138 20,642 35,890 51,026
Total liabilities 47,209 57,426 66,133 82,691 99,760
Share capital 2,973 2,973 2,973 2,973 2,973
Retained earnings reserve 13,746 17,844 20,229 22,242 24,285
Other reserves 22,535 22,536 22,546 22,546 22,546
Shareholders' equity 39,254 43,353 45,748 47,761 49,805
Minority interests 210 189 144 336 548
Other equity (0) 0 (0) 0 0
Total equity 39,464 43,542 45,893 48,098 50,353
Total liabilities & equity 86,672 100,968 112,026 130,788 150,113
Source: Company data, RHB
Key Ratios (THB) Dec-11 Dec-12 Dec-13 Dec-14F Dec-15F
Revenue growth (%) 13.6 12.0 2.3 0.1 2.0
Operating profit growth (%) 19.1 17.6 2.9 6.7 13.0
Net profit growth (%) 8.1 57.0 4.0 5.2 10.7
EPS growth (%) 8.0 56.9 4.0 5.2 10.7
Bv per share growth (%) (4.8) 10.4 5.5 4.4 4.3
Operating margin (%) 30.8 32.4 32.6 34.7 38.5
Net profit margin (%) 17.6 24.6 25.0 26.3 28.6
Return on average assets (%) 24.1 37.2 34.1 31.4 30.1
Return on average equity (%) 55.2 84.5 81.4 81.6 86.6
Net debt to equity (%) 7.4 (1.9) 25.3 65.5 94.5
DPS 8.4 10.9 12.1 12.8 14.2
Recurrent cash flow per share 15.8 17.1 17.1 18.1 20.0
Source: Company data, RHB
Advanced Info Services (ADVANC TB)
17 December 2014
See important disclosures at the end of this report 13
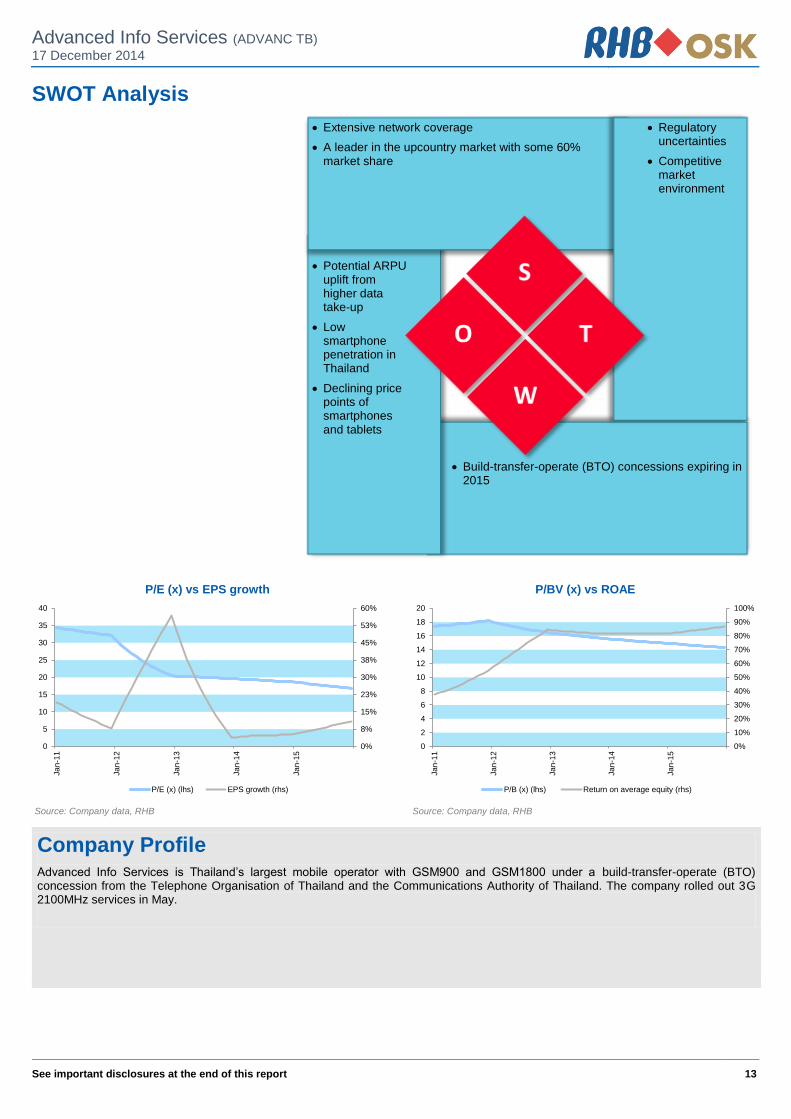
SWOT Analysis
Extensive network coverage
A leader in the upcountry market with some 60% market share
Regulatory uncertainties
Competitive market environment
Potential ARPU uplift from higher data take-up
Low smartphone penetration in Thailand
Declining price points of smartphones and tablets
Build-transfer-operate (BTO) concessions expiring in 2015
0%
8%
15%
23%
30%
38%
45%
53%
60%
0
5
10
15
20
25
30
35
40
Jan
-11
Jan
-12
Jan
-13
Jan
-14
Jan
-15
P/E (x) vs EPS growth
P/E (x) (lhs) EPS growth (rhs)
0%
10%
20%
30%
40%
50%
60%
70%
80%
90%
100%
0
2
4
6
8
10
12
14
16
18
20
Jan
-11
Jan
-12
Jan
-13
Jan
-14
Jan
-15
P/BV (x) vs ROAE
P/B (x) (lhs) Return on average equity (rhs)
Source: Company data, RHB Source: Company data, RHB
Company Profile Advanced Info Services is Thailand’s largest mobile operator with GSM900 and GSM1800 under a build-transfer-operate (BTO) concession from the Telephone Organisation of Thailand and the Communications Authority of Thailand. The company rolled out 3G 2100MHz services in May.
Advanced Info Services (ADVANC TB)
17 December 2014
See important disclosures at the end of this report 14
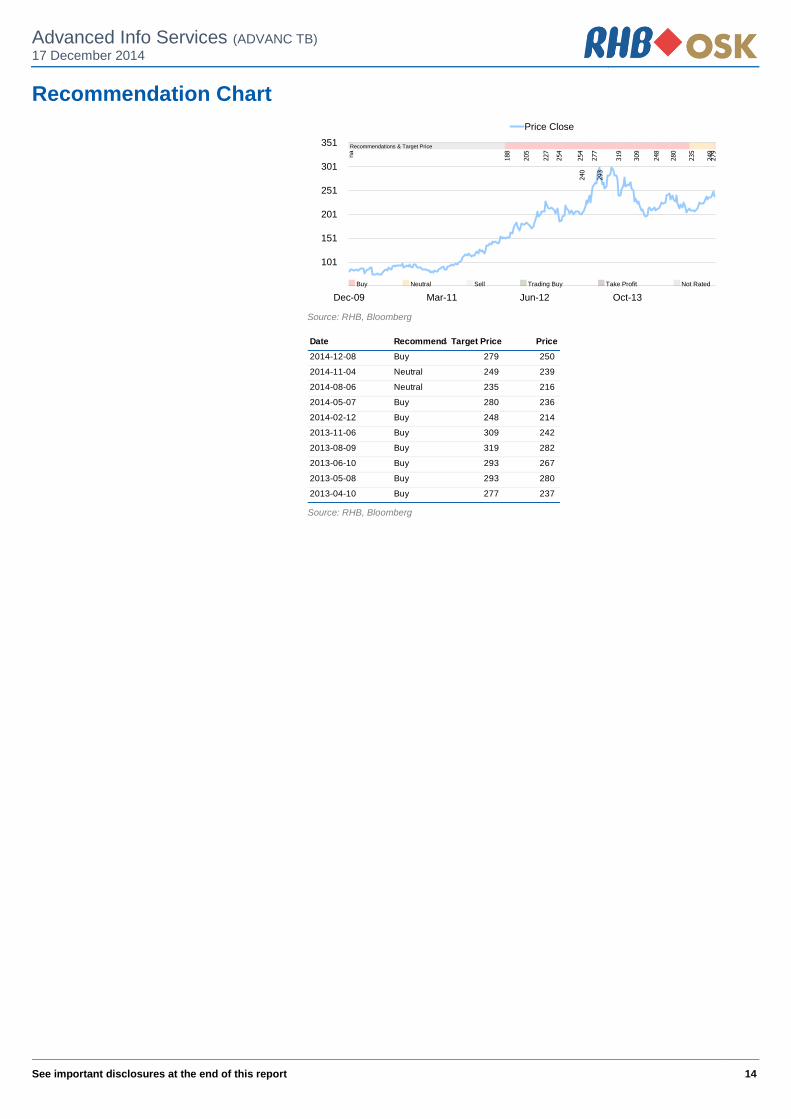
Recommendation Chart
51
101
151
201
251
301
351
Dec-09 Mar-11 Jun-12 Oct-13
Price Close
na
Recommendations & Target Price
Buy Neutral Sell Trading Buy Take Profit Not Rated
Source: RHB, Bloomberg
Date RecommendationTarget Price Price
2014-12-08 Buy 279 250
2014-11-04 Neutral 249 239
2014-08-06 Neutral 235 216
2014-05-07 Buy 280 236
2014-02-12 Buy 248 214
2013-11-06 Buy 309 242
2013-08-09 Buy 319 282
2013-06-10 Buy 293 267
2013-05-08 Buy 293 280
2013-04-10 Buy 277 237
Source: RHB, Bloomberg
See important disclosures at the end of this report Powered by EFATM
Platform 15
Company Update, 17 December 2014
Total Access Communications (DTAC TB) Buy (Maintained) Communications - Telecommunications Target Price: THB133.00
Market Cap: USD6,962m Price: THB97.00
Embracing “Internet For All”
Macro
2.00
Risks
2.00
Growth
2.00
Value
2.00
75
82
88
95
102
108
115
122
128
135
88
93
98
103
108
113
118
123
128
133
Total Access Communication (DTAC TB)Price Close Relative to Stock Exchange of Thailand Index (RHS)
2468
101214161820
De
c-1
3
Fe
b-1
4
Ap
r-1
4
Ju
n-1
4
Au
g-1
4
Oct-
14
Vo
l m
Source: Bloomberg
Avg Turnover (THB/USD) 372m/11.4m
Cons. Upside (%) 21.6
Upside (%) 37.0
52-wk Price low/high (THB) 92.5 - 129
Free float (%) 13
Share outstanding (m) 2,368
Shareholders (%)
Telenor Asia 42.6
Thai Telco Holdings 22.4
TOT Public Company 5.6
Share Performance (%)
YTD 1m 3m 6m 12m
Absolute 0.0 (3.0) (4.9) (9.4) (1.0)
Relative (16.7) 0.9 (0.8) (13.4) (14.0)
Shariah compliant
Veena Naidu License No. 24418, 66 2862 9752
Jeffrey Tan +603 9207 7633
Vikran Lumyai +66 2862 9999 Ext 2028
Forecasts and Valuations Dec-12 Dec-13 Dec-14F Dec-15F Dec-16F
Total turnover (THBm) 89,497 94,617 89,794 93,298 97,454
Reported net profit (THBm) 11,278 10,549 10,911 13,652 16,376
Recurring net profit (THBm) 11,235 11,843 10,910 13,652 16,376
Recurring net profit growth (%) (8.4) 5.4 (7.9) 25.1 20.0
Recurring EPS (THB) 4.74 5.00 4.61 5.77 6.92
DPS (THB) 5.06 3.72 6.22 8.22 9.86
Recurring P/E (x) 20.4 19.4 21.1 16.8 14.0
P/B (x) 6.6 6.6 9.2 11.1 15.2
P/CF (x) 10.5 9.5 20.3 8.6 7.4
Dividend Yield (%) 5.2 3.8 6.4 8.5 10.2
EV/EBITDA (x) 9.41 8.44 8.57 7.61 6.83
Return on average equity (%) 32.3 30.2 36.5 59.7 91.3
Net debt to equity (%) 73.2 74.6 211.9 340.0 519.0
Our vs consensus EPS (adjusted) (%) (15.6) (9.8) (4.3)
Source: Company data, RHB
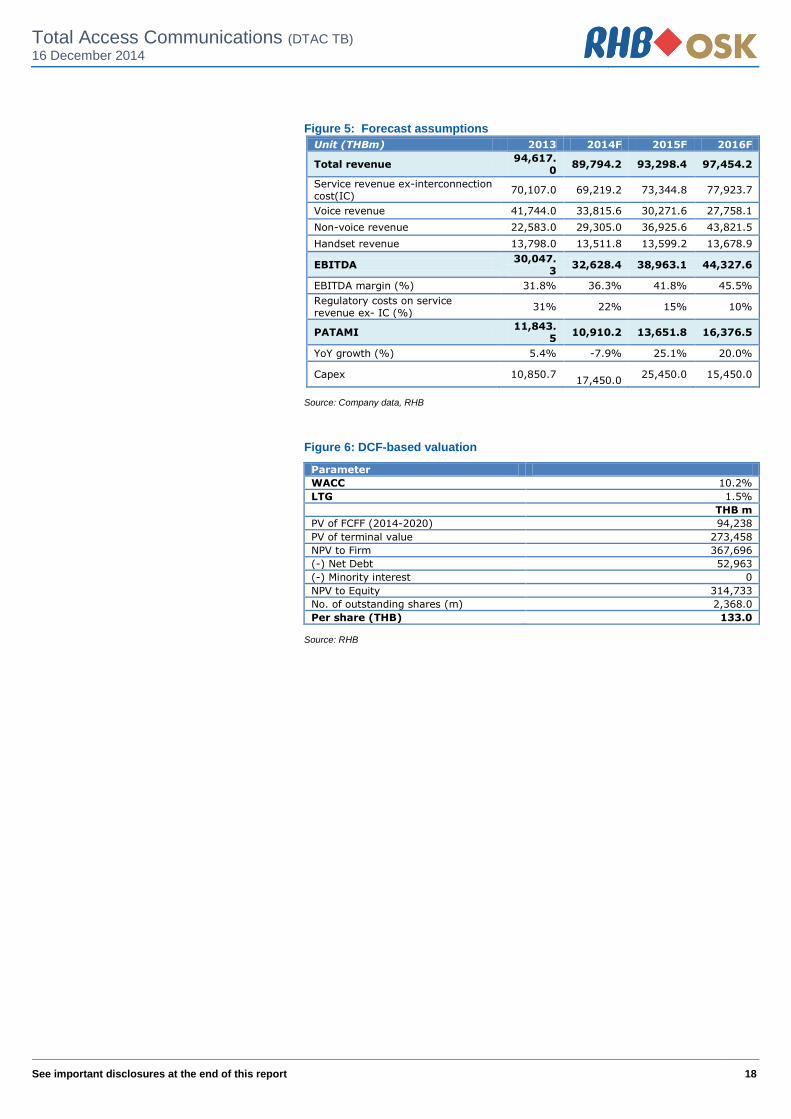
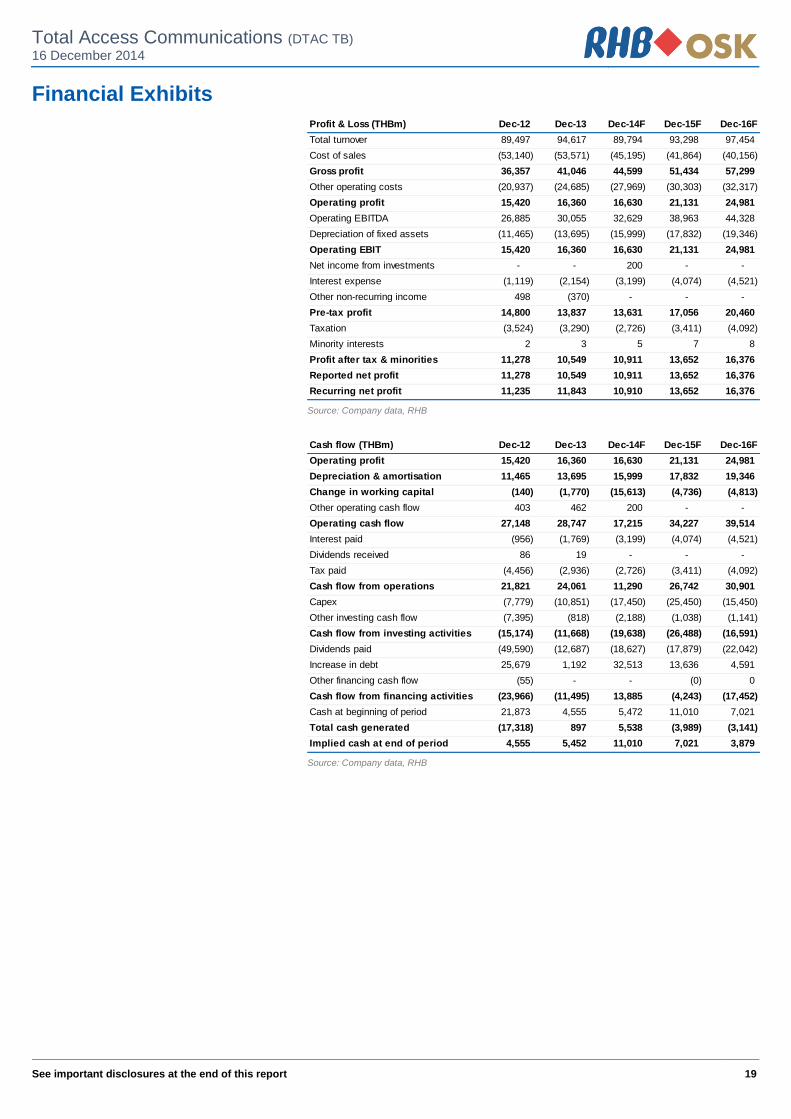
We expect DTAC to stem the erosion in its prepaid base on the back of its localized marketing campaigns and the new bundled postpaid and data offers. BUY with a lower DCF-based TP of THB133.00 (37% upside, WACC: 10.2%, TG: 1.5%) as we attach a higher risk premium on the stock. It could regain 0.62m subs in 4Q14, which would lift service revenue by a strong 7% QoQ. We project a decent 23% core earnings CAGR for FY14-FY16, supported by higher regulatory cost savings.
Making a comeback. We expect Total Access Communication’s
(DTAC) service revenue to stage a strong rebound of 7% QoQ in 4Q14, helped by seasonality, the economic recovery and its new marketing initiatives. For FY15, we expect DTAC’s non-voice revenue to grow 26% YoY– from higher 3G and smartphone penetration which we expect to reach 93% and 60% by end 2015 (3Q14: 71% and 41.4% respectively) – and make up 50% of service revenue (3Q14: 39.9%). Its core earnings are forecast to expand 25% in FY14, driven by the 29% drop in regulatory fees.
Prepaid subs base set to recover. DTAC’s prepaid subs contracted
407k in 9M14 on the back of the intense competition in the prepaid segment, especially in the upcountry areas. This led to its mobile service revenue share falling under 30% in 3Q14, a new low. We expect the erosion in its subscriber base to normalise in 1Q15 following the launch of new plans and targeted marketing efforts.
Lowest spectrum risk. DTAC may consider releasing its unused
25MHz spectrum on the 1,800MHz band to the NBTC ahead of the spectrum auction in 3Q15 and are in discussions with the CAT. It currently has a combined 75MHz bandwidth of spectrum compared with Advanced Info Services’ (AIS) (ADVANC TB, BUY, TP: THB279.00) 32.5MHz and True Corp (TRUE TB, NR)’s 30MHz.
Maintain BUY. DTAC remains a laggard, having underperformed the
SET by 14% YTD. Our TP is lowered to THB133.00 (from THB138.00) (WACC: 10.2%, TG: 1.5%) after attaching a higher risk premium to reflect the stronger competition in the upcountry areas. We cut our FY14 and FY15 core earnings forecasts by 2% and 12% after tweaking our depreciation assumptions. We like DTAC as it offers the lowest spectrum risk and boast a strong FY14-FY16 earnings CAGR of 23%.

Total Access Communications (DTAC TB)
16 December 2014
See important disclosures at the end of this report 16
Key Highlights New and innovative bucket plans. DTAC has embarked on a 3 pronged strategy to
stem the decline in its subscriber share and strengthen ARPU. It is shifting the standard industry practice of offering unlimited data on postpaid with new bucket plans offering limited data and free voice calls, applicable for certain time bands. For example, its THB599 bundled plan (offered with attractive handset rebates) offers unlimited voice calls from 7am-5pm with 3G/4G data allowance of 4GB (see Fig. 1). The data bundled is higher than a similar plan marketed by AIS (ADVANC TB, BUY, TP: THB269) and appears to be taking on True (Not Rated)’s plans which we understand have been well received. We believe DTAC’s latest promotion would help to stimulate voice usage and allow the group to better monetise data with the improved data experience (42Mbps) contributing to higher usage over time. More importantly, we think it would compel more prepaid subscribers to switch to postpaid and help stem the erosion in its subscriber base. We also view positively DTAC’s cluster- based pricing and marketing initiatives which target specific customer segments, in line with the group-wide “Internet for All” strategy. The combination of new plans and target marketing initiatives should allow DTAC to strengthen its market share and revenue going into FY15.
Figure 1: Post-paid plans offered by the operators
Telcos Monthly Price
(THB) Voice (min)
Networks Time Data (GB)
Max Speed Technology Promotional
AIS
1099.0 384.0 599.0
Unlimited Unlimited
300.0
AIS AIS All
10PM-5PM
10PM-5PM
-
2.0 3.0 1.5
128kbps 384kbps 42Mbps
3G/EDGE
THB549 for 12 mo. -
1.5GB x 3 for 6 mo.
DTAC 599.0 Unlimited All 7AM-5PM 4.0 42Mbps 3G/4G THB449 first 3 mo.
TRUE 599.0 Unlimited All 7AM-5PM 4.0 42Mbps 3G/EDGE THB449 first 3 mo.
Source: RHB
Figure 2: DTAC’s promotions for new subs/switching telcos and top-up data packages
Source: Company
Capex savings from tower sharing. DTAC intends to utilize its assets more
efficiently by sharing its towers with AIS and lease towers from TRUE Telecommunication Growth Infrastructure Fund (TRUEIF) (TRUEIF TB, NR). We understand it will share 100 towers with AIS in the first phase of the network collaboration and lease up to 600 cell sites from TRUEIF (at a monthly rental fee of THB20,000/site). We are positive on the sharing of passive infrastructure to reduce capex and opex savings in the longer-term. DTAC has guided for an additional THB10bn capex (which forms part of the THB13bn guidance for FY14) to roll out 6,500 new 3G/4G sites in 4Q14/1Q15. It aspires to have the best-quality network in the Bangkok Metropolitan Area (BMA) and across 30 major cities.
Data top-up package : Get 500MB 3G for THB79, valid for 30 days
Up to 50% discount on smartphones, 20 monthly payments with no interest
Total Access Communications (DTAC TB)
16 December 2014
See important disclosures at the end of this report 17
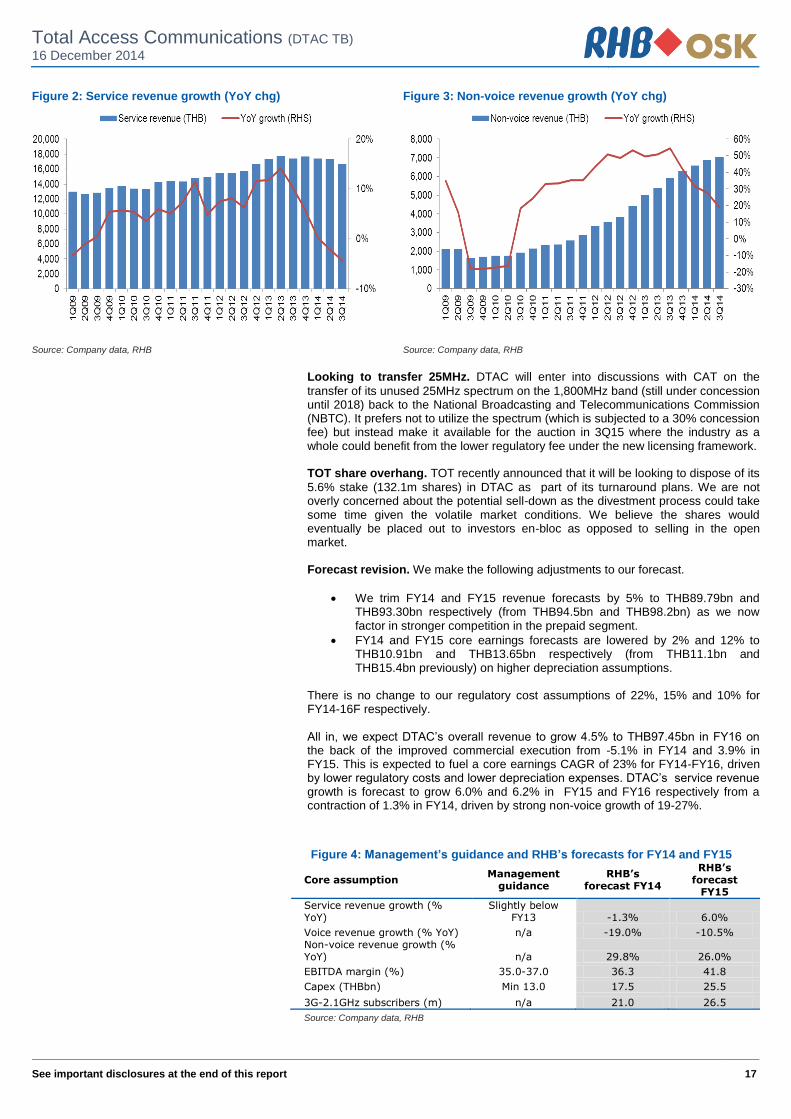
Figure 2: Service revenue growth (YoY chg) Figure 3: Non-voice revenue growth (YoY chg)
Source: Company data, RHB Source: Company data, RHB
Looking to transfer 25MHz. DTAC will enter into discussions with CAT on the
transfer of its unused 25MHz spectrum on the 1,800MHz band (still under concession until 2018) back to the National Broadcasting and Telecommunications Commission (NBTC). It prefers not to utilize the spectrum (which is subjected to a 30% concession fee) but instead make it available for the auction in 3Q15 where the industry as a whole could benefit from the lower regulatory fee under the new licensing framework. TOT share overhang. TOT recently announced that it will be looking to dispose of its
5.6% stake (132.1m shares) in DTAC as part of its turnaround plans. We are not overly concerned about the potential sell-down as the divestment process could take some time given the volatile market conditions. We believe the shares would eventually be placed out to investors en-bloc as opposed to selling in the open market. Forecast revision. We make the following adjustments to our forecast.
We trim FY14 and FY15 revenue forecasts by 5% to THB89.79bn and THB93.30bn respectively (from THB94.5bn and THB98.2bn) as we now factor in stronger competition in the prepaid segment.
FY14 and FY15 core earnings forecasts are lowered by 2% and 12% to THB10.91bn and THB13.65bn respectively (from THB11.1bn and THB15.4bn previously) on higher depreciation assumptions.
There is no change to our regulatory cost assumptions of 22%, 15% and 10% for FY14-16F respectively. All in, we expect DTAC’s overall revenue to grow 4.5% to THB97.45bn in FY16 on the back of the improved commercial execution from -5.1% in FY14 and 3.9% in FY15. This is expected to fuel a core earnings CAGR of 23% for FY14-FY16, driven by lower regulatory costs and lower depreciation expenses. DTAC’s service revenue growth is forecast to grow 6.0% and 6.2% in FY15 and FY16 respectively from a contraction of 1.3% in FY14, driven by strong non-voice growth of 19-27%.
Figure 4: Management’s guidance and RHB’s forecasts for FY14 and FY15
Core assumption Management
guidance RHB’s
forecast FY14
RHB’s forecast
FY15
Service revenue growth (% YoY)
Slightly below FY13 -1.3% 6.0%
Voice revenue growth (% YoY) n/a -19.0% -10.5% Non-voice revenue growth (% YoY) n/a 29.8% 26.0%
EBITDA margin (%) 35.0-37.0 36.3 41.8
Capex (THBbn) Min 13.0 17.5 25.5
3G-2.1GHz subscribers (m) n/a 21.0 26.5
Source: Company data, RHB
Total Access Communications (DTAC TB)
16 December 2014
See important disclosures at the end of this report 18
Figure 5: Forecast assumptions
Unit (THBm) 2013 2014F 2015F 2016F
Total revenue 94,617.
0 89,794.2 93,298.4 97,454.2
Service revenue ex-interconnection cost(IC)
70,107.0 69,219.2 73,344.8 77,923.7
Voice revenue 41,744.0 33,815.6 30,271.6 27,758.1
Non-voice revenue 22,583.0 29,305.0 36,925.6 43,821.5
Handset revenue 13,798.0 13,511.8 13,599.2 13,678.9
EBITDA 30,047.
3 32,628.4 38,963.1 44,327.6
EBITDA margin (%) 31.8% 36.3% 41.8% 45.5%
Regulatory costs on service revenue ex- IC (%)
31% 22% 15% 10%
PATAMI 11,843.
5 10,910.2 13,651.8 16,376.5
YoY growth (%) 5.4% -7.9% 25.1% 20.0%
Capex 10,850.7
17,450.0 25,450.0 15,450.0
Source: Company data, RHB
Figure 6: DCF-based valuation
Parameter
WACC 10.2%
LTG 1.5%
THB m
PV of FCFF (2014-2020) 94,238
PV of terminal value 273,458
NPV to Firm 367,696
(-) Net Debt 52,963
(-) Minority interest 0
NPV to Equity 314,733
No. of outstanding shares (m) 2,368.0
Per share (THB) 133.0
Source: RHB
Total Access Communications (DTAC TB)
16 December 2014
See important disclosures at the end of this report 19
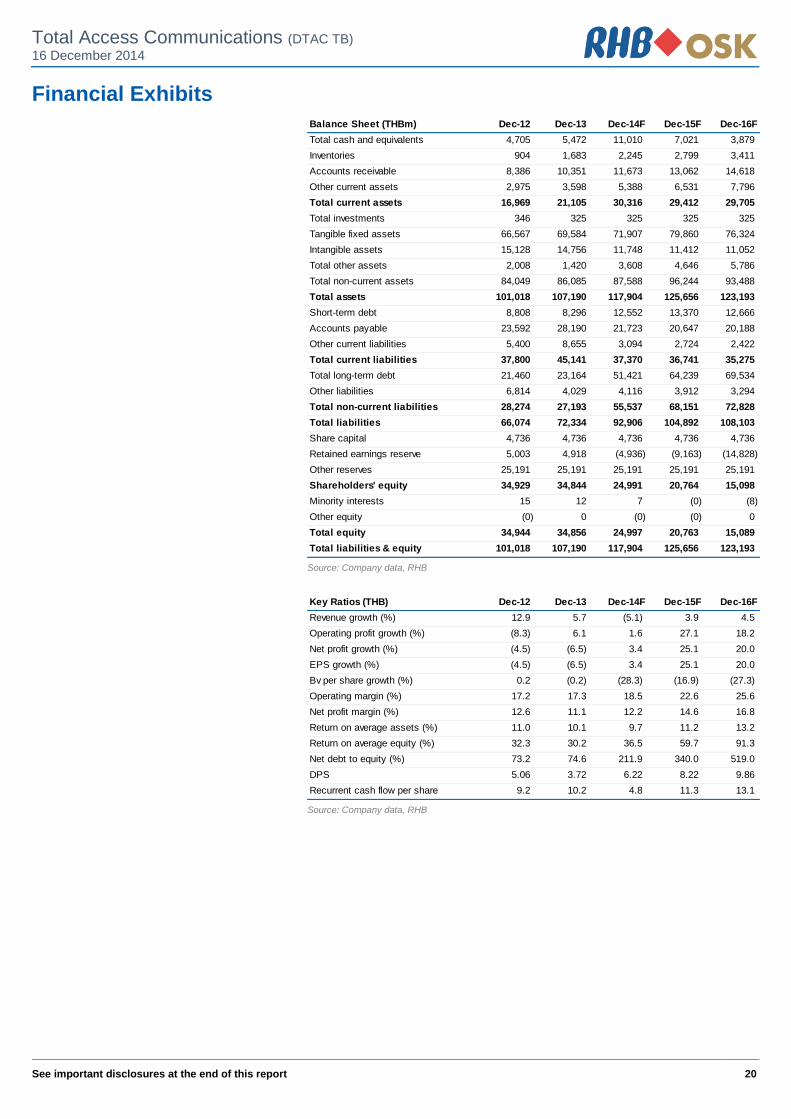
Financial Exhibits
Profit & Loss (THBm) Dec-12 Dec-13 Dec-14F Dec-15F Dec-16F
Total turnover 89,497 94,617 89,794 93,298 97,454
Cost of sales (53,140) (53,571) (45,195) (41,864) (40,156)
Gross profit 36,357 41,046 44,599 51,434 57,299
Other operating costs (20,937) (24,685) (27,969) (30,303) (32,317)
Operating profit 15,420 16,360 16,630 21,131 24,981
Operating EBITDA 26,885 30,055 32,629 38,963 44,328
Depreciation of fixed assets (11,465) (13,695) (15,999) (17,832) (19,346)
Operating EBIT 15,420 16,360 16,630 21,131 24,981
Net income from investments - - 200 - -
Interest expense (1,119) (2,154) (3,199) (4,074) (4,521)
Other non-recurring income 498 (370) - - -
Pre-tax profit 14,800 13,837 13,631 17,056 20,460
Taxation (3,524) (3,290) (2,726) (3,411) (4,092)
Minority interests 2 3 5 7 8
Profit after tax & minorities 11,278 10,549 10,911 13,652 16,376
Reported net profit 11,278 10,549 10,911 13,652 16,376
Recurring net profit 11,235 11,843 10,910 13,652 16,376
Source: Company data, RHB
Cash flow (THBm) Dec-12 Dec-13 Dec-14F Dec-15F Dec-16F
Operating profit 15,420 16,360 16,630 21,131 24,981
Depreciation & amortisation 11,465 13,695 15,999 17,832 19,346
Change in working capital (140) (1,770) (15,613) (4,736) (4,813)
Other operating cash flow 403 462 200 - -
Operating cash flow 27,148 28,747 17,215 34,227 39,514
Interest paid (956) (1,769) (3,199) (4,074) (4,521)
Dividends received 86 19 - - -
Tax paid (4,456) (2,936) (2,726) (3,411) (4,092)
Cash flow from operations 21,821 24,061 11,290 26,742 30,901
Capex (7,779) (10,851) (17,450) (25,450) (15,450)
Other investing cash flow (7,395) (818) (2,188) (1,038) (1,141)
Cash flow from investing activities (15,174) (11,668) (19,638) (26,488) (16,591)
Dividends paid (49,590) (12,687) (18,627) (17,879) (22,042)
Increase in debt 25,679 1,192 32,513 13,636 4,591
Other financing cash flow (55) - - (0) 0
Cash flow from financing activities (23,966) (11,495) 13,885 (4,243) (17,452)
Cash at beginning of period 21,873 4,555 5,472 11,010 7,021
Total cash generated (17,318) 897 5,538 (3,989) (3,141)
Implied cash at end of period 4,555 5,452 11,010 7,021 3,879
Source: Company data, RHB
Total Access Communications (DTAC TB)
16 December 2014
See important disclosures at the end of this report 20
Financial Exhibits
Balance Sheet (THBm) Dec-12 Dec-13 Dec-14F Dec-15F Dec-16F
Total cash and equivalents 4,705 5,472 11,010 7,021 3,879
Inventories 904 1,683 2,245 2,799 3,411
Accounts receivable 8,386 10,351 11,673 13,062 14,618
Other current assets 2,975 3,598 5,388 6,531 7,796
Total current assets 16,969 21,105 30,316 29,412 29,705
Total investments 346 325 325 325 325
Tangible fixed assets 66,567 69,584 71,907 79,860 76,324
Intangible assets 15,128 14,756 11,748 11,412 11,052
Total other assets 2,008 1,420 3,608 4,646 5,786
Total non-current assets 84,049 86,085 87,588 96,244 93,488
Total assets 101,018 107,190 117,904 125,656 123,193
Short-term debt 8,808 8,296 12,552 13,370 12,666
Accounts payable 23,592 28,190 21,723 20,647 20,188
Other current liabilities 5,400 8,655 3,094 2,724 2,422
Total current liabilities 37,800 45,141 37,370 36,741 35,275
Total long-term debt 21,460 23,164 51,421 64,239 69,534
Other liabilities 6,814 4,029 4,116 3,912 3,294
Total non-current liabilities 28,274 27,193 55,537 68,151 72,828
Total liabilities 66,074 72,334 92,906 104,892 108,103
Share capital 4,736 4,736 4,736 4,736 4,736
Retained earnings reserve 5,003 4,918 (4,936) (9,163) (14,828)
Other reserves 25,191 25,191 25,191 25,191 25,191
Shareholders' equity 34,929 34,844 24,991 20,764 15,098
Minority interests 15 12 7 (0) (8)
Other equity (0) 0 (0) (0) 0
Total equity 34,944 34,856 24,997 20,763 15,089
Total liabilities & equity 101,018 107,190 117,904 125,656 123,193
Source: Company data, RHB
Key Ratios (THB) Dec-12 Dec-13 Dec-14F Dec-15F Dec-16F
Revenue growth (%) 12.9 5.7 (5.1) 3.9 4.5
Operating profit growth (%) (8.3) 6.1 1.6 27.1 18.2
Net profit growth (%) (4.5) (6.5) 3.4 25.1 20.0
EPS growth (%) (4.5) (6.5) 3.4 25.1 20.0
Bv per share growth (%) 0.2 (0.2) (28.3) (16.9) (27.3)
Operating margin (%) 17.2 17.3 18.5 22.6 25.6
Net profit margin (%) 12.6 11.1 12.2 14.6 16.8
Return on average assets (%) 11.0 10.1 9.7 11.2 13.2
Return on average equity (%) 32.3 30.2 36.5 59.7 91.3
Net debt to equity (%) 73.2 74.6 211.9 340.0 519.0
DPS 5.06 3.72 6.22 8.22 9.86
Recurrent cash flow per share 9.2 10.2 4.8 11.3 13.1
Source: Company data, RHB
Total Access Communications (DTAC TB)
16 December 2014
See important disclosures at the end of this report 21
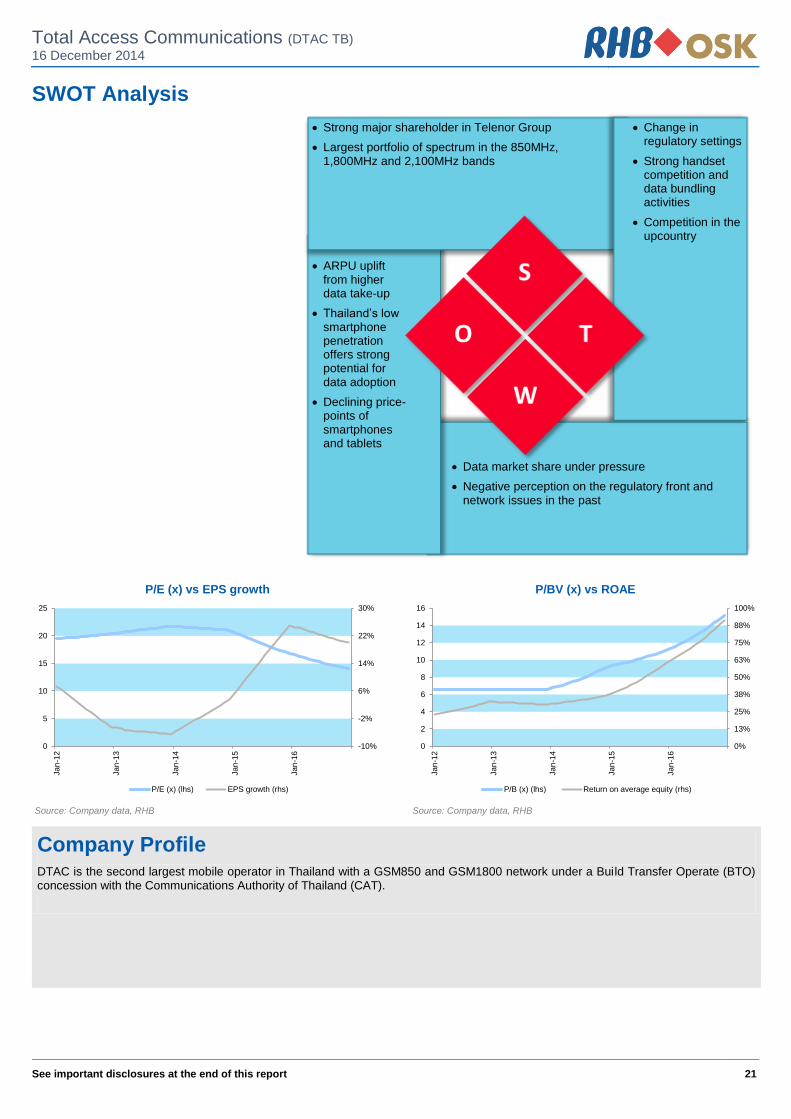
SWOT Analysis
Strong major shareholder in Telenor Group
Largest portfolio of spectrum in the 850MHz, 1,800MHz and 2,100MHz bands
Change in regulatory settings
Strong handset competition and data bundling activities
Competition in the upcountry
ARPU uplift from higher data take-up
Thailand’s low smartphone penetration offers strong potential for data adoption
Declining price-points of smartphones and tablets
Data market share under pressure
Negative perception on the regulatory front and network issues in the past
-10%
-2%
6%
14%
22%
30%
0
5
10
15
20
25
Jan
-12
Jan
-13
Jan
-14
Jan
-15
Jan
-16
P/E (x) vs EPS growth
P/E (x) (lhs) EPS growth (rhs)
0%
13%
25%
38%
50%
63%
75%
88%
100%
0
2
4
6
8
10
12
14
16
Jan
-12
Jan
-13
Jan
-14
Jan
-15
Jan
-16
P/BV (x) vs ROAE
P/B (x) (lhs) Return on average equity (rhs)
Source: Company data, RHB Source: Company data, RHB
Company Profile DTAC is the second largest mobile operator in Thailand with a GSM850 and GSM1800 network under a Build Transfer Operate (BTO) concession with the Communications Authority of Thailand (CAT).
Total Access Communications (DTAC TB)
16 December 2014
See important disclosures at the end of this report 22
Recommendation Chart
21
41
61
81
101
121
141
Dec-09 Mar-11 Jun-12 Oct-13
Price Close
na
72
78
115
103
116
122
133
130
116
140
140
138
Recommendations & Target Price
Buy Neutral Sell Trading Buy Take Profit Not Rated
Source: RHB, Bloomberg
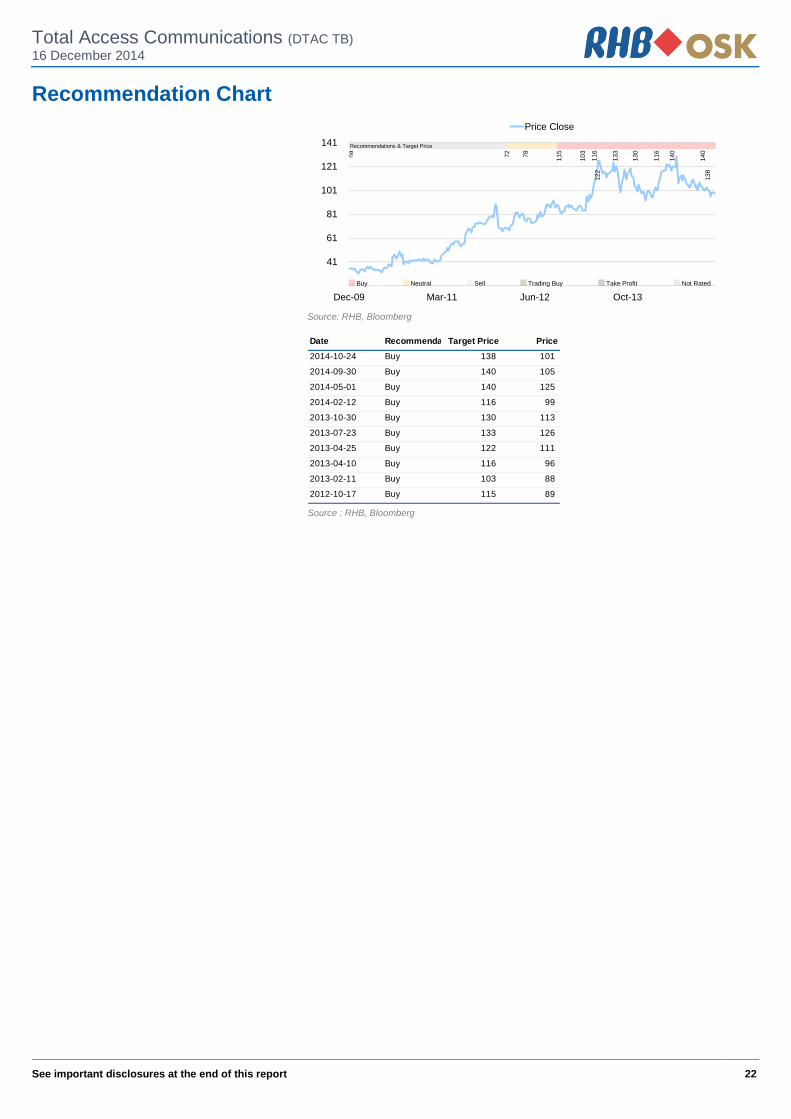
Date RecommendationTarget Price Price
2014-10-24 Buy 138 101
2014-09-30 Buy 140 105
2014-05-01 Buy 140 125
2014-02-12 Buy 116 99
2013-10-30 Buy 130 113
2013-07-23 Buy 133 126
2013-04-25 Buy 122 111
2013-04-10 Buy 116 96
2013-02-11 Buy 103 88
2012-10-17 Buy 115 89
Source : RHB, Bloomberg
23
RHB Guide to Investment Ratings Buy: Share price may exceed 10% over the next 12 months Trading Buy: Share price may exceed 15% over the next 3 months, however longer-term outlook remains uncertain Neutral: Share price may fall within the range of +/- 10% over the next 12 months Take Profit: Target price has been attained. Look to accumulate at lower levels Sell: Share price may fall by more than 10% over the next 12 months Not Rated: Stock is not within regular research coverage Disclosure & Disclaimer All research is based on material compiled from data considered to be reliable at the time of writing, but RHB does not make any representation or warranty, express or implied, as to its accuracy, completeness or correctness. No part of this report is to be construed as an offer or solicitation of an offer to transact any securities or financial instruments whether referred to herein or otherwise. This report is general in nature and has been prepared for information purposes only. It is intended for circulation to the clients of RHB and its related companies. Any recommendation contained in this report does not have regard to the specific investment objectives, financial situation and the particular needs of any specific addressee. This report is for the information of addressees only and is not to be taken in substitution for the exercise of judgment by addressees, who should obtain separate legal or financial advice to independently evaluate the particular investments and strategies. This report may further consist of, whether in whole or in part, summaries, research, compilations, extracts or analysis that has been prepared by RHB’s strategic, joint venture and/or business partners. No representation or warranty (express or implied) is given as to the accuracy or completeness of such information and accordingly investors should make their own informed decisions before relying on the same. RHB, its affiliates and related companies, their respective directors, associates, connected parties and/or employees may own or have positions in securities of the company(ies) covered in this research report or any securities related thereto, and may from time to time add to, or dispose off, or may be materially interested in any such securities. Further, RHB, its affiliates and related companies do and seek to do business with the company(ies) covered in this research report and may from time to time act as market maker or have assumed an underwriting commitment in securities of such company(ies), may sell them or buy them from customers on a principal basis and may also perform or seek to perform significant investment banking, advisory or underwriting services for or relating to such company(ies), as well as solicit such investment, advisory or other services from any entity mentioned in this research report. RHB and its employees and/or agents do not accept any liability, be it directly, indirectly or consequential losses, loss of profits or damages that may arise from any reliance based on this report or further communication given in relation to this report, including where such losses, loss of profits or damages are alleged to have arisen due to the contents of such report or communication being perceived as defamatory in nature. The term “RHB” shall denote where applicable, the relevant entity distributing the report in the particular jurisdiction mentioned specifically herein below and shall refer to RHB Research Institute Sdn Bhd, its holding company, affiliates, subsidiaries and related companies. All Rights Reserved. This report is for the use of intended recipients only and may not be reproduced, distributed or published for any purpose without prior consent of RHB and RHB accepts no liability whatsoever for the actions of third parties in this respect. Malaysia This report is published and distributed in Malaysia by RHB Research Institute Sdn Bhd (233327-M), Level 11, Tower One, RHB Centre, Jalan Tun Razak, 50400 Kuala Lumpur, a wholly-owned subsidiary of RHB Investment Bank Berhad (RHBIB), which in turn is a wholly-owned subsidiary of RHB Capital Berhad. Singapore This report is published and distributed in Singapore by DMG & Partners Research Pte Ltd (Reg. No. 200808705N), a wholly-owned subsidiary of DMG & Partners Securities Pte Ltd, a joint venture between Deutsche Asia Pacific Holdings Pte Ltd (a subsidiary of Deutsche Bank Group) and OSK Investment Bank Berhad, Malaysia which have since merged into RHB Investment Bank Berhad (the merged entity is referred to as “RHBIB”, which in turn is a wholly-owned subsidiary of RHB Capital Berhad). DMG & Partners Securities Pte Ltd is a Member of the Singapore Exchange Securities Trading Limited. DMG & Partners Securities Pte Ltd may have received compensation from the company covered in this report for its corporate finance or its dealing activities; this report is therefore classified as a non-independent report. As of 15 December 2014, DMG & Partners Securities Pte Ltd and its subsidiaries, including DMG & Partners Research Pte Ltd do not have proprietary positions in the securities covered in this report, except for: a) - As of 15 December 2014, none of the analysts who covered the securities in this report has an interest in such securities, except for: a) Advanced Info Services, Total Access Communication Special Distribution by RHB Where the research report is produced by an RHB entity (excluding DMG & Partners Research Pte Ltd) and distributed in Singapore, it is only distributed to "Institutional Investors", "Expert Investors" or "Accredited Investors" as defined in the Securities and Futures Act, CAP. 289 of Singapore. If you are not an "Institutional Investor", "Expert Investor" or "Accredited Investor", this research report is not intended for you and you should disregard this research report in its entirety. In respect of any matters arising from, or in connection with this research report, you are to contact our Singapore Office, DMG & Partners Securities Pte Ltd Hong Kong This report is published and distributed in Hong Kong by RHB OSK Securities Hong Kong Limited (“RHBSHK”) (formerly known as OSK Securities Hong Kong Limited), a subsidiary of OSK Investment Bank Berhad, Malaysia which have since merged into RHB Investment Bank Berhad (the merged entity is referred to as “RHBIB”), which in turn is a wholly-owned subsidiary of RHB Capital Berhad.
24
RHBSHK, RHBIB and/or other affiliates may beneficially own a total of 1% or more of any class of common equity securities of the subject company. RHBSHK, RHBIB and/or other affiliates may, within the past 12 months, have received compensation and/or within the next 3 months seek to obtain compensation for investment banking services from the subject company. Risk Disclosure Statements The prices of securities fluctuate, sometimes dramatically. The price of a security may move up or down, and may become valueless. It is as likely that losses will be incurred rather than profit made as a result of buying and selling securities. Past performance is not a guide to future performance. RHBSHK does not maintain a predetermined schedule for publication of research and will not necessarily update this report Indonesia This report is published and distributed in Indonesia by PT RHB OSK Securities Indonesia (formerly known as PT OSK Nusadana Securities Indonesia), a subsidiary of OSK Investment Bank Berhad, Malaysia, which have since merged into RHB Investment Bank Berhad, which in turn is a wholly-owned subsidiary of RHB Capital Berhad. Thailand This report is published and distributed in Thailand by RHB OSK Securities (Thailand) PCL (formerly known as OSK Securities (Thailand) PCL), a subsidiary of OSK Investment Bank Berhad, Malaysia, which have since merged into RHB Investment Bank Berhad, which in turn is a wholly-owned subsidiary of RHB Capital Berhad. Other Jurisdictions In any other jurisdictions, this report is intended to be distributed to qualified, accredited and professional investors, in compliance with the law and regulations of the jurisdictions. DMG & Partners Research Guide to Investment Ratings Buy: Share price may exceed 10% over the next 12 months Trading Buy: Share price may exceed 15% over the next 3 months, however longer-term outlook remains uncertain Neutral: Share price may fall within the range of +/- 10% over the next 12 months Take Profit: Target price has been attained. Look to accumulate at lower levels Sell: Share price may fall by more than 10% over the next 12 months Not Rated: Stock is not within regular research coverage DISCLAIMERS This research is issued by DMG & Partners Research Pte Ltd and it is for general distribution only. It does not have any regard to the specific investment objectives, financial situation and particular needs of any specific recipient of this research report. You should independently evaluate particular investments and consult an independent financial adviser before making any investments or entering into any transaction in relation to any securities or investment instruments mentioned in this report. The information contained herein has been obtained from sources we believed to be reliable but we do not make any representation or warranty nor accept any responsibility or liability as to its accuracy, completeness or correctness. Opinions and views expressed in this report are subject to change without notice. This report does not constitute or form part of any offer or solicitation of any offer to buy or sell any securities. DMG & Partners Research Pte Ltd is a wholly-owned subsidiary of DMG & Partners Securities Pte Ltd, a joint venture between OSK Investment Bank Berhad, Malaysia which have since merged into RHB Investment Bank Berhad (the merged entity is referred to as “RHBIB” which in turn is a wholly-owned subsidiary of RHB Capital Berhad) and Deutsche Asia Pacific Holdings Pte Ltd (a subsidiary of Deutsche Bank Group). DMG & Partners Securities Pte Ltd is a Member of the Singapore Exchange Securities Trading Limited. DMG & Partners Securities Pte Ltd and their associates, directors, and/or employees may have positions in, and may effect transactions in the securities covered in the report, and may also perform or seek to perform broking and other corporate finance related services for the corporations whose securities are covered in the report. This report is therefore classified as a non-independent report. As of 15 December 2014, DMG & Partners Securities Pte Ltd and its subsidiaries, including DMG & Partners Research Pte Ltd, do not have proprietary positions in the subject companies, except for: a) - As of 15 December 2014, none of the analysts who covered the stock in this report has an interest in the subject companies covered in this report, except for: a) Advanced Info Services, Total Access Communication DMG & Partners Research Pte. Ltd. (Reg. No. 200808705N)
Kuala Lumpur Hong Kong Singapore
Malaysia Research Office
RHB Research Institute Sdn Bhd Level 11, Tower One, RHB Centre
Jalan Tun Razak Kuala Lumpur
Malaysia Tel : +(60) 3 9280 2185 Fax : +(60) 3 9284 8693
RHB OSK Securities Hong Kong Ltd. (formerly known
as OSK Securities Hong Kong Ltd.)
12th Floor
World-Wide House 19 Des Voeux Road Central, Hong Kong
Tel : +(852) 2525 1118 Fax : +(852) 2810 0908
DMG & Partners
Securities Pte. Ltd. 10 Collyer Quay
#09-08 Ocean Financial Centre Singapore 049315
Tel : +(65) 6533 1818 Fax : +(65) 6532 6211
Jakarta Shanghai Phnom Penh
PT RHB OSK Securities Indonesia (formerly known as
PT OSK Nusadana Securities Indonesia)
Plaza CIMB Niaga 14th Floor
Jl. Jend. Sudirman Kav.25 Jakarta Selatan 12920, Indonesia
Tel : +(6221) 2598 6888 Fax : +(6221) 2598 6777
RHB OSK (China) Investment Advisory Co. Ltd.
(formerly known as OSK (China) Investment Advisory Co. Ltd.)
Suite 4005, CITIC Square 1168 Nanjing West Road
Shanghai 20041 China
Tel : +(8621) 6288 9611 Fax : +(8621) 6288 9633
RHB OSK Indochina Securities Limited (formerly
known as OSK Indochina Securities Limited)
No. 1-3, Street 271 Sangkat Toeuk Thla, Khan Sen Sok
Phnom Penh Cambodia
Tel: +(855) 23 969 161 Fax: +(855) 23 969 171
Bangkok
RHB OSK Securities (Thailand) PCL (formerly known
as OSK Securities (Thailand) PCL) 10th Floor, Sathorn Square Office Tower
98, North Sathorn Road,Silom Bangrak, Bangkok 10500
Thailand Tel: +(66) 2 862 9999
Fax : +(66) 2 108 0999
Thai Institute of Directors Association (IOD) – Corporate Governance Report Rating 2014
Excellent
ADVANC BCP CPF ERW IVL NKI PS ROBINS SCB SNC TCAP TMB UV AOT BECL CPN GRAMMY KBANK NOBLE PSL RS SCC SPALI THAI TNITY VGI ASIMAR BKI CSL HANA KKP PAP PTT S&J SCSMG SPI THCOM TOP WACOAL BAFS BROOK DRT HEMRAJ KTB PG PTTEP SAMART SE-ED SSI THRE TRC BANPU BTS DTAC ICC LPN PHOL PTTGC SAMTEL SIM SSSC TIP TRUE BAY CIMB EASTW INTUCH MCOT PR QH SAT SIS SVI TASCO TTW BBL CK EGCO IRPC MINT PRANDA RATCH SC SITHAI SYMC TKT TVO
Very Good
2S AYUD CNT GL KKC MBK OISHI SABINA STANLY TK TTCL zZMICO ACAP BEC CPALL GLOW KSL MBKET PB SAMCO STEC TLUXE TUF AF BFIT CSC GOLD KWC MFC PDI SCCC SUC TMILL TWFP AHC BH DCC GSTEL L&E MFEC PE SCG SUSCO TMT TYM AIT BIGC DELTA GUNKUL LANNA MODERN PF SEAFCO SYNTEC TNL UAC AKP BJC DTC HMPRO LH MTI PJW SFP TASCO TOG UMI AMANAH BLA ECL HTC LHBANK NBC PM SIAM TCP TPC UMS AMARIN BMCL EE IFEC LHK NCH PPM SINGER TF TPCORP UP AMATA BWG EIC INET LIVE NINE PPP SIRI TFD TPIPL UPOIC AP CCET ESSO ITD LOXLEY NMG PREB SKR TFI TRT UT APCO CENTEL FE JAS LRH NSI PRG SMT THANA TRU VIBHA APCS CFRESH FORTH JUBILE LST NWR PT SNP THANI TSC VIH ASIA CGS GBX KBS MACO OCC PYLON SPCG THIP TSTE VNG ASK CHOW GC KCE MAJOR OFM QTC SPPT TICON TSTH VNT ASP CM GFPT KGI MAKRO OGC RASA SSF TIPCO TTA YUASA *** PHATRA was voluntarily delisted from the Stock Exchange of Thailand effectively on September 25,2012
Good
A BCH CRANE FPI IT MBAX PICO SGP TBSP TPP WIN AAV BEAUTY CSP FSS JMART MDX PL SIMAT TCCC TR WORK AEC BGI CSR GENCO JMT PRINC POST SLC TEAM TTI AEONTS BLAND CTW GFM JTS MJD PRECHA SMIT TGCI TVD AFC BOL DEMCO GJS JUTHA MK PRIN SMK TIC TVI AGE BROCK DNA GLOBAL KASET MOONG Q-CON SOLAR TIES TWZ AH BSBM DRACO HFT KC MPIC QLT SPC TIW UBIS AI CHARAN EA HTECH KCAR MSC RCI SPG TKS UEC AJ CHUO EARTH HYDRO KDH NC RCL SRICHA TMC UOBKH AKR CI EASON IFS KTC NIPPON ROJNA SSC TMD UPF ALUCON CIG EMC IHL KWH NNCL RPC STA TMI UWC ANAN CITY EPCO ILINK LALIN NTV SCBLIF SUPER TNDT VARO ARIP CMR F&D INOX LEE OSK SCP SVOA TNPC VTE AS CNS FNS IRC MATCH PAE SENA SWC TOPP WAVE BAT-3K CPL FOCUS IRPC MATI PATO SF SYNEX TPA WG *** CIMBI was voluntarily delisted from the Stock Exchange of Thailand effectively on September 25, 2012. Source: Thai Institute of Directors (IOD)
IOD (IOD Disclaimer)
การเปิดเผลผลการส ารวจของสมาคมส่งเสริมสถาบันกรรมการบรษิัทไทย (IOD) ในเรื่องการก ากับดูแลกิจการ (Corporate Governance) นี้เป็นการด าเนินการตามนโยบายของส านักงานคณะกรรมการก ากับหลักทรัพย์และตลาดหลักทรัพย์ โดยการส ารวจของ IOD เป็นการส ารวจและประเมินจากข้อมูลของบรษัทจดทะเบียนในตลาดหลักทรัพย์แห่งประเทศไทยและตลาดหลกัทรัพย์เอ็มเอไอ ที่มีการเปิดเผยต่อสาธารณะและเป็นข้อมูลที่ผูล้งทุนทั่วไปสามารถเข้าถงึได้ ดังนั้นผลส ารวจดังกล่าวจึงเป็นการน าเสนอในมุมมองของบุคคลภายนอกโดยไม่ได้เป็นการประเมินการปฏิบัติและมิได้มีการใช้ข้อมูลภายในในการประเมิน
อนึ่ง ผลการส ารวจดังกล่าว เป็นผลการส ารวจ ณ วนัที่ปรากฎในรายงานการก ากับดแูละกิจการบริษัทจดทะเบียนไทยเท่านั้น ดังนั้นผลการส ารวจจึงอาจเปลี่ยนแปลงได้ภายหลังวันดังกล่าว ทัง้นี้บริษัทหลักทรัพย์ อาร์เอสบี โอเอส เค จ ากัด (มหาชน) มิได้ยืนยันหรือรับรองถึงความถูกต้องของผลการส ารวจดงักล่าวแต่อย่างใด