Embed Size (px)
Citation preview
International Ophthalmology 20: 231-239, 1996. 231 @ 1996 KluwerAcademic Publishers. Printed in the Netherlands.
Temporal integration in diseased eyes
M o m o y o Kono & Shin ich i Yamade* Department of Ophthalmology, Shiga University of Medical Science, Seta, Ohtsu, Shiga, 520-21, Japan * Author for correspondence
Accepted 17 September 1996
Key words: central serous retinopathy, critical duration for visual acuity, glaucoma, increment threshold, macular edema, temporal integration
Abstract
We examined critical duration for visual acuity in eyes with central serous retinopathy (CSR), macular edema (ME) and glaucoma. Critical duration for visual acuity is the minimum period of time to perceive the acuity chart of his best. Visual acuity was measured at several limited exposure durations and the results were then compared with that of normal eyes. The acuity target was a single Landolt ring. The size, direction, and exposure duration of the target were computer controlled. The mean critical duration for visual acuity of the CSR and ME groups was 1.78 s and 2.69 s. These were significantly longer than that of the normal group (0.62 s). The critical duration of the glaucoma group was 0.42 s, which was not significantly prolonged. Critical duration for the increment or static threshold was measured for the purpose of comparison, and no significant differences were found between the diseased eyes (the CSR and ME groups) and the normal eyes, although the thresholds were significantly higher in the diseased eyes. Next, fixation movements which occurred during visual acuity testing were observed in order to investigate their role in acuity testing. In both normal and ME eyes the frequency and amplitude of microsaccades were smaller while the visual acuity chart was shown. This suggests that microsaccades play no positive role in the reading of acuity charts, and that they bear little relation to the phenomenon of critical duration for visual acuity.
From these results we hypothesized that in the CSR and ME groups the X-type ganglion cells send incomplete information to the central neural system. Thus, a longer time is required to obtain complete information before responding. Furthermore, one glaucoma case suggested that in diseased eyes in which mainly the Y-cell systems are damaged, temporal specificity in visual acuity for shorter exposure duration may reveal different response patterns.
Introduction
During visual acuity testing, patients are occasional- ly encountered who, though demonstrating relatively high levels of visual acuity and comprehension, require longer stimulus duration for the proper reading of tar- gets. Patients who have macular edema are more likely to demonstrate this phenomenon. Time-dependency in visual function, such as Bloch's law, which is a phe- nomenon of critical duration in increment threshold testing (L x t = constant, whereL represents the thresh- old luminance and t represents the stimulus duration), is thought to be as applicable to visual acuity as it is also sensitive to temporal (light) summation. Hence, we measured critical duration during visual acuity testing
as a test of temporal integration in the visual response system.
We report the results of critical duration for visual acuity by measuring acuity at several limited exposure times in both normal and diseased eyes. We made com- parable measurements of critical duration while sam- pling increment or static thresholds. Fixation move- ments which occurred during visual acuity testing were recorded in order to investigate the role of fixation fluc- tuation in acuity testing. In the latter, we attempted to answer the following: Are there movements that com- pensate for disorders in the sensory system? Are there any movements that disturb visual responses during measurements of visual acuity?

232
E x p e r i m e n t 1 - M a t e r i a l s a n d m e t h o d s
During the examination of critical duration in visual acuity testing, the acuity target was a single Landolt ring projected upon a small square screen using a chart projector, NIDEK CP-500. The size, direction, and exposure duration of the target were computer con- trolled using a stepping motor and a chopper disc. The subjects' examined eye was corrected with the appro- priate distance lens, and no artificial pupil was used. The other eye was occluded. The viewing distance was 5 m from a 20 x 20 cm screen, which subtends a 2.3 x 2.3 degree of arc at the subject. The acuity target was projected at the center of the screen, using no fixa- tion marks. The illuminance of the room was 30 lux at the subject and 19 lux at the screen. The luminance of the Landolt ring at the entrance pupil of the eye was 4.7 cd/m 2 (mean) and that of the background was 72.3 cd/m 2 (mean) during the examination. The target contrast was 87.8% (mean).
After each presentation, the subject was required to choose the orientation of the Landolt ring from top, bottom, right, left or cannot discriminate. To indicate the exposure timing we used a warning sound before the presentation of the target. The staircase method was used in this study to determine the visual acuity of each exposure duration. Log visual acuity measured at each exposure duration (60 ~ 1000 ms) was plotted, and the linear regression line was computed. Using the 75% value of visual acuity (V75) on a regression line, which was obtained with unlimited exposure duration, we determined the critical duration (Tc) (Figure 1). We calculated the critical duration using 100%, 80%, 75%, and 70% of visual acuity and found 75% gave the smallest deviation of value. In addition, we mea- sured visual acuity at relatively short exposure dura- tions using a camera shutter.
E x p e r i m e n t 1 - R e s u l t s
The data of 17 normal control eyes (10 males and 7 females, ranging in age from 22 to 60 years) are plotted in Figure 2 as a function of exposure time. To demon- strate clearly, the data for each subject was moved until the final point of each line was superimposed on the value of visual acuity taken with unlimited exposure time. Visual acuity increases until about 1000 ms (1 s), and then remains constant. The mean critical duration for the test population was 0.62 s.
< >
z
2.2"
2.0-
1.8-
1.6i
1.4
1.2
1.0
o o V
.................................................................... V 7 5
Tc: critical duration
2 ; 4 ; log exposure time (ms)
Figure 1. The critical duration in visual acuity testing. Log values of visual acuity which were measured at various exposure duration (60 ~ 1000 ms) were plotted as a function of log exposure time and a regression line was computed. The 75% value of acuity taken with no limited exposure duration (V75) on the regression line shows the critical duration (Tc).
2.2
< 2.o ;>
1.8
1.6
~l} 1.4 O
1,2
1.0
Normal control 17 eyes
Tc: 2 . 7 9 • log ms 0.62 sec. (0 .40~0 .95 sec.)
log exposure time (ms)
Figure 2. The results of 17 normal control eyes. The data of each subject was moved until the final point of each line was superimposed on the value of visual acuity taken with no limited exposure dura- tion. Visual acuity increases until about 1000 ms and then remains constant. The mean critical duration for visual acuity of this group was 0.62 s.
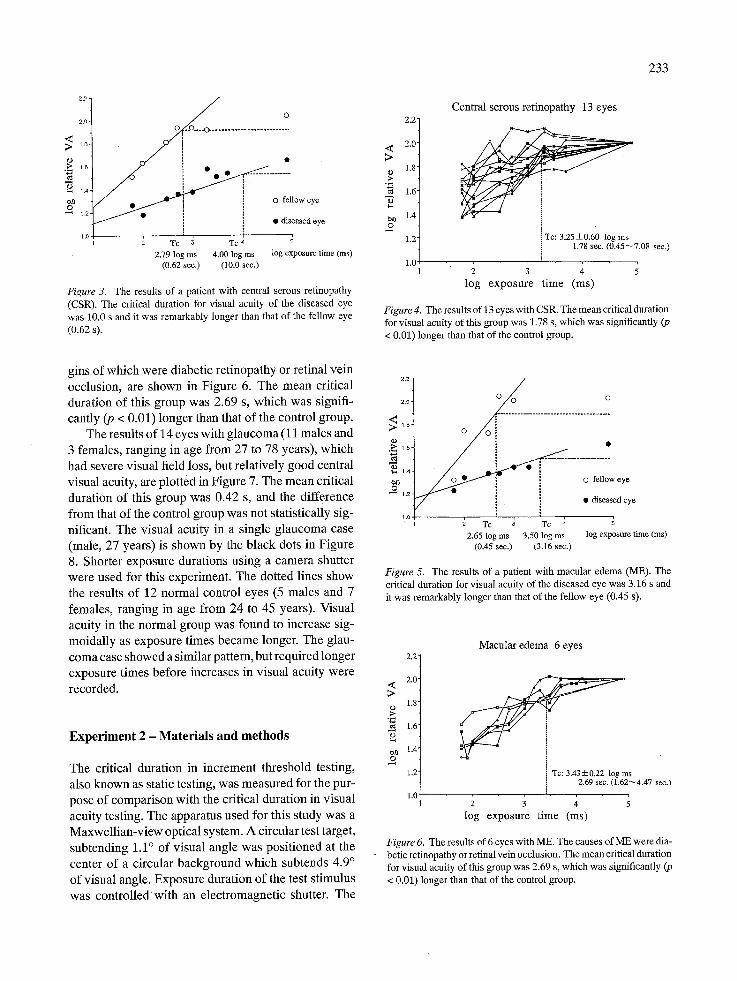
Figure 3 shows the results of one patient (male, 52 years) with central serous retinopathy (CSR). The critical duration of the diseased eye was 10.0 s and it was remarkably longer than that of the fellow eye (0.62 s). The results of 13 eyes with CSR (11 males and 2 females, ranging in age from 37 to 60 years) are shown in Figure 4. The mean critical duration of this group was 1.78 s which was significantly (p < 0.01) longer than that of the control group.
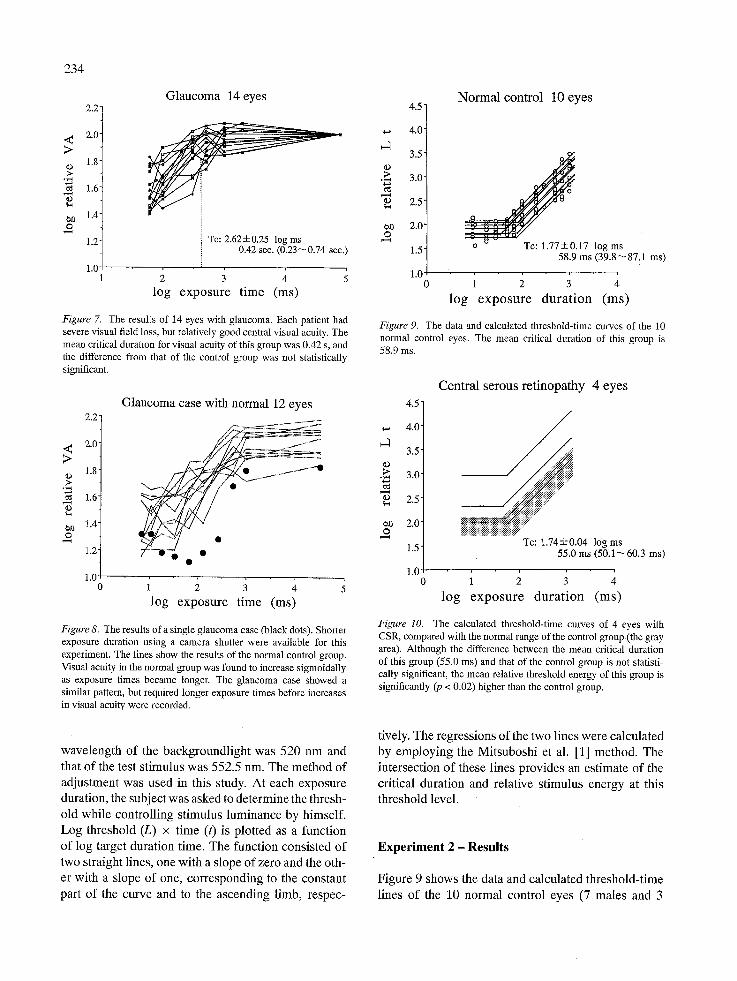
Figure 5 shows the results of one patient (female, 20 years) with macular edema (ME) caused by central retinal vein occlusion. The critical duration of the dis- eased eye was 3.16 s and that of the fellow eye was 0.45 s. The results of 6 eyes with ME (1 male and 5 females, ranging in age from 23 to 66 years), the ori-
233
2.O'
16
�9 1.6
-
1.4-
1.2"
1.0
0
. . . . . . . . . . . . . . . . . . . . i
/ ~ O fellow eye
/ �9 �9 diseased eye
Tc ~ Tc 4 2.79 log ms 4.00 log ms log exposure time (ms)
(0.62 see.) (10.0 sec.)
Figure 3. The results of a patient with central serous retinopathy (CSR). The critical duration for visual acuity of the diseased eye was 10.0 s and it was remarkably longer than that of the fellow eye
(0.62 s).
2.2"
.~ 2.0" >
1.8- �9 .~ "~ 1.6" z ~1~ 1.4-
2 1.2"
1.0
Cen t r a l se rous r e t i nopa thy 13 e y e s
i Tc: 3.25-t-0.60 log ms 1.78 sec. (0.45--7.08 sec.)
2 3 4 l o g e x p o s u r e t i m e ( m s )
Figure 4. The results of 13 eyes with CSR. The mean critical duration for visual acuity of this group was 1.78 s, which was significantly (p < 0.01) longer than that of the control group.
gins of which were diabetic retinopathy or retinal vein occlusion, are shown in Figure 6. The mean critical duration of this group was 2.69 s, which was signifi- cantly (p < 0.01) longer than that of the control group.
The results of 14 eyes with glaucoma (11 males and 3 females, ranging in age from 27 to 78 years), which had severe visual field loss, but relatively good central visual acuity, are plotted in Figure 7. The mean critical duration of this group was 0.42 s, and the difference from that of the control group was not statistically sig- nificant. The visual acuity in a single glaucoma case (male, 27 years) is shown by the black dots in Figure 8. Shorter exposure durations using a camera shutter were used for this experiment. The dotted lines show the results of 12 normal control eyes (5 males and 7 females, ranging in age from 24 to 45 years). Visual acuity in the normal group was found to increase sig- moidally as exposure times became longer. The glau- coma case showed a similar pattern, but required longer exposure times before increases in visual acuity were recorded.
Exper iment 2 - Materials and methods
The critical duration in increment threshold testing, also known as static testing, was measured for the pur- pose of comparison with the critical duration in visual acuity testing. The apparatus used for this study was a Maxwellian-view optical system. A circular test target, subtending 1.1 ~ of visual angle was positioned at the center of a circular background which subtends 4.9 ~ of visual angle. Exposure duration of the test stimulus was controlledwith an electromagnetic shutter. The
2.0 0 0 0
~>. 1.8 0
"~ l ,
0 fellow eye
V , �9 diseased eye
1.o I , , , , �9 1 2 Tc ~ Tc 4 5
2.65 log ms 3.50 log ms log exposure time (ms) (0.45 see.) (3.16 sec.)
Figure 5. The results of a patient with macular edema (ME). The critical duration for visual acuity of the diseased eye was 3.16 s and it was remarkably longer than that of the fellow eye (0.45 s).
2.2'
2.0' <
1.8' �9
1.6
e~ 1.4' o
1.2
1.0
Macu la r e d e m a 6 eyes
Tc: 3.435=0.22 log ms 2.69 sec. (1.62~4.47 sec.)
log e x p o s u r e t i m e (ms)
Figure 6. The results of 6 eyes with ME. The causes of ME were dia- betic retinopathy or retinal vein occlusion. The mean critical duration for visual acuity of this group was 2.69 s, which was significantly (p < 0.01) longer than that of the control group.
234
< >
<D
e~0
2 . 2 -
2.0
1.8
1.6
1.4
1.2
1s
Glaucoma 14 eyes
Te: 2.62-----0.25 log ms 0.42 sec. (0.23~0.74 sec.)
2 3 4 ;
log exposure time (ms)
Figure 7. The results of 14 eyes with glaucoma. Each patient had severe visual field loss, but relatively good central visual acuity. The mean critical duration for visual acuity of this group was 0.42 s, and the difference from that of the control group was not statistically significant.
2 . 2 ~
2.0" < >
1.8" �9
1.6" �9
1.4"
2 1.2"
1.0 0
Glaucoma case with normal 12 eyes
log exposure time (ms)
Figure 8. The results of a single glaucoma case (black dots). Shorter exposure duration using a camera shutter were available for this experiment. The lines show the results of the normal control group. Visual acuity in the normal group was found to increase sigmoidally as exposure times became longer. The glaucoma case showed a similar pattern, but required longer exposure times before increases in visual acuity were recorded.
wavelength of the backgroundlight was 520 nm and that of the test stimulus was 552.5 nm. The method of adjustment was used in this study. At each exposure duration, the subject was asked to determine the thresh- old while controlling stimulus luminance by himself. Log threshold (L) x time (t) is plotted as a function of log target duration time. The function consisted of two straight lines, one with a slope of zero and the oth- er with a slope of one, corresponding to the constant part of the curve and to the ascending limb, respec-
4 ID
O
4.5
4.0
3.5
3.0-
2.5"
2.0"
1.5"
1.0
Normal control 10 eyes
j 8
~ u u t:l
To: 1.77• log ms 58.9 ms (39.8~87.1 ms)
log exposure durat ion (ms)
Figure 9. The data and calculated threshold-time curves of the 10 normal control eyes. The mean critical duration of this group is 58.9 ms.
�9
�9
O
4 . 5 �84
4.0
3.5
3.0
2.5
2.0
1.5
1.0 0
Central serous retinopathy 4 eyes
iNiiiiiiiiiiii!iiiiiiiiiiiiiiiiiiiiiiiiiiiiii~ .... Tc: 1.74• log ms
55.0 ms (50.1~60.3 ms)
1 2 3 4
log exposure durat ion (ms)
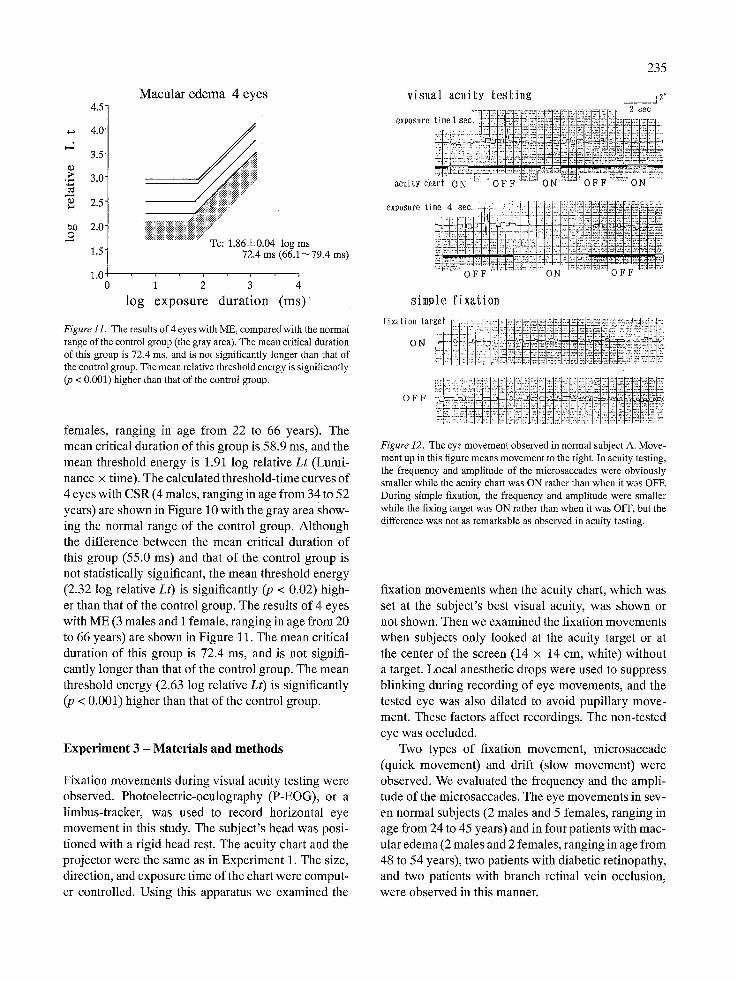
Figure 10. The calculated threshold-time curves of 4 eyes with CSR, compared with the normal range of the control group (the gray area). Although the difference between the mean critical duration of this group (55.0 ms) and that of the control group is not statisti- cally significant, the mean relative threshold energy of this group is significantly (p < 0.02) higher than the control group.
tively. The regressions of the two lines were calculated by employing the Mitsuboshi et al. [1] method. The intersection of these lines provides an estimate of the critical duration and relative stimulus energy at this threshold level.
Experiment 2 - Results
Figure 9 shows the data and calculated threshold-time lines of the 10 normal control eyes (7 males and 3
l l ) ;>
o.O 0
4 * 5 "
4.0"
3.5"
3.0 +
2.5"
2.0"
1.5"
1.0
Macular edema 4 eyes
iiNigiiii!i!iiii .... Tc: 1.86--+0.04 log ms
72.4 ms (66.1~79.4 ms)
1 2 3 4
log exposure durat ion ( m s )
Figure 11. The results of 4 eyes with ME, compared with the normal range of the control group (the gray area). The mean critical duration of this group is 72.4 ms, and is not significantly longer than that of the control group. The mean relative threshold energy is significantly (p < 0.001) higher than that of the control group.
females, ranging in age from 22 to 66 years). The mean critical duration of this group is 58.9 ms, and the mean threshold energy is 1.91 log relative Lt (Lumi- nance x time). The calculated threshold-time curves of 4 eyes with CSR (4 males, ranging in age from 34 to 52 years) are shown in Figure 10 with the gray area show- ing the normal range of the control group. Although the difference between the mean critical duration of this group (55.0 ms) and that of the control group is not statistically significant, the mean threshold energy (2.32 log relative Lt) is significantly (p < 0.02) high- er than that of the control group. The results of 4 eyes with ME (3 males and i female, ranging in age from 20 to 66 years) are shown in Figure 11. The mean critical duration of this group is 72.4 ms, and is not signifi- cantly longer than that of the control group. The mean threshold energy (2.63 log relative Lt) is significantly (p < 0.001) higher than that of the control group.
Exper iment 3 - Materials and methods
Fixation movements during visual acuity testing were observed. Photoelectric-oculography (P-EOG), or a limbus-tracker, was used to record horizontal eye movement in this study. The subject's head was posi- tioned with a rigid head rest. The acuity chart and the projector were the same as in Experiment 1. The size, direction, and exposure time of the chart were comput- er controlled. Using this apparatus we examined the
235
visual acuity test ing _ _ 1 2 . - , - = - : r ' + . - . = , = : = . = ~ . ~ : m = , ~ : ' . = : = . = ' : - . = = ~ 8 e c
exposure time i sec. - -+ -+--+-+0-"'--+"- '(2:!:!!:~i:+-i-:+:}~:!-~:;_~::~:-:~!;++:~-:~::!.+::::~::::~,:.:::.
I ................. " ............ i=i,i~.iii +ili ':i ~ i.- ::+ ~. i ,+
acuity ch
exposure time 4 see. :.21:,.:-,:+: ; : ....... .-~-:~Z::,il-.~ii!;;i~!~i~-~}:~i!:i.~:
:~+:~oi; F il:-~
simple f ixation
fixatio~ ~ar
Figure 12. The eye movement observed in normal subject A. Move- ment up in this figure means movement to the right. In acuity testing, the frequency and amplitude of the microsaccades were obviously smaller while the acuity chart was ON rather than when it was OFF. During simple fixation, the frequency and amplitude were smaller while the fixing target was ON rather than when it was OFF, but the difference was not as remarkable as observed in acuity testing.
fixation movements when the acuity chart, which was set at the subject's best visual acuity, was shown or not shown. Then we examined the fixation movements when subjects only looked at the acuity target or at the center of the screen (14 x 14 cm, white) without a target. Local anesthetic drops were used to suppress blinking during recording of eye movements, and the tested eye was also dilated to avoid pupillary move- ment. These factors affect recordings. The non-tested eye was occluded.
Two types of fixation movement, microsaccade (quick movement) and drift (slow movement) were observed. We evaluated the frequency and the ampli- tude of the microsaccades. The eye movements in sev- en normal subjects (2 males and 5 females, ranging in age from 24 to 45 years) and in four patients with mac- ular edema (2 males and 2 females, ranging in age from 48 to 54 years), two patients with diabetic retinopathy, and two patients with branch retinal vein occlusion, were observed in this manner.
236
visual acui ty tes t ing
exposure t i m e l s e c , , [ ~ ~ ~ ~ , ~ , ' r l . . ] 2 see , . , - t ~,...{.,-!. I,A :! i !. ,5-4.7-.i: I,,.L,~I.~ . r -~- ,
', ] I �9 ..t . . ' l" I.. ' . [ . ~ ~ ) t . [[ <[: ~ . ! ' i ' J I.." .[ . . . . . ~ I " i. : i i ~ I
acuity chart ON ! O F F ~ ON I O F F O N
exposure t me 4 see :: ::V; . .I �9 ~ I i i
ifliiii OFFI ........ ' , : l . l l!l : : ........ :'121T=I!:[ON " .... ' . . . . . . OFF i l i i i '
simple f ixa t ion
f ixat ion target . . . . :..1....'..:[2_:., t :.:':k : : ~ ; '~1: : _ , _
I, I I [ I I, i I ..... ........ I::+,[::+,
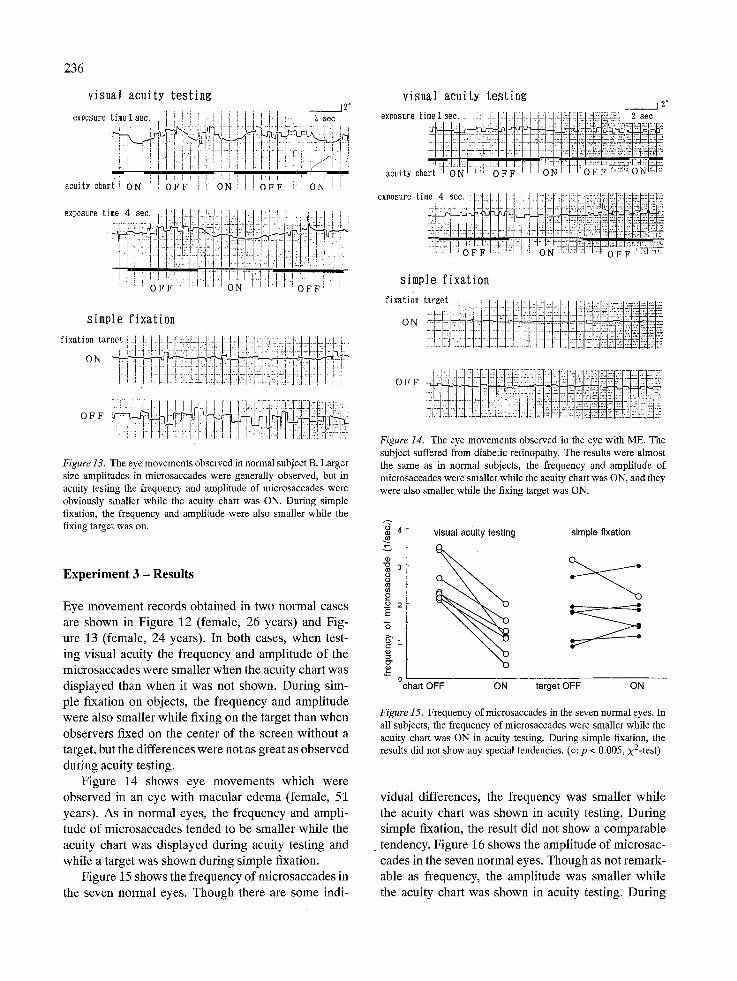
Figure 13�9 T h e eye m o v e m e n t s observed in no rma l subject B. L a r g e r
size ampl i tudes in mic rosaccades w e r e genera l ly observed , but in acuity test ing the f requency and ampl i tude o f m ic ro saccades w e r e
obvious ly smal le r whi le the acui ty chart was ON. Dur ing s imple fixation, the f r equency and ampl i tude w e r e also smal le r whi le the
f ixing target was on.
E x p e r i m e n t 3 - R e s u l t s
Eye movement records obtained in two normal cases are shown in Figure 12 (female, 26 years) and Fig- ure 13 (female, 24 years). In both cases, when test- ing visual acuity the frequency and amplitude of the microsaccades were smaller when the acuity chart was displayed than when it was not shown. During sim- ple fixation on objects, the frequency and amplitude were also smaller while fixing on the target than when observers fixed on the center of the screen without a target, but the differences were not as great as observed during acuity testing�9
Figure 14 shows eye movements which were observed in an eye with macular edema (female, 51 years). As in normal eyes, the frequency and ampli- tude of microsaccades tended to be smaller while the acuity chart was displayed during acuity testing and while a target was shown during simple fixation�9
Figure 15 shows the frequency of microsaccades in the seven normal eyes. Though there are some indi-
visual acui ty tes t ing _ _ j 2"
exposure time 1 see. -I .l:::l:.4.bl.:.4:.~.q:-lq:..l:~:l;i:l::41q:~:N~ 2 meo
�9 :1: . . . . . . I [ : . - " " ' : ~l~a.l~<x+ acui t, chart +~dT,il'H-:-d ~ - ~ - - H ~ ~
exposure time 4 see. : I I~:i-:.:.~:.:s.#:~.~:-ii~-;ii:;::ri:i;:i~:~:~=i
- -i
simple f ixa t ion
f ixat ion ta rge t . . . .: , . . . . . . . . . . . . . . . . . . . . . . . ...:::,=:. ....... O N ................ =. = =...2; = :::_: ..: .: 2 L =: 2: 52: ,:~ 5-_. 2,: ka: .2, 5= =
O F F
Figure 14. The eye m o v e m e n t s obse rved in the eye wi th ME. The
subject suffered f r o m diabetic retinopathy. The results w e r e a lmos t the s a m e as in no rma l subjects, the f requency and ampl i tude o f
mic rosaccades w e r e smal le r whi le the acuity chart was ON, and they
w e r e also smal le r whi le the fixing target was ON.
~ 4
8 .o
._o 2 E
>~
visual acuity testing simple fixation
chart OFF ON target OFF ON
Figure 15. Frequency o f mic rosaccades in the seven no rma l eyes. In
all subjects, the f r equency o f mic rosaccades w e r e smal le r whi le the acui ty chart was O N in acuity testing. Dur ing s imple fixation, the results did not show any special tendencies . (o: p < 0.005, x2- tes t )
vidual differences, the frequency was smaller while the acuity chart was shown in acuity testing. During simple fixation, the result did not show a comparable
�9 tendency�9 Figure 16 shows the amplitude of microsac- cades in the seven normal eyes. Though as not remark- able as frequency, the amplitude was smaller while the acuity chart was shown in acuity testing. During
237
.~ 3
82 o .~_ E
"5 l
0
visual acuity testing simple fixation
chart OFF ON target OFF ON
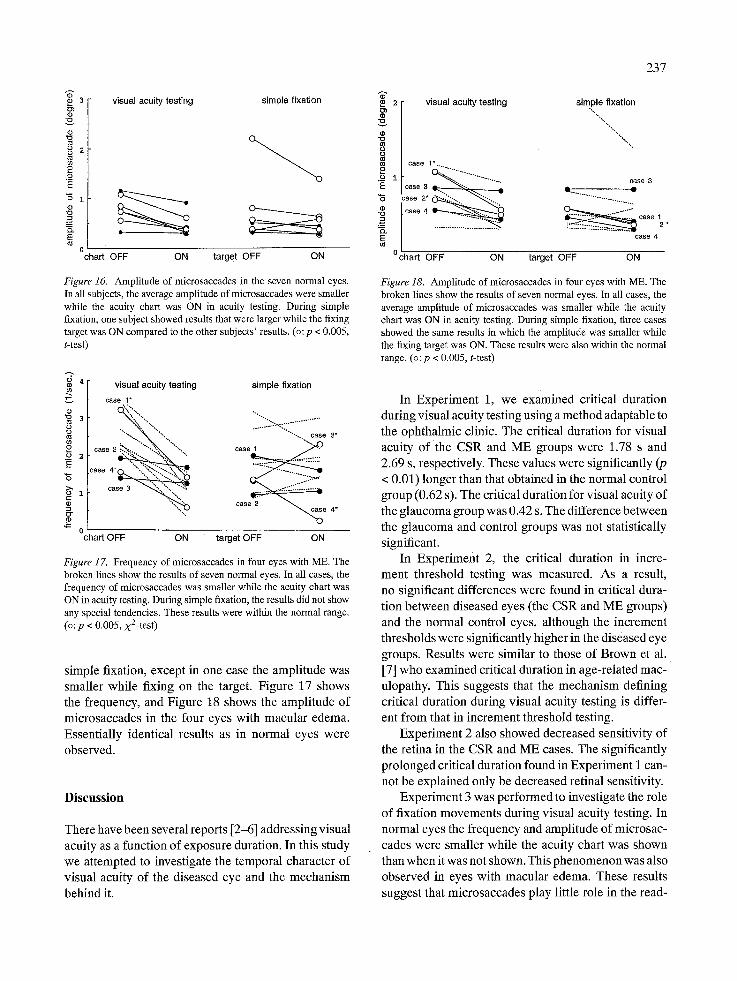
Figure 16. Amplitude of microsaccades in the seven normal eyes. In all subjects, the average amplitude of microsaccades were smaller while the acuity chart was ON in acuity testing. During simple fixation, one subject showed results that were larger while the fixing target was ON compared to the other subjects' results. (o: p < 0.005, t-test)
~4
3
8 b 2
"5
g 0
visual acuity testing simple fixation case 1"
'": c a s e 2 ~ case 4*
" - o chart OFF ON target OFF ON
Figure 17. Frequency of microsaccades in four eyes with ME. The broken lines show the results of seven normal eyes. In all cases, the frequency of microsaccades was smaller while the acuity chart was ON in acuity testing. During simple fixation, the results did not show any special tendencies. These results were within the normal range. (o: p < 0.005, x2-test)
simple fixation, except in one case the amplitude was smaller while fixing on the target. Figure 17 shows the frequency, and Figure 18 shows the amplitude of microsaccades in the four eyes with macular edema. Essentially identical results as in normal eyes were observed.
Discussion
There have been several reports [2-6] addressing visual acuity as a function of exposure duration. In this study we attempted to investigate the temporal character of visual acuity of the diseased eye and the mechanism behind it.
"~" 2 visualacuitytesting simplefixation
~ / case 1". ..........
$ " ' " , " " .............. case 3 "E case 3 "5 case 2 . . . . . . "",,.. ~ ...........................
Ice .... " ~ . . . . . . . . . . = ~ -----"'2" caee, } 2. case 4
~ ~ target OFF ON
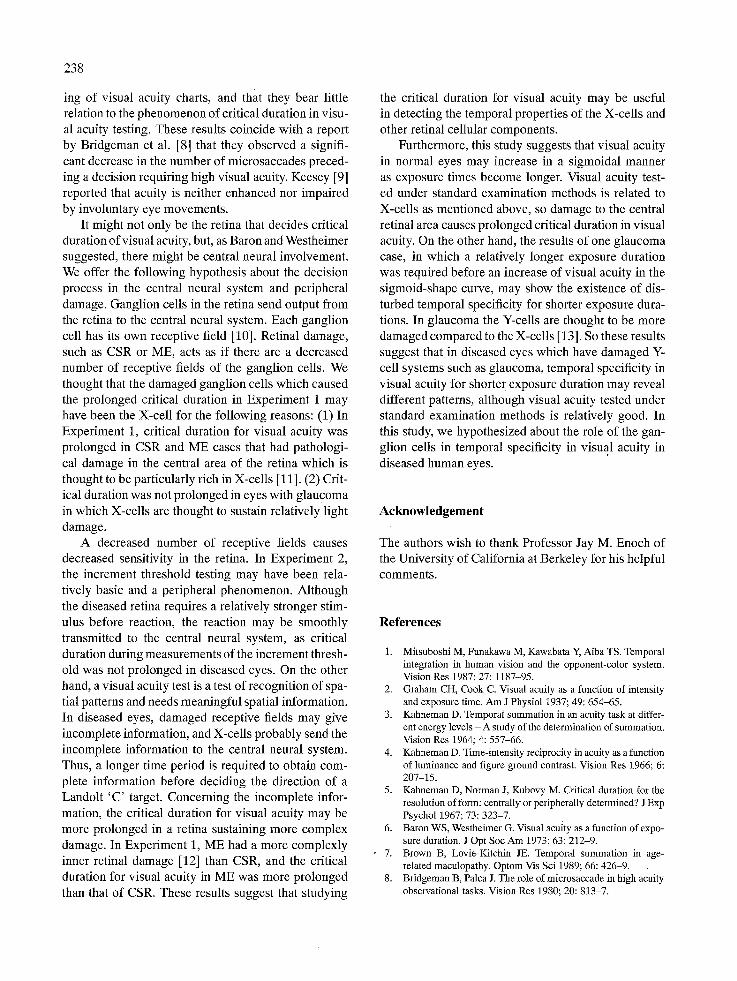
Figure 18. Amplitude of microsaccades in four eyes with ME. The broken lines show the results of seven normal eyes. In all cases, the average amplitude of microsaccades was smaller while the acuity chart was ON in acuity testing. During simple fixation, three cases showed the same results in which the amplitude was smaller while the fixing target was ON. These results were also within the normal range. (o:p < 0.005, t-test)
In Experiment 1, we examined critical duration during visual acuity testing using a method adaptable to the ophthalmic clinic. The critical duration for visual acuity of the CSR and ME groups were 1.78 s and 2.69 s, respectively. These values were significantly (p < 0.01) longer than that obtained in the normal control group (0.62 s). The critical duration for visual acuity of the glaucoma group was 0.42 s. The difference between the glaucoma and control groups was not statistically significant.
In Experiment 2, the critical duration in incre- ment threshold testing was measured. As a result, no significant differences were found in critical dura- tion between diseased eyes (the CSR and ME groups) and the normal control eyes, although the increment thresholds were significantly higher in the diseased eye groups. Results were similar to those of Brown et al. [7] who examined critical duration in age-related mac- ulopathy. This suggests that the mechanism defining critical duration during visual acuity testing is differ- ent from that in increment threshold testing.
Experiment 2 also showed decreased sensitivity of the retina in the CSR and ME cases. The significantly prolonged critical duration found in Experiment i can- not be explained only be decreased retinal sensitivity.
Experiment 3 was performed to investigate the role of fixation movements during visual acuity testing. In normal eyes the frequency and amplitude of microsac- cades were smaller while the acuity chart was shown than when it was not shown. This phenomenon was also observed in eyes with macular edema. These results suggest that microsaccades play little role in the read-
238
ing of visual acuity charts, and that they bear little relation to the phenomenon of critical duration in visu- al acuity testing. These results coincide with a report by Bridgeman et al. [8] that they observed a signifi- cant decrease in the number of microsaccades preced- ing a decision requiring high visual acuity. Keesey [9] reported that acuity is neither enhanced nor impaired by involuntary eye movements.
It might not only be the retina that decides critical duration of visual acuity, but, as Baron and Westheimer suggested, there might be central neural involvement. We offer the following hypothesis about the decision process in the central neural system and peripheral damage. Ganglion cells in the retina send output from the retina to the central neural system. Each ganglion cell has its own receptive field [10]. Retinal damage, such as CSR or ME, acts as if there are a decreased number of receptive fields of the ganglion cells. We thought that the damaged ganglion cells which caused the prolonged critical duration in Experiment 1 may have been the X-cell for the following reasons: (1) In Experiment 1, critical duration for visual acuity was prolonged in CSR and ME cases that had pathologi- cal damage in the central area of the retina which is thought to be particularly rich in X-cells [11]. (2) Crit- ical duration was not prolonged in eyes with glaucoma in which X-cells are thought to sustain relatively light damage.
A decreased number of receptive fields causes decreased sensitivity in the retina. In Experiment 2, the increment threshold testing may have been rela- tively basic and a peripheral phenomenon. Although the diseased retina requires a relatively stronger stim- ulus before reaction, the reaction may be smoothly transmitted to the central neural system, as critical duration during measurements of the increment thresh- old was not prolonged in diseased eyes. On the other hand, a visual acuity test is a test of recognition of spa- tial patterns and needs meaningful spatial information. In diseased eyes, damaged receptive fields may give incomplete information, and X-cells probably send the incomplete information to the central neural system. Thus, a longer time period is required to obtain com- plete information before deciding the direction of a Landolt 'C ' target. Concerning the incomplete infor- mation, the critical duration for visual acuity may be more prolonged in a retina sustaining more complex damage. In Experiment 1, ME had a more complexly inner retinal damage [12] than CSR, and the critical duration for visual acuity in ME was more prolonged than that of CSR. These results suggest that studying
the critical duration for visual acuity may be useful in detecting the temporal properties of the X-cells and other retinal cellular components.
Furthermore, this study suggests that visual acuity in normal eyes may increase in a sigmoidal manner as exposure times become longer. Visual acuity test- ed under standard examination methods is related to X-cells as mentioned above, so damage to the central retinal area causes prolonged critical duration in visual acuity. On the other hand, the results of one glaucoma case, in which a relatively longer exposure duration was required before an increase of visual acuity in the sigmoid-shape curve, may show the existence of dis- turbed temporal specificity for shorter exposure dura- tions. In glaucoma the Y-cells are thought to be more damaged compared to the X-cells [13]. So these results suggest that in diseased eyes which have damaged Y- cell systems such as glaucoma, temporal specificity in visual acuity for shorter exposure duration may reveal different patterns, although visual acuity tested under standard examination methods is relatively good. In this study, we hypothesized about the role of the gan- glion cells in temporal specificity in visual acuity in diseased human eyes.
Acknowledgement
The authors wish to thank Professor Jay M. Enoch of the University of California at Berkeley for his helpful comments.
References
1. Mitsuboshi M, Funakawa M, Kawabata Y, Aiba TS. Temporal integration in human vision and the opponent-color system. Vision Res 1987; 27: 1187-95.
2. Graham CH, Cook C. Visual acuity as a function of intensity and exposure time. Am J Physiol 1937; 49: 654--65.
3. Kahneman D. Temporal summation in an acuity task at differ- ent energy levels - A study of the determination of summation. Vision Res 1964; 4: 55%66.
4. Kahneman D. Time-intensity reciprocity in acuity as a function of luminance and figure ground contrast. Vision Res 1966; 6: 207-15.
5. Kahneman D, Norman J, Kubovy M. Critical duration for the resolution of form: centrally or peripherally determined? J Exp Psychol 1967; 73: 323-7.
6. Baron WS, Westheimer G. Visual acuity as a function of expo- sure duration. J Opt Soc Am 1973; 63: 212-9.
�9 7. Brown B, Lovie-Kitchin JE. Temporal summation in age- related maculopathy. Optom Vis Sci 1989; 66: 426-9.
8. Bridgeman B, Palca J. The role of microsaccade in high acuity observational tasks. Vision Res 1980; 20: 813-7.

9. Keesey UT. Effects of involuntary eye movements on visual acuity. J Opt Soc Am 1960; 50: 769-74.
10. Drasdo N. The neural representation of visual space. Nature 1977; 266: 554-6.
11. Inui T, Kani K, Miyake S. Estimation 0f the receptive field density of X cells in the human retina and visual acuity. Neuro- Ophthalmol Jpn 1989; 6: 391-5.
12. Yanoff M, Fine BS, Brucker AJ, Eagle JR. RC. Pathology of human cystoid macular edema. Surv Ophthalmol 1984; 28: 505-11.
239
13. Quigley HA et al. Chronic glaucoma selectively damages large optic nerve fiber. Invest Ophthalmol Vis Sci 1987; 28: 913-20.
Address for correspondence: S. Yamade, Department of Ophthal- mology, Shiga University of Medical Science, Seta, Ohtsu, Shiga, 520-21, Japan