Embed Size (px)
Citation preview
REPORT NO. 875
Tensile Testing of Metals
Proficiency Testing Program
Round 6
August 2014
ACKNOWLEDGMENTS
PTA wishes to gratefully acknowledge the technical assistance provided for this program by Mr K Bazley, BlueScope Steel Limited, Port Kembla. PTA also wishes to thank Mr W Robinson and Mr G Pownall, ARL Laboratory Services Pty Ltd, for the supply and homogeneity testing of the samples.
© COPYRIGHT PROFICIENCY TESTING AUSTRALIA 2014
PO Box 7507 Silverwater NSW 2128 AUSTRALIA
CONTENTS
1. FOREWORD 1
2. FEATURES OF THE PROGRAM 1
3. FORMAT OF THE APPENDICES 2
4. DESIGN OF THE PROGRAM 2
5. OUTLIER RESULTS 2
Table A: Summary Statistics for All Tests 3
Table B: Summary of Statistical Outliers 4
6. PTA AND TECHNICAL ADVISER'S COMMENTS 4
7. REFERENCES 9 APPENDICES
APPENDIX A
Summary of Results
Thickness A1.1
Upper Yield A2.1
Lower Yield A3.1
0.2% Proof Stress A4.1
Tensile Strength A5.1
Percentage Elongation after Fracture A6.1
Method Information and Other Reported Results A7.1
APPENDIX B
Homogeneity Testing B1.1
APPENDIX C
Instructions to Participants C1.1
Results Sheet C2.1
-1-
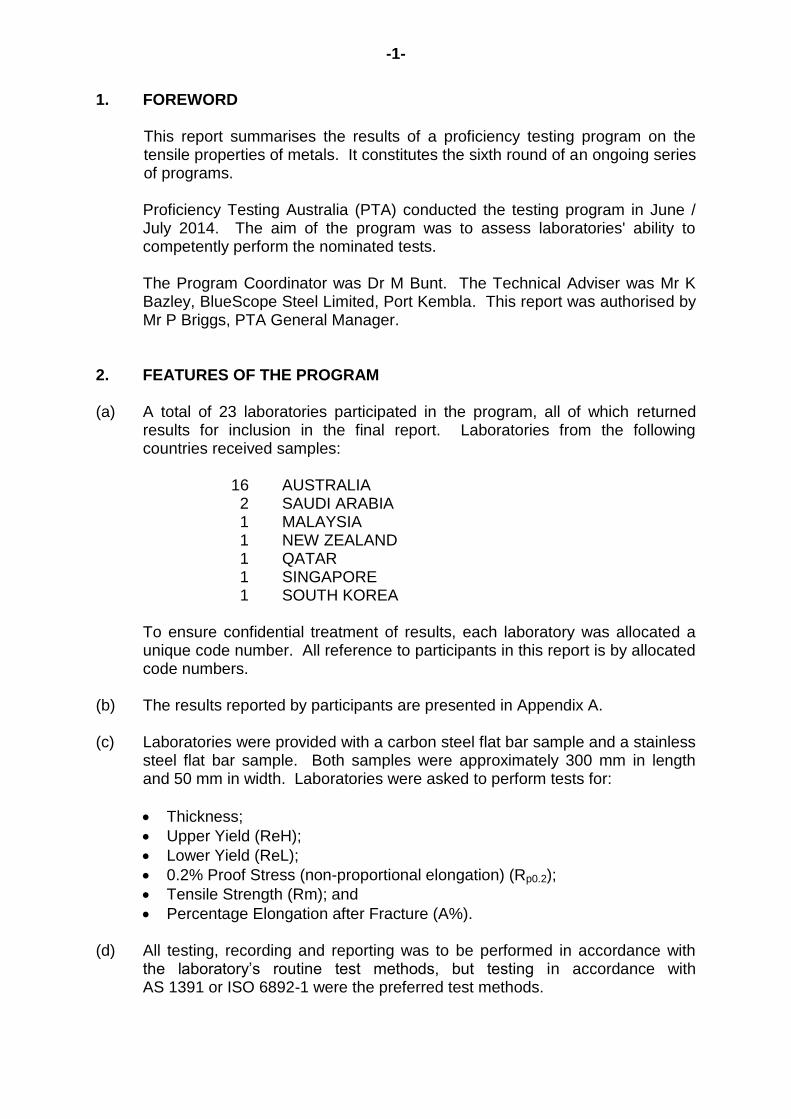
1. FOREWORD This report summarises the results of a proficiency testing program on the
tensile properties of metals. It constitutes the sixth round of an ongoing series of programs.
Proficiency Testing Australia (PTA) conducted the testing program in June /
July 2014. The aim of the program was to assess laboratories' ability to competently perform the nominated tests.
The Program Coordinator was Dr M Bunt. The Technical Adviser was Mr K
Bazley, BlueScope Steel Limited, Port Kembla. This report was authorised by Mr P Briggs, PTA General Manager.
2. FEATURES OF THE PROGRAM (a) A total of 23 laboratories participated in the program, all of which returned
results for inclusion in the final report. Laboratories from the following countries received samples:
16 AUSTRALIA 2 SAUDI ARABIA 1 MALAYSIA 1 NEW ZEALAND 1 QATAR 1 SINGAPORE 1 SOUTH KOREA
To ensure confidential treatment of results, each laboratory was allocated a unique code number. All reference to participants in this report is by allocated code numbers.
(b) The results reported by participants are presented in Appendix A.
(c) Laboratories were provided with a carbon steel flat bar sample and a stainless steel flat bar sample. Both samples were approximately 300 mm in length and 50 mm in width. Laboratories were asked to perform tests for:
Thickness;
Upper Yield (ReH);
Lower Yield (ReL);
0.2% Proof Stress (non-proportional elongation) (Rp0.2);
Tensile Strength (Rm); and
Percentage Elongation after Fracture (A%).
(d) All testing, recording and reporting was to be performed in accordance with the laboratory’s routine test methods, but testing in accordance with AS 1391 or ISO 6892-1 were the preferred test methods.
-2-
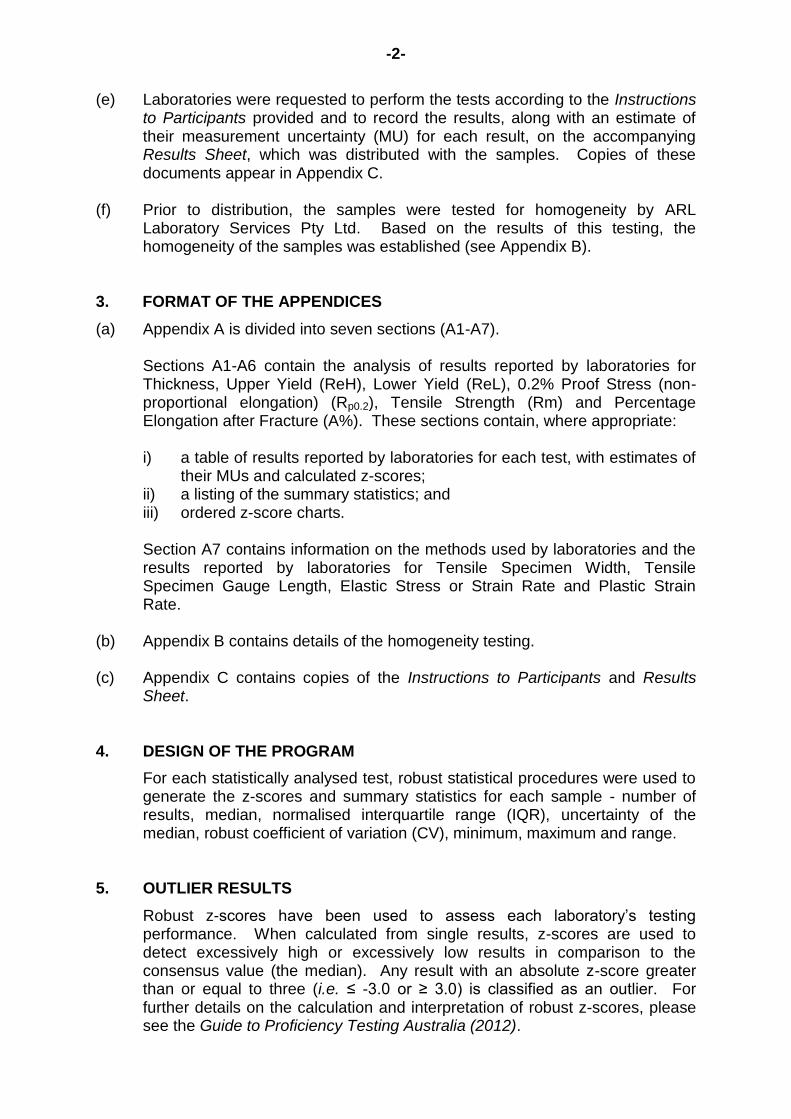
(e) Laboratories were requested to perform the tests according to the Instructions to Participants provided and to record the results, along with an estimate of their measurement uncertainty (MU) for each result, on the accompanying Results Sheet, which was distributed with the samples. Copies of these documents appear in Appendix C.
(f) Prior to distribution, the samples were tested for homogeneity by ARL
Laboratory Services Pty Ltd. Based on the results of this testing, the homogeneity of the samples was established (see Appendix B).
3. FORMAT OF THE APPENDICES (a) Appendix A is divided into seven sections (A1-A7).
Sections A1-A6 contain the analysis of results reported by laboratories for Thickness, Upper Yield (ReH), Lower Yield (ReL), 0.2% Proof Stress (non-proportional elongation) (Rp0.2), Tensile Strength (Rm) and Percentage Elongation after Fracture (A%). These sections contain, where appropriate: i) a table of results reported by laboratories for each test, with estimates of
their MUs and calculated z-scores; ii) a listing of the summary statistics; and iii) ordered z-score charts.
Section A7 contains information on the methods used by laboratories and the results reported by laboratories for Tensile Specimen Width, Tensile Specimen Gauge Length, Elastic Stress or Strain Rate and Plastic Strain Rate.
(b) Appendix B contains details of the homogeneity testing. (c) Appendix C contains copies of the Instructions to Participants and Results
Sheet.
4. DESIGN OF THE PROGRAM
For each statistically analysed test, robust statistical procedures were used to generate the z-scores and summary statistics for each sample - number of results, median, normalised interquartile range (IQR), uncertainty of the median, robust coefficient of variation (CV), minimum, maximum and range.
5. OUTLIER RESULTS
Robust z-scores have been used to assess each laboratory’s testing performance. When calculated from single results, z-scores are used to detect excessively high or excessively low results in comparison to the consensus value (the median). Any result with an absolute z-score greater than or equal to three (i.e. ≤ -3.0 or ≥ 3.0) is classified as an outlier. For further details on the calculation and interpretation of robust z-scores, please see the Guide to Proficiency Testing Australia (2012).
-3-
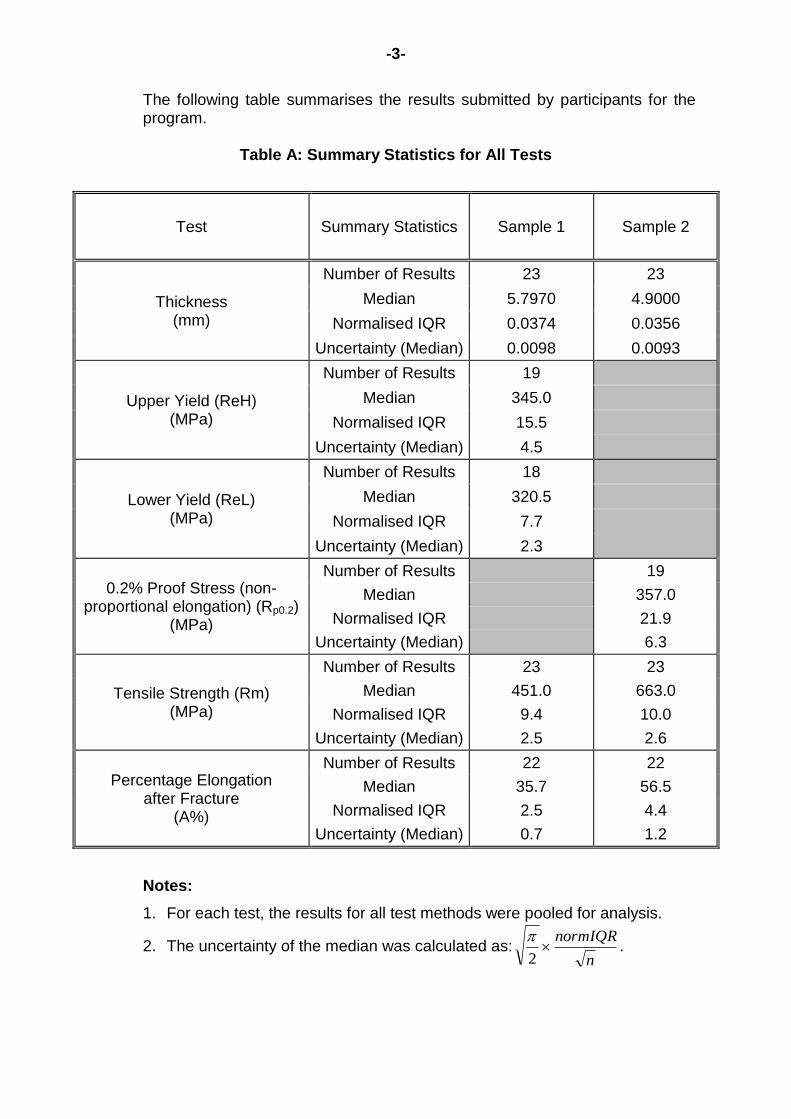
The following table summarises the results submitted by participants for the program.
Table A: Summary Statistics for All Tests
Test Summary Statistics Sample 1 Sample 2
Thickness (mm)
Number of Results 23 23
Median 5.7970 4.9000
Normalised IQR 0.0374 0.0356
Uncertainty (Median) 0.0098 0.0093
Upper Yield (ReH) (MPa)
Number of Results 19
Median 345.0
Normalised IQR 15.5
Uncertainty (Median) 4.5
Lower Yield (ReL) (MPa)
Number of Results 18
Median 320.5
Normalised IQR 7.7
Uncertainty (Median) 2.3
0.2% Proof Stress (non-proportional elongation) (Rp0.2)
(MPa)
Number of Results 19
Median 357.0
Normalised IQR 21.9
Uncertainty (Median) 6.3
Tensile Strength (Rm) (MPa)
Number of Results 23 23
Median 451.0 663.0
Normalised IQR 9.4 10.0
Uncertainty (Median) 2.5 2.6
Percentage Elongation after Fracture
(A%)
Number of Results 22 22
Median 35.7 56.5
Normalised IQR 2.5 4.4
Uncertainty (Median) 0.7 1.2
Notes: 1. For each test, the results for all test methods were pooled for analysis.
2. The uncertainty of the median was calculated as:n
normIQR
2
.
-4-
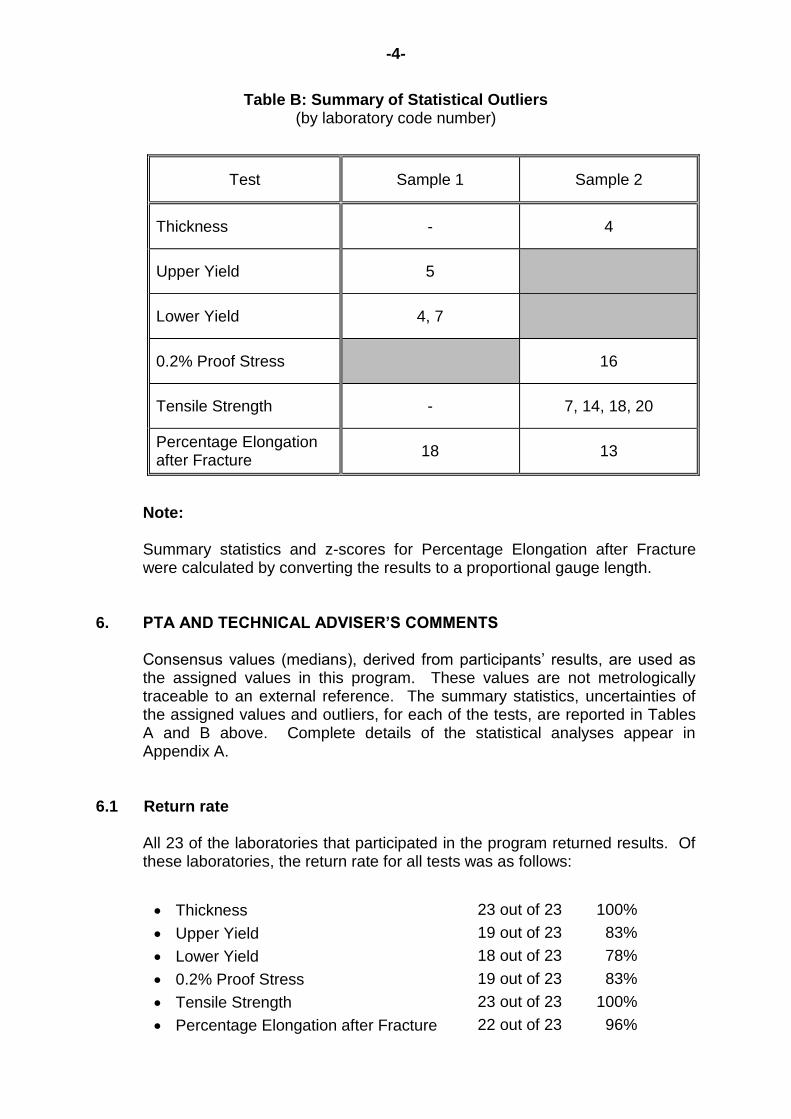
Table B: Summary of Statistical Outliers (by laboratory code number)
Test Sample 1 Sample 2
Thickness - 4
Upper Yield 5
Lower Yield 4, 7
0.2% Proof Stress 16
Tensile Strength - 7, 14, 18, 20
Percentage Elongation after Fracture
18 13
Note: Summary statistics and z-scores for Percentage Elongation after Fracture were calculated by converting the results to a proportional gauge length.
6. PTA AND TECHNICAL ADVISER’S COMMENTS
Consensus values (medians), derived from participants’ results, are used as the assigned values in this program. These values are not metrologically traceable to an external reference. The summary statistics, uncertainties of the assigned values and outliers, for each of the tests, are reported in Tables A and B above. Complete details of the statistical analyses appear in Appendix A.
6.1 Return rate
All 23 of the laboratories that participated in the program returned results. Of these laboratories, the return rate for all tests was as follows:
Thickness 23 out of 23 100%
Upper Yield 19 out of 23 83%
Lower Yield 18 out of 23 78%
0.2% Proof Stress 19 out of 23 83%
Tensile Strength 23 out of 23 100%
Percentage Elongation after Fracture 22 out of 23 96%
-5-
6.2 Performance summary
One or more statistical outliers were reported by eight laboratories (35%) for this round of the Tensile Testing of Metals program. For comparison, 28% of the participants reported outlier results in Round 5 of the Tensile Testing of Metals program (see Report No. 823 for more details). A total of 192 results were analysed in this round of the program. Of these results, eleven (6%) were outliers. For comparison, 10% of the results analysed in Round 5 of the Tensile Testing of Metals program were outliers (see Report No. 823 for more details).
6.3 Thickness
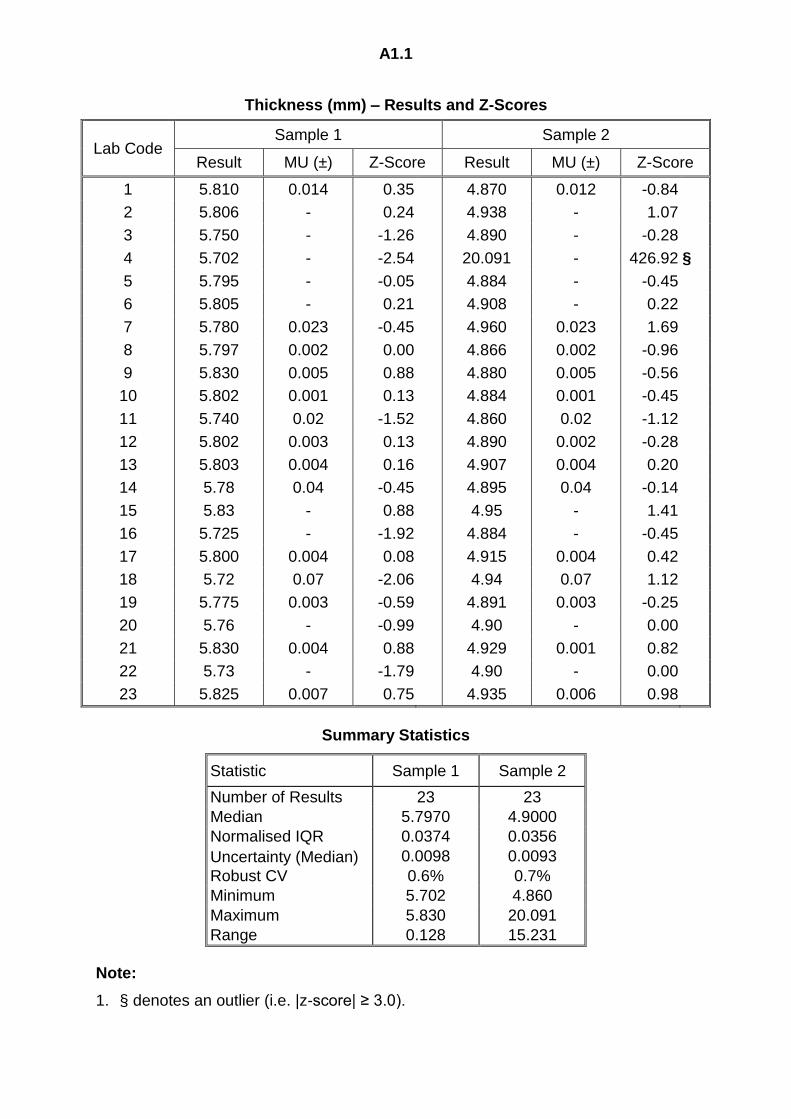
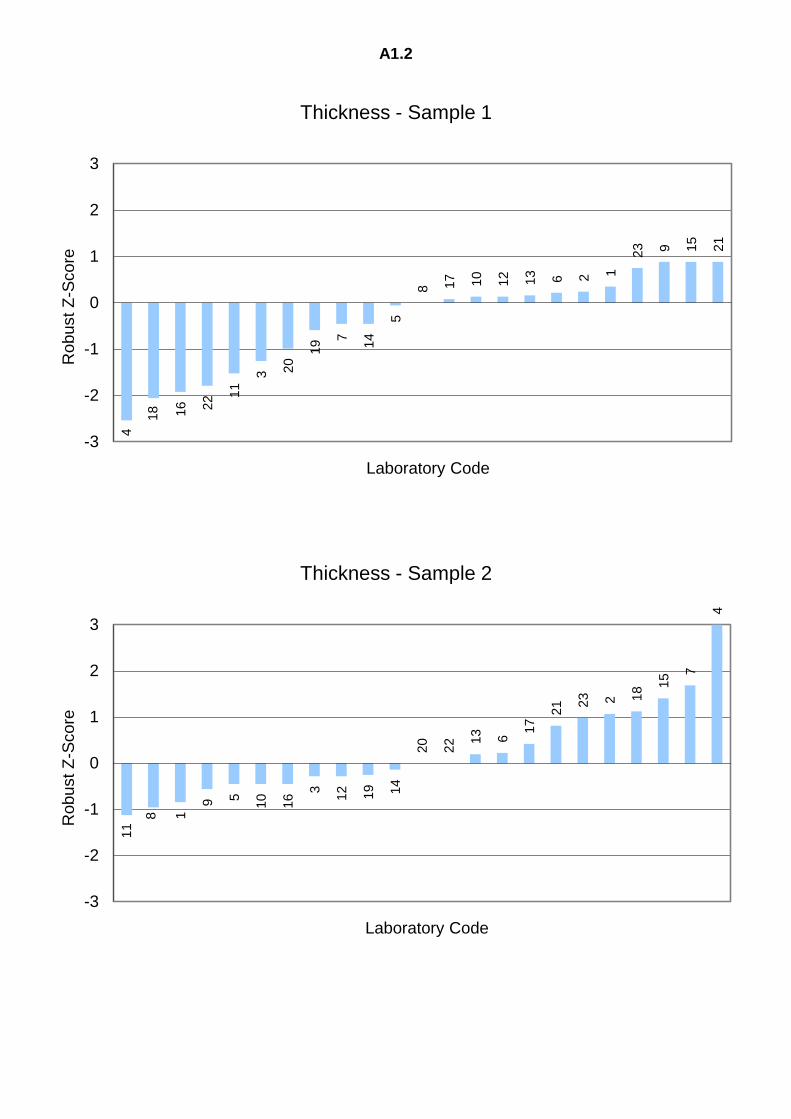
Of the 23 laboratories that tested the samples for Thickness, nine laboratories tested using AS 1391, three laboratories tested using ISO 6892-1, one laboratory used both AS 1391 and ISO 6892-1, one laboratory used the ASTM A370 method and one laboratory recorded that they used a micrometer. Eight laboratories did not specify the method that they used for testing (see Appendix A7 for more details). The methods were pooled when analysing the results for both samples. One laboratory (code 4) reported an outlier for sample 2. This laboratory appears to have reported the Tensile Specimen Width, instead of the Thickness, for sample 2. There were no outliers reported for sample 1. The robust CVs for the Thickness results were 0.6% and 0.7% for sample 1 and sample 2, respectively. The last round of this program where the participants were asked to record Thickness results was Round 3. The robust CVs of 0.6%, 1.3%, 0.3% and 0.2% for the Thickness results for Round 3 of this program compare well with the values obtained this round (see Report No. 718). Fourteen laboratories reported measurement uncertainties associated with their Thickness test results in this round.
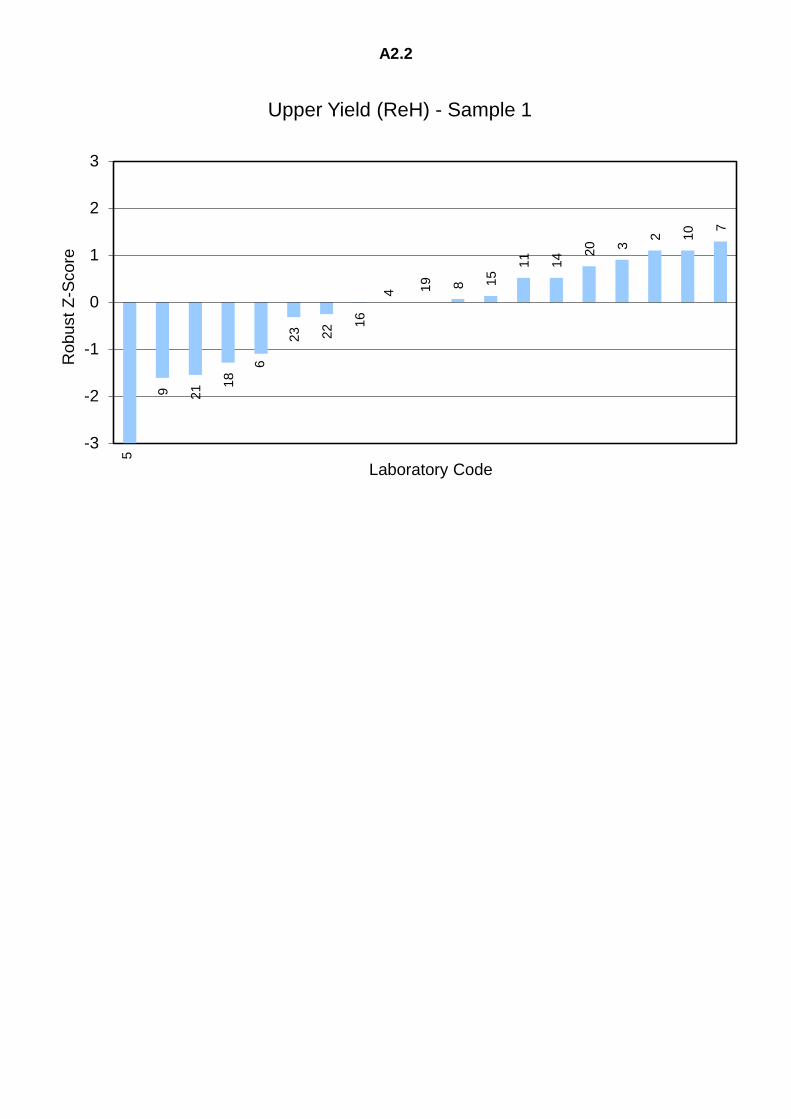
6.4 Upper Yield
A total of 19 laboratories tested the samples for Upper Yield. Of these laboratories, six tested using the AS 1391 method. Four laboratories tested using the ISO 6892-1 method. One laboratory used both AS 1391 and ISO 6892-1. One laboratory used the KS B 0802 method. Seven laboratories did not specify the method that they used for testing (see Appendix A7 for more details).
-6-
The methods were pooled when analysing the results. One laboratory (code 5) reported an outlier. Upper Yield measurements are very sensitive to sample preparation, alignment of the specimen in the tensile machine, straining rate and machine stiffness. It is therefore pleasing to see that only one laboratory reported an outlier for Upper Yield strength. The robust CV for the Upper Yield results was 4.5%. The last round of this program where the participants were asked to record Upper Yield results was Round 3. The robust CVs of 4.6% and 4.9% for the Upper Yield results for Round 3 of this program compare well with the value obtained this round (see Report No. 718). Ten laboratories reported measurement uncertainties associated with their Upper Yield test results in this round.
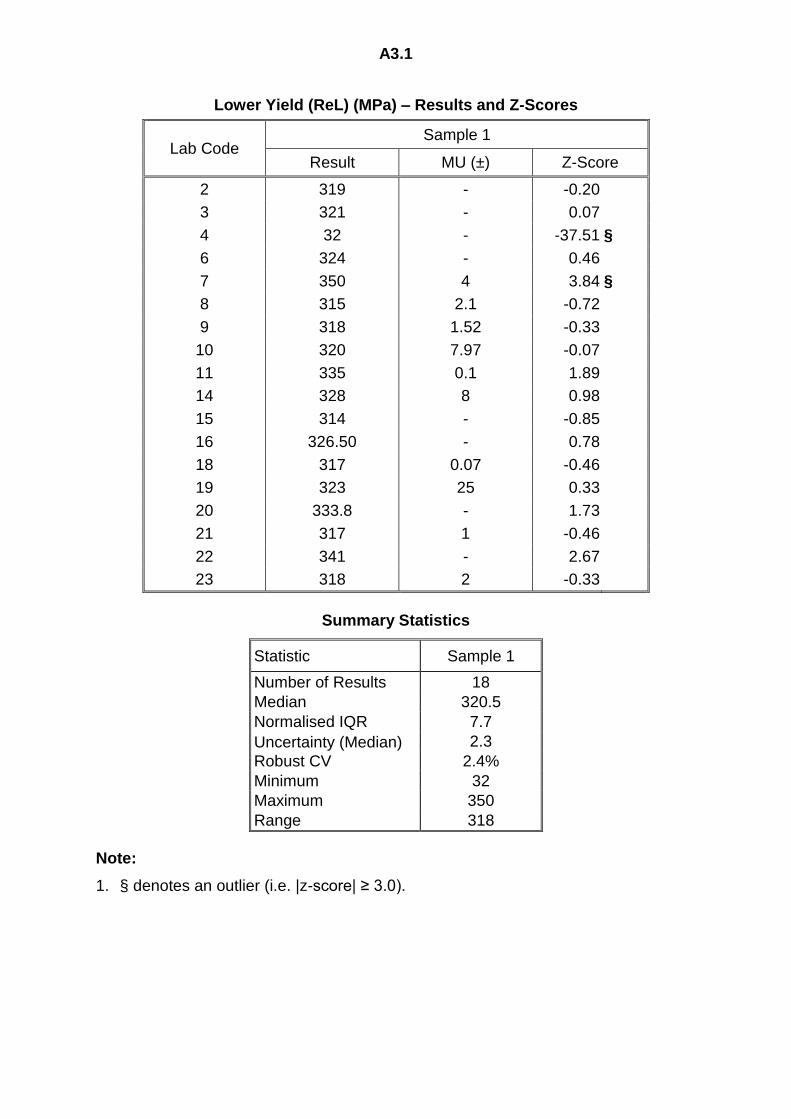
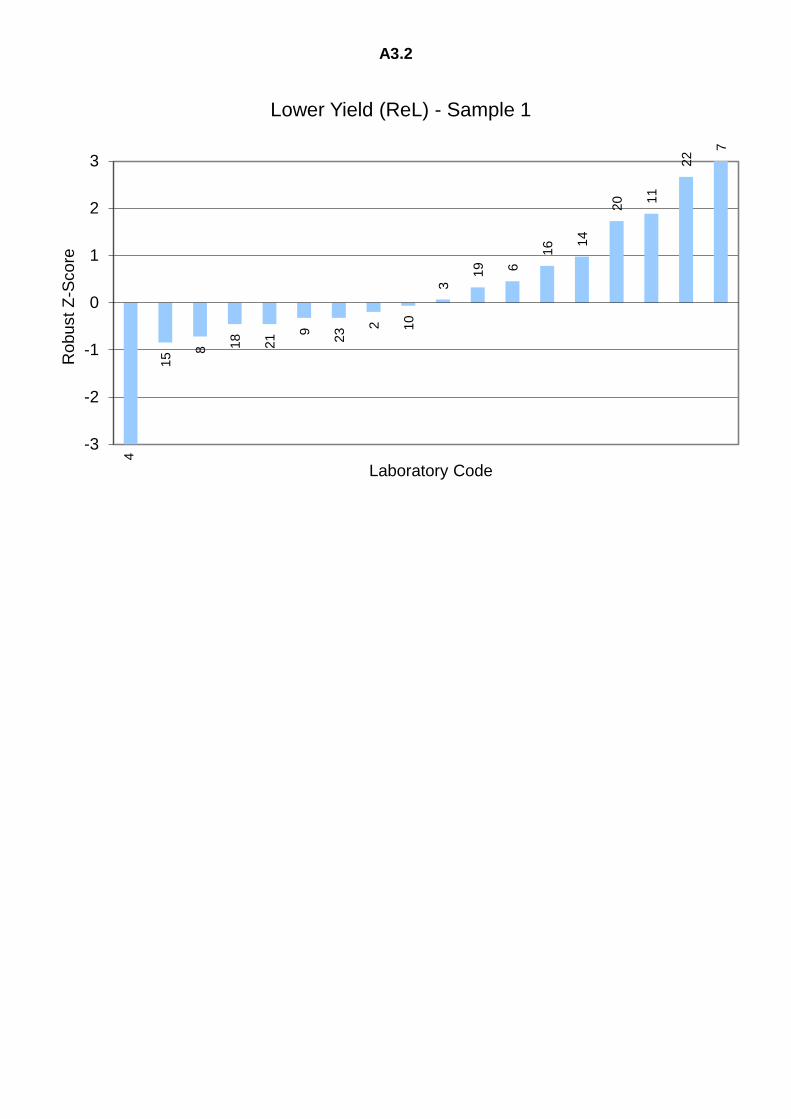
6.5 Lower Yield
Of the 18 laboratories that tested the samples for Lower Yield, six laboratories tested using AS 1391, four laboratories tested using ISO 6892-1, one laboratory used both AS 1391 and ISO 6892-1 and one laboratory used the KS B 0802 method. Six laboratories did not specify the method that they used for testing (see Appendix A7 for more details). The methods were pooled when analysing the results. Two laboratories (codes 4 and 7) reported outliers. The robust CV for the Lower Yield results was 2.4%. The last round of this program where the participants were asked to record Lower Yield results was Round 3. The robust CVs of 1.8% and 2.0% for the Lower Yield results for Round 3 of this program compare well with the value obtained this round (see Report No. 718). The spread in the reported Lower Yield results was smaller than it was for the Upper Yield results. This was to be expected, as Lower Yield strength is less sensitive to the conditions that affect the measurement of the Upper Yield strength. Ten laboratories reported measurement uncertainties associated with their Lower Yield test results in this round.
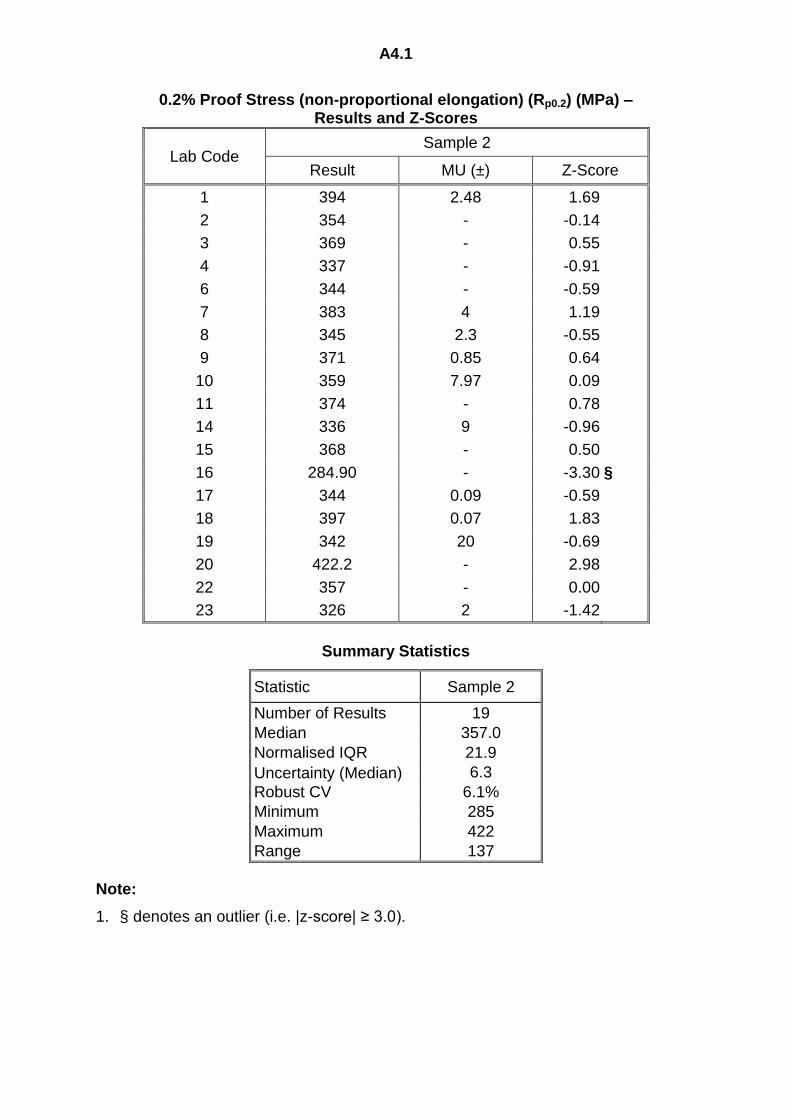
6.6 0.2% Proof Stress
Of the 19 laboratories that tested the samples for 0.2% Proof Stress, seven laboratories tested using AS 1391, four laboratories tested using ISO 6892-1 and one laboratory used both AS 1391 and ISO 6892-1. Seven laboratories did not specify the method that they used for testing (see Appendix A7 for more details).
-7-
The methods were pooled when analysing the results. One laboratory (code 16) reported an outlier. The robust CV for the 0.2% Proof Stress results was 6.1%. The last round of this program where the participants were asked to record 0.2% Proof Stress results was Round 4. The robust CV of 5.5% for the 0.2% Proof Stress results for Round 4 of this program compares well with the value obtained this round (see Report No. 770). Ten laboratories reported measurement uncertainties associated with their 0.2% Proof Stress test results in this round.
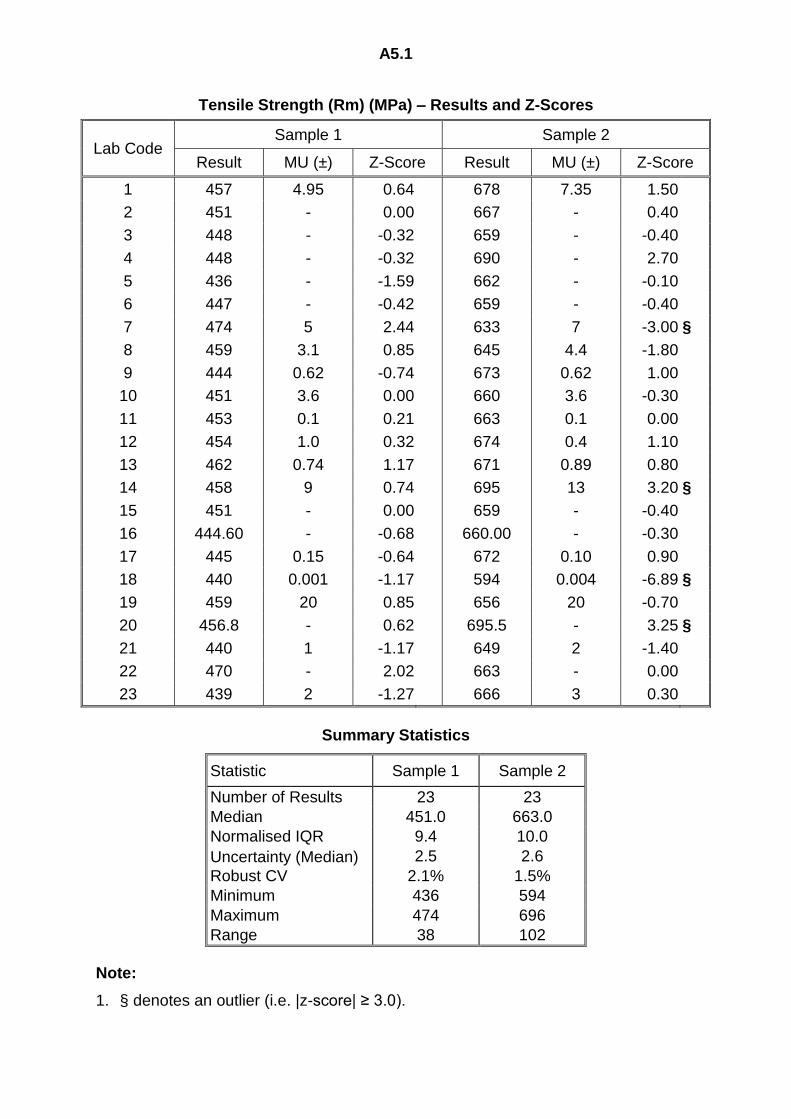
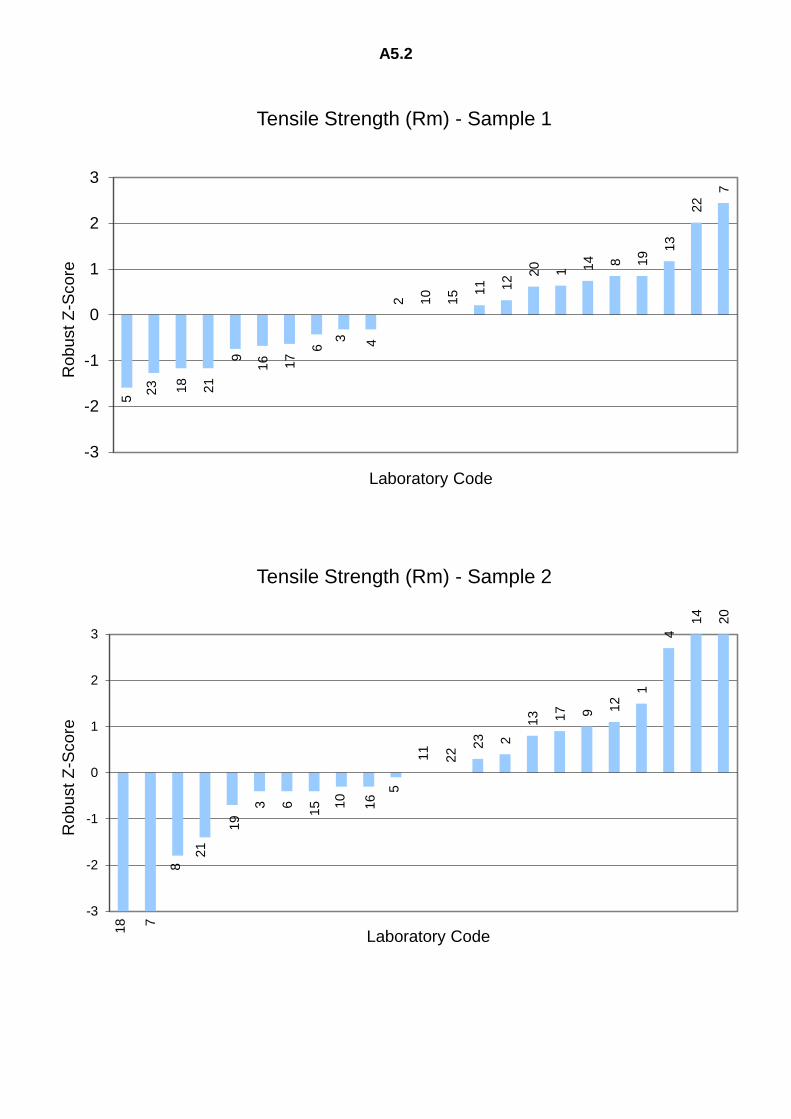
6.7 Tensile Strength
A total of 23 laboratories tested the samples for Tensile Strength. Of these laboratories, eight tested using the AS 1391 method. Four laboratories tested using the ISO 6892-1 method. One laboratory used both AS 1391 and ISO 6892-1. One laboratory used the ASTM A370 method and one laboratory used the KS B 0802 method. Eight laboratories did not specify the method that they used for testing (see Appendix A7 for more details). The methods were pooled when analysing the results for both samples. Four laboratories (codes 7, 14, 18 and 20) reported outliers for sample 2. There were no outliers reported for sample 1. All laboratories that have reported outliers should review their testing procedures and check their measurements, calculations and calibrations of their testing equipment. The robust CVs for the Tensile Strength results were 2.1% and 1.5% for sample 1 and sample 2, respectively. These values compare well with the values of 1.9% and 2.2%, obtained for the Tensile Strength results for Round 5 of this program (see Report No. 823). Fourteen laboratories reported measurement uncertainties associated with their Tensile Strength test results in this round.
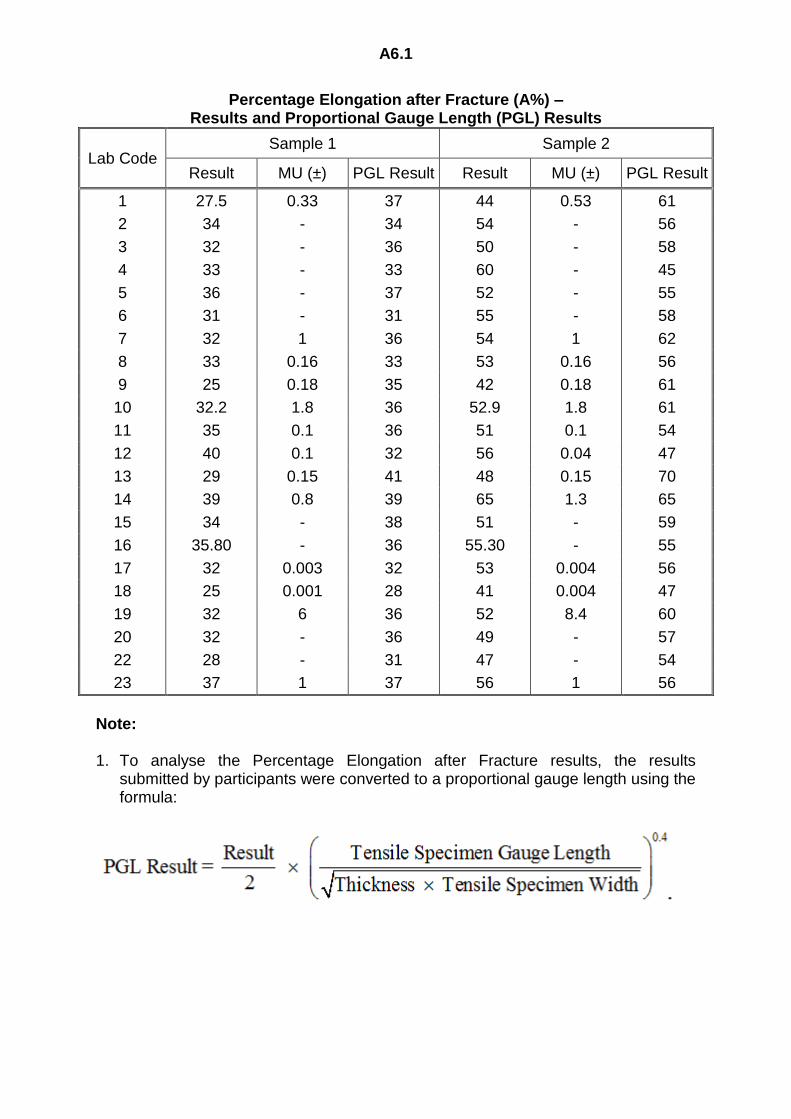
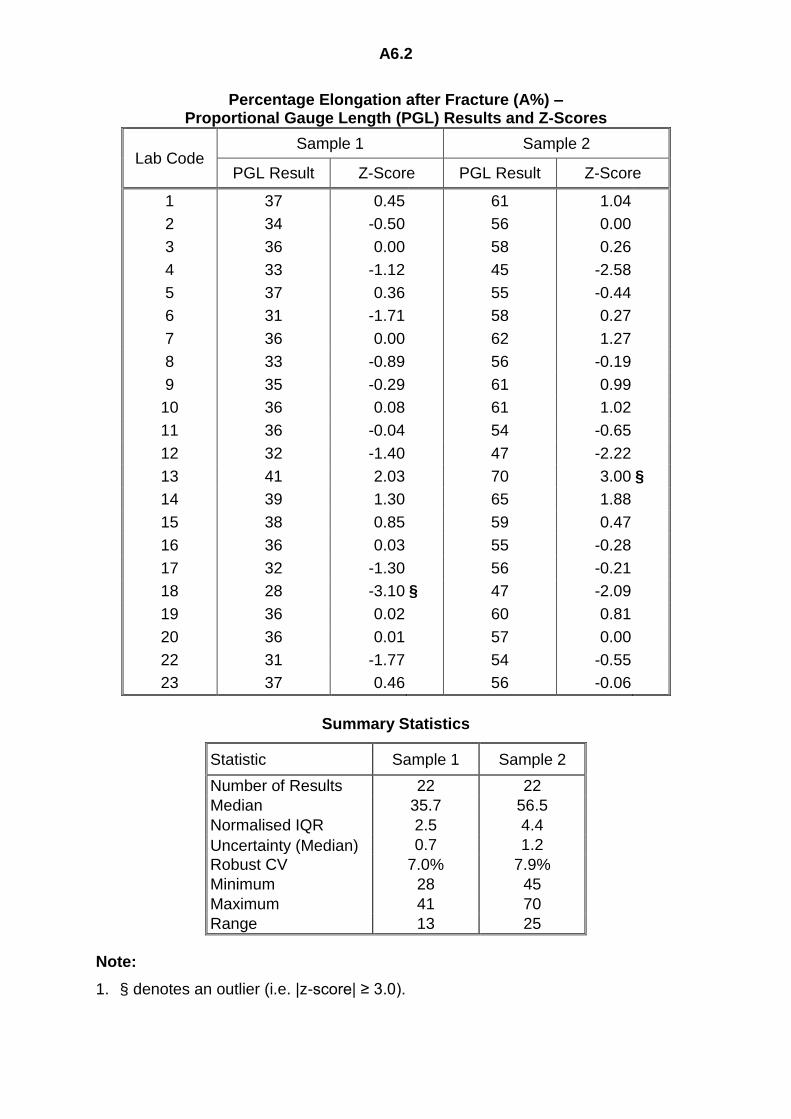
6.8 Percentage Elongation after Fracture
A total of 22 laboratories tested the samples for Percentage Elongation after Fracture. Of these laboratories, eight tested using the AS 1391 method. Four laboratories tested using the ISO 6892-1 method. One laboratory used both AS 1391 and ISO 6892-1. One laboratory used the ASTM A370 method. Eight laboratories did not specify the method that they used for testing (see Appendix A7 for more details).
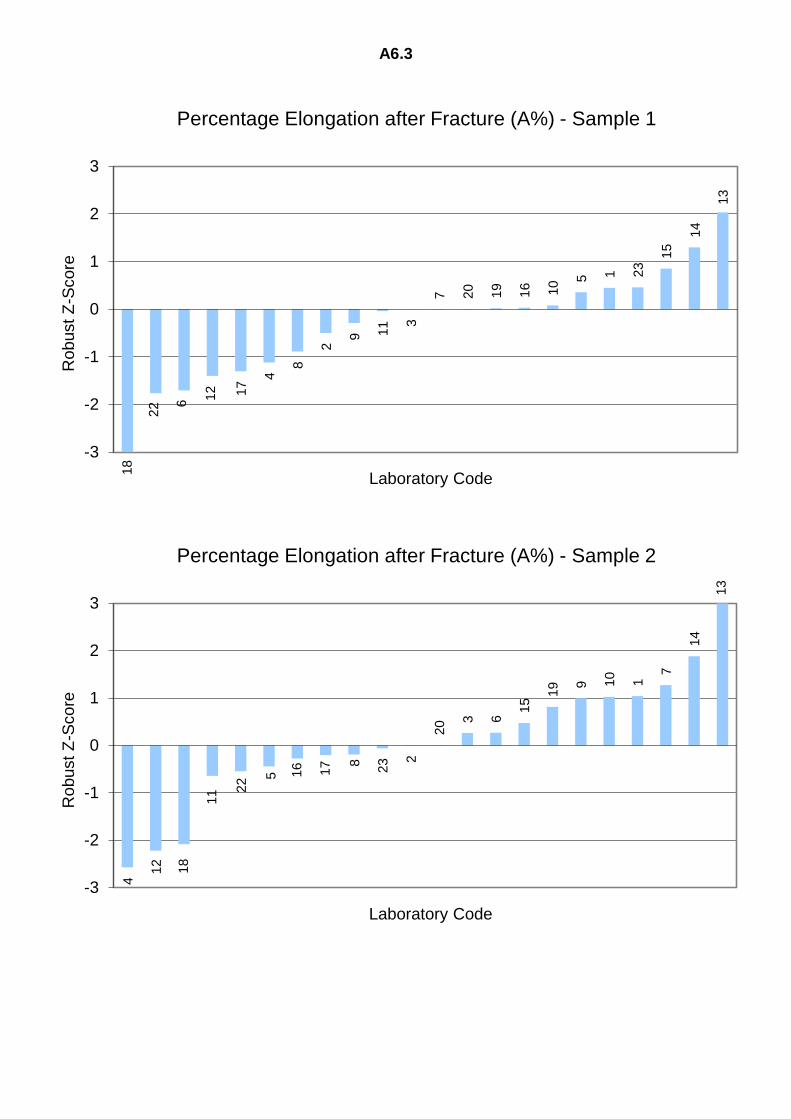
-8-
Because the participants employed different width specimens and different gauge lengths for their tensile testing in this program, it was necessary to convert the Percentage Elongation after Fracture results submitted by the participants to a proportional gauge length. The results, converted to a proportional gauge length, are displayed in Appendix A6, while the formula used to convert the results is given on page A6.1 of Appendix A6. The methods were pooled when analysing the results for both samples. One laboratory (code 18) reported an outlier for sample 1. One laboratory (code 13) reported an outlier for sample 2. The robust CVs for the Percentage Elongation after Fracture results were 7.0% and 7.9% for sample 1 and sample 2, respectively. These values are lower than the values of 8.4% and 11.6%, obtained for the Percentage Elongation after Fracture results for Round 5 of this program (see Report No. 823). Thirteen laboratories reported measurement uncertainties associated with their Percentage Elongation after Fracture test results in this round.
6.9 Measurement Uncertainty There still appears to be some confusion, regarding measurement uncertainty (MU), by the participants in this round of the program, as a number of laboratories have not reported any MU estimates for their results. An approach, such as that described in AS 1391 Appendix H, “An Error Budget”, to the estimation of the MU in tensile testing should be followed.
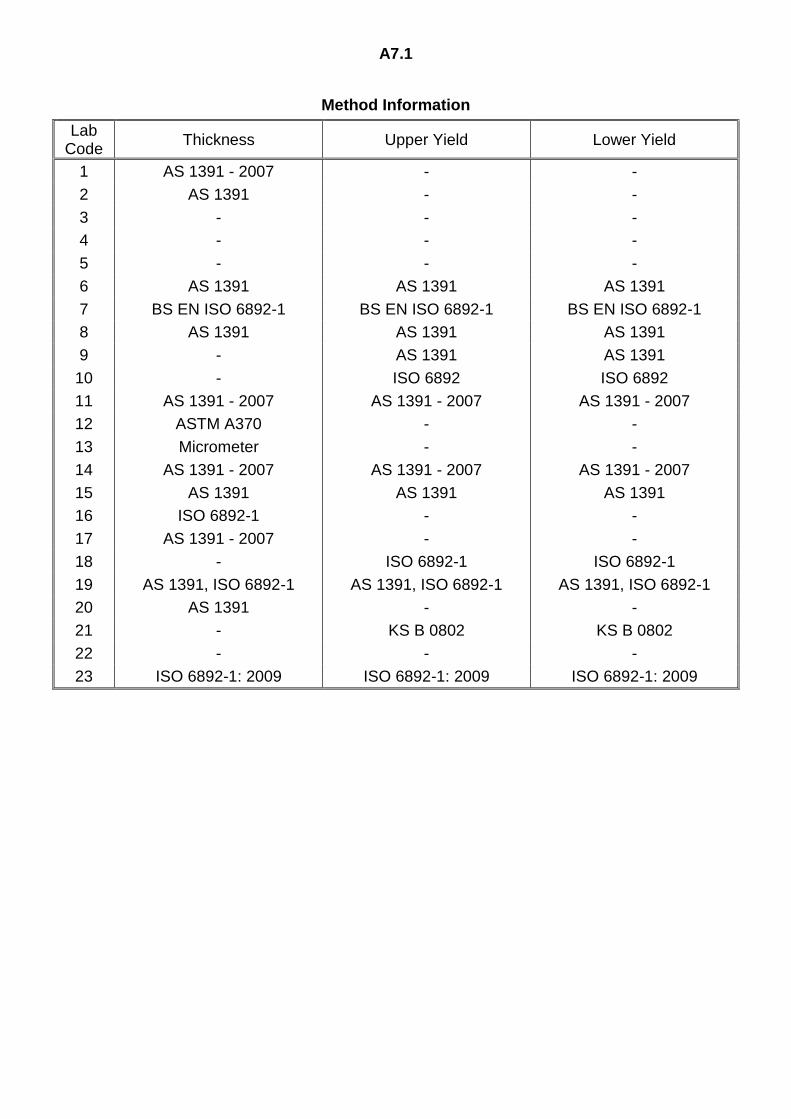
6.10 Other Reported Results
In addition to reporting results for Thickness, Upper Yield, Lower Yield, 0.2% Proof Stress, Tensile Strength and Percentage Elongation after Fracture, participants were also asked to report the Tensile Specimen Width, Tensile Specimen Gauge Length, Elastic Stress or Strain Rate and Plastic Strain Rate. The details reported by each of the participants are displayed in Appendix A7. The information reported is limited, but it was requested in the hope that it would assist in the analysis of the results, especially in converting the Percentage Elongation after Fracture results to a proportional gauge length. There was a large range in the stress and strain rates reported by the participants in this round of the program and many of these results were reported in unusual units. The range of test conditions and test pieces (allowed by the standards), along with test setups, will always allow for variation in the test results obtained.
-9-
7. REFERENCES
1. Guide to Proficiency Testing Australia (2012). (This document is located on the PTA website at www.pta.asn.au under Programs / Documents).
2. AS 1391 (2007) – Metallic materials – Tensile testing at ambient
temperature.
3. ISO 6892-1 (2009) – Metallic materials – Tensile testing – Part 1: Method of test at room temperature.
4. ASTM A370 – Standard Test Methods and Definitions for Mechanical Testing of Steel Products.
5. KS B 0802 (2003) – Method of tensile test for metallic materials.
APPENDIX A
Summary of Results
Section A1
Thickness
A1.1
Thickness (mm) – Results and Z-Scores
Lab Code Sample 1 Sample 2
Result MU (±) Z-Score Result MU (±) Z-Score
1 5.810 0.014 0.35 4.870 0.012 -0.84
2 5.806 - 0.24 4.938 - 1.07
3 5.750 - -1.26 4.890 - -0.28
4 5.702 - -2.54 20.091 - 426.92 §
5 5.795 - -0.05 4.884 - -0.45
6 5.805 - 0.21 4.908 - 0.22
7 5.780 0.023 -0.45 4.960 0.023 1.69
8 5.797 0.002 0.00 4.866 0.002 -0.96
9 5.830 0.005 0.88 4.880 0.005 -0.56
10 5.802 0.001 0.13 4.884 0.001 -0.45
11 5.740 0.02 -1.52 4.860 0.02 -1.12
12 5.802 0.003 0.13 4.890 0.002 -0.28
13 5.803 0.004 0.16 4.907 0.004 0.20
14 5.78 0.04 -0.45 4.895 0.04 -0.14
15 5.83 - 0.88 4.95 - 1.41
16 5.725 - -1.92 4.884 - -0.45
17 5.800 0.004 0.08 4.915 0.004 0.42
18 5.72 0.07 -2.06 4.94 0.07 1.12
19 5.775 0.003 -0.59 4.891 0.003 -0.25
20 5.76 - -0.99 4.90 - 0.00
21 5.830 0.004 0.88 4.929 0.001 0.82
22 5.73 - -1.79 4.90 - 0.00
23 5.825 0.007 0.75 4.935 0.006 0.98
Summary Statistics
Statistic Sample 1 Sample 2
Number of Results 23 23
Median 5.7970 4.9000
Normalised IQR 0.0374 0.0356
Uncertainty (Median) 0.0098 0.0093
Robust CV 0.6% 0.7%
Minimum 5.702 4.860
Maximum 5.830 20.091
Range 0.128 15.231
Note:
1. § denotes an outlier (i.e. |z-score| ≥ 3.0).
A1.2
4
18 16 22 1
1
3 20
19 7
14
5
8 17 10
12 13 6 2 1
23 9 15
21
-3
-2
-1
0
1
2
3
Robust
Z-S
core
Laboratory Code
Thickness - Sample 111
8 1
9 5
10
16
3
12 19 14
20
22 1
3 6
17
21 2
3 2 18 1
5 7
4
-3
-2
-1
0
1
2
3
Robust
Z-S
core
Laboratory Code
Thickness - Sample 2
Section A2
Upper Yield
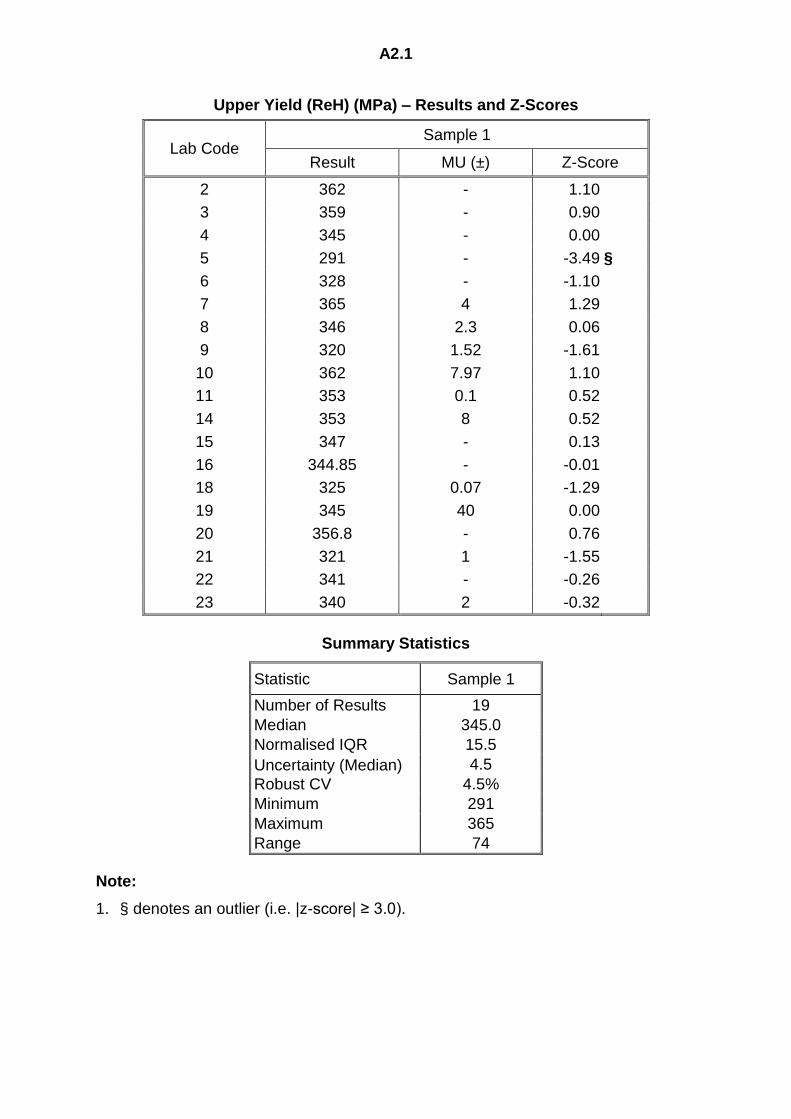
A2.1
Upper Yield (ReH) (MPa) – Results and Z-Scores
Lab Code Sample 1
Result MU (±) Z-Score
2 362 - 1.10
3 359 - 0.90
4 345 - 0.00
5 291 - -3.49 §
6 328 - -1.10
7 365 4 1.29
8 346 2.3 0.06
9 320 1.52 -1.61
10 362 7.97 1.10
11 353 0.1 0.52
14 353 8 0.52
15 347 - 0.13
16 344.85 - -0.01
18 325 0.07 -1.29
19 345 40 0.00
20 356.8 - 0.76
21 321 1 -1.55
22 341 - -0.26
23 340 2 -0.32
Summary Statistics
Statistic Sample 1
Number of Results 19
Median 345.0
Normalised IQR 15.5
Uncertainty (Median) 4.5
Robust CV 4.5%
Minimum 291
Maximum 365
Range 74
Note:
1. § denotes an outlier (i.e. |z-score| ≥ 3.0).
A2.2
5
9 21 1
8
6
23 22 1
6
4 19 8 15
11
14 2
0 3
2 10 7
-3
-2
-1
0
1
2
3
Robust
Z-S
core
Laboratory Code
Upper Yield (ReH) - Sample 1
Section A3
Lower Yield
A3.1
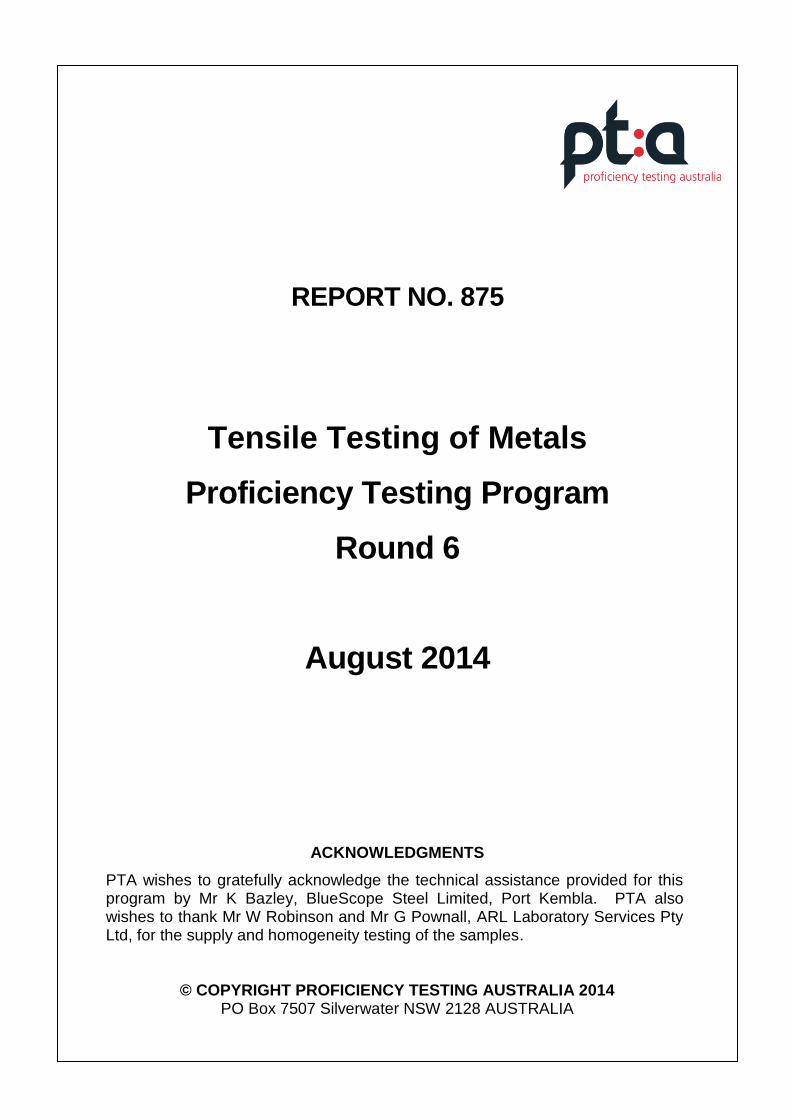
Lower Yield (ReL) (MPa) – Results and Z-Scores
Lab Code Sample 1
Result MU (±) Z-Score
2 319 - -0.20
3 321 - 0.07
4 32 - -37.51 §
6 324 - 0.46
7 350 4 3.84 §
8 315 2.1 -0.72
9 318 1.52 -0.33
10 320 7.97 -0.07
11 335 0.1 1.89
14 328 8 0.98
15 314 - -0.85
16 326.50 - 0.78
18 317 0.07 -0.46
19 323 25 0.33
20 333.8 - 1.73
21 317 1 -0.46
22 341 - 2.67
23 318 2 -0.33
Summary Statistics
Statistic Sample 1
Number of Results 18
Median 320.5
Normalised IQR 7.7
Uncertainty (Median) 2.3
Robust CV 2.4%
Minimum 32
Maximum 350
Range 318
Note:
1. § denotes an outlier (i.e. |z-score| ≥ 3.0).
A3.2
4
15 8 1
8
21 9
23 2 1
0
3
19 6
16 1
4
20 11
22
7
-3
-2
-1
0
1
2
3
Ro
bust
Z-S
co
re
Laboratory Code
Lower Yield (ReL) - Sample 1
Section A4
0.2% Proof Stress
A4.1
0.2% Proof Stress (non-proportional elongation) (Rp0.2) (MPa) –Results and Z-Scores
Lab Code Sample 2
Result MU (±) Z-Score
1 394 2.48 1.69
2 354 - -0.14
3 369 - 0.55
4 337 - -0.91
6 344 - -0.59
7 383 4 1.19
8 345 2.3 -0.55
9 371 0.85 0.64
10 359 7.97 0.09
11 374 - 0.78
14 336 9 -0.96
15 368 - 0.50
16 284.90 - -3.30 §
17 344 0.09 -0.59
18 397 0.07 1.83
19 342 20 -0.69
20 422.2 - 2.98
22 357 - 0.00
23 326 2 -1.42
Summary Statistics
Statistic Sample 2
Number of Results 19
Median 357.0
Normalised IQR 21.9
Uncertainty (Median) 6.3
Robust CV 6.1%
Minimum 285
Maximum 422
Range 137
Note:
1. § denotes an outlier (i.e. |z-score| ≥ 3.0).
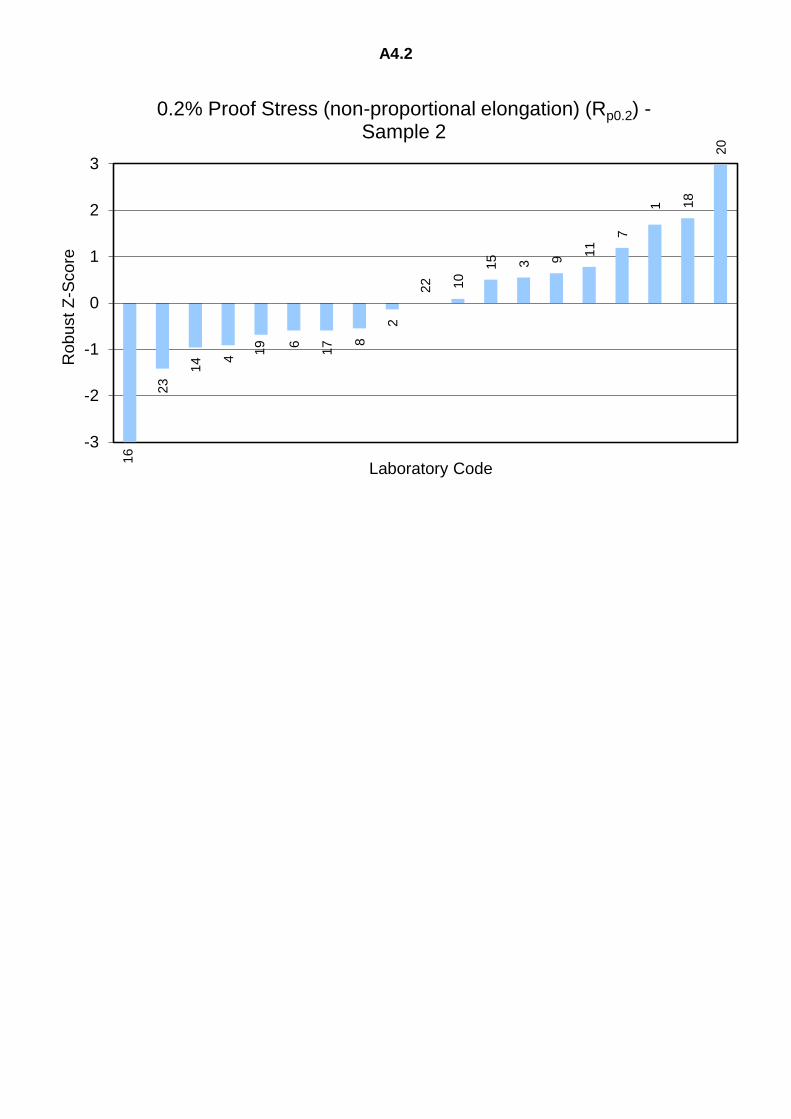
A4.2
16
23
14 4
19 6
17 8
2
22 10
15 3 9
11
7
1 18
20
-3
-2
-1
0
1
2
3
Robust
Z-S
core
Laboratory Code
0.2% Proof Stress (non-proportional elongation) (Rp0.2) -Sample 2
Section A5
Tensile Strength
A5.1
Tensile Strength (Rm) (MPa) – Results and Z-Scores
Lab Code Sample 1 Sample 2
Result MU (±) Z-Score Result MU (±) Z-Score
1 457 4.95 0.64 678 7.35 1.50
2 451 - 0.00 667 - 0.40
3 448 - -0.32 659 - -0.40
4 448 - -0.32 690 - 2.70
5 436 - -1.59 662 - -0.10
6 447 - -0.42 659 - -0.40
7 474 5 2.44 633 7 -3.00 §
8 459 3.1 0.85 645 4.4 -1.80
9 444 0.62 -0.74 673 0.62 1.00
10 451 3.6 0.00 660 3.6 -0.30
11 453 0.1 0.21 663 0.1 0.00
12 454 1.0 0.32 674 0.4 1.10
13 462 0.74 1.17 671 0.89 0.80
14 458 9 0.74 695 13 3.20 §
15 451 - 0.00 659 - -0.40
16 444.60 - -0.68 660.00 - -0.30
17 445 0.15 -0.64 672 0.10 0.90
18 440 0.001 -1.17 594 0.004 -6.89 §
19 459 20 0.85 656 20 -0.70
20 456.8 - 0.62 695.5 - 3.25 §
21 440 1 -1.17 649 2 -1.40
22 470 - 2.02 663 - 0.00
23 439 2 -1.27 666 3 0.30
Summary Statistics
Statistic Sample 1 Sample 2
Number of Results 23 23
Median 451.0 663.0
Normalised IQR 9.4 10.0
Uncertainty (Median) 2.5 2.6
Robust CV 2.1% 1.5%
Minimum 436 594
Maximum 474 696
Range 38 102
Note:
1. § denotes an outlier (i.e. |z-score| ≥ 3.0).
A5.2
5
23 18
21
9
16 17
6
3 4
2 10
15 1
1 12 2
0
1 14 8 19
13
22
7
-3
-2
-1
0
1
2
3
Robust
Z-S
core
Laboratory Code
Tensile Strength (Rm) - Sample 118 7
8
21
19
3 6
15 10
16
5
11
22
23 2
13 17 9 1
2
1
4
14
20
-3
-2
-1
0
1
2
3
Robust
Z-S
core
Laboratory Code
Tensile Strength (Rm) - Sample 2
Section A6
Percentage Elongation after Fracture
A6.1
Percentage Elongation after Fracture (A%) – Results and Proportional Gauge Length (PGL) Results
Lab Code Sample 1 Sample 2
Result MU (±) PGL Result Result MU (±) PGL Result
1 27.5 0.33 37 44 0.53 61
2 34 - 34 54 - 56
3 32 - 36 50 - 58
4 33 - 33 60 - 45
5 36 - 37 52 - 55
6 31 - 31 55 - 58
7 32 1 36 54 1 62
8 33 0.16 33 53 0.16 56
9 25 0.18 35 42 0.18 61
10 32.2 1.8 36 52.9 1.8 61
11 35 0.1 36 51 0.1 54
12 40 0.1 32 56 0.04 47
13 29 0.15 41 48 0.15 70
14 39 0.8 39 65 1.3 65
15 34 - 38 51 - 59
16 35.80 - 36 55.30 - 55
17 32 0.003 32 53 0.004 56
18 25 0.001 28 41 0.004 47
19 32 6 36 52 8.4 60
20 32 - 36 49 - 57
22 28 - 31 47 - 54
23 37 1 37 56 1 56
Note:
1. To analyse the Percentage Elongation after Fracture results, the results
submitted by participants were converted to a proportional gauge length using the formula:
A6.2
Percentage Elongation after Fracture (A%) – Proportional Gauge Length (PGL) Results and Z-Scores
Lab Code Sample 1 Sample 2
PGL Result Z-Score PGL Result Z-Score
1 37 0.45 61 1.04
2 34 -0.50 56 0.00
3 36 0.00 58 0.26
4 33 -1.12 45 -2.58
5 37 0.36 55 -0.44
6 31 -1.71 58 0.27
7 36 0.00 62 1.27
8 33 -0.89 56 -0.19
9 35 -0.29 61 0.99
10 36 0.08 61 1.02
11 36 -0.04 54 -0.65
12 32 -1.40 47 -2.22
13 41 2.03 70 3.00 §
14 39 1.30 65 1.88
15 38 0.85 59 0.47
16 36 0.03 55 -0.28
17 32 -1.30 56 -0.21
18 28 -3.10 § 47 -2.09
19 36 0.02 60 0.81
20 36 0.01 57 0.00
22 31 -1.77 54 -0.55
23 37 0.46 56 -0.06
Summary Statistics
Statistic Sample 1 Sample 2
Number of Results 22 22
Median 35.7 56.5
Normalised IQR 2.5 4.4
Uncertainty (Median) 0.7 1.2
Robust CV 7.0% 7.9%
Minimum 28 45
Maximum 41 70
Range 13 25
Note:
1. § denotes an outlier (i.e. |z-score| ≥ 3.0).
A6.3
18
22 6
12 17
4
8
2
9 11 3
7 20
19
16 10 5 1 2
3
15
14
13
-3
-2
-1
0
1
2
3
Robust
Z-S
core
Laboratory Code
Percentage Elongation after Fracture (A%) - Sample 14
12
18
11 2
2 5 16 17 8
23 2
20 3 6
15
19 9 1
0
1
7
14
13
-3
-2
-1
0
1
2
3
Robust
Z-S
core
Laboratory Code
Percentage Elongation after Fracture (A%) - Sample 2
Section A7
Method Information and Other Reported Results
A7.1
Method Information
Lab Code
Thickness Upper Yield Lower Yield
1 AS 1391 - 2007 - -
2 AS 1391 - -
3 - - -
4 - - -
5 - - -
6 AS 1391 AS 1391 AS 1391
7 BS EN ISO 6892-1 BS EN ISO 6892-1 BS EN ISO 6892-1
8 AS 1391 AS 1391 AS 1391
9 - AS 1391 AS 1391
10 - ISO 6892 ISO 6892
11 AS 1391 - 2007 AS 1391 - 2007 AS 1391 - 2007
12 ASTM A370 - -
13 Micrometer - -
14 AS 1391 - 2007 AS 1391 - 2007 AS 1391 - 2007
15 AS 1391 AS 1391 AS 1391
16 ISO 6892-1 - -
17 AS 1391 - 2007 - -
18 - ISO 6892-1 ISO 6892-1
19 AS 1391, ISO 6892-1 AS 1391, ISO 6892-1 AS 1391, ISO 6892-1
20 AS 1391 - -
21 - KS B 0802 KS B 0802
22 - - -
23 ISO 6892-1: 2009 ISO 6892-1: 2009 ISO 6892-1: 2009
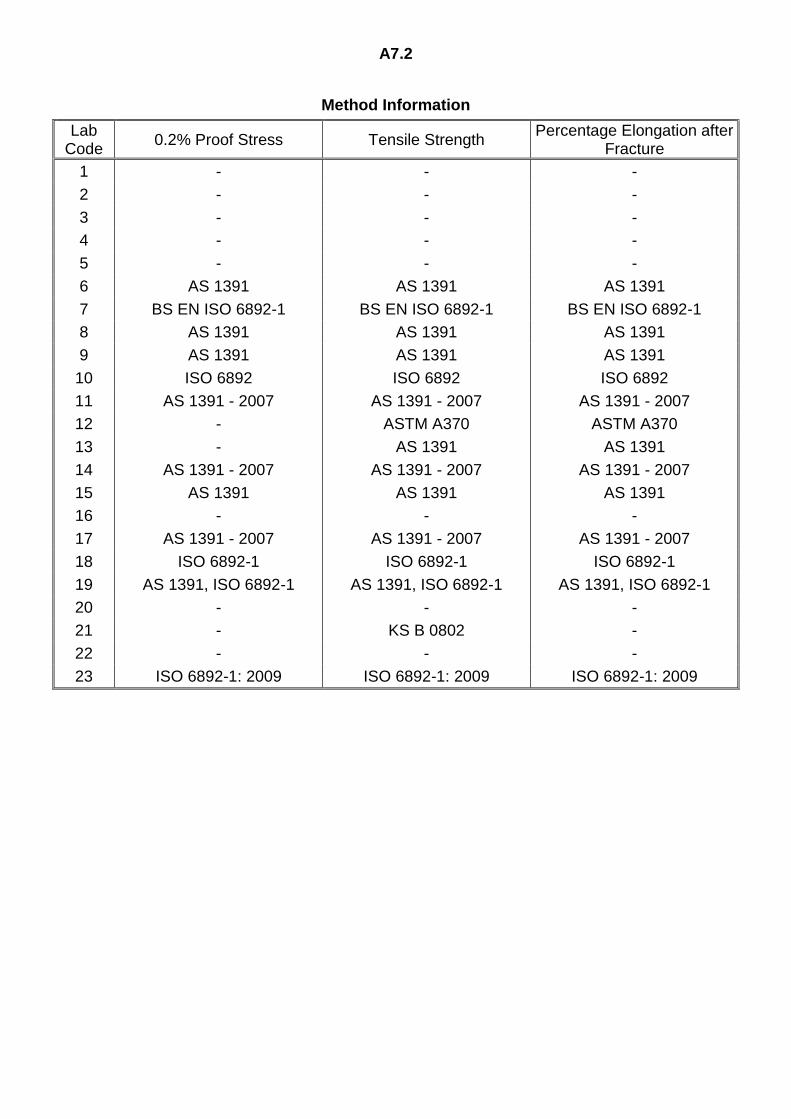
A7.2
Method Information
Lab Code
0.2% Proof Stress Tensile Strength Percentage Elongation after
Fracture
1 - - -
2 - - -
3 - - -
4 - - -
5 - - -
6 AS 1391 AS 1391 AS 1391
7 BS EN ISO 6892-1 BS EN ISO 6892-1 BS EN ISO 6892-1
8 AS 1391 AS 1391 AS 1391
9 AS 1391 AS 1391 AS 1391
10 ISO 6892 ISO 6892 ISO 6892
11 AS 1391 - 2007 AS 1391 - 2007 AS 1391 - 2007
12 - ASTM A370 ASTM A370
13 - AS 1391 AS 1391
14 AS 1391 - 2007 AS 1391 - 2007 AS 1391 - 2007
15 AS 1391 AS 1391 AS 1391
16 - - -
17 AS 1391 - 2007 AS 1391 - 2007 AS 1391 - 2007
18 ISO 6892-1 ISO 6892-1 ISO 6892-1
19 AS 1391, ISO 6892-1 AS 1391, ISO 6892-1 AS 1391, ISO 6892-1
20 - - -
21 - KS B 0802 -
22 - - -
23 ISO 6892-1: 2009 ISO 6892-1: 2009 ISO 6892-1: 2009
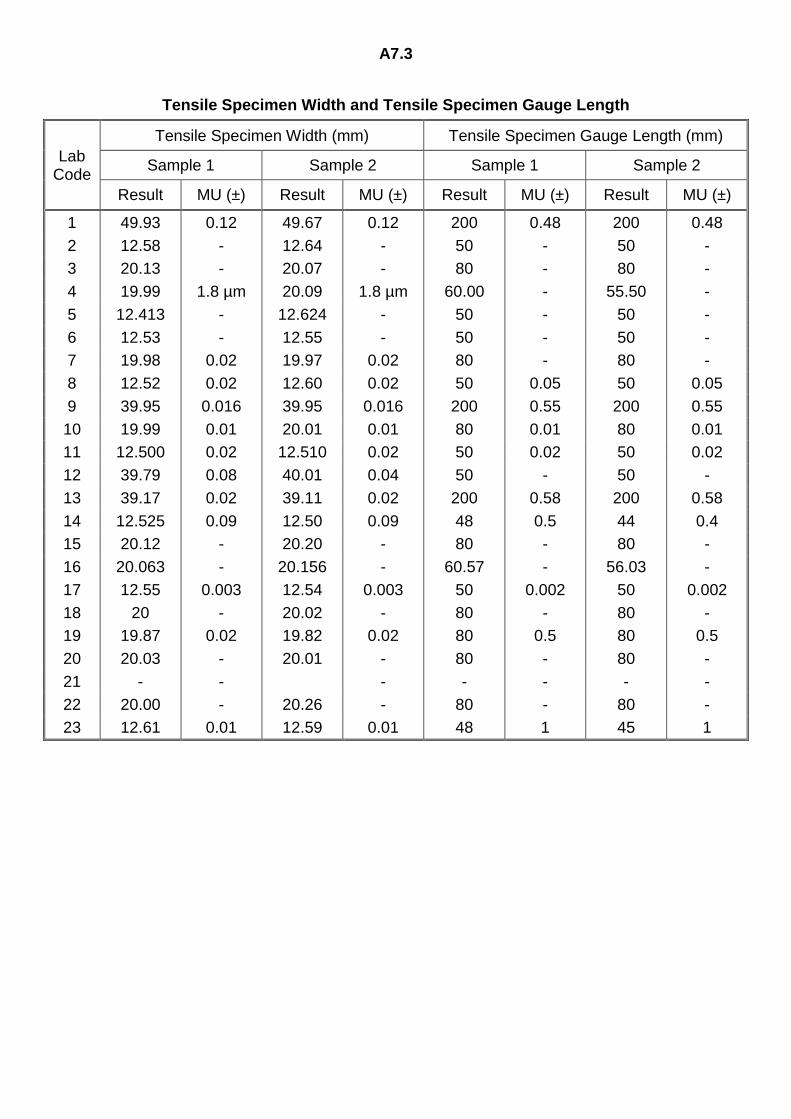
A7.3
Tensile Specimen Width and Tensile Specimen Gauge Length
Lab Code
Tensile Specimen Width (mm) Tensile Specimen Gauge Length (mm)
Sample 1 Sample 2 Sample 1 Sample 2
Result MU (±) Result MU (±) Result MU (±) Result MU (±)
1 49.93 0.12 49.67 0.12 200 0.48 200 0.48
2 12.58 - 12.64 - 50 - 50 -
3 20.13 - 20.07 - 80 - 80 -
4 19.99 1.8 µm 20.09 1.8 µm 60.00 - 55.50 -
5 12.413 - 12.624 - 50 - 50 -
6 12.53 - 12.55 - 50 - 50 -
7 19.98 0.02 19.97 0.02 80 - 80 -
8 12.52 0.02 12.60 0.02 50 0.05 50 0.05
9 39.95 0.016 39.95 0.016 200 0.55 200 0.55
10 19.99 0.01 20.01 0.01 80 0.01 80 0.01
11 12.500 0.02 12.510 0.02 50 0.02 50 0.02
12 39.79 0.08 40.01 0.04 50 - 50 -
13 39.17 0.02 39.11 0.02 200 0.58 200 0.58
14 12.525 0.09 12.50 0.09 48 0.5 44 0.4
15 20.12 - 20.20 - 80 - 80 -
16 20.063 - 20.156 - 60.57 - 56.03 -
17 12.55 0.003 12.54 0.003 50 0.002 50 0.002
18 20 - 20.02 - 80 - 80 -
19 19.87 0.02 19.82 0.02 80 0.5 80 0.5
20 20.03 - 20.01 - 80 - 80 -
21 - - - - - - -
22 20.00 - 20.26 - 80 - 80 -
23 12.61 0.01 12.59 0.01 48 1 45 1
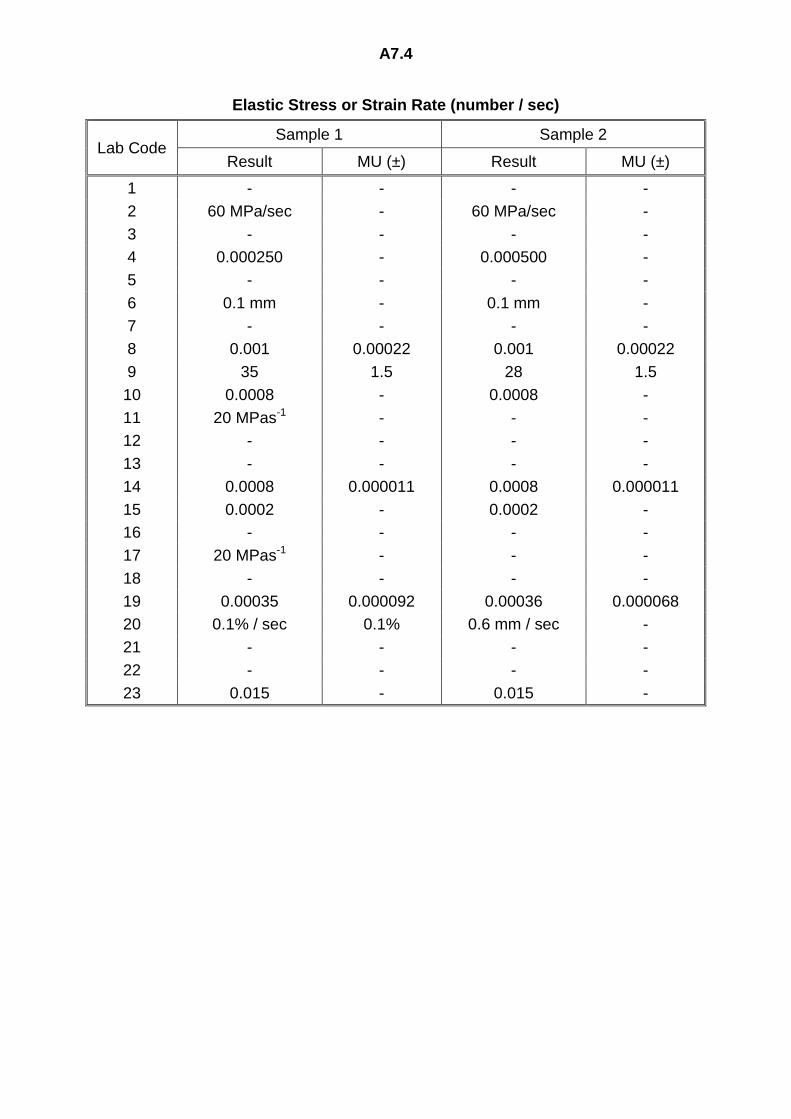
A7.4
Elastic Stress or Strain Rate (number / sec)
Lab Code Sample 1 Sample 2
Result MU (±) Result MU (±)
1 - - - -
2 60 MPa/sec - 60 MPa/sec -
3 - - - -
4 0.000250 - 0.000500 -
5 - - - -
6 0.1 mm - 0.1 mm -
7 - - - -
8 0.001 0.00022 0.001 0.00022
9 35 1.5 28 1.5
10 0.0008 - 0.0008 -
11 20 MPas-1 - - -
12 - - - -
13 - - - -
14 0.0008 0.000011 0.0008 0.000011
15 0.0002 - 0.0002 -
16 - - - -
17 20 MPas-1 - - -
18 - - - -
19 0.00035 0.000092 0.00036 0.000068
20 0.1% / sec 0.1% 0.6 mm / sec -
21 - - - -
22 - - - -
23 0.015 - 0.015 -
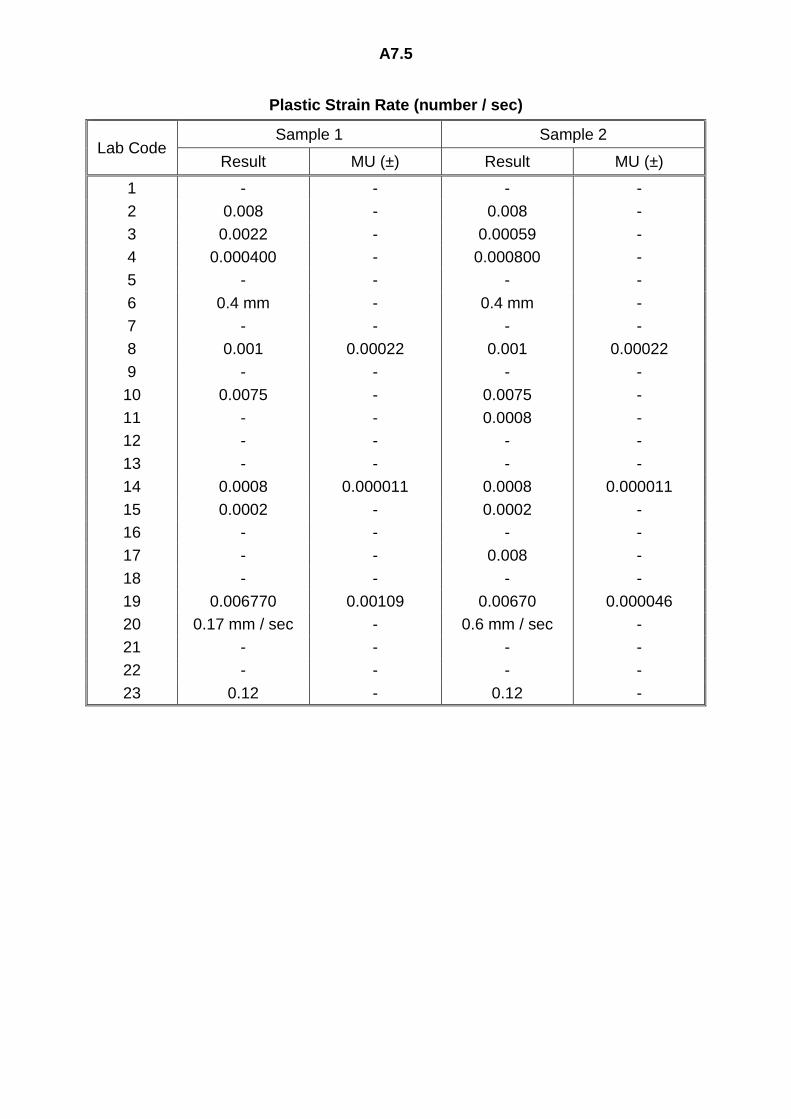
A7.5
Plastic Strain Rate (number / sec)
Lab Code Sample 1 Sample 2
Result MU (±) Result MU (±)
1 - - - -
2 0.008 - 0.008 -
3 0.0022 - 0.00059 -
4 0.000400 - 0.000800 -
5 - - - -
6 0.4 mm - 0.4 mm -
7 - - - -
8 0.001 0.00022 0.001 0.00022
9 - - - -
10 0.0075 - 0.0075 -
11 - - 0.0008 -
12 - - - -
13 - - - -
14 0.0008 0.000011 0.0008 0.000011
15 0.0002 - 0.0002 -
16 - - - -
17 - - 0.008 -
18 - - - -
19 0.006770 0.00109 0.00670 0.000046
20 0.17 mm / sec - 0.6 mm / sec -
21 - - - -
22 - - - -
23 0.12 - 0.12 -
APPENDIX B
Homogeneity
Testing
B1.1
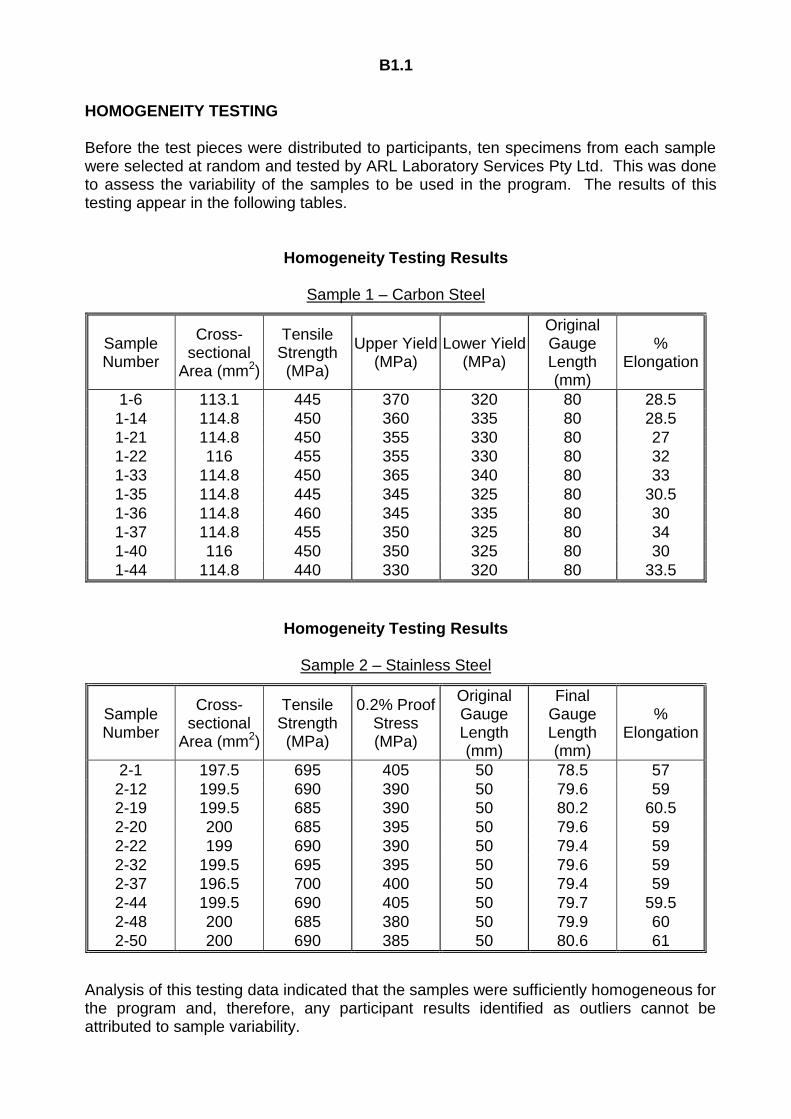
HOMOGENEITY TESTING Before the test pieces were distributed to participants, ten specimens from each sample were selected at random and tested by ARL Laboratory Services Pty Ltd. This was done to assess the variability of the samples to be used in the program. The results of this testing appear in the following tables.
Homogeneity Testing Results
Sample 1 – Carbon Steel
Sample Number
Cross-sectional
Area (mm2)
Tensile Strength (MPa)
Upper Yield (MPa)
Lower Yield (MPa)
Original Gauge Length (mm)
% Elongation
1-6 113.1 445 370 320 80 28.5
1-14 114.8 450 360 335 80 28.5
1-21 114.8 450 355 330 80 27
1-22 116 455 355 330 80 32
1-33 114.8 450 365 340 80 33
1-35 114.8 445 345 325 80 30.5
1-36 114.8 460 345 335 80 30
1-37 114.8 455 350 325 80 34
1-40 116 450 350 325 80 30
1-44 114.8 440 330 320 80 33.5
Homogeneity Testing Results
Sample 2 – Stainless Steel
Sample Number
Cross-sectional
Area (mm2)
Tensile Strength (MPa)
0.2% Proof Stress (MPa)
Original Gauge Length (mm)
Final Gauge Length (mm)
% Elongation
2-1 197.5 695 405 50 78.5 57
2-12 199.5 690 390 50 79.6 59
2-19 199.5 685 390 50 80.2 60.5
2-20 200 685 395 50 79.6 59
2-22 199 690 390 50 79.4 59
2-32 199.5 695 395 50 79.6 59
2-37 196.5 700 400 50 79.4 59
2-44 199.5 690 405 50 79.7 59.5
2-48 200 685 380 50 79.9 60
2-50 200 690 385 50 80.6 61
Analysis of this testing data indicated that the samples were sufficiently homogeneous for the program and, therefore, any participant results identified as outliers cannot be attributed to sample variability.
APPENDIX C
Instructions to Participants
and
Results Sheet
C1.1
Tensile Testing of Metals, Round 6 June 2014 Page 1 of 3
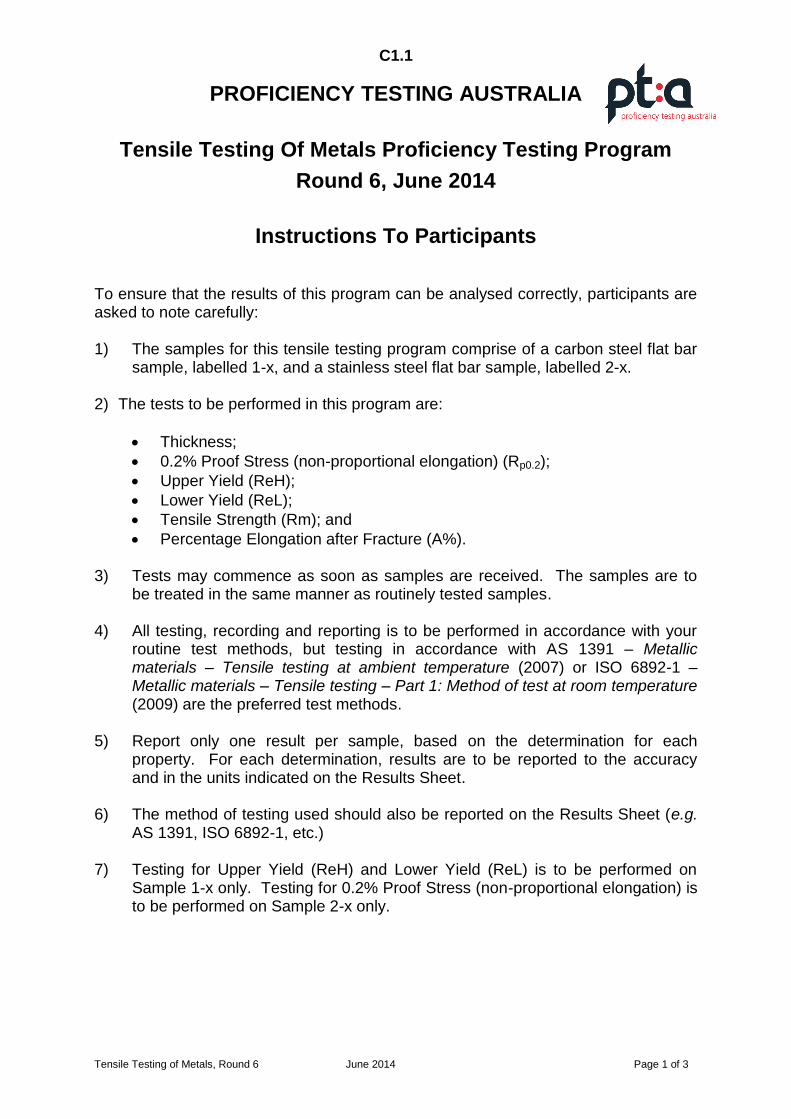
PROFICIENCY TESTING AUSTRALIA
Tensile Testing Of Metals Proficiency Testing Program
Round 6, June 2014
Instructions To Participants
To ensure that the results of this program can be analysed correctly, participants are asked to note carefully: 1) The samples for this tensile testing program comprise of a carbon steel flat bar
sample, labelled 1-x, and a stainless steel flat bar sample, labelled 2-x. 2) The tests to be performed in this program are:
Thickness;
0.2% Proof Stress (non-proportional elongation) (Rp0.2);
Upper Yield (ReH);
Lower Yield (ReL);
Tensile Strength (Rm); and
Percentage Elongation after Fracture (A%).
3) Tests may commence as soon as samples are received. The samples are to be treated in the same manner as routinely tested samples.
4) All testing, recording and reporting is to be performed in accordance with your routine test methods, but testing in accordance with AS 1391 – Metallic materials – Tensile testing at ambient temperature (2007) or ISO 6892-1 – Metallic materials – Tensile testing – Part 1: Method of test at room temperature (2009) are the preferred test methods.
5) Report only one result per sample, based on the determination for each
property. For each determination, results are to be reported to the accuracy and in the units indicated on the Results Sheet.
6) The method of testing used should also be reported on the Results Sheet (e.g.
AS 1391, ISO 6892-1, etc.)
7) Testing for Upper Yield (ReH) and Lower Yield (ReL) is to be performed on Sample 1-x only. Testing for 0.2% Proof Stress (non-proportional elongation) is to be performed on Sample 2-x only.
C1.2
Tensile Testing of Metals, Round 6 June 2014 Page 2 of 3
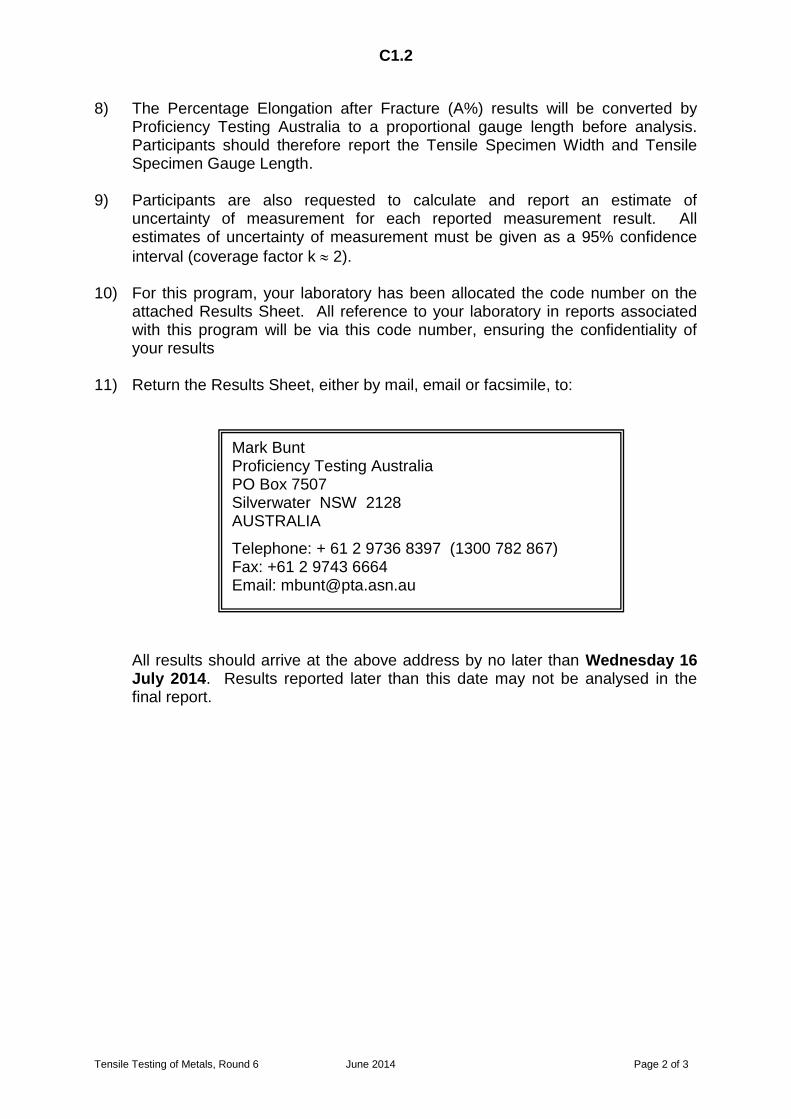
8) The Percentage Elongation after Fracture (A%) results will be converted by
Proficiency Testing Australia to a proportional gauge length before analysis. Participants should therefore report the Tensile Specimen Width and Tensile Specimen Gauge Length.
9) Participants are also requested to calculate and report an estimate of
uncertainty of measurement for each reported measurement result. All estimates of uncertainty of measurement must be given as a 95% confidence
interval (coverage factor k 2).
10) For this program, your laboratory has been allocated the code number on the attached Results Sheet. All reference to your laboratory in reports associated with this program will be via this code number, ensuring the confidentiality of your results
11) Return the Results Sheet, either by mail, email or facsimile, to: All results should arrive at the above address by no later than Wednesday 16
July 2014. Results reported later than this date may not be analysed in the final report.
Mark Bunt Proficiency Testing Australia PO Box 7507 Silverwater NSW 2128 AUSTRALIA
Telephone: + 61 2 9736 8397 (1300 782 867) Fax: +61 2 9743 6664 Email: [email protected]
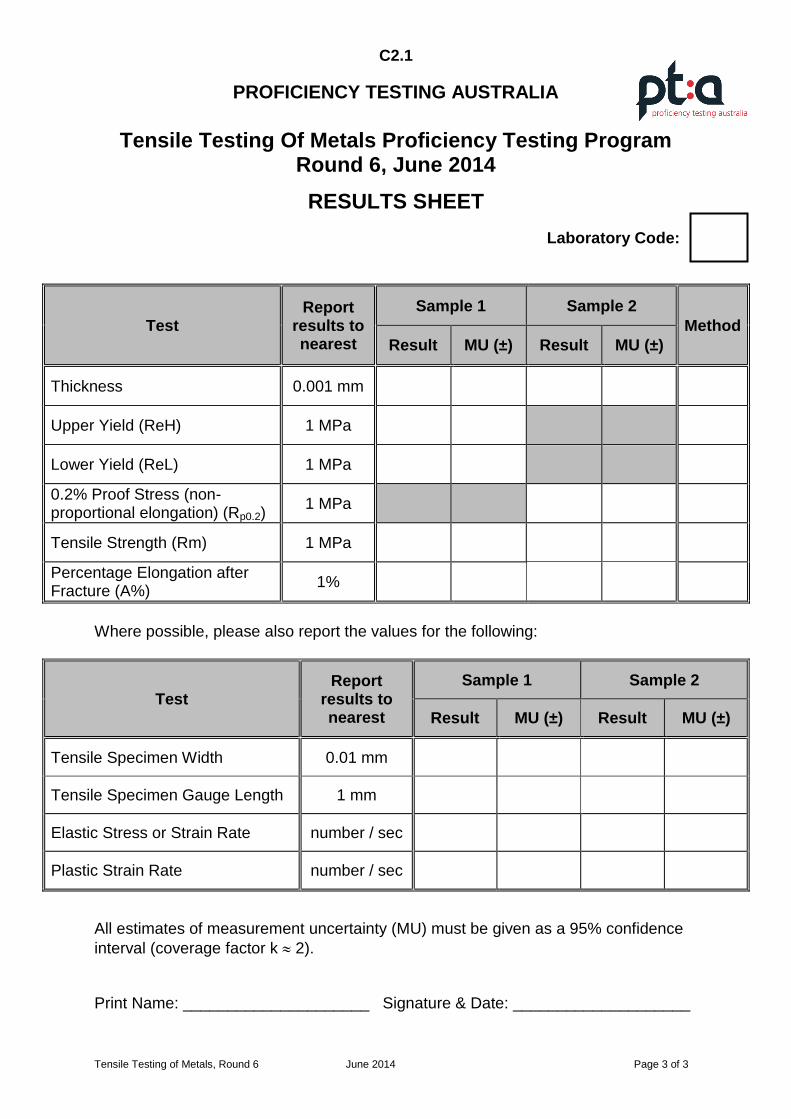
C2.1
Tensile Testing of Metals, Round 6 June 2014 Page 3 of 3
PROFICIENCY TESTING AUSTRALIA
Tensile Testing Of Metals Proficiency Testing Program Round 6, June 2014
RESULTS SHEET
Laboratory Code:
Test Report
results to nearest
Sample 1 Sample 2
Method
Result MU (±) Result MU (±)
Thickness 0.001 mm
Upper Yield (ReH) 1 MPa
Lower Yield (ReL) 1 MPa
0.2% Proof Stress (non-proportional elongation) (Rp0.2)
1 MPa
Tensile Strength (Rm) 1 MPa
Percentage Elongation after Fracture (A%)
1%
Where possible, please also report the values for the following:
Test Report
results to nearest
Sample 1 Sample 2
Result MU (±) Result MU (±)
Tensile Specimen Width 0.01 mm
Tensile Specimen Gauge Length 1 mm
Elastic Stress or Strain Rate number / sec
Plastic Strain Rate number / sec
All estimates of measurement uncertainty (MU) must be given as a 95% confidence
interval (coverage factor k 2). Print Name: _____________________ Signature & Date: ____________________

-----End of Report-----