Embed Size (px)
Citation preview
Tension Buckling of Plate Having a Hole
S.Shimizu
Department of Civil Engineering, Shinshu University, Wakasato 4-Chome,Nagano380-8553, Japan
_____________________________________________________________________ Abstract
Generally, it is believed that buckling of plates never arises under tensile load. However, when a plate has a hole, compression stresses appear locally near the hole under a tensile load, and the compression stress may cause local buckling - so called tension buckling - of the plate. In this paper, some results of numerical analysis on the tension buckling are presented, and basic behaviour on the tension buckling is discussed. Keywords: tension buckling, plate, hole _____________________________________________________________________ 1. Introduction
This paper presents some numerical results of the “tension buckling” in plates having a hole.
As illustrated in Fig.1, sometimes steel structures have holes, which are often arranged in the part subjected to tension, to avoid buckling. Generally, no attention is paid to the buckling of plates if they are subjected to a tensile load. However, when a plate has a hole, the compressive stress arises near the hole under a tensile load, and the stress may cause local buckling of the plate. Fig.2 shows a demonstrative model of the tension buckling. The left part of this figure indicates a simple frame structure composed of 8 members. When this structure is subjected to a set of tensile loading ------------------------------------------------------------------------------------------------------------------------------ *Corresponding author. Tel.:+81 26 2695 313; fax: +81 26 269 5271, e-mail: [email protected]
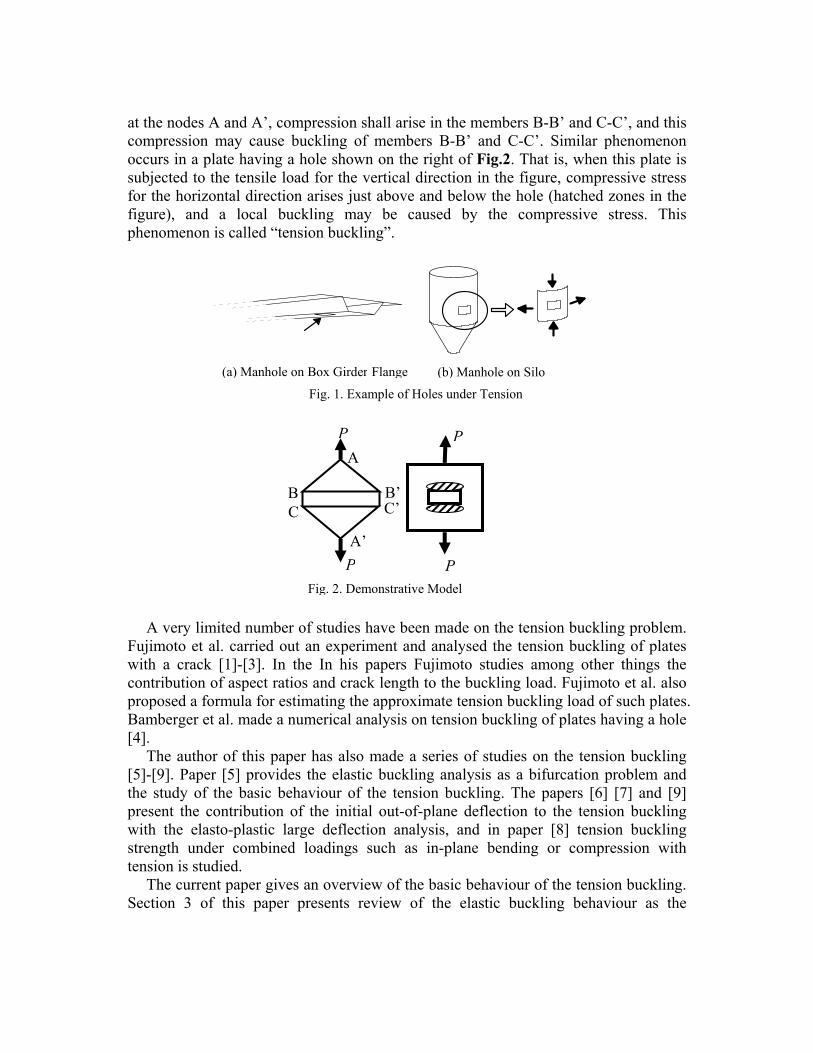
at the nodes A and A’, compression shall arise in the members B-B’ and C-C’, and this compression may cause buckling of members B-B’ and C-C’. Similar phenomenon occurs in a plate having a hole shown on the right of Fig.2. That is, when this plate is subjected to the tensile load for the vertical direction in the figure, compressive stress for the horizontal direction arises just above and below the hole (hatched zones in the figure), and a local buckling may be caused by the compressive stress. This phenomenon is called “tension buckling”.
(a) Manhole on Box Girder Flange (b) Manhole on Silo
Fig. 1. Example of Holes under Tension
P
P
B’C’
B C
A’
A
P
P
Fig. 2. Demonstrative Model
A very limited number of studies have been made on the tension buckling problem. Fujimoto et al. carried out an experiment and analysed the tension buckling of plates with a crack [1]-[3]. In the In his papers Fujimoto studies among other things the contribution of aspect ratios and crack length to the buckling load. Fujimoto et al. also proposed a formula for estimating the approximate tension buckling load of such plates. Bamberger et al. made a numerical analysis on tension buckling of plates having a hole [4].
The author of this paper has also made a series of studies on the tension buckling [5]-[9]. Paper [5] provides the elastic buckling analysis as a bifurcation problem and the study of the basic behaviour of the tension buckling. The papers [6] [7] and [9] present the contribution of the initial out-of-plane deflection to the tension buckling with the elasto-plastic large deflection analysis, and in paper [8] tension buckling strength under combined loadings such as in-plane bending or compression with tension is studied.
The current paper gives an overview of the basic behaviour of the tension buckling. Section 3 of this paper presents review of the elastic buckling behaviour as the
bifurcation problem. Section 4 shows a review of the large deflection elasto-plastic analysis. Numerical models used for the review are described in section 2.
2. Numerical Models
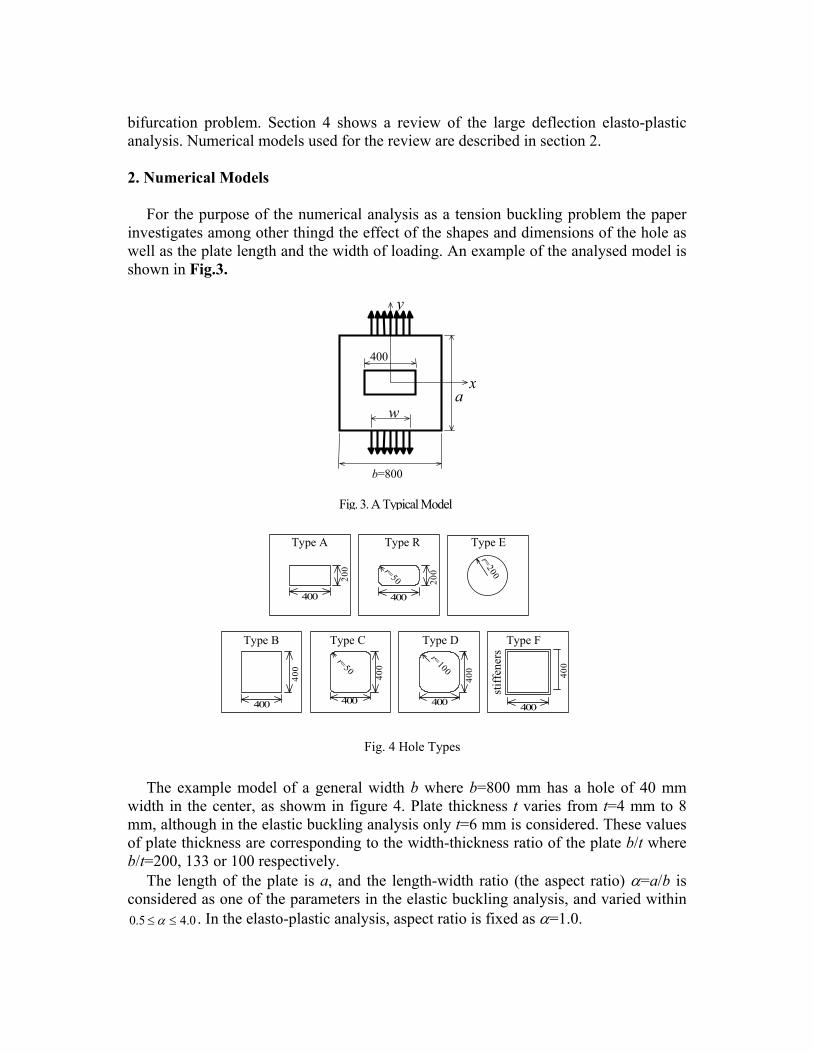
For the purpose of the numerical analysis as a tension buckling problem the paper investigates among other thingd the effect of the shapes and dimensions of the hole as well as the plate length and the width of loading. An example of the analysed model is shown in Fig.3.
y
a
b=800
w
400
x
Fig. 3. A Typical Model
he exam e of 40 mm wi
d the length-width ratio (the aspect ratio) α=a/b is considered as one of the parameters in the elastic buckling analysis, and varied within
400
400 400 400
400
400
200
r=50
r=100
r=20
400
400
400
0
Type B Type C Type D Type F
stiff
ener
s
400
200r=50
Type A Type R Type E
Fig. 4 Hole Types
T ple model of a general width b where b=800 mm has a holdth in the center, as showm in figure 4. Plate thickness t varies from t=4 mm to 8
mm, although in the elastic buckling analysis only t=6 mm is considered. These values of plate thickness are corresponding to the width-thickness ratio of the plate b/t where b/t=200, 133 or 100 respectively.
The length of the plate is a, an
. In the elasto-plastic analysis, aspect ratio is fixed as α=1.0. 0.45.0 ≤≤ α
The plate is subjected to a set of tensile loadings P with the width w at its top and bottom edges as illustrated in the figure. The loading width w is selected as w/b=0.0,
nd expressed as the undimensioned form β=w/b. Here the 0.5, 1.0, a undimensioned loa
an
sis the shape and the magnitude of the ou
ess of the material used in the elasto-pla
3.1. Analysis and Result Expressions
he elastic buckling analysis is made as an eigen-value problem. For the analysis, at P=9,8 kN,
en the eigen-value analysis is performed by using the stresses. The buckling load Pcr is o
hole. In this stu
ding width β=0.0 means that the plate is subjected to a set of concentrated loads at the centre of the top and the bottoms edges, and β=1.0 indicates fully distributed load.
The shapes of the hole are illustrated in Fig.4. In this paper 7 types of the hole shapes are considered. The hole Type A is a rectangular hole with the dimensions of 400 x 200 mm, and the hole Type B has square shape of 400 x 400 mm. The Type C
d the Type D are similar to the Type B, but the corners of the holes of these types are rounded off as its radius r=50 mm or r=100 mm respectively. In Type E the plate has a circular hole of the radius r=200 mm. The hole Type F is the same hole as the Type B with square shape of 400 x 400 mm, but this type has stiffeners with their section of 30 x 6 mm or 10 x 6 mm attached at the four edges of the hole. The Type R is the same as the Type A but the corners of the holes of these types are rounded off as its radius r=50 mm as similar to the Type C.
In the elastic buckling analysis, all these hole types except type R are dealt with, and in the elasto-plastic problem, only the hole types A and R are analysed.
In the elasto-plastic large deflection analyt-of-plane initial deflection are also considered as parameters. Details of the initial
deflection shall be described in the later section. In the analysis the plates are assumed to be simply supported at their four edges.
The material properties used in the elastic buckling analysis are Young's modulus E = 206GPa and Poisson's ratio ν = 0, 3. The yield str
stic analysis σy is σy=312 MPa.
3. Elastic Buckling Behaviour
T
first, stress distribution of the plate is calculated under the tensile load of th
btained by multiplying the eigen-value to the initial load of P=9,8 kN. The buckling strength of the plate is expressed with the buckling stress σcr estimated
from the buckling load Pcr and the effective section area of plates A as σcr = Pcr/A.,here the effective area is the plate section area subtracted by the area of the
dy, the width of a hole is assumed to be half of the plate width, therefore the effective section area A is half of the full section area, A = t(b/2). The results of the analysis in this section are discussed with the buckling coefficient k, i.e. σcr = k x σe, here σe is Euler's buckling stress defined as
( )2
2
2
112⎟⎠⎞
⎜⎝⎛
−=
btE
e νπσ , where b denotes the plate
width defined as in Fig.1, and t is plate thickness.
3.2. Stresses of Plates
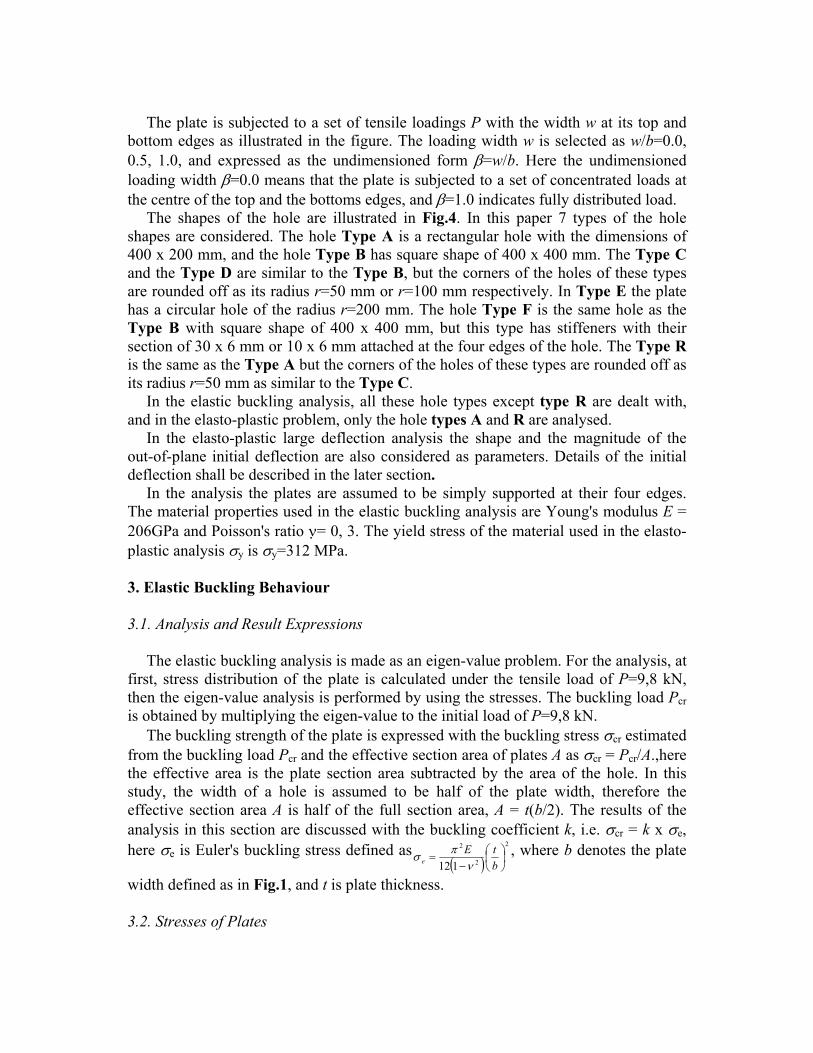
ratio α=2.0, the loading width β= 0.5 and plate thiFig.5 shows the stress distributions of type B and type D models, with their aspect
ckness t= 6 mm, under the load of P = 9,8 kN. In this figure, because of the symmetry, only quarter parts indicated in Fig. 5
Althou ure is no is paper, these s patterns are true for all other m that the tensile stress is dominant for the vertical direction (y-directio er tensile stress is observed in the left-adjacent zone of the hole. The magnitude of the tensile stress at the left zone of the ho
(a) are shown.
2
0 0 0.5
-0.5
In this figure it is found that both types have very similar stress contour patterns. gh the fig
odel types. This figure indicates t shown in th tress contour
n), and the relatively larg
le is over 5 MPa in all models. On the other hand, the compressive stress of over -3 MPa arises for the horizontal direction (x-direction) just under the hole in both types. As it is not clear in this figure, the tensile stress for the vertical direction σy at the corner of the hole (marked as a black point in the figure) of the model type B is 3.7 MPa, and in the type D, which has the corners of rounded off, 3.0 MPa, and in the type E with a circular hole, the stress σy at the at the lower left part is 2.0 MPa. This value of 2.0 MPa is smaller by about 46% than that of the type B. The compressive stress at the point shown in the figure is –3.4 MPa for the type B and 3.2 MPa for the type D. In the type E with a circular hole, σx at the bottom part of the hole is –3.0 MPa, smaller by 12% than that of the type B. Thus, it is obvious that the rounded corners of the hole reduce the magnitude of the tensile stress for the loading direction (y-direction) at the corner effectively, although the compressive stress is not reduced so much by the shape of the hole. 3.3. Buckling Behaviour
Fig.6 shows the out-of-plane deformation patterns due to the ‘tension buckling' for
the model type A, which has a hole of 400 x 200 mm, with β=1.0 and t=6 mm and the spect ratio α=0.75 or 1.5. The deformation patterns shown in this figure are obtained
he eigen-value problem of the elastic buckling analysis. Therefore, it should be noted that only the deformation patterns are discussed and the
aas an eigen-vector of t
y P
P
-2
a) Layout
2
0 00.5
-0.5
00-
-1
σx
x 1
2 2 3
y
b) Hol pe
3 3
4 5
1 0
σ
e Ty B
00.5
-2 -3
-1
σx
3
3 45
10
21
2
3
σy
c) H Type D
Fi S C urs (MPa) ontotress5 g.
ole

ma
the symm
ode in Fig.6(a) for α=0.75 is symmetrical with respect to both x and y axes. In this model, the plate deforms with almo
d along the x-axis, and the plate deforms for the alternative direction.
ling mode similar to one of the
ominated as the mode type
1 and the mode in Fig. 6 s the ode t 2. The buckling coefficient-aspect ratio curves of the hole type A are plotted in Fig. 7
for the load w ure denotes the buckling coefficient k and the horizontal axis the aspect ratio α=a/b of the plate. This
Fig. 6. Buckling Mode of the Hole Type A
gnitude (or the degree) of the deformation in the figure is meaningless. Because of
In Fig. 6(b) with the model of α=1.5, two half waves are observe
etry, the upper half of the plate is displayed in this figure.
In this figure, two types of the buckling mode are found. The buckling m
st one half-wave along the x-axis.
The similar buckling mode like the case with α=1.5 is obtained for models with the aspect ratio α greater than approximately 1.4 under the load width β=1.0, and the models with the smaller aspect ratio than 1.4 has the buck
model of α=0.75.
(a) α=0.75 (b) α=1.50
Hole Type A
ab
α 0.0 1.0 2.0 3.0 4.0
80
k 100
60
40
20
0
β=0.0 β=0.5 β=1.0
Fig. 7 Buckling Coefficients-Aspect Ratio Curves of Hole Types A
Hereafter the buckling mode as shown in Fig. 6(a) is den(b) a m ype
idth β=0.0, β=0.5 and β=1.0. The vertical axis of this fig
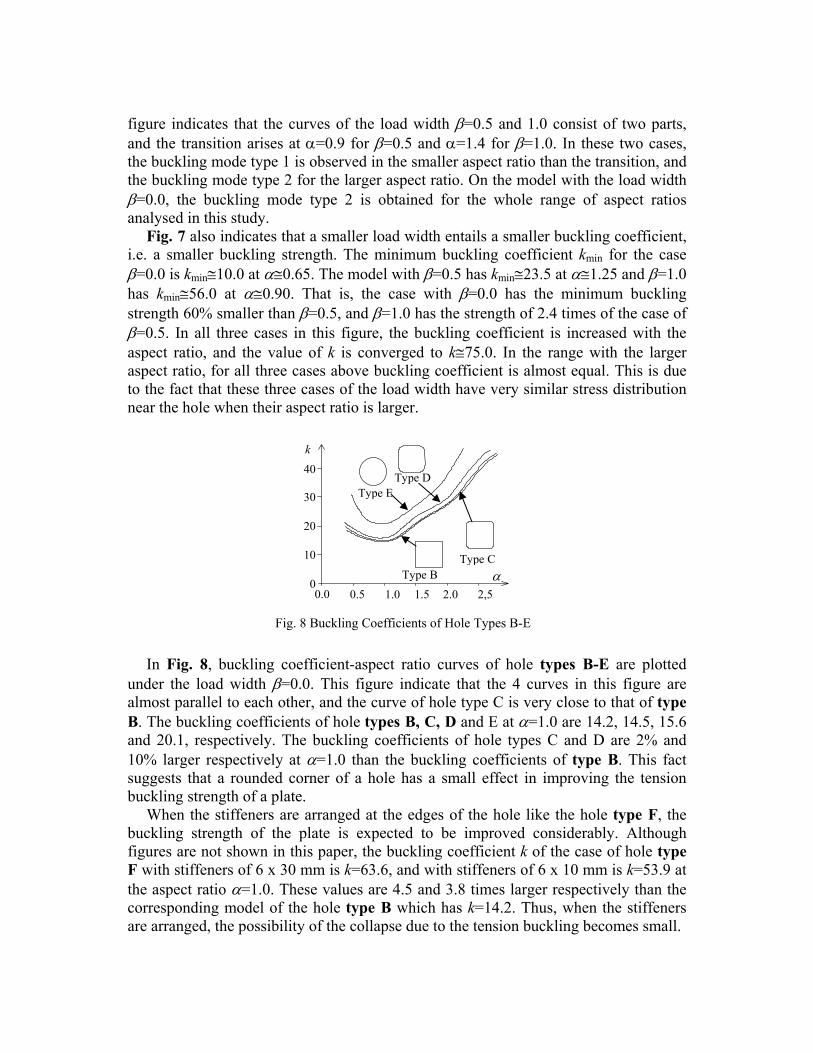
fig α=1.4 for β=1.0. In these two cases,
the
han β=0.5, and β=1.0 has the strength of 2.4 times of the case of
β=
a
In Fig. 8, bu types B-E are plotted
under the load width e 4 curves in this figure are almost parallel to each o type B. The buckling coe 1.0 are 14.2, 14.5, 15.6 and 20.1, respectively. The buckling coefficients of hole types C and D are 2% and 10
values are 4.5 and 3.8 times larger respectively than the co
ure indicates that the curves of the load width β=0.5 and 1.0 consist of two parts, and the transition arises at α=0.9 for β=0.5 and
buckling mode type 1 is observed in the smaller aspect ratio than the transition, and the buckling mode type 2 for the larger aspect ratio. On the model with the load width β=0.0, the buckling mode type 2 is obtained for the whole range of aspect ratios analysed in this study.
Fig. 7 also indicates that a smaller load width entails a smaller buckling coefficient, i.e. a smaller buckling strength. The minimum buckling coefficient kmin for the case β=0.0 is kmin≅10.0 at α≅0.65. The model with β=0.5 has kmin≅23.5 at α≅1.25 and β=1.0
as kmin≅56.0 at α≅0.90. That is, the case with β=0.0 has the minimum buckling strength 60% smaller th
0.5. In all three cases in this figure, the buckling coefficient is increased with the aspect ratio, and the value of k is converged to k≅75.0. In the range with the larger spect ratio, for all three cases above buckling coefficient is almost equal. This is due
to the fact that these three cases of the load width have very similar stress distribution near the hole when their aspect ratio is larger.
α
k
40
30 Type D
Type E
ckling coefficient-aspect ratio curves of hole β=0.0. This figure indicate that th
ther, and the curve of hole type C is very close to that of fficients of hole types B, C, D and E at α=
% larger respectively at α=1.0 than the buckling coefficients of type B. This fact suggests that a rounded corner of a hole has a small effect in improving the tension buckling strength of a plate.
When the stiffeners are arranged at the edges of the hole like the hole type F, the buckling strength of the plate is expected to be improved considerably. Although figures are not shown in this paper, the buckling coefficient k of the case of hole type F with stiffeners of 6 x 30 mm is k=63.6, and with stiffeners of 6 x 10 mm is k=53.9 at the aspect ratio α=1.0. These
rresponding model of the hole type B which has k=14.2. Thus, when the stiffeners are arranged, the possibility of the collapse due to the tension buckling becomes small.
0.00
20
0 1.5 2.0 2,5
10 Type CType B
.5 1.0
Fig. uckling Coefficients of Hole Types B-E8 B
3.4. Remarks on the Elastic Buckling Analysis
In a plate having a hole subjected to a tensile load compressive stress arises locally near the hole for the perpendicular direction to the loading, and this compressive stress ma cause local buckling of the plate. In this case a smaller load width entails a smaller
has the larger aspect ratio (i.e. larger ngth), the influence of the load width becomes smaller and the plate shall have
alm
4.
As described in section 2, elasto-plastic large deflection analysis is made for the the parameters described in the
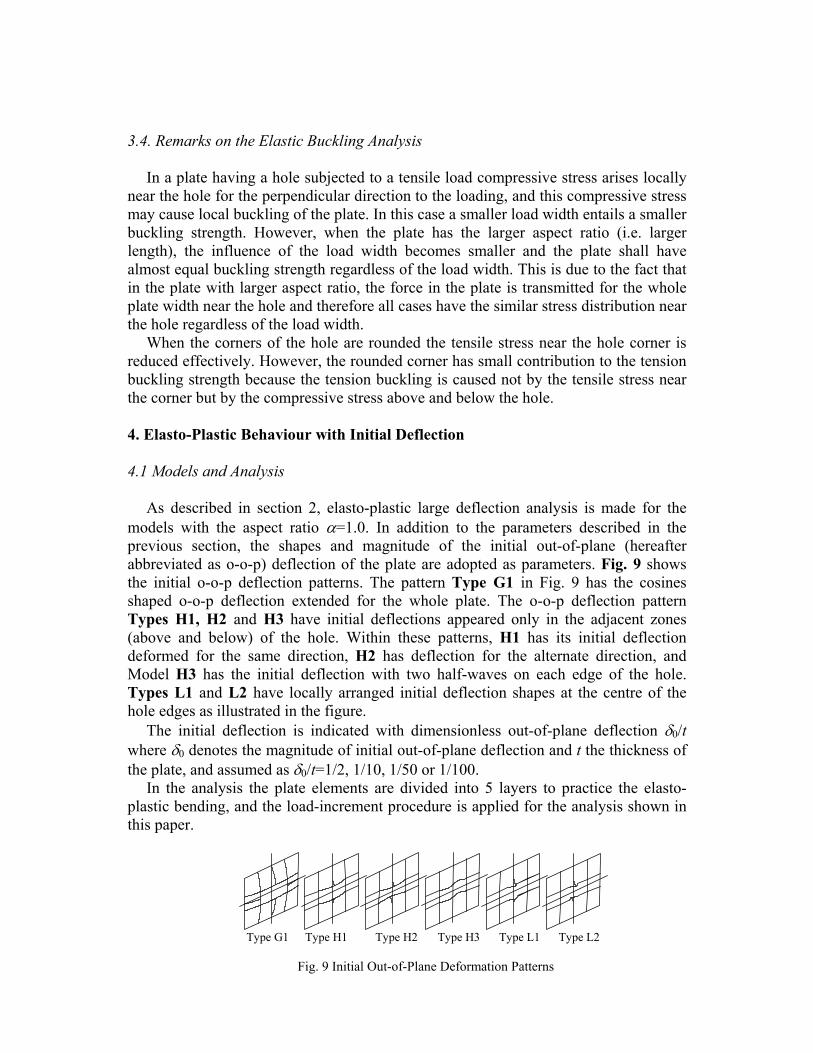
previous section, the shapes and magnitude of the initial out-of-plane (hereafter lection of the plate are adopted as parameters. Fig. 9 shows
e initial o-o-p deflection patterns. The pattern Type G1 in Fig. 9 has the cosines sha
thi
Fig. 9 Initial Out-of-Plane Deformation Patterns
Type G1 Type H1 Type H2 Type H3 Type L1 Type L2
ybuckling strength. However, when the plate le
ost equal buckling strength regardless of the load width. This is due to the fact that in the plate with larger aspect ratio, the force in the plate is transmitted for the whole plate width near the hole and therefore all cases have the similar stress distribution near the hole regardless of the load width.
When the corners of the hole are rounded the tensile stress near the hole corner is reduced effectively. However, the rounded corner has small contribution to the tension buckling strength because the tension buckling is caused not by the tensile stress near the corner but by the compressive stress above and below the hole.
Elasto-Plastic Behaviour with Initial Deflection
4.1 Models and Analysis
models with the aspect ratio α=1.0. In addition to
abbreviated as o-o-p) defth
ped o-o-p deflection extended for the whole plate. The o-o-p deflection pattern Types H1, H2 and H3 have initial deflections appeared only in the adjacent zones (above and below) of the hole. Within these patterns, H1 has its initial deflection deformed for the same direction, H2 has deflection for the alternate direction, and Model H3 has the initial deflection with two half-waves on each edge of the hole. Types L1 and L2 have locally arranged initial deflection shapes at the centre of the hole edges as illustrated in the figure.
The initial deflection is indicated with dimensionless out-of-plane deflection δ0/t where δ0 denotes the magnitude of initial out-of-plane deflection and t the thickness of the plate, and assumed as δ0/t=1/2, 1/10, 1/50 or 1/100.
In the analysis the plate elements are divided into 5 layers to practice the elasto-plastic bending, and the load-increment procedure is applied for the analysis shown in
s paper.
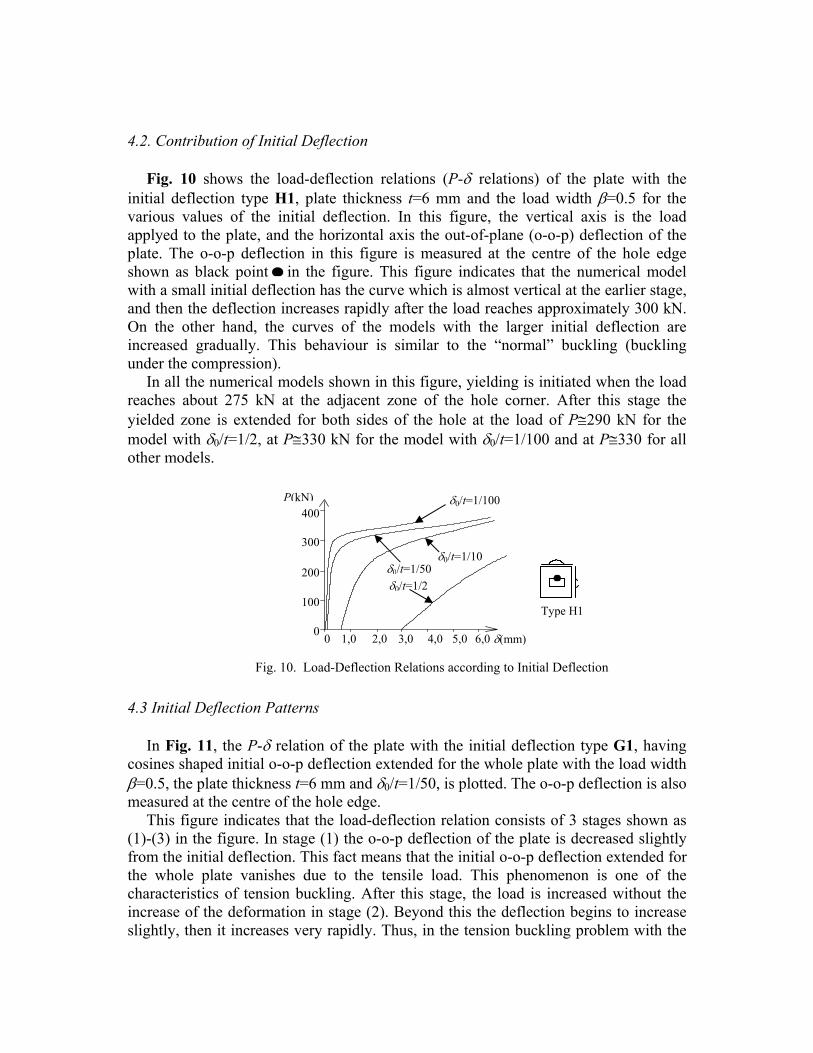
Fig. 10 sho the plate with the
initial deflec =0.5 for the , ti is is the load
applyed to the plate, and th ) deflection of the pla e. The o-o-p deflectio e of the hole edge
4.2. Contribution of Initial Deflection
ws the load-deflection relations (P-δ relations) oftion type H1, plate thickness t=6 mm and the load width β
various values of the initial deflection. In this figure the ver cal axe horizontal axis the out-of-plane (o-o-p
n in this figure is measured at the centrtshown as black point in the figure. This figure indicates that the numerical model
ich is almost vertical at the earlier stage, ly after the load reaches approximately 300 kN.
On the other hand, the curves of the minc
4.3 Initial Defle
In Fig. 11, the P-δ rela the plate with the initial deflection type G1, having
cosines shaped initial o-o-p deflection extended for the whole plate with the load width β=0.5, the plate thickness t=6 mm and δ0/t=1/50, is plotted. The o-o-p deflection is also measured at the centre of the hole edg
This figure indic s shown as e figure ed slightly
act means that the initial o-o-p deflection extended for to the tensile load. This phenomenon is one of the
characteristics of tension buckling. After this stage, the load is increased without the
Fig. -Deflection Relations a itial Deflection
with a small initial deflection has the curve whand then the deflection increases rapid
odels with the larger initial deflection are reased gradually. This behaviour is similar to the “normal” buckling (buckling
under the compression). In all the numerical models shown in this figure, yielding is initiated when the load
reaches about 275 kN at the adjacent zone of the hole corner. After this stage the yielded zone is extended for both sides of the hole at the load of P≅290 kN for the model with δ0/t=1/2, at P≅330 kN for the model with δ0/t=1/100 and at P≅330 for all other models.
ction Patterns
tion of
e. ates that the load-deflection relation consists of 3 stage. In stage (1) the o-o-p deflection of the plate is decreas(1)-(3) in th
from the initial deflection. This fthe whole plate vanishes due
increase of the deformation in stage (2). Beyond this the deflection begins to increase slightly, then it increases very rapidly. Thus, in the tension buckling problem with the
10. Load ccording to In
300
200
100
400
0
P(kN) δ0/t=1/100
δ0/t=1/50δ0/t=1/10
δ0/t=1/2
Type H1
0 1,0 2,0 3,0 4,0 5,0 6,0 δ(mm)

i
incsmaller initial def
Thus, in the tension buckling problem, the initial o-o-p deflection arranged locally near the hole has ger influence on the behaviour of the plate than the initial deflection extended for the whole plate.
4.4. Effect of Load Width
As described in section 3, in the elastic buckling ana e load width influences
the buckling strength th th generally entails a larger buckling strength. Fig. 13 t of the cases with the load width
1 urves
nitial o-o-p deflection extended for the whole plate, the plate behaves as if one with a small initial deflection.
Type G10
β=0.5
P(kN)
In Fig. 12, P-δ relations of the plates with the initial deflection arranged in the zone
very close to the hole. Such an initial deflection may be caused by the error during fabricating the structure. The o-o-p deflection in these figures is also measured at the centre of the hole edge as in Fig. 10. These two figures show that the increasing rate becomes larger gradually as the load reaches 300 kN. However, in the initial deflection type H3, which has the o-o-p deflection for the alternative direction near the hole, the
lination of the curve is changed rapidly and behaves similarly to the case with a lection.
a lar
lysis, th of e p
sholate,ws
andhe P
a la-δ r
rgerelat
loaions
d wid
Fig. 1. Typical Load-Deflection c
300
200
100
0 0 1,0 0 3,0 4,0 5,0 6,02, δ(mm)
(3)
(2)
(1)
Type H3
Type H2Type H1
300
200
100
400
0
P(kN)
0 1,0 2,0 3,0 4,0 5,0 6,0 δ(mm)
Fig. 12 Load-Deflection Curves of Initial Deflection Type H

β=1.0, 0.5 and 0.0. As it is clear from the figure, on the model with the load width β=0.0 the slope of the curves change at the load level of 200 kN. This is about 37 % sm ller than the model with β=0.5. The model with the load width of β=1.0 has a load
larger than the model of β=0.5. Beyond these load levels def
ph
4.5. Remarks on the Elasto-Plastic Analysis
Generally, when the corners of the hole are rounded stress intensity shall be defused.
In the elastic buckling analysis, ounded corners have a
es with the hole type A and the type R are plotted. The initial deflection type 1 and the load width β=0.5 are used for this figure. As described in the earlier section,
the corners of this type are rounded by the radius of 5 mm. This figure indicates that on the type R the slope of the curve is ch
alevel of 500 kN, and 60%
ormation increases as a faster rate in all models. In the elastic buckling analysis the buckling strength of the case with β=1.0 is 2.4 times larger than that of the case with β=0.5 so in the elasto-plastic analysis the load width has a smaller effect on improving the strength. This is due to the fact that in the elasto-plastic analysis the strength of the late is influenced not only by the buckling but also the yielding of the plate near the ole.
small effect on the tension buckling strength, because the tension buckling is caused by the local compression, and not by the stress near the hole corners. In Fig. 14 P-δ curves of plat
as described in section 3, the r
Hthe hole type R is similar to the type A, but
anged at the load level of approximately 340 kN, and this about 13 % larger than the type A.
Fig. 14. Effect of Rounded Hole Corner
0 1,0 2,0 3,0 4,0 5,0 δ(mm)
400
200
0
100
300
P(kN)
Hole Type A
r=50
Fig. 13 Contribution of Load Width
0 1,0 2,0 3,0 4,0 5,0 δ(mm)
P(kN)
300
400
500
Type L1
β=0.5
β=1.0
β=0.0
200
100
0

In the plate with the hole type A, yielding is initiated at the corners of the hole
(indicated as the black point in the figure) at the load of P≅275 kN and the yielded zone is extended for the side of the hole (hatched zone in the figure) at P≅320 kN. In the case, the plate begins to be yielded at the load of P≅280 kN at the hatched zo
n that extended for the whole plate. In the cas
if it had a sm
behaviour of tension buckling is described. Generally, no attention is paid to plate buckling when the plate is subjected to tension. When a plate
is subjected to the tensile loading, it is often considered as a stress intensity problem. However, as shown in this paper, if the plate has a hole buckling ma
Type R ne. But the yielded zone in this plate is smaller than the Type A case, and is not
extended until the load reaches P≅400 kN. Thus, in the elasto-plastic large deflection behaviour, unlike in the elastic buckling
problem, rounded corners of a hole are effective in improving the strength. In addition, in the tension buckling problem, initial o-o-p deflection occuring very
close to the hole has a larger influence thae with the initial o-o-p deflection extended for the whole plate, the initial deflection
is reduced at the earlier stage by the tensile load and the plate behaves asaller initial deflection.
5. Conclusion In this paper, the basic
has a hole and
y occur under tension. In this paper, only very basic patterns are shown. But, in the practical structures, a more severe situation may arise. One of the examples is a plate with a hole which is subjected not only a tensile load but also to the perpendicular compression as illustrated in Fig. 15(a). In the case demonstrated in Fig.15(a) the compression perpendicular to the tension may reduce the tension buckling strength considerably even if the compression is small[8]. In fact, such a case is not so unusual. For example, a steel box girder is sometimes connected to the pier as illustrated in Fig.15(b). In addition, when a manhole is required for the girder, it is often arranged in the bottom flange which is generally subjected to tension. This arrangement shall result subjecting the plate panel near the hole to the loading shown in Fig.15(a). The plate panel shown in Fig.15(a) may also be found in a silo structure having a manhole shown in Fig.1(b) in this paper. In such structures, buckling of plate panel may occur as the “tension buckling” under very small compression.
Therefore, the author of this paper believes that in such structures, more attention should be paid to the tension buckling problem and that further studies are required on
Fig. 15. Example of Combined Load
Manhole
(a) severer case of tension buckling (b) manhole arranged at the bottom flange of a box girder

this problem.
References 1. Fujimoto,T. and Suni,S. : Elastic Buckling of Center Cracked Plates under Tension,
Jour. JSME, Part A, Vol.52, No.478, 1579-1586, 1986 (in Japanese) 2. Fujimoto,T. and Sumi,S. : Elasto-plastic buckling of Center Cracked plates under
Tension, Jour. JSME, PartA, Vol.52, No.478, 1587-1593, 1986 (in Japanese) 3. Fujimoto,T. and Sumi,S. : Buckling Deformation Behaviour of Center cracked
Plates under Tension, Jour. JSME, Part A, Vol.53, No.487, 593-600, 1987 (in Japanese)
4. Bamberger,Y. and Voldoire,F. : Stabilite en Traction D'une Plaque Trouee, Proc. of ECCS Colloquium on Stability of Plate and Shell structures, Ghent, Belgium, 1987, 241-246 (in French)
5. Shimizu,S., Enomoto,N. & Yoshida, S. : Buckling of Plates with a Hole under Tension, Thin-Wailed Structures, Vol.12, 35-49, 1991
6. Shimizu,S. & Yoshida,Y. : A Large Deflection Analysis of Plates with a Hole Having Initial Out-of-Plane Deflection; Jour. Structural Engineering, JACE, Vol.38A, 203-212, 1992 (in Japanese)
7. Shimizu,S. & Yoshida,S. : Strength of Plates with a Hole under Tensile Loading, Proc. of International Conference on Steel and Aluminum Structures, ICSAS’91, Singapore, 501-510, 1991
8. Shimizu,S. & Nishimura,H. :Tension Buckling of Plates Having a Hole under Combined Loading; Proc. of 2nd International Conference on Thin-Walled Structures, Singapore, 579-586, 1998
9. Shimizu,S. & Kanematsu,W. : A Parametric Study on Tension Buckling of Plates Having a Hole, Archives of Civil Engineering Vol.49, pp107-118, 2003


![Investigation on Simulation of Buckling of Aluminium Sheet ......The simulation of buckling geometry according [8] under an uniaxial tension load with the material properties of an](https://img.pdfslide.net/doc/110x75/60ed22dd6dffd264b06ed3b7/investigation-on-simulation-of-buckling-of-aluminium-sheet-the-simulation.jpg)