Embed Size (px)
Citation preview

TERA Foundation
on behalf ofU. Amaldi, D. Bergesio, R. Bonomi,
A. Degiovanni, M. Garlasché and P. Magagnin
Silvia Verdú Andrés
3 GHz Cavity Test
The TERA cavity tests at CTF -- last run of February 2012 --
Report April 25, 2012
The motivationThe hadrontherapy community demands compact, reliable accelerators
with the appropriate beam performances for tumour treatment with ions.

Characteristics of a therapeutical beamBasics on Hadrontherapy:
Charged hadron beam that loses energy in matter
27 cm
Tumourtarget
200 MeV - 1 nA protons
4800 MeV – 0.1 nA carbon ions(radioresistant tumours)
tail
httt://global.mitsubishielectric.com/bu/particlebeam/index_b.html
Courtesy of PSI
Depth-dose distribution
4
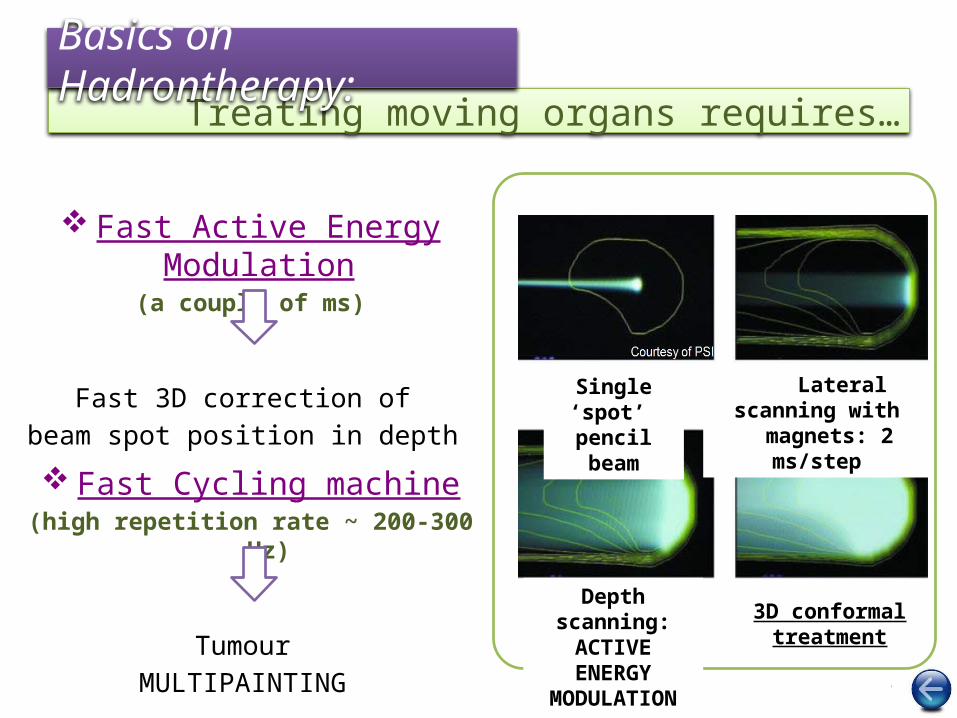
Fast Cycling machine(high repetition rate ~ 200-300 Hz)
Tumour MULTIPAINTING
Fast Active Energy Modulation (a couple of ms)
Fast 3D correction of beam spot position in depth
Treating moving organs requires…Basics on Hadrontherapy:
Single ‘spot’ pencil beam
Lateral scanning with magnets: 2 ms/step
3D conformal treatment
Depth scanning: ACTIVE ENERGY MODULATION

Characteristics of an accelerator for hadrontherapyBasics on Hadrontherapy:
Beam Parameter Value
Min./Max. Extraction Energy [MeV/u](range variation: 3-32 cm)
60/230 (protons)110/430 (carbon ions)
Beam Energy Modulation Step [MeV/u](range step: 2 mm –voxel size–)
~ 1
Energy Resolution (FWHM) at Max./Min. Energy [%](range resolution: ±0.5 mm)
4/2
Average Dose Rate [Gy/min/L](beam intensity: ~ nA)
2
Repetition Rate [Hz](fast scanning + moving organs)
100-400
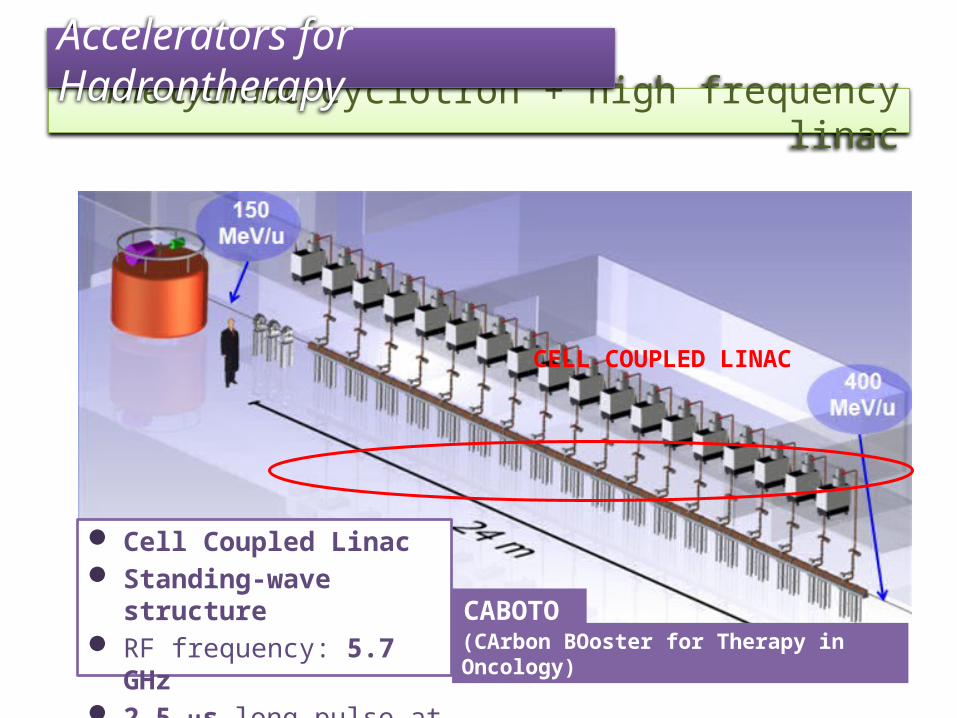
The cyclinac: cyclotron + high frequency linacAccelerators for Hadrontherapy
CELL COUPLED LINAC
Cell Coupled Linac Standing-wave structure RF frequency: 5.7 GHz 2.5 ms-long pulse at 300 Hz (CArbon BOoster for Therapy in Oncology)
CABOTO

C-band linac Section 1
cyclotron
Beam dose delivery
RF rotating joints
Line with 2% momentum acceptance
C-band linac Section 2
RF Power sources
W0
W1
W2
SM1
SM2
TULIP(TUrning LInac for Protontherapy)
Cell Coupled Linac Standing-wave structure RF frequency: 5.7 GHz 2.5 ms-long pulse at 100 Hz
The cyclinac: cyclotron + high frequency linacAccelerators for Hadrontherapy

The hadrontherapy community demands a compact, reliable accelerators with the appropriate beam performances for tumour treatment with ions.
Active energy modulation
High repetition rate: 3D spot-scanning technique
with multipainting
+
3D feedback system
moving organs treatment
+
CABOTO – 300 Hz
The cyclinac: cyclotron + high frequency linacAccelerators for Hadrontherapy

CELL COUPLED LINAC
Cell Coupled Linac Standing-wave structure RF frequency: 5.7 GHz 2.5 ms-long pulse at 300 Hz (CArbon BOoster for Therapy in Oncology)
CABOTO
The cyclinac: cyclotron + high frequency linacAccelerators for Hadrontherapy

TERA’s proposal:cyclotron + high-freq. linac = cyclinac
120MeV/u
400MeV/u
Silvia Verdú-Andrés
CELL COUPLED LINAC
Cell Coupled Linac Standing-wave structure RF frequency: 5.7 GHz
10
(CArbon BOoster for Therapy in Oncology)
CABOTO
Higher accelerating gradients
Reduce size and cost!
TERA’s proposal:cyclotron + high-freq. linac = cyclinac
120MeV/u
400MeV/u
Silvia Verdú-Andrés
CELL COUPLED LINAC
Cell Coupled Linac Standing-wave structure RF frequency: 5.7 GHz
11
(CArbon BOoster for Therapy in Oncology)
CABOTO
Higher accelerating gradients
Reduce size and cost!
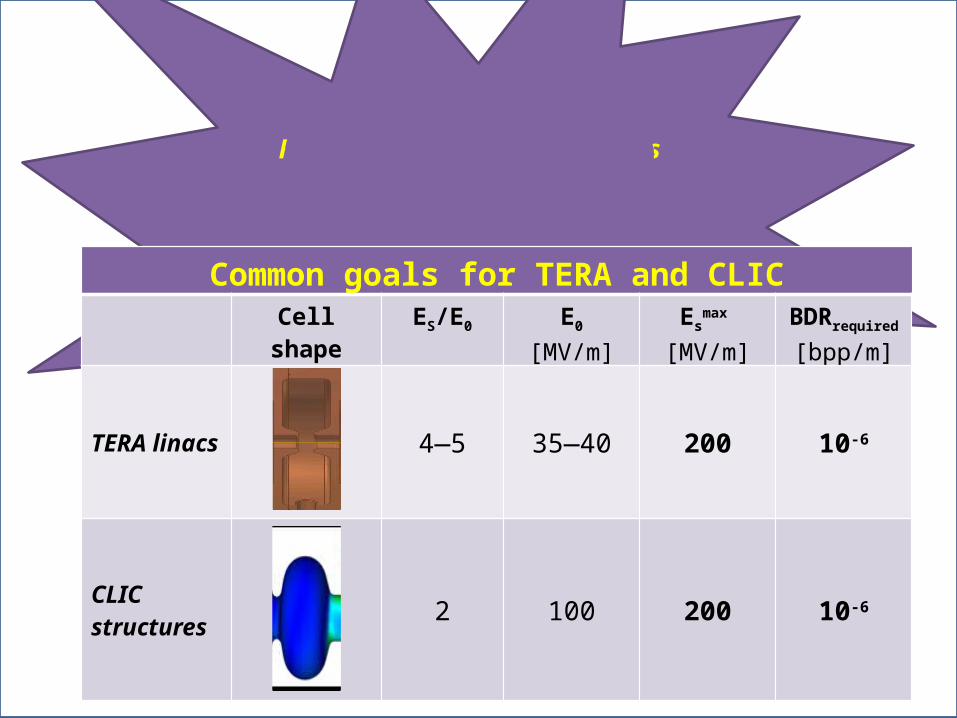
Common goals for TERA and CLICCell shape ES/E0 E0
[MV/m]Es
max
[MV/m]BDRrequired [bpp/m]
TERA linacs 4—5 35—40 200 10-6
CLIC structures 2 100 200 10-6

ObjectivesPerformance Studies of High-Gradient Accelerating Structures
• Operation limit for high-freq cavities BreakDown Rate BDR• limit described by surface field ES (Kilp.)
• mod. Poynting vector SC
• Scaling laws (ES, SC, pulse length, temperature, frequency)• evaluated for X, K and C bands
• Applying found limit to future designs• ensure reliable operation
• optimize RF structures (efficiency, length, cost)

• 3 GHz - One prototype- Preliminary high-power test
in 2010. - High power in Fall 2011.- High power in Winter 2012.
• 5.7 GHz- 3 prototypes for testing:
- BDR behaviour,- eventual hot spots for BD activity - BD as function of machining procedure (i.e conventional vs. diamond turning)
- Under tuning and brazing
High power test of high-gradient performance single-cell cavities at two different frequencies:
TERA High-Gradient Test Program: test cavities Performance Studies of High-Gradient Accelerating Structures

TERA 3 GHz Single-Cell Cavity: main characteristicsPerformance Studies of High-Gradient Accelerating Structures
• Single accelerating cell (two unsymmetrical half-cells) H-coupled to WR284 waveguide.• Two lateral plates for structure cooling.• CF flanges for data acquisition.
Cell Parameters
Material C10100 Copper
Dimensional tolerance band 20 μm
Surface roughness (Ra) 0.4 μm
Brazing under vacuum at > 800 0C (Palcusil)

TERA 3 GHz Single-Cell Cavity: RF designPerformance Studies of High-Gradient Accelerating Structures
max. Emax. Hmax. Sc
β= 0.38 (Ekin=70 MeV)
f0= 3000 MHz
Q0= 9000
Emax/E0 = 6.5

Short Circuit
Test Cavity
RF input
f0= 3000.2 MHzQ0= 8650 (96% Q0,sim)b = 0.92, G=-27 dB
TERA 3 GHz Single-Cell Cavity: tuning by nose stretching & matching
Performance Studies of High-Gradient Accelerating Structures
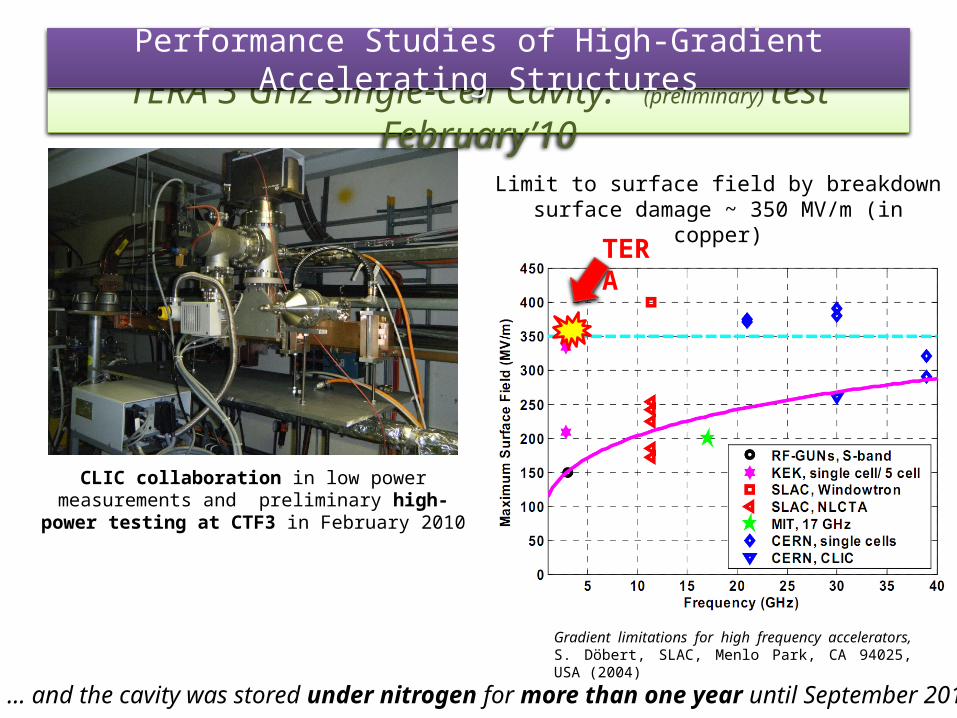
CLIC collaboration in low power measurements and preliminary high-power testing at CTF3 in February 2010
TERA 3 GHz Single-Cell Cavity: (preliminary) test February’10Performance Studies of High-Gradient Accelerating Structures
Gradient limitations for high frequency accelerators, S. Döbert, SLAC, Menlo Park, CA 94025, USA (2004)
Limit to surface field by breakdown surface damage ~ 350 MV/m (in copper)
TERA
… and the cavity was stored under nitrogen for more than one year until September 2011.

TERA 3 GHz Single-Cell Cavity: test Fall’11Performance Studies of High-Gradient Accelerating Structures
2.2 ms
1.5 ms
1.0 msBDR E13
BDR E23
BDR tP1.2
Still conditioning the cavity!

Strategy for February 2012-- dreamed scenario --
Testing time: 17 daysSchedule:- Start + continue conditioning (1+2 days)- BDR measurements at high field interesting for CLIC comparison (2-3 days, scaling law evaluation)- BDR measurement at low field interesting for TERA applications (12 days)* Dark current measurements at different stages
Slide from January 2012!

Test February 2012

Experimental Set-up at CLIC Test Facility (CERN)
o Rf circuit: klystron no.14 3 GHz, 50-100 Hz, 50 MW peak power
o Vacuum station (ion pump): 10-8 mbaro Cooling system: thermalized water, constant water flowo Diagnostics:
• Faraday cup• Incident and reflected RF power (amplitudes and phases)• Vacuum gauge• Temperature of cavity and coolant (thermistors and Pt100, respectively)• Photomultiplier
o Remote control of the incident RF pulse performanceso Automatic data acquisition systemo 24/24 operation shifts

RF window
bidirectional coupler
towards 3 GHz TERA single-cell cavity
vacuum system
from klystron 14
from klystron 14
3 GHz TERA single-cell cavity

from klystron 14
3 GHz TERA single-cell cavity
from klystron 14
cavity
vacuum portaside Faraday cup
vacuum portupstream cavity
vacuum lectureFaraday cup
vacuum portaside Faraday cup
Faraday cup
cavity

cavity
photomultiplier

from klystron 30
cooling system
PT100
thermistors
PT100
in
inout
out

Incident RF signal amplitude
Reflected RF signal amplitude
Reflected RF signal phase
Incident RF signal phase
Dark current signalLight emission (photomultiplier)
Signals

pulse length
incident RF pulse
estimated reflected RF pulse
« dynamic » stored energy
measured reflected RF pulse
RF pulse characteristics -- Normal operation --
(12-20% of power in b ~0.9)
-- Breakdown --
field emission current signal(< 8 mA peak within 2.5 ms-long pulse)
negative current: electrons!
a) reflected power increase:
b) field-emission current burst:
breakdown!
0
0
electrons
electronics
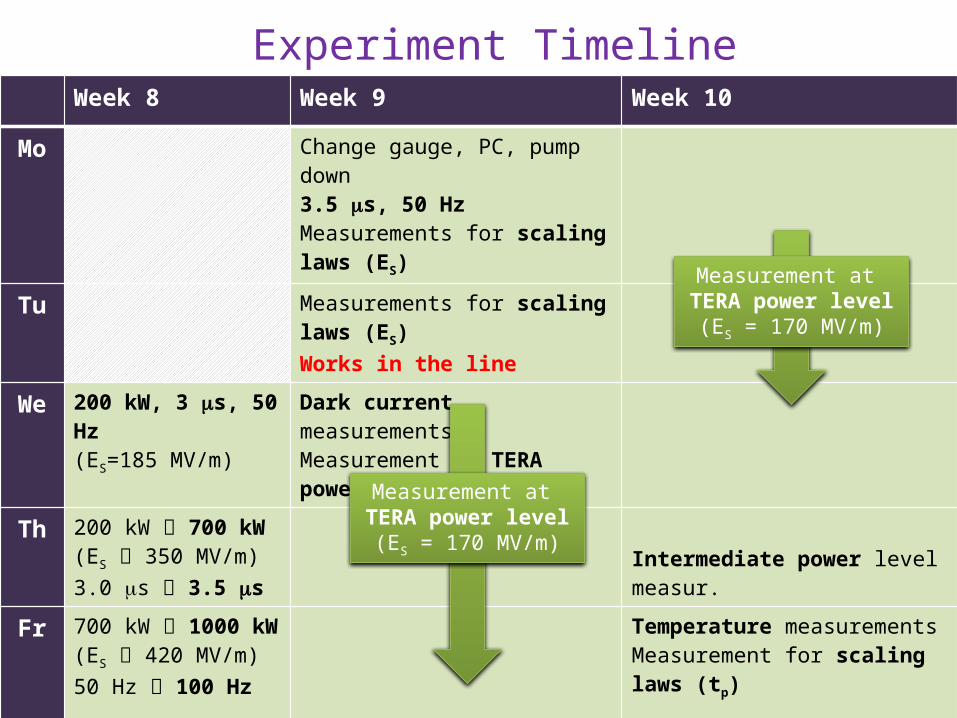
Experiment TimelineWeek 8 Week 9 Week 10
Mo Change gauge, PC, pump down3.5 ms, 50 Hz Measurements for scaling laws (ES)
Tu Measurements for scaling laws (ES)Works in the line
We 200 kW, 3 ms, 50 Hz(ES=185 MV/m)
Dark current measurementsMeasurement at TERA power level
Th 200 kW 700 kW(ES 350 MV/m)3.0 ms 3.5 ms Intermediate power level measur.
Fr 700 kW 1000 kW(ES 420 MV/m)50 Hz 100 Hz
Temperature measurementsMeasurement for scaling laws (tp)
Sa Electrovalve interlock700 kW 1000 kW(ES 420 MV/m)Vacuum gauge breaks
Measurement for scaling laws (tp)
Su PC crashes Test stops on Monday morning
Measurement at TERA power level (ES = 170 MV/m)
Measurement at TERA power level (ES = 170 MV/m)

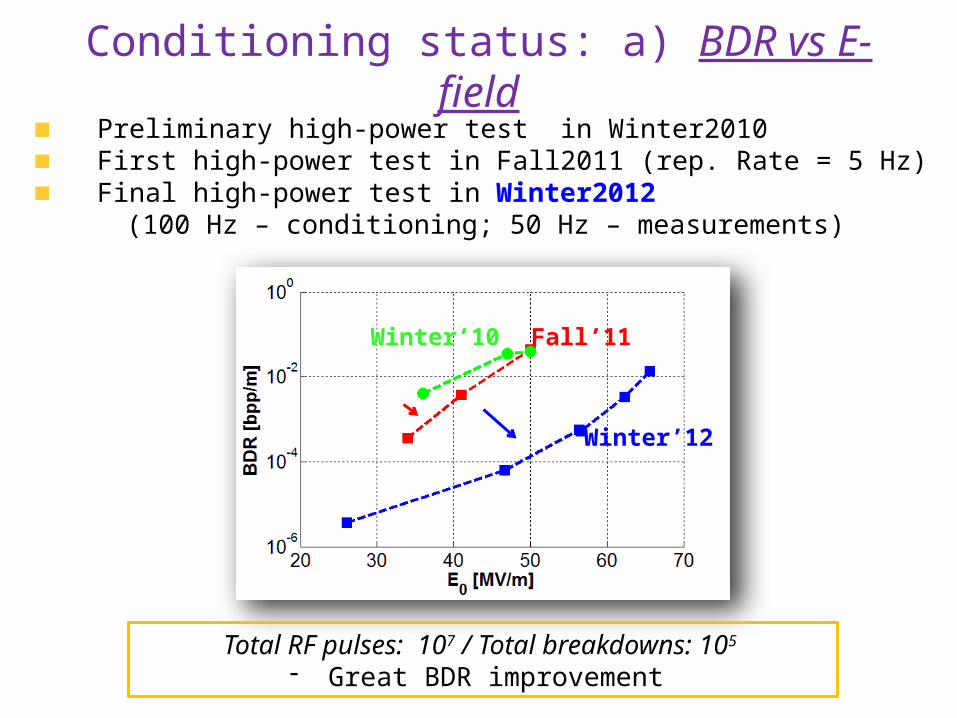
Preliminary high-power test in Winter2010 First high-power test in Fall2011 (rep. Rate = 5 Hz) Final high-power test in Winter2012
(100 Hz – conditioning; 50 Hz – measurements)
Winter’10
Conditioning status: a) BDR vs E-field

Preliminary high-power test in Winter2010 First high-power test in Fall2011 (rep. Rate = 5 Hz) Final high-power test in Winter2012
(100 Hz – conditioning; 50 Hz – measurements)
Winter’10 Fall’11
Conditioning status: a) BDR vs E-field
Conditioning status: a) BDR vs E-field Preliminary high-power test in Winter2010 First high-power test in Fall2011 (rep. Rate = 5 Hz) Final high-power test in Winter2012
(100 Hz – conditioning; 50 Hz – measurements)
Total RF pulses: 107 / Total breakdowns: 105 - Great BDR improvement
Winter’10 Fall’11
Winter’12

Conditioning status: b) field-enhancement factor b
29 Feb 201211 March 2012
<30 nA

Conditioning status: b) field-enhancement factor b
29 Feb 201211 March 2012
<30 nA
By the way, is this current enough to load the cavity?

Field enhancement factor b = 60-75
Conditioning status: b) field-enhancement factor b
29 Feb 201211 March 2012

Scaling laws: power flow model
Modified Poynting vector Sc power law

Scaling laws: power flow model
Modified Poynting vector Sc power law
Fit to high-field data
Fit to low-field data
0 events*
Log ( )Lo
g (
)

Scaling laws: power flow model
Modified Poynting vector Sc power law
Fits:Low-field data (ES [300,370] MV/m)exp= 10 ± 5, efit
RMS =0.05
High-field data (ES [370,420] MV/m)exp= 16 ± 5, efit
RMS =0.05
Fit to high-field data
Fit to low-field data
0 events*
Log ( )Lo
g (
)

Defect volume DV [m3]
Dislocation loop radius rloop [nm]
Other experimental data [0.8,13]*10-25 [13,40]
Scaling laws: stress model
Stress model exponential law:
BDR exp (xE2)

Defect volume DV [m3]
Dislocation loop radius rloop [nm]
Other experimental data [0.8,13]*10-25 [13,40]
Scaling laws: stress model
Stress model exponential law:
BDR exp (xE2)
0 events*

Defect volume DV [m3]
Dislocation loop radius rloop [nm]
Other experimental data [0.8,13]*10-25 [13,40]
Scaling laws: stress model
Stress model exponential law:
BDR exp (xE2)
0 events*
Fit: x= (2.8 ± 1.3 )·10-3 ; efitRMS
=0.003
TERA 3 GHz SCC Test (1.3 ± 0.6)*10-24 (46 ± 11)

Fit:Highest-field data , varying pulse lengthx= 2.9 ± 0.5, efit
RMS =0.03
Scaling laws: BDR vs PulseLength
pulse length or flat-top
« dynamic » stored energy
E0=58 MV/m
E0=54 MV/m
BDR tpulsex

Measured BDR for E0=26 MV/m* (equivalent to 37 MV/m in CABOTO)
is 3 · 10-6 bpp/m.
Consequences for TERA applications
* and same pulse length
Expected E0 for BDR = 10-6 bpp/m,
according to fit models (red dotted lines), is 31– 37 MV/m (respectively, stress model and power flow model).

Measured BDR for E0=26 MV/m* (equivalent to 37 MV/m in CABOTO)
is 3 · 10-6 bpp/m.
Consequences for TERA applications
* and same pulse length
Expected E0 for BDR = 10-6 bpp/m,
according to fit models (red dotted lines), is 31– 37 MV/m (respectively, stress model and power flow model).

What is next?
1. Cut the cavity and inspect its surface on-going…
finish data analysis!: Dubrovskiy’s fit, “extended” stress model, etc.

What is next?
1. Cut the cavity and inspect its surface on-going…
finish data analysis!: Dubrovskiy’s fit, “extended” stress model, etc.
2. High-power test of 5.7 GHz Single-Cell Cavitiesby the end of 2012

What is next?
1. Cut the cavity and inspect its surface on-going…
finish data analysis!: Dubrovskiy’s fit, “extended” stress model, etc.
2. High-power test of 5.7 GHz Single-Cell Cavitiesby the end of 2012
3. Design, prototyping and high-power test of a multi-cell structure (~ 5 cells), either in S or C-band
evaluate high-gradient performances of multi-cell structure at the selected frequency

AcknowledgementsWe would like to express our gratitude to the CTF3 group for permission to run experiment in their test facility and technical and scientific support (Gerry McMonagle, Jan Kovermann, Roberto Corsini, Jose Monteiro, Stephane Curt, Stephane Rey, Frank Tecker, Esa Paju, Ghislain Rossat, Wilfrid Farabolini, Thibaut Lefevre, Aurelie Rabiller, etc.) to prepare and perform the experiment. We also acknowledge the CLIC RF structure development group (Walter Wuensch, Igor Syratchev, Alexej Grudiev, Jiaru Shi, etc.) for the enriching discussions about the preparation, development and analysis of the test. We are also grateful to Rolf Wegner, who leaded the design, prototyping and first high-power test of the cavity, for his valuable discussions on the continuation of the high power tests. Special thanks go to Alexey Dubrovskiy and Luca Timeo, for their special involvement in the experiment. We also acknowledge Javier Bilbao de Mendizábal for the time spent in long shifts and Eugenio Bonomi for the support on the temperature measurement system preparation.
Thanks to Vodafone Italy foundation for the fundings received to produce the test cavity. Thanks also to the CERN PS group and CERN General Services for the technical support.

[Degiovanni et al.] A. Degiovanni et al., « TERA High Gradient Test Program of RF Cavities for Medical Linear Accelerators ». NIM A 657 (2011) 55-58: http://www.sciencedirect.com/science?_ob=MiamiImageURL&_cid=271580&_user=107896&_pii=S0168900211008886&_check=y&_origin=&_coverDate=21-Nov-2011&view=c&wchp=dGLzVlk-zSkWz&md5=401347aa3fed9fd2706dc8d36b049a94/1-s2.0-S0168900211008886-main.pdf
[Wang&Loew] J. W. Wang and G. A. Loew, “Field Emission and RF Breakdown in High-Gradient Room-Temperature Linac Structures”. SLAC-PUB-7684 (1997): http://slac.stanford.edu/cgi-wrap/getdoc/slac-pub-7684.pdf [Grudiev et al.] A. Grudiev, S. Calatroni, and W. Wuensch, “New local field quantity describing the high gradient limit of accelerating structures”. Phys. Rev. ST Accel. Beams 12, 102001 (2009): http://prst-ab.aps.org/pdf/PRSTAB/v12/i10/e102001
[Djurabekova at al.] F. Djurabekova et al., “Multiscale modeling of electrical breakdown at high electric fields”. Talk in the International workshop on Mechanisms of Vacuum Arcs MeVArc, Helsinki, Finland (2011): http://beam.acclab.helsinki.fi/hip/mevarc11/presentations/djurabekova.pdf
Bibliography