Embed Size (px)
Citation preview


Preface
This publication provides aviation data users with summary historical and forecast statistics on passenger demand and aviation activity at U.S. airports. The summary level forecasts are based on individual airport projections.
The Terminal Area Forecast (TAF) includes forecasts for active airports in the National Plan of Integrated Airport Systems (NPIAS). The Federal Aviation Administration’s (FAA) Forecast and Performance Analysis Division, Office of Aviation Policy and Plans, develops the TAF. As its primary input, the TAF initially used the national forecasts of aviation activity contained in FAA Aerospace Forecasts, Fiscal Years 2015-2035. The final TAF considers the forecasts and assumptions contained in FAA Aerospace Forecasts, Fiscal Years 2016-2036. Beginning March, 2016 the tables for the national forecasts can be found at:
http://www.faa.gov/data_research/aviation/aerospace_forecasts/media/2016_National_ Forecast_Report.pdf
The TAF is available on the Internet. The TAF model and TAF database can be accessed at:
http://www.faa.gov/data_research/aviation/taf
The TAF model allows users to create their own forecast scenarios. It contains a query data application that allows the public to access and print historical (1990 to 2014) and forecast (2015 to 2040) aviation activity data by individual airport, state, or FAA region.
The FAA welcomes public comment on the forecasts, as well as suggestions for improving the usefulness of the TAF.
Roger Schaufele, Jr. Manager Forecast and Performance Analysis Division Office of Aviation Policy and Plans
i

Acknowledgements
This document was prepared by the Forecast and Performance Analysis Division of the FAA Office of Aviation Policy and Plans under the direction of Roger Schaufele, Manager, and Michael Lukacs, Deputy Division Manager, Forecast and Performance Analysis Division. The forecasts were prepared by Peter LeBoff, Dipasis Bhadra, Li Ding, Chia-Mei Liu, Anna Barlett, Gary Mihalik, and Katherine Lizotte.
The software support was provided under contract by IT WORKS! Software. We extend a special thanks to Alice Dobrin and Damien Agostinelli whose invaluable programming support for the TAF software made accessing and analyzing this airport data so much more efficient.
Special acknowledgments are made to FAA Airports staff in the Regional and Airport District Offices for their assistance in coordinating the regional reviews, state input, and forecast recommendations. The reviews and comments of the regional offices were extremely important and useful in guiding the Forecast and Performance Analysis Division in making adjustments to the preliminary version of the forecasts. Their efforts have enhanced the accuracy and credibility of the final product.
ii

Table of Contents Preface .......................................................................................................................................................... i
Acknowledgements .................................................................................................................................... ii
Table of Contents ....................................................................................................................................... iii
Summary Historical and Forecast Highlights .......................................................................................... 1
Forecast Process ........................................................................................................................................ 3
Introduction................................................................................................................................................ 3
Forecast Method ....................................................................................................................................... 4
Forecast Review Process ......................................................................................................................... 5
Data Sources ............................................................................................................................................ 5
TAF and National Forecast Summary ....................................................................................................... 7
Near-Term Forecasts ................................................................................................................................ 7
National Forecast Trends .......................................................................................................................... 7
Trends by Region ...................................................................................................................................... 7
Large, Medium, and Small Hubs ............................................................................................................... 8
Core Airports ............................................................................................................................................. 9
TAF and National Forecast Tables .......................................................................................................... 10
Table S-1 Enplanements at Core Airports (in thousands)...................................................................... 11
Graph S-1 Enplanements Growth Rates for the Core Airports, Fiscal Years 2014-2040 ..................... 12
Table S-2 Airport Operations at the Core Airports (in thousands) ......................................................... 13
Graph S-2 Airport Operations Growth Rates for the Core Airports, Fiscal Years 2014-2040 ............... 14
Table S-3 Air Traffic Control Towers and Contract Towers by Region and State ................................. 15
Table S-4 Ranking of Top 100 FAA Towers by Total Enplanements, FY 2014 .................................... 16
Table S-5 Summary of Enplanements and Airport Operations at FAA Towers and Contract Towers .. 19
Table S-6 Commercial Airport Operations Summary by Region* ......................................................... 20
Table S-7 Itinerant Airport Operations Summary by Region* ................................................................ 21
Table S-8 Total Airport Operations Summary by Region* ..................................................................... 22
Table S-9 TRACON Operations Summary by Region ........................................................................... 23
Table S-10 Enplanements Summary by Region* .................................................................................. 24
Table S-11 Based Aircraft Summary by Region* ................................................................................... 25
Appendix A: Description of Activity Measures .................................................................................... 26
Air Carrier Enplanements ........................................................................................................................ 26
Regional Enplanements .......................................................................................................................... 26
iii

Aircraft Operations .................................................................................................................................. 26
Local Operations ..................................................................................................................................... 27
Itinerant Operations ................................................................................................................................. 27
Tracon Operations .................................................................................................................................. 27
Overflights ............................................................................................................................................... 27
Appendix B: List of FAA Towers by Hub Size and FAA Contract Towers ........................................ 28
Table B-1 List of Large Hub Towers ...................................................................................................... 29
Table B-2 List of Medium Hub Towers ................................................................................................... 30
Table B-3 List of Small Hub Towers ...................................................................................................... 31
Table B-4 List of Non-Hub Towers ........................................................................................................ 33
Table B-5 List of FAA Contract Towers ................................................................................................. 40
iv

Summary Historical and Forecast Highlights
• A total of 753.1 million passengers were enplaned at U.S. airports in 2014; FAAand Federal contract towered airports accounted for 748.6 million enplanements.
• The top 100 air carrier airports accounted for 708.5 million enplanements in2014, or 94 percent of total U.S. enplanements.
• FAA towers handled 35.4 million operations (takeoffs and landings) in 2014,including 19.6 million commercial aircraft operations.
• FAA contract towers handled 14.3 million operations in 2014, including 1.8 millioncommercial operations.
• The Core airports1 enplaned 539.0 million passengers in 2014. These airportsare projected to enplane 907.8 million passengers in 2040, a 68.4 percentincrease over the forecast period (or 2.0 percent annually).
• The 30 large hub airports2 enplaned 545.0 million passengers in 2014. Theseairports are projected to enplane 919.0 million passengers in 2040, a 68.6percent increase over the 26-year period (or 2.0 percent annually).
• The 31 medium hub airports3 recorded 116.3 million enplanements in 2014.These airports are projected to enplane 196.6 million passengers in 2040, a 69.1percent increase over the 26-year period (or 2.0 percent annually).
• Atlanta (46.2 million enplanements), Los Angeles (33.9 million), Chicago O’Hare(33.3 million), Dallas/Ft. Worth (30.3 million), and Denver (26.0 million) led U.S.commercial airports in passenger enplanements, accounting for 22.5 percent ofenplanements at U.S. airports.
• Atlanta is projected to remain the country’s busiest airport, as measured bypassenger enplanements, through the forecast period with a projected 78.2million enplaned passengers in 2040. Los Angeles is projected to enplane thesecond most passengers (56.3 million) in 2040, followed by Chicago O’Hare with52.8 million enplanements.
• Enplanements at Seattle, Ft. Lauderdale, and Orlando airports are projected togrow fastest among the Core airports. The annual growth rates at these airports
1 The large hub airports (except Portland) plus Memphis. 2 Airports enplaning one percent or more of total enplanements. 3 Airports enplaning 0.25 to 0.99 percent of total enplanements.
1

are forecast to increase by 2.7, 2.6, and 2.5 percent per year, respectively, over the forecast period.
• In terms of total operations, Chicago O’Hare was the busiest U.S. airport in 2014with 879,000 aircraft operations. Atlanta and Dallas/Ft. Worth were the secondand third busiest airports with 876,000 and 674,000 operations, respectively.
• In 2040, Atlanta is expected to be the busiest airport in the nation, as measuredby total operations, with a projected 1.38 million operations. Chicago O’Hare(1.20 million operations) is projected to drop to second place and Dallas/Ft.Worth (1.05 million operations) is projected to remain in third place.
• The FAA’s Southern region airports enplaned more passengers than any otherregion with 173.8 million passengers in 2014, or 23 percent of U.S.enplanements. The Western Pacific region was second with 154.9 millionenplanements, or 21 percent of the total.
• The Southern region is expected to lead in passenger enplanements in 2040,reaching 297.6 million. The Western Pacific region is projected to stay in secondplace with 263.3 million enplanements.
• The Southern region led all FAA regions in the number of airport operations with22.2 million in 2014. The Southern region is expected to remain first in 2040 with26.3 million operations. The Western Pacific and Great Lakes regions ran secondand third in airport operations in 2014 with 16.7 and 14.9 million, respectively. In2040, the Western Pacific region is projected to remain in second place with 19.5million operations and the Great Lakes region is projected to remain in third placewith 17.0 million operations.
2

Forecast Process
Introduction The Terminal Area Forecast (TAF) contains historical and forecast data for enplanements, airport operations, tracon operations, and based aircraft. The data cover 264 FAA towered airports, 252 Federal contract tower airports, 31 terminal radar approach control facilities, and 2,818 non FAA airports. Data in the TAF are presented on a U.S. Government fiscal year basis (October through September).
The TAF is available on the Internet. The TAF model and TAF database can be accessed at:
http://www.faa.gov/data_research/aviation/taf
The TAF model allows users to create their own forecast scenarios. The TAF database allows public access to historical and forecast aviation activity data by individual airport, state, or FAA region. In addition, links to the TAF from previous years are available via the address noted above.
The TAF is prepared to assist the FAA in meeting its planning, budgeting, and staffing requirements. In addition, state aviation authorities and other aviation planners use the TAF as a basis for planning airport improvements.
This document presents a set of summary tables on airport activity statistics. The airport activity data contained in the TAF consist of the following:
• enplanements (sum of originating and connecting passengers) for air carriersand regionals;
• itinerant operations for air carriers, commuters and air taxis, general aviation(GA), and military aircraft;
• local operations for civil and military aircraft; and• tracon operations for aircraft operations under radar control.
Data on operations presented in the TAF show historical information from 1990 through 2014 and forecasts for 2015 to 2040.4 The historical enplanement information in the TAF model is from 1976 through 2014 and the 2015 figures represent estimates. The enplanement forecasts are from 2016 to 2040. Appendix A provides a detailed description of the activity data elements in the TAF. Appendix B provides a list of FAA airports by hub size and a list of FAA contract towers.
4 Operations data for FAA towers and Federal contract towers for 2015 are actual.
3

Forecast Method The TAF assumes a demand driven forecast for aviation services based upon local and national economic conditions as well as conditions within the aviation industry. In other words, an airport’s forecast is developed independent of the ability of the airport and the air traffic control system to furnish the capacity required to meet demand. However, if the airport historically functions under constrained conditions, the FAA forecast may reflect those constraints since they are embedded in historical data. In statistical terms, the relationships between economic growth data and data representing growth in aviation activity reflect those constraints.
The forecasts of passenger enplanements and commercial operations at airports with more than 100,000 enplanements in FY 2014 are based on a bottoms-up approach. The domestic enplanements are forecast by generating origin and destination (O&D) market demand forecasts using the DB1B (quarterly 10% sample) data to model passenger flow on a quarterly basis. The O&D passenger demand forecasts are based on regression analysis using fares, regional demographics, and regional economic factors as the independent variables. The O&D forecasts are then combined with DOT T-100 segment data to generate passenger forecasts by airport pair and segment pair. The segment pair passenger forecasts are assigned to aircraft equipment in order to produce segment pair operation forecasts. The quarterly segment pair forecasts are aggregated to produce annual airport forecasts.
Separate models are used to forecast international passenger enplanements and operations and cargo operations. The international passenger enplanements are forecast on a quarterly basis using time series analysis and T-100 segment data. The segment pair passenger enplanement forecasts are used to generate segment pair operation forecasts. The cargo operation forecasts are also generated on a quarterly basis using time series analysis and T-100 segment data. The segment pair forecasts for international passenger enplanements and operations and cargo operations are aggregated to the market pair and airport level on an annual basis.
The short run (2 year) forecasts of passenger enplanements and operations for airports with more than 100,000 enplanements in FY 2014 are produced using models at the airport level. These models incorporate the use of future airline schedules.
The forecasts of passenger enplanements at FAA facilities with fewer than 100,000 enplanements in FY 2014 are based on analysis of historic trends. The commercial operations forecasts are based on the enplanement forecasts, trend analysis, and enplanements per operation. In addition the commercial forecasts for these airports may be prorated in comparison to national forecast trends by category.
4

Forecasts of itinerant general aviation operations and local civil operations at FAA facilities are based primarily on time series analysis. Because military operations forecasts have national security implications, the Department of Defense (DOD) provides only limited information on future aviation activity. Hence, the TAF projects military activity at its present level except when FAA has specific knowledge of a change. For instance, DOD may announce a base closing or may shift an Air Force wing from one base to another.
For non-FAA facilities, historic operations in the TAF are from the Form 5010 data. These operations levels are held constant for the forecast unless otherwise specified by a local or regional FAA official.
Forecast Review Process Initially, FAA headquarters staff and management review forecasts for airports with more than 100,000 enplanements in FY 2014 and FAA facilities with fewer than 100,000 enplanements in FY 2014. These preliminary estimates are then submitted to FAA regional and district offices for review. Suggested changes made by the FAA regional staff are reviewed and, if determined reasonable by APO staff economists, are incorporated into the TAF. Significant increases in commercial activity forecasts are normally incorporated into the TAF only where APO receives verifiable evidence of a firm commitment by an air carrier or regional airline to initiate new service.
Summary statistics presented in the TAF differ from the national totals contained in FAA Aerospace Forecasts, Fiscal Years 2016-2036. Reasons for the differences are threefold. First, the TAF forecast methods consider airport and market specific trends. Second, the TAF and national forecast measurements vary. For example, the TAF includes facilities not serviced by the FAA in its totals. These facilities make up a large share of total general aviation operations. In addition, the TAF includes enplanements at U.S. airports only, whereas the national forecast includes enplanements on U.S. airlines at both U.S. and foreign airports. Finally, individual forecasts are not scaled to force aggregates to equal national totals.
Data Sources The development of the TAF begins with an update of the latest historical enplanement, operation, and based aircraft statistics, using information derived from several sources. FAA’s National Flight Data Center provides general airport information such as the airport name, location, and location identifier. Airport operations and tracon (radar assisted) operations data for airports with FAA and Federal contract air traffic control services are reported by FAA air traffic and Federal contract tower staff. Operations at non FAA airports are taken from FAA Form 5010 reports on aviation activity at the
5

airport as estimated by FAA inspectors or information provided by airport managers, state aviation activity surveys, and other sources.
U.S. domestic and international (U.S. and foreign flag carriers) enplanements are derived from the Department of Transportation’s (DOT’s) T-100 database. Regional carrier enplanements are derived from DOT T-100 and 298-C data.5
The origin and destination (O&D) data are based on the Airline Origin and Destination Survey (DB1B). This is a 10 percent sample of airline tickets from carriers reporting to the Office of Airline Information at the Bureau of Transportation Statistics.
Based aircraft data are collected by FAA inspectors, airport managers, and state aviation officials and reported on FAA Form 5010. These data show numbers of aircraft, mostly general aviation aircraft, permanently based at an airport.
5 In October 2002, DOT began collecting data for all airlines using the T-100 format. This change provides more detail on regional airlines, who previously reported on Form 298-C.
6

TAF and National Forecast Summary
Near-Term Forecasts In 2015 total operations at FAA and contract towers increased 0.2 percent, commercial operations increased 0.9 percent, and non-commercial operations decreased 0.3 percent based on OPSNET. Total enplanements at all airports were estimated to increase 3.7 percent in 2015.
In 2016 total operations at towers are forecast to increase 0.9 percent. This forecast increase in total operations at FAA and contract towers is attributable to forecast increases in air carrier (5.4 percent), itinerant general aviation (0.1 percent), and local civil operations (0.7 percent). The forecast increase in air carrier operations (aircraft with more than 60 seats) is attributable, in part, to a shift away from air taxi/commuter operations (aircraft with 60 or fewer seats) as a result of the substitution of larger aircraft for smaller regional jets. Total enplanements at all airports are forecast to increase 2.9 percent in 2016.
National Forecast Trends Trends at individual airports reflect to varying degrees national aviation trends as well as the dynamics at individual airports. The national forecasts for FAA and contract towered airports in FAA Aerospace Forecasts, Fiscal Years 2015-2035 show aircraft operations growing at an average annual rate of 0.9 percent over the 21-year forecast period. Average annual growth rates for this period by user group are as follows: air carrier, 2.7 percent; air taxi/commuter, -1.2 percent; itinerant general aviation, 0.4 percent; and local civil, 0.5 percent. The projected average annual rate of increase for enplanements on U.S. mainline and regional carriers from the national forecast is 2.0 percent over the 21-year forecast period.
Trends by Region There are 264 FAA towers and 252 Federal contract towers in the TAF. California had the most FAA towers with 33, followed by Texas with 19 and Florida with 18. Regions with the most FAA towers were Southern with 51, Great Lakes with 48, and Western Pacific with 46. Table S-3 presents the number of FAA and Federal contract towers by region and state.
Tables S-6 through S-11 summarize airport operations, tracon operations, enplanements, and based aircraft by region from 2011 through 2040. The Southern (22.2 million operations), Western Pacific (16.7 million), and Great Lakes (14.9 million) regions ranked as the top three FAA regions in airport operations in 2014. Operations
7

for all TAF airports totaled 97.4 million. The Northwest Mountain and Southwest regions are projected to be the fastest growing FAA regions from 2014 to 2040 in terms of airport operations, increasing 32 percent and 20 percent, respectively.
The Southern region led FAA regions in passengers enplaned with 173.8 million in 2014, followed by the Western Pacific region with 154.9 million passengers. Enplanements in the Northwest Mountain region are projected to increase the most in percentage terms increasing 75 percent from 2014 to 2040. The next two regions with the fastest projected increase in enplanements are New England (71 percent) and Southern (71 percent).
In 2014, there was a national total of 170,000 based aircraft. Southern (32,200 aircraft), Western Pacific (28,500), and Great Lakes (27,600) ranked as the top three FAA regions.
Large, Medium, and Small Hubs Table S-5 presents passenger enplanements and airport operations at FAA and contract towers by hub size. An airport qualifies as a large hub with one percent or more of total U.S. passenger enplanements. A medium hub airport enplanes from 0.25 to 0.99 percent of total U.S. passenger enplanements while small and non-hub airports enplane from 0.05 to 0.249 percent and less than 0.05 percent, respectively. Appendix B contains a list of hub airports classified by size (large, medium, small, and non-hub) as well as a list of Federal contract towers.
The 30 large hub airports enplaned 545.0 million passengers in 2014 while the 31 medium and 74 small hub airports enplaned 116.3 and 65.4 million passengers, respectively. The 381 non-hub airports enplaned 22.0 million passengers. Enplanements at large hubs are expected to increase at an annual rate of 2.0 percent over the 2014 to 2040 forecast period. Medium and small hub airports are forecast to increase 2.0 percent and 1.7 percent annually, respectively, during the forecast period.
Operations at large hub airports totaled 12.5 million compared to 4.6 million and 6.8 million at medium and small hub airports, respectively. Operations at large hub airports are forecast to increase at an annual rate of 1.6 percent from 2014 to 2040, growing to 18.9 million. Operations at the medium hubs are forecast to rise at an annual rate of 1.3 percent from 2014 to 2040; aircraft operations at small hub airports are forecast to grow 0.8 percent per year.
Non-hub airports accounted for 25.8 million operations or 52 percent of total operations at FAA and Federal contract towers. General aviation aircraft operations accounted for the majority of operations at these smaller airports.
8

Core Airports Table S-1 presents enplanement forecast summaries for the Core airports. Atlanta was the busiest airport in 2014 (46.2 million enplanements), followed by Los Angeles (33.9 million), Chicago O’Hare (33.3 million), and Dallas/Ft. Worth (30.3 million). Atlanta and Los Angeles are forecast to have the strongest growth in enplanements among the top four airports, increasing at an annual rate of 2.0 percent over the 2014 to 2040 forecast period. Dallas/Ft. Worth and Chicago O’Hare are forecast to increase 1.9 and 1.8 percent per year, respectively, over the forecast period. Graph S-1 shows relative enplanements growth over the next 26 years. The four airports with the fastest projected increase are Seattle, Ft. Lauderdale, Orlando, and Boston.
Seattle is projected to make the largest upward movement in ranking of enplanements, from 14th to 9th. LaGuardia is projected to make the largest drop in rankings, going from 20th to 25th.
Table S-2 presents operations forecast summaries for the Core airports. In 2014, FAA controllers at Chicago O’Hare handled 879,000 landings and takeoffs, followed by Atlanta, which totaled 876,000 operations. The next busiest airports were Dallas/Ft. Worth and Los Angeles with 674,000 and 633,000 airport operations, respectively.
In 2040, Atlanta is projected to move into first place with 1.38 million operations. Chicago O’Hare (1.20 million operations) is projected to drop to second place. Dallas/Ft. Worth (1.05 million operations) and Los Angeles (1.01 million operations) are projected to remain in third and fourth place, respectively.
Graph S-2 shows that the five airports projected to grow the fastest in operations are Seattle, Orlando, John F. Kennedy, Ft. Lauderdale, and Miami. John F. Kennedy is expected to move into the list of the top 10 busiest airports; San Francisco is expected to drop out of the top 10 ranking.
9

TAF and National Forecast Tables
10

5
10
15
20
25
30
Table S-1 Enplanements at Core Airports (in thousands)
Airport ranking
2014 Rate** Loc ID Region Airport Name 2014 Percent* 2015 2019 2040 2014-2040 2014 2040
ATL ASO HARTSFIELD - JACKSON ATLANTA INTL 46,227 6.13 48,208 53,430 78,221 2.04 1 1
LAX AWP LOS ANGELES INTL 33,921 4.50 35,425 39,344 56,338 1.97 2 2
ORD AGL CHICAGO O'HARE INTL 33,322 4.42 35,051 37,046 52,837 1.78 3 3
DFW ASW DALLAS/FORT WORTH INTL 30,319 4.02 30,958 32,755 49,590 1.91 4 4
DEN ANM DENVER INTL 25,980 3.44 25,669 28,319 42,524 1.91 6
JFK AEA JOHN F KENNEDY INTL 25,909 3.44 27,083 30,207 46,149 2.24 6 5
SFO AWP SAN FRANCISCO INTL 22,571 2.99 23,555 26,013 38,650 2.09 7 7
CLT ASO CHARLOTTE/DOUGLAS INTL 21,529 2.85 21,583 22,900 33,949 1.76 8 12
LAS AWP MC CARRAN INTL 20,265 2.69 21,117 24,062 37,605 2.40 9 8
PHX AWP PHOENIX SKY HARBOR INTL 20,030 2.65 21,037 22,534 34,326 2.09 10
IAH ASW GEORGE BUSH INTERCONTINENTAL/HOUSTON 19,494 2.58 20,008 20,751 33,370 2.08 11 13
MIA ASO MIAMI INTL 19,479 2.58 20,207 22,366 34,019 2.16 12 11
EWR AEA NEWARK LIBERTY INTL 17,551 2.33 18,344 20,222 30,979 2.20 13 15
SEA ANM SEATTLE-TACOMA INTL 17,414 2.31 19,561 23,437 35,159 2.73 14 9
MCO ASO ORLANDO INTL 17,057 2.26 18,190 21,112 32,642 2.52 14
MSP AGL MINNEAPOLIS-ST PAUL INTL/WOLD-CHAMBERLAIN 16,839 2.23 17,286 18,725 26,373 1.74 16 17
DTW AGL DETROIT METROPOLITAN WAYNE COUNTY 15,777 2.09 15,985 17,651 24,354 1.68 17 18
BOS ANE GENERAL EDWARD LAWRENCE LOGAN INTL 15,229 2.02 15,998 18,596 28,518 2.44 18 16
PHL AEA PHILADELPHIA INTL 14,745 1.95 14,847 15,821 22,800 1.69 19 19
LGA AEA LA GUARDIA 13,324 1.76 13,898 14,584 16,007 0.70 25
FLL ASO FORT LAUDERDALE/HOLLYWOOD INTL 11,724 1.55 12,760 14,822 22,755 2.58 21 20
BWI AEA BALTIMORE/WASHINGTON INTL THURGOOD MARSHALL
10,956 1.45 11,319 12,897 18,717 2.08 22 21
IAD AEA WASHINGTON DULLES INTL 10,416 1.38 10,231 10,438 16,055 1.67 23 24
MDW AGL CHICAGO MIDWAY INTL 10,202 1.35 10,618 11,317 16,354 1.83 24 23
SLC ANM SALT LAKE CITY INTL 9,980 1.32 10,422 11,257 17,077 2.08 22
DCA AEA RONALD REAGAN WASHINGTON NATIONAL 9,825 1.30 10,902 11,990 15,108 1.66 26 27
HNL AWP HONOLULU INTL 9,422 1.25 9,359 9,774 13,437 1.37 27 29
SAN AWP SAN DIEGO INTL 9,190 1.22 9,720 10,648 15,955 2.14 28 26
TPA ASO TAMPA INTL 8,449 1.12 8,935 9,852 14,837 2.18 29 28
MEM ASO MEMPHIS INTL 1,830 0.24 1,824 2,120 3,058 1.99 30
Totals 538,976 71.41 560,100 614,990 907,763 2.02
*Percent of total US enplanements.
**Annual compound growth rate.
11

Graph S-1 Enplanements Growth Rates for the Core
Airports Fiscal Years 2014 to 2040
12

5
10
15
20
25
30
Table S-2 Airport Operations at the Core Airports (in thousands)
2014 Rate** Airport ranking
Loc ID Region Airport Name 2014 Percent* 2015 2019 2040 2014-2040 2014 2040
ORD AGL CHICAGO O'HARE INTL 879 0.90 881 891 1,197 1.19 1 2
ATL ASO HARTSFIELD - JACKSON ATLANTA INTL 876 0.89 877 958 1,376 1.75 2 1
DFW ASW DALLAS/FORT WORTH INTL 674 0.69 684 720 1,045 1.70 3 3
LAX AWP LOS ANGELES INTL 633 0.65 648 706 1,015 1.82 4 4
DEN ANM DENVER INTL 579 0.59 551 590 870 1.57 5
CLT ASO CHARLOTTE/DOUGLAS INTL 547 0.56 546 572 788 1.41 6 7
LAS AWP MC CARRAN INTL 523 0.53 521 571 823 1.76 7 6
IAH ASW GEORGE BUSH INTERCONTINENTAL/HOUSTON 504 0.51 508 502 765 1.62 8 8
SFO AWP SAN FRANCISCO INTL 432 0.44 429 447 639 1.52 9 13
PHX AWP PHOENIX SKY HARBOR INTL 430 0.44 438 473 691 1.83 10
JFK AEA JOHN F KENNEDY INTL 426 0.43 443 498 757 2.24 11 9
PHL AEA PHILADELPHIA INTL 420 0.43 413 429 571 1.18 12 18
MSP AGL MINNEAPOLIS-ST PAUL INTL/WOLD-CHAMBERLAIN 418 0.42 405 422 576 1.24 13 17
EWR AEA NEWARK LIBERTY INTL 404 0.41 414 438 619 1.65 14 14
MIA ASO MIAMI INTL 401 0.41 409 456 690 2.11 11
DTW AGL DETROIT METROPOLITAN WAYNE COUNTY 400 0.41 380 419 590 1.50 16 16
LGA AEA LA GUARDIA 370 0.38 369 387 387 0.17 17 24
BOS ANE GENERAL EDWARD LAWRENCE LOGAN INTL 369 0.37 372 419 596 1.86 18 15
SEA ANM SEATTLE-TACOMA INTL 332 0.34 372 448 653 2.63 19 12
SLC ANM SALT LAKE CITY INTL 325 0.33 315 324 446 1.22 20
IAD AEA WASHINGTON DULLES INTL 319 0.32 299 300 429 1.14 21 22
HNL AWP HONOLULU INTL 306 0.31 314 318 411 1.13 22 23
MCO ASO ORLANDO INTL 295 0.30 311 351 533 2.29 23 19
DCA AEA RONALD REAGAN WASHINGTON NATIONAL 287 0.29 296 307 308 0.27 24 28
FLL ASO FORT LAUDERDALE/HOLLYWOOD INTL 255 0.26 275 307 445 2.17 21
MDW AGL CHICAGO MIDWAY INTL 249 0.25 254 266 361 1.44 26 26
BWI AEA BALTIMORE/WASHINGTON INTL THURGOOD MARSHALL 247 0.25 245 273 384 1.70 27 25
MEM ASO MEMPHIS INTL 220 0.22 220 230 320 1.44 28 27
SAN AWP SAN DIEGO INTL 189 0.19 195 210 308 1.89 29 29
TPA ASO TAMPA INTL 184 0.18 190 203 294 1.81 30
Totals 12,493 12.70 12,574 13,435 18,887 1.60
*Percent of total US operations.
**Annual compound growth rate.
13

GraphS-2AirportOperationsGrowthRatesforthe Core Airports Fiscal Years 2014 to 2040
14

Table S-3 Air Traffic Control Towers and Contract Towers by Region and State
FAA Contract FAA Contract Region/State Towers Towers Region/State Towers Towers
Alaskan Region Northwest Mountain Region
Alaska 4 4 Colorado 6 3
Regional Total 4 4 Idaho 2 4
Montana 3 3
Central Region Oregon 3 7
Iowa 4 1 Utah 1 2
Kansas 1 8 Washington 6 7
Missouri 5 5 Wyoming 1 2
Nebraska 2 1 Regional Total 22 28
Regional Total 12 15 Southern Region
Eastern Region Alabama 4 3
Delaware 1 0 Florida 18 25
District of Columbia 3 0 Georgia 5 6
Maryland 2 5 Kentucky 4 2
New Jersey 5 1 Mississippi 2 7
New York 12 5 North Carolina 6 5
Pennsylvania 9 5 Puerto Rico 1 2
Virginia 4 2 South Carolina 5 4
West Virginia 3 4 Tennessee 5 3
Virgin Islands 1 1 Regional Total 39 22
Regional Total 51 58
Great Lakes Region
Illinois 11 6 Southwestern Region
Indiana 6 4 Arkansas 2 5
Michigan 11 4 Louisiana 7 5
Minnesota 6 2 New Mexico 2 4
North Dakota 3 1 Oklahoma 3 6
Ohio 7 5 Texas 19 23
South Dakota 1 1 Regional Total 33 43
Wisconsin 3 9
Regional Total 48 32 Western Pacific Region
Arizona 7 7
New England Region California 33 20
Connecticut 1 6 Guam 0 1
Maine 2 0 Hawaii 3 4
Massachusetts 3 8 Nevada 3 1
New Hampshire 1 2 Northern Mariana Isl 0 1
Rhode Island 1 0 Regional Total 46 34
Vermont 1 0
Regional Total 9 16
Grand Total 264 252
15

5
10
15
20
25
30
35
40
Table S-4 Ranking of Top 100 FAA Towers by Total Enplanements, FY 2014
Location Enplaned Percent Cumulative Cumulative Commercial Cumulative Rank City State Identifier Passengers* of Total** Enplanements Percentage Operations*** Operations
1 ATLANTA GA ATL 46,226,883 6.13 46,226,883 6.13 868,547 868,547 2 LOS ANGELES CA LAX 33,920,890 4.50 80,147,773 10.64 612,873 1,481,420 3 CHICAGO IL ORD 33,322,123 4.42 113,469,896 15.06 871,638 2,353,058 4 DALLAS-FORT WORTH TX DFW 30,318,969 4.02 143,788,865 19.09 666,257 3,019,315
DENVER CO DEN 25,979,988 3.44 169,768,853 22.54 574,317 3,593,632
6 NEW YORK NY JFK 25,908,734 3.44 195,677,587 25.98 417,975 4,011,607 7 SAN FRANCISCO CA SFO 22,571,283 2.99 218,248,870 28.98 416,056 4,427,663 8 CHARLOTTE NC CLT 21,528,753 2.85 239,777,623 31.84 519,160 4,946,823 9 LAS VEGAS NV LAS 20,265,489 2.69 260,043,112 34.53 469,499 5,416,322
PHOENIX AZ PHX 20,030,285 2.65 280,073,397 37.19 407,522 5,823,844
11 HOUSTON TX IAH 19,494,062 2.58 299,567,459 39.78 491,539 6,315,383 12 MIAMI FL MIA 19,479,065 2.58 319,046,524 42.36 381,609 6,696,992 13 NEWARK NJ EWR 17,550,823 2.33 336,597,347 44.69 393,095 7,090,087 14 SEATTLE WA SEA 17,413,997 2.31 354,011,344 47.00 328,274 7,418,361
ORLANDO FL MCO 17,056,548 2.26 371,067,892 49.27 279,487 7,697,848
16 MINNEAPOLIS MN MSP 16,838,805 2.23 387,906,697 51.51 403,891 8,101,739 17 DETROIT MI DTW 15,776,910 2.09 403,683,607 53.60 393,268 8,495,007 18 BOSTON MA BOS 15,229,066 2.02 418,912,673 55.62 352,435 8,847,442 19 PHILADELPHIA PA PHL 14,744,570 1.95 433,657,243 57.58 405,770 9,253,212
NEW YORK NY LGA 13,324,196 1.76 446,981,439 59.35 363,316 9,616,528
21 FORT LAUDERDALE FL FLL 11,723,833 1.55 458,705,272 60.91 218,797 9,835,325 22 BALTIMORE MD BWI 10,955,816 1.45 469,661,088 62.36 228,226 10,063,551 23 WASHINGTON DC IAD 10,415,850 1.38 480,076,938 63.75 278,417 10,341,968 24 CHICAGO IL MDW 10,202,117 1.35 490,279,055 65.10 211,190 10,553,158
SALT LAKE CITY UT SLC 9,980,042 1.32 500,259,097 66.43 264,679 10,817,837
26 WASHINGTON DC DCA 9,825,263 1.30 510,084,360 67.73 279,931 11,097,768 27 HONOLULU HI HNL 9,422,406 1.25 519,506,766 68.98 234,594 11,332,362 28 SAN DIEGO CA SAN 9,190,322 1.22 528,697,088 70.20 179,690 11,512,052 29 TAMPA FL TPA 8,448,779 1.12 537,145,867 71.32 162,059 11,674,111
PORTLAND OR PDX 7,842,533 1.04 544,988,400 72.36 194,981 11,869,092
31 ST LOUIS MO STL 6,131,193 0.81 551,119,593 73.18 174,267 12,043,359 32 HOUSTON TX HOU 5,796,332 0.76 556,915,925 73.95 149,964 12,193,323 33 NASHVILLE TN BNA 5,308,229 0.70 562,224,154 74.65 142,761 12,336,084 34 AUSTIN TX AUS 5,133,878 0.68 567,358,032 75.34 120,999 12,457,083
OAKLAND CA OAK 4,959,534 0.65 572,317,566 75.99 125,416 12,582,499
36 KANSAS CITY MO MCI 4,925,002 0.65 577,242,568 76.65 122,695 12,705,194 37 NEW ORLEANS LA MSY 4,785,909 0.63 582,028,477 77.28 110,382 12,815,576 38 RALEIGH/DURHAM NC RDU 4,616,354 0.61 586,644,831 77.90 135,699 12,951,275 39 SANTA ANA CA SNA 4,556,168 0.60 591,200,999 78.50 94,633 13,045,908
SAN JOSE CA SJC 4,546,045 0.60 595,747,044 79.11 110,982 13,156,890
16

Table S-4 Ranking of Top 100 FAA Towers by Total Enplanements, FY 2014
Location Enplaned Percent Cumulative Cumulative Commercial Cumulative Rank City State Identifier Passengers* of Total** Enplanements Percentage Operations*** Operations
41 SACRAMENTO CA SMF 4,338,637 0.57 600,085,681 79.68 95,496 13,252,386 42 SAN JUAN PR SJU 4,160,003 0.55 604,245,684 80.23 130,527 13,382,913 43 DALLAS TX DAL 4,157,154 0.55 608,402,838 80.79 118,457 13,501,370 44 SAN ANTONIO TX SAT 4,049,550 0.53 612,452,388 81.32 115,086 13,616,456 45 FORT MYERS FL RSW 3,895,910 0.51 616,348,298 81.84 68,888 13,685,344
46 CLEVELAND OH CLE 3,895,511 0.51 620,243,809 82.36 138,348 13,823,692 47 PITTSBURGH PA PIT 3,812,558 0.50 624,056,367 82.86 118,077 13,941,769 48 INDIANAPOLIS IN IND 3,593,746 0.47 627,650,113 83.34 135,824 14,077,593 49 MILWAUKEE WI MKE 3,255,921 0.43 630,906,034 83.77 99,826 14,177,419 50 COLUMBUS OH CMH 3,102,511 0.41 634,008,545 84.19 103,540 14,280,959
51 KAHULUI HI OGG 2,960,703 0.39 636,969,248 84.58 107,708 14,388,667 52 WEST PALM BEACH FL PBI 2,899,497 0.38 639,868,745 84.96 77,863 14,466,530 53 WINDSOR LOCKS CT BDL 2,892,228 0.38 642,760,973 85.35 79,359 14,545,889 54 COVINGTON KY CVG 2,817,237 0.37 645,578,210 85.72 127,768 14,673,657 55 JACKSONVILLE FL JAX 2,576,796 0.34 648,155,006 86.06 69,704 14,743,361
56 BUFFALO NY BUF 2,425,809 0.32 650,580,815 86.39 73,526 14,816,887 57 ALBUQUERQUE NM ABQ 2,384,366 0.31 652,965,181 86.70 81,177 14,898,064 58 ANCHORAGE AK ANC 2,331,137 0.30 655,296,318 87.01 179,061 15,077,125 59 OMAHA NE OMA 2,018,566 0.26 657,314,884 87.28 69,625 15,146,750 60 ONTARIO CA ONT 2,013,354 0.26 659,328,238 87.55 67,218 15,213,968
61 BURBANK CA BUR 1,916,918 0.25 661,245,156 87.80 61,269 15,275,237 62 MEMPHIS TN MEM 1,830,244 0.24 663,075,400 88.05 195,554 15,470,791 63 OKLAHOMA CITY OK OKC 1,829,831 0.24 664,905,231 88.29 59,627 15,530,418 64 PROVIDENCE RI PVD 1,793,153 0.23 666,698,384 88.53 44,998 15,575,416 65 LOUISVILLE KY SDF 1,654,189 0.21 668,352,573 88.75 133,388 15,708,804
66 RICHMOND VA RIC 1,647,904 0.21 670,000,477 88.97 65,344 15,774,148 67 RENO NV RNO 1,609,450 0.21 671,609,927 89.18 47,016 15,821,164 68 TUCSON AZ TUS 1,580,741 0.20 673,190,668 89.39 49,879 15,871,043 69 NORFOLK VA ORF 1,512,223 0.20 674,702,891 89.59 53,886 15,924,929 70 CHARLESTON SC CHS 1,507,877 0.20 676,210,768 89.79 53,301 15,978,230
71 GUAM GU GUM 1,439,378 0.19 677,650,146 89.98 26,212 16,004,442 72 SPOKANE WA GEG 1,436,045 0.19 679,086,191 90.17 43,259 16,047,701 73 EL PASO TX ELP 1,392,291 0.18 680,478,482 90.36 54,083 16,101,784 74 KAILUA/KONA HI KOA 1,387,060 0.18 681,865,542 90.54 46,047 16,147,831 75 LONG BEACH CA LGB 1,384,977 0.18 683,250,519 90.72 32,553 16,180,384
76 TULSA OK TUL 1,363,696 0.18 684,614,215 90.91 51,581 16,231,965 77 BOISE ID BOI 1,349,518 0.17 685,963,733 91.09 46,668 16,278,633 78 LIHUE HI LIH 1,303,431 0.17 687,267,164 91.26 89,700 16,368,333 79 BIRMINGHAM AL BHM 1,298,859 0.17 688,566,023 91.43 49,200 16,417,533 80 ALBANY NY ALB 1,200,254 0.15 689,766,277 91.59 44,890 16,462,423
17

Table S-4 Ranking of Top 100 FAA Towers by Total Enplanements, FY 2014
Location Enplaned Percent Cumulative Cumulative Commercial Cumulative Rank City State Identifier Passengers* of Total** Enplanements Percentage Operations*** Operations
81 ROCHESTER NY ROC 1,180,241 0.15 690,946,518 91.75 46,453 16,508,876 82 GRAND RAPIDS MI GRR 1,162,367 0.15 692,108,885 91.90 41,229 16,550,105 83 DAYTON OH DAY 1,150,047 0.15 693,258,932 92.05 42,224 16,592,329 84 DES MOINES IA DSM 1,127,813 0.14 694,386,745 92.20 42,068 16,634,397 85 MANCHESTER NH MHT 1,066,804 0.14 695,453,549 92.35 39,527 16,673,924
86 LITTLE ROCK AR LIT 1,010,926 0.13 696,464,475 92.48 37,762 16,711,686 87 SYRACUSE NY SYR 988,540 0.13 697,453,015 92.61 44,775 16,756,461 88 ORLANDO FL SFB 979,332 0.13 698,432,347 92.74 35,331 16,791,792 89 GREER SC GSP 940,676 0.12 699,373,023 92.87 34,796 16,826,588 90 PALM SPRINGS CA PSP 931,385 0.12 700,304,408 92.99 32,714 16,859,302
91 SAVANNAH GA SAV 894,992 0.11 701,199,400 93.11 37,904 16,897,206 92 MYRTLE BEACH SC MYR 858,699 0.11 702,058,099 93.22 132,662 17,029,868 93 GREENSBORO NC GSO 851,406 0.11 702,909,505 93.34 45,374 17,075,242 94 KNOXVILLE TN TYS 844,369 0.11 703,753,874 93.45 41,754 17,116,996 95 PORTLAND ME PWM 837,494 0.11 704,591,368 93.56 29,928 17,146,924
96 MADISON WI MSN 828,052 0.10 705,419,420 93.67 33,036 17,179,960 97 AKRON OH CAK 785,436 0.10 706,204,856 93.77 27,858 17,207,818 98 PENSACOLA FL PNS 756,102 0.10 706,960,958 93.87 25,997 17,233,815 99 WICHITA KS ICT 754,954 0.10 707,715,912 93.97 38,950 17,272,765
100 WHITE PLAINS NY HPN 739,517 0.09 708,455,429 94.07 64,502 17,337,267
Total of airports 101 thru 516 40,169,457 5.365 748,624,886 99.44 4,117,212 21,454,479 *Enplanements include air carrier, commuter and international.**Percent is of national total enplanements. ***Operations include itinerant air carrier and air taxi only.
18

Table S-5 Summary of Enplanements and Airport Operations at FAA Towers and Contract Towers
Enplanements at Towered Airports Annual
Compound Growth Rate
Count 2014 2040 2014-2040
Large Hubs 30 544,988,400 919,039,976 2.03 Medium Hubs 31 116,256,756 196,629,411 2.04 Small Hubs 74 65,390,783 102,061,171 1.72 Non Hub Towers 381 21,988,947 31,258,983 1.36
Total 516 748,624,886 1,248,989,541 1.98
Operations at Towered Airports Annual
Compound Growth Rate
Count 2014 2040 2014-2040
Large Hubs 30 12,492,382 18,918,436 1.60 Medium Hubs 31 4,571,577 6,465,915 1.34 Small Hubs 74 6,769,418 8,260,444 0.76 Non Hub Towers 381 25,790,516 28,484,067 0.38
Total 516 49,623,893 62,128,862 0.86
19

Table S-6 Commercial Airport Operations Summary by Region*
Northwest Western Fiscal Year
Alaska (AAL)
Central (ACE)
Eastern (AEA)
Great Lakes (AGL)
New England (ANE)
Mountain (ANM)
Southern (ASO)
Southwest (ASW)
Pacific (AWP)
National Total
Historical 2011
2012
2013
2014
Forecast 2015
966,993
978,538
973,892
975,078
1,004,919
753,863
750,262
728,014
722,148
710,799
3,752,492
3,748,561
3,650,772
3,584,168
3,576,540
3,930,017
3,801,157
3,769,368
3,672,972
3,606,790
999,862
984,577
954,733
939,378
918,057
2,474,806
2,357,975
2,295,774
2,296,273
2,279,325
5,229,181
5,157,408
5,103,800
5,040,093
5,251,022
2,728,233
2,705,244
2,730,735
2,723,520
2,713,861
4,276,445
4,402,743
4,385,286
4,462,686
4,551,906
25,111,892
24,886,465
24,592,374
24,416,316
24,613,219
2016
2017
2018
2019
2020
1,012,602
1,018,599
1,024,568
1,030,549
1,036,762
716,428
725,792
734,121
742,538
752,283
3,624,701
3,684,522
3,731,872
3,771,852
3,814,094
3,620,855
3,669,060
3,709,451
3,748,782
3,795,013
939,837
951,871
962,113
972,621
984,587
2,359,807
2,403,140
2,442,417
2,483,557
2,531,145
5,398,769
5,491,298
5,573,569
5,657,441
5,753,423
2,691,752
2,741,073
2,785,689
2,831,018
2,883,195
4,604,115
4,683,219
4,759,248
4,835,347
4,920,723
24,968,866
25,368,574
25,723,048
26,073,705
26,471,225
2021
2022
2023
2024
2025
1,042,901
1,048,781
1,054,576
1,060,271
1,065,979
761,822
770,099
778,399
787,783
797,238
3,854,625
3,886,250
3,922,974
3,971,812
4,023,411
3,838,412
3,873,168
3,911,508
3,961,090
4,012,941
995,967
1,005,650
1,015,761
1,028,392
1,041,376
2,575,275
2,613,781
2,652,278
2,693,151
2,733,212
5,847,603
5,930,805
6,015,668
6,108,610
6,202,909
2,934,458
2,978,795
3,023,384
3,072,205
3,121,961
5,005,305
5,084,886
5,159,236
5,234,027
5,308,905
26,856,368
27,192,215
27,533,784
27,917,341
28,307,932
2026
2027
2028
2029
2030
1,071,931
1,077,966
1,083,968
1,089,913
1,095,931
807,093
817,134
827,049
837,009
847,010
4,076,761
4,130,775
4,183,685
4,235,860
4,288,139
4,067,354
4,122,286
4,176,008
4,229,782
4,283,403
1,054,749
1,069,386
1,082,921
1,097,078
1,110,932
2,773,720
2,816,062
2,859,299
2,901,130
2,942,003
6,301,030
6,400,401
6,499,330
6,597,588
6,696,017
3,173,323
3,224,435
3,275,507
3,326,855
3,378,810
5,387,187
5,465,553
5,544,529
5,623,345
5,702,894
28,713,148
29,123,998
29,532,296
29,938,560
30,345,139
2031
2032
2033
2034
2035
1,101,934
1,108,019
1,114,245
1,120,603
1,127,176
857,123
867,315
878,102
889,359
900,860
4,340,052
4,392,510
4,446,921
4,504,208
4,562,449
4,336,564
4,390,655
4,447,574
4,507,049
4,567,733
1,124,337
1,137,976
1,152,325
1,166,830
1,182,101
2,984,521
3,030,097
3,074,946
3,122,507
3,172,263
6,795,516
6,899,298
7,007,168
7,118,538
7,231,261
3,431,269
3,486,556
3,543,841
3,602,964
3,662,550
5,782,204
5,864,457
5,948,884
6,036,548
6,125,042
30,753,520
31,176,883
31,614,006
32,068,606
32,531,435
2036
2037
2038
2039
2040
1,133,842
1,140,606
1,147,548
1,154,640
1,161,792
912,439
923,950
935,447
946,946
958,497
4,621,952
4,680,311
4,740,548
4,799,639
4,858,518
4,629,903
4,691,544
4,753,741
4,815,718
4,878,156
1,197,546
1,212,279
1,228,176
1,243,631
1,259,019
3,221,492
3,269,157
3,317,914
3,368,364
3,417,786
7,344,661
7,455,814
7,568,536
7,680,618
7,792,382
3,721,472
3,779,759
3,837,293
3,894,167
3,951,388
6,214,368
6,304,492
6,396,984
6,486,504
6,577,258
32,997,675
33,457,912
33,926,187
34,390,227
34,854,796
*Includes air carrier and commuter/air taxi operations at all airports.
20

Table S-7 Itinerant Airport Operations Summary by Region*
Northwest Western Fiscal Year
Alaska (AAL)
Central (ACE)
Eastern (AEA)
Great Lakes (AGL)
New England (ANE)
Mountain (ANM)
Southern (ASO)
Southwest (ASW)
Pacific (AWP)
National Total
Historical 2011
2012
2013
2014
Forecast 2015
1,512,164
1,515,204
1,505,447
1,509,699
1,539,699
2,671,104
2,690,523
2,618,381
2,555,492
2,537,278
7,192,883
7,191,580
6,878,525
6,796,127
6,755,233
9,136,845
8,993,370
8,820,646
8,614,373
8,541,554
2,308,904
2,317,060
2,209,568
2,171,164
2,118,308
6,548,769
6,434,950
6,315,070
6,203,884
6,236,499
14,711,588
14,620,128
14,506,854
14,364,861
14,591,647
7,980,812
7,678,646
7,773,617
7,614,454
7,610,837
10,492,556
10,550,620
10,465,233
10,627,242
10,721,243
62,555,625
61,992,081
61,093,341
60,457,296
60,652,298
2016
2017
2018
2019
2020
1,548,241
1,555,503
1,562,748
1,570,016
1,577,528
2,542,823
2,553,597
2,563,339
2,573,181
2,584,355
6,786,794
6,856,954
6,914,773
6,965,338
7,018,298
8,572,040
8,632,191
8,684,671
8,736,128
8,794,635
2,131,568
2,144,595
2,155,831
2,167,337
2,180,307
6,344,578
6,421,550
6,495,018
6,570,917
6,653,658
14,751,870
14,864,966
14,968,073
15,073,054
15,190,427
7,628,450
7,696,889
7,760,946
7,826,020
7,898,257
10,789,490
10,880,779
10,969,104
11,057,603
11,155,487
61,095,854
61,607,024
62,074,503
62,539,594
63,052,952
2021
2022
2023
2024
2025
1,584,977
1,592,181
1,599,311
1,606,353
1,613,419
2,595,333
2,605,056
2,614,808
2,625,654
2,636,578
7,069,680
7,112,282
7,160,121
7,220,212
7,283,196
8,850,453
8,897,796
8,948,880
9,011,247
9,076,050
2,192,693
2,203,384
2,214,507
2,228,154
2,242,156
6,733,349
6,808,013
6,883,301
6,961,751
7,040,065
15,306,272
15,411,433
15,518,548
15,634,056
15,751,220
7,969,934
8,035,018
8,100,644
8,170,840
8,242,380
11,252,683
11,344,992
11,432,185
11,519,937
11,607,888
63,555,374
64,010,155
64,472,305
64,978,204
65,492,952
2026
2027
2028
2029
2030
1,620,741
1,628,160
1,635,561
1,642,918
1,650,361
2,647,908
2,659,431
2,670,835
2,682,292
2,693,803
7,348,072
7,413,761
7,478,487
7,542,628
7,606,758
9,143,610
9,211,891
9,279,161
9,346,718
9,414,334
2,256,549
2,272,213
2,286,779
2,301,974
2,316,869
7,119,545
7,201,634
7,285,415
7,368,592
7,451,633
15,872,517
15,995,359
16,118,084
16,240,463
16,363,351
8,315,898
8,389,539
8,463,535
8,538,187
8,613,870
11,699,368
11,791,054
11,883,473
11,975,868
12,069,117
66,024,208
66,563,042
67,101,330
67,639,640
68,180,096
2031
2032
2033
2034
2035
1,657,801
1,665,339
1,673,031
1,680,868
1,688,934
2,705,442
2,717,173
2,729,513
2,742,335
2,755,417
7,670,683
7,735,307
7,802,053
7,871,840
7,942,751
9,481,710
9,550,252
9,621,847
9,696,245
9,772,087
2,331,316
2,346,000
2,361,396
2,376,953
2,393,281
7,537,165
7,626,624
7,716,242
7,809,475
7,905,860
16,487,647
16,616,578
16,749,949
16,887,170
17,026,106
8,690,472
8,770,314
8,852,588
8,937,138
9,022,600
12,162,257
12,258,479
12,357,015
12,458,927
12,561,814
68,724,493
69,286,066
69,863,634
70,460,951
71,068,850
2036
2037
2038
2039
2040
1,697,107
1,705,394
1,713,871
1,722,514
1,731,233
2,768,593
2,781,716
2,794,843
2,807,985
2,821,199
8,015,098
8,086,475
8,159,899
8,232,353
8,304,771
9,849,657
9,926,952
10,005,064
10,083,223
10,162,104
2,409,784
2,425,579
2,442,541
2,459,064
2,475,526
8,002,685
8,098,903
8,197,222
8,298,280
8,399,359
17,166,094
17,304,213
17,444,286
17,584,122
17,724,043
9,107,878
9,192,990
9,277,833
9,362,508
9,448,042
12,665,676
12,770,494
12,877,829
12,982,344
13,088,264
71,682,572
72,292,716
72,913,388
73,532,393
74,154,541
*Includes itinerant air carrier, commuter/air taxi, general aviation and military operations at all airports.
21

Table S-8 Total Airport Operations Summary by Region*
Northwest Western Fiscal Year
Alaska (AAL)
Central (ACE)
Eastern (AEA)
Great Lakes (AGL)
New England (ANE)
Mountain (ANM)
Southern (ASO)
Southwest (ASW)
Pacific (AWP)
National Total
Historical 2011
2012
2013
2014
Forecast 2015
1,846,387
1,843,881
1,838,141
1,841,688
1,859,488
4,673,290
4,740,615
4,657,963
4,557,087
4,539,088
11,269,548
11,169,965
10,820,264
10,687,236
10,573,504
15,821,010
15,649,076
15,305,889
14,939,552
14,881,298
3,728,948
3,766,936
3,561,861
3,475,019
3,374,419
10,533,555
10,346,539
10,167,585
10,066,210
10,203,071
22,409,048
22,273,778
22,318,112
22,163,485
22,418,477
13,397,406
13,033,449
13,066,676
12,961,740
12,992,442
16,392,212
16,445,328
16,398,906
16,685,281
16,776,140
100,071,404
99,269,567
98,135,397
97,377,298
97,617,927
2016
2017
2018
2019
2020
1,861,867
1,869,651
1,877,424
1,885,222
1,893,267
4,549,145
4,561,464
4,572,762
4,584,173
4,596,925
10,607,165
10,694,210
10,769,145
10,837,062
10,907,921
14,922,302
15,001,641
15,073,522
15,144,556
15,222,893
3,376,562
3,390,450
3,402,551
3,414,926
3,428,767
10,372,921
10,478,730
10,581,551
10,687,240
10,800,383
22,612,714
22,750,355
22,878,351
23,008,580
23,151,581
13,049,665
13,140,200
13,226,715
13,314,629
13,410,066
16,876,246
16,981,369
17,083,639
17,186,191
17,298,244
98,228,587
98,868,070
99,465,660
100,062,579
100,710,047
2021
2022
2023
2024
2025
1,901,252
1,908,994
1,916,666
1,924,254
1,931,870
4,609,491
4,620,820
4,632,189
4,644,661
4,657,224
10,976,893
11,037,627
11,103,851
11,182,591
11,264,496
15,298,741
15,366,371
15,437,967
15,520,971
15,606,661
3,442,029
3,453,600
3,465,607
3,480,139
3,495,030
10,910,902
11,016,872
11,124,044
11,234,927
11,346,225
23,293,409
23,424,930
23,558,791
23,701,423
23,846,118
13,505,352
13,594,430
13,684,448
13,779,462
13,876,225
17,409,720
17,516,417
17,618,115
17,720,489
17,823,182
101,347,789
101,940,061
102,541,678
103,188,917
103,847,031
2026
2027
2028
2029
2030
1,939,746
1,947,722
1,955,684
1,963,604
1,971,613
4,670,208
4,683,395
4,696,481
4,709,632
4,722,851
11,348,567
11,433,737
11,518,222
11,602,420
11,686,620
15,695,403
15,785,170
15,874,230
15,963,908
16,053,966
3,510,319
3,526,881
3,542,349
3,558,448
3,574,255
11,459,318
11,575,670
11,694,390
11,813,181
11,932,556
23,995,339
24,146,528
24,298,043
24,449,639
24,602,169
13,975,406
14,075,153
14,175,709
14,277,382
14,380,583
17,929,522
18,036,190
18,143,718
18,251,352
18,359,966
104,523,828
105,210,446
105,898,826
106,589,566
107,284,579
2031
2032
2033
2034
2035
1,979,626
1,987,739
1,996,011
2,004,433
2,013,087
4,736,210
4,749,680
4,763,769
4,778,358
4,793,221
11,770,907
11,856,203
11,943,945
12,035,046
12,127,597
16,144,109
16,235,757
16,330,795
16,428,996
16,528,989
3,589,617
3,605,220
3,621,539
3,638,021
3,655,280
12,055,143
12,182,402
12,310,587
12,443,160
12,579,692
24,756,550
24,916,019
25,080,402
25,249,098
25,420,003
14,485,182
14,593,511
14,704,789
14,818,869
14,934,397
18,468,604
18,580,449
18,694,743
18,812,552
18,931,462
107,985,948
108,706,980
109,446,580
110,208,533
110,983,728
2036
2037
2038
2039
2040
2,021,851
2,030,733
2,039,808
2,049,053
2,058,379
4,808,193
4,823,127
4,838,081
4,853,069
4,868,148
12,221,912
12,315,605
12,411,690
12,507,171
12,602,971
16,631,070
16,733,248
16,836,611
16,940,427
17,045,343
3,672,718
3,689,451
3,707,355
3,724,825
3,742,237
12,717,499
12,855,539
12,996,570
13,141,228
13,286,850
25,592,474
25,763,565
25,937,114
26,110,970
26,285,440
15,050,274
15,166,532
15,283,086
15,400,045
15,518,459
19,051,488
19,172,603
19,296,380
19,417,480
19,540,131
111,767,479
112,550,403
113,346,695
114,144,268
114,947,958
*Includes all itinerant and local operations at all airports.
22

Table S-9 TRACON Operations Summary by Region
Northwest Western Fiscal Year
Alaska (AAL)
Central (ACE)
Eastern (AEA)
Great Lakes (AGL)
New England (ANE)
Mountain (ANM)
Southern (ASO)
Southwest (ASW)
Pacific (AWP)
National Total
Historical 2011
2012
2013
2014
Forecast 2015
372,753
367,648
358,581
359,662
370,069
1,313,121
1,318,638
1,239,629
1,223,564
1,220,302
5,935,900
5,918,379
5,676,943
5,629,251
5,657,365
5,461,079
5,386,757
5,215,434
5,072,721
5,022,396
1,467,058
1,397,435
1,363,177
1,356,804
1,341,910
2,932,576
2,840,736
2,775,624
2,834,102
2,860,833
9,476,742
9,277,018
9,179,526
9,005,002
9,230,649
5,316,833
5,214,290
5,160,831
5,132,931
5,150,627
6,019,093
6,057,072
6,014,158
6,208,864
6,338,774
38,295,155
37,777,973
36,983,903
36,822,901
37,192,925
2016
2017
2018
2019
2020
372,427
375,846
379,209
382,480
385,971
1,220,771
1,231,138
1,239,667
1,247,992
1,257,702
5,683,363
5,748,909
5,798,396
5,838,486
5,881,552
5,038,971
5,091,283
5,132,203
5,170,669
5,216,614
1,365,890
1,378,797
1,388,687
1,398,333
1,409,491
2,924,993
2,967,806
3,005,777
3,045,079
3,090,487
9,341,713
9,447,796
9,538,918
9,630,207
9,734,601
5,119,669
5,177,837
5,230,140
5,282,837
5,342,814
6,387,070
6,473,419
6,554,484
6,635,106
6,725,632
37,454,867
37,892,831
38,267,481
38,631,189
39,044,864
2021
2022
2023
2024
2025
389,386
392,588
395,737
398,764
401,805
1,266,702
1,273,573
1,281,472
1,292,275
1,303,571
5,921,438
5,948,207
5,984,911
6,042,555
6,105,023
5,257,587
5,285,912
5,322,020
5,377,187
5,436,490
1,419,517
1,426,624
1,435,706
1,449,845
1,464,941
3,133,897
3,171,026
3,208,910
3,250,494
3,291,602
9,834,713
9,918,341
10,009,150
10,118,257
10,231,052
5,401,357
5,451,677
5,503,241
5,561,074
5,620,271
6,814,159
6,895,251
6,973,495
7,056,285
7,140,004
39,438,756
39,763,199
40,114,642
40,546,736
40,994,759
2026
2027
2028
2029
2030
404,978
408,202
411,385
414,515
417,640
1,315,314
1,327,270
1,339,090
1,350,933
1,362,817
6,169,594
6,235,064
6,299,395
6,362,963
6,426,638
5,498,554
5,561,225
5,622,613
5,683,908
5,745,003
1,480,562
1,497,152
1,512,958
1,529,058
1,545,036
3,333,242
3,376,670
3,420,965
3,463,800
3,505,699
10,348,054
10,466,451
10,584,637
10,701,654
10,819,136
5,681,291
5,742,129
5,802,907
5,863,919
5,925,569
7,227,389
7,315,156
7,403,194
7,491,099
7,579,812
41,458,978
41,929,319
42,397,144
42,861,849
43,327,350
2031
2032
2033
2034
2035
420,805
424,001
427,317
430,684
434,128
1,374,821
1,386,945
1,399,713
1,413,008
1,426,573
6,489,996
6,554,258
6,620,856
6,690,785
6,761,853
5,805,665
5,867,735
5,932,912
6,000,975
6,070,455
1,560,620
1,576,458
1,593,140
1,610,166
1,627,931
3,549,175
3,595,686
3,641,521
3,690,030
3,740,702
10,937,718
11,061,230
11,189,515
11,321,919
11,456,249
5,987,751
6,052,940
6,120,322
6,189,781
6,259,826
7,668,326
7,760,106
7,854,343
7,952,197
8,050,955
43,794,877
44,279,359
44,779,639
45,299,545
45,828,672
2036
2037
2038
2039
2040
437,694
441,320
445,106
449,001
452,844
1,440,221
1,453,773
1,467,329
1,480,871
1,494,460
6,834,288
6,905,519
6,978,769
7,050,817
7,122,659
6,141,368
6,211,462
6,282,159
6,352,505
6,423,214
1,645,862
1,663,235
1,681,518
1,699,431
1,717,282
3,790,871
3,839,376
3,889,051
3,940,284
3,990,530
11,590,946
11,723,283
11,857,418
11,990,474
12,123,325
6,329,234
6,397,957
6,466,024
6,533,361
6,601,040
8,150,602
8,250,743
8,353,066
8,452,648
8,553,577
46,361,086
46,886,668
47,420,440
47,949,392
48,478,931
23

Table S-10 Enplanements Summary by Region*
Northwest Western Fiscal Year
Alaska (AAL)
Central (ACE)
Eastern (AEA)
Great Lakes (AGL)
New England (ANE)
Mountain (ANM)
Southern (ASO)
Southwest (ASW)
Pacific (AWP)
National Total
Historical 2011
2012
2013
2014
Forecast 2015
4,333,115
4,335,234
4,389,781
4,461,781
4,752,953
16,247,278
16,347,060
16,332,429
16,562,601
16,662,364
118,328,419
119,867,749
120,114,631
121,625,306
125,432,061
98,579,675
98,413,657
98,066,458
100,604,426
103,618,128
22,367,970
22,242,987
22,393,108
23,181,491
23,799,818
67,510,844
67,863,588
68,258,672
70,663,863
73,318,859
169,095,789
170,789,344
170,889,088
173,796,012
180,890,448
81,703,579
82,374,948
83,571,431
87,294,714
91,052,679
144,759,533
148,818,946
150,320,923
154,869,858
161,115,774
722,926,202
731,053,513
734,336,521
753,060,052
780,643,084
2016
2017
2018
2019
2020
4,995,893
5,077,240
5,154,431
5,231,694
5,315,669
17,011,270
17,372,514
17,707,136
18,052,743
18,456,477
127,192,580
130,330,845
133,487,676
136,220,268
139,050,748
105,783,629
107,928,555
109,949,285
112,041,145
114,454,191
25,036,751
25,632,487
26,190,709
26,769,201
27,415,109
77,542,619
79,499,433
81,335,046
83,223,375
85,367,256
188,810,083
193,212,090
197,283,118
201,488,921
206,292,179
90,952,907
93,242,082
95,422,749
97,660,649
100,197,802
166,291,053
170,292,800
174,147,971
178,033,390
182,388,466
803,616,785
822,588,046
840,678,121
858,721,386
878,937,897
2021
2022
2023
2024
2025
5,396,197
5,469,701
5,538,266
5,602,994
5,666,499
18,859,659
19,227,372
19,567,878
19,901,981
20,227,925
141,898,552
144,582,082
147,139,077
149,641,428
152,134,804
116,874,149
119,130,452
121,211,324
123,205,116
125,165,429
28,062,244
28,672,501
29,245,737
29,813,242
30,373,967
87,499,153
89,461,345
91,275,011
93,001,294
94,712,308
211,091,156
215,537,401
219,774,682
223,933,829
228,026,821
102,708,669
105,021,468
107,201,954
109,343,847
111,458,993
186,710,440
190,747,856
194,498,729
198,153,877
201,779,370
899,100,219
917,850,178
935,452,658
952,597,608
969,546,116
2026
2027
2028
2029
2030
5,735,516
5,805,005
5,873,610
5,939,925
6,006,369
20,570,604
20,920,790
21,265,749
21,612,701
21,960,890
154,716,970
157,332,382
159,909,996
162,523,906
165,148,021
127,231,880
129,323,052
131,372,784
133,416,679
135,454,947
30,961,282
31,565,663
32,162,161
32,759,076
33,356,687
96,501,209
98,322,453
100,125,287
101,913,824
103,713,885
232,339,100
236,743,675
241,086,691
245,404,713
249,720,975
113,646,137
115,825,207
118,001,690
120,185,234
122,398,161
205,589,898
209,420,573
213,265,182
217,102,480
220,973,553
987,292,596
1,005,258,800
1,023,063,150
1,040,858,538
1,058,733,488
2031
2032
2033
2034
2035
6,072,595
6,139,313
6,210,269
6,283,560
6,360,052
22,311,292
22,664,709
23,041,712
23,436,730
23,839,490
167,781,915
170,441,392
173,176,016
176,004,874
178,866,592
137,473,013
139,541,197
141,719,114
143,995,369
146,310,438
33,946,813
34,538,611
35,164,012
35,797,902
36,453,805
105,524,119
107,411,823
109,384,639
111,421,771
113,488,019
254,094,991
258,659,909
263,399,747
268,272,524
273,173,456
124,624,185
126,971,558
129,396,518
131,902,510
134,418,374
224,823,681
228,807,092
232,896,413
237,162,720
241,453,991
1,076,652,604
1,095,175,604
1,114,388,440
1,134,277,960
1,154,364,217
2036
2037
2038
2039
2040
6,437,896
6,516,700
6,597,824
6,680,409
6,763,189
24,241,511
24,639,543
25,037,313
25,433,532
25,832,337
181,763,561
184,621,567
187,541,339
190,430,293
193,322,395
148,672,608
151,003,556
153,355,872
155,687,368
158,040,553
37,103,672
37,749,596
38,410,580
39,064,652
39,718,595
115,581,409
117,661,955
119,730,210
121,797,378
123,887,607
278,106,575
282,934,115
287,827,260
292,694,387
297,567,192
136,904,240
139,350,885
141,771,228
144,156,721
146,565,626
245,789,823
250,163,874
254,513,929
258,854,205
263,256,187
1,174,601,295
1,194,641,791
1,214,785,555
1,234,798,945
1,254,953,681
*Includes both tower and non-tower airports.
24

Table S-11 Based Aircraft Summary by Region*
Northwest Western Fiscal Year
Alaska (AAL)
Central (ACE)
Eastern (AEA)
Great Lakes (AGL)
New England (ANE)
Mountain (ANM)
Southern (ASO)
Southwest (ASW)
Pacific (AWP)
National Total
Historical 2011
2012
2013
2014
Forecast 2015
4,286
4,567
4,698
4,728
4,756
8,942
9,361
9,714
9,927
9,947
14,983
15,378
15,698
15,841
15,940
26,676
26,593
27,262
27,572
27,786
6,099
5,803
5,985
6,291
6,347
21,991
21,998
22,507
22,814
23,051
29,277
30,202
31,163
32,190
32,430
20,092
21,312
21,537
22,530
22,637
28,028
28,119
28,389
28,482
28,770
160,374
163,333
166,953
170,375
171,664
2016
2017
2018
2019
2020
4,786
4,813
4,843
4,873
4,900
10,012
10,057
10,113
10,160
10,200
16,081
16,197
16,337
16,460
16,576
27,982
28,159
28,360
28,548
28,747
6,406
6,470
6,528
6,591
6,655
23,303
23,523
23,775
23,994
24,223
32,720
32,984
33,264
33,527
33,797
22,870
23,078
23,279
23,484
23,681
29,058
29,332
29,608
29,892
30,168
173,218
174,613
176,107
177,529
178,947
2021
2022
2023
2024
2025
4,931
4,962
4,993
5,027
5,057
10,253
10,309
10,379
10,433
10,489
16,714
16,847
16,986
17,108
17,223
28,944
29,142
29,348
29,537
29,733
6,721
6,780
6,853
6,919
6,987
24,485
24,728
24,986
25,219
25,456
34,101
34,396
34,710
35,011
35,299
23,909
24,125
24,354
24,569
24,790
30,454
30,753
31,078
31,378
31,680
180,512
182,042
183,687
185,201
186,714
2026
2027
2028
2029
2030
5,088
5,120
5,152
5,184
5,217
10,542
10,597
10,653
10,710
10,766
17,341
17,465
17,589
17,708
17,835
29,921
30,116
30,307
30,505
30,702
7,056
7,125
7,194
7,265
7,336
25,687
25,924
26,162
26,398
26,639
35,589
35,884
36,180
36,482
36,797
25,012
25,237
25,461
25,692
25,939
31,985
32,293
32,606
32,924
33,245
188,221
189,761
191,304
192,868
194,476
2031
2032
2033
2034
2035
5,250
5,284
5,318
5,352
5,388
10,822
10,879
10,938
10,996
11,056
17,964
18,090
18,217
18,343
18,474
30,900
31,096
31,297
31,502
31,704
7,406
7,477
7,549
7,622
7,695
26,883
27,126
27,373
27,628
27,891
37,107
37,421
37,744
38,068
38,404
26,186
26,436
26,688
26,949
27,222
33,567
33,891
34,220
34,555
34,900
196,085
197,700
199,344
201,015
202,734
2036
2037
2038
2039
2040
5,424
5,461
5,498
5,535
5,572
11,114
11,176
11,239
11,305
11,371
18,603
18,740
18,876
19,011
19,151
31,906
32,114
32,331
32,545
32,760
7,769
7,845
7,923
8,007
8,094
28,154
28,424
28,696
28,973
29,262
38,745
39,102
39,462
39,833
40,216
27,499
27,787
28,078
28,378
28,688
35,250
35,603
35,963
36,327
36,696
204,464
206,252
208,066
209,914
211,810
*Includes both tower and non-tower airports.
25

Appendix A: Description of Activity Measures
Air Carrier Enplanements These data summarize domestic enplaned passengers (originations and connections) of U.S. commercial air carriers and international enplanements for both U.S. and foreign flag carriers submitted to the U.S. Department of Transportation (DOT), Bureau of Transportation Statistics (BTS) on T-100 reports. Estimates include both scheduled and non-scheduled enplaned passengers.
Regional Enplanements Starting in FY 2003, FAA includes in the regional category enplanements for those airlines whose primary function is to provide passenger feed to mainline carriers, regardless of aircraft size. As of October 2002, all scheduled and non-scheduled operations using aircraft with 10 or more seats to transport regional passengers must report on T-100.
Historic enplanement data includes originating passengers on scheduled commuter or regional carriers as reported on DOT Form 41 and 298-C; where possible, adjustments were made to include connecting passengers. Historically, Form 298-C included carriers operating at least five scheduled round trips per week whose entire fleet consists of aircraft having 60 seats or less.
Aircraft Operations FAA air traffic controllers count landings and takeoffs at FAA towered airports. Controllers employed by an FAA contractor count operations at FAA contract towers. At non-FAA facilities, operations counts represent an estimate.
Air carrier operations represent either takeoffs or landings of commercial aircraft with seating capacity of more than 60 seats.
Commuter/air taxi operations are one category. Commuter operations include takeoffs and landings by aircraft with 60 or fewer seats that transport regional passengers on scheduled commercial flights. Air taxi operations include takeoffs and landings by aircraft with 60 or fewer seats conducted on non-scheduled or for-hire flights.
Itinerant general aviation and local civil operations represent all civil aviation aircraft takeoffs and landings not classified as commercial. Military operations represent take-offs and landings by military aircraft. Operations are either itinerant or local flights.
26

Local Operations Aircraft operating in the traffic pattern or within sight of the tower, or aircraft known to be departing or arriving from flight in local practice areas, or aircraft executing practice instrument approaches at the airport.
Itinerant Operations FAA reports all aircraft operations other than local operations as itinerant. Essentially, these data represent takeoffs and landings of aircraft going from one airport to another.
Tracon Operations These data include arrivals, departures, and overflights conducted by an FAA radar approach control facility for aircraft under Instrument Flight Rule (IFR) or Visual Flight Rule (VFR) plans.
Overflights These data include operations of aircraft in transit through the approach control facility airspace.
27

Appendix B: List of FAA Towers by Hub Size and FAA Contract Towers
28

Table B-1 List of Large Hub Towers
Location Identifier Region Airport Name City, State
ATL ASO HARTSFIELD - JACKSON ATLANTA INTL ATLANTA, GA BOS ANE GENERAL EDWARD LAWRENCE LOGAN INTL BOSTON, MA BWI AEA BALTIMORE/WASHINGTON INTL THURGOOD MARSHALL BALTIMORE, MD CLT ASO CHARLOTTE/DOUGLAS INTL CHARLOTTE, NC DCA AEA RONALD REAGAN WASHINGTON NATIONAL WASHINGTON, DC DEN ANM DENVER INTL DENVER, CO DFW ASW DALLAS/FORT WORTH INTL DALLAS-FORT WORTH, TX DTW AGL DETROIT METROPOLITAN WAYNE COUNTY DETROIT, MI EWR AEA NEWARK LIBERTY INTL NEWARK, NJ FLL ASO FORT LAUDERDALE/HOLLYWOOD INTL FORT LAUDERDALE, FL HNL AWP HONOLULU INTL HONOLULU, HI IAD AEA WASHINGTON DULLES INTL WASHINGTON, DC IAH ASW GEORGE BUSH INTERCONTINENTAL/HOUSTON HOUSTON, TX JFK AEA JOHN F KENNEDY INTL NEW YORK, NY LAS AWP MC CARRAN INTL LAS VEGAS, NV LAX AWP LOS ANGELES INTL LOS ANGELES, CA LGA AEA LA GUARDIA NEW YORK, NY MCO ASO ORLANDO INTL ORLANDO, FL MDW AGL CHICAGO MIDWAY INTL CHICAGO, IL MIA ASO MIAMI INTL MIAMI, FL MSP AGL MINNEAPOLIS-ST PAUL INTL/WOLD-CHAMBERLAIN MINNEAPOLIS, MN ORD AGL CHICAGO O'HARE INTL CHICAGO, IL PDX ANM PORTLAND INTL PORTLAND, OR PHL AEA PHILADELPHIA INTL PHILADELPHIA, PA PHX AWP PHOENIX SKY HARBOR INTL PHOENIX, AZ SAN AWP SAN DIEGO INTL SAN DIEGO, CA SEA ANM SEATTLE-TACOMA INTL SEATTLE, WA SFO AWP SAN FRANCISCO INTL SAN FRANCISCO, CA SLC ANM SALT LAKE CITY INTL SALT LAKE CITY, UT TPA ASO TAMPA INTL TAMPA, FL
Listed 30 Airports.
29
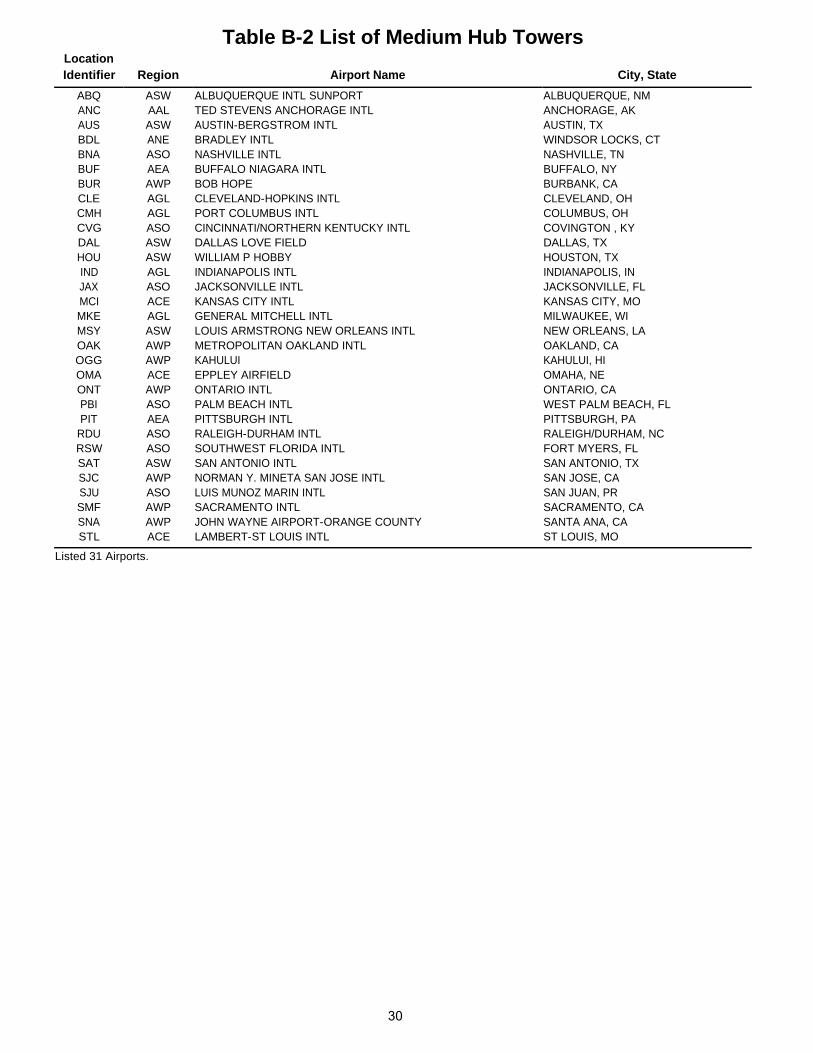
Table B-2 List of Medium Hub Towers
Location Identifier Region Airport Name City, State
ABQ ASW ALBUQUERQUE INTL SUNPORT ALBUQUERQUE, NM ANC AAL TED STEVENS ANCHORAGE INTL ANCHORAGE, AK AUS ASW AUSTIN-BERGSTROM INTL AUSTIN, TX BDL ANE BRADLEY INTL WINDSOR LOCKS, CT BNA ASO NASHVILLE INTL NASHVILLE, TN BUF AEA BUFFALO NIAGARA INTL BUFFALO, NY BUR AWP BOB HOPE BURBANK, CA CLE AGL CLEVELAND-HOPKINS INTL CLEVELAND, OH CMH AGL PORT COLUMBUS INTL COLUMBUS, OH CVG ASO CINCINNATI/NORTHERN KENTUCKY INTL COVINGTON , KY DAL ASW DALLAS LOVE FIELD DALLAS, TX HOU ASW WILLIAM P HOBBY HOUSTON, TX IND AGL INDIANAPOLIS INTL INDIANAPOLIS, IN JAX ASO JACKSONVILLE INTL JACKSONVILLE, FL MCI ACE KANSAS CITY INTL KANSAS CITY, MO MKE AGL GENERAL MITCHELL INTL MILWAUKEE, WI MSY ASW LOUIS ARMSTRONG NEW ORLEANS INTL NEW ORLEANS, LA OAK AWP METROPOLITAN OAKLAND INTL OAKLAND, CA OGG AWP KAHULUI KAHULUI, HI OMA ACE EPPLEY AIRFIELD OMAHA, NE ONT AWP ONTARIO INTL ONTARIO, CA PBI ASO PALM BEACH INTL WEST PALM BEACH, FL PIT AEA PITTSBURGH INTL PITTSBURGH, PA
RDU ASO RALEIGH-DURHAM INTL RALEIGH/DURHAM, NC RSW ASO SOUTHWEST FLORIDA INTL FORT MYERS, FL SAT ASW SAN ANTONIO INTL SAN ANTONIO, TX SJC AWP NORMAN Y. MINETA SAN JOSE INTL SAN JOSE, CA SJU ASO LUIS MUNOZ MARIN INTL SAN JUAN, PR SMF AWP SACRAMENTO INTL SACRAMENTO, CA SNA AWP JOHN WAYNE AIRPORT-ORANGE COUNTY SANTA ANA, CA STL ACE LAMBERT-ST LOUIS INTL ST LOUIS, MO
Listed 31 Airports.
30

Table B-3 List of Small Hub Towers Location Identifier Region Airport Name City, State
ACY AEA ATLANTIC CITY INTL ATLANTIC CITY, NJ ALB AEA ALBANY INTL ALBANY, NY AVL ASO ASHEVILLE RGNL ASHEVILLE, NC BHM ASO BIRMINGHAM-SHUTTLESWORTH INTL BIRMINGHAM, AL BIL ANM BILLINGS LOGAN INTL BILLINGS, MT BLI ANM BELLINGHAM INTL BELLINGHAM, WA BOI ANM BOISE AIR TERMINAL/GOWEN FLD BOISE, ID BTR ASW BATON ROUGE METROPOLITAN, RYAN FIELD BATON ROUGE, LA BTV ANE BURLINGTON INTL BURLINGTON, VT BZN ANM BOZEMAN YELLOWSTONE INTL BOZEMAN, MT CAE ASO COLUMBIA METROPOLITAN COLUMBIA, SC CAK AGL AKRON-CANTON RGNL AKRON, OH CHS ASO CHARLESTON AFB/INTL CHARLESTON, SC CID ACE THE EASTERN IOWA CEDAR RAPIDS, IA COS ANM CITY OF COLORADO SPRINGS MUNI COLORADO SPRINGS, CO DAY AGL JAMES M COX DAYTON INTL DAYTON, OH DSM ACE DES MOINES INTL DES MOINES, IA ECP ASO NORTHWEST FLORIDA BEACHES INTL PANAMA CITY, FL ELP ASW EL PASO INTL EL PASO, TX EUG ANM MAHLON SWEET FIELD EUGENE, OR EYW ASO KEY WEST INTL KEY WEST, FL FAI AAL FAIRBANKS INTL FAIRBANKS, AK FAR AGL HECTOR INTL FARGO, ND FAT AWP FRESNO YOSEMITE INTL FRESNO, CA FNT AGL BISHOP INTL FLINT, MI FSD AGL JOE FOSS FIELD SIOUX FALLS, SD GEG ANM SPOKANE INTL SPOKANE, WA GRR AGL GERALD R. FORD INTL GRAND RAPIDS, MI GSN AWP FRANCISCO C. ADA/SAIPAN INTL SAIPAN ISLAND, MP GSO ASO PIEDMONT TRIAD INTL GREENSBORO, NC GSP ASO GREENVILLE SPARTANBURG INTL GREER, SC GUM AWP GUAM INTL GUAM, GU HPN AEA WESTCHESTER COUNTY WHITE PLAINS, NY HSV ASO HUNTSVILLE INTL-CARL T JONES FIELD HUNTSVILLE, AL ICT ACE WICHITA DWIGHT D. EISENHOWER NATIONAL WICHITA, KS ILM ASO WILMINGTON INTL WILMINGTON, NC ISP AEA LONG ISLAND MAC ARTHUR NEW YORK, NY ITO AWP HILO INTL HILO, HI IWA AWP PHOENIX-MESA GATEWAY PHOENIX, AZ JAN ASO JACKSON-MEDGAR WILEY EVERS INTL JACKSON, MS KOA AWP KONA INTL AT KEAHOLE KAILUA/KONA, HI LBB ASW LUBBOCK PRESTON SMITH INTL LUBBOCK, TX LEX ASO BLUE GRASS LEXINGTON, KY LGB AWP LONG BEACH /DAUGHERTY FIELD/ LONG BEACH, CA LIH AWP LIHUE LIHUE, HI LIT ASW BILL AND HILLARY CLINTON NATIONAL/ADAMS FIELD LITTLE ROCK, AR
MAF ASW MIDLAND INTL MIDLAND, TX MDT AEA HARRISBURG INTL HARRISBURG, PA MEM ASO MEMPHIS INTL MEMPHIS, TN MHT ANE MANCHESTER MANCHESTER, NH
31

Table B-3 List of Small Hub Towers
Location Identifier Region Airport Name City, State
MLI AGL QUAD CITY INTL MOLINE, IL MSN AGL DANE COUNTY RGNL-TRUAX FIELD MADISON, WI MYR ASO MYRTLE BEACH INTL MYRTLE BEACH, SC OKC ASW WILL ROGERS WORLD OKLAHOMA CITY, OK ORF AEA NORFOLK INTL NORFOLK, VA PIE ASO ST PETE-CLEARWATER INTL ST PETERSBURG-CLEARWATER, FL PNS ASO PENSACOLA INTL PENSACOLA, FL PSP AWP PALM SPRINGS INTL PALM SPRINGS, CA PVD ANE THEODORE FRANCIS GREEN STATE PROVIDENCE, RI PWM ANE PORTLAND INTL JETPORT PORTLAND, ME RIC AEA RICHMOND INTL RICHMOND, VA RNO AWP RENO/TAHOE INTL RENO, NV ROC AEA GREATER ROCHESTER INTL ROCHESTER, NY SAV ASO SAVANNAH/HILTON HEAD INTL SAVANNAH, GA SDF ASO LOUISVILLE INTL-STANDIFORD FIELD LOUISVILLE, KY SFB ASO ORLANDO SANFORD INTL ORLANDO, FL SGF ACE SPRINGFIELD-BRANSON NATIONAL SPRINGFIELD, MO SRQ ASO SARASOTA/BRADENTON INTL SARASOTA/BRADENTON , FL STT ASO CYRIL E KING CHARLOTTE AMALIE, VI SYR AEA SYRACUSE HANCOCK INTL SYRACUSE, NY TUL ASW TULSA INTL TULSA, OK TUS AWP TUCSON INTL TUCSON, AZ TYS ASO MC GHEE TYSON KNOXVILLE, TN XNA ASW NORTHWEST ARKANSAS RGNL FAYETTEVILLE/SPRINGDALE/, AR
Listed 74 Airports.
32

Table B-4 List of Non-Hub Towers Location Identifier Region Airport Name City, State
ABE AEA LEHIGH VALLEY INTL ALLENTOWN, PA ABI ASW ABILENE RGNL ABILENE, TX ABY ASO SOUTHWEST GEORGIA RGNL ALBANY, GA ACK ANE NANTUCKET MEMORIAL NANTUCKET, MA ACT ASW WACO RGNL WACO, TX ADM ASW ARDMORE MUNI ARDMORE, OK ADQ AAL KODIAK KODIAK, AK ADS ASW ADDISON DALLAS, TX ADW AEA JOINT BASE ANDREWS CAMP SPRINGS, MD AEG ASW DOUBLE EAGLE II ALBUQUERQUE, NM AEX ASW ALEXANDRIA INTL ALEXANDRIA, LA AFW ASW FORT WORTH ALLIANCE FORT WORTH, TX AGC AEA ALLEGHENY COUNTY PITTSBURGH, PA AGS ASO AUGUSTA RGNL AT BUSH FIELD AUGUSTA, GA AHN ASO ATHENS/BEN EPPS ATHENS, GA AKN AAL KING SALMON KING SALMON, AK ALN AGL ST LOUIS RGNL ALTON/ST LOUIS, IL ALO ACE WATERLOO RGNL WATERLOO, IA ALW ANM WALLA WALLA RGNL WALLA WALLA, WA AMA ASW RICK HUSBAND AMARILLO INTL AMARILLO, TX ANE AGL ANOKA COUNTY-BLAINE ARPT(JANES FIELD) MINNEAPOLIS, MN APA ANM CENTENNIAL DENVER, CO APC AWP NAPA COUNTY NAPA, CA APF ASO NAPLES MUNI NAPLES, FL ARA ASW ACADIANA RGNL NEW IBERIA, LA ARB AGL ANN ARBOR MUNI ANN ARBOR, MI ARR AGL AURORA MUNI CHICAGO/AURORA, IL ASE ANM ASPEN-PITKIN CO/SARDY FIELD ASPEN, CO ASG ASW SPRINGDALE MUNI SPRINGDALE, AR ASH ANE BOIRE FIELD NASHUA, NH ATW AGL OUTAGAMIE COUNTY RGNL APPLETON, WI AVP AEA WILKES-BARRE/SCRANTON INTL WILKES-BARRE/SCRANTON, PA AZO AGL KALAMAZOO/BATTLE CREEK INTL KALAMAZOO, MI BAF ANE WESTFIELD-BARNES RGNL WESTFIELD/SPRINGFIELD, MA BAK AGL COLUMBUS MUNI COLUMBUS, IN BAZ ASW NEW BRAUNFELS RGNL NEW BRAUNFELS, TX BBG ACE BRANSON BRANSON, MO BCT ASO BOCA RATON BOCA RATON, FL BDR ANE IGOR I SIKORSKY MEMORIAL BRIDGEPORT, CT BED ANE LAURENCE G HANSCOM FLD BEDFORD, MA BET AAL BETHEL BETHEL, AK BFI ANM BOEING FIELD/KING COUNTY INTL SEATTLE, WA BFL AWP MEADOWS FIELD BAKERSFIELD, CA BFM ASO MOBILE DOWNTOWN MOBILE, AL BGM AEA GREATER BINGHAMTON/EDWIN A LINK FIELD BINGHAMTON, NY BGR ANE BANGOR INTL BANGOR, ME BIS AGL BISMARCK MUNI BISMARCK, ND BJC ANM ROCKY MOUNTAIN METROPOLITAN DENVER, CO BKL AGL BURKE LAKEFRONT CLEVELAND, OH BKV ASO BROOKSVILLE-TAMPA BAY RGNL BROOKSVILLE, FL BMG AGL MONROE COUNTY BLOOMINGTON, IN BMI AGL CENTRAL IL RGNL ARPT AT BLOOMINGTON-NORMAL BLOOMINGTON/NORMAL, IL BPT ASW JACK BROOKS RGNL BEAUMONT/PORT ARTHUR, TX BQN ASO RAFAEL HERNANDEZ AGUADILLA, PR BRO ASW BROWNSVILLE/SOUTH PADRE ISLAND INTL BROWNSVILLE, TX
33

Table B-4 List of Non-Hub Towers Location Identifier Region Airport Name City, State
BTL AGL W K KELLOGG BATTLE CREEK, MI BVY ANE BEVERLY MUNI BEVERLY, MA CCR AWP BUCHANAN FIELD CONCORD, CA CDW AEA ESSEX COUNTY CALDWELL, NJ CGF AGL CUYAHOGA COUNTY CLEVELAND, OH CHA ASO LOVELL FIELD CHATTANOOGA, TN CHD AWP CHANDLER MUNI CHANDLER, AZ CHO AEA CHARLOTTESVILLE-ALBEMARLE CHARLOTTESVILLE, VA CIC AWP CHICO MUNI CHICO, CA CKB AEA NORTH CENTRAL WEST VIRGINIA CLARKSBURG, WV CLL ASW EASTERWOOD FIELD COLLEGE STATION, TX CMA AWP CAMARILLO CAMARILLO, CA CMI AGL UNIVERSITY OF ILLINOIS-WILLARD CHAMPAIGN/URBANA , IL CNO AWP CHINO CHINO, CA CNW ASW TSTC WACO WACO, TX COU ACE COLUMBIA RGNL COLUMBIA, MO CPR ANM CASPER/NATRONA COUNTY INTL CASPER, WY CPS AGL ST LOUIS DOWNTOWN CAHOKIA/ST LOUIS, IL CRE ASO GRAND STRAND NORTH MYRTLE BEACH, SC CRG ASO JACKSONVILLE EXECUTIVE AT CRAIG JACKSONVILLE, FL CRP ASW CORPUS CHRISTI INTL CORPUS CHRISTI, TX CRQ AWP MC CLELLAN-PALOMAR CARLSBAD, CA CRW AEA YEAGER CHARLESTON, WV CSG ASO COLUMBUS COLUMBUS, GA CWA AGL CENTRAL WISCONSIN MOSINEE, WI CWF ASW CHENNAULT INTL LAKE CHARLES, LA CXO ASW LONE STAR EXECUTIVE HOUSTON , TX CXY AEA CAPITAL CITY HARRISBURG, PA CYS ANM CHEYENNE RGNL/JERRY OLSON FIELD CHEYENNE, WY DAB ASO DAYTONA BEACH INTL DAYTONA BEACH, FL DBQ ACE DUBUQUE RGNL DUBUQUE, IA DEC AGL DECATUR DECATUR, IL DET AGL COLEMAN A. YOUNG MUNI DETROIT, MI DHN ASO DOTHAN RGNL DOTHAN, AL DLH AGL DULUTH INTL DULUTH, MN DPA AGL DUPAGE CHICAGO/WEST CHICAGO , IL DTN ASW SHREVEPORT DOWNTOWN SHREVEPORT, LA DTO ASW DENTON MUNI DENTON, TX DVT AWP PHOENIX DEER VALLEY PHOENIX, AZ DWH ASW DAVID WAYNE HOOKS MEMORIAL HOUSTON, TX DXR ANE DANBURY MUNI DANBURY, CT EAU AGL CHIPPEWA VALLEY RGNL EAU CLAIRE, WI EGE ANM EAGLE COUNTY RGNL EAGLE, CO ELM AEA ELMIRA/CORNING RGNL ELMIRA/CORNING, NY EMT AWP EL MONTE EL MONTE, CA ENA AAL KENAI MUNI KENAI, AK ENW AGL KENOSHA RGNL KENOSHA, WI ERI AEA ERIE INTL/TOM RIDGE FIELD ERIE, PA ESN AEA EASTON/NEWNAM FIELD EASTON, MD EVB ASO NEW SMYRNA BEACH MUNI NEW SMYRNA BEACH, FL EVV AGL EVANSVILLE RGNL EVANSVILLE, IN EWB ANE NEW BEDFORD RGNL NEW BEDFORD, MA EWN ASO COASTAL CAROLINA REGIONAL NEW BERN, NC FAY ASO FAYETTEVILLE RGNL/GRANNIS FIELD FAYETTEVILLE, NC FCM AGL FLYING CLOUD MINNEAPOLIS, MN
34
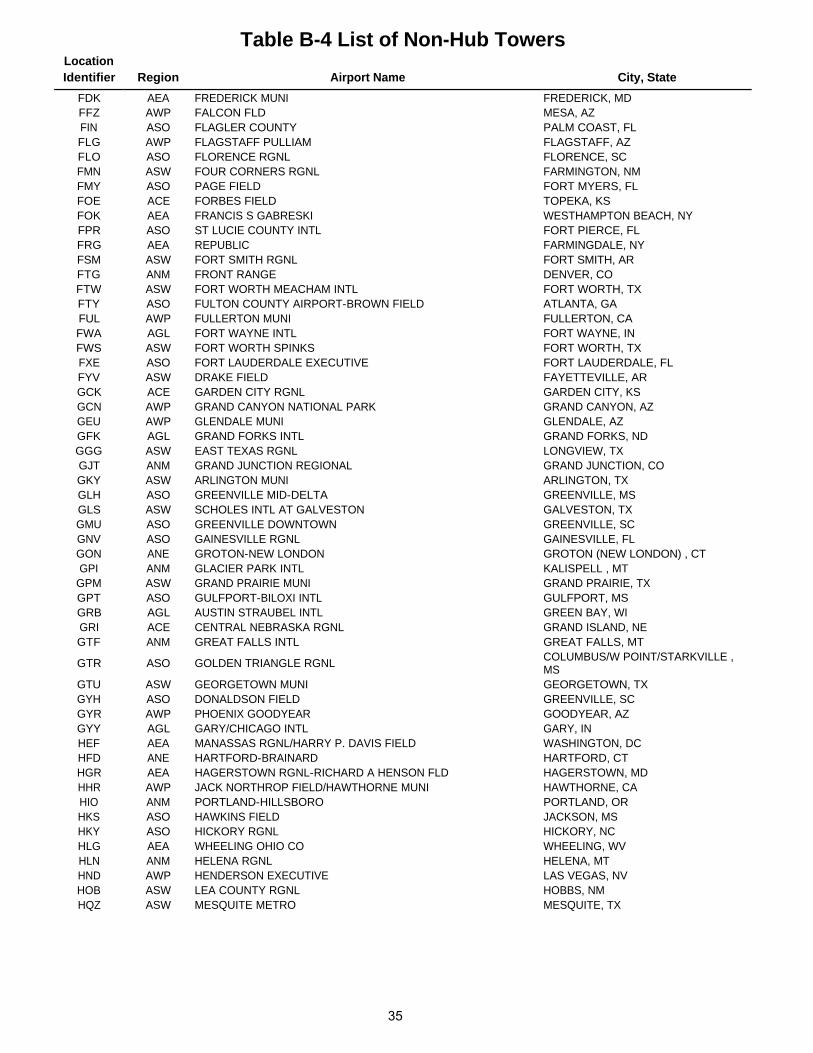
Table B-4 List of Non-Hub Towers Location Identifier Region Airport Name City, State
FDK AEA FREDERICK MUNI FREDERICK, MD FFZ AWP FALCON FLD MESA, AZ FIN ASO FLAGLER COUNTY PALM COAST, FL FLG AWP FLAGSTAFF PULLIAM FLAGSTAFF, AZ FLO ASO FLORENCE RGNL FLORENCE, SC FMN ASW FOUR CORNERS RGNL FARMINGTON, NM FMY ASO PAGE FIELD FORT MYERS, FL FOE ACE FORBES FIELD TOPEKA, KS FOK AEA FRANCIS S GABRESKI WESTHAMPTON BEACH, NY FPR ASO ST LUCIE COUNTY INTL FORT PIERCE, FL FRG AEA REPUBLIC FARMINGDALE, NY FSM ASW FORT SMITH RGNL FORT SMITH, AR FTG ANM FRONT RANGE DENVER, CO FTW ASW FORT WORTH MEACHAM INTL FORT WORTH, TX FTY ASO FULTON COUNTY AIRPORT-BROWN FIELD ATLANTA, GA FUL AWP FULLERTON MUNI FULLERTON, CA FWA AGL FORT WAYNE INTL FORT WAYNE, IN FWS ASW FORT WORTH SPINKS FORT WORTH, TX FXE ASO FORT LAUDERDALE EXECUTIVE FORT LAUDERDALE, FL FYV ASW DRAKE FIELD FAYETTEVILLE, AR GCK ACE GARDEN CITY RGNL GARDEN CITY, KS GCN AWP GRAND CANYON NATIONAL PARK GRAND CANYON, AZ GEU AWP GLENDALE MUNI GLENDALE, AZ GFK AGL GRAND FORKS INTL GRAND FORKS, ND GGG ASW EAST TEXAS RGNL LONGVIEW, TX GJT ANM GRAND JUNCTION REGIONAL GRAND JUNCTION, CO GKY ASW ARLINGTON MUNI ARLINGTON, TX GLH ASO GREENVILLE MID-DELTA GREENVILLE, MS GLS ASW SCHOLES INTL AT GALVESTON GALVESTON, TX GMU ASO GREENVILLE DOWNTOWN GREENVILLE, SC GNV ASO GAINESVILLE RGNL GAINESVILLE, FL GON ANE GROTON-NEW LONDON GROTON (NEW LONDON) , CT GPI ANM GLACIER PARK INTL KALISPELL , MT
GPM ASW GRAND PRAIRIE MUNI GRAND PRAIRIE, TX GPT ASO GULFPORT-BILOXI INTL GULFPORT, MS GRB AGL AUSTIN STRAUBEL INTL GREEN BAY, WI GRI ACE CENTRAL NEBRASKA RGNL GRAND ISLAND, NE GTF ANM GREAT FALLS INTL GREAT FALLS, MT
GTR ASO GOLDEN TRIANGLE RGNL COLUMBUS/W POINT/STARKVILLE , MS
GTU ASW GEORGETOWN MUNI GEORGETOWN, TX GYH ASO DONALDSON FIELD GREENVILLE, SC GYR AWP PHOENIX GOODYEAR GOODYEAR, AZ GYY AGL GARY/CHICAGO INTL GARY, IN HEF AEA MANASSAS RGNL/HARRY P. DAVIS FIELD WASHINGTON, DC HFD ANE HARTFORD-BRAINARD HARTFORD, CT HGR AEA HAGERSTOWN RGNL-RICHARD A HENSON FLD HAGERSTOWN, MD HHR AWP JACK NORTHROP FIELD/HAWTHORNE MUNI HAWTHORNE, CA HIO ANM PORTLAND-HILLSBORO PORTLAND, OR HKS ASO HAWKINS FIELD JACKSON, MS HKY ASO HICKORY RGNL HICKORY, NC HLG AEA WHEELING OHIO CO WHEELING, WV HLN ANM HELENA RGNL HELENA, MT HND AWP HENDERSON EXECUTIVE LAS VEGAS, NV HOB ASW LEA COUNTY RGNL HOBBS, NM HQZ ASW MESQUITE METRO MESQUITE, TX
35

Table B-4 List of Non-Hub Towers Location Identifier Region Airport Name City, State
HRL ASW VALLEY INTL HARLINGEN, TX HSA ASO STENNIS INTL BAY ST LOUIS, MS HTS AEA TRI-STATE/MILTON J. FERGUSON FIELD HUNTINGTON, WV HUF AGL TERRE HAUTE INTL-HULMAN FIELD TERRE HAUTE, IN HUM ASW HOUMA-TERREBONNE HOUMA, LA HUT ACE HUTCHINSON MUNI HUTCHINSON, KS HVN ANE TWEED-NEW HAVEN NEW HAVEN, CT HWD AWP HAYWARD EXECUTIVE HAYWARD, CA HWO ASO NORTH PERRY HOLLYWOOD, FL HXD ASO HILTON HEAD HILTON HEAD ISLAND, SC HYA ANE BARNSTABLE MUNI-BOARDMAN/POLANDO FIELD HYANNIS, MA HYI ASW SAN MARCOS MUNI SAN MARCOS, TX IAG AEA NIAGARA FALLS INTL NIAGARA FALLS, NY IDA ANM IDAHO FALLS RGNL IDAHO FALLS, ID IFP AWP LAUGHLIN/BULLHEAD INTL BULLHEAD CITY, AZ ILG AEA NEW CASTLE WILMINGTON, DE INT ASO SMITH REYNOLDS WINSTON SALEM, NC IPT AEA WILLIAMSPORT RGNL WILLIAMSPORT, PA ISM ASO KISSIMMEE GATEWAY ORLANDO, FL ISO ASO KINSTON RGNL JETPORT AT STALLINGS FLD KINSTON, NC ITH AEA ITHACA TOMPKINS RGNL ITHACA, NY IXD ACE NEW CENTURY AIRCENTER OLATHE, KS JAC ANM JACKSON HOLE JACKSON, WY JEF ACE JEFFERSON CITY MEMORIAL JEFFERSON CITY, MO JLN ACE JOPLIN RGNL JOPLIN, MO JNU AAL JUNEAU INTL JUNEAU, AK JQF ASO CONCORD RGNL CONCORD, NC JRF AWP KALAELOA (JOHN RODGERS FIELD) KAPOLEI, HI JVL AGL SOUTHERN WISCONSIN RGNL JANESVILLE, WI JXN AGL JACKSON COUNTY-REYNOLDS FIELD JACKSON, MI LAF AGL PURDUE UNIVERSITY LAFAYETTE, IN LAL ASO LAKELAND LINDER RGNL LAKELAND, FL LAN AGL CAPITAL REGION INTL LANSING, MI LAW ASW LAWTON-FORT SILL RGNL LAWTON, OK LBE AEA ARNOLD PALMER RGNL LATROBE, PA LCH ASW LAKE CHARLES RGNL LAKE CHARLES, LA LEB ANE LEBANON MUNI LEBANON, NH LEE ASO LEESBURG INTL LEESBURG, FL LFT ASW LAFAYETTE RGNL LAFAYETTE, LA LMT ANM KLAMATH FALLS KLAMATH FALLS, OR LNK ACE LINCOLN LINCOLN, NE LNS AEA LANCASTER LANCASTER, PA LOU ASO BOWMAN FIELD LOUISVILLE, KY LRD ASW LAREDO INTL LAREDO, TX LSE AGL LA CROSSE RGNL LA CROSSE, WI LUK AGL CINCINNATI MUNI AIRPORT LUNKEN FIELD CINCINNATI, OH LVK AWP LIVERMORE MUNI LIVERMORE, CA LWB AEA GREENBRIER VALLEY LEWISBURG, WV LWM ANE LAWRENCE MUNI LAWRENCE, MA LWS ANM LEWISTON-NEZ PERCE COUNTY LEWISTON, ID LYH AEA LYNCHBURG RGNL/PRESTON GLENN FLD LYNCHBURG, VA LZU ASO GWINNETT COUNTY - BRISCOE FIELD LAWRENCEVILLE, GA MBS AGL MBS INTL SAGINAW, MI MCN ASO MIDDLE GEORGIA RGNL MACON, GA MDH AGL SOUTHERN ILLINOIS CARBONDALE/MURPHYSBORO, IL
36

Table B-4 List of Non-Hub Towers Location Identifier Region Airport Name City, State
MEI ASO KEY FIELD MERIDIAN, MS MER AWP CASTLE ATWATER, CA MFD AGL MANSFIELD LAHM RGNL MANSFIELD, OH MFE ASW MC ALLEN MILLER INTL MC ALLEN, TX MFR ANM ROGUE VALLEY INTL - MEDFORD MEDFORD, OR MGM ASO MONTGOMERY RGNL (DANNELLY FIELD) MONTGOMERY, AL MGW AEA MORGANTOWN MUNI-WALTER L. BILL HART FLD MORGANTOWN, WV MHK ACE MANHATTAN RGNL MANHATTAN, KS MHR AWP SACRAMENTO MATHER SACRAMENTO, CA MIC AGL CRYSTAL MINNEAPOLIS, MN MIE AGL DELAWARE COUNTY RGNL MUNCIE, IN MKC ACE CHARLES B. WHEELER DOWNTOWN KANSAS CITY, MO MKG AGL MUSKEGON COUNTY MUSKEGON, MI MKK AWP MOLOKAI KAUNAKAKAI, HI MKL ASO MC KELLAR-SIPES RGNL JACKSON, TN MLB ASO MELBOURNE INTL MELBOURNE, FL MLU ASW MONROE RGNL MONROE, LA MMU AEA MORRISTOWN MUNI MORRISTOWN, NJ MOB ASO MOBILE RGNL MOBILE, AL MOD AWP MODESTO CITY-CO-HARRY SHAM FLD MODESTO, CA MOT AGL MINOT INTL MINOT, ND MQY ASO SMYRNA SMYRNA, TN MRI AAL MERRILL FIELD ANCHORAGE, AK MRY AWP MONTEREY RGNL MONTEREY, CA MSO ANM MISSOULA INTL MISSOULA, MT MTN AEA MARTIN STATE BALTIMORE, MD MVY ANE MARTHA'S VINEYARD VINEYARD HAVEN, MA MWA AGL WILLIAMSON COUNTY RGNL MARION, IL MWC AGL LAWRENCE J TIMMERMAN MILWAUKEE, WI MWH ANM GRANT CO INTL MOSES LAKE, WA MYF AWP MONTGOMERY FIELD SAN DIEGO, CA NEW ASW LAKEFRONT NEW ORLEANS, LA NQA ASO MILLINGTON RGNL JETPORT MILLINGTON, TN OCF ASO OCALA INTL-JIM TAYLOR FIELD OCALA, FL OGD ANM OGDEN-HINCKLEY OGDEN, UT OJC ACE JOHNSON COUNTY EXECUTIVE OLATHE, KS OLM ANM OLYMPIA RGNL OLYMPIA, WA OLV ASO OLIVE BRANCH OLIVE BRANCH, MS OMN ASO ORMOND BEACH MUNI ORMOND BEACH, FL OPF ASO OPA-LOCKA EXECUTIVE MIAMI, FL ORH ANE WORCESTER RGNL WORCESTER, MA ORL ASO EXECUTIVE ORLANDO, FL OSH AGL WITTMAN RGNL OSHKOSH, WI OSU AGL OHIO STATE UNIVERSITY COLUMBUS, OH OTH ANM SOUTHWEST OREGON RGNL NORTH BEND, OR OUN ASW UNIVERSITY OF OKLAHOMA WESTHEIMER NORMAN, OK OWB ASO OWENSBORO-DAVIESS COUNTY OWENSBORO, KY OWD ANE NORWOOD MEMORIAL NORWOOD, MA OXC ANE WATERBURY-OXFORD OXFORD, CT OXR AWP OXNARD OXNARD, CA PAE ANM SNOHOMISH COUNTY (PAINE FLD) EVERETT, WA PAH ASO BARKLEY RGNL PADUCAH, KY PAO AWP PALO ALTO ARPT OF SANTA CLARA CO PALO ALTO, CA PDK ASO DEKALB-PEACHTREE ATLANTA, GA PDT ANM EASTERN OREGON RGNL AT PENDLETON PENDLETON, OR
37

Table B-4 List of Non-Hub Towers Location Identifier Region Airport Name City, State
PGD ASO PUNTA GORDA PUNTA GORDA, FL PHF AEA NEWPORT NEWS/WILLIAMSBURG INTL NEWPORT NEWS, VA PIA AGL GENERAL DOWNING - PEORIA INTL PEORIA, IL PIH ANM POCATELLO RGNL POCATELLO, ID PKB AEA MID-OHIO VALLEY RGNL PARKERSBURG, WV PMD AWP PALMDALE USAF PLANT 42 PALMDALE, CA PMP ASO POMPANO BEACH AIRPARK POMPANO BEACH, FL PNE AEA NORTHEAST PHILADELPHIA PHILADELPHIA, PA POC AWP BRACKETT FIELD LA VERNE, CA POU AEA DUTCHESS COUNTY POUGHKEEPSIE, NY PRC AWP ERNEST A. LOVE FIELD PRESCOTT, AZ PSC ANM TRI-CITIES PASCO, WA PTK AGL OAKLAND COUNTY INTL PONTIAC, MI PUB ANM PUEBLO MEMORIAL PUEBLO, CO PVU ANM PROVO MUNI PROVO, UT PWA ASW WILEY POST OKLAHOMA CITY, OK
PWK AGL CHICAGO EXECUTIVE CHICAGO/PROSPECT HEIGHTS/WHEELING , IL
RAL AWP RIVERSIDE MUNI RIVERSIDE, CA RAP AGL RAPID CITY RGNL RAPID CITY, SD RBD ASW DALLAS EXECUTIVE DALLAS, TX RDD AWP REDDING MUNI REDDING, CA RDG AEA READING RGNL/CARL A SPAATZ FIELD READING, PA RDM ANM ROBERTS FIELD REDMOND, OR RFD AGL CHICAGO/ROCKFORD INTL CHICAGO/ROCKFORD, IL RHV AWP REID-HILLVIEW OF SANTA CLARA COUNTY SAN JOSE, CA RME AEA GRIFFISS INTL ROME, NY RNM AWP RAMONA RAMONA, CA RNT ANM RENTON MUNI RENTON, WA ROA AEA ROANOKE RGNL/WOODRUM FIELD ROANOKE, VA ROG ASW ROGERS MUNI-CARTER FIELD ROGERS, AR ROW ASW ROSWELL INTL AIR CENTER ROSWELL, NM RST AGL ROCHESTER INTL ROCHESTER, MN RVS ASW RICHARD LLOYD JONES JR TULSA, OK RYN AWP RYAN FIELD TUCSON, AZ RYY ASO COBB COUNTY-MC COLLUM FIELD ATLANTA, GA SAC AWP SACRAMENTO EXECUTIVE SACRAMENTO, CA SAF ASW SANTA FE MUNI SANTA FE, NM SAW AGL SAWYER INTL MARQUETTE, MI SBA AWP SANTA BARBARA MUNI SANTA BARBARA, CA SBN AGL SOUTH BEND INTL SOUTH BEND, IN SBP AWP SAN LUIS COUNTY RGNL SAN LUIS OBISPO, CA SBY AEA SALISBURY-OCEAN CITY WICOMICO RGNL SALISBURY, MD SCK AWP STOCKTON METROPOLITAN STOCKTON, CA SDL AWP SCOTTSDALE SCOTTSDALE, AZ SDM AWP BROWN FIELD MUNI SAN DIEGO, CA SEE AWP GILLESPIE FIELD SAN DIEGO/EL CAJON , CA SFF ANM FELTS FIELD SPOKANE, WA SGJ ASO NORTHEAST FLORIDA RGNL ST AUGUSTINE, FL SGR ASW SUGAR LAND RGNL HOUSTON, TX SHV ASW SHREVEPORT RGNL SHREVEPORT, LA SIG ASO FERNANDO LUIS RIBAS DOMINICCI SAN JUAN, PR SJT ASW SAN ANGELO RGNL/MATHIS FIELD SAN ANGELO, TX SLE ANM MCNARY FLD SALEM, OR SLN ACE SALINA RGNL SALINA, KS SMO AWP SANTA MONICA MUNI SANTA MONICA, CA
38

Table B-4 List of Non-Hub Towers
Location Identifier Region Airport Name City, State
SMX AWP SANTA MARIA PUB/CAPT G ALLAN HANCOCK FLD SANTA MARIA, CA SNS AWP SALINAS MUNI SALINAS, CA SPG ASO ALBERT WHITTED ST PETERSBURG, FL SPI AGL ABRAHAM LINCOLN CAPITAL SPRINGFIELD, IL SQL AWP SAN CARLOS SAN CARLOS, CA SSF ASW STINSON MUNI SAN ANTONIO, TX STC AGL ST CLOUD RGNL ST CLOUD, MN STJ ACE ROSECRANS MEMORIAL ST JOSEPH, MO STP AGL ST PAUL DOWNTOWN HOLMAN FLD ST PAUL, MN STS AWP CHARLES M. SCHULZ - SONOMA COUNTY SANTA ROSA, CA STX ASO HENRY E ROHLSEN CHRISTIANSTED, VI SUA ASO WITHAM FIELD STUART, FL SUN ANM FRIEDMAN MEMORIAL HAILEY, ID SUS ACE SPIRIT OF ST LOUIS ST LOUIS, MO SUX ACE SIOUX GATEWAY/COL. BUD DAY FIELD SIOUX CITY, IA SWF AEA STEWART INTL NEWBURGH, NY SWO ASW STILLWATER RGNL STILLWATER, OK TCL ASO TUSCALOOSA RGNL TUSCALOOSA, AL TEB AEA TETERBORO TETERBORO, NJ TIW ANM TACOMA NARROWS TACOMA, WA TIX ASO SPACE COAST RGNL TITUSVILLE, FL TKI ASW COLLIN COUNTY RGNL AT MC KINNEY DALLAS, TX TLH ASO TALLAHASSEE RGNL TALLAHASSEE, FL TMB ASO KENDALL-TAMIAMI EXECUTIVE MIAMI, FL TOA AWP ZAMPERINI FIELD TORRANCE, CA TOL AGL TOLEDO EXPRESS TOLEDO, OH TOP ACE PHILIP BILLARD MUNI TOPEKA, KS TRI ASO TRI-CITIES RGNL TN/VA BRISTOL/JOHNSON/KINGSPORT, TN TTD ANM PORTLAND-TROUTDALE PORTLAND, OR TTN AEA TRENTON MERCER TRENTON, NJ TUP ASO TUPELO RGNL TUPELO, MS TVC AGL CHERRY CAPITAL TRAVERSE CITY, MI TWF ANM JOSLIN FIELD - MAGIC VALLEY RGNL TWIN FALLS, ID TXK ASW TEXARKANA RGNL-WEBB FIELD TEXARKANA, AR TYR ASW TYLER POUNDS RGNL TYLER, TX TZR AGL BOLTON FIELD COLUMBUS, OH UES AGL WAUKESHA COUNTY WAUKESHA, WI UGN AGL WAUKEGAN RGNL CHICAGO/WAUKEGAN, IL UNV AEA UNIVERSITY PARK STATE COLLEGE, PA VCT ASW VICTORIA RGNL VICTORIA, TX VCV AWP SOUTHERN CALIFORNIA LOGISTICS VICTORVILLE, CA VGT AWP NORTH LAS VEGAS LAS VEGAS, NV VNY AWP VAN NUYS VAN NUYS, CA VQQ ASO CECIL JACKSONVILLE, FL VRB ASO VERO BEACH MUNI VERO BEACH, FL WDG ASW ENID WOODRING RGNL ENID, OK WHP AWP WHITEMAN LOS ANGELES, CA WJF AWP GENERAL WM J FOX AIRFIELD LANCASTER, CA YIP AGL WILLOW RUN DETROIT, MI
YKM ANM YAKIMA AIR TERMINAL/MCALLISTER FIELD YAKIMA, WA YNG AGL YOUNGSTOWN-WARREN RGNL YOUNGSTOWN/WARREN, OH
Listed 381 Airports.
39

Table B-5 List of FAA Contract Towers Location Identifier Region Airport Name City, State
ABY ASO SOUTHWEST GEORGIA RGNL ALBANY, GA ADM ASW ARDMORE MUNI ARDMORE, OK ADQ AAL KODIAK KODIAK, AK AEG ASW DOUBLE EAGLE II ALBUQUERQUE, NM AEX ASW ALEXANDRIA INTL ALEXANDRIA, LA AHN ASO ATHENS/BEN EPPS ATHENS, GA AKN AAL KING SALMON KING SALMON, AK ALN AGL ST LOUIS RGNL ALTON/ST LOUIS, IL ALW ANM WALLA WALLA RGNL WALLA WALLA, WA ANE AGL ANOKA COUNTY-BLAINE ARPT(JANES FIELD) MINNEAPOLIS, MN APF ASO NAPLES MUNI NAPLES, FL ARA ASW ACADIANA RGNL NEW IBERIA, LA ASG ASW SPRINGDALE MUNI SPRINGDALE, AR ASH ANE BOIRE FIELD NASHUA, NH ATW AGL OUTAGAMIE COUNTY RGNL APPLETON, WI BAF ANE WESTFIELD-BARNES RGNL WESTFIELD/SPRINGFIELD, MA BAK AGL COLUMBUS MUNI COLUMBUS, IN BAZ ASW NEW BRAUNFELS RGNL NEW BRAUNFELS, TX BBG ACE BRANSON BRANSON, MO BCT ASO BOCA RATON BOCA RATON, FL BDR ANE IGOR I SIKORSKY MEMORIAL BRIDGEPORT, CT BET AAL BETHEL BETHEL, AK BFM ASO MOBILE DOWNTOWN MOBILE, AL BKL AGL BURKE LAKEFRONT CLEVELAND, OH BKV ASO BROOKSVILLE-TAMPA BAY RGNL BROOKSVILLE, FL BLI ANM BELLINGHAM INTL BELLINGHAM, WA
BMG AGL MONROE COUNTY BLOOMINGTON, IN BMI AGL CENTRAL IL RGNL ARPT AT BLOOMINGTON-NORMAL BLOOMINGTON/NORMAL, IL BQN ASO RAFAEL HERNANDEZ AGUADILLA, PR BRO ASW BROWNSVILLE/SOUTH PADRE ISLAND INTL BROWNSVILLE, TX BTL AGL W K KELLOGG BATTLE CREEK, MI BVY ANE BEVERLY MUNI BEVERLY, MA BZN ANM BOZEMAN YELLOWSTONE INTL BOZEMAN, MT CGF AGL CUYAHOGA COUNTY CLEVELAND, OH CHD AWP CHANDLER MUNI CHANDLER, AZ CHO AEA CHARLOTTESVILLE-ALBEMARLE CHARLOTTESVILLE, VA CIC AWP CHICO MUNI CHICO, CA CLL ASW EASTERWOOD FIELD COLLEGE STATION, TX CNW ASW TSTC WACO WACO, TX COU ACE COLUMBIA RGNL COLUMBIA, MO CRE ASO GRAND STRAND NORTH MYRTLE BEACH, SC CRG ASO JACKSONVILLE EXECUTIVE AT CRAIG JACKSONVILLE, FL CWA AGL CENTRAL WISCONSIN MOSINEE, WI CWF ASW CHENNAULT INTL LAKE CHARLES, LA CXO ASW LONE STAR EXECUTIVE HOUSTON , TX CXY AEA CAPITAL CITY HARRISBURG, PA CYS ANM CHEYENNE RGNL/JERRY OLSON FIELD CHEYENNE, WY DBQ ACE DUBUQUE RGNL DUBUQUE, IA DEC AGL DECATUR DECATUR, IL DET AGL COLEMAN A. YOUNG MUNI DETROIT, MI
40

Table B-5 List of FAA Contract Towers Location Identifier Region Airport Name City, State
DHN ASO DOTHAN RGNL DOTHAN, AL DTN ASW SHREVEPORT DOWNTOWN SHREVEPORT, LA DTO ASW DENTON MUNI DENTON, TX DXR ANE DANBURY MUNI DANBURY, CT EAU AGL CHIPPEWA VALLEY RGNL EAU CLAIRE, WI ECP ASO NORTHWEST FLORIDA BEACHES INTL PANAMA CITY, FL EGE ANM EAGLE COUNTY RGNL EAGLE, CO ENA AAL KENAI MUNI KENAI, AK ENW AGL KENOSHA RGNL KENOSHA, WI ESN AEA EASTON/NEWNAM FIELD EASTON, MD EVB ASO NEW SMYRNA BEACH MUNI NEW SMYRNA BEACH, FL EWB ANE NEW BEDFORD RGNL NEW BEDFORD, MA EWN ASO COASTAL CAROLINA REGIONAL NEW BERN, NC EYW ASO KEY WEST INTL KEY WEST, FL FDK AEA FREDERICK MUNI FREDERICK, MD FIN ASO FLAGLER COUNTY PALM COAST, FL FLG AWP FLAGSTAFF PULLIAM FLAGSTAFF, AZ FMN ASW FOUR CORNERS RGNL FARMINGTON, NM FMY ASO PAGE FIELD FORT MYERS, FL FOE ACE FORBES FIELD TOPEKA, KS FOK AEA FRANCIS S GABRESKI WESTHAMPTON BEACH, NY FTG ANM FRONT RANGE DENVER, CO FTY ASO FULTON COUNTY AIRPORT-BROWN FIELD ATLANTA, GA FUL AWP FULLERTON MUNI FULLERTON, CA FWS ASW FORT WORTH SPINKS FORT WORTH, TX FYV ASW DRAKE FIELD FAYETTEVILLE, AR GCK ACE GARDEN CITY RGNL GARDEN CITY, KS GEU AWP GLENDALE MUNI GLENDALE, AZ GJT ANM GRAND JUNCTION REGIONAL GRAND JUNCTION, CO GKY ASW ARLINGTON MUNI ARLINGTON, TX GLH ASO GREENVILLE MID-DELTA GREENVILLE, MS GLS ASW SCHOLES INTL AT GALVESTON GALVESTON, TX GMU ASO GREENVILLE DOWNTOWN GREENVILLE, SC GNV ASO GAINESVILLE RGNL GAINESVILLE, FL GON ANE GROTON-NEW LONDON GROTON (NEW LONDON) , CT GPI ANM GLACIER PARK INTL KALISPELL , MT
GPM ASW GRAND PRAIRIE MUNI GRAND PRAIRIE, TX GRI ACE CENTRAL NEBRASKA RGNL GRAND ISLAND, NE GSN AWP FRANCISCO C. ADA/SAIPAN INTL SAIPAN ISLAND, MP
GTR ASO GOLDEN TRIANGLE RGNL COLUMBUS/W POINT/STARKVILLE , MS
GTU ASW GEORGETOWN MUNI GEORGETOWN, TX GUM AWP GUAM INTL GUAM, GU GYH ASO DONALDSON FIELD GREENVILLE, SC GYR AWP PHOENIX GOODYEAR GOODYEAR, AZ GYY AGL GARY/CHICAGO INTL GARY, IN HFD ANE HARTFORD-BRAINARD HARTFORD, CT HGR AEA HAGERSTOWN RGNL-RICHARD A HENSON FLD HAGERSTOWN, MD HHR AWP JACK NORTHROP FIELD/HAWTHORNE MUNI HAWTHORNE, CA HKS ASO HAWKINS FIELD JACKSON, MS HKY ASO HICKORY RGNL HICKORY, NC
41

Table B-5 List of FAA Contract Towers Location Identifier Region Airport Name City, State
HLG AEA WHEELING OHIO CO WHEELING, WV HND AWP HENDERSON EXECUTIVE LAS VEGAS, NV HOB ASW LEA COUNTY RGNL HOBBS, NM HQZ ASW MESQUITE METRO MESQUITE, TX HRL ASW VALLEY INTL HARLINGEN, TX HSA ASO STENNIS INTL BAY ST LOUIS, MS HUM ASW HOUMA-TERREBONNE HOUMA, LA HUT ACE HUTCHINSON MUNI HUTCHINSON, KS HVN ANE TWEED-NEW HAVEN NEW HAVEN, CT HWO ASO NORTH PERRY HOLLYWOOD, FL HXD ASO HILTON HEAD HILTON HEAD ISLAND, SC HYA ANE BARNSTABLE MUNI-BOARDMAN/POLANDO FIELD HYANNIS, MA HYI ASW SAN MARCOS MUNI SAN MARCOS, TX IAG AEA NIAGARA FALLS INTL NIAGARA FALLS, NY IDA ANM IDAHO FALLS RGNL IDAHO FALLS, ID IFP AWP LAUGHLIN/BULLHEAD INTL BULLHEAD CITY, AZ INT ASO SMITH REYNOLDS WINSTON SALEM, NC IPT AEA WILLIAMSPORT RGNL WILLIAMSPORT, PA ISM ASO KISSIMMEE GATEWAY ORLANDO, FL ISO ASO KINSTON RGNL JETPORT AT STALLINGS FLD KINSTON, NC ITH AEA ITHACA TOMPKINS RGNL ITHACA, NY IWA AWP PHOENIX-MESA GATEWAY PHOENIX, AZ IXD ACE NEW CENTURY AIRCENTER OLATHE, KS JAC ANM JACKSON HOLE JACKSON, WY JEF ACE JEFFERSON CITY MEMORIAL JEFFERSON CITY, MO JLN ACE JOPLIN RGNL JOPLIN, MO JQF ASO CONCORD RGNL CONCORD, NC JRF AWP KALAELOA (JOHN RODGERS FIELD) KAPOLEI, HI JVL AGL SOUTHERN WISCONSIN RGNL JANESVILLE, WI JXN AGL JACKSON COUNTY-REYNOLDS FIELD JACKSON, MI KOA AWP KONA INTL AT KEAHOLE KAILUA/KONA, HI LAL ASO LAKELAND LINDER RGNL LAKELAND, FL LAW ASW LAWTON-FORT SILL RGNL LAWTON, OK LBE AEA ARNOLD PALMER RGNL LATROBE, PA LEB ANE LEBANON MUNI LEBANON, NH LEE ASO LEESBURG INTL LEESBURG, FL LIH AWP LIHUE LIHUE, HI
LMT ANM KLAMATH FALLS KLAMATH FALLS, OR LNS AEA LANCASTER LANCASTER, PA LRD ASW LAREDO INTL LAREDO, TX LSE AGL LA CROSSE RGNL LA CROSSE, WI LUK AGL CINCINNATI MUNI AIRPORT LUNKEN FIELD CINCINNATI, OH LWB AEA GREENBRIER VALLEY LEWISBURG, WV LWM ANE LAWRENCE MUNI LAWRENCE, MA LWS ANM LEWISTON-NEZ PERCE COUNTY LEWISTON, ID LYH AEA LYNCHBURG RGNL/PRESTON GLENN FLD LYNCHBURG, VA LZU ASO GWINNETT COUNTY - BRISCOE FIELD LAWRENCEVILLE, GA MCN ASO MIDDLE GEORGIA RGNL MACON, GA MDH AGL SOUTHERN ILLINOIS CARBONDALE/MURPHYSBORO, IL MEI ASO KEY FIELD MERIDIAN, MS
42

Table B-5 List of FAA Contract Towers Location Identifier Region Airport Name City, State
MER AWP CASTLE ATWATER, CA MFE ASW MC ALLEN MILLER INTL MC ALLEN, TX MFR ANM ROGUE VALLEY INTL - MEDFORD MEDFORD, OR MGW AEA MORGANTOWN MUNI-WALTER L. BILL HART FLD MORGANTOWN, WV MHK ACE MANHATTAN RGNL MANHATTAN, KS MHR AWP SACRAMENTO MATHER SACRAMENTO, CA MIE AGL DELAWARE COUNTY RGNL MUNCIE, IN MKK AWP MOLOKAI KAUNAKAKAI, HI MKL ASO MC KELLAR-SIPES RGNL JACKSON, TN MLB ASO MELBOURNE INTL MELBOURNE, FL MOD AWP MODESTO CITY-CO-HARRY SHAM FLD MODESTO, CA MOT AGL MINOT INTL MINOT, ND MQY ASO SMYRNA SMYRNA, TN MSO ANM MISSOULA INTL MISSOULA, MT MTN AEA MARTIN STATE BALTIMORE, MD MVY ANE MARTHA'S VINEYARD VINEYARD HAVEN, MA MWA AGL WILLIAMSON COUNTY RGNL MARION, IL MWC AGL LAWRENCE J TIMMERMAN MILWAUKEE, WI NQA ASO MILLINGTON RGNL JETPORT MILLINGTON, TN OCF ASO OCALA INTL-JIM TAYLOR FIELD OCALA, FL OGD ANM OGDEN-HINCKLEY OGDEN, UT OJC ACE JOHNSON COUNTY EXECUTIVE OLATHE, KS OLM ANM OLYMPIA RGNL OLYMPIA, WA OLV ASO OLIVE BRANCH OLIVE BRANCH, MS OMN ASO ORMOND BEACH MUNI ORMOND BEACH, FL OPF ASO OPA-LOCKA EXECUTIVE MIAMI, FL ORH ANE WORCESTER RGNL WORCESTER, MA OSH AGL WITTMAN RGNL OSHKOSH, WI OSU AGL OHIO STATE UNIVERSITY COLUMBUS, OH OTH ANM SOUTHWEST OREGON RGNL NORTH BEND, OR OUN ASW UNIVERSITY OF OKLAHOMA WESTHEIMER NORMAN, OK OWB ASO OWENSBORO-DAVIESS COUNTY OWENSBORO, KY OWD ANE NORWOOD MEMORIAL NORWOOD, MA OXC ANE WATERBURY-OXFORD OXFORD, CT OXR AWP OXNARD OXNARD, CA PAH ASO BARKLEY RGNL PADUCAH, KY PDT ANM EASTERN OREGON RGNL AT PENDLETON PENDLETON, OR PGD ASO PUNTA GORDA PUNTA GORDA, FL PIH ANM POCATELLO RGNL POCATELLO, ID PKB AEA MID-OHIO VALLEY RGNL PARKERSBURG, WV PMD AWP PALMDALE USAF PLANT 42 PALMDALE, CA PMP ASO POMPANO BEACH AIRPARK POMPANO BEACH, FL PVU ANM PROVO MUNI PROVO, UT PWA ASW WILEY POST OKLAHOMA CITY, OK RAL AWP RIVERSIDE MUNI RIVERSIDE, CA RAP AGL RAPID CITY RGNL RAPID CITY, SD RBD ASW DALLAS EXECUTIVE DALLAS, TX RDD AWP REDDING MUNI REDDING, CA RDM ANM ROBERTS FIELD REDMOND, OR RME AEA GRIFFISS INTL ROME, NY
43

Table B-5 List of FAA Contract Towers Location Identifier Region Airport Name City, State
RNM AWP RAMONA RAMONA, CA RNT ANM RENTON MUNI RENTON, WA ROG ASW ROGERS MUNI-CARTER FIELD ROGERS, AR RYN AWP RYAN FIELD TUCSON, AZ RYY ASO COBB COUNTY-MC COLLUM FIELD ATLANTA, GA SAC AWP SACRAMENTO EXECUTIVE SACRAMENTO, CA SAF ASW SANTA FE MUNI SANTA FE, NM SAW AGL SAWYER INTL MARQUETTE, MI SBP AWP SAN LUIS COUNTY RGNL SAN LUIS OBISPO, CA SBY AEA SALISBURY-OCEAN CITY WICOMICO RGNL SALISBURY, MD SDM AWP BROWN FIELD MUNI SAN DIEGO, CA SFF ANM FELTS FIELD SPOKANE, WA SGJ ASO NORTHEAST FLORIDA RGNL ST AUGUSTINE, FL SGR ASW SUGAR LAND RGNL HOUSTON, TX SIG ASO FERNANDO LUIS RIBAS DOMINICCI SAN JUAN, PR SJT ASW SAN ANGELO RGNL/MATHIS FIELD SAN ANGELO, TX SLE ANM MCNARY FLD SALEM, OR SLN ACE SALINA RGNL SALINA, KS SMX AWP SANTA MARIA PUB/CAPT G ALLAN HANCOCK FLD SANTA MARIA, CA SNS AWP SALINAS MUNI SALINAS, CA SPG ASO ALBERT WHITTED ST PETERSBURG, FL SQL AWP SAN CARLOS SAN CARLOS, CA SSF ASW STINSON MUNI SAN ANTONIO, TX STC AGL ST CLOUD RGNL ST CLOUD, MN STJ ACE ROSECRANS MEMORIAL ST JOSEPH, MO STX ASO HENRY E ROHLSEN CHRISTIANSTED, VI SUA ASO WITHAM FIELD STUART, FL SUN ANM FRIEDMAN MEMORIAL HAILEY, ID SWF AEA STEWART INTL NEWBURGH, NY SWO ASW STILLWATER RGNL STILLWATER, OK TCL ASO TUSCALOOSA RGNL TUSCALOOSA, AL TIW ANM TACOMA NARROWS TACOMA, WA TIX ASO SPACE COAST RGNL TITUSVILLE, FL TKI ASW COLLIN COUNTY RGNL AT MC KINNEY DALLAS, TX
TOP ACE PHILIP BILLARD MUNI TOPEKA, KS TTD ANM PORTLAND-TROUTDALE PORTLAND, OR TTN AEA TRENTON MERCER TRENTON, NJ TUP ASO TUPELO RGNL TUPELO, MS TXK ASW TEXARKANA RGNL-WEBB FIELD TEXARKANA, AR TYR ASW TYLER POUNDS RGNL TYLER, TX TZR AGL BOLTON FIELD COLUMBUS, OH UES AGL WAUKESHA COUNTY WAUKESHA, WI UGN AGL WAUKEGAN RGNL CHICAGO/WAUKEGAN, IL UNV AEA UNIVERSITY PARK STATE COLLEGE, PA VCT ASW VICTORIA RGNL VICTORIA, TX VCV AWP SOUTHERN CALIFORNIA LOGISTICS VICTORVILLE, CA VQQ ASO CECIL JACKSONVILLE, FL WDG ASW ENID WOODRING RGNL ENID, OK WHP AWP WHITEMAN LOS ANGELES, CA WJF AWP GENERAL WM J FOX AIRFIELD LANCASTER, CA
44

Table B-5 List of FAA Contract Towers
Location Identifier Region Airport Name City, State
XNA ASW NORTHWEST ARKANSAS RGNL FAYETTEVILLE/SPRINGDALE/, AR YKM ANM YAKIMA AIR TERMINAL/MCALLISTER FIELD YAKIMA, WA
Listed 252 Airports.
45