Embed Size (px)
Citation preview
Clim. Past, 5, 615–632, 2009www.clim-past.net/5/615/2009/© Author(s) 2009. This work is distributed underthe Creative Commons Attribution 3.0 License.
Climateof the Past
Terrestrial climate variability and seasonality changes in theMediterranean region between 15 000 and 4000 years BP deducedfrom marine pollen records
I. Dormoy1,2, O. Peyron1, N. Combourieu Nebout2, S. Goring3, U. Kotthoff 4,5, M. Magny1, and J. Pross4
1Laboratory of Chrono-Environnement, UMR CNRS 6249, University of Franche-Comte, 16 route de Gray,25030 Besancon, France2Laboratory of Sciences of Climate and Environment, UMR 1572 CEA-CNRS-UVSQ, domaine du CNRS,avenue de la Terrasse, 91198 Gif-sur-Yvette, France3Department of Biological Sciences, Simon Fraser University, 8888 University Drive, Burnaby, British Columbia,V5A 1S6, Canada4Institute of Geosciences, University of Frankfurt, Altenhoferallee 1, 60438 Frankfurt, Germany5Department of Geosciences, Hamburg University, Bundesstrasse 55, 20146 Hamburg, Germany
Received: 26 January 2009 – Published in Clim. Past Discuss.: 27 February 2009Revised: 14 September 2009 – Accepted: 15 September 2009 – Published: 19 October 2009
Abstract. Pollen-based climate reconstructions were per-formed on two high-resolution pollen marines cores from theAlboran and Aegean Seas in order to unravel the climaticvariability in the coastal settings of the Mediterranean re-gion between 15 000 and 4000 years BP (the Lateglacial, andearly to mid-Holocene). The quantitative climate reconstruc-tions for the Alboran and Aegean Sea records focus mainlyon the reconstruction of the seasonality changes (tempera-tures and precipitation), a crucial parameter in the Mediter-ranean region. This study is based on a multi-method ap-proach comprising 3 methods: the Modern Analogues Tech-nique (MAT), the recent Non-Metric Multidimensional Scal-ing/Generalized Additive Model method (NMDS/GAM) andPartial Least Squares regression (PLS). The climate signalinferred from this comparative approach confirms that coldand dry conditions prevailed in the Mediterranean region dur-ing the Oldest and Younger Dryas periods, while temper-ate conditions prevailed during the Bølling/Allerød and theHolocene. Our records suggest a West/East gradient of de-creasing precipitation across the Mediterranean region dur-ing the cooler Late-glacial and early Holocene periods, simi-lar to present-day conditions. Winter precipitation was high-est during warm intervals and lowest during cooling phases.Several short-lived cool intervals (i.e. Older Dryas, an-other oscillation after this one (GI-1c2), Gerzensee/Preboreal
Correspondence to:I. Dormoy([email protected])
Oscillations, 8.2 ka event, Bond events) connected to theNorth Atlantic climate system are documented in the Albo-ran and Aegean Sea records indicating that the climate oscil-lations associated with the successive steps of the deglacia-tion in the North Atlantic area occurred in both the westernand eastern Mediterranean regions. This observation con-firms the presence of strong climatic linkages between theNorth Atlantic and Mediterranean regions.
1 Introduction
Research on the natural climate variability during the recentdecades has been immensely stimulated by the increasingmanifestation of anthropogenic climate change. Such re-search can provide support in evaluating future climate sce-narios and as such may be instrumental in extending the leadtime for adaptation (e.g. Alley et al., 2003; Mayewski et al.,2004; IPCC, 2007). The Mediterranean region is particularlysensitive to short-term climate change due to its intermedi-ate position between the higher-latitude (i.e. North Atlantic-influenced) and lower-latitude (i.e. monsoonally influenced)climate systems. Consequently, future climate change canbe expected to be particularly strong in this region and willlikely have a strong impact on terrestrial ecosystems (Ched-dadi et al., 2001).
The present-day Mediterranean climate is characterised bya strong seasonality, with warm to hot, dry summers and
Published by Copernicus Publications on behalf of the European Geosciences Union.

616 I. Dormoy et al.: Terrestrial climate variability and seasonality changes in the Mediterranean region
3232
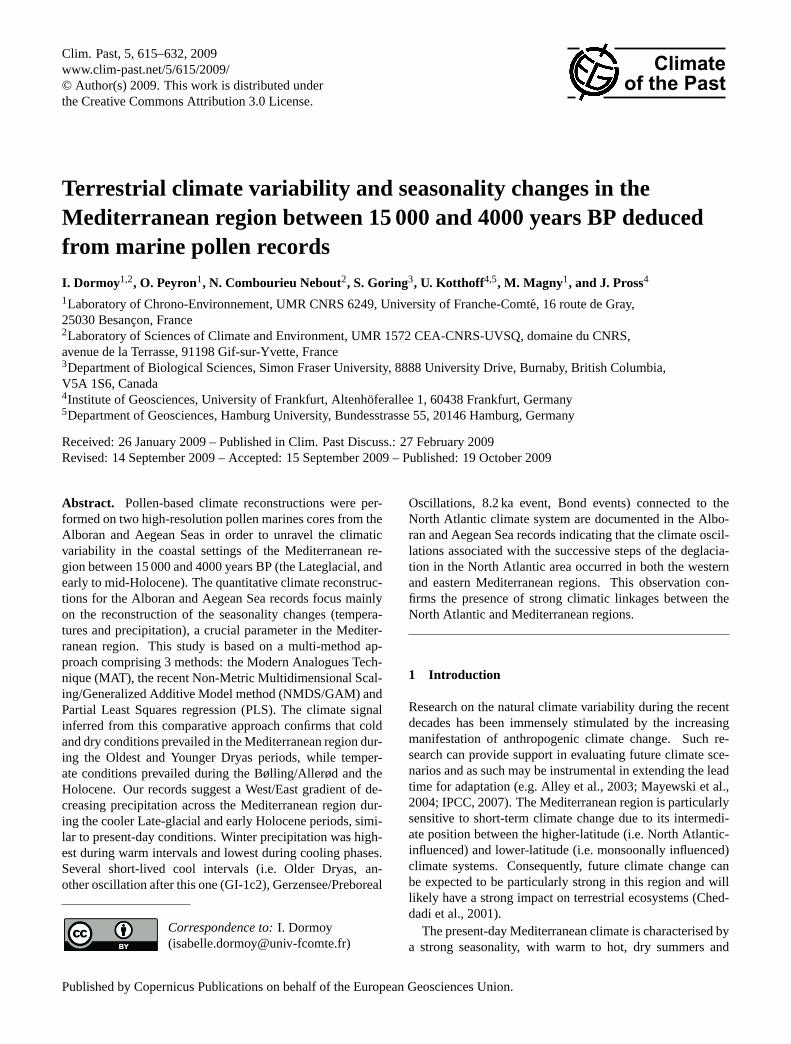
Fig. 1. Map of the Mediterranean Sea with locations of the cores ODP 976 and SL 152 (dark stars).
mild wet winters (Quezel and Medail, 2003; Lionello et al.,2006). Both terrestrial (i.e. pollen, ostracods, speleothems,lake-levels) and marine (i.e. planktic foraminifera, dinoflag-ellate cysts, coccoliths) proxies show that the Mediterraneanregion experienced very different climatic and environmentalconditions during the Lateglacial and much of the Holocene,and that these climate changes differ significantly acrossthe Mediterranean from north to south, and from west toeast (e.g. Wijmstra, 1969; Pons and Reille, 1988; Zonn-eveld, 1996; Combourieu Nebout et al., 1998; Geraga etal., 2000; Colmenero-Hildago et al., 2002; Perez-Folgadoet al., 2003; Lawson et al., 2004; Drescher-Schneider etal., 2007; Davis and Stevenson, 2007; Magny et al., 2003,2006b, 2007; Zanchetta et al., 2007; Kotthoff et al., 2008a,b). The quantitative paleoclimatic reconstructions inferredfrom pollen and chironomids records (e.g. Huntley et al.,1999; Davis et al., 2003; Heiri et al., 2007; Kotthoff et al.,2008a, b; Larocque and Finsinger, 2008), along with modelsimulations (e.g. Wiersma and Renssen, 2006; Brewer et al.,2007b) also indicate complex climate trends and regional cli-mate patterns across the Mediterranean region for the last15 000 years BP. A key parameter within this climatic evo-lution is the seasonal distribution of temperature and precip-itation (Rohling et al., 2002; Tzedakis, 2007).
In view of the above, we here aim to reconstruct the cli-matic trends and estimate the magnitude of temperature andprecipitation changes in the Mediterranean region over thepast 15 000 years BP; moreover, we explore the extent ofclimatic linkages between the North Atlantic and Mediter-ranean regions. Our reconstructions are based on quantitativeclimate estimates derived from two high-resolution pollenrecords in the eastern (core SL 152; Kotthoff et al., 2008a,
b) and western (ODP Leg 161 Site 976; Combourieu-Neboutet al., 1999, 2002) Mediterranean region. The quantitativeclimate estimates were performed with a special emphasisto reconstructing changes in seasonality, summer and win-ter temperatures, and summer and winter precipitation. Be-cause each of the different procedures used in the climaticinterpretation of paleoecological signals has its own set ofadvantages and limitations (Birks and Birks, 2006; Breweret al., 2007a), we here follow an approach that integrates theclimate data inferred from three quantitative methods. Sim-ilar approaches have been successfully applied to other re-gions and time intervals (e.g. Peyron et al., 2005; Brewer etal., 2008). It has been shown to yield more precise and ro-bust climate estimates than approaches that relied on onlyone method (e.g. Lotter et al., 2000; Peyron et al., 2000,2005, 2006; Brewer et al., 2008). Here, the Modern Ana-logue Technique (MAT; Guiot, 1990), the well-known Par-tial Least Squares regression (PLS; Wold et al., 1984) andthe recently developed Non-Metric Multidimensional Scal-ing/Generalized Additive Model (NMDS/GAM; Goring etal., 2009) methods are used.
2 Data and methods
This study is based on two well-dated high-resolution pollenrecords from marine cores located along a West/East gradientacross the Mediterranean Sea (Fig. 1). Core ODP Leg 161Site 976 (Combourieu-Nebout et al., 1999, 2002, 2009)was retrieved from the Alboran Sea located between SouthIberia and North Africa (36◦12′ N, 4◦18′ W, 1108 m waterdepth). The lands bordering the Alboran Sea are dominated
Clim. Past, 5, 615–632, 2009 www.clim-past.net/5/615/2009/

I. Dormoy et al.: Terrestrial climate variability and seasonality changes in the Mediterranean region 617
by mountains composed of the Baetic Sierras (Spain) andthe Rif (Morocco). The modern Alboran Sea hydrology ismarked by an antiestuarine circulation. The Mediterraneanintermediate and deep saline waters leave the MediterraneanSea from the East to the West through the Gibraltar strait(Bethoux and Prieur, 1984).
Core SL 152 (Kotthoff et al., 2008a, b) was obtainedfrom the Mount Athos Basin, Northern Agean Sea (40◦19′ N,24◦36′ E, 978 m water depth). Pollen carried into the MountAthos Basin through aerial and fluvial transport is predomi-nately derived from the northern borderlands of the AegeanSea (Kotthoff et al., 2008a, b).
The chronology is based on six14C dates in Alboran Seaand seven in Aegean Sea between 15 000 and 4000 years BP(Fig. 2; Combourieu-Nebout et al., 1999, 2002; Kotthoff etal., 2008a, b). The dates were corrected assuming reservoirages of 400 years in the core ODP 976 to account for14Creservoir age of the modern Alboran Sea surface water. And,the dates in the core SL 152 have been corrected by 400years, except the14C date “12 430 yr BP” in depth 505 cm,following Siani et al. (2001). And in both cores, the dateswere converted into calendar years after Stuiver et al. (1998)and Fairbanks et al. (2005). The sampling resolution rangesfrom 40 to 250 years for the core from ODP Site 976, andfrom 30 to 180 years for core SL 152 with the highest reso-lution of 270 to 350 cm. The preparation of pollen sampleswas carried out following the classical protocol (Faegri andIversen, 1964).
2.1 Pollen data
Figure 2 and Table 1 summarize the main vegetation changesin the Alboran and the Aegean Seas over the past 15 000years BP. In-depth descriptions of the palynological changesdocumented in both cores are available in Combourieu-Nebout et al. (2009) for the Alboran Sea and in Kotthoff etal. (2008a, b) for the Aegean Sea.
Both cores have high proportions ofArtemisia, Chenopo-diaceae and Ephedra to 14.7 kyr BP. Temperate forestspecies are all found in low proportions (Quercus, Al-nus, Betula, Populus, Salix, Carpinusand Fagus, all<10%). From 14.7 to 12.5 kyr BP, pollen taxa associ-ated with deciduous forests increase to 45%, and the semi-desert taxa such asArtemisia decrease rapidly. Between12,5 to 11.7 kyr BP, during the Younger Dryas an increaseof Artemisia, Chenopodiaceaeand Ephedraare associatedwith a decrease ofQuercus. During short-lived events oc-curred within the Lateglacial, semi-desert taxa increase andthe temperate forest taxa decrease slightly. From 11.7 to4 kyr BP,Quercusand temperate forest taxa increase to 70%(Mediterranean taxa increase too). During short-lived events(possibly corresponding to the Preboreal Oscillation andthe 8.2 ka event) theCichorioideaeandChenopodiaceaein-crease slightly.
2.2 Climate reconstruction methods
The quantitative reconstructions are derived from theModern Analogue Technique (MAT), the Non-MetricMultidimension Scaling/Generalized Additive Model(NMDS/GAM) method, and the Partial Least Squareregression (PLS) approach.
The MAT (Guiot, 1990) uses modern pollen surface sam-ples and the corresponding modern climate to infer paleocli-mate parameters. The method consists of selecting a set ofmodern samples (or analogues) that most closely resembleeach fossil pollen sample. The dissimilarity between eachfossil sample and modern pollen assemblage is evaluated bya chord distance (Guiot, 1990). Usually, the ten modern spec-tra that have the smallest distance from a given pollen spec-trum are considered as the best modern analogues and subse-quently used for the reconstruction. If the chord distance isabove a threshold defined by a Monte-Carlo method (Guiot,1990), the modern samples are considered as poor analoguesand not taken into account in the reconstruction. Estimatesof climatic parameters are obtained by using a weighted av-erage of the values for all selected best modern analogues,where the weights used are the inverse of the chord distance.
The NMDS/GAM method (Goring et al., 2009) recon-structs climate parameters by applying an NMDS ordinationto the modern pollen data and fitting a GAM for the climateparameter of interest to the NMDS ordination output. Thistechnique reduces the effects of co-linearity among pollentaxa, accounts for species gradients and, since NMDS is anon-parametric ordination procedure, reduces the likelihoodthat the statistical assumptions common in standard pollen-based reconstruction methods – such as normal distributionsfor pollen proportions – will be violated by the methods.
The PLS method used in this study is a technique thateliminates co-linearity among predictor variables through theselection of orthogonal components obtained from the singu-lar decomposition of the response (climate parameters) andpredictor (pollen taxon) variables. This improves the similarprincipal components regression since the response variableis specifically taken into account in the initial component de-composition (Wold et al., 1984). The PLS method is com-monly used and may be paired with weighted averaging (terBraak and Juggins, 1993), although this does not always im-prove the prediction results (Goring et al., 2009).
All three methods are based on present-day environmentalconditions and therefore require high-quality, taxonomicallyconsistent modern pollen and climate datasets. The modernpollen dataset used here is based on 3542 modern samples,among which more than 2000 are from the Mediterraneanregion (Bordon et al., 2009). For the present study, bisaccatepollen (Pinus) was removed from the pollen sums because itis generally overrepresented in marine pollen assemblages.
The three methods were used to reconstruct the an-nual precipitation (PANN), seasonal precipitation (PWinteris the sum of the precipitation occurring from December
www.clim-past.net/5/615/2009/ Clim. Past, 5, 615–632, 2009

618 I. Dormoy et al.: Terrestrial climate variability and seasonality changes in the Mediterranean region
ODP Leg 161 site 976 - Alboran Sea
.
100
150
200
250
300
350
400
450
500
550
600
Depth
(cm
)
Ages (
cal yr)
20 40 60 80 100
Pinu
sAb
ies
20 40
Cedrus
20 40
ERIC
ACEA
E
20 40 60
Quercus
decid
uous
20
Quercus
ilex t
ype
Pista
cia
Olea Centaurea
ASTE
ROIDEA
E
20
CICHORIO
DEAE
BRAS
SICAC
EAE
CARYO
PHYL
LACEA
E
CYPER
ACEA
E
POAC
EAE
20 40
Artemisi
a
Ephe
dra
20
CHENOPO
DIACEA
E
Aqua
tic ta
xa
20
Isoetes
20
PTER
IDOPH
YTA
Altid. Forest Lowland Forest Open vegetation Semid desert
8.2 ka
PBO
YD
G.O.
GI-c2
Older DryasBøllingOldest Dryas
Altid. Forest Lowland Forest Open vegetation Semid desert
200
250
300
350
400
450
500
Geo TÜ SL152 - Aegean Sea
4462
5599
7078
8226
9851
11479
13738
20 40 60 800 20 40
20 40 60 80 20 20 20 40 20 20 20 20 20 40
LA
TE
GL
AC
IAL
H
OL
OC
EN
E
20 40 60
Figure 2
8.2 ka
PBO
YD
G.O.
GI-c2
Older Dryas
Bølling
Oldest Dryas
LA
TE
GL
AC
IAL
HO
LO
CE
NE
3497
7889
9722
11682
13988
14911
Depth
(cm
)
Ages (
cal yr)
Pinu
sAb
ies
ERIC
ACEA
E
Quercus
(total)
Quercus
ilex ty
pe
OleaCen
taurea
CICHORIO
DEAE
BRAS
SICAC
EAE
CARYO
PHYL
LACEA
E
Artemisi
a
Ephe
dra
CHENOPO
DIACEA
E
PTER
IDOPH
YTA
Corylu
s
CYPER
ACEA
E
ASTE
ROIDEA
E
POAC
EAE
Fig. 2. Simplified pollen diagrams from cores ODP Leg 161 Site 976 (Alboran Sea; Combourieu-Nebout et al., 2002, 2009) and GeoTuSL 152 (Aegean Sea; Kotthoff et al., 2008a, b). Horizontal grey bands mark cooling phases.
Clim. Past, 5, 615–632, 2009 www.clim-past.net/5/615/2009/

I. Dormoy et al.: Terrestrial climate variability and seasonality changes in the Mediterranean region 619
Table 1. Vegetation changes of core ODP Leg 161 site ODP 976 and core SL 152.
ODP Leg 161 site 976 – Pollensignature Chronology Biozones GeoTü SL 152 – Pollen signature
Quercus and temperate forest (45-70%)Persistence of Cichorioideae (10-25%) and Chenopodiaceae (5%)
Quercus and temperate forest (60-80%)
Persistence of Cichorioideae(15%)
Quercus and temperate forestdecrease (<55%)Cichorioideae increase (>25%) 8.
2ka
Quercus and temperate forestdecrease (<60%)Cichorioideae increase (>35%)
Quercus increase (40- 60%)Poaceae and Cyperaceae increase
Quercus increase (30- 80%)
Quercus and temperate forestdecrease (<40%)Cedrus increase (15%) PB
O Quercus and temperate forestdecrease (<15%)Cichorioideae increase (>35%)
temperate forest increase (40%)Artemisia and Ephedra decrease,persistence of Chenopodiaceae
Early
toM
id-H
oloc
ene
(11,
700
to40
00yr
s)
temperate forest increase (30-40%)semi-desert decrease (<10%)
semi-desert increase: Artemisia(15%), Chenopodiaceae (15%),Ephedra (5%)Quercus decrease (15%)
YoungerDryas
(12,500 to 11,700yrs)
semi-desert increase (Artemisia 10-15%, Chenopodiaceae 10-15%,Ephedra 10-20%)Quercus decrease (20%)
temperate forest and Quercusincrease
temperate forest and Quercusincrease
temperate forest decrease (<25%)semi-desert increase (Artemisia-Chenopodiaceae >10%) G
erze
nsee
Osc
illat
ion
temperate forests decrease (<30%)semi-desert increase (>25%Artemisia-Chenopodiaceae )
temperate forest and Quercusincrease
temperate forest and Quercusincrease
temperate forest decrease (<30%)semi-desert increase (Artemisia-Chenopodiaceae >20%) G
I-1c
2 temperate forests decrease(<30%)semi-desert increase (>20%Artemisia-Chenopodiaceae)
Quercus increase (40-45%)
Alle
rød
(13,
8 00
t o12
,500
y rs)
Quercus increase (40%)
temperate forest decrease (<15%)semi-desert increase (Artemisia-Chenopodiaceae >15%)
Older Dryas(14,100 to 13,800
yrs)
temperate forests decrease(<20%)semi-desert increase (>30%)
Temperate increase (30%) andmediterranean forests (15%)semi-desert decrease (<15%)
Bølling(14,700 to 14,100
yrs)
temperate forests increase (40-50%)semi-desert decrease(<20%)
Low percentages in Quercus andtemperate forest (<10%Semi-desert associations(Artemisia 15%, Chenopodiaceae5%, Ephedra 10%)
Oldest Dryas(to 14,700 yrs)
Low percentages in Quercus andtemperate forest (<15%)Semi-desert associations(Artemisia 5%, Chenopodiaceae5%, Ephedra 10%)
Table 1. Vegetation changes of core ODP Leg 161 site ODP 976 and core SL 152. www.clim-past.net/5/615/2009/ Clim. Past, 5, 615–632, 2009

620 I. Dormoy et al.: Terrestrial climate variability and seasonality changes in the Mediterranean region
to February inclusive, and PSummer of the precipitationsum from June to August inclusive), mean temperature ofthe coldest month (MTCO) and mean temperature of thewarmest month (MTWA).
3 Results and discussion
3.1 Oldest Dryas (to 14.7 kyr BP)
The pollen data indicate cold and arid conditions for the bor-derlands of the Alboran and Aegean Seas (Figs. 3 and 4)before 14.7 kyr BP. The quantitative reconstructions confirmthe prevalence of cold and dry conditions before 14.7 kyr BPin the Alboran Sea, with low winter (up to−10◦C) andsummer (up to 14◦C) temperatures and winter precipita-tion values (Fig. 3). High percentages of semi-desertspecies (ArtemisiaandChenopodiaceae) in both records arein agreement with terrestrial pollen records from TenaghiPhilippon in Greece (Wijmstra, 1969), Lake Maliq in theBalkans (Bordon et al., 2009) and marine pollen recordsfrom western Iberia (Naughton et al., 2007). Low tem-peratures during this period are supported by foraminiferaabundance data from the Myrtoon basin (SW Aegean Sea),where cold species dominate the assemblages (Geraga et al.,2000). Reconstructed winter anomalies are in agreementwith estimates from Lago Grande di Monticchio in CentralItaly (Huntley et al., 1999). Annual precipitation values at15 kyr BP reconstructed from the Alboran pollen record areslightly lower than today. This result is similar to the situa-tion reconstructed for the Balkans (Bordon et al., 2009). It isalso supported by previous pollen-based climate reconstruc-tions from the Alboran Sea (Kageyama et al., 2005).
In the Aegean Sea, both NMDS/GAM and MAT methodsindicate mean temperature of the coldest month around 0◦C,mean temperature of the warmest month around 21◦C, andannual precipitation 100 mm lower than modern precipitationvalues (Fig. 4). The PLS method indicate strongly differentvalues (such discrepancies in the methods are discussed indetail in the part 4 of the current study). The transition be-tween the Oldest Dryas and the Bølling/Allerød is more pro-nounced and rapid in the reconstructions from the AlboranSea than in the Aegean Sea. This dramatic transition seen inthe Alboran record is similar to those seen in marine and ter-restrial records from western Spain (Naughton et al., 2007).
3.2 Bølling/Allerød (14.7 to 12.5 kyr BP)
From 14.7 to 12.5 kyr BP, both marine pollen records indi-cate an early temperate phase marked by the expansion ofdeciduous and Mediterranean forest elements (Fig. 2 and Ta-ble 1). This suggests warm, moist climate conditions for theborderlands of the Western and Eastern Mediterranean Sea(Combourieu-Nebout et al., 1999; Zonneveld, 1996). The
presence ofPistacia in the Alboran Sea record during thisperiod suggests a mild winter sincePistacia is not found atsites with minimum temperatures below 5◦C (Mudie et al.,2002; Quezel and Medail, 2003).
Warm, moist conditions are also evident from the pollen-based climate reconstructions during this period (Figs. 3and 4). They indicate the establishment of a sub-seasonal“Mediterranean” rainfall regime with hot, dry summers andcool, wet winters (PWinter: 130–250 mm, PSummer: 50 to100 mm), less marked in the Aegean Sea. Our results fromthe Alboran Sea (MAT) suggest that a seasonality compa-rable to modern condition in that region (with high winterprecipitation and low summer precipitation) first occurred at14.7 kyr BP and is comparable in trend but not in magnitudeto modern seasonality observed in the Alboran Sea. The tran-sition to modern precipitation seasonality is not observed inthe Aegean core, SL 152, suggesting that it may have takingplace earlier than 15 kyr BP (Fig. 4).
The results obtained with three methods shows at leastthree rapid and abrupt short-term events which punctuate theLate-glacial interstadial in the Alboran and Aegean Seas at14.1−13.9, 13.5−13.4. and 13−12.6 kyr BP, and may be re-lated to the Older Dryas, Greenland Interstadial-1c2 (GI-1c2)and the Gerzensee Oscillation respectively (Rasmussen et al.,2006; Brauer et al., 2000). Here, the pollen-based precipita-tion reconstructions show sharp drops in annual and sum-mer precipitation for the borderlands of the Aegean Sea, andsmaller drops in the borderlands of the Alboran Sea that cor-relate with the GI-1d (Older Dryas) and GI-1b (Gerzenseeoscillation) events in the GRIP and NGRIP records (Figs. 3and 4; Bjorck et al., 1998; Rasmussen et al., 2006). TheOlder Dryas shows a negative anomaly of 2–6◦C for MTWAand MTCO, a drop of 100–200 mm for PANN, and between25 to 100 mm for PWinter in the both cores. During the GI-1c2, the MTCO and MTWA decrease between 2 and 5◦C,the Annual and Winter Precipitations show a drop of 50 to200 mm in the Alboran and Aegean Seas. And the GerzenseeOscillation shows a drop of 2–3◦C for the Mean Temperatureof the Warmest and the Coldest Months, PANN and PWin-ter decrease between 50 and 200 mm in the cores ODP 976and SL 152. For each oscillations, the PSummer increase be-tween 50 to 100 mm in the Aegean Sea and decrease between25 to 50 mm in the Alboran Sea. These successive oscil-lations are well documented in Northern and Central Europe(Lotter et al., 1992; Peyron et al., 2005; Magny et al., 2006a),and to a lesser extent, in the Mediterranean region (Asioli etal., 1999; Magny et al., 2006b; Drescher-Schneider et al.,2007).
Our study reveals strong temperature responses to theseevents in the Aegean Sea pollen record, with drops of upto 4◦C in winter temperature, and equivalent, but somewhatearlier changes in the Alboran Sea. The precipitation recordshows a similar pattern, with smaller changes in the Albo-ran resulting in an overall precipitation gradient from Eastto West (with dryer conditions in the East) that matches the
Clim. Past, 5, 615–632, 2009 www.clim-past.net/5/615/2009/

I. Dormoy et al.: Terrestrial climate variability and seasonality changes in the Mediterranean region 621
A ge (ca l K yr B .P .)4 5 6 7 8 9 10 11 12 13 14 15
-42
-40
-38
-36
-34
-32
0
20
40
60
12141618202224
-10
-5
0
5
10
40
600
800
1000
0
50
100
150
A ge (ca l K yr B .P .)
4 5 6 7 8 9 10 11 12 13 14 150
100
200
300
400
Figure 3
PBO
GS-1
GI-1a GI-1c
GI-1bGI-1d
GI-1e
GS-2
8.2
4 5 6 7 8c
d e--
8.2k
a Ger
zens
ee O
.
GI-
1c2
NG
RIP
(ð18
O)
MTW
A [°
C]
MTC
O [°
C]
PAN
N [m
m]
PSum
mer
[mm
]
PWin
ter [
mm
]
Tem
pera
te [%
]Se
mi-D
eser
t [%
]
PLS MethodMAT Method Modern values
GAM Method
Holocene Younger Dryas Allerød
Bøl
ling
Old
est D
ryas
Old
er D
ryas
Fig. 3. Climate reconstructions for the borderlands of the Alboran Sea based on the pollen data from core ODP Leg 161 Site 976(Combourieu-Nebout et al., 2009). Percentages of temperate taxa and semi-desert taxa in percent are marked in green and red, respectively.MTWA=mean temperature of the warmest month, MTCO=mean temperature of the coldest month. Annual (PANN), winter (PWinter) andsummer (PSummer) precipitation is indicated as reconstructed with the MAT, NMDS/GAM and PLS methods. The RMSE values for MATare 2.55 for MTWA, 4.02 for MTCO, 186.70 for PANN, 16.01 for PSummer and 27.02 for PWinter. The RMSEP values for NMDS/GAMand PLS (in this order) are 3.04 and 3.68 for MTWA, 4.94 and 6.39 for MTCO, 227.27 and 271.92 for PANN, 50.39 and 67.52 for PSum-mer, and 77.69 and 91.59 for PWinter. Horizontal grey bands correspond to cool climate oscillations: Oldest Dryas, Older Dryas, GI-1c2,Gerzensee oscillation, Younger Dryas, 8.2 ka event are indicated in black. The short-term events defined by Bond et al. (1997) are named“4 to 8” in blue. The events indicated by Favaretto et al. (2008) are named “c, d and e” in red. NGripδ18O after North Greenland Ice CoreProject members (2004).
www.clim-past.net/5/615/2009/ Clim. Past, 5, 615–632, 2009

622 I. Dormoy et al.: Terrestrial climate variability and seasonality changes in the Mediterranean region
modern gradient in the Mediterranean. The study of newsites, particularly in the center of the Mediterranean Sea,could test this assumption.
3.3 Younger Dryas (12.5 to 11.7 kyr BP)
A rapid decrease in temperature and precipitation (annualand winter) occurred during the Younger Dryas in both therecords (Figs. 3 and 4). During this interval,Artemisiapollenpercentages increased in the Alboran (+20%) and AegeanSea cores (+30%) indicating a pronounced aridity (Fig. 2).These results are in agreement with increases in semi-desertpollen taxa recorded in the marine pollen cores MD 90-2043 (Alboran Sea; Fletcher and Sanchez-Goni, 2008) andMD 90-917 (Adriatic Sea; Combourieu-Nebout et al., 1998,1999), and in the terrestrial pollen record from Padul, Spain(Pons and Reille, 1988). In the Alboran Sea, winter tempera-ture values of approximately−2 to−4◦C during the YoungerDryas correspond to a strong decline in temperatures withMTCO anomalies of−8 to −10◦C, while the anomaly ofMTWA is around −6◦C with the PLS and NMDS/GAMmethods (Fig. 3). In general, the amplitude of the YoungerDryas cooling event is larger for the MAT reconstructionthan the NMDS/GAM and PLS methods. The results ob-tained with the MAT for Mean Temperature of the ColdestMonth and Annual Precipitation are however in agreementwith those simulated by Renssen et al. (2001).
For the Younger Dryas, the temporal resolution of theAegean core SL 152 is higher than that of the Alborancore. Hence, the MAT appears to indicate the presenceof three distinct climate phases during the Younger Dryas(Fig. 4) with colder conditions during the first and thirdphases between 12.6 to 12.4 kyr and 12.2 to 11.7 kyr BP(MTCO:−5◦C and−1◦C). The middle phase of the YoungerDryas, based on the MAT reconstruction, between 12.4 to12.2 kyr BP shows an temperature increase of 3–5◦C whencompared to the colder phases. This pattern is in agreementwith GRIP and NGRIP ice-core records (Bjorck et al., 1998;Rasmussen et al., 2006), pollen-based reconstructions fromthe Jura (Peyron et al., 2005) and the Balkans (Bordon etal., 2009), and chironomid-based reconstructions from NorthItaly (Larocque and Finsinger, 2008).
In the borderlands of the Alboran and Aegean Seas, themean temperature of the coldest month ranged from−5◦Cto 0◦C during the Younger Dryas. These are close to val-ues from Central Italy (Huntley et al., 1999), the centralBalkans (Bordon et al., 2009) but colder than model simu-lations (Renssen et al., 2001). In the Alboran and AegeanSeas, our three pollen-based climate reconstructions showpronounced declines in all three precipitation parameters,particularly for annual and winter precipitation (PANN de-cline: ∼400 mm; PWinter decline:∼100 mm). Thus, theYounger Dryas event seems to affect principally the winterseason (Denton et al., 2005).
The cooling during the Younger Dryas seems to have hadlittle effect on summer climate parameters (both precipita-tion and temperature) in the borderlands of the Aegean andAlboran Seas. This interpretation is well consistent withthe current interpretation of the Younger Dryas event byRenssen et al. (2001). It is of note that wet summer con-ditions are depicted (1) in the Aegean Sea with the ModernAnalogue Technique model and (2) in the Alboran Sea withthe NMDS/GAM model. In the Balkans at Lake Maliq, apollen-inferred climate reconstruction also shows increasedprecipitation seasonality during the Younger Dryas, charac-terised by arid winter conditions and wetter summer condi-tions (Bordon et al., 2009). The present-day summer con-ditions in the Mediterranean area are relatively dry due todownward motion in the atmosphere associated with areasof high surface pressure, such as the Azores High. Duringthe Younger Dryas, these high-pressure centers may havemoved slightly to the South, enabling depressions to reachthe Mediterranean more easily during the summer. However,these interpretations should be treated with caution sincethe underlying climate reconstructions may also be a resultof bias in the modern pollen dataset:Artemisia-dominatedpollen assemblages are today predominantly found in Asiansteppes (including Tibet and Kazakhstan) characterized bylow annual precipitation and precipitation maxima in thespring or summer. This study should confirm this interpreta-tion: the wet conditions reconstructed for the borderlands ofthe Aegean Sea during the Younger Dryas are probably dueto the seasonality regime of the modern semi-desert mod-ern pollen assemblages. Only the PLS method indicates adecline in summer precipitation, in both the Alboran andAegean Seas (Figs. 3 and 4). The summer precipitationvalues simulated by the REMO model present a negativeanomaly compared to present day values over the Europe(Renssen et al., 2001). But the use of another method suchas the inverse modelling method which includes a vegetationmodel could help to better understand this seasonality pattern(Guiot et al., 2000).
3.4 Early to mid-Holocene (11.7 to 4 kyr BP)
3.4.1 Transition younger Dryas/Holocene(11.7 to 9.5 kyr BP)
The pollen data from the Alboran and Aegean cores clearlyindicate warm and moist conditions through this interval,which was climatically much more stable than the Late-glacial (Figs. 3 and 4). Both pollen diagrams show a sig-nificant expansion ofQuercusand temperate taxa (Fig. 2),with the development of temperate forests resulting froman increase in temperature and moisture (Figs. 3 and 4;Combourieu-Nebout et al., 1999, 2009; Kotthoff et al.,2008a, b).
Between 11.7 and 9.5 kyr BP, our quantitative climatereconstructions results indicate a trend toward increasing
Clim. Past, 5, 615–632, 2009 www.clim-past.net/5/615/2009/

I. Dormoy et al.: Terrestrial climate variability and seasonality changes in the Mediterranean region 623
A ge (ca l K yr B .P .)4 5 6 7 8 9 10 11 12 13 14 15
-42
-40
-38
-36
-34
-32
05
1015202530
5
10
15
20
25
-20-15-10
-505
10
300
450
600
750
900
1050
0
50
100
150
A ge (ca l K yr B .P .)
4 5 6 7 8 9 10 11 12 13 14 150
100
200
300
400
PBO
GS-1
GI-1aGI-1c
GI-1bGI-1d
GI-1e
GS-2
8.2
4 5 6 7 8a b --8.
2ka
Ger
zens
ee O
.
GI-1
c2
NG
RIP
(ð18
O)
MTW
A [°
C]
MTC
O [°
C]
PAN
N [m
m]
PSum
mer
[mm
]
PWin
ter [
mm
]
Tem
pera
te [%
]Se
mi-D
eser
t [%
]
PLS MethodMAT Method Modern values
GAM Method
Holocene Younger Dryas Allerød
Bølli
ng
Old
est D
ryas
Old
er D
ryas
3
PBO
Figure 4
Fig. 4. Climate reconstructions for the borderlands of the Aegean Sea based on the pollen data from core SL 152 (Kotthoff et al., 2008a,b). Percentages of temperate taxa and semi-desert taxa are marked in green and red, respectively. MTWA=mean temperature of the warmestmonth, MTCO=mean temperature of the coldest month. Annual (PANN), winter (PWinter) and summer (PSummer) precipitation is indicatedas reconstructed with the MAT, NMDS/GAM and PLS methods. The RMSE values for MAT are 2.55 for MTWA, 4.02 for MTCO, 186.70for PANN, 16.01 for PSummer and 27.02 for PWinter. The RMSEP values for NMDS/GAM and PLS (in this order) are 3.04 and 3.68for MTWA, 4.94 and 6.39 for MTCO, 227.27 and 271.92 for PANN, 50.39 and 67.52 for PSummer, and 77.69 and 91.59 for PWinter.Horizontal grey bands correspond to cool climate oscillations: Oldest Dryas, Older Dryas, GI-1c2, Gerzensee oscillation, Younger Dryas,Preboreal oscillation (PBO), 8.2 ka event are indicated in black. The short-term events defined by Bond et al. (1997) are named “3 to 8” inblue. The events indicated by Geraga et al. (2000) are named “a and b” in red. NGripδ18O after North Greenland Ice Core Project members(2004).
www.clim-past.net/5/615/2009/ Clim. Past, 5, 615–632, 2009

624 I. Dormoy et al.: Terrestrial climate variability and seasonality changes in the Mediterranean region
precipitation in the borderlands of the eastern and west-ern Mediterranean Sea (PANN: 500–700 mm for the Albo-ran Sea, 400–800 mm for the Aegean Sea; PWinter: 100–250 mm for the Alboran and Aegean Seas). Summer pre-cipitations remained relatively high and stable during thetransition from the Younger Dryas to the Holocene, whilethe winter and summer temperatures increase slightly. Al-though precipitation increased, the gain in effective precipita-tion was likely to be small because rising temperatures trendto result in increased evaporation (Renssen and Isarin, 2001).The amplitude of the transition from the Late-glacial to theHolocene is largest in the core from the Aegean Sea with re-gard to winter temperatures. This observation is consistentwith the results of Renssen and Isarin (2001) for the sameinterval. In the borderlands of the Alboran Sea, the sum-mer warming was likely more important than the Januarywarming: the MTCO reaches 5◦C at 11.5 kyr BP with theMAT, this result is well consistent with the value obtained byRenssen and Isarin (2001) for Spain using the ECHAM4 at-mospheric general circulation model, and 2◦C upper than thevalue obtained for Southwest in Europe by Davis et al. (2003)from pollen data.
In the borderland of the Aegean Sea, the warming trendwas interrupted by a short-lived cooling indicated by theMAT method between 11.4 and 10.9 kyr BP (Fig. 4) that maybe related to the Preboreal Oscillation (PBO; Bjorck et al.,1997), a response to meltwater pulses and a sudden decreasein solar activity (Magny et al., 2007). In northern Europe,the PBO is marked by a∼4–5◦C decline in temperature inassociation with low annual and winter precipitation (Daviset al., 2003). Here too, dryer conditions and a more com-plex pattern in summer (Fig. 4) are in agreement with de-clining lake-levels inferred from the Lake Accesa record inCentral Italy (Magny et al., 2007). In the Alboran Sea core,the warming trend was interrupted by three short-term colddry oscillations at 10.8, 10.3 and 10 kyr BP (Fig. 3, events c,d and e). These temperature oscillations are also documentedin foraminifera and pollen records from the western and cen-tral Mediterranean region (Favaretto et al., 2008) and in thealkenone SST records (Sbaffi et al,. 2001) (Fig. 3).
3.4.2 Holocene optimum (9.5 to 7.5 kyr BP)
The early Holocene (9.5 to 7.5 kyr BP) was characterized byhigh temperatures and moist annual and winter conditions inboth the western and eastern Mediterranean regions (Petit-Maire et al., 2005). Previous studies have shown that annualprecipitation reached a maximum during this period both inthe eastern Mediterranean region (Bar-Matthews et al., 1999;Rossignol-Strick, 1999; Kotthoff et al., 2008a, b), and innorthern Africa and central Europe (Magny et al., 2002). Ac-cording to the results of our study, precipitation seasonalityincreased strongly during this period, with winter precipi-tation attaining a maximum at both sites (PWinter: 200 to300 mm) and summer precipitation simultaneously reaching
a minimum (PSummer: 50 to 100 mm). These trends are ev-idenced in all three reconstruction methods applied. Jalut etal. (2009) reconstructed a similar pattern in the Western andCentral Mediterranean with short dry summer periods sincethe beginning of the Holocene that correspond to present-day Mediterranean conditions. This pattern differs from re-sults obtained for other geographical regions, for examplein Northernmost Europe (Allen et al., 2007), and in the East-ern Mediterranean (Rossignol-Strick, 1999; Bar-Matthews etal., 2000) which found abundant year-round moisture withhigher precipitation during the summer. However, such in-terpretation of wet summers in Eastern Mediterranean is stillunder debate (Tzedakis et al., 2007). Reconstructions focus-ing on the mid-Holocene climate (6 kyr BP) for Europe alsoshow that the climatic response varies along a north-southgradient (Cheddadi et al., 1997; Davis et al., 2003; Ched-dadi and Bar-Hen, 2009), and also between the eastern andwestern Mediterranean (Brewer et al., 2009).
The current study shows evidence of strong seasonalitywith hot dry summers and wet winters (MTWA: 20–22◦C,MTCO: 3–5◦C). Temperatures for the coldest and warmestmonths reached modern levels by 9.5 kyr BP. In the MyrtoonBasin of the southern Aegean Sea SST values reached mod-ern values at the same period (Geraga et al., 2000). Thereconstruction of moist conditions during the early to mid-Holocene is consistent with speleothem evidence that showsa substantial increase in winter rainfall in Central Italy dur-ing this period (Zanchetta et al., 2007), and with marine andlacustrine records from the Nile cone (Cheddadi et al., 1995)and the central Italy (Ariztegui et al., 2000). SST recon-structions for the early Holocene do not show a clear pattern.Some authors suggest cooler conditions (Kallel et al., 1997)and others warmer conditions (Marchal et al., 2002) in thenortheast Atlantic and Mediterranean. In contrast to Daviset al. (2003), and in agreement with our own study, the in-ferred climate for this period in a number of marine-basedstudies has also been warm and wet during the winter in theMediterranean region (Rohling and De Rijk, 1999; Arizteguiet al., 2000, Myers and Rohling, 2000). In the AegeanSea, the period from 9.5 to 7 kyr BP represents Sapropel S1(Ariztegui et al., 2000; Kotthoff et al., 2008a, b). Sapro-pels are organic-carbon-rich layers usually found intercalatedwith the more typical organic-poor carbonate sediments ofthe Mediterranean. Most of the lithostratigraphic evidencefor S1 is found in marine cores of the Adriatic Sea, andthe Ionian and Levantine Basins (Emeis et al., 2000). Es-timates of the duration for Sapropel S1 from the Aegeanare longer (9.4−6.8 kyr BP) than those from the Adriatic Sea(e.g. 8.3−6.3 kyr BP; Jorissen et al., 1993; Mercone et al.,2000).
3.4.3 Mid-Holocene (7.5 to 4.0 kyr BP)
During this period, temperatures decline by 3◦C in thewestern Mediterranean region whereas the annual and
Clim. Past, 5, 615–632, 2009 www.clim-past.net/5/615/2009/

I. Dormoy et al.: Terrestrial climate variability and seasonality changes in the Mediterranean region 625
winter precipitation decrease by∼50 mm, while PSummerincreases slightly by the same amount. This decline beganat ∼7.8 kyr BP in the borderlands of the Alboran Sea and at∼7.2 kyr BP in those of the Aegean Sea (Figs. 3 and 4). Adrying phase also begins at 7.9 kyr BP in Italia, in Lake La-gaccione pollen record and between 8 to 7.6 kyr BP in Sicily,Lago di Pergusa (Jalut et al., 2009). The Mid-Holocene hu-mid conditions ended between 7.7 to 7.2 kyr BP in Algero-Balearic basin (Jimenez-Espejo et al., 2008). These resultsare in agreement with the Alboran Sea record presented here.In Turkey (Eski Acigol), the beginning of the dry interval is at6.5 kyr BP (Roberts et al., 2001). Decreasing humidity seemsto develop along a West-to-East gradient.
At 6 kyr BP, winter temperatures are also in agreementwith other temperature reconstructions in Mediterranean forthe mid-Holocene period (Cheddadi et al., 1997; Davis etal., 2003; Brewer et al., 2007b; Wu et al., 2007; Davis andStevenson, 2007). The MTWA anomaly during the mid-Holocene in the Aegean Sea is around−1◦C and the MTCOanomaly is around 0◦C with the MAT method. These resultsare in agreement with the values – also obtained with theMAT – of Davis et al. (2003) in SE Europe and confirm thewarming summer trend reconstructed between 7.5 kyr BP to4.0 kyr BP. In Alboran Sea however, we reconstruct a slightsummer cooling trend between 7.5 kyr BP to 4.0 kyr BP, withMTWA anomalies between 0 to 0.5◦C. The results obtainedfor the Alboran Sea seems not to be agreement with theDavis et al. (2003) study which reconstruct negative sum-mer anomalies associated to a warming summer trend from6.0 kyr BP to 0 kyr BP in SW Europe. Such discrepanciescan be explained by the fact that, in contrast to the currentstudy, Davis et al. (2003) use a modified Modern AnalogueTechnique (Guiot, 1990), using Plant Functional Type scores(Prentice et al., 1996) to select the best modern analogues.The larger modern pollen data set used in the current study,the wide fossil dataset (more than 500 sites) used in Daviset al. (2003) and Davis and Brewer (2009), and the method-ological differences (see this study) may ultimately explainthe differences between the current study and those of Daviset al. (2003). Davis and Brewer (2009) found a summer tem-perature anomaly between−1.5◦C to −0.5◦C in SouthernEurope during the mid-Holocene. They explain the patternof cooling in South Europe and warming in North Europealready shown by Cheddadi et al. (1997), by a latitudinalinsolation gradient. Davis and Brewer (2009) indicate thattemperature sensitivity to both the latitudinal insolation gra-dient and to ice cover forcing may therefore offer an alter-native perspective not just on orbital forcing of high latitudewarming, but also on orbital forcing of low latitude climate.This result is in agreement with the results described in thisstudy, but the trends differ slightly. Between 7.5 kyr BP to4.0 kyr BP, the MTWA values decrease slightly in AlboranSea and are relatively stable in Aegean Sea. The data pre-sented in this paper seems thus not support the hypothesisof Davis and Brewer (2009). More investigation and the
addition of new study sites could allow a better comparisonwith the results obtained by Davis and Brewer (2009) to val-idate or not the Davis and Brewer (2009) hypothesis.
At that time, precipitation in the borderlands of the Alb-oran and Aegean Seas predominantly occurred during thewinter, and summers experienced increasingly dry conditions(+50 to 75 mm/yr as evidenced in all three methods). Wu etal. (2007) have obtained similar results for the Mediterraneanarea at 6 kyr BP based an inverse modelling method whichuse a vegetation model type Biome 4 (Guiot et al., 2000).
The cooling and drying trend which began in Mid-Holocene continues to 4 kyr BP in Northeast Atlantic andMediterranean (Marchal et al., 2002).
3.4.4 The 8.2 ka event and others short-term Holoceneevents
A short-lived cooling event occurs in Alboran and AegeanSeas between 8.4−8.2 kyr BP in our reconstructions, andcould correspond to the regional expression of the 8.2 kaevent well known from ice, marine and terrestrial archives inthe Northern hemisphere (e.g. Von Grafenstein et al., 1998;Mayewski et al., 2004; Alley and Agustsdottir, 2005). Theduration of this event is 150 to 300 years (Thomas et al.,2007; Seppa et al., 2007). These temperature and precipi-tation anomalies of the 8.2 ka event are explained by large-scale changes in the atmospheric circulation resulting from ameltwater outflow into the North Atlantic Ocean and slow-down in North Atlantic deep-water formation (Barber et al.,1999; Rohling and Palike, 2005).
The timing of the Sapropel S1 interruption in the AegeanSea core clearly coincides with the 8.2 ka event (Kotthoff etal., 2008b). The precipitation signals inferred from our re-constructions indicate that the 8.2 ka event resulted in drierconditions in the borderlands of the Alboran and AegeanSeas (Fig. 5). For the Aegean region, this finding is in agree-ment with existing model simulations (Renssen et al., 2001;Wiersma and Renssen, 2006) as well as with terrestrial (Kot-thoff et al., 2008b; Pross et al., 2009) and marine (Rohlinget al., 2002) proxy data. This pattern also is consistent withvarious studies for the Northern hemisphere (Magny et al.,2003; Alley and Agustsdottir, 2005).
The temperature anomalies recorded in the Aegean and theAlboran Sea cores during the winter and summer are around−3◦C. Thus, their magnitudes are similar to the cooling ob-served at Lake Maliq in the Balkans (Bordon et al., 2009),at Tenaghi Philippon in Grecce (Pross et al., 2009) and atAmmersee in Central Europe (Von Grafenstein et al., 1998).The 8.2 ka event was particularly significant for summer tem-peratures with a drop of∼4◦C in the Western Mediterranean(Perez-Folgado et al., 2003) and values of∼1–2◦C elsewherein Europe (Alley and Agustsdottir, 2005). The summeranomaly in this study is in agreement with Perez-Folgadoet al. (2003) but the summer drop is smaller than the winteranomaly in this study.
www.clim-past.net/5/615/2009/ Clim. Past, 5, 615–632, 2009

626 I. Dormoy et al.: Terrestrial climate variability and seasonality changes in the Mediterranean region
.
7 .8 8 .0 8.2 8.4 8.6 8.8
16
18
20
22
24
-9-6-30369
500
600
700
800
900
50
75
100
7 .8 8.0 8.2 8.4 8.6 8.8
100
150
200
250
300
7.8 8.0 8.2 8.4 8.6 8.8
16
18
20
22
24
-9-6-30369
500
600
700
800
900
50
75
100
7 .8 8.0 8.2 8.4 8.6 8.8
100
150
200
250
300
GAM MethodMAT MethodPLS Method
Figure 5
Age (cal Kyr B.P.) Age (cal Kyr B.P.)
Age (cal Kyr B.P.) Age (cal Kyr B.P.)
]C°[ A
WTM
]C°[ OCT
M]
mm[
NN
AP]
mm[ retni
WPPS
umm
er [m
m]
GeoTü SL 152 - Aegean SeaODP Leg 161 site 976 - Alboran Sea
Fig. 5. Expression of the 8.2 ka event as reconstructed from the pollen records of cores ODP Leg 161 Site 976 and SL 152. Climaticparameters presented are mean temperature of the warmest month (MTWA), mean temperature of the coldest month (MTCO), annualprecipitation (PANN), summer precipitation (PSummer) and winter precipitation (PWinter) estimated. The RMSE values for MAT are 2.55for MTWA, 4.02 for MTCO, 186.70 for PANN, 16.01 for PSummer and 27.02 for PWinter. The RMSEP values for NMDS/GAM and PLS(in this order) are 3.04 and 3.68 for MTWA, 4.94 and 6.39 for MTCO, 227.27 and 271.92 for PANN, 50.39 and 67.52 for PSummer, and77.69 and 91.59 for PWinter.
At both sites, the amplitude of variations associated withthe 8.2 ka event is stronger for the PLS model and compa-rable for MAT and NMDS/GAM model. In Alboran Sea,the same variation has been observed with the PLS andNMDS/GAM. In Aegean Sea, the trend of the event is dif-ficult to observed, because the PLS anomalies are moremarked. Wet summer conditions are suggested for the 8.2 kaevent, but the climate pattern of the summer precipitationseems not really clear during this period (PLS indicate wetconditions, while MAT and NMDS/GAM indicate dry con-ditions for the Aegean sea). More studies are required toclarify this pattern.
During the Holocene, five additional short-lived cooland dry events are indicated during for the intervals11.2−10.8 kyr BP (Figs. 3 and 4, event 8), 10.4−10.2 kyr BP(Figs. 3 and 4, event 7), 9.5–9.6 kyr BP (Figs. 3 and 4,event 6), 8.4−8.0 kyr BP (Figs. 3 and 4, event 5 or 8.2 ka),6.0−5.5 kyr BP (Figs. 3 and 4, event 4) and 5.9−4.2 kyr BP(Figs. 4, event 3 in the Aegean Sea). During these events, thewinter and summer temperatures decrease slightly (∼2◦C)along with annual and winter precipitation values. Someof these events can be correlated with phases of lake-levelchanges described by Magny et al. (2002) in the WesternMediterranean around 11.5 kyr BP, 10.5 kyr BP, 9.0 kyr BP7.0 kyr BP, 4.0 kyr BP. The succession of these phases agrees
Clim. Past, 5, 615–632, 2009 www.clim-past.net/5/615/2009/

I. Dormoy et al.: Terrestrial climate variability and seasonality changes in the Mediterranean region 627
well with the lake-level fluctuations at Lake Accesa (Italy)(Magny et al., 2007) and some of the events described byJalut et al. (2000) in the Western Mediterranean. Theseevents correspond to some of the Bond events centred at11.1 kyr BP, 10.3 kyr BP, 9.5 kyr BP, 8.2 kyr BP, 5.9 kyr BPand 4.3 kyr BP in the North Atlantic. The Holocene eventsappear to be the most recent manifestation of a pervasivemillennial-scale climate cycle operating independently of theglacial-interglacial climate state (Bond et al., 1997).
The short Holocene cooling events such as the eventsmarked 4, 5, 6, 7, and 8 (Figs. 3 and 4) are likely transmittedfrom the Atlantic Ocean to the Western Mediterranean Seaand the signal is amplified in the central Mediterranean set-tings (Cacho et al., 2002). During the short-term Holoceneevents we observed no precipitation differences between theAlboran and Aegean Sea records. This is in contrast to theprecipitation gradient reconstructed during the Late-glacialevents, such as the Older Dryas, Gerzensee Oscillation andGI-1c2.
In the Aegean Sea, two short-term cool and dry oscilla-tions are also detected at∼7.3 and at∼6.4 kyr BP, the termi-nation of Sapropel 1 formation. Similar short cooling eventswere detected using foraminiferal assemblages in the Adriac-tic Sea and the Aegean Sea at∼7.5−7.0 and 6.5−6.0 kyr BP(De Rijk et al., 1999; Geraga et al., 2000; Jimenez-Espejo etal., 2008).
The apparent timing of these short-lived events differsslightly between the two cores. This variation may be dueto statistical uncertainties associated with the age models foreach core. These uncertainties are dependent on the preci-sion of radiocarbon dates, marine reservoir effects and onthe calibration models themselves. Because of these uncer-tainties we established the timing and duration of these cli-mate events independently between the two cores (Lowe etal., 2008).
4 Comparison of methodologies applied, and reliabilityof the climate signal inferred
Some indication of the relative reliability of the models canbe obtained from the differences between model outputs.Clear differences in model response can be seen in sev-eral locations throughout the reconstructions, for example,the absence of a strong MTWA signal in the MAT modelfor the Aegean, during the 8.2 ka event (Fig. 5), declinesin NMDS/GAM PSummer values in the Alboran during thePBO, and generally dissimilar PLS results in all models. Forboth records the variability of the NMDS/GAM model islower than the variability of either the MAT or PLS model.While Guiot (1990) uses low variability as an indication ofthe reliability of model construction when testing MAT dis-tance metrics, it is possible that, among these methods lowvariability for the NMDS/GAM model is a result of statisticalartifacts of the method since the GAM function used has a
relatively high smoothing penalty to avoid overfitting of thedata. The MAT and NMDS/GAM models appear to havegreater similarity to one another than to the PLS model.In general the PLS reconstructions are more sensitive tochanges in one or two pollen taxa. For example the PLSreconstruction of PSummer for the Aegean Sea has a veryhigh correlation to changes inAsteraceae(r2=0.82 for thePLS method compared tor2=0.17 for NMDS/GAM) whichare unlikely to be valid in reality given the regional nature ofthe pollen record and the complex landscape dynamics in thesurrounding region.
The NMDS/GAM method shows a smoother trend ofincreasing precipitation through the early Holocene in theAegean Sea and in general has lower correlations betweenindividual pollen taxa and the precipitation reconstructions.Since pollen taxa are rank-weighted in the NMDS/GAMmethod to generate the initial ordination, it is unlikely thatany one pollen taxon will dominate the climate signal. Thiscombined signal results in a smoother trend curve, exceptin cases where rapid, multi-species responses to climate areseen. The NMDS/GAM method picks up rapid changes inclimatic parameters in the Alboran Sea where the trend be-tween the PLS and NMDS/GAM reconstructions are similar,but again, the NMDS/GAM method shows smaller variationabout the trend, likely as a result of decreased sensitivity to asingle pollen taxon.
Holocene climatic oscillations are less pronounced withthe MAT and NMDS/GAM method than the PLS methodin both sites. In the Aegean site, the results of the MATare close to the NMDS/GAM curves while in the Albo-ran Sea, the MAT curve appears to overstate the MTWA,MTCO, PANN and PWinter. Lack of close analogue assem-blages may be responsible for the strong differences betweenNMDS/GAM and MAT models and the PLS model. Sincethe PLS model relies more strongly on individual pollen taxa,it may be more effective in predicting climate parametersfor regions that are poorly sampled in the dataset, whereasMAT and NMDS/GAM models use complete pollen assem-blages to determine climate parameters. In the Alboran Sea,the pollen comes from both Southern Spain and Morocco(with the presence ofCedrusfrom Morocco’s Mountains)thus there are likely to be less analogues in the Europeanpollen dataset, potentially causing statistical artefacts in thereconstruction, and resulting in greater differences betweenthe PLS model and the MAT and NMDS/GAM models.
To address model quality, we tested the root mean squarederror (RMSE) for the three different model types, MAT,NMDS/GAM and PLS. To do this, we randomly selected67% of the complete pollen dataset to build the pollen-basedclimate transfer functions and subsequently predicted the re-maining 33% of the dataset (ter Braak, 1995), this selec-tion and modelling procedure was repeated fifty times forNMDS/GAM and PLS method to arrive at a mean RMSEPvalue with valid standard deviations. Using this method,we find that model error for modern pollen is lowest with
www.clim-past.net/5/615/2009/ Clim. Past, 5, 615–632, 2009

628 I. Dormoy et al.: Terrestrial climate variability and seasonality changes in the Mediterranean region
Table 2. Root mean squared error for climate variables used in thisstudy, based on bootstrapped models using data subsets consistingof 67% of the entire pollen dataset (1181 predicted values).
Climate MAT NMDS/GAM PLS
Variable R2 RMSE R2 RMSEP R2 RMSEP
MTWA 0.87 2.55 0.85 3.04 0.84 3.68MTCO 0.94 4.02 0.98 4.94 0.91 6.39PANN 0.80 186.70 0.75 227.27 0.74 271.92PSummer 0.87 16.01 0.78 50.39 0.77 67.52PWinter 0.78 27.02 0.76 77.69 0.75 91.59
the MAT method for all climate parameters in this dataset(Table 2). Although NMDS/GAM appears to work betterthan MAT in situations where pollen samples are spatiallysparse, or climatic gradients are sparsely sampled (Goring etal., 2009). However as coverage in a region increases andthe number of potential analogues passes a threshold definedby local pollen variability, the MAT begins to perform betterthan NMDS/GAM. Although the PLS model has the high-est RMSEP, it appears to be generally synchronous with theother models. However, the PLS model often has a muchstronger amplitude in the pollen signal, perhaps an artifact ofnon-analogue climate parameters. It is interesting to note thateven with relatively high RMSE values, all models are wellcorrelated to the climate variables they reconstruct. This itcan be relatively certain, that although the models show dif-fering absolute magnitudes of temperature or precipitation,the general trend over time remain well reconstructed. Itseems perhaps surprising that error for temperature and pre-cipitation parameters are so high, however these values aresomewhat lower than those reported by Brewer et al. (2008)for MTCO using PLS and MAT methods, although, strictlyspeaking the method for RMSE calculation differs betweenthis paper and those in Brewer et al. (2008). Given the diver-sity of the pollen dataset and the broad climatic range, it isnot surprising that the errors are so high. To ensure that therewas no systematic bias in the prediction of error (for exam-ple, from the inclusion of steppe samples) we tested the spa-tial autocorrelation of RMSEP values using Moran’s statistic(Cliff and Ord, 1981) and found no significant spatial auto-correlation (lm=0.007,p=0.630). From this, we can con-clude that the models used here perform well, and that thereis no significant spatial bias in our pollen-based climate mod-els. According to the results from modern and fossil data, theMAT and NMDS/GAM methods seem provide better resultsthan the PLS method, which appears to provide spurious val-ues in non-analogue situations.
Model error is calculated as the root mean squared errorof prediction using leave-one-out cross validation for eachmethod (Table 2). It is clear that a number of factors af-fect the predictive ability of each reconstruction method (for
example Telford and Birks, 2005; Goring et al., 2009) thus,as statistical assumptions are violated, model performancewill likely decline. Since it is difficult to predict the re-sponse of models to non-analogue conditions, especially forthe multi-parameter climate data we are examining, we usemodel RMSEP as a guide to overall error. In general modelerror is large, this is in part a function of pollen-based cli-mate models in general, but also of the extremely broad scaleof Europe. The error terms incorporate error from across thecontinent, and thus may be inflated. It appears that MATprovides the best fit to underlying climate parameters. PLSregression appears to provide the lowest fit to the climate datafor all parameters, with NMDS/GAM providing intermediateresults.
5 Conclusions
This study aims to quantitatively reconstruct climatic trendsand seasonality changes in the west and east Mediterraneanregion between 15 000 and 4000 years BP. The palaeoclimatereconstructions are based on a new multi-method approachwith three different and complementary methods: ModernAnalogue Technique, Non-Metric Multidimensional Scal-ing/Generalized Additive Model and Partial Least Square re-gression.
The three methods produce patterns that show roughlysimilar trends throughout the pollen records of both sites.Some discrepancies can be seen in the amplitude of the cli-mate reconstructions given that each method has their ownset of advantages and limitations (Birks and Birks, 2006;Brewer et al., 2008). Cold and dry conditions prevailed dur-ing the Oldest and Younger Dryas. For the Younger Dryas,the reconstructions show a reduction in winter precipita-tion. More temperate conditions were established during theLateglacial interstadial and continued through the Holocenewith the establishment of a seasonal “Mediterranean” pre-cipitation regime (hot dry summers and cool wet winters).A temperature and precipitation optimum is observed for theEarly to mid-Holocene. Following the optimum of precipi-tation and temperature (after 7.8 kyr BP), a progressive arid-ification and a slight decrease in temperature is recorded inboth sites.
Evidence of strong climatic links between the North At-lantic and Mediterranean are found throughout the recon-structions. Evidence of events that have punctuated thedeglaciation in the North Atlantic (such as Older Dryas, GI-1c2, Gerzensee and Preboreal Oscillations and 8.2 ka event)appears in both the Aegean and Alboran Sea cores. Theseoscillations appear to have been stronger in the Aegean re-gion than in the Alboran Sea. Our study suggests a West/Eastprecipitation gradient across the Mediterranean region, withshort-term climate changes being markedly stronger ex-pressed and dryer in the Aegean region.
Clim. Past, 5, 615–632, 2009 www.clim-past.net/5/615/2009/
I. Dormoy et al.: Terrestrial climate variability and seasonality changes in the Mediterranean region 629
Acknowledgements.Financial support for this study was providedby the French CNRS and the LAMA ANR project (MSHE Ledoux,USR 3124, CNRS), PICC and IDEGLACE ANR Projects. SimonGoring was funded by NSERC. We thank Ocean Driling Programfor giving us samples of ODP Leg 161 Site 976 and J. P. Cazetand M. H. Castera help us for processing of samples of this core.UK and JP acknowledge support through the German ResearchFundation (DFG, grant PR 651/6-1). This is LSCE contributionno. 4012. This paper is dedicated to our friend Dominique Jolly.
Edited by: D.-D. Rousseau
The publication of this article is financed by CNRS-INSU.
References
Allen, J. R. M., Long, A. J., Ottley, C. J., Graham Pearson, D.,and Huntley, B.: Holocene climate variability in northernmostEurope, Quaternary Sci. Rev., 26, 1432–1453, 2007.
Alley, R. B., Marotzke, J., Nordhaus, W. D., Overpeck, J. T., Pe-teet, D. M., Pielke Jr., R. A., Pierrehumbert, T. R., Rhines, P. B.,Stocker, T. F., Talley, L. D., and Wallace, J. M.: Abrupt climatechange, Science, 299, 2005–2010, 2003.
Alley, R. B. and Agustsdottir, A. M.: The 8 k event: cause andconsequences of a major Holocene abrupt climate change, Qua-ternary Sci. Rev., 24, 1123–1149, 2005.
Ariztegui, D., Asioli, A., Lowe, J. J., Trincardi, F., Vigliotti, L.,Tamburini, F., Chondrogianni, C., Accorsi, C. A., Bandini Maz-zanti, M., Mercuri, A. M., Van der Kaars, S., McKenzie, J. A.,and Oldfield, F.: Palaeoclimate and the formation of the sapro-pel S1: inferences from Late Quaternary lacustrine and ma-rine sequences in the central Mediterranean region, Palaeogeogr.Palaeocl., 158, 215–240, 2000.
Asioli, A., Trincardi, F., Lowe, J. J., and Oldfield, F.: Short-term climate changes during the last glacial-Holocene transition:Comparison between Mediterranean records and the GRIP eventstratigraphy, J. Quaternary Sci., 14, 373–381, 1999.
Barber, D. C., Dyke, A., Hillaire-Marcel, C., Jennings, A. E., An-drews, J. T., Kerwin, M. W., Bilodeau, G., McNeely, R., Southon,J., Morehead, M. D., and Gagnon, J. M.: Forcing of the coldevent of 8.200 years ago by catastrophic drainage of Laurentidelakes, Nature, 400, 344–348, 1999.
Bar-Matthews, M., Ayalon, A., Kaufman, A., and Wasserburg, G.J.: The Eastern Mediterranean paleoclimate as a reflection of re-gional events: Soreq cave, Israel, Earth Planet. Sc. Lett., 166,85–95, 1999.
Bar-Matthews, M., Ayalon, A., and Kaufman, A.: Timing and hy-drological conditions of Sapropel events in the Eastern Mediter-ranean, as evident from speleothems, Soreq cave, Israel, Chem.Geol., 169, 145–156, 2000.
Bethoux, J. P. and Prieur, L.: Hydrologie et circulation enMediterranee Nord Occidentale, Ecologie des Microorganismes
en Mediterranee Occidentale : ECOMED, Assoc. Franc. Tech.Petrole, 13–22, 1984.
Birks, H. H. and Birks, H. J. B.: Multi-proxy studiesin palaeoclimnology, Veg. Hist. Archaeobot., 15, 235–251,doi:10.1007/s00334-006-0066-6, 2006.
Bjorck, S., Rundgren, M., Ingolfsson, O., and Funder, S.: The Pre-boreal oscillation around the Nordic seas: terrestrial and lacus-trine responses. J. Quaternary Sci., 12, 455–465, 1997.
Bjorck, S., Walker, M. J. C., Cwynar, L. C., Johnsen, S., Knud-sen, S., Lowe, J. J., Wohlfarth, B., and Intimate Members.: Anevent stratigraphy for the last Termination in the North Atlanticregion based on the Greenland ice-core record: a proposal by theINTIMATE group, J. Quaternary Sci., 13, 283–292, 1998.
Bond, G., Showers, W., Cheseby, M., Lotti, R., Almasi, P., de-Menocal, P., Priore, P., Cullen, H., Hajdas, I., and Bonani, G.:A Pervasive Millenial-Scale Cycle in North Atlantic Holoceneand Glacial Climates, Science, 278, 1257–1266, 1997.
Bordon, A., Peyron, O., Lezine, A. M., Brewer, S., and Fouache, E.:Pollen-inferred Late-Glacial and Holocene climate in southernBalkans (Lake Maliq), Quatern. Int., 200, 19–30, 2009.
ter Braak, C. J. F. and Juggins, S.: Weighted averaging partial leastsquares regression (WA-PLS): an improved method for recon-structing environmental variables from species assemblages, Hy-drobiologia, 269/270, 485–502, 1993.
ter Braak, C. J. F.: Non-linear methods for multivariate sta-tistical calibration and their use in palaeoecology: a com-parison of inverse (k-nearest neighbours, partial least squaresand weighted averaging partial least squares) and classical ap-proaches, Chemometr. Intell. Lab., 28, 165–180, 1995.
Brauer, A., Gunter, C., Johsen, S. J., and Negendank, J. F. W.:Land-ice teleconnections of cold climatic periods during thelast Glacial/Interglacial transition. Clim. Dynam., 16, 229–239,2000.
Brewer, S., Guiot, J., and Barboni, D.: Pollen Methods and Studies,Use of Pollen as Climate Proxies, Enc. Quaternary Sci., 2497–2508, doi:10.1016/B0-44-452747-8/00177-0, 2007a.
Brewer, S., Guiot, J., and Torre, F.: Mid-Holocene climate changein Europe: a data-model comparison, Clim. Past, 3, 499–512,2007,http://www.clim-past.net/3/499/2007/.
Brewer, S., Guiot, J., Sanchez-Goni, M. F., and Klotz, S.: The cli-mate in Europe during the Eemian: a multi-method approach us-ing pollen data, Quaternary Sci. Rev., 27, 2303–2315, 2008.
Brewer, S., Francois, L., Cheddadi, R., Laurent, J.-M., and Favre,E.: Comparison of simulated and observed vegetation for themid-Holocene in Europe, Clim. Past Discuss., 5, 965–1011,2009,http://www.clim-past-discuss.net/5/965/2009/.
Cacho, I., Grimalt, J. O., and Canals, M.: Response of the WesternMediterranean Sea to rapid climatic variability during the last50 000 years: a molecular biomarker approach, J. Marine Syst.,33/34, 253–272, 2002.
Cheddadi, R. and Rossignol-Strick, M.: Quaternary paleoclimatesfrom pollen and isotope records of marine cores in the Nile conearea, Paleoceanography, 10, 291–300, 1995.
Cheddadi, R., Yu, G., Guiot, J., Harrison, S. P., and Prentice, I. C.:The climate of Europe 6000 years ago, Clim. Dynam., 13, 1–9,1997.
Cheddadi, R., Guiot, J., and Jolly, D.: The Mediterranean vegeta-
www.clim-past.net/5/615/2009/ Clim. Past, 5, 615–632, 2009

630 I. Dormoy et al.: Terrestrial climate variability and seasonality changes in the Mediterranean region
tion: what if the atmospheric CO2 increased?, Landscape Ecol.,16, 667–675, 2001.
Cheddadi, R. and Bar-Hen, A.: Spatial gradient of temperature andpotential vegetation feedback across Europe during the late Qua-ternary, Clim. Dynam., 32, 371–379, doi:10.1007/s00382-008-0405-7, 2009.
Cliff, A. D. and Ord, J. K.: Spatial processes, Pion, 21 pp., 1981.Colmenero-Hidalgo, E., Flores, J. A. and Sierro, F. J.: Biometry
of Emiliania huxleyiand ist biostratigraphic significance in theEastern North Atlantic Ocean and Western Mediterranean Sea inthe last 20 000 years, Mar. Micropaleontol., 46, 247–263, 2002.
Combourieu Nebout, N., Peyron, O., Dormoy, I., Desprat, S., Beau-douin, C., Kotthoff, U., and Marret, F.: Rapid climatic variabilityin the west Mediterranean during the last 25 000 years from highresolution pollen data, Clim. Past, 5, 503–521, 2009,http://www.clim-past.net/5/503/2009/.
Combourieu-Nebout, N., Paterne, M., Turon, J. L., and Siani, G.:A high-resolution record of the last deglaciation in the Cen-tral Mediterranean Sea: Palaeovegetation and Palaeohydrologi-cal evolution, Quaternary Sci. Rev., 17, 303–317, 1998.
Combourieu-Nebout, N., Londeix, L., Baudin, F., Turon, J. L., vonGrafenstein, R., and Zahn, R.: Quaternary marine and continen-tal paleoenvironments in the Western Mediterranean (Site 976,Alboran Sea): palynological evidence, edited by: Zahn, R., Co-mas, M. C., and Klaus, A., Proc. ODP, College Station, TX(Ocean Drilling Program), Sci. Results, 161, 457–468, 1999.
Combourieu-Nebout, N., Turon, J. L., Zahn, R., Capotondi, L.,Londeix, L., and Pahnke, K.: Enhanced aridity and atmospherichigh-pressure stability over the western Mediterranean during theNorth Atlantic cold events of the past 50 ky, Geology, 30, 863–866, 2002.
Davis, B. A. S., Brewer, S., Stevenson, A. C., and Guiot, J.: Thetemperature of Europe during the Holocene reconstructed frompollen data, Quaternary Sci. Rev., 22, 1701–1716, 2003.
Davis, B. A. S. and Stevenson, A. C.: The 8.2 ka event and Early-Mid Holocene forests, fires and flooding in the Central EbroDesert, NE Spain, Quaternary Sci. Rev., 26, 1695–1712, 2007.
Davis, B. A. S. and Brewer, S.: Orbital forcing and role of the lati-tudinal insolation/temperature gradient, Clim. Dynam., 32, 143–165, doi:10.1007/s00382-008-0480-9, 2009.
Denton, G. H., Alley R. B., Comer, G. C., and Broecker, W. S.:The role of seasonality in abrupt climate change, Quaternary Sci.Rev., 24, 1159–1182, 2005.
De Rijk, S., Hayes, A., and Rohling, E. J.: Eastern Mediterraneansapropel S1 interruption: an expression of the onset of climaticdeteriortion around 7 ka B.P., Mar. Geol., 153, 337–343, 1999.
Drescher-Schneider, R., De Beaulieu, J. L., Magny, M., Walter-Simonnet, A. V., Bossuet, G., Millet, L., Brugiapaglia, E., andDrescher, A.: Vegetation history, climate and human impactover the last 15 000 years at Lago dell’Accesa (Tuscany, CentralItaly), Veg. Hist. Archaeobot., 16, 279–299, 2007.
Emeis, K. C., Struck, U., Schulz, H. M., Rosenberg, R., Bernasconi,S., Erlenkeuser, H., Sakamoto, T., and Martinez-Ruiz, F.: Tem-perature and salinity variations of Mediterranean Sea surface wa-ters over the last 16 000 years from records of planktonic stableoxygen isotopes and alkenone unsaturation ratios, Palaeogeogr.Palaeocl., 158, 259–280, 2000.
Faegri, K. and Iversen, J.: Textbook of Pollen Analysis, Munks-gaard, Copenhagen, Danemark, 237 pp., 1964.
Fairbanks, R. G., Mortlock, R. A., Chiu, T. C., Cao, L., Kaplan, A.,Guilderson, T. P., Fairbanks, T. W., Bloom, T. W., Bloom, A. L.,Grootes, P. M., and Nadeau M. J.: Radiocarbon calibration curvespanning 0 to 50 000 years B.P. based on paired230Th/234U and14C dates on pristine corals, Quaternary Sci. Rev., 24, 1781–1796, 2005.
Favaretto, S., Asioli, A., Miola, A., and Piva, A.: Preboreal climaticoscillations recorded by pollen and foraminifera in the southernAdriatic Sea, Quatern. Int., 190(1), 89–102, 2008.
Fletcher, W. J. and Sanchez-Goni, M. F.: Orbital- and sub-orbital-scale climate impacts on vegetation of the western Mediterraneanbasin over the last 48 000 yr, Quaternary Res., 70(3), 451–464,2008.
Geraga, M., Tsaila-Monopolis, S., Ioakim, C., Papatheodorou, G.,and Ferentinos, G.: Evaluation of palaeoenvironmental changesduring the last 18 000 years in the Myrtoon basin, SW AegeanSea, Palaeogeogr. Palaeocl., 156, 1–17, 2000.
Goring, S., Pellatt, M. G., Lacourse, T., Walker, I. R., andMathewes, R. W.: A new methodology for reconstructing cli-mate and vegetation from modern pollen assemblages: anexample from British Columbia, J. Biogeogr., 36, 626–638,doi:110.1111/j.1365-2699.02021.x, 2009.
Grafenstein, V., Erlenkeuser, U., Muller, H., Jouzel, J., and Johnsen,S.: The cold event 8200 years ago documented in oxygen isotoperecords of precipitation in Europe and Greenland, Clim. Dynam.,14, 73–81, 1998.
Guiot, J.: Methodology of the last climatic cycle reconstructionin France from pollen data, Palaeogeogr. Palaeocl., 80, 49–69,1990.
Guiot, J., Torre, F., Jolly, D., Peyron, O., Boreux, J. J., and Ched-dadi, R.: Inverse vegetation modelling by Monte Carlo samplingto reconstruct palaeoclimates under changed precipitation sea-sonality and CO2 conditions: application to glacial climate inMediterranean region, Ecol. Model., 127, 119–140, 2000.
Heiri, O., Cremer, H., Engels, S., Hoek, W. Z., Peeters, W., andLotter, A. F.: Lateglacial summer temperatures in the NorthwestEuropean lowlands: a chironomid record from Hijkermeer, TheNetherlands, Quaternary Sci. Rev., 26, 2420–2437, 2007.
Huntley, B., Watts, W. A., Allen, J. R. M., and Zolitschka, B.:Palaeoclimate, chronology and vegetation history of the Weich-selian Lateglacial: comparative analysis of data from three coresat Lago Grande di Monticchio, Southern Italy, Quaternary Sci.Rev., 18, 945–960, 1999.
IPCC 2007, Climate Change 2007: Synthesis Report, Contributionof Working Groups I, II and III to the Fourth Assessment Reportof the Intergovernmental Panel on Climate Change, edited by:Core Writing Team, Pachauri, R. K., and Reisinger, A., IPCC,Geneva, Switzerland, 104 pp., 2007.
Jalut, G., Amat, A. E., Bonnet, L., Gauquelin, T., and Fontugne, M.:Holocene climatic changes in the Western Mediterranean, fromsouth-east France to south-east Spain, Palaeogeogr. Palaeocl.,160, 255–290, 2000.
Jalut, G., Dedoubat, J. J., Fontugne, M., and Otto, T.: Holocenecircum-Mediterranean vegetation changes: Climate forcing andhuman impact, Quatern. Int., 200, 4–18, 2009.
Jimenez-Espejo, F. J., Martinez-Ruiz, F., Rogerson, M., Gonzalez-Donoso, J. M., Romero, O. E., Linares, D., Sakamoto, T.,Gallego-Torres, D., Rueda Ruiz, J. L., Ortega-Huertas, M., andPerez Claros, J. A.: Detrital input, productivity fluctuations, and
Clim. Past, 5, 615–632, 2009 www.clim-past.net/5/615/2009/
I. Dormoy et al.: Terrestrial climate variability and seasonality changes in the Mediterranean region 631
water mass circulation in the westernmost Mediterranean Seasince the Last Glacial Maximum, Geochem. Geophy. Geosy., 9,Q11U02, doi:10.1029/2008GC002096, 2008.
Jorissen, F. J., Asioli, A., Borsetti, A. M., Capotondi, L., De Visser,J. P., Hilgen, F. J., Rohling, E. J., Van der Borg, K., VergnaudGrazzini, C., and Zachariasse, W. J.: Late Quaternary centralMediterranean biochronology, Mar. Micropalaeontol., 21, 169–189, 1993.
Kageyama, M., Combourieu-Nebout, N., Sepulchre, P., Peyron, O.,Krinner, G., Ramstein, G., and Cazet, J. P.: The Last Maximumand Heinrich Event 1 in terms of climate and vegetation aroundthe Alboran Sea: a preliminary model-data comparison, C. R.Geoscience, 337, 983–992, 2005.
Kallel, N., Paterne, M., Labeyrie, L., Duplessy, J. C., and Arnold,M.: Temperature and salinity of the Tyrrhenian Sea during thelast 18 000 years, Palaeogeogr. Palaeocl., 135, 97–108, 1997.
Kotthoff, U., Muller, U. C., Pross, J., Schmiedl, G., Van de Schoot-brugge, B., Lawson, I., and Schulz, H.: Lateglacial and Holocenevegetation dynamics in the Aegean region: An integrated viewbased on pollen data from marine and terrestrial archives, TheHolocene, 18, 1019–1032, 2008a.
Kotthoff, U., Pross, J., Muller, U. C., Peyron, O., Schmiedl, G.,Schulz, H., and Bordon, A.: Climate dynamics in the border-lands of the Aegean Sea during formation of Sapropel S1 de-duced from a marine pollen record, Quaternary Sci. Rev., 27,832–845, 2008b.
Larocque, I. and Finsinger, W.: Late-glacial chironomid-based tem-perature reconstructions for Lago Piccolo di Avigliana in thesouthwestern Alps (Italy), Palaeogeogr. Palaeocl., 257, 207–223,2008.
Lawson, I., Frogley, M., Bryant, C., Preece, R., and Tzedakis, P.:The Lateglacial and Holocene environmental history of the Ioan-nina basin, north-west Greece, Quaternary Sci. Rev., 23, 1599–1625, 2004.
Lionello, P., Malanotte-Rizzoli, P., and Boscolo, R.: MediterraneanClimate Variability, Elsevier BV, Amsterdam, The Netherlands,421 pp., 2006.
Lotter, A. F., Eicher, U., Siegenthaler, U., and Birks, H. J. B.: Late-glacial climatic oscillations as recorded in Swiss lake sediments,J. Quaternary Sci., 7, 187–204, 1992.
Lotter, A. F., Birks, H., Eicher, U., Hofmann, W., Schwander, J.,and Wick, L.: Younger Dryas and Allerød summer temperaturesat Gerzensee (Switzerland) inferred from fossil pollen and clado-ceran assemblages, Palaeogeogr. Palaeocl., 159, 349–361, 2000.
Lowe, J. J., Rasmussen, S. O., Bjorck, S., Hoek, W. Z., Steffensen,J. P., Walker, M. J. C., Yu, Z. C., and the INTIMATE group:Synchronisation of palaeoenvironmental events in the North At-lantic region during the Last Termination: a revised protocol rec-ommended by the INTIMATE group, Quaternary Sci. Rev., 27,6–17, 2008.
Magny, M., Miramont, C., and Sivan, O.: Assessment of the impactof climate and anthropogenic factors on Holocene Mediterraneanvegetation in Europe on the basis of palaeohydrological records,Palaeogeogr. Palaeocl., 186, 47–59, 2002.
Magny, M., Begeot, C., Guiot, J., and Peyron, O.: Contrasting pat-terns of hydrological changes in Europe in response to Holoceneclimate cooling phases, Quaternary Sci. Rev., 22, 1589–1596,2003.
Magny, M., Aalbersberg, G., Begeot, C., Benoit-Ruffaldi, P.,
Bossuet, G., Disnar, J. R., Heiri, O., Laggoun-Defarge, F.,Mazier, F., Millet, L., Peyron, O., Vanniere, B., and Walter-Simonet, A. V.: Environmental and climatic changes in theJura mountains (eastern France) during the Lateglacial-Holocenetransition: a multi-proxy record from Lake Lautrey, QuaternarySci. Rev., 25, 414–445, 2006a.
Magny, M., De Beaulieu, J. L., Drescher-Schneider, R., Vanniere,B., Walter-Simonnet, A. V., Millet, L., Bossuet, G., and Peyron,O.: Climatic oscillations in central Italy during the Last Glacial-Holocene transition: the record from Lake Accesa, J. QuaternarySci., 21, 1–10, 2006b.
Magny, M., De Beaulieu, J. L., Drescher-Schneider, R., Vanniere,B., Walter-Simonnet, A. V., Miras, Y., Millet, L., Bossuet, G.,Peyron, O., Brugiapaglia, E., and Leroux, A.: Holocene climatechanges in the central Mediterranean as recorded by lake-levelfluctuations at Lake Accesa (Tuscany, Italy), Quaternary Sci.Rev., 26, 1736–1758, 2007.
Marchal, O., Cacho, I., Stocker, T. F., Grimalt, J. O., Calvo, E., Mar-trat, B., Shackleton, N., Vautravers, M., Cortijo, E., Van Kreveld,S., Andersson, C., Koc, N., Chapman, M., Sbaffi, L., Duplessy, J.C., Sarnthein, M., Turon, J. L., Duprat, J., and Jansen, E.: Appar-ent long-term cooling of the sea surface in the northeast Atlanticand Mediterranean during the Holocene, Quaternary Sci. Rev.,21, 455–483, 2002.
Mayewski, P. A., Rohling, E. J., Stager, J. C., Karlen, W., Maasch,K. A., Meeker, L. D., Meyerson, E. A., Gasse, F., Van Kreveld,S., Holmgren, K., Lee-Thorp, J., Rosqvist, G., Rack, F., Staub-wasser, M., Schneider, R., and Steig, E.: Holocene climate vari-ability, Quaternary Res., 62, 243–255, 2004.
Mercone, D., Thomson, J., Croudace, I. W., Siani, G., Paterne,M., and Troelstra, S.: Duration of S1, the most recent sapro-pel in the eastern Mediterranean Sea, as indicated by acceleratormass spectrometry radiocarbon and geochemical evidence, Pale-oceanography, 15, 336–347, 2000.
Mudie, P. J., Rochon, A., and Aksu, A. E.: Pollen stratigraphy ofLate Quaternary cores from Marmara Sea: land-sea correlationand paleoclimatic history, Mar. Geol., 190, 233–260, 2002.
Myers, P. G. and Rohling, E. J.: Modeling a 200-Yr Interrup-tion of the Holocene Sapropel S1, Quaternary Res., 53, 98–104,doi:10.1006/qres.1999.2100, 2000.
Naughton, F., Sanchez-Goni, M. F., Desprat, S., Turon, J. L.,Duprat, J., Malaize, B., Joli, C., Cortijo, E., Drago, T., andFreitas, M. C.: Present-day and past (last 25 000 years) marinepollen signal off western Iberia, Mar. Micropaleontol., 62, 91–114, 2007.
North Greenland Ice Core Project members: North Greenland IceCore Project Oxygen Isotope Data, IGBP Pages/Word Data Cen-ter for Paleoclimatology Data Contribution Series #2004-059,NOAA/NGDC Paleoclimatology Program, Boulder CO, USA,2004.
Perez-Folgado, M., Sierro, F. J., Flores, J. A., Cacho, I., Grimalt, J.O., Zahn, R., and Shackleton, N.: Western Mediterranean plank-tonic foraminifera events and millennial climatic variability dur-ing the last 70 kyr, Mar. Micropaleontol., 48, 49–70, 2003.
Petit-Maire, N. and Vrielinck, B.: The Mediterranean basin: the lasttwo climatic extremes: explanatory notes of the maps, Andra Ed,Paris, France, 98 pp., 2005.
Peyron, O., Jolly, D., Bonnefille, R., Vincens, A., and Guiot, J.:Climate of East Africa 600014C yr B.P., as inferred from pollen
www.clim-past.net/5/615/2009/ Clim. Past, 5, 615–632, 2009

632 I. Dormoy et al.: Terrestrial climate variability and seasonality changes in the Mediterranean region
data, Quaternary Res., 54, 90–101, 2000.Peyron, O., Begeot, C., Brewer, S., Heiri, O., Magny, M., Millet, L.,
Ruffaldi, P., Van Campo, E., and Yu, G.: Late-Glacial climaticchanges in Eastern France (Lake Lautrey) from pollen, lake-levels, and chironomids, Quaternary Res., 64, 197–211, 2005.
Peyron, O., Jolly, D., Braconnot, P., Bonnefille, R., Guiot,G., Wirmann, D., and Chalie, F.: Quantitative recon-structions of annual rainfall in Africa 6000 years ago:Model-data comparison, J. Geophys., Res., 111, D24110,doi:D2411010.1029/2006JD007396, 2006.
Pons, A. and Reille, M.: The Holocene and Upper Pleistocenepollen records from Padul (Granada, Spain): a new study, Palaeo-geogr. Palaeocl., 66, 243–263, 1988.
Prentice, I. C., Guiot, J., Huntley, B., Jolly, D., and Cheddadi,R.: Reconstructing biomes from palaeocological data: a generalmethod and its application to European pollen data at 0 to 6 ka,Clim. Dynam., 12, 185–194, 1996.
Pross, J., Kotthoff, U., Muller, U. C., Peyron, O., Dormoy, I.,Schmiedl, G., Kalaitzidis, S., and Smith, A.: Massive perturba-tion in terrestrial ecosystems of the Eastern Mediterranean regionassociated with the 8.2 kyr climatic event, Geology, 37, 887–890,2009.
Quezel, P. and Medail, F.: Ecologie et biogeographie des foretsdu basin mediterraneen, Elsevier-Lavoisier eds, Paris, France,571 pp., 2003.
Rasmussen, S. O., Andersen, K. K., Svensson, A. M., Steffensen,J. P., Vinther, B. M., Clausen, H. B., Siggaard-Andersen, M.L., Johnsen, S. J., Larsen, L. B., Dahl-Jensen, D., Bigler, M.,Rothlisberger, R., Fischer, H., Goto-Azuma, K., Hansson, M.E., and Ruth, U.: A new Greenland ice core chronology forthe last glacial termination, J. Geophys. Res., 111, D06102,doi:10.1029/2005JD006079, 2006.
Renssen, H. and Isarin, R. F. B.: The two major warming phasesof the last deglaciation at∼14.7 and∼11.5 ka cal B.P. in Europe:climate reconstructions and AGCM experiments, Global Planet.Change, 30, 117–153, 2001.
Renssen, H., Isarin, R. F. B., Jacob, D., Podzun, R., and Vanden-berghe, J.: Simulation of the Younger Dryas climate in Europeusing a regional climate model nested in an AGCM: preliminaryresults, Global Planet. Change, 30, 41–57, 2001.
Roberts, N., Reed, J. M., Leng, M. J., Kuzucuoglu, C., Fontugne,M., Bertaux, J., Woldring, H., Bottema, S., Black, S., Hunt, E.,and Karabiyikoglu, M.: The tempo of Holocene climatic changein the eastern Mediterranean region: new high-resolution crater-lake sediment data from central Turkey, The Holocene, 11(6),721–736, 2001.
Rohling, E. J. and De Rijk, S.: Holocene Climate Optimum andLast Glacial Maximum in the Mediterranean: the marine oxygenisotope record, Mar. Geol., 153, 57–75, 1999.
Rohling, E. J., Cane, T. R., Cooke, S., Sprovieri, M., Bouloubassi,I., Emeis, K. C., Schiebel, R., Kroon, D., Jorissen, F. J., Lorre,A., and Kemp, A. E. S.: African monsoon variability during theprevious interglacial maximum, Earth Planet. Sc. Lett., 202, 61–75, 2002.
Rohling, E. J. and Palike, H.: Centennial-scale climate cooling witha sudden cold event around 8200 years ago, Nature, 434, 975–979, 2005.
Rossignol-Strick, M.: The Holocene climatic optimum and pollenrecords of sapropel 1 in the eastern Mediterranean, 9000–6000 B.P., Quaternary Sci. Rev., 18, 515–530, 1999.
Sbaffi, L., Wezel, F. C., Kallel, N., Paterne, M., Cacho, I., Ziveri,P., and Shackleton, N.: Response of the pelagic environment topalaeoclimatic changes in the central Mediterranean Sea duringthe Late Quaternary, Mar. Geol., 178, 39–62, 2001.
Seppa, H., Birks, H. J. B., Giesecke, T., Hammarlund, D., Alenius,T., Antonsson, K., Bjune, A. E., Heikkila, M., MacDonald, G.M., Ojala, A. E. K., Telford, R. J., and Veski, S.: Spatial structureof the 8200 cal yr B.P. event in northern Europe, Clim. Past, 3,225–236, 2007,http://www.clim-past.net/3/225/2007/.
Siani, G., Paterne, M., Michel, E., Sulpizio, R., Sbrana, A., Arnold,M., and Haddad, G.: Mediterranean Sea surface radiocarbonreservoir age changes since the Last Glacial Maximum, Science,294, 1917–1920, 2001.
Stuiver, M., Reimer, P. J., Bard, E., Beck, J. W., Burr, G. S., Hughen,K. A., Kromer, B., McCormac, G., Van Der Plicht, J., and Spurk,M.: Radiocarbon age calibration, 24 000-0 cal B.P., Radiocarbon,40, 1041–1083, 1998.
Thomas, E. R., Wolff, E. W., Mulvaney, R., Steffensen, J. P.,Johnsen, S. J., Arrowsmith, C., White, J. W. C., Vaughn, B., andPopp, T.: The 8.2 ka event from Greenland ice cores, QuaternarySci. Rev., 26, 70–81, 2007.
Telford, R. J. and Birks, H. J. B.: The secret assumption of trans-fer functions: problems with spatial performance, QuaternarySci. Rev., 24, 2173–2179, doi:10.1016/j.quascirev.2005.05.001,2005.
Tzedakis, P. C.: Seven ambiguities in the Mediterranean palaeoen-vironmental narrative, Quaternary Sci. Rev., 26, 2042–2066,2007.
Wiersma, A. P. and Renssen, H.: Model-data comparison for the8.2 ka B.P. event: confirmation of a forcing mechanism by catas-trophic drainage of Laurentide Lakes, Quaternary Sci. Rev., 25,63–88, 2006.
Wijmstra, T. A.: Palynology on the first 30 meters of a 120 mdeep section in Northern Greece, Acta. Bot. Neerl., 18, 511–526,1969.
Wold, S., Ruhe, A., Wold, H., and Dunn III, W. J.: The colinearityproblem in linear regression, the partial least squares (PLS) ap-proach to generalized inverses, SIAM, J. Sci. and Stat. Comput.,5, 735–743, 1984.
Wu, H., Guiot, J., Brewer, S., and Guo, Z.: Climaticchanges in Eurasia and Africa at the last glacial maximumand mid-Holocene: reconstruction from pollen data usinginverse vegetation modelling, Clim. Dynam., 29, 211–229,doi10.1007/s00382-007-0231-3, 2007.
Zanchetta, G., Drysdale, R. N., Hellstrom, J. C., Fallick, A. E.,Isola, I., Gagan, M. K., and Pareschi, M. T.: Enhanced rainfall inthe Western Mediterranean during deposition of sapropel S1: sta-lagmite evidence from Corchia cave (Central Italy), QuaternarySci. Rev., 26, 279–286, 2007.
Zonneveld, K. A. F.: Palaeoclimatic reconstruction of the lastdeglaciation (18–8 ka B.P.) in the Adriatic Sea region; a land-sea correlation based on palynological evidence, Palaeogeogr.Palaeocl., 122, 89–106, 1996.
Clim. Past, 5, 615–632, 2009 www.clim-past.net/5/615/2009/