Embed Size (px)
Citation preview
13th World Conference on Earthquake Engineering Vancouver, B.C., Canada
August 1-6, 2004 Paper No. 408
TEST AND ANALYSIS OF REINFORCED CONCRETE COLUMNS STRENGTHENED WITH POLYESTER SHEET
Toshimi KABEYASAWA1, Akira TASAI2, Shun’ichi IGARASHI3,
SUMMARY A new economical and efficient method of strengthening reinforced concrete columns was developed and was verified through a serious of seismic tests. Static tests on columns were conducted for eight specimens in the first phase, and fourteen and ten in the second and the third, which represents reinforced concrete columns in old buildings of Japan or worldwide. Some of the columns were strengthened using polyester sheet by which the cost of retrofit would remarkably be reduced from traditional methods. The columns strengthened by the new method could maintain relatively high gravity load until more than ten percent inter-story drift, while the bare specimens without strengthening failed in shear at small drift simultaneously losing axial load capacity. Various types of concrete prisms and cubes confined with the sheet were also tested, based on which the resistance mechanisms of the columns were interpreted. Through these test series, the method has been improved to be effective to prevent the loss of capacity not only against axial load but also against lateral load reversals. The new method has been verified to be efficient, effective and economical, which has started to be used in seismic retrofit practice for Japanese existing buildings.
INTRODUCTION A lot of casualties have been caused due to the collapse of building structures even by recent major earthquakes in the countries with advanced earthquake engineering technologies. Although research themes in earthquake engineering are being oriented to innovative technology for new structures, continuous efforts are still important to reduce loss-of-life by developing an economical way of retrofit for existing buildings. To prevent the casualties due to structural failure during major earthquakes, it is primarily important to maintain the gravity load carrying capacity even in the cases that the response would exceed the limit state expected from design earthquake intensity. In some cases of old reinforced concrete buildings, the columns would lose the capacity due to inadequate amount of confining hoops or shear reinforcement, then the buildings would collapse in the weak story or totally like so-called pancake. The development of an economical and simple strengthening method would be very much worthwhile for
1 Professor, Earthquake Research Institute, The University of Tokyo, Japan.
Email: [email protected] 2 Associate Professor, Yokohama National University, Japan. Email: [email protected] 3 President, Square Inc., Japan. Email: [email protected]

preventing these brittle columns from the gravity load collapse during strong earthquakes. A new method of strengthening reinforced concrete columns against axial failure was developed and verified through seismic tests on column and frame specimens. The purpose of the strengthening was specially focused on the maintenance of axial load capacity of the columns until the excessive lateral deformation in the first stage, although the lateral load capacity could also be improved. In this paper, the method is introduced and the results of a series of static verification tests are reported.
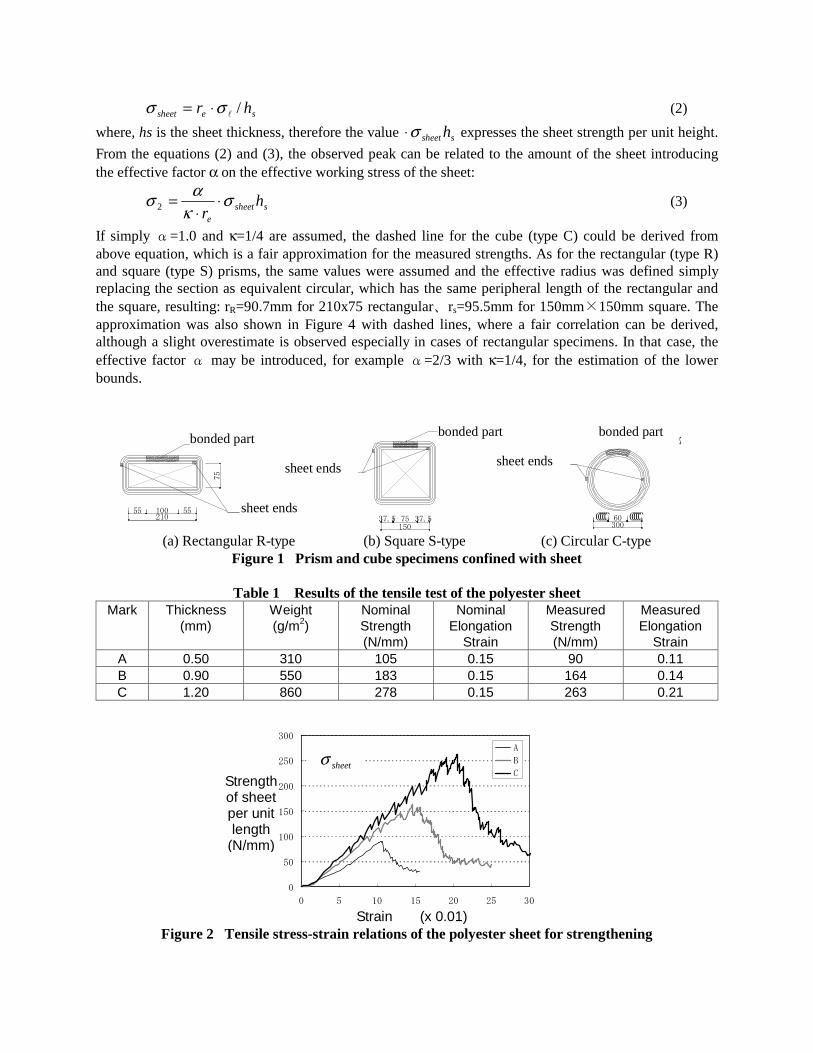
PRISMS AND CUBES CONFINED WITH POLYESTER SHEET The concrete prisms or cubes confined with the polyester sheet were tested to investigate the basic stress-strain relation of confined concrete (Tanabe[1] and Kabeyasawa[2]). The thickness and number of layers of the sheet were varied systematically. The concrete prism and cube were made using the same concrete with column specimens, the compressive strength of which was 18.25MPa. The height was 300mm commonly and the shapes of the base were also varied as: (a) R-type, rectangular of 210 mm×75mm, (b) S-type, square of 150 mm×150mm, and (c) C-type, circular with diameter of 150mm. The prism and cube specimens with the sheet layers are shown in Figure 1. The thickness of the used sheets was 0.5mm(A), 0.9mm(B) and 1.2mm(C). The number of the sheet layers was varied as 1, 2, 3 for 0.5mm(A), 2, 3 for 0.9mm(B), and 2 for 1.2mm(C). The results from the tensile test of the sheets were listed in Table 1. The measured strengths were a little less than the nominal strengths. The observed elongation strain at the maximum strength were in proportion to the thickness varying from 0.11 to 0.21, whereas the nominal value is commonly 0.15. The observed stress strain relations were shown in Figure 2. The stress strain relations from the compression tests of the prisms and cubes are shown in Figure 3. The specimens failed in compression at the first peak strains of 0.003 to 0.007. The specimens without sheet failed after the peak. The axial stress of the specimens with sheet decreased after the first peak down to 5 MPa to 15 MPa at the strain of 0.01 to 0.05, and then recovered gradually with progress of the axial strain. The stress reached the second peak up to 30 MPa at the strain of 0.1 to 0.3, where the sheet ruptured with a vertical gap. The measured strengths were analyzed with the amount of the sheet, which is the sheet strength measured from the tensile test and multiplied with number of layers. The amount sheet was not effective to the first peak strength (σ1), which was determined essentially by the unconfined concrete strength. The second peak strength (σ2) had clear relations with the amount of the sheet, as shown in Figure 4, where the horizontal axial is the amount of the sheet in . The observed second peak strength was in proportion to the amount of the sheet regardless of number of layers in case of each specimen types(R, S, C). The increment of the second peak strength to the amount of the sheet was almost equal in cases of R, rectangular, and S, square, whereas it was 1.6 times larger generally in case of C, circular. The least square linear relations were shown in solid lines in the figures. The relations were analyzed as follows reflecting the amount of the sheet and the shapes of the specimens. The normal stress for expansion or passive confinement stress (σ1) can be related with the measured second peak stress (σ2) as:
2σκσ ⋅=l
(1)
Under the normal stress l
σ in the cube with the radius of re, the passive tensile stress of the sheet per unit
thickness in the tangential direction σsheet are in the form as:
sesheet hr /l
σσ ⋅= (2)
where, hs is the sheet thickness, therefore the value ssheet hσ⋅ expresses the sheet strength per unit height.
From the equations (2) and (3), the observed peak can be related to the amount of the sheet introducing the effective factor α on the effective working stress of the sheet:
ssheete
hr
σκ
ασ ⋅⋅
=2 (3)
If simply α=1.0 and κ=1/4 are assumed, the dashed line for the cube (type C) could be derived from above equation, which is a fair approximation for the measured strengths. As for the rectangular (type R) and square (type S) prisms, the same values were assumed and the effective radius was defined simply replacing the section as equivalent circular, which has the same peripheral length of the rectangular and the square, resulting: rR=90.7mm for 210x75 rectangular、rs=95.5mm for 150mm×150mm square. The approximation was also shown in Figure 4 with dashed lines, where a fair correlation can be derived, although a slight overestimate is observed especially in cases of rectangular specimens. In that case, the effective factor α may be introduced, for example α=2/3 with κ=1/4, for the estimation of the lower bounds.
(a) Rectangular R-type (b) Square S-type (c) Circular C-type Figure 1 Prism and cube specimens confined with sheet
Table 1 Results of the tensile test of the polyester sheet
Mark Thickness (mm)
Weight (g/m2)
Nominal Strength (N/mm)
Nominal Elongation
Strain
Measured Strength (N/mm)
Measured Elongation
Strain A 0.50 310 105 0.15 90 0.11 B 0.90 550 183 0.15 164 0.14 C 1.20 860 278 0.15 263 0.21
Figure 2 Tensile stress-strain relations of the polyester sheet for strengthening
0
50
100
150
200
250
300
0 5 10 15 20 25 30
伸び率(%)
引張強度(N/mm)
A
B
C
Strain (x 0.01)
Strengthof sheet per unit length
(N/mm)
sheetσ
Rタイプ (4層)
シート端 210
75
55 100 55
接着部
150
Sタイプ (4層)
接着部
シート端
75 37.537.5
Cタイプ (4層)
シート端
300
接着部
60
sheet ends
sheet ends
sheet ends
bonded part bonded part bonded part
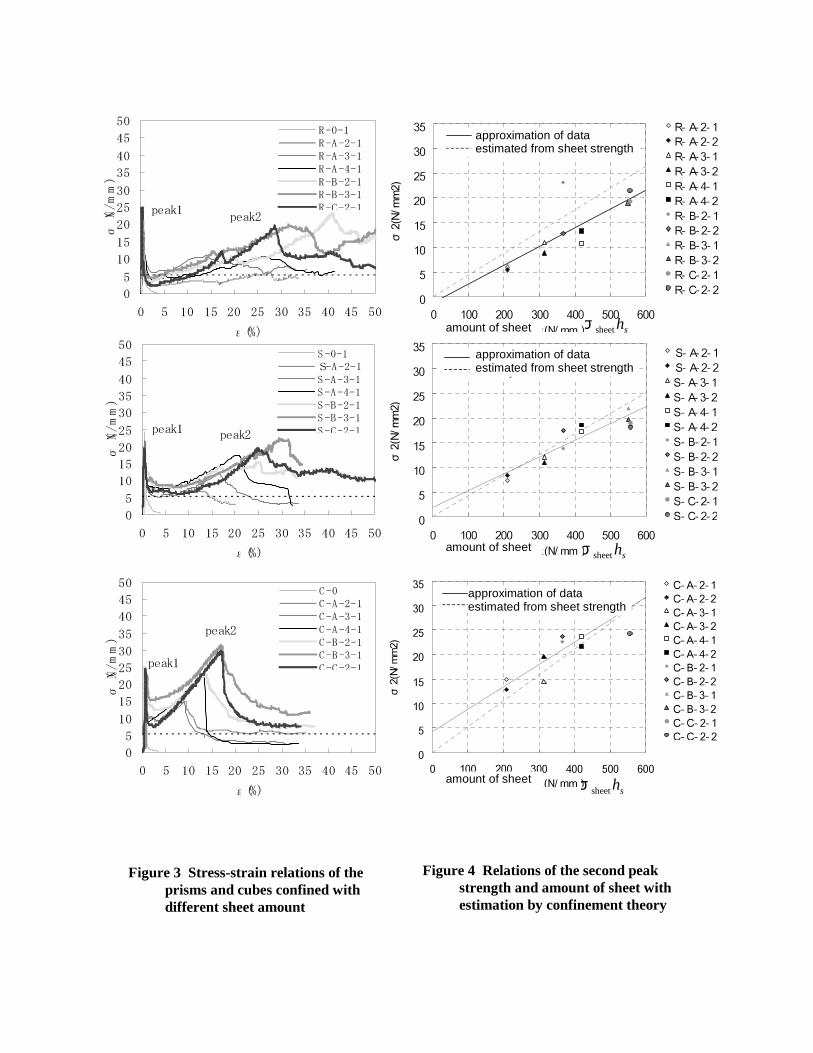
Figure 3. Compressive stress-strain relations of the prisms confined with
equivalent sheet ratios
Figure 4. Relations of the second peak
strengths and the amount of sheet
0
5
10
15
20
25
30
35
40
45
50
0 5 10 15 20 25 30 35 40 45 50
ε(%)
σ(N/mm)
R-0-1
R-A-2-1
R-A-3-1
R-A-4-1
R-B-2-1
R-B-3-1
R-C-2-1peak1peak2
0
5
10
15
20
25
30
35
40
45
50
0 5 10 15 20 25 30 35 40 45 50
ε(%)
σ(N/mm)
S-0-1
S-A-2-1
S-A-3-1
S-A-4-1
S-B-2-1
S-B-3-1
S-C-2-1peak1 peak2
0
5
10
15
20
25
30
35
40
45
50
0 5 10 15 20 25 30 35 40 45 50
ε(%)
σ(N/mm)
C-0
C-A-2-1
C-A-3-1
C-A-4-1
C-B-2-1
C-B-3-1
C-C-2-1peak1
peak2
0
5
10
15
20
25
30
35
0 100 200 300 400 500 600
補強量(N/ mm)
σ2(N/mm2)
R-A-2- 1
R-A-2- 2
R-A-3- 1
R-A-3- 2
R-A-4- 1
R-A-4- 2
R-B-2- 1
R-B-2- 2
R-B-3- 1
R-B-3- 2
R-C-2- 1
R-C-2- 2
回帰線y=- 1.25+0.038x 計算式y=0.044x
0
5
10
15
20
25
30
35
0 100 200 300 400 500 600
補強量(N/ mm)
σ2(N/mm2)
S-A-2- 1
S-A-2- 2
S-A- 3- 1
S-A- 3- 2
S-A- 4- 1
S-A- 4- 2
S-B- 2- 1
S-B- 2- 2
S-B- 3- 1
S-B- 3- 2
S-C- 2- 1
S-C- 2- 2
回帰線y=1.88+0.034x 計算式y=0.042x
0
5
10
15
20
25
30
35
0 100 200 300 400 500 600
補強量(N/ mm)
σ2(N/mm2)
C- A- 2- 1C- A- 2- 2
C- A- 3- 1C- A- 3- 2
C- A- 4- 1
C- A- 4- 2C- B- 2- 1
C- B- 2- 2C- B- 3- 1
C- B- 3- 2
C- C- 2- 1C- C- 2- 2
回帰線y=4.19+0.046x 計算式y=0.053x
amount of sheet
amount of sheet
amount of sheet
approximation of data estimated from sheet strength
approximation of data estimated from sheet strength
approximation of data estimated from sheet strength
shsheetσ
shsheetσ
shsheetσ
Figure 3 Stress-strain relations of
the prisms and cubes
Figure 4 Relations of the second peak
strength and amount of sheet
Figure 3 Stress-strain relations of the prisms and cubes confined with different sheet amount
Figure 4 Relations of the second peak strength and amount of sheet with estimation by confinement theory
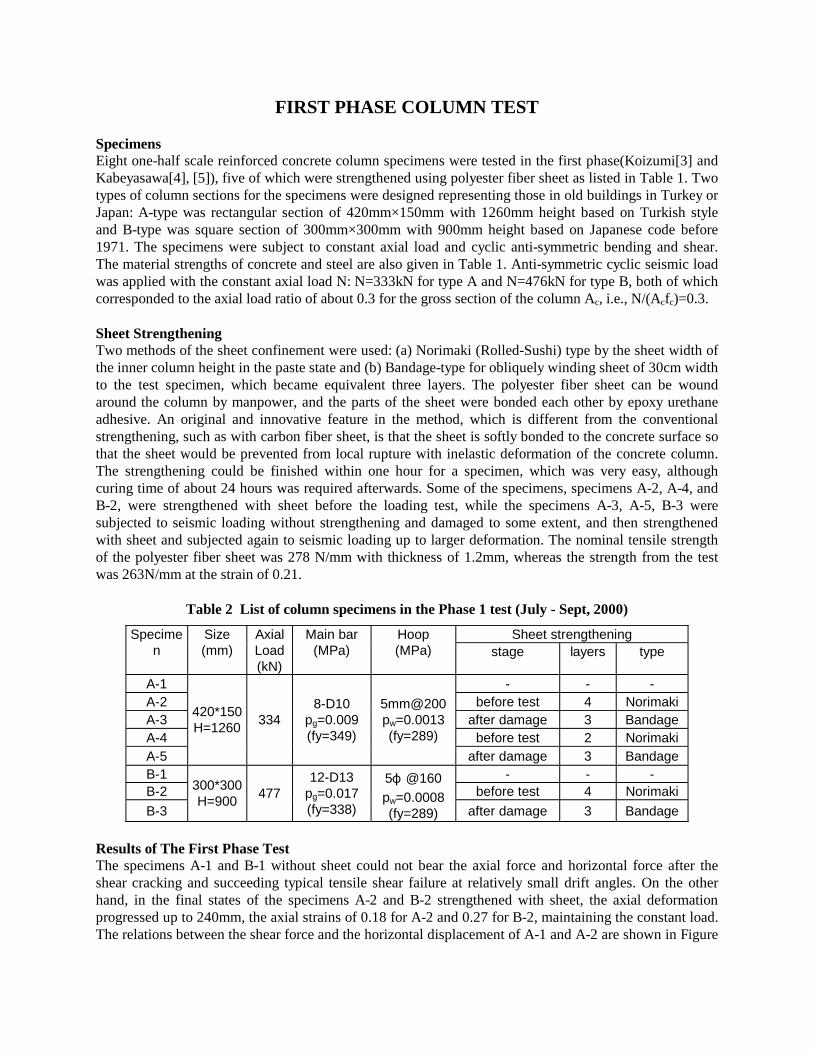
FIRST PHASE COLUMN TEST Specimens Eight one-half scale reinforced concrete column specimens were tested in the first phase(Koizumi[3] and Kabeyasawa[4], [5]), five of which were strengthened using polyester fiber sheet as listed in Table 1. Two types of column sections for the specimens were designed representing those in old buildings in Turkey or Japan: A-type was rectangular section of 420mm×150mm with 1260mm height based on Turkish style and B-type was square section of 300mm×300mm with 900mm height based on Japanese code before 1971. The specimens were subject to constant axial load and cyclic anti-symmetric bending and shear. The material strengths of concrete and steel are also given in Table 1. Anti-symmetric cyclic seismic load was applied with the constant axial load N: N=333kN for type A and N=476kN for type B, both of which corresponded to the axial load ratio of about 0.3 for the gross section of the column Ac, i.e., N/(Acfc)=0.3. Sheet Strengthening Two methods of the sheet confinement were used: (a) Norimaki (Rolled-Sushi) type by the sheet width of the inner column height in the paste state and (b) Bandage-type for obliquely winding sheet of 30cm width to the test specimen, which became equivalent three layers. The polyester fiber sheet can be wound around the column by manpower, and the parts of the sheet were bonded each other by epoxy urethane adhesive. An original and innovative feature in the method, which is different from the conventional strengthening, such as with carbon fiber sheet, is that the sheet is softly bonded to the concrete surface so that the sheet would be prevented from local rupture with inelastic deformation of the concrete column. The strengthening could be finished within one hour for a specimen, which was very easy, although curing time of about 24 hours was required afterwards. Some of the specimens, specimens A-2, A-4, and B-2, were strengthened with sheet before the loading test, while the specimens A-3, A-5, B-3 were subjected to seismic loading without strengthening and damaged to some extent, and then strengthened with sheet and subjected again to seismic loading up to larger deformation. The nominal tensile strength of the polyester fiber sheet was 278 N/mm with thickness of 1.2mm, whereas the strength from the test was 263N/mm at the strain of 0.21.
Table 2 List of column specimens in the Phase 1 test (July - Sept, 2000)
Sheet strengthening Specimen
Size (mm)
Axial Load (kN)
Main bar (MPa)
Hoop (MPa) stage layers type
A-1 - - - A-2 before test 4 Norimaki A-3 after damage 3 Bandage A-4 before test 2 Norimaki A-5
420*150 H=1260
334 8-D10
pg=0.009 (fy=349)
5mm@200 pw=0.0013 (fy=289)
after damage 3 Bandage B-1 - - - B-2 before test 4 Norimaki
B-3
300*300 H=900
477 12-D13
pg=0.017 (fy=338)
5φ @160 pw=0.0008 (fy=289) after damage 3 Bandage
Results of The First Phase Test The specimens A-1 and B-1 without sheet could not bear the axial force and horizontal force after the shear cracking and succeeding typical tensile shear failure at relatively small drift angles. On the other hand, in the final states of the specimens A-2 and B-2 strengthened with sheet, the axial deformation progressed up to 240mm, the axial strains of 0.18 for A-2 and 0.27 for B-2, maintaining the constant load. The relations between the shear force and the horizontal displacement of A-1 and A-2 are shown in Figure
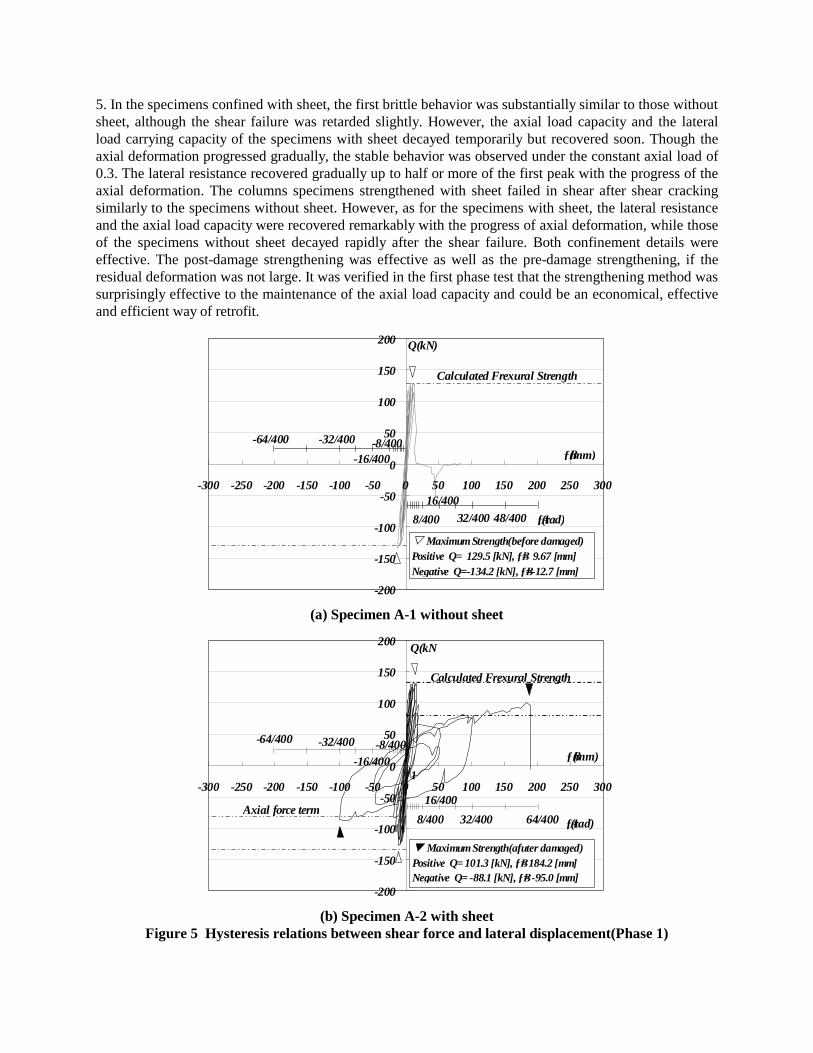
5. In the specimens confined with sheet, the first brittle behavior was substantially similar to those without sheet, although the shear failure was retarded slightly. However, the axial load capacity and the lateral load carrying capacity of the specimens with sheet decayed temporarily but recovered soon. Though the axial deformation progressed gradually, the stable behavior was observed under the constant axial load of 0.3. The lateral resistance recovered gradually up to half or more of the first peak with the progress of the axial deformation. The columns specimens strengthened with sheet failed in shear after shear cracking similarly to the specimens without sheet. However, as for the specimens with sheet, the lateral resistance and the axial load capacity were recovered remarkably with the progress of axial deformation, while those of the specimens without sheet decayed rapidly after the shear failure. Both confinement details were effective. The post-damage strengthening was effective as well as the pre-damage strengthening, if the residual deformation was not large. It was verified in the first phase test that the strengthening method was surprisingly effective to the maintenance of the axial load capacity and could be an economical, effective and efficient way of retrofit.
(a) Specimen A-1 without sheet
(b) Specimen A-2 with sheet Figure 5 Hysteresis relations between shear force and lateral displacement(Phase 1)
-200
-150
-100
-50
0
50
100
150
200
-300 -250 -200 -150 -100 -50 0 50 100 150 200 250 300
Q(kN
ƒΒ(mm)
8/400
-8/400
16/400
ƒΑ(rad)32/400
-32/400
-16/400
▼ Maximum Strength(afuter damaged)Positive Q= 101.3 [kN], ƒΒ= 184.2 [mm]Negative Q= -88.1 [kN], ƒΒ= -95.0 [mm]
64/400
1
-64/400
Axial force term
Calculated Frexural Strength
-200
-150
-100
-50
0
50
100
150
200
-300 -250 -200 -150 -100 -50 0 50 100 150 200 250 300
Q(kN)
ƒΒ(mm)
▽ Maximum Strength(before damaged)Positive Q= 129.5 [kN], ƒΒ= 9.67 [mm]Negative Q=-134.2 [kN], ƒΒ=-12.7 [mm]
8/400
16/400
-8/400
ƒΑ(rad)32/400 48/400
-16/400
-32/400-64/400
Calculated Frexural Strength
SECOND PHASE COLUMN TEST
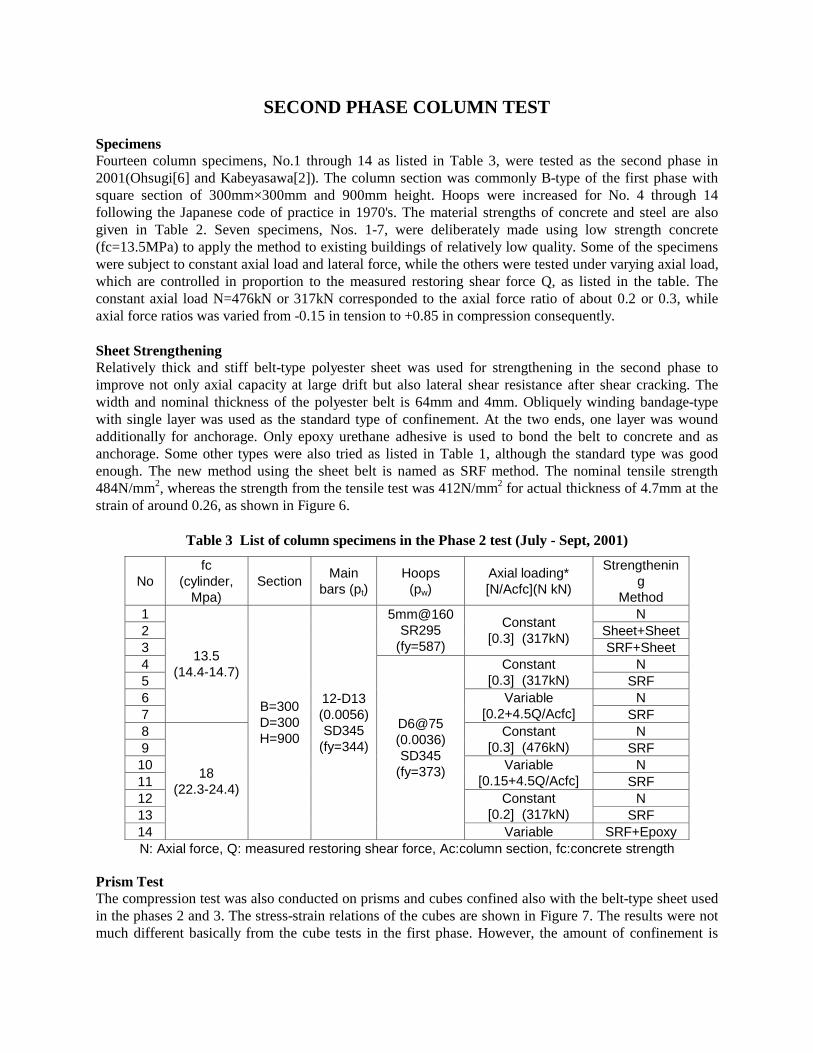
Specimens Fourteen column specimens, No.1 through 14 as listed in Table 3, were tested as the second phase in 2001(Ohsugi[6] and Kabeyasawa[2]). The column section was commonly B-type of the first phase with square section of 300mm×300mm and 900mm height. Hoops were increased for No. 4 through 14 following the Japanese code of practice in 1970's. The material strengths of concrete and steel are also given in Table 2. Seven specimens, Nos. 1-7, were deliberately made using low strength concrete (fc=13.5MPa) to apply the method to existing buildings of relatively low quality. Some of the specimens were subject to constant axial load and lateral force, while the others were tested under varying axial load, which are controlled in proportion to the measured restoring shear force Q, as listed in the table. The constant axial load N=476kN or 317kN corresponded to the axial force ratio of about 0.2 or 0.3, while axial force ratios was varied from -0.15 in tension to +0.85 in compression consequently. Sheet Strengthening Relatively thick and stiff belt-type polyester sheet was used for strengthening in the second phase to improve not only axial capacity at large drift but also lateral shear resistance after shear cracking. The width and nominal thickness of the polyester belt is 64mm and 4mm. Obliquely winding bandage-type with single layer was used as the standard type of confinement. At the two ends, one layer was wound additionally for anchorage. Only epoxy urethane adhesive is used to bond the belt to concrete and as anchorage. Some other types were also tried as listed in Table 1, although the standard type was good enough. The new method using the sheet belt is named as SRF method. The nominal tensile strength 484N/mm2, whereas the strength from the tensile test was 412N/mm2 for actual thickness of 4.7mm at the strain of around 0.26, as shown in Figure 6.
Table 3 List of column specimens in the Phase 2 test (July - Sept, 2001)
No fc
(cylinder, Mpa)
Section Main
bars (pt) Hoops
(pw) Axial loading* [N/Acfc](N kN)
Strengthening
Method 1 N 2 Sheet+Sheet 3
5mm@160 SR295
(fy=587)
Constant [0.3] (317kN)
SRF+Sheet 4 N 5
Constant [0.3] (317kN) SRF
6 N 7
13.5 (14.4-14.7)
Variable [0.2+4.5Q/Acfc] SRF
8 N 9
Constant [0.3] (476kN) SRF
10 N 11
Variable [0.15+4.5Q/Acfc] SRF
12 N 13
Constant [0.2] (317kN) SRF
14
18 (22.3-24.4)
B=300 D=300 H=900
12-D13 (0.0056) SD345
(fy=344)
D6@75 (0.0036) SD345
(fy=373)
Variable SRF+Epoxy N: Axial force, Q: measured restoring shear force, Ac:column section, fc:concrete strength
Prism Test The compression test was also conducted on prisms and cubes confined also with the belt-type sheet used in the phases 2 and 3. The stress-strain relations of the cubes are shown in Figure 7. The results were not much different basically from the cube tests in the first phase. However, the amount of confinement is
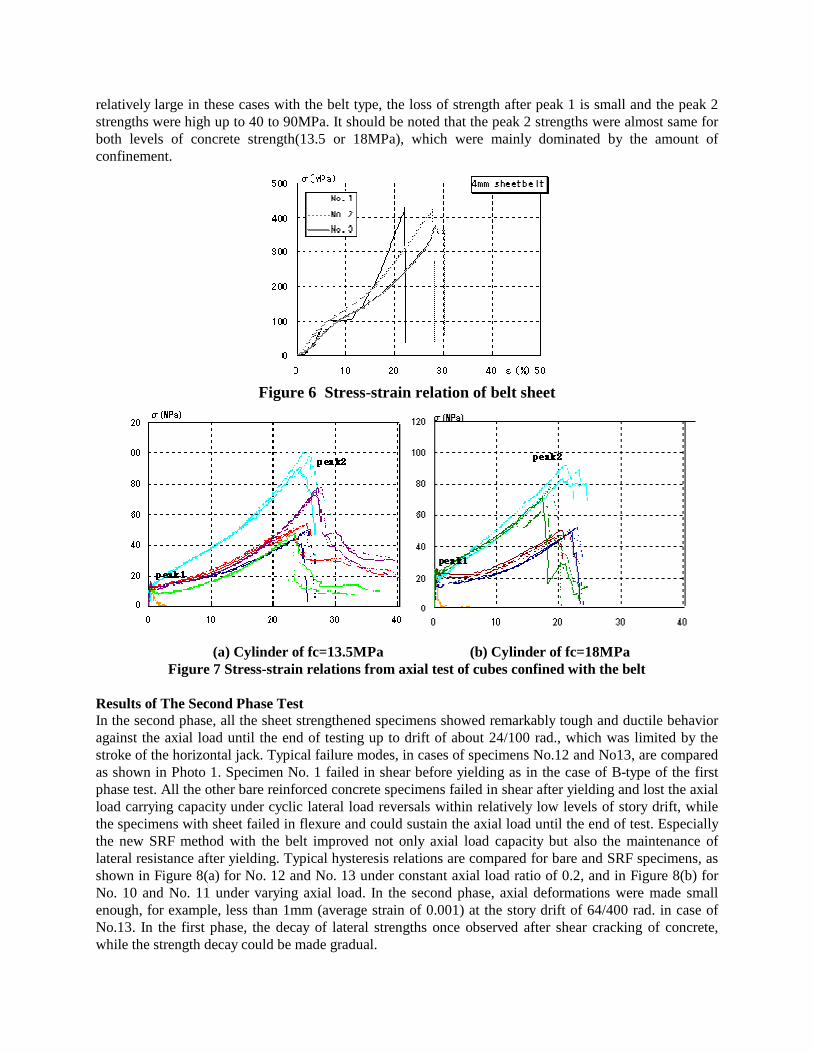
relatively large in these cases with the belt type, the loss of strength after peak 1 is small and the peak 2 strengths were high up to 40 to 90MPa. It should be noted that the peak 2 strengths were almost same for both levels of concrete strength(13.5 or 18MPa), which were mainly dominated by the amount of confinement.
Figure 6 Stress-strain relation of belt sheet
(a) Cylinder of fc=13.5MPa (b) Cylinder of fc=18MPa
Figure 7 Stress-strain relations from axial test of cubes confined with the belt Results of The Second Phase Test In the second phase, all the sheet strengthened specimens showed remarkably tough and ductile behavior against the axial load until the end of testing up to drift of about 24/100 rad., which was limited by the stroke of the horizontal jack. Typical failure modes, in cases of specimens No.12 and No13, are compared as shown in Photo 1. Specimen No. 1 failed in shear before yielding as in the case of B-type of the first phase test. All the other bare reinforced concrete specimens failed in shear after yielding and lost the axial load carrying capacity under cyclic lateral load reversals within relatively low levels of story drift, while the specimens with sheet failed in flexure and could sustain the axial load until the end of test. Especially the new SRF method with the belt improved not only axial load capacity but also the maintenance of lateral resistance after yielding. Typical hysteresis relations are compared for bare and SRF specimens, as shown in Figure 8(a) for No. 12 and No. 13 under constant axial load ratio of 0.2, and in Figure 8(b) for No. 10 and No. 11 under varying axial load. In the second phase, axial deformations were made small enough, for example, less than 1mm (average strain of 0.001) at the story drift of 64/400 rad. in case of No.13. In the first phase, the decay of lateral strengths once observed after shear cracking of concrete, while the strength decay could be made gradual.
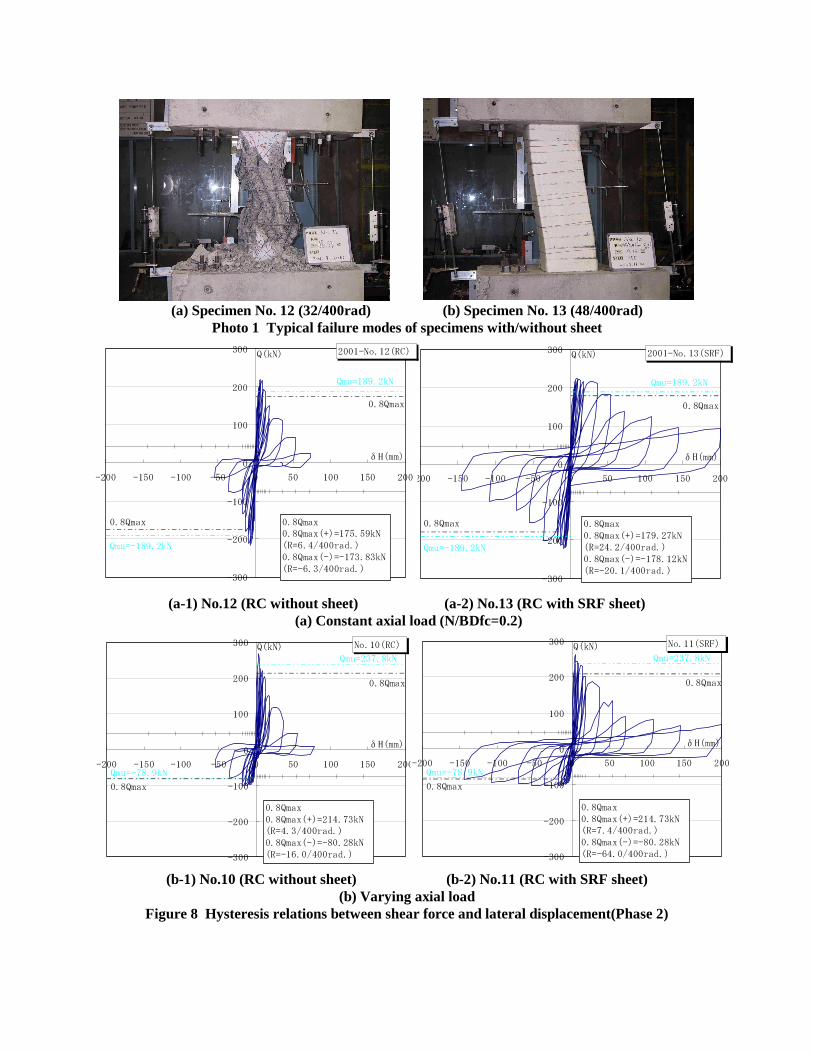
(a) Specimen No. 12 (32/400rad) (b) Specimen No. 13 (48/400rad) Photo 1 Typical failure modes of specimens with/without sheet
(a-1) No.12 (RC without sheet) (a-2) No.13 (RC with SRF sheet) (a) Constant axial load (N/BDfc=0.2)
(b-1) No.10 (RC without sheet) (b-2) No.11 (RC with SRF sheet) (b) Varying axial load
Figure 8 Hysteresis relations between shear force and lateral displacement(Phase 2)
2001-No.13(SRF)
-300
-200
-100
0
100
200
300
-200 -150 -100 -50 0 50 100 150 200
δH(mm)
Q(kN)
-
0.8Qmax
0.8Qmax(+)=179.27kN
(R=24.2/400rad.)
0.8Qmax(-)=-178.12kN
(R=-20.1/400rad.)
Qmu=-189.2kN
Qmu=189.2kN
0.8Qmax
0.8Qmax
No.10(RC)
-300
-200
-100
0
100
200
300
-200 -150 -100 -50 0 50 100 150 200
δH(mm)
Q(kN)
-
0.8Qmax
0.8Qmax(+)=214.73kN
(R=4.3/400rad.)
0.8Qmax(-)=-80.28kN
(R=-16.0/400rad.)
Qmu=-78.9kN
Qmu=237.8kN
0.8Qmax
0.8Qmax
No.11(SRF)
-300
-200
-100
0
100
200
300
-200 -150 -100 -50 0 50 100 150 200
δH(mm)
Q(kN)
-
0.8Qmax
0.8Qmax(+)=214.73kN
(R=7.4/400rad.)
0.8Qmax(-)=-80.28kN
(R=-64.0/400rad.)
Qmu=-78.9kN
Qmu=237.8kN
0.8Qmax
0.8Qmax
2001-No.12(RC)
-300
-200
-100
0
100
200
300
-200 -150 -100 -50 0 50 100 150 200
δH(mm)
Q(kN)
-
0.8Qmax
0.8Qmax(+)=175.59kN
(R=6.4/400rad.)
0.8Qmax(-)=-173.83kN
(R=-6.3/400rad.)
Qmu=-189.2kN
Qmu=189.2kN
0.8Qmax
0.8Qmax
After the seismic test to maximum drift of 24/100, some of the specimens were returned to the origin and axial compression test was conducted. The specimen could sustain more than axial load ratio of 1.0 (N=Acfc), which was limited by the capacity of vertical jacks.
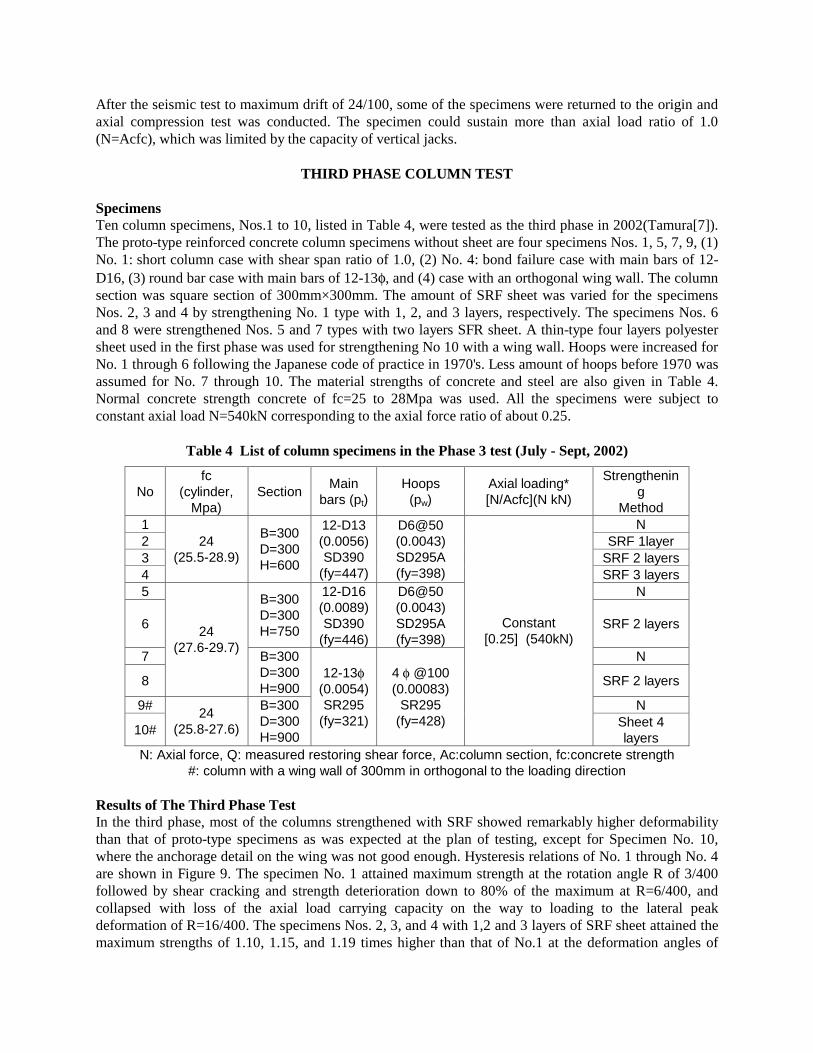
THIRD PHASE COLUMN TEST Specimens Ten column specimens, Nos.1 to 10, listed in Table 4, were tested as the third phase in 2002(Tamura[7]). The proto-type reinforced concrete column specimens without sheet are four specimens Nos. 1, 5, 7, 9, (1) No. 1: short column case with shear span ratio of 1.0, (2) No. 4: bond failure case with main bars of 12-D16, (3) round bar case with main bars of 12-13φ, and (4) case with an orthogonal wing wall. The column section was square section of 300mm×300mm. The amount of SRF sheet was varied for the specimens Nos. 2, 3 and 4 by strengthening No. 1 type with 1, 2, and 3 layers, respectively. The specimens Nos. 6 and 8 were strengthened Nos. 5 and 7 types with two layers SFR sheet. A thin-type four layers polyester sheet used in the first phase was used for strengthening No 10 with a wing wall. Hoops were increased for No. 1 through 6 following the Japanese code of practice in 1970's. Less amount of hoops before 1970 was assumed for No. 7 through 10. The material strengths of concrete and steel are also given in Table 4. Normal concrete strength concrete of fc=25 to 28Mpa was used. All the specimens were subject to constant axial load N=540kN corresponding to the axial force ratio of about 0.25.
Table 4 List of column specimens in the Phase 3 test (July - Sept, 2002)
No fc
(cylinder, Mpa)
Section Main
bars (pt) Hoops
(pw) Axial loading* [N/Acfc](N kN)
Strengthening
Method 1 N 2 SRF 1layer 3 SRF 2 layers 4
24 (25.5-28.9)
B=300 D=300 H=600
12-D13 (0.0056) SD390
(fy=447)
D6@50 (0.0043) SD295A (fy=398) SRF 3 layers
5 N
6
B=300 D=300 H=750
12-D16 (0.0089) SD390
(fy=446)
D6@50 (0.0043) SD295A (fy=398)
SRF 2 layers
7 N
8
24 (27.6-29.7)
B=300 D=300 H=900 SRF 2 layers
9# N
10# 24
(25.8-27.6)
B=300 D=300 H=900
12-13φ (0.0054) SR295
(fy=321)
4 φ @100 (0.00083)
SR295 (fy=428)
Constant [0.25] (540kN)
Sheet 4 layers
N: Axial force, Q: measured restoring shear force, Ac:column section, fc:concrete strength #: column with a wing wall of 300mm in orthogonal to the loading direction
Results of The Third Phase Test In the third phase, most of the columns strengthened with SRF showed remarkably higher deformability than that of proto-type specimens as was expected at the plan of testing, except for Specimen No. 10, where the anchorage detail on the wing was not good enough. Hysteresis relations of No. 1 through No. 4 are shown in Figure 9. The specimen No. 1 attained maximum strength at the rotation angle R of 3/400 followed by shear cracking and strength deterioration down to 80% of the maximum at R=6/400, and collapsed with loss of the axial load carrying capacity on the way to loading to the lateral peak deformation of R=16/400. The specimens Nos. 2, 3, and 4 with 1,2 and 3 layers of SRF sheet attained the maximum strengths of 1.10, 1.15, and 1.19 times higher than that of No.1 at the deformation angles of
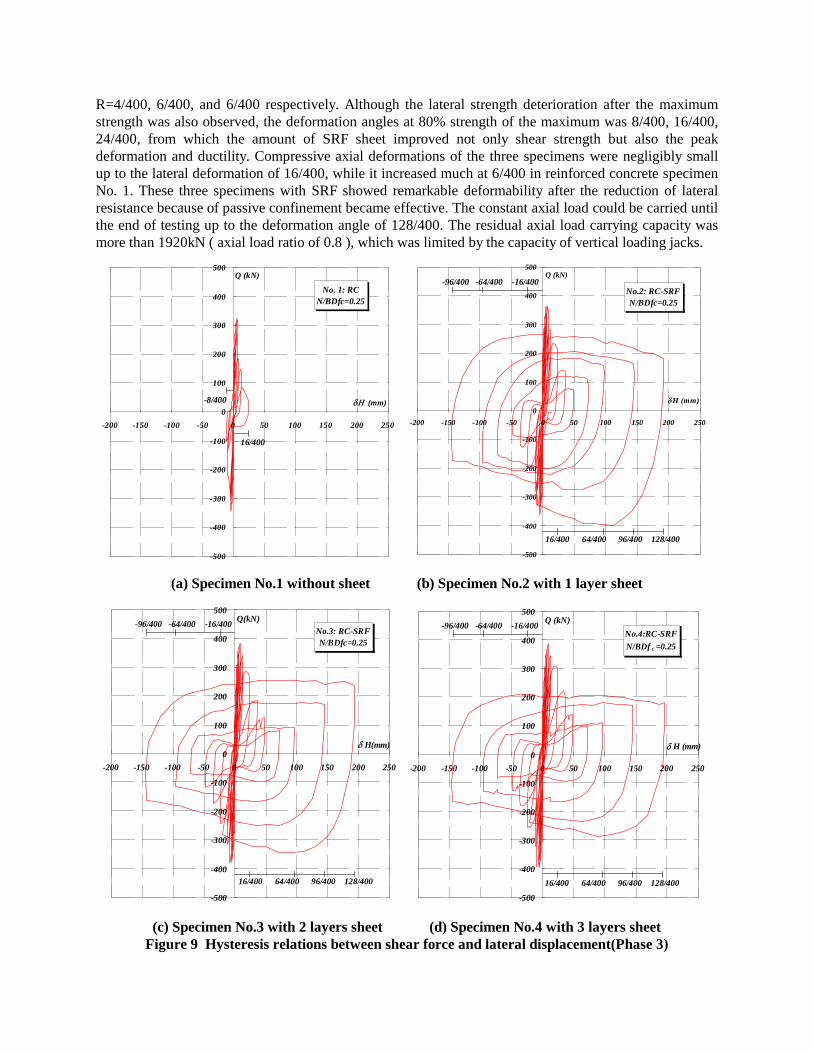
R=4/400, 6/400, and 6/400 respectively. Although the lateral strength deterioration after the maximum strength was also observed, the deformation angles at 80% strength of the maximum was 8/400, 16/400, 24/400, from which the amount of SRF sheet improved not only shear strength but also the peak deformation and ductility. Compressive axial deformations of the three specimens were negligibly small up to the lateral deformation of 16/400, while it increased much at 6/400 in reinforced concrete specimen No. 1. These three specimens with SRF showed remarkable deformability after the reduction of lateral resistance because of passive confinement became effective. The constant axial load could be carried until the end of testing up to the deformation angle of 128/400. The residual axial load carrying capacity was more than 1920kN ( axial load ratio of 0.8 ), which was limited by the capacity of vertical loading jacks.
(a) Specimen No.1 without sheet (b) Specimen No.2 with 1 layer sheet
(c) Specimen No.3 with 2 layers sheet (d) Specimen No.4 with 3 layers sheet Figure 9 Hysteresis relations between shear force and lateral displacement(Phase 3)
No. 1: RCN/BDfc=0.25
-500
-400
-300
-200
-100
0
100
200
300
400
500
-200 -150 -100 -50 0 50 100 150 200 250
δΗ (mm)
Q (kN)
16/400
-8/400
No.2: RC-SRFN/BDfc=0.25
-500
-400
-300
-200
-100
0
100
200
300
400
500
-200 -150 -100 -50 0 50 100 150 200 250
δ H (mm)
Q (kN)
16/400 64/400 96/400 128/400
-16/400-64/400-96/400
No.3: RC-SRFN/BDfc=0.25
-500
-400
-300
-200
-100
0
100
200
300
400
500
-200 -150 -100 -50 0 50 100 150 200 250
δ H(mm)
Q(kN)
16/400 64/400 96/400 128/400
-16/400-64/400-96/400No.4:RC-SRF
N/BDf c =0.25
-500
-400
-300
-200
-100
0
100
200
300
400
500
-200 -150 -100 -50 0 50 100 150 200 250
δ H (mm)
Q (kN)
16/400 64/400 96/400 128/400
-16/400-64/400-96/400
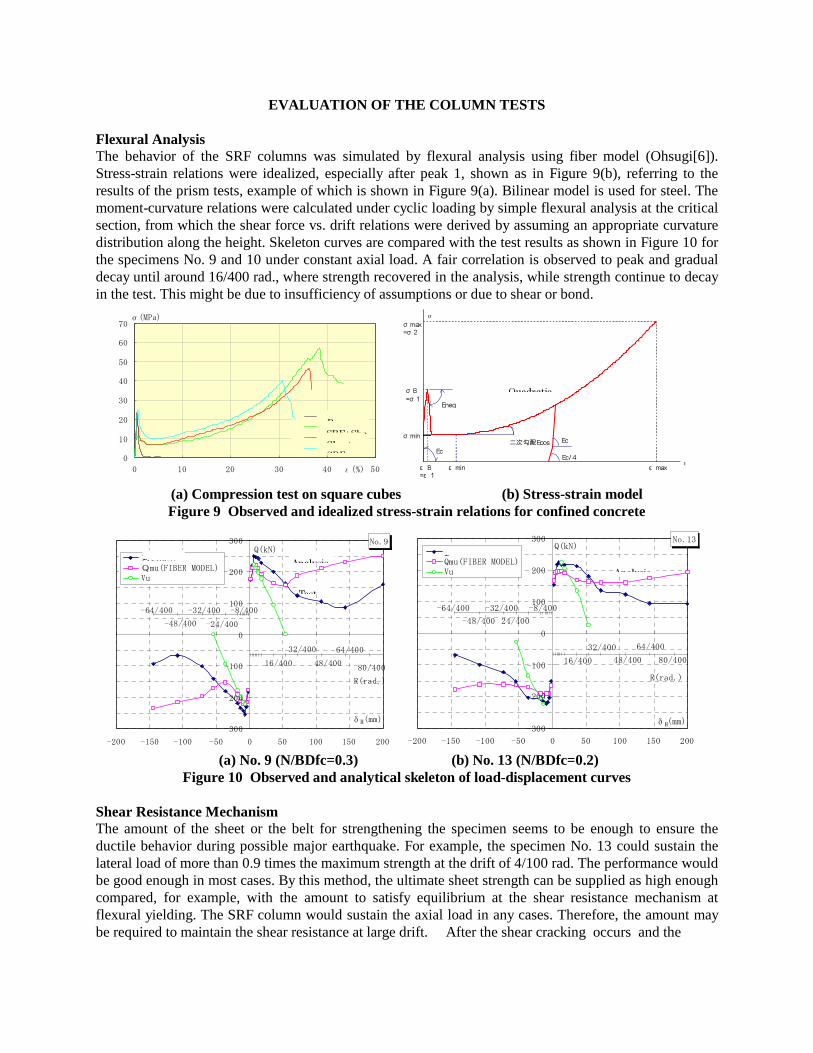
EVALUATION OF THE COLUMN TESTS Flexural Analysis The behavior of the SRF columns was simulated by flexural analysis using fiber model (Ohsugi[6]). Stress-strain relations were idealized, especially after peak 1, shown as in Figure 9(b), referring to the results of the prism tests, example of which is shown in Figure 9(a). Bilinear model is used for steel. The moment-curvature relations were calculated under cyclic loading by simple flexural analysis at the critical section, from which the shear force vs. drift relations were derived by assuming an appropriate curvature distribution along the height. Skeleton curves are compared with the test results as shown in Figure 10 for the specimens No. 9 and 10 under constant axial load. A fair correlation is observed to peak and gradual decay until around 16/400 rad., where strength recovered in the analysis, while strength continue to decay in the test. This might be due to insufficiency of assumptions or due to shear or bond.
(a) Compression test on square cubes (b) Stress-strain model Figure 9 Observed and idealized stress-strain relations for confined concrete
(a) No. 9 (N/BDfc=0.3) (b) No. 13 (N/BDfc=0.2) Figure 10 Observed and analytical skeleton of load-displacement curves
Shear Resistance Mechanism The amount of the sheet or the belt for strengthening the specimen seems to be enough to ensure the ductile behavior during possible major earthquake. For example, the specimen No. 13 could sustain the lateral load of more than 0.9 times the maximum strength at the drift of 4/100 rad. The performance would be good enough in most cases. By this method, the ultimate sheet strength can be supplied as high enough compared, for example, with the amount to satisfy equilibrium at the shear resistance mechanism at flexural yielding. The SRF column would sustain the axial load in any cases. Therefore, the amount may be required to maintain the shear resistance at large drift. After the shear cracking occurs and the
ε
σ
σ B=σ 1
σ min
σ max=σ 2
ε min
Eneg
二次勾配EposEc
Ec
Ec/ 4
ε B=ε 1
ε max
Quadratic
0
10
20
30
40
50
60
70
0 10 20 30 40 50ε(%)
σ(MPa)
無補強
補強方法B
補強方法C
補強方法D
B
SRF+She
SRF
Sheet
No.9
-300
-200
-100
0
100
200
300
-200 -150 -100 -50 0 50 100 150 200
δH(mm)
Q(kN)実験結果
Qmu(FIBER MODEL)
Vu
-8/400
-24/400
48/400
64/400
80/40016/400
32/400
R(rad.)
-64/400 -32/400
-48/400
Test
AnalysisT t
No.13
-300
-200
-100
0
100
200
300
-200 -150 -100 -50 0 50 100 150 200
δH(mm)
Q(kN)実験結果Qmu(FIBER MODEL)Vu
-8/400
24/400
48/400
64/400
80/40016/400
32/400
-32/400
R(rad.)
-48/400
-64/400
T t
Analysis
-2
-1
0
-200 -100 0 100 200δH(mm)
-16/400
48/400
64/400
80/40016/400
32/400
-32/400
R(rad.)-48/400
-64/400
No.9
-2
-1
0
1
2
3
4
5
6
-200 -100 0 100 200δH(mm)
ε(%)
平均最大
-16/400
48/400
64/400
80/40016/400
32/400
-32/400
R(rad.)-48/400
-64/400
No.13
-2
-1
0
1
2
3
4
5
6
-200 -100 0 100 200δH(mm)
ε(%)
平均最大
-16/400
48/400
64/400
80/40016/400
32/400
-32/400
R(rad.)
-48/400
-64/400
-2
-1
0
-200 -100 0 100 200δH(mm)
-16/400
48/400
64/400
80/40016/400
32/400
-32/400
R(rad.)-48/400
-64/400
A
Maximum Maximum
AverageAverage Average
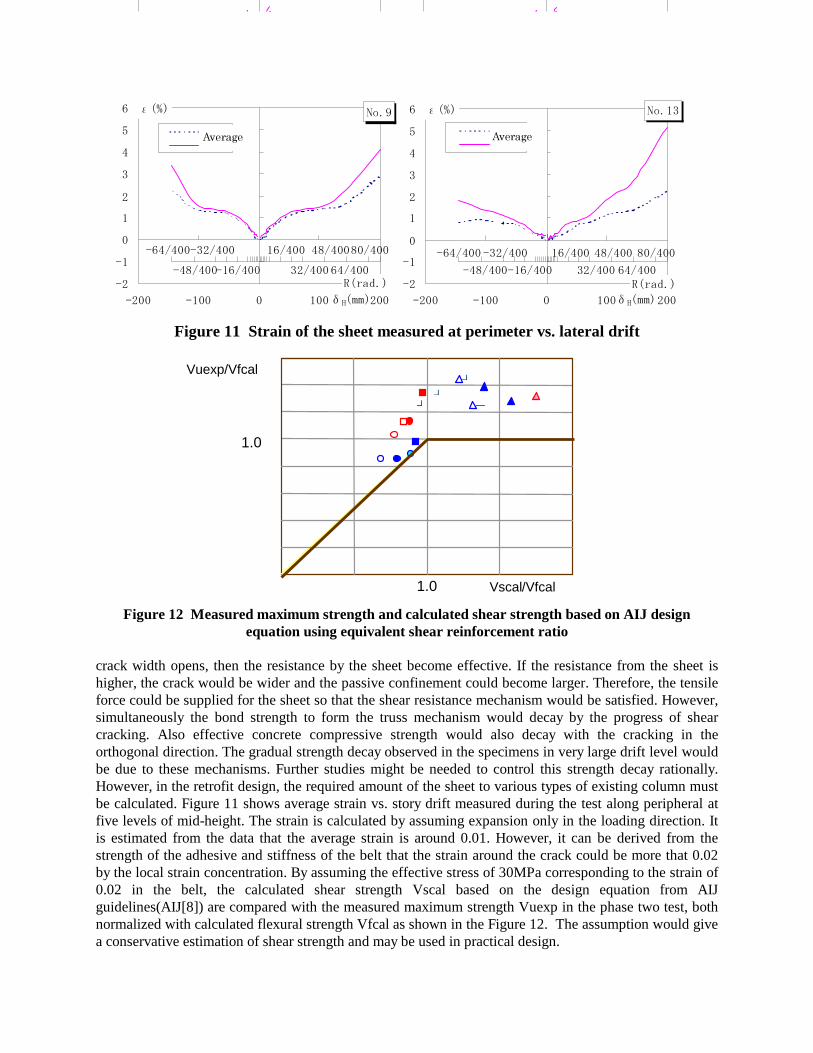
Figure 11 Strain of the sheet measured at perimeter vs. lateral drift
Figure 12 Measured maximum strength and calculated shear strength based on AIJ design equation using equivalent shear reinforcement ratio
crack width opens, then the resistance by the sheet become effective. If the resistance from the sheet is higher, the crack would be wider and the passive confinement could become larger. Therefore, the tensile force could be supplied for the sheet so that the shear resistance mechanism would be satisfied. However, simultaneously the bond strength to form the truss mechanism would decay by the progress of shear cracking. Also effective concrete compressive strength would also decay with the cracking in the orthogonal direction. The gradual strength decay observed in the specimens in very large drift level would be due to these mechanisms. Further studies might be needed to control this strength decay rationally. However, in the retrofit design, the required amount of the sheet to various types of existing column must be calculated. Figure 11 shows average strain vs. story drift measured during the test along peripheral at five levels of mid-height. The strain is calculated by assuming expansion only in the loading direction. It is estimated from the data that the average strain is around 0.01. However, it can be derived from the strength of the adhesive and stiffness of the belt that the strain around the crack could be more that 0.02 by the local strain concentration. By assuming the effective stress of 30MPa corresponding to the strain of 0.02 in the belt, the calculated shear strength Vscal based on the design equation from AIJ guidelines(AIJ[8]) are compared with the measured maximum strength Vuexp in the phase two test, both normalized with calculated flexural strength Vfcal as shown in the Figure 12. The assumption would give a conservative estimation of shear strength and may be used in practical design.
+
-++
1.0
1.0
Vuexp/Vfcal
Vscal/Vfcal
CONCLUSIONS
A new method using polyester fiber sheet or belt (SRF method) was developed for strengthening columns in existing reinforced concrete buildings. The seismic performance of the strengthened columns was verified through a series of static test on column specimens, prism tests and dynamic test. It may be concluded from the test and analytical results that the SRF method is surprisingly effective to the maintenance of the axial load capacity as well as the lateral load capacity and can widely be applied in practice as an economical, effective and efficient way of retrofit.
ACKNOWLEDGEMENT The static tests on columns were conducted in the Structural Testing Laboratory at Yokohama National University, with Mr. Hiroshi Koizumi, Mr. Kengo Kamano, Miss Yasuko Ohsugi, formerly with ERI, Mr. Ousalem Hassane, ERI, Mr. Daichi Tanabe and Mr. Rei Tamura, formerly with YNU. Their cooperative works in the tests and data analyses are gratefully acknowledged. The strengthening method reported herein has been international patent pending as "SRF" method by Square Inc., Japan.
REFERENCES 1. Tanabe, D., Osugi, Y., Tasai, A., Kabeyasawa, T.(2001), “Effect of sheet strengthening on the axial
ductility of reinforced concrete columns at large lateral drift (in Japanese),” Proceedings of the Japan Concrete Institute, Vol. 23, No. 1, 943-948.
2. Kabeyasawa, T., Tasai, A., Igarashi, S. (2002a). An Economical and Efficient Method of Preventing Old Reinforced Concrete Buildings from Collapse under Major Earthquake. Proceedings of 7NCEE, CD-ROM, Boston.
3. Koizumi, H., Kabeyasawa, T., Tasai, A., Igarashi, S.(2001), “A study on sheet strengthening reinforced concrete columns against axial load collapse during major earthquake (in Japanese),” Proceedings of the Japan Concrete Institute, Vol. 23, No. 1, 937-942.
4. Kabeyasawa, T., Tasai, A., Igarashi, S. (2001a). An Economical and Efficient Method of Strengthening Reinforced Concrete Columns against Axial Load Collapse during Major Earthquake. Proceedings of the Third Workshop on Performance-based Engineering on Reinforced Concrete Building Structures, 371-384, Seattle.
5. Kabeyasawa, T., Tasai, A., Igarashi, S. (2001b). A New Method of Strengthening Reinforced Concrete Columns against Axial Load Collapse during Major Earthquake. Proceedings of EASEC-8, CD-ROM, Singapore.
6. Ohsugi, Y., Kabeyasawa, T., Tasai, A., Igarashi, et al (2002). Effect of Sheet Strengthening on Seismic Behavior of Low-Strength Reinforced Concrete (in Japanese). Proceedings of The Third Symposium on Improvement of Preparedness to Earthquake Disaster by Investigating Collapse Process of Structures, 183-187, JSCE.
7. Tamura, R., Tasai, A., Kabeyasawa, T., Igarachi, S.(2003), “Seismic performance of reinforced concrete columns strengthened with polyester sheet (in Japanese),” Proceedings of the Japan Concrete Institute, Vol. 25, No. 1,CD-ROM.
8. AIJ(1999). Design Guidelines for Earthquake-Resistant Reinforced Concrete Buildings Based on Inelastic Displacement Concept (in Japanese). AIJ, Tokyo.


![Design of Reinforced Concrete Columns[1]](https://img.pdfslide.net/doc/110x75/55cf881055034664618ceef8/design-of-reinforced-concrete-columns1.jpg)