Embed Size (px)
Citation preview

International Journal of Mathematics and Statistics Studies
Vol.9, No.2, pp.53-68, 2021
Print ISSN: 2053-2229 (Print),
Online ISSN: 2053-2210 (Online)
53
TEST OF SIGNIFICANCE OF CORRELATION COEFFICIENT IN SCIENCE AND
EDUCATIONAL RESEARCH
Nduka WONU1 and Uyodhu Amekauma VICTOR-EDEMA2 1-2Department of Mathematics/Statistics, Ignatius Ajuru University of Education,
P.M.B 5047 Port Harcourt, Nigeria
Stanley Chimezie NDIMELE3 3Rivers State Senior Secondary Schools Board, Port Harcourt, Nigeria
ABSTRACT: This study demonstrated and compared the use of t-distribution, z-transformation
and the Statistical Package for Social Sciences (SPSS) methods in testing the significance of the
correlation coefficients. The study utilized data extracted from Eze (2019). The findings revealed
that the significance of the correlation coefficient by the Fisher z-transformation and t-distribution
methods were not at variance with that of SPSS. Results also showed that the SPSS approach
appears to be the best method since it saves time, reveals the correlation coefficient and p-value
for decision making. Results further showed that the t-distribution can be used for both large and
small sample sizes since it approximates the z-distribution as the data tends to infinity. Based on
the findings of the study, it was recommended among others that the SPSS approach should be
adopted by researchers and data analysts for testing the significance of correlation coefficients
because it is not only robust, but it is easier, saves time and energy; and users of SPSS in computing
correlation should not go further to convert the derived correlation coefficient using either the t-
distribution or the z-transformation to test a hypothesis to minimize the risk of computational
errors, wrong decisions, time wastage and to avoid unnecessary repetition.
KEYWORDS: Pearson, Spearman, Correlation, Significance, Relationship.
INTRODUCTION
The term correlation refers to a bivariate measure of the relationship that exists between two
variables simultaneously. Correlation can also be defined as a bivariate measure of association
(strength) of the relationship between two variables (Adeleke, 2010). In science and educational
research and statistics, the correlation (relationship) between two variables can be measured using
different statistical tools. These include the Pearson Product Moment Correlation (r) which is
commonly used in research when there are two continuous variables), Spearman Rank Order
Correlation (rs) which is usually used when there are two ordinal variables, Kendall Rank
Correlation, popularly known as Kendal Tau (Kt) and Rank Biserial Correlation (rrb) which are
usually used to correlate an ordinal variable with a dichotomous variable, Point Biserial
Correlation (rpb) which is usually used to correlate a continuous variable with a true dichotomy or
to correlate a nominal data and an internal data, and Phi Coefficient of Correlation (rᶲ) which is
used to correlate two variables that are dichotomous. However, in the concept of this study, the

International Journal of Mathematics and Statistics Studies
Vol.9, No.2, pp.53-68, 2021
Print ISSN: 2053-2229 (Print),
Online ISSN: 2053-2210 (Online)
54
Pearson Product Moment Correlation and Spearman’s Rank Order Correlation are briefly
discussed.
The Pearson Product Moment Correlation and Spearman Rank Order Correlation are statistical
tools used to determine the magnitude and direction of the relationship or association between two
variables (bivariate). They determine whether the two variables are directly or inversely related or
not. The variables correlated are known as covariates. This implies that the idea of independent
and dependent variables is not considered in this regard. However, two variables are said to be
related if the changes in one variable lead to changes in the other variable. The degree of
relationship between or among the correlated variables is shown by the coefficient of correlation.
In other words, the correlation coefficient is a quantitative expression of the mutual relationship
that exists between two variables. Also, the coefficient of correlation can be used to indicate the
extent to which the values of one variable may be predicted from known values of another variable
(Nzeneri, 2010). Correlation coefficient values range from -1 to +1. A correlation coefficient of
+1 indicates perfect positive (direct) correlation (relationship) meaning that high scores on the one
variable are very much associated with high scores on the other variable, whereas -1 indicates
perfect negative (inverse) correlation (relationship) which means that high scores on the one
variable are very much associated with low scores on the other variable and vice versa. On the
other hand, a coefficient of zero (0) indicates no correlation or association. According to Best and
Kahn (2007), a frequently used method of evaluating the magnitude of a correlation is the crude
criterion, where coefficient (r) ranging from .00 to .20 is negligible, .20 to .40 is low, .40 to .60 is
moderate, .60 to .80 is substantial and from .80 to 1.00 is high or very high.
Pearson Product Moment Correlation (r)
The Pearson correlation is a statistical tool that uses interval or ratio data. The raw score method
for the computation of Pearson’s correlation (r) is computed using the formula below.
2222 . YYNXXN
YXXYNr
Where
X = sum of all X scores of the sample;
2
X = sum of all squared X scores of the sample;
Y = sum of all Y scores of the sample;
2
Y = sum of all squared Y scores of the sample;
YX = sum of the products of paired X and Y scores of the sample;
International Journal of Mathematics and Statistics Studies
Vol.9, No.2, pp.53-68, 2021
Print ISSN: 2053-2229 (Print),
Online ISSN: 2053-2210 (Online)
55
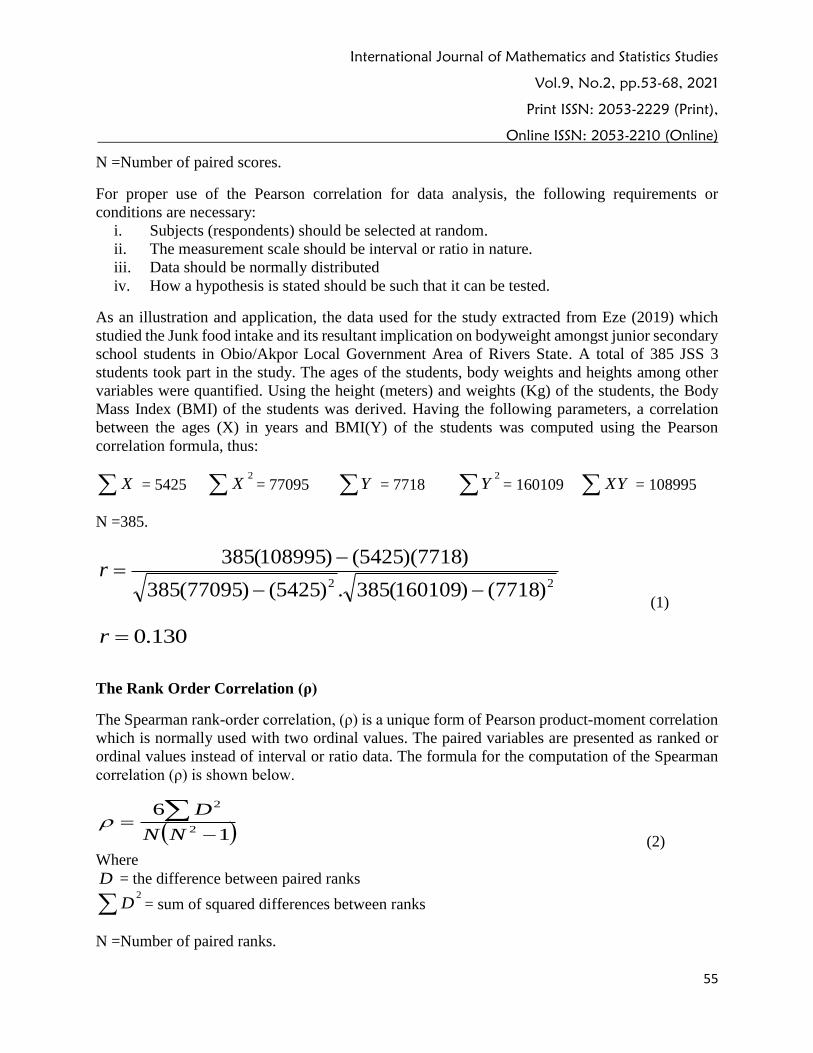
N =Number of paired scores.
For proper use of the Pearson correlation for data analysis, the following requirements or
conditions are necessary:
i. Subjects (respondents) should be selected at random.
ii. The measurement scale should be interval or ratio in nature.
iii. Data should be normally distributed
iv. How a hypothesis is stated should be such that it can be tested.
As an illustration and application, the data used for the study extracted from Eze (2019) which
studied the Junk food intake and its resultant implication on bodyweight amongst junior secondary
school students in Obio/Akpor Local Government Area of Rivers State. A total of 385 JSS 3
students took part in the study. The ages of the students, body weights and heights among other
variables were quantified. Using the height (meters) and weights (Kg) of the students, the Body
Mass Index (BMI) of the students was derived. Having the following parameters, a correlation
between the ages (X) in years and BMI(Y) of the students was computed using the Pearson
correlation formula, thus:
X = 5425 2
X = 77095 Y = 7718 2
Y = 160109 YX = 108995
N =385.
22 )7718()160109(385.)5425()77095(385
)7718)(5425()108995(385
r
(1)
130.0r
The Rank Order Correlation (ρ)
The Spearman rank-order correlation, (ρ) is a unique form of Pearson product-moment correlation
which is normally used with two ordinal values. The paired variables are presented as ranked or
ordinal values instead of interval or ratio data. The formula for the computation of the Spearman
correlation (ρ) is shown below.
1
62
2
NN
D
(2)
Where
D = the difference between paired ranks 2
D = sum of squared differences between ranks
N =Number of paired ranks.

International Journal of Mathematics and Statistics Studies
Vol.9, No.2, pp.53-68, 2021
Print ISSN: 2053-2229 (Print),
Online ISSN: 2053-2210 (Online)
56
For proper use of the Spearman rank-order correlation coefficient for data analysis, these
requirements or conditions are necessary:
i. Subjects (respondents) should be randomly selected.
ii. The sample size should be small.
iii. Data should be discrete
iv. The measurement scale should be ordinal.
v. How a hypothesis is stated should be such that it can be tested.
Best and Kahn (2007) however, warned that the coefficient does not mean a cause-and-effect
relationship between the considered variables. High correlation is not a result of causality and
neither does a zero correlation (or negative) imply the impossibility of causation. The sample size
influences the value of the coefficient of correlation. Furthermore, the correlation coefficient could
be interpreted concerning variance. This is achieved by computing the coefficient of determination
(r2). This is the percentage of explained variance or percentage reduction in error of prediction.
The percentage of unexplained variance (percentage of error of prediction) is given by 1-r2.
Some Characteristics/ Properties of Correlation Coefficient
i. The correlation coefficient value is not easily affected by the unit or dimension of the
measuring scale or by positive and negative signs.
ii. The correlation coefficient ranges from -1 to +1, where -1 signifies a perfect negative
relationship and +1 signifies a perfect positive relationship.
iii. The correlation coefficient does not connote cause-and-effect relationship between the two
considered variables.
iv. The correlation coefficient could be interpreted regarding variance.
Problem specification
A School of Thought (SoT-1) argues that the Pearson or Spearman correlation cannot be used to
answer a research question but to test a hypothesis since it is an inferential statistic. They further
argued that when Statistical Package for Social Sciences (SPSS) is used in the computation of the
correlation coefficient, it becomes unnecessary to do further transformations of the computed
correlation coefficient since the SPSS provides the probability values used for the test of
significance and decision making. Another School of Thought (SoT-2) however is of a contrary
view. They argue that the transformation is needed for the test of significance of the computed
coefficient and that the computed correlation coefficient shows the magnitude and direction of the
existing relationship (if any) and hence could be used to answer a research question probing the
description of the nature of the relationship between two variables correlated. The SoT-2 further
argued that when combined with the z-transformation or the t-transformation, relating to the
sample size (large or small sizes) and degrees of freedom, it could as well be used to test a
hypothesis.
The transformations are aimed at testing the significance of the computed correlation coefficient.
This could be achieved by comparing the computed z or t value with the critical/table values. This
study, therefore, compared the results of three methods utilized in testing the significance of the
correlation coefficient. It shows three approaches to testing a hypothesis using the t-transformation

International Journal of Mathematics and Statistics Studies
Vol.9, No.2, pp.53-68, 2021
Print ISSN: 2053-2229 (Print),
Online ISSN: 2053-2210 (Online)
57
as well as the z-transformation. The study also demonstrates how the SPSS could be utilized to
calculate the correlation coefficient, the probability value, to make a decision or to test a hypothesis
using the generated probability value and recommend the way forward to create an understanding
between these two Schools of Thought regarding the use of correlations, transformations and tests
of hypothesis.
Aim and objectives of the study
The overarching goal of this study is to test the significance of a correlation coefficient.
Specifically, the study compared the following methods of testing the significance of a correlation
coefficient:
1. t distribution
2. z-transformation
3. SPSS
METHODOLOGY
Testing the Significance of Correlation Coefficient
Test of significance could be defined as the statistical test that attempts to determine whether or
not an observed difference indicates that the given characteristics of two or more groups are the
same or different; or whether a relationship exists between two or more variables (Bamgboye,
Lucas, Agbeja, Adewale, Ogunleye & Fawole, 2006). The significance of the correlation
coefficient could be tested by simply comparing the calculated correlation coefficient with the
critical (table) value. The significance can also be tested with the use of t-transformation, z-
transformation and the use of Statistical Package for Social Sciences (SPSS). Obilor and Amadi
(2018) explored the test of the significance of Pearson correlation using the t-distribution, the z-
transformation and the Statistical Package for Social Packages (SPSS). This study, however,
adopted the z-transformation approach as suggested by Devore (2004) with a rule of thumb (a
correlation is weak if 0≤/r/≤.5, strong if .8≤/r/≤1 and moderate otherwise), which facilitated the z-
transformation. The word distribution and transformation are used interchangeably in this study.
This exploration focuses on comparing the results obtained when using the three approaches
mentioned above. We can transform the computed correlation coefficient to t-distribution using
the formula below:
2
1 2
N
r
rt
(3a)
The equation (3a) is simply written as:
21
2
r
Nrt
(3b)
or

International Journal of Mathematics and Statistics Studies
Vol.9, No.2, pp.53-68, 2021
Print ISSN: 2053-2229 (Print),
Online ISSN: 2053-2210 (Online)
58
21
2
Nt
(3c)
Where:
N=sample size
r=computed Pearson correlation coefficient
ρ= computed Spearman correlation coefficient
t=computed t-value required for the test
2
1 2
N
r
= The estimated standard error
Kpolovie (2018) stated that in converting the computed r to t when the sample size is small,
equation (3) could be used. However, the exact size of the small sample was not stated. Kpolovie
further noted that given a zero correlation (r=0) in a given population as hypothesized in a null
hypothesis, with sample correlations of numeration samples of same size randomly drawn from
the population, there will be a normal distribution with a mean of 0 and a standard deviation of
N
1 for a large sample size. This implies that the t-distribution for a large sample may be given
by the formula:
N
rt
(4)
Nwankwo (2016) supported equation (3) and demonstrated its application in the transformation
hypothesis testing and also stressed that to apply it, the sample size should be less than or equal to
49 and further suggested a formula for the z-test for sample sizes of 50 and above (equation 5) for
the Pearson r. It was also suggested that when N≤ 30 the rho (ρ) table should be used for the test
of significance but N>30 the equation (5c) should be used. The process of utilization of equation
(5) could be utilized in the transformation and hypothesis testing is vital. It is unclear if the sample
size (N) has any influence on the calculated t or z given a derived r.
1
1
N
r
z (5a)
1
N
rz
(5b)

International Journal of Mathematics and Statistics Studies
Vol.9, No.2, pp.53-68, 2021
Print ISSN: 2053-2229 (Print),
Online ISSN: 2053-2210 (Online)
59
1
1
Nz
(5c)
1
Nz
(5d)
A study by Ekwebelem and Oladayo (2012) transformed the computed r to z for test of hypotheses
regarding the significance of r. The study investigated whether teacher quality is related to their
job performance in public primary schools in Rivers State. In application, however, the
transformation yielded higher values of z greater than 1.960 in four variables out of the five
variables investigated about teacher job performance. The researchers rejected the null hypothesis
in each of the four cases. A closer look at the equation (5) shows that with the large sample sizes,
such as N=698, it is unlikely for any computed r to yield a derived z greater than 1.960, to
necessitate the rejection of the null hypothesis at .05 level of significance as suggested by
Nwankwo (2016) when equation (5) is used. This implies that the null hypothesis (H0: ρ=0) could
also be rejected at .05 when z ≤ ±1.960 with equation (5).
In all, Kpolovie (2018) strongly advised that since there are critical values for correlation
coefficients, it is straightforward to directly determine the significance of the correlation
coefficient by comparing the calculated correlation coefficient with the critical values at the chosen
level of significance and degrees of freedom. This approach is easier, better and less time-
consuming. It, therefore, becomes unnecessary to convert the calculated correlation coefficient to
t-distribution for the test of significance of the coefficient. Nevertheless, Obilor and Amadi (2018)
used two separate formulas for computing the t-distribution and the z-transformation in an attempt
to test the significance of the computed correlation coefficient. The derived r was compared with
the SPPS results. The present study however used a slightly different formula for the z-
transformation which is anchored on a transformation of R known as the Fisher transformation.
The transformation is applied with a large sample size (n) for valid approximation (Devore, 2004)
There is a difference between the t-statistic and z-statistic for the test of difference in the mean of
the measured response variable based on a dichotomous factor, when the sample size is small and
when the sample size is large. It is, however, outside the scope of this study. An exploration geared
toward clarifying how the t-distribution and the z-transformation of computed coefficients of
relationship are utilized to test the significance of the computed correlation coefficients is
worthwhile and timely. Coolidge (2006) stated that the t-transformation formula (3a) is used only
to test whether r=0 and that it cannot be used to test whether it is likely to be equal to any other
number different from zero. The t-distribution is most commonly used to test for the significance
of the difference between two group means, but it could also be used to test for the significance of
the correlation coefficient. Coolidge further made it clear that the t-distribution approximates z-
distribution as the data tends to infinity and they are similar in a data set involving several hundred
numbers. This implies that the formula (3a) could be used for both large and small sample sizes.
Therefore, at large sample sizes, it becomes a matter of interest to use the letter t or z. Thus,

International Journal of Mathematics and Statistics Studies
Vol.9, No.2, pp.53-68, 2021
Print ISSN: 2053-2229 (Print),
Online ISSN: 2053-2210 (Online)
60
2
1 2
N
r
rzt
(6a)
The above formula could simply be rewritten in the from below:
21
2
r
Nrzt
(6b)
The computed r is obtained from a sample. Then ρ is the population correlation coefficient. It is
assumed that r roughly approximates ρ. The null and the alternative hypotheses are given below:
H0: ρ=0
Ha: ρ≠0
Test Procedure
t-distribution For the application of t-distribution in testing the significance of correlation coefficient, the two-
tailed test which is a non-directional hypothesis is considered as it is done in most studies. Given
the conventional level of significance, p=.05 and degree of freedom (df=N-2), the final step is to
determine whether the computed t is greater than the critical values (table values) obtained from
the t-distribution. Using the example as demonstrated under the Pearson Product Moment
Correlation above where n=385 and r=0.310, and substituting the values in equation 3a, we have:
2385
130.01
130.0
2
t
383
9831.0
130.0
0026.0
130.0t
0510.0
130.0t
560.2t

International Journal of Mathematics and Statistics Studies
Vol.9, No.2, pp.53-68, 2021
Print ISSN: 2053-2229 (Print),
Online ISSN: 2053-2210 (Online)
61
Given, H0: ρ=0:
There is no significant relationship between age and Body Mass Index (BMI)
For a two-tailed test of significance at p=.05, with a degree of freedom, df=385-2=383, the critical
values are +1.960 and -1.960. If the computed t is greater than t=+1.960 or less than -1.960, then
the null hypothesis will be rejected. In this example, the computed t=2.560 which is greater than
critical t=+1.960; therefore the null hypothesis is rejected at .05 level of significance. We,,
therefor,e, conclude that r=0.310 indicates a significant relationship. This finding could also be
reported thus: that there was a strong positive relationship found between age and Body Mass
Index (BMI). The correlation was statistically significant since the derived t=2.560 >critical
t=1.960.
z-transformation
Fisher’s z-transformation is given by the formula below. The equation (7) was utilized to
demonstrate the transformation of son’s r for the test of significance of r.
r
rz e
1
1log
2
1 (7)
where:
Loge = Natural logarithm
/r/ = modulus of the computed r
Fisher developed this z-transformation method to normalize the distribution of the correlation
coefficients and to allow average correlations and standard deviations to be calculated more
accurately (Gorsuch & Lehmann, 2010).
Substituting the value, r=.130 into the formula above, we have:
130.01
130.01log
2
1ez
870.0
130.1log
2
1e
29885.1log2
1e
)26148.0(2
1
International Journal of Mathematics and Statistics Studies
Vol.9, No.2, pp.53-68, 2021
Print ISSN: 2053-2229 (Print),
Online ISSN: 2053-2210 (Online)
62
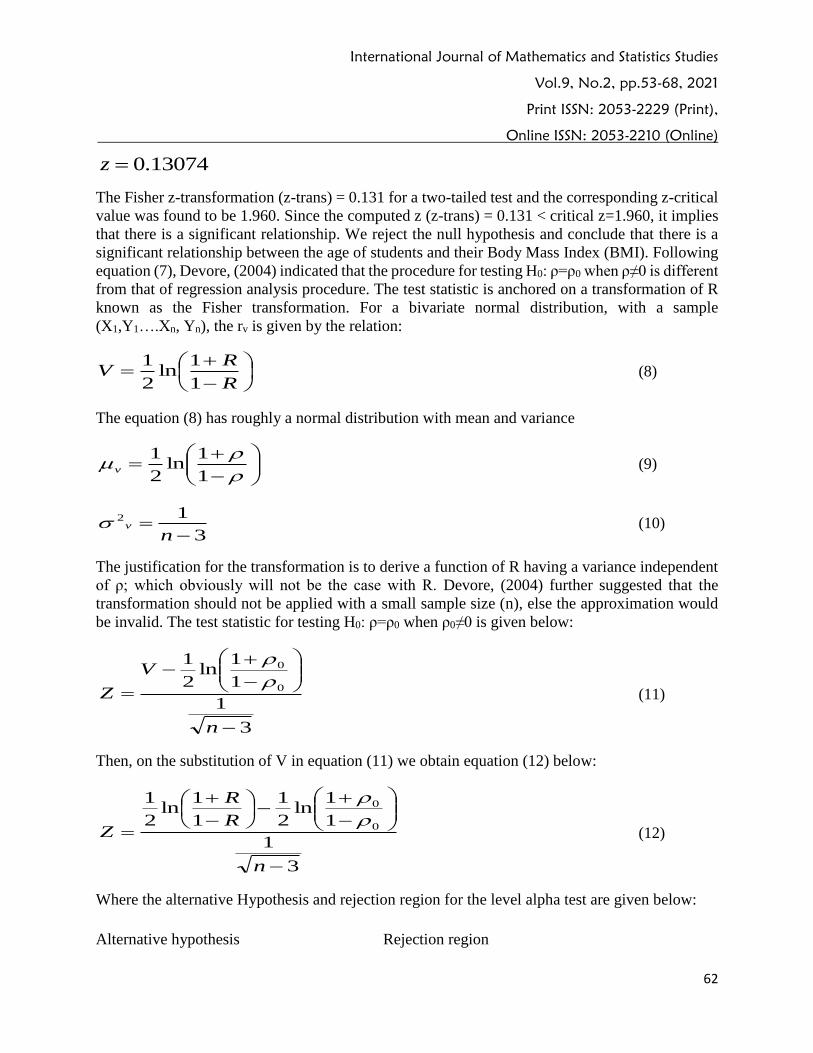
13074.0z
The Fisher z-transformation (z-trans) = 0.131 for a two-tailed test and the corresponding z-critical
value was found to be 1.960. Since the computed z (z-trans) = 0.131 < critical z=1.960, it implies
that there is a significant relationship. We reject the null hypothesis and conclude that there is a
significant relationship between the age of students and their Body Mass Index (BMI). Following
equation (7), Devore, (2004) indicated that the procedure for testing H0: ρ=ρ0 when ρ≠0 is different
from that of regression analysis procedure. The test statistic is anchored on a transformation of R
known as the Fisher transformation. For a bivariate normal distribution, with a sample
(X1,Y1….Xn, Yn), the rv is given by the relation:
R
RV
1
1ln
2
1 (8)
The equation (8) has roughly a normal distribution with mean and variance
1
1ln
2
1v (9)
3
12
nv (10)
The justification for the transformation is to derive a function of R having a variance independent
of ρ; which obviously will not be the case with R. Devore, (2004) further suggested that the
transformation should not be applied with a small sample size (n), else the approximation would
be invalid. The test statistic for testing H0: ρ=ρ0 when ρ0≠0 is given below:
3
1
1
1ln
2
1
0
0
n
V
Z
(11)
Then, on the substitution of V in equation (11) we obtain equation (12) below:
3
1
1
1ln
2
1
1
1ln
2
1
0
0
n
R
R
Z
(12)
Where the alternative Hypothesis and rejection region for the level alpha test are given below:
Alternative hypothesis Rejection region

International Journal of Mathematics and Statistics Studies
Vol.9, No.2, pp.53-68, 2021
Print ISSN: 2053-2229 (Print),
Online ISSN: 2053-2210 (Online)
63
Ha: ρ>ρ0 z ≥zα
Ha: ρ<ρ0 z ≤-zα
Ha: ρ≠ρ0 either z ≥zα/2 or z ≤-zα/2
To establish whether a correlation is strong or weak, Devore, (2004) opined that a reasonable rule
of thumb is to say that a correlation is weak if 0≤/r/≤.5, strong if .8≤/r/≤1 and moderate otherwise.
It is worthy of note that when we regress x on y and if r=.5, then r2=.25, which implies that the x
contributes 25% of the observed changes in y which could be explained by the data whereas 75%
of the observed variance are unexplained. Therefore, a moderate positive correlation could be said
to be in the range: .5<ρ<.8, therefore, having r=.130 and n=385 we could derive z using equation
(12) above and hence test the significance of the correlation coefficient. The test is H0: ρ=.5 versus
H0: ρ>.5. The computed r=.130, therefore substituting in equation 12, we have:
3385
1
50.1
50.1ln
2
1
130.1
130.1ln
2
1
Z
382
1
50.0
50.1ln
2
1
87.0
130.1ln
2
1
382
1
549.0131.0
)54.19(418.0
17.8Z
For a test of significance at p=.05 with df=383, the critical values of t are z=+1.645 and z=-1.645.
If the computed t is greater than z=+1.645 or less than z=-1.645, then the null hypothesis will be
rejected. In the above example, the computed z =-8.17 is less than z=-1.645 at .05. This is also true
at .025 (-8.17<-1.960 at .025), we conclude that ρ<.5. The relationship has shown to be moderately
strong. It may appear to be an astonishing conclusion because r=.130, however, when the sample
size is large a small r could be derived.
The SPSS Approach

International Journal of Mathematics and Statistics Studies
Vol.9, No.2, pp.53-68, 2021
Print ISSN: 2053-2229 (Print),
Online ISSN: 2053-2210 (Online)
64
To obtain the bivariate correlations using the SPSS approach, these operations are done on the
SPSS menus:
Choose/ Click Analyze
Correlate
Bivariate...
Select two or more numeric variables ( in this case the age and BMI)
The following options are also available:
Correlation Coefficients. For quantitative, normally distributed variables, choose the
Pearson correlation coefficient or choose Kendall’s tau-b or spearman for rank orders.
Test of Significance. You can select two-tailed or one-tailed probabilities. If the direction
of association is known in advance, select one-tailed. Otherwise, select two-tailed.
Flag significant correlations. Correlation coefficients significant at the 0.05 level are
identified with a single asterisk, and those significant at the 0.01 level are identified with
two asterisks (SPSS, various versions).
Table 1: SPSS results for Pearson’s correlation
Age BMI
Age Pearson Correlation 1 .130*
Sig. (2-tailed) .010
N 385 385
BMI Pearson Correlation .130* 1
Sig. (2-tailed) .010
N 385 385
*. Correlation is significant at the 0.05 level (2-tailed).
The result showed that the relationship between age and BMI was positive moderately low, but
significant at .05 level of significance (r=.130, p=.010).
RESULTS
Table 1: Comparison of the test results and decisions based on the three methods
Test method

International Journal of Mathematics and Statistics Studies
Vol.9, No.2, pp.53-68, 2021
Print ISSN: 2053-2229 (Print),
Online ISSN: 2053-2210 (Online)
65
Formula
t-distribution z-transformation SPSS
2
1 2
N
r
rzt
3
1
1
1ln
2
1
0
0
n
V
Z
CORRELATIONS
/VARIABLES=Age BMI
/PRINT=TWOTAIL NOSIG
/MISSING=PAIRWISE.
(On SPSS menus: Click
Analyze, Correlate,
Bivariate..., Select the
numeric variables)
Computed r or ρ r=0.130 r=0.130 r=0.130
Computed t and z t=2.560 Z= 17.8 -
Sample size N=385 N=385 N=385
Degree of
freedom df=383 df=383 -
Critical t=±1.960 z=±1.960 -
p-value - - .010
Hypothesis t=2.560 > t=1.960)
Reject H0: ρ=0
z= -8.17 < z=-1.960
Reject H0:ρ=ρ0, ρ0≠0
p=.010< p=.05
Reject H0: p<.05
Decision The correlation was
statistically significant,
r(383)=.130, p<.05.
The correlation was statistically
significant (Z=-8.17).
The correlation was
statistically significant
(r=.130, p=.010).
Source: Researchers’ Data Computation, 2020.
Table 1 shows the result of the comparison of the three methods, the t-distribution, z-
transformation and SPSS used in the test of the significance of the correlation coefficient as
demonstrated under the test procedure above. It shows the result of the correlation between age of
students and their BMI. The computed Pearson correlation coefficient was 0.130 and the sample
size (N) was 385. This implies that the degree of freedom (df=N-2=385-2=383). The result further
shows that in the use of the t-transformation (equation 3a), the computed t= 2.560 whereas the z-
transformation (equations 11 & 12) yielded z=-8.17. Since the sample size is large (above 120),
the critical value of z=±1.960. The SPSS method yielded a correlation coefficient of 0.130 and a
probability (p) value of .010.
DISCUSSION
The result from Table 1 showed that the three methods explored yielded similar results. The null
hypothesis H0: ρ=0 was rejected, suggesting that the correlation was statistically significant, while
using the t-distribution (t=2.560 > t=1.960), the z-transformation (z=-8.17< z=-1.960) and the
SPSS (p=.010< p=.05). This indicated that there is a significant relationship between the age of
the students and their BMI. A close peer at the procedures adopted while testing for the
significance of the correlation coefficients using the three methods discloses that the SPSS
approach is the easiest. This was followed by the t-transformation (equation 3a). The z-
transformation approach (equation 11) is tricky. The users of the method must know that the

International Journal of Mathematics and Statistics Studies
Vol.9, No.2, pp.53-68, 2021
Print ISSN: 2053-2229 (Print),
Online ISSN: 2053-2210 (Online)
66
natural logarithm (ln or loge) of a number is different from the logarithm to base 10 of the same
number. Secondly, users of the z-statistic should be conversant with Fisher’s assumptions guiding
the test of hypothesis, which when satisfied the t-transformation is preferable: Ha: (i) ro≠rh (ii)
r1≠r2 (iii) r≠0 where ro=observed correlation coefficient and rh= hypothetical correlation
coefficient; r1 and r2 are two sampled values of the correlation coefficient. This implies that the
alternative hypothesis is tested.
The z-test or transformation formulae suggested by Nwankwo (2016) and Kpolovie (2018) as
shown in equation (4) and equation (5) respectively are said to be useful when the sample size
considered is large. However, it was unclear how these formulae could be used to test for the
significance of the correlation coefficient and the gap was plugged by this study. Coolidge (2006)
observed that at large samples or data set involving several hundreds; the t-distribution
approximates z-distribution as the data tends to infinity. This finding is in agreement with Obilor
and Amadi (2018) who explored the test of the significance of Pearson’s correlation using the t-
distribution, z-transformation and SPSS. The study also reported SPSS as the most useful method
to test the significance of the correlation coefficient but a small data set (sample size below 20)
was used to demonstrate the applicability of the methods. Following the advice of Devore, (2004)
that the z-transformation (equation 11) should not be applied with a small sample size (n), else the
approximation would be invalid; the present study demonstrated the applicability of equation (11)
with a sample of 385 participants.
A review of the literature shows that the Pearson Product Moment Correlation could be used to
answer a research question trying to determine the magnitude and direction of the relationship
between two variables measured separately. If a hypothesis is derived by directly transforming the
research question, the p-value could aid in testing the hypothesis when SPSS is used. The rationale
for taking his position is that after deriving the coefficient of correlation (r) using equation (1), the
size of the relation and the direction (direct or inverse) could be established. The computed r=0.130
was moderately low but a positive relationship was found between the two variables. We can go
further to compute the coefficient of determination (r2). This is the percentage of explained
variance or percentage reduction in error of prediction. This value shows the percentage
contribution of one variable to the other. This percentage of unexplained variance (percentage of
error of prediction) is given by 1-r2. In the present example, the percentage reduction in error of
prediction, r2=.017. This shows that age contributed about 1.7% to the observed variance in the
BMI. The percentage of error of prediction, 1-r2=0.983, indicating that about 98.3% of the changes
in BMI is unexplained by the current data. In trying to test the hypothesis regarding the relationship
between age and BMI, p=0.010 which is less .05 shows that the relationship between age and BMI
was statistically significant at .05 level of significance.
CONCLUSION
The study demonstrated and compared the use of the t-distribution, the z-transformation and the
SPSS methods to test for the significance of a correlation coefficient. The t-distribution, (equation
3a) is the most commonly used test of significance. The reason is that the t-distribution
approximates the z-transformation as the data (sample size) tends to infinity. The equation (3a)

International Journal of Mathematics and Statistics Studies
Vol.9, No.2, pp.53-68, 2021
Print ISSN: 2053-2229 (Print),
Online ISSN: 2053-2210 (Online)
67
could be used for both large and small sample sizes. This implies that when the sample size is large
it becomes optional to use the letter t or z with the same formula. It, therefore, appears to be
unnecessary to adopt any of the z-transformation formulae discussed when the equation (3a) could
be easily used instead to achieve the same goal. In addition, the computational process and the
decision rule involved in the test of hypothesis using the z-transformation are somewhat more
complicated than the other two methods considered (t-distribution & SPSS). . The use of SPSS
appears to be the simplest approach for the test of significance of the correlation coefficient due to
ease of use, robustness, time optimization and ability to indicate (*) a significant correlation based
on the computed coefficient and probability value which form part of the output. This permits a
decision to be made regarding the magnitude, direction and significance of the relationship
between the two variables correlated from the same output. Also, the use of SPSS minimizes the
risk of computational errors and wrong decisions.
Recommendations
Based on the findings of the study, the following recommendations were made:
1. The SPSS approach should be adopted by researchers in data analysis for testing the
significance of a correlation coefficient because it is easier, saves time and energy, and is
robust.
2. Users of the SPSS in computing correlation should not go further to convert the derived
correlation coefficient using either t-distribution or z-transformation methods to test a
hypothesis to minimize the risk of computational errors, wrong decisions and to optimize
time and avoid unnecessary repetition.
3. In the absence of SPSS, the t-distribution method (equation 3a) should be used to test for
the significance of the computed correlation coefficient irrespective of the sample size of
the study because the t-distribution approximates the z-transformation as the data tends to
infinity
References
Adeleke, J. O. (2010). The basics of research and evaluation tools. Lagos: Samerest Ventures.
Bamgboye, E. A., Lucas, E. O., Agbeja, B. O., Adewale, G., Ogunleye, B. O. & Fawole, I. (2006).
Statistical analysis and inferences. In A. I. AOlayinka, V. O. Taiwo, A. Raji-Oyelade & I.
P. Farai (Eds.) (2006). Methodology of basic and applied research (2nd edition). Ibadan:
Postgraduate School, University of Ibadan.
Best, J. W. & Kahn, J. V. (2007). Research in education (9th edition). India: Prentice-Hall.
Coolidge, F. L. (2006). Statistics: A gentle introduction (second edition). Thousand Oaks
California. Sage Publications.
Devore, J. L. (2004). Probability and Statistics for Engineering and the Sciences. Sixth Edition.
Brooks/Core-Thomson Learning. Belmont, CA.

International Journal of Mathematics and Statistics Studies
Vol.9, No.2, pp.53-68, 2021
Print ISSN: 2053-2229 (Print),
Online ISSN: 2053-2210 (Online)
68
Ekwebelem, I. B. M. & Oladayo, O. T. (2012). Quality teaching staff and job performance in
primary schools in Rivers State: EDITED by Osaat, D. S. Chapter 13: Contemporary
Issues in Nigerian Education. 267-287
Eze, P (2019). Junk food intake and its resultant implication on bodyweight amongst junior
secondary school students in Obio/Akpor Local Government Area of Rivers State. An
Unpublished M. Sc Dissertation, Ignatius Ajuru University of Education, Port Harcourt.
Fisher, R. A. (1915). Frequency distribution of the values of the correlation coefficient in samples
from indefinitely large population. Biometrika, 10(4), 507 – 521.
Gorsuch, R. L. & Lehmann, C. S. (2010). Correlation coefficients: Mean bias and confidence
interval distortions. Journal of Methods and Measurement in the Social Sciences, 1(2), 52-
65.
Kpolovie, P. J. (2018). Statistical approaches in excellent research methods. South Africa:
Patridge Publishing. www.patridgepublishing.com/africa
Nwankwo, O. C. (2016). A practical guide to research writing for students of research enterprise
(6th edition). Port Harcourt: University of Port Harcourt Press.
Nzeneri, I. S. (2010). An introduction to research methods and statistics (revised edition). Uyo:
Abigab Associates Ltd.
Obilor, E.I & Amadi E.C (2018). Test for significance of Pearson’s correlation coefficient (r).
International Journal of Innovative Mathematics, Statistics & Energy Policies, 6(1), 11-
23.
Peck, R. & Olsen, C. (2014). Statistics: Learning from data. Stamford: Centage Learning.