Embed Size (px)
Citation preview
Testimony of Joan Claybrook, President, Public Citizen, Former Administrator, National Highway Traffic Safety Administration
before the Senate Committee on Commerce, Science and Transportation
February 26, 2003
Profit-Driven Myths and Severe Public Damage: The Terrible Truth About SUVs
Thank you, Mr. Chairman and members of the Senate Committee on Commerce, Science and Transportation, for the opportunity to testify before you today on the safety of sport utility vehicles, or SUVs. My name is Joan Claybrook and I am the President of Public Citizen, a national non-profit public interest organization with over 125,000 members nationwide. We represent consumer interests through lobbying, litigation, regulatory oversight, research and public education. Public Citizen has a long and successful history of working to improve consumer health and safety.
In recent months, there has been welcome and renewed public attention to the social, environmental and safety problems afflicting SUVs. While every consumer knows about the way these gas-guzzlers block visibility on the road, blind drivers with higher headlamps, and cause congestion in cities, few may be aware that SUVs are in fact no safer than large or mid-size cars and impose additional safety liabilities in many types of crashes. Since Dr. Jeffrey Runge, Administrator of the National Highway Traffic Safety Administration (NHTSA), openly assessed SUV hazards for their drivers and other motorists during a recent speech in Detroit, a long-needed public debate has begun. We must ask whether SUVs deliver what they promise in terms of consumer need and safety, and take a hard look at the profoundly anti-social and violent aspects of these pollution-belching highway battering rams.
As I will discuss, the criticism of SUVs is richly deserved. SUVs are basically gussied-up pickup trucks, and most have never been comprehensively re-designed to be safely used as passenger vehicles. In a crash, the high bumper, stiff frame and steel-panel construction of SUVs override crash protections of other vehicles. Due to their cut-rate safety design, SUVs often fail to adequately absorb crash energy or to crumple as they should, so they ram into other motorists and shock their own occupants’ bodies. Endangering their occupants, SUVs may also slide over roadside guardrails, which were designed for cars. And their high profile and narrow track width create a tippy vehicle, which, when combined with their weak roofs and poor crash protection, places SUV drivers at risk of death or paralysis in a devastating rollover crash. All of these factors

2
mean that overall, SUVs are less safe on average for their occupants than large or mid-size cars, and yet inflict far greater costs in both lives and money on other motorists.
The SUV is a bad bargain for society and a nightmare for American roads. The
switch from mid-size and large passenger cars to SUVs has endangered millions of Americans, without any recognizable benefits. One former NHTSA Administrator estimated in 1997 that the aggressive design of light trucks (a category including SUVs, pickup trucks, vans and minivans) has killed 2,000 additional people needlessly each year.1 Yet automakers continue to exploit special interest exemptions and safety loopholes, while creating consumer demand and shaping consumer choice with a multibillion-dollar marketing campaign, because SUVs bring in maximum dollars for minimal effort.
After years of losing out in the passenger car market to foreign manufacturers, the
domestics’ decision to produce and market vehicles in the far less regulated, tariff-protected2 SUV category was like hitting the lottery for Detroit. In the SUV, the industry found and developed a broad market that allowed it to rake in cash, while taking every step to avoid spending money to fix the unstable and threatening vehicle that resulted.
Manufacturers have known for decades about the tendency of SUVs to roll over,
and about the damage incurred when the vehicles’ weak roof crushes in on the heads and spines of motorists. Manufacturers have settled the many lawsuits brought by motorists who were horribly injured by these vehicles and facing a lifetime of pain, often imposing gag orders to hide the documents that show this knowledge. They’ve also unblinkingly faced the carnage inflicted on other motorists from high SUV bumpers and menacing front grilles, building ever-more heavy and terrible SUVs over time and continuing to market them militaristically, such as the ads calling the Lincoln Navigator an “urban assault vehicle.” For this designed-in harm, they are rarely held responsible. Throughout, they’ve kept churning out millions of SUVs, essentially unfixed.
This hearing is necessary because, although manufactures have known for years
about these hazards, instead of acting voluntarily, they have bobbed, weaved, delayed and denied. SUVs are in fact the dangerous offspring of a heady mix of profit-driven special interest politics and corporate deception. Most safety standards and emissions rules are more than thirty years old, and relentless industry lobbying has killed off interim attempts to update them or pass badly needed new ones on rollover or vehicle compatibility. Yet when the safety, fuel economy and emissions laws were originally passed in the 1960s and 1970s, it was unimagined that SUVs and other light trucks would become, as today, nearly half of all new vehicles sold. The result is that Detroit has retained, and jealously guarded, a massive incentive to create demand for, and to sell, these highly profitable machines.
Despite their high price tag, SUVs are cheap to produce because of an
accumulation of regulatory exceptions and the near-total lack of up-to-date, much-needed standards for rollover and vehicle compatibility. The result is that consumers are unnecessarily threatened, injured and killed. The combination of safety design shortcuts

3
that imperil their own occupants, aggressive and heavy designs that devastate the occupants of other vehicles, and special, higher levels of fuel usage and pollutants means that the SUV is a lose-lose for society. Better regulation is sorely needed to transform this socially and environmentally hostile vehicle into one worth selling or owning.
I. SUVs Are No Safer for Their Drivers Than Mid-size and Large Cars, and Are Extremely Dangerous for Others on the Road Although many Americans purchase SUVs because they believe that they will safely transport their families, the truth is that SUVs are among the most dangerous vehicles on the road. They are no more safe for their drivers than many passenger cars, and are much more dangerous for other drivers who share the highway, making them a net social loss for society. Yet this cycle is perpetuated by industry-spread myths that heavier vehicles are safer per se, so consumers believe that they must continue to “super-size” their own vehicle in order to remain safe. The self-reinforcing nature of this growing highway arms race makes the notion that SUVs are safe for their occupants one of the more harmful myths of our time.
Yet the influx of these new urban assault vehicles is threatening overall road safety in new and more frightening ways. While the rate of passenger cars involved in fatal crashes per 100,000 registered passenger cars declined by 15.1 percent between 1995 and 2001, the rate of light truck involvement only declined only by 6.8 percent during the same time. Thus, while light truck involvement rates in fatal crashes have always been greater than those of passenger cars, this difference is growing ever larger.3
The growing death toll from SUVs is so significant that a recent federal study
found that fatalities in rollover crashes in light trucks, a category which includes SUVs, threatens to overwhelm all other reductions in fatalities on the highway, an astonishing fact when we consider that air bags are now a requirement for new vehicles and seat belt use keeps going up. NHTSA explained that “the increase in light truck occupant fatalities accounts for the continued high level of overall occupant fatalities, having offset the decline in traffic deaths of passenger car occupants.”4 In addition to the height of the vehicles’ profiles and headlamps, which block sightlines on the highway, light truck design is so incompatible with passenger vehicles that they are estimated to kill approximately 2,000 unnecessary vehicle occupants each year, as noted by a previous NHTSA Administrator.5 A more specific analysis found that 1,434 passenger car drivers who were killed in collisions with light trucks would have lived if they had been hit instead by a passenger car of the same weight as the light truck, even under the same crash conditions.6 The deadly design of light trucks has thus been responsible for thousands of unnecessary deaths on American highways.
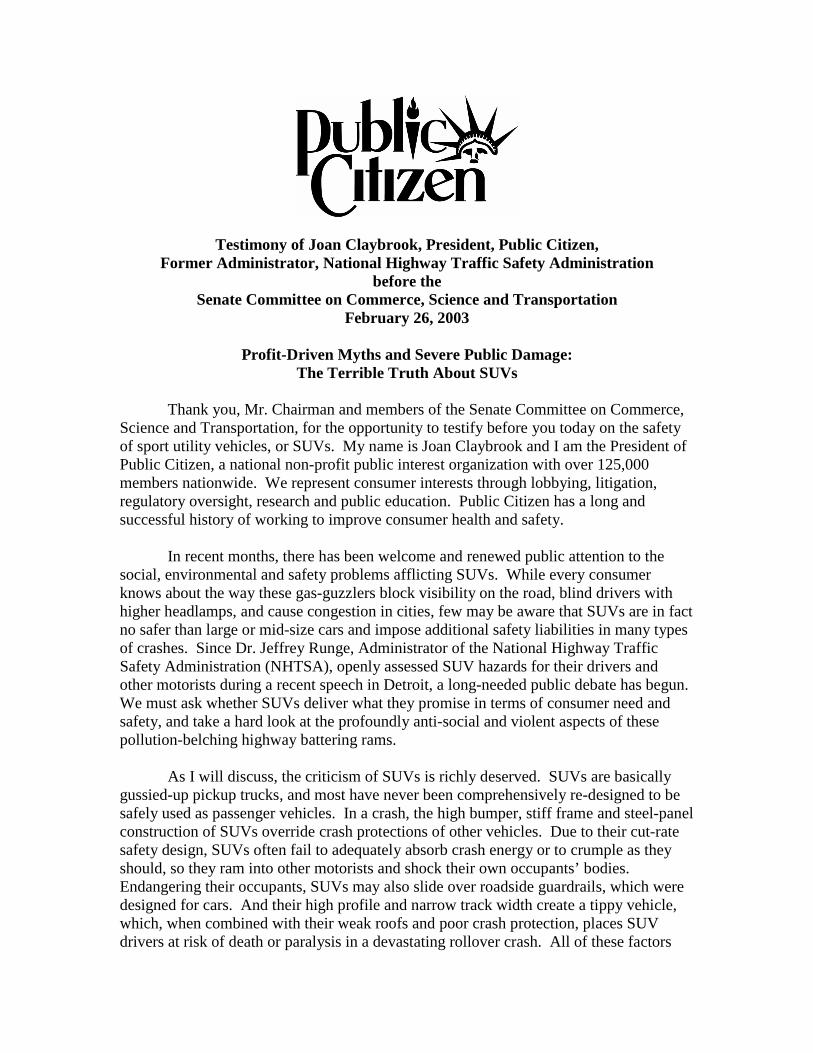
Overall, SUVs are no safer for their occupants than are many passenger cars. NHTSA’s fatality statistics show that, in 2001, there were 162 deaths per million SUVs and 157 deaths per million cars, indicating that the death rate for SUVs is slightly higher.7 In fact, researchers Marc Ross, of the University of Michigan, and Tom Wenzel, of Lawrence Berkley National Laboratory, have examined detailed crash data and
4
concluded that risks to drivers of SUVs are slightly higher than risks to drivers of mid-size and large cars, but slightly lower than risks to drivers of compact and subcompact cars. When the risk to drivers is combined with the risk to drivers of other vehicles, the average SUV has about the same combined risk as the average compact car (and higher combined risk than average mid-size and large cars, while lower combined risk than the average subcompact). This is further explained in the chart below. However, Ross and Wenzel found that the risk to drivers of the safest compact and subcompact models are lower than that of the average SUV, and are about the same as that of the safest SUV model.
Ross and Wenzel Fatality Risk by Vehicle Type - 1997-2001 model years
using NHTSA driver death rates per million vehicles sold Combined risk Risk to driver Risk to other drivers
Sports Car 225 175 50Pickup Truck 211 108 103Subcompact Car 141 109 33SUV 132 79 53Compact Car 128 90 38Large Car 112 74 38Mid-Size Car 97 66 32Minivan 80 40 40Luxury Import 60 40 20
Combined risk is the sum of the death rate for a vehicle’s drives and the drivers of other vehicles with which it collides, showing a vehicle’s net social harm in crash fatalities.
Variations within weight categories are significant. For example, drivers of Honda Accord (3049 lbs.8) passenger cars and the hulking Ford Expedition SUV (5686 lbs.) have similar risks to their drivers. And drivers of the gargantuan Chevrolet Surburban (5567 lbs.), the safest SUV identified, have the same fatality rates as drivers of much smaller Volkswagen Jettas (3091 lbs.). But in each of these two cases, the SUV model imposes over twice the risk on drivers of other vehicles than the car model.
Ross and Wenzel have also specifically challenged the idea that weight explains
the safety levels of particular vehicles. Using the resale value of vehicles as a proxy for the “quality” of their design, their research shows that, while there is a wide range of safety outcomes in each weight category, the risk to the driver of a vehicle is more closely correlated with the quality of that vehicle than with its weight.9 Because heavy vehicles are much more dangerous for others on the highway, it is critical to figure out whether this added weight actually buys better safety for the occupants of these vehicles. Ross and Wenzel’s work shows that some of the heaviest vehicles offer only very mediocre protection for their occupants, yet threatens other drivers, inflicting a net loss on society.
For just one egregious example from a different study, for every Ford Explorer
driver saved in a two-vehicle crash because that driver chose an Explorer over a large car, five drivers are killed in vehicles hit by Explorers.10 We must take up the challenge

5
presented by Ross and Wenzel and begin to address the net social consequences of bad choices – choices made out of a narrowly perceived, woefully uninformed, and factually incorrect, self-interest.
For this reason alone, a recent release of data by the Insurance Institute for
Highway Safety (IIHS) is beside the point.11 IIHS claims that its numbers show that overall occupant fatality rates for SUVs are, for the first time, lower than the overall rates for cars.
My main objections to the work by IIHS are below:
1) The IIHS has been quoted in several news articles as emphasizing that the new study, for the “first time,” shows that SUVs are safer than cars. There are several serious problems with this claim:
a. Other statistics disagree: NHTSA’s overall occupant fatality data for all crashes for 1999 (the most recent year NHTSA published statistics using SUVs as a vehicle class) showed that the occupant fatality rate per 100,000 registered vehicles was 17.78 for SUVs and a slightly lower 16.44 for passenger cars.12 NHTSA’s statistics include all vehicles on the road.
b. The overall IIHS driver death rates for SUVs (73) show they are more risky than both large (63) and very large (69) cars, as classified by IIHS. The only real disagreement between the Ross and Wenzel data and IIHS concerns whether mid-size cars are also more safe than SUVs, which may be a matter of how the researchers have sorted particular vehicles by size. In addition, IIHS rollover death rates for SUVs (2-wheel drive = 44/four- wheel drive = 31) show that these are still far above the overall rollover rates in single-vehicle rollover crashes for cars (all cars = 18).
c. SUVs may be killing more people in cars: IIHS fails to consider the effect of SUV aggressivity as their numbers grow in proportion to the overall vehicle fleet, which could mean that the marginal relative safety gains in SUVs are at the expense of the occupants in passenger cars. The fatality rate in cars has declined steadily over time, and has been cut in half since 1980. IIHS must estimate how much further the car fatality rate would have declined if thousands of car drivers had not switched to more dangerous SUVs. One expert estimates that the net increase in deaths from the aggressive design of SUVs was 445 in 1996 alone, over what the death count would have been had those drivers been in cars of the same weight class.13 IIHS must show that their numbers are significant outside of this “replacement effect” caused by the deadly design of SUVs.
d. Very small sample size: The IIHS does not present any indication of the statistical significance of its findings, as it did in earlier make/model analyses. Yet the IIHS sample size, which sorts one year of fatality data for three model years of vehicle registrations into even smaller bins of data regarding vehicle type (inexplicably divided by both wheelbase and length for cars, and weight for trucks), is likely to also be small, making a spread of 115 to 125 between SUVs and cars in the IIHS 2001 occupant fatalities
6
chart statistically insignificant. In contrast, the analysis by Ross and Wenzel uses fatality data and vehicle sales from five years, which allows analysis of particular vehicle models.14 The more detailed analysis by Ross and Wenzel indicates that SUVs are less safe than mid-size and large cars and safer than compact and subcompact cars for their drivers.
e. The data categories may be misleading: IIHS has included all car types, including high risk sports and mini cars and low risk minivans, in their car category, and has dropped the worst performers, 2-wheel-drive SUVs, out of the SUV category below 3,000 and above 5,000 lbs. IIHS must demonstrate that this line-drawing does not distort its results. Also, SUVs should only be compared with vehicles with comparable attributes appealing to SUV buyers, such as minivans, and compact, mid-size, and large cars. Moreover, the new cars used in the IIHS sample may be under-involved in crashes, as drivers of new cars tend to be more affluent and more careful on the road.
2) The study’s focus on weight fails to explain the problem and leads to the
wrong result: In fact, there are tremendous variations in the safety of vehicles for their drivers and for others on the road within the same weight or size categories.15 Other research shows weight to be inconclusive at best, as it confounds such potentially more explanatory factors as safety design, quality and size. A better method would be to update the 2000 IIHS make/model analysis, so that consumers may be informed about the particular vehicle models they drive.
The IIHS study’s focus on occupant protection, without considering off-setting
aggressivity effects, perpetuates the myopic focus on occupant safety, rather than factoring in the costs and risks for others on the road. The IIHS results would wrongly lead individual consumers to purchase heavier vehicles as a matter of self-protection. Yet Ross and Wenzel have shown that drawing conclusions about safety across weight classes without looking at make/model quality distinctions produces a misleading picture at best.
And the IIHS approach results in a far more dangerous highway for all of us. Encouraging consumers to "super-size" vehicles creates a vehicle fleet with a far greater range between the largest and smallest vehicles. But these kind of disparities have been shown by safety experts to be the most devastating in two-car crashes, turning the nation’s fleet of vehicles into a combination of battering rams and lambs to the slaughter. One study recently concluded that the risks imposed by heavier cars on lighter car occupants outweigh the benefits to heavier car occupants, and that the variability of distribution of weights in the vehicle fleet increases net fatalities.16 Another study demonstrated that shifting the passenger vehicle fleet to include more SUVs in lieu of cars increased the overall number of deaths.17 Instead of fixing design flaws in SUVs, manufacturers frequently claim that driver behavior is to blame. But data on driver behavior patterns also fail to explain the difference in driver death rates between SUVs and passenger cars. SUV drivers killed in
7
rollovers are, in fact, considerably less likely to be either speeding or drunk than are passenger car drivers involved in a fatal rollover crash, suggesting that it is easier for SUV drivers to lose control of the vehicle and become involved in a severe crash.18 II. New Safety Standards On Rollover and Aggressivity Reduction Could Save Lives A. Rollover
As General Motors pointed out in its response to Dr. Runge’s comments in
Detroit, rollover crashes are rare events, representing only 2.5 percent of all crashes. GM failed to mention that almost one third (32 percent) of all occupant fatalities are rollover-related (over 10,000 per year).19 And, when they occur today, rollovers are often deadly. According to NHTSA, 20 percent of fatal crashes involve a rollover.20
SUVs are a major part of the rollover problem: while 22 percent of passenger car
occupant fatalities are attributable to rollover, a whopping 61 percent of SUV occupant fatalities are.21 The high frame and unstable design of SUVs makes SUV rollovers particularly likely, and the weak roofs and poor crash protection make them deadly when they do occur. SUV rollovers are dangerous no matter how you slice the data:
• High overall death toll from SUV rollovers: SUV rollovers resulted in 12,000
deaths in the U.S. in the 1990s and increased from 2,064 in 2000 to 2,142 in 2001.22 According to the NHTSA Administrator, in 2001, SUV occupants were far more likely to die in fatal rollover crashes than were other vehicle occupants. SUV occupant fatalities in rollover crashes occurred at a rate of 9.9 per 100,000 registered vehicles, compared to a rate of 3.53 for passenger cars, 4.33 for vans, and 6.97 for pickup trucks.23
• High SUV involvement in fatal rollovers: According to NHTSA, the rate at which SUVs roll over in fatal crashes is more than three times the rate of passenger cars. While passenger cars roll over in fatal crashes at a rate of 3.48 per 100,000 registered vehicles, SUVs roll over at a rate of 11.06, pickups roll over at a rate of 7.52, and vans roll over at a rate of 4.09.24
• High rate of SUV rollover fatal crashes: While the rate of passenger car occupants who died in fatal rollover crashes per 100,000 registered vehicles declined 9.7 percent between 1995 and 1999, the rate for SUV occupants declined only 1.8 percent in the same time period. Critically, SUV occupant death rate in rollover crashes has remained about three times that of passenger car occupant deaths.25 And the problem is growing. The rate of passenger car occupants who died in
fatal rollover crashes per 100,000 registered vehicles declined 18.5 percent between 1991 and 2000, while the rate of light truck occupants who died in fatal rollover crashes increased 36 percent between 1991 and 2000.26
8
1. The High, Boxy Design of SUVs Makes Them Prone to Roll Over, Particularly in Emergency Maneuvers
The high center of gravity of SUVs and narrow track width makes them unstable
during emergency maneuvers, such as swerving to avoid another vehicle, pedestrian or curb, or during a tire blowout. Loading of the vehicle, which is encouraged in SUVs by the large cargo areas, raises the center of gravity of the vehicle, making it more dangerous and hard to control. Consumers unaware of these handling differences may drive SUVs more aggressively, yet be unable to handle the slower response time and longer braking distances of a light truck. In a rollover propensity test of the Ford Explorer by Little Rock, Arkansas, trial attorney Tab Turner, even an expert driver aware of the planned timing of the tire blowout was unable to keep the vehicle from rolling over.
Although charged by Congress to prepare a rollover propensity minimum
standard in 1991, NHTSA terminated rulemaking on the standard in 1994. NHTSA defended its termination by citing obsolete statistics on the number of SUVs in the vehicle population in the late 1980s, without acknowledging the growing popularity and hazards of this vehicle class. At that time, NHTSA promised that a consumer information program and numerous crashworthiness protections would be forthcoming.
A decade and tens of millions SUVs later, in January 2001, NHTSA at long last
published very basic information based on a static measure of the rollover propensity of vehicles as a part of the agency’s New Car Assessment Program, which assesses a mere 40 or so vehicles in each model year. Rather than prominently displaying a vehicle’s safety ratings next to the sticker price to help consumers make informed purchases, the safety information is only available on the agency’s Web site, where fewer than 1.5 percent of consumers would even think to look.27 NHTSA claimed that its program would highlight the poor performers and that public pressure would force manufacturers to improve the rollover tendencies of vehicles.
Yet 22 SUVs in the 2003 model year received a rollover rating of just two stars
out of a total of five, indicating that they are very prone to rollover, and the Chevrolet Blazer was awarded a pathetic single star, the minimum handed out to any vehicle in the testing program. A single star or two stars, as Dr. Runge indicated, on this test is a failing grade. By imperiling anyone who unwittingly purchases one of these unstable death-traps, these continuing low grades show the failure of NCAP’s rollover tests to set a meaningful floor for risks imposed on consumers, demonstrating that the program also well deserves a failing grade. The Transportation, Recall Enhancement, Accountability and Documentation (TREAD) Act, passed in the wake of the Ford/Firestone disaster, included a requirement for a dynamic rollover consumer information program to be added to NCAP on the NHTSA Web site. This is a step in the right direction, but consumer information, for the reasons described above, will never be enough. NHTSA should return to the Congressional mandate it denied in 1994 and establish a minimum standard for rollover
9
propensity. Between 1994 and 2001, 12,959 people have died in SUV rollovers alone, not to mention the other people killed or injured in other types of vehicles.28 No more consumers should be a guinea pig in this ongoing, failed experiment in market dynamics or should be forced to await the next Ford/Firestone debacle before a meaningful remedy is implemented. 2. A Safety Standard Establishing Basic Rollover Crash Protections Is Sorely
Needed
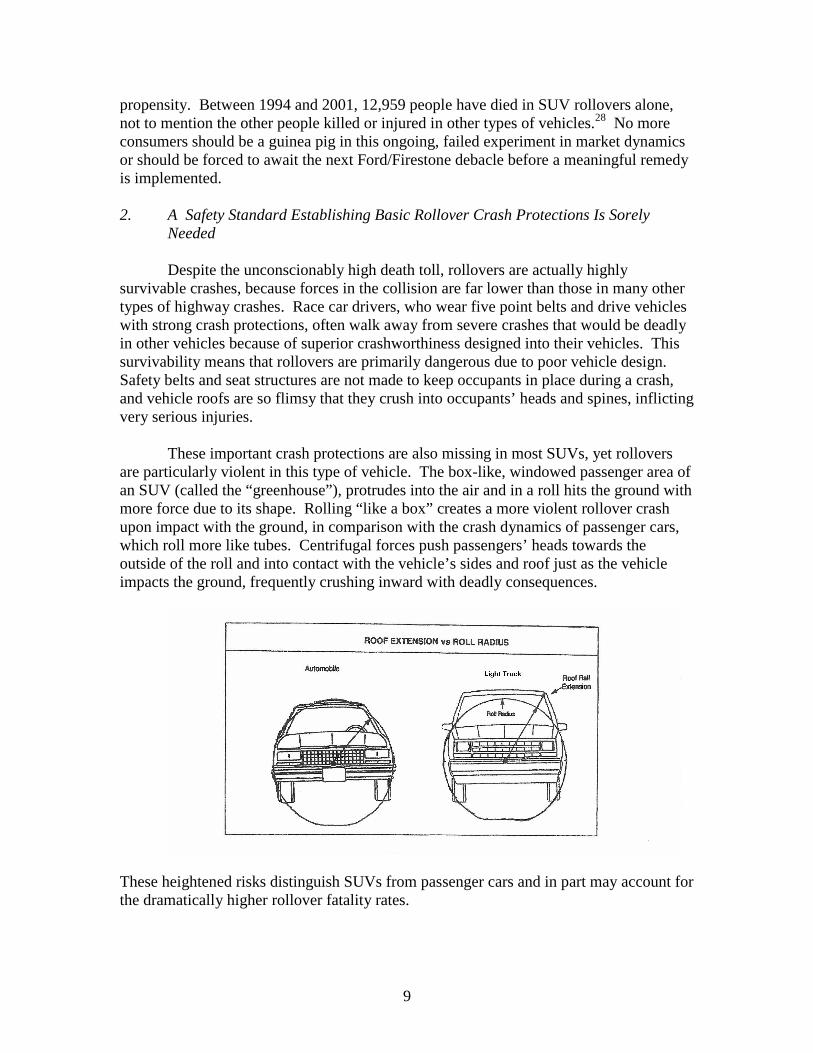
Despite the unconscionably high death toll, rollovers are actually highly survivable crashes, because forces in the collision are far lower than those in many other types of highway crashes. Race car drivers, who wear five point belts and drive vehicles with strong crash protections, often walk away from severe crashes that would be deadly in other vehicles because of superior crashworthiness designed into their vehicles. This survivability means that rollovers are primarily dangerous due to poor vehicle design. Safety belts and seat structures are not made to keep occupants in place during a crash, and vehicle roofs are so flimsy that they crush into occupants’ heads and spines, inflicting very serious injuries.
These important crash protections are also missing in most SUVs, yet rollovers are particularly violent in this type of vehicle. The box-like, windowed passenger area of an SUV (called the “greenhouse”), protrudes into the air and in a roll hits the ground with more force due to its shape. Rolling “like a box” creates a more violent rollover crash upon impact with the ground, in comparison with the crash dynamics of passenger cars, which roll more like tubes. Centrifugal forces push passengers’ heads towards the outside of the roll and into contact with the vehicle’s sides and roof just as the vehicle impacts the ground, frequently crushing inward with deadly consequences.
These heightened risks distinguish SUVs from passenger cars and in part may account for the dramatically higher rollover fatality rates.
10
In addition, the heavy bodies and engines of SUVs place greater pressure on the roof during a roll, making roof strength a paramount concern for drivers of these vehicles. Most SUV roofs are not strong enough to withstand the impact of a rollover crash. The current roof crush standard became effective in 1973 and has been revised since that time only for extension to vehicles with a gross vehicle weight (GVWR) of 6,000 pounds or less and to apply to vehicles with raised roofs.29 This weight limit has allowed manufacturers to increase the gross weight of SUVs and pickups over 6,000 pounds to evade the standard, meaning that the vehicles most in need of a strong roof are totally unregulated. The weight limit should be raised by Congressional action to 10,000 pounds to correct this egregious oversight.
NHTSA’s 1994 termination of work on a rollover propensity standard was
followed by subsequent public statements in which the agency promised many crashworthiness improvements, including a stronger roof crush standard as well as requirements for better door latches, door hinges and upper side impact protection. Among these tragically broken promises, the roof crush standard remains far out-of-date.
In order to "beat" the standard in recent years, manufacturers have taken the short
cut of merely improving the bonding of the windshield to the vehicle structure, which helps the vehicle pass NHTSA’s weak test without helping occupants, because in a crash the windshield is typically gone by the end of the first roll. Once the windshield is gone, typically one-third of the roof strength disappears with it, and the roof crushes.
When roofs crush in a rollover, the cardinal rule that occupant space not be
intruded upon is broken. The survival space for occupants is greatly limited or eliminated altogether, so that the heads and spines of occupants contact the roof. In addition, roof crush can open ejection portals — making windows and the windshield area very large and leading to ejection of occupants, which is frequently fatal. The current static standard tests only one side of the vehicle, failing to provide any indication of what will happen in a roll when the following side (rather than the leading side) impacts the ground. Because in a real-world rollover the roof is already weakened by the first impact, and the windshield shatters in the first roll, roofs should be tested under those conditions. Although NHTSA has issued a general request for comments over a year ago, a schedule of deadlines for the agency to issue a proposed and final rule is sorely needed and should be set out by Congress.
What is needed is a dynamic test that will provide the basis for a minimum roof
strength standard, or, at a minimum, an updated static test for both sides of the roof with the windshield removed, and both should be applicable to vehicles over 6,000 lbs. In addition, Congress should require crash protections that will protect occupants in rollovers, such as safety belts that tighten in a roll, advanced window glazing and side head protection air bags to keep ejection portals from opening, and air bag sensors that will deploy the air bags in a rollover crash.
11
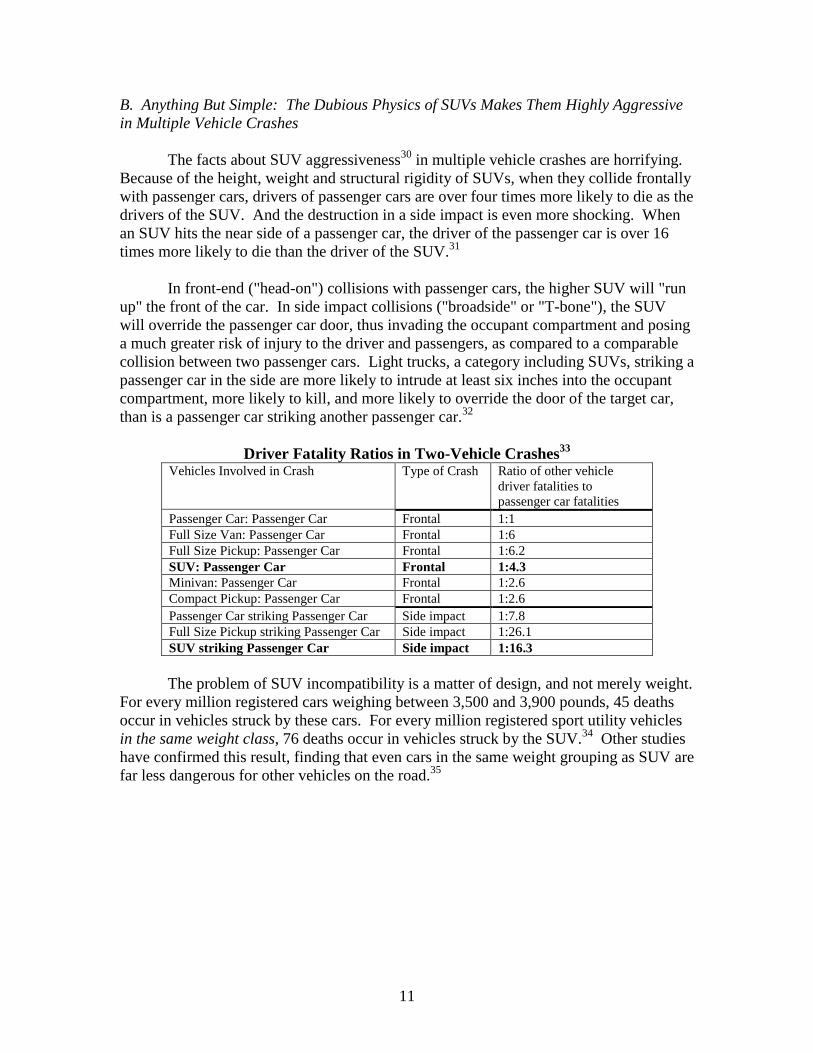
B. Anything But Simple: The Dubious Physics of SUVs Makes Them Highly Aggressive in Multiple Vehicle Crashes The facts about SUV aggressiveness30 in multiple vehicle crashes are horrifying. Because of the height, weight and structural rigidity of SUVs, when they collide frontally with passenger cars, drivers of passenger cars are over four times more likely to die as the drivers of the SUV. And the destruction in a side impact is even more shocking. When an SUV hits the near side of a passenger car, the driver of the passenger car is over 16 times more likely to die than the driver of the SUV.31 In front-end ("head-on") collisions with passenger cars, the higher SUV will "run up" the front of the car. In side impact collisions ("broadside" or "T-bone"), the SUV will override the passenger car door, thus invading the occupant compartment and posing a much greater risk of injury to the driver and passengers, as compared to a comparable collision between two passenger cars. Light trucks, a category including SUVs, striking a passenger car in the side are more likely to intrude at least six inches into the occupant compartment, more likely to kill, and more likely to override the door of the target car, than is a passenger car striking another passenger car.32
Driver Fatality Ratios in Two-Vehicle Crashes33 Vehicles Involved in Crash Type of Crash Ratio of other vehicle
driver fatalities to passenger car fatalities
Passenger Car: Passenger Car Frontal 1:1 Full Size Van: Passenger Car Frontal 1:6 Full Size Pickup: Passenger Car Frontal 1:6.2 SUV: Passenger Car Frontal 1:4.3 Minivan: Passenger Car Frontal 1:2.6 Compact Pickup: Passenger Car Frontal 1:2.6 Passenger Car striking Passenger Car Side impact 1:7.8 Full Size Pickup striking Passenger Car Side impact 1:26.1 SUV striking Passenger Car Side impact 1:16.3 The problem of SUV incompatibility is a matter of design, and not merely weight.
For every million registered cars weighing between 3,500 and 3,900 pounds, 45 deaths occur in vehicles struck by these cars. For every million registered sport utility vehicles in the same weight class, 76 deaths occur in vehicles struck by the SUV.34 Other studies have confirmed this result, finding that even cars in the same weight grouping as SUV are far less dangerous for other vehicles on the road.35
12
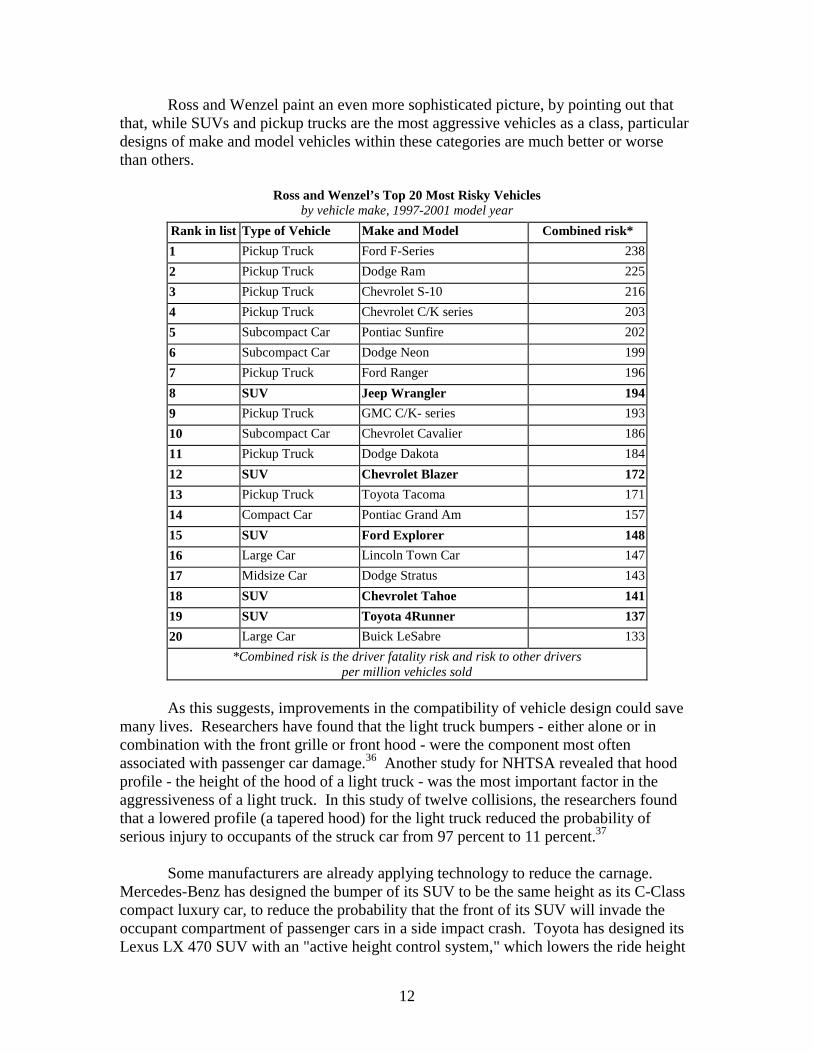
Ross and Wenzel paint an even more sophisticated picture, by pointing out that that, while SUVs and pickup trucks are the most aggressive vehicles as a class, particular designs of make and model vehicles within these categories are much better or worse than others.
Ross and Wenzel’s Top 20 Most Risky Vehicles
by vehicle make, 1997-2001 model year Rank in list Type of Vehicle Make and Model Combined risk* 1 Pickup Truck Ford F-Series 238 2 Pickup Truck Dodge Ram 225 3 Pickup Truck Chevrolet S-10 216 4 Pickup Truck Chevrolet C/K series 203 5 Subcompact Car Pontiac Sunfire 202 6 Subcompact Car Dodge Neon 199 7 Pickup Truck Ford Ranger 196 8 SUV Jeep Wrangler 194 9 Pickup Truck GMC C/K- series 193 10 Subcompact Car Chevrolet Cavalier 186 11 Pickup Truck Dodge Dakota 184 12 SUV Chevrolet Blazer 172 13 Pickup Truck Toyota Tacoma 171 14 Compact Car Pontiac Grand Am 157 15 SUV Ford Explorer 148 16 Large Car Lincoln Town Car 147 17 Midsize Car Dodge Stratus 143 18 SUV Chevrolet Tahoe 141 19 SUV Toyota 4Runner 137 20 Large Car Buick LeSabre 133
*Combined risk is the driver fatality risk and risk to other drivers per million vehicles sold
As this suggests, improvements in the compatibility of vehicle design could save
many lives. Researchers have found that the light truck bumpers - either alone or in combination with the front grille or front hood - were the component most often associated with passenger car damage.36 Another study for NHTSA revealed that hood profile - the height of the hood of a light truck - was the most important factor in the aggressiveness of a light truck. In this study of twelve collisions, the researchers found that a lowered profile (a tapered hood) for the light truck reduced the probability of serious injury to occupants of the struck car from 97 percent to 11 percent.37
Some manufacturers are already applying technology to reduce the carnage.
Mercedes-Benz has designed the bumper of its SUV to be the same height as its C-Class compact luxury car, to reduce the probability that the front of its SUV will invade the occupant compartment of passenger cars in a side impact crash. Toyota has designed its Lexus LX 470 SUV with an "active height control system," which lowers the ride height
13
of the SUV by as much as four inches if it is driven at high speeds.38 By adding a lower cross-member bar to the vehicle below the front bumper, the Volvo’s new XC90 SUV better engages the structure of small vehicles, increasing its crash compatibility. And to better protect pedestrians and bicyclists, the rounded front of the XC90 is smooth and the engine is positioned low in relation to the hood, allowing the hood to dissipate crash forces rather than transferring them to the person hit.39 These kinds of changes should be the norm, rather than the exception. Without regulation, they will remain the province of luxury manufacturers, yet these designs show what is feasible if a socially responsible attitude toward the safety of others is a priority. NHTSA has been collecting crash profile information as a part of its New Car Assessment Program for the past decade, yet it has never used this information to suggest regulatory changes or propose an aggressivity reduction standard. It is far past time to act on this information and to establish basic standards to limit vehicular violence by urban assault vehicles. III. While the Worst Risks Remain Unregulated, SUVs Exploit Other Key Loopholes SUVs provide a case study in industry muscle overpowering government. Sailing through loophole after loophole, the vehicles exploit numerous omissions and special favors, from the tax code to fuel economy rules and safety protections. In addition to the extra costs and boondoggles listed below, SUVs also inflict needless harm on the public health, emitting smog-forming, greenhouse gases that cause respiratory maladies and global warming.
A Legacy of Loopholes: SUVs are Regulatory Renegades
• Emissions Evasion: In 1997, the auto industry brokered a voluntary agreement
with the EPA that protected Detroit’s largest and most profitable SUVs from having to make any pollution improvements until 2004. In addition to befouling the air with high levels of smog-forming pollutants and greenhouse gases, the emissions exemption also encouraged an upsizing of SUVs above the 6,000 pound threshold, helping to make large SUVs the most rapidly expanding market segment. In 2004, a new emissions program is scheduled to take effect that will impose new fleet requirements on average emissions.
• Fuel Economy: A Twisted Tale of Two Vehicle Classes: In 1978, when
Congress passed the first fuel economy law, instructing NHTSA to set the Corporate Average Fuel Economy (CAFE) standards for passenger cars at 27.5 miles per gallon (mpg) it told NHTSA to set standards separately for light trucks (now set at 20.7 mpg). In designing these categories, NHTSA never imagined that trucks would one day morph into popular passenger vehicles, constituting one-half of all new vehicles sold. Furthermore, the light truck standard applies only to vehicles under 8,500 pounds. Consequently, automobile companies push vehicles above the upper limit and game the rules defining cars and light trucks to artificially deflate their CAFE.

14
• Subsidies and Tax Breaks for SUVs Rob Federal Coffers and the Public Extravagance at a High Price for the Public: The luxury SUV giveaway began in the 1980s as a tax break to enable small farmers and construction companies to deduct the cost of their pickup trucks as a business expense. 40 A business that purchases one of the 38 different SUVs that qualify can immediately deduct $25,000 from the sticker price, and the Bush stimulus package of 2002 allots another 30 percent depreciation bonus on top of a 20 percent deduction over five years, as well as an existing exemption from luxury surcharge taxes. Instead of closing this sinkhole for public revenues, the Bush administration is seeking to raise the initial deduction to an incredible $75,000, a figure that would effectively cover the entire cost of a large, luxury SUV.41 Because the loophole applies only to “light trucks” exceeding 6,000 pounds, some small business owners have admitted that the tax breaks have caused them to purchase large SUVs when they would otherwise have bought smaller vehicles.42 According to Taxpayers for Common Sense, the light-truck loophole costs the federal government between $840 million and $986 million yearly. Thankfully, efforts to close this egregious waste of tax dollars and safety threat have been made in both the House of Representatives and the Senate. Sen. Barbara Boxer (D.-CA) introduced the “SUV Business Tax Loophole Closure Act,” S. 265, and Rep. Anna Eshoo (D.-CA) offered the same title as H.R. 727 for consideration by the House.
“Light Truck” Gas Guzzlers Need Not Pay: When adopted in 1978, the gas guzzler tax sought to penalize individuals who consume more than their fair share of gasoline. Legislators chose not to subject “light trucks” to the fine because these vehicles were used primarily for work purposes and made up only a small percentage of the vehicle fleet. Today, SUVs are flooding the market place, draining oil reserves, and spoiling the environment. Exempting SUVs from a gas guzzler penalty violates legislative intent and effectively rewards consumers for driving socially irresponsible vehicles.
• Designed for Cars, Safety Standards Don’t Adequately Protect SUV
Occupants
Holes in Side Impact Protection Unlike passenger cars, a loophole in the federal safety standards requires SUVs over 6,000 pounds to meet only a weak, outdated side impact crash test, but not the more effective moving barrier test. Consequently, many larger SUVs need not offer reinforced side door crash protection.
Roof Strength Weak on Top Despite their high risk of rollover, SUVs over 6,000 pounds need not meet any minimum crash protection standard for roof strength. In a rollover crash, roofs of SUVs typically crush into their occupants’ heads, inflicting serious injury and death.

15
Bumper Height and Strength Encourage High Costs and Aggressivity In order to minimize damage in low speed crashes and to ensure crash compatibility between vehicles, passenger cars must meet very weak standards for bumper strength and standards for height, none of which apply to SUVs. Consequently, crashes involving SUVs result in more severe property damage and higher insurance payouts than passenger cars. The lack of bumper height requirements creates a menace to other vehicles on the road.
Missing Child Restraint Anchorage Systems Although marketed as family vehicles, the largest SUVs (above 8,500 lbs.), unlike passenger cars, are not required to install anchorage systems to accommodate child restraints. Brake Light Requirements Dimmed Down for SUVs Unlike passenger cars, many SUVs have lower conspicuity because they need not have a center high-mounted stop lamp. SUV Manufacturers Evade Air Bag Safeguards That Applied to Cars In 1997, auto manufacturers successfully convinced NHTSA to allow them to reduce the test requirements for air bags, changing the test from a 30 mph barrier test to a less demanding sled test. Having never been required to comply with the protective standards applicable to passenger cars, manufacturers wished to avoid doing the vehicle re-design for light trucks that would make them, overall, more energy absorbing and reduce the need for a more aggressive air bag. In its May 2000 recent final rule on advanced air bags, NHTSA continued its bad habit of letting them off the hook. Instead of asking SUV makers to do more, NHTSA reduced the protectiveness of the requirements for all vehicles, including cars and light trucks, by lowering the common standard to a 25 mph test.
SUV and Light Truck Tire Performance Is a Safety Blowout Since the government established separate performance standards for passenger car tires and light truck tires in 1968, light truck tires have not been held to the same high speed and endurance requirements as passenger car tires, placing consumers at risk of dangerous blowouts. As evidenced by the Ford-Firestone debacle, light truck tire failures have resulted in countless deaths and injuries. A new standard is pending that will apply to all vehicles under 10,000 lbs., but the agency has yet to issue the final rule.
16
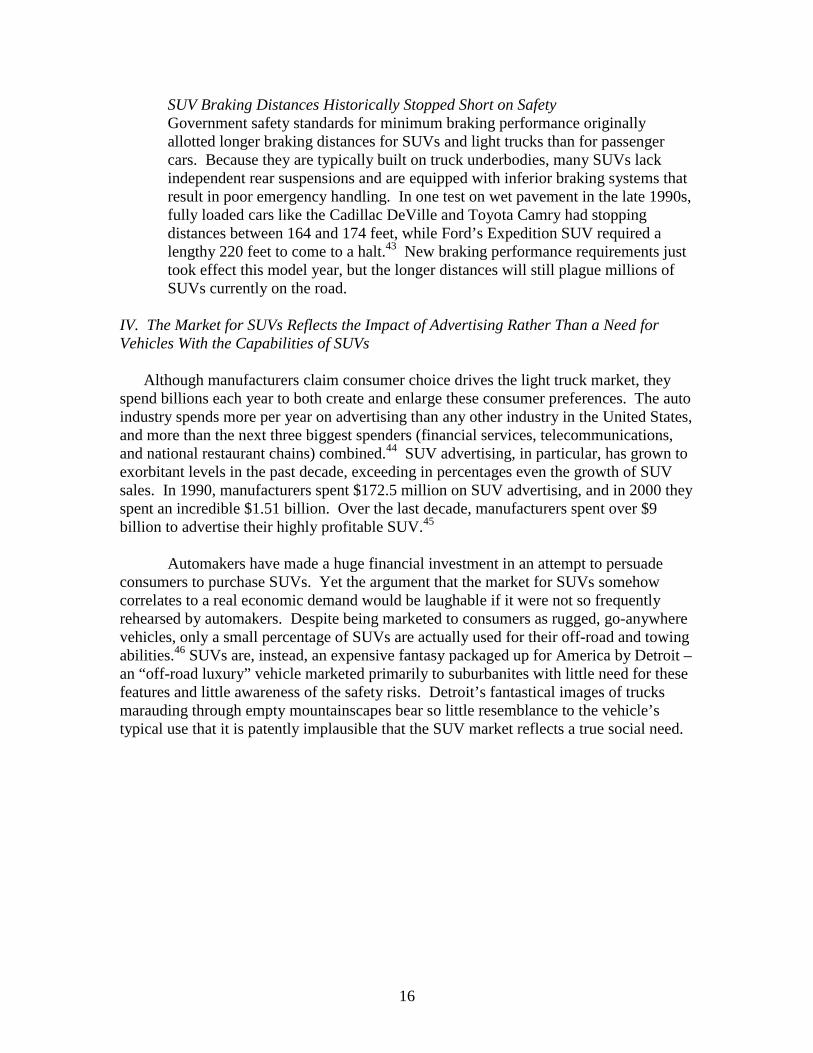
SUV Braking Distances Historically Stopped Short on Safety Government safety standards for minimum braking performance originally allotted longer braking distances for SUVs and light trucks than for passenger cars. Because they are typically built on truck underbodies, many SUVs lack independent rear suspensions and are equipped with inferior braking systems that result in poor emergency handling. In one test on wet pavement in the late 1990s, fully loaded cars like the Cadillac DeVille and Toyota Camry had stopping distances between 164 and 174 feet, while Ford’s Expedition SUV required a lengthy 220 feet to come to a halt.43 New braking performance requirements just took effect this model year, but the longer distances will still plague millions of SUVs currently on the road.
IV. The Market for SUVs Reflects the Impact of Advertising Rather Than a Need for Vehicles With the Capabilities of SUVs Although manufacturers claim consumer choice drives the light truck market, they spend billions each year to both create and enlarge these consumer preferences. The auto industry spends more per year on advertising than any other industry in the United States, and more than the next three biggest spenders (financial services, telecommunications, and national restaurant chains) combined.44 SUV advertising, in particular, has grown to exorbitant levels in the past decade, exceeding in percentages even the growth of SUV sales. In 1990, manufacturers spent $172.5 million on SUV advertising, and in 2000 they spent an incredible $1.51 billion. Over the last decade, manufacturers spent over $9 billion to advertise their highly profitable SUV.45
Automakers have made a huge financial investment in an attempt to persuade
consumers to purchase SUVs. Yet the argument that the market for SUVs somehow correlates to a real economic demand would be laughable if it were not so frequently rehearsed by automakers. Despite being marketed to consumers as rugged, go-anywhere vehicles, only a small percentage of SUVs are actually used for their off-road and towing abilities.46 SUVs are, instead, an expensive fantasy packaged up for America by Detroit –an “off-road luxury” vehicle marketed primarily to suburbanites with little need for these features and little awareness of the safety risks. Detroit’s fantastical images of trucks marauding through empty mountainscapes bear so little resemblance to the vehicle’s typical use that it is patently implausible that the SUV market reflects a true social need.

17
V. Voluntary Standards Are No Solution
“The promotion of motor vehicle safety through voluntary standards has largely failed. The unconditional imposition of mandatory standards at the earliest practicable date is the only course commensurate with the highway death and injury toll.” – Committee Report on S. 3005, the Traffic Safety Act of 196647
On February 13, 2003, the Alliance of Automobile Manufacturers (the Alliance)
and the IIHS wrote a letter to Dr. Runge acknowledging the need to improve SUV front-to-side and front-to-front crash protection to address vehicle incompatibility and stiffness, or aggressivity. This is the first industry-wide acknowledgment of such deficiencies in SUVs and other light trucks.
Yet this long-overdue admission appears mainly calculated to convince federal
regulators and others that a voluntary effort to improve vehicles should replace any new move to regulate the safety of SUVs. Buying into this obvious delaying tactic would be a grave mistake. The vague promises and half-hearted inquiries (Apossible changes...need to be explored@) described in the letter are no substitute for a public process resulting in mandatory safety improvements required of the entire light truck fleet.
Automakers have long asked legislators to “trust them” to improve safety, an
argument Congress specifically considered and rejected when it enacted the National Traffic and Motor Vehicle Safety Act in 1966, the Act giving rise to NHTSA. In lobbying against the Act, auto manufacturers tried to sell Congress on the concept of voluntary standards. The plausibility of their proposal was roundly criticized by Congress and ultimately denied.
Legislators were right. The historical path of automakers’ voluntary efforts is
paved with broken promises. From General Motors� (GM’s) promises in 1970 to voluntarily put air bags in all its vehicles by the mid-l970s (GM installed just 10,000 in model year 1974 and 1975 vehicles and then discontinued the program), to Ford, Daimler/Chrysler and GM’s recent recantation of their widely publicized 2001 promises to voluntarily improve the fuel economy of their light trucks by 25 percent (withdrawn after the threat of Congressional action on fuel economy receded), “voluntary” is often just another name for the manufacturers’ tactical whims.
The Alliance/IIHS letter suggests that Aone possible result could be development
of voluntary standards, such as those previously developed for side air bags.@ The limited inquiry conducted by the side impact air bag working group (an industry group working only on injury prevention) is an extremely poor example on which to model the crucial SUV safety standards that are needed. Instead, the side impact air bag group is representative of many problems that infest a voluntary alternative to regulation.
18
This group has thus far been plagued by the following serious drawbacks, among others:
• The narrowness of the group’s focus on injury prevention from the air bags
(mitigating the down-side), rather than injury reduction in all passengers (exploring the up-side), has accomplished little and yet has precluded broader efforts to develop a requirement for side impact head protection air bags;
• Real-world data on the crashes involving these air bags is scarce due to the lack of a requirement for their installation and the resulting low fleet penetration;
• Core sections of industry group meetings are closed to the public, and policy analysts in attendance from consumer groups have been asked to leave mid-meeting;
• Some manufacturers, including General Motors, have since ceased installing side air bags in some models, and the lack of a safety standard enables this capriciousness.
In general, a promise to develop voluntary standards is merely grounds for obfuscation, delay, secret meetings, and deniability. A significant body of academic research has repeatedly shown that voluntary standards fail, for the following reasons:
• Closed, secret processes and meetings: The public is shut out of the
development of the proposal, which instead is designed in secret by industry working groups;
• Lack of procedural and judicial oversight: Industry group decision makers are not subject to oversight, compliance with statutory requirements, and judicial review of decisions;
• Weak and non-binding results: Proposals are invariably weak because they represent the lowest common denominator among companies looking out for their own costs and product plans, and there is no obligation to install technology in compliance with the group standard, meaning that companies can change their minds at will and decide to withdraw any protection offered by the new standard;
• No accountability: The public has no means to secure an independent evaluation of the quality of the industry’s voluntary tests or standards;
• No transparency: The public receives no verification that a particular vehicle actually complies with the industry’s voluntary tests, as they do with government standards that are subject to public compliance testing and enforcement, and there is no vehicle sticker at the point-of-sale to indicate that a standard is met;
• No baseline for safety: High-income purchasers that can afford safety extras may be protected, but low-income purchasers remain vulnerable to cost-based decisions by manufacturers.
19
As the Committee Report on the Traffic Safety Act of 1966 observed in rejecting the option of standards developed on a voluntary basis, such as through the Society of Automotive Engineers (SAE):
These SAE standards are the product of a committee consensus, subject to a single manufacturer’s veto, while affording no consumer or user representation: Compliance is voluntary. There exist no procedures to compel their adoption, monitor their use, or evaluate their effectiveness.
A voluntary standards program is a particularly inapt solution where, as here, manufacturers have long been on notice of the serious safety hazards in these vehicles and where the externalities of their decisions to produce ever-more aggressive and deadly vehicles are imposing needless suffering and costs on all of us. VI. Better Safeguards Are Needed to Protect the Public In addition to the shocking toll in lives, devastating injuries, and unnecessary suffering, the monetary costs of our failure to regulate SUVs is staggering. NHTSA estimates the “comprehensive cost”48 of each motor vehicle crash fatality in FY 2000 at approximately $3.4 million. Without adjusting for inflation, the cost to society of SUV rollover fatalities in FY 2001 alone cost the United States approximately $7.3 billion, and has totaled a shocking 44 billion since 1994, when NHTSA terminated its rulemaking on a minimum propensity standard.49 The 2,000 unnecessary deaths resulting from the aggressivity of light trucks deaths cost the U.S. economy approximately $6.8 billion per year.50 Congress could put a halt to the carnage, the human suffering, and the incredible waste, by requiring simple, long-overdue measures to address the safety of SUVs, light trucks and other vehicles, up to 10,000 lbs.:
1) NHTSA should develop and implement a minimum rollover propensity
standard; 2) NHTSA should issue a requirement for basic rollover crashworthiness
protections, including requirements for: a. Safety belts that employ sensors which pretension in a rollover crash
(currently belts remain slack in a rollover from the lack of pressure); b. Side impact head and frontal air bags with sensors that trigger inflation in
a rollover crash; c. A dynamic roof crush standard, and, in the interim, a revised static
standard which test both sides of the roof with the windshield removed; d. Roof structures equipped with interior, energy absorbing materials to
reduce damage to the occupant should any body part of the occupant contact the roof;
e. Advanced window glazing for impact protection in side windows; and f. Improved seat structure and belt placement to contain and protect
occupants by integrating safety belts into the seat structure.

20
3) NHTSA should issue aggressivity reduction and vehicle compatibility standards;
4) Close the luxury tax loophole as it applies to SUVs; 5) NHTSA should improve the safety of 15-passenger vans, which are plagued
by many of the same rollover problems as SUVs are, such as in legislation recommended by Sen. Olympia Snowe (R-ME);
6) Improving funding for NHTSA to develop regulatory standards and track real-world crash data;
7) Placing vehicle safety information on stickers at the point-of-sale and changing the NCAP program to grades that indicate success and failure rather than unclear results with stars;
8) Improving the fuel economy of light trucks, which the National Academy of Sciences found would accrue safety benefits if improvements were targeted at vehicles weighing more than 4,000 lbs.
It is far less expensive for manufacturers to undertake a comprehensive re-design of
vehicles for safety and fuel economy at the same time, as was the case when the initial fuel economy standards were targeted for the same time-period as new occupant protection requirements. Therefore, Congress should ask manufacturers to bring their vehicle fleets into this century by upgrading the vehicles’ safety and fuel economy in one combined design campaign.
These eight crucial changes would transform American highways by realizing the promise of the safety program first envisioned in 1966 – saving countless lives, improving the quality of vehicles sold in America, and making the United States once again a leader in automotive safety.
21
Endnotes 1 See Bradsher, Keith, High and Mighty: SUVs- The World’s Most Dangerous Vehicles and How They Got That Way, 2002, at 193 (referring to Joksch, Hans C., “Vehicle Design versus Aggressivity,” (Apr. 2000), DOT HS 809 194, at 40-42). 2 See Id. at 32. 3 See National Highway Traffic Safety Administration (NHTSA), 2001 Motor Vehicle Crash Data from FARS and GES, at 17 (the rate of passenger cars involved in fatal crashes per 100,000 registered passenger cars declined by 15.1 percent between 1995 and 2001 (from a rate of 25.11 to a rate of 21.31), the rate of light truck involvement only declined by 6.8 percent during the same time (from a rate of 28.13 to a rate of 26.23)). 4 National Center for Statistics and Analysis (NCSA), Characteristics of Fatal Rollover Crashes, DOT HS 809 438, at 22 (Apr. 2002), at 13 (emphasis added). 5 See Bradsher, Keith. “Light Trucks Will Get Designs That Are Safer, Official Says,” New York Times, June 2, 1998 quoting former NHTSA Administrator Dr. Ricardo Martinez. 6 See Joksch, Hans C., “Vehicle Design versus Aggressivity,” April 2002 at 41; Further calculations contained in an electronic mail communications between Public Citizen and safety researcher Hans Joksch stated that: “In 1996, 890 car occupants died in collisions with SUVs. If the risk in collisions with cars of the same weight had been half as high, as estimated at that time, 445 deaths would not have occurred if SUVs had been replaced by cars of the same weight.” Email from Hans Joksch to Laura MacCleery of Public Citizen, on February 24, 2003 (on file at Public Citizen). 7 Cloud, John, “Why The SUV Is All The Rage,” Time Magazine, Feb. 24, 2003; See also NCSA, Characteristics of Fatal Rollover Crashes, DOT HS 809 438, at 22 (Apr. 2002), (In 1999, there were 16.44 passenger car deaths per 100,000 registered passenger cars compared to 17.78 SUV deaths per 100,000 registered SUVs.). 8 All four figures use curb weight. Curb weight is the weight of a vehicle that is ready to drive, with all fluid levels topped up and a full tank of gas, but without occupants or cargo. 9 Ross, Mark, Wenzel, Tom, “Losing Weight to Save Lives,” prepared for the Commission on Energy Policy, January 29, 2003. 10 See Bradsher, Keith, High and Mighty: SUVs- The World’s Most Dangerous Vehicles and How They Got That Way, 2002, at 449, footnote 13 (Leaving aside SUVs and considering just the number of drivers killed per 5,000 crashes, in which a large car hits another car of any size, an average of 2.2 drivers die in large cars and 5.5 drivers die in the other cars that were struck. Together these numbers render a total of 7.7 deaths per 5,000 crashes. Because the large cars are heavier than most of the cars they hit, the drivers of the large cars tend to fare better. When looking at the crashes involving Explorers, on average only 1.2 Explorer drivers die when involved in the same number of collisions with cars. Compared to the 2.2 drivers who died in the large cars, the Explorers actually save a life. However this is misleading because, when hit by Explorers instead of large cars, the death rate for drivers of other cars rises dramatically, doubling to 11 deaths. Therefore, on average 5.5 extra driver deaths occur in the struck cars. The combined death rate for drivers on both sides of the collision has now risen to 12.2 for collisions involving Explorers, compared with 7.7 when there were just large cars hitting the other cars.). 11 Insurance Institute for Highway Safety, "Fatality Facts: Passenger Vehicles as of November 2002," (Feb. 14, 2003). 12 See, National Center for Statistics and Analysis, Characteristics of Rollover Crashes, DOT HS 809 438 (April 2002), at 22. 13 See Joksch, Hans C., “Vehicle Design versus Aggressivity,” April 2002 at 41; Further calculations contained in an electronic mail communications between Public Citizen and safety researcher Hans Joksch stated that: “In 1996, 890 car occupants died in collisions with SUVs. If the risk in collisions with cars of the same weight had been half as high, as estimated at that time, 445 deaths would not have occurred if SUVs had been replaced by cars of the same weight.” Email from Hans Joksch to Laura MacCleery of Public Citizen, on February 24, 2003 (on file at Public Citizen). 14 See Ross, Mark, Wenzel, Tom, “Losing Weight to Save Lives,” prepared for the Commission on Energy Policy, January 29, 2003. 15 Id.
22
16 Greene, David L., “Fuel Economy, Weight and Safety: Its What you Think You Know, That Just Isn’t So,” Presentation to Automotive Composites Conference, Society of Plastics Engineers, Detroit, Michigan, September 19, 2001, at 12. 17 Id. at 12. 18 See NCSA, Characteristics of Rollover Crashes, DOT HS 809 438, (Apr. 2002), at 34 and 37 (In fatal rollover crashes, fifty-three percent of passenger car drivers were speeding compared with 39 percent of SUV drivers. And speed is an important factor in the fatality of rollover crashes; in 2001; nearly three quarters of all fatal rollovers took place on roads where the speed limit was 55 miles per hour or higher. Furthermore, while passenger car and SUV drivers were equally likely to have a 0.01 to 0.09 Blood Alcohol Concentration when getting into a fatal rollover crash, 39 percent of passenger car drivers were at 0.10 or over while only 27 percent of SUV drivers were (0.08 is the legal level for intoxication)). 19 Id. at 14. 20 Id. at 3. 21 Jeffrey W. Runge, M.D., NHTSA Administrator, “Meeting the Safety Challenge” at Automotive News World Congress, Dearborn, Michigan, Jan. 14, 2003. 22 See Bradsher, Keith, High and Mighty: SUVs- The World’s Most Dangerous Vehicles and How They Got That Way, 2002, at 164. 23 Jeffrey W. Runge, M.D., NHTSA Administrator, "Meeting the Safety Challenge" at the Automotive News World Congress, Dearborn, Michigan, Jan. 14, 2003. 24 See NCSA, Characteristics of Rollover Crashes, DOT HS 809 438, (Apr. 2002) at 21. 25 Id. at 14 and 20; See also "Registration Data for 1975-2001: Data Source" FHWA and Polk," provided by a NCSA researcher to Public Citizen on Feb. 6, 2003, (the rate of passenger car occupants who died in fatal rollover crashes declined 9.7 percent between 1995 and 1999 (from 4.12 to 3.72 deaths per 100,000 registered vehicles), the rate for SUV occupants only declined 1.8 percent in the same time period (from 11.38 to 11.17 deaths per 100,000 registered vehicles.). 26 See NCSA, Characteristics of Rollover Crashes, DOT HS 809 438, (Apr. 2002), at 14 and 20; See also "Registration Data for 1975-2001: Data Source" FHWA and Polk" provided by a NCSA researcher to Public Citizen on Feb. 6, 2003, (The rate of passenger car occupants who died in fatal rollover crashes declined 18.5 percent between 1991 and 2000 (from 4.32 to 3.52 deaths per 100,000 registered vehicles) while the rate of light truck occupants who died in fatal rollover crashes increased 36 percent between 1991and 2000 (from 7.55 to 10.27 deaths per 100,000 registered vehicles.). 27 See NHTSA, Status Report for Rollover Prevention and Injury Mitigation, Docket No. 91-68, at 11 (May 1996), (NHTSA’s own research shows that only about 1.5 percent of consumers would consider researching auto safety issues by contacting a federal agency, while about half would think to request safety information from auto dealers. The report indicates that a 1995 Customer Satisfaction Survey reflected that less than 50 percent of the people surveyed would go to the auto dealer for information. Seventy-six percent of the people polled considered safety to be an important factor. However, less than 50 percent of the total population polled said they would request information from the dealer. Only 60 out of 4,000 people said they would contact a federal agency for auto safety information.) 28 Advocates for Highway and Auto Safety, Analysis of NHTSA SUV Rollover data. 29 The current standard requires a static test, in which the platen on the vehicle roof corner, above the A pillar, must bear one and a half times the vehicle’s weight with the windshield intact. 30 "Aggressivity" of a vehicle is generally defined as the risk of fatal or serious injury to occupants of other vehicles with which it might collide. See, Joksch, Hans, et al., Vehicle Aggressivity: Fleet Characterization Using Traffic Collision Data, U.S.Dept. of Tran., N.H.T.S.A., DOT HS 808-679 (Feb. 1998). 31 Jeffrey W. Runge, M.D., NHTSA Administrator, “Meeting the Safety Challenge” at the Automotive News World Congress, Dearborn, Michigan, Jan. 14, 2003. 32 Terhune, K.W., Ranney, T.A., et al., “Study of Light Truck Aggressivity,” Calspan Field Services, Inc. (Feb. 1984). 33 Jeffrey W. Runge, M.D., NHTSA Administrator, "Meeting the Safety Challenge" at the Automotive News World Congress, Dearborn, Michigan, Jan. 14, 2003. 34 See Insurance Institute for Highway Safety, Status Report, Vol. 43, No. 9, Oct. 30, 1999, at 3. 35 See Joksch, Hans C., “Vehicle Design versus Aggressivity,” April 2002 at 41; Further calculations contained in an electronic mail communications between Public Citizen and safety researcher Hans Joksch stated that: “In 1996, 890 car occupants died in collisions with SUVs. If the risk in collisions with cars of
23
the same weight had been half as high, as estimated at that time, 445 deaths would not have occurred if SUVs had been replaced by cars of the same weight.” Email from Hans Joksch to Laura MacCleery of Public Citizen, on February 24, 2003 (on file at Public Citizen). 36 Terhune, K.W., Ranney, T.A., et al., “Study of Light Truck Aggressivity,” Calspan Field Services, Inc. (Feb. 1984). 37 Monk, M.W., et al., “Striking Vehicle Aggressiveness Factors for Side Impacts,” U.S. Dept. of Trans., NHTSA, NAD-52 (January 1986). 38 Gardner, Greg, et al., “Fine-Tuning the Laws of Physics,” Ward's Auto World vol. 34, no. 4 (April 1998). 39 Lamm, John, “The Safety Story,” Road & Track Guide to the Volvo XC90, 2002, at 48. 40 See http://www.taxpayer.net/TCS/whitepapers/SUVtaxbreak.htm#10 (visited February 20, 2003), describing Section 280F(d)(5) of the Internal Revenue Code of 1986. 41 McCarthy, Sheryl, “Eliminate SUV Tax Giveaway Which Helps Rich and Busts Budget,” The Detroit News, Feb. 14, 2003. 42 Ball, Jeffrey, Lundegaard, Karen, "Quirk in Law Lets Some SUV Drivers Take Big Deduction," The Wall Street Journal, Dec. 19, 2002. 43 See Bradsher, Keith, High and Mighty: SUVs- The World’s Most Dangerous Vehicles and How They Got That Way, 2002, at 138. 43 NCSA, Characteristics of Rollover Crashes, April 2002, at 3. 44 See Bradsher, Keith, High and Mighty: SUVs- The World’s Most Dangerous Vehicles and How They Got That Way, 2002, at 112. 45 Id. at 112. (Financial analysts estimate profits of $12,000 for Ford’s Expedition SUV and $15,000 for the Ford Navigator.) Id. at 84 and 85. 46 See Bradsher, Keith, High and Mighty: SUVs- The World’s Most Dangerous Vehicles and How They Got That Way, 2002, at 112 (“Auto industry surveys show that one in six SUV owners us their vehicles at least once a year for towing, especially boats. Some owners, no more than one in 10 and perhaps fewer than one in 100, also use their SUVs for off-road driving.”). 47 Committee Report on S. 3005, The Traffic Safety Act of 1966, June 23, 1966, at 271, 273-74. 48See Blincoe, Lawrence J., et al, “The Economic Impact of Motor Vehicle Crashes 2002,” May, 2002, at Appendix A, DOT HS 809 446, (A comprehensive cost estimate combines both economic cost and values for “intangible” consequences, by estimating quality-adjusted life years lost. NHTSA estimates that the value of fatal risk reduction lies in the range of $2 to $7 million per life saved.). 49 See Id to reach the sum provided, (The death toll from SUV rollovers was 2,142 in 2001, according to NHTSA crash statistics. This figure is multiplied by the cost numbers used by NHTSA in its last annual report.). 50 Id.
Appendix A
Blaming Consumers for SUV Dangers Is Wrong on the Facts
The Alliance of Automobile Manufacturers has recently highlighted what it calls
the “shared responsibility” for safety. But the facts show that it is manufacturers’ shoddy designs, and not consumer misbehavior, that is to blame for the elevated deaths in SUV crashes.
In fact, federal government statistics show that the behavior of SUV drivers is
actually slightly better than that of passenger car drivers. SUV occupants have higher levels of seatbelt use, and lower levels of speeding and drinking while driving, than do occupants of passenger cars. Its unclear what more Detroit would have consumers do. SUV occupants are more likely that occupants of passenger cars to wear their seatbelts. • In 2002, SUV and van occupants were observed by federal researchers to be wearing
their belts 78 percent of the time, a rate slightly higher than the 77 percent of passenger car occupants who were belted.
• The rate at which SUV and van occupant belt use is growing is faster than the rate for passenger cars – between the fall of 1998 and June of 2002, belt use in SUVs and vans increased 11.4 percent while belt use in passenger cars only increased 8.5 percent. Source: National Center Statistics and Analysis, National Highway Traffic Safety Administration, Safety Belt and Helmet Use in 2002 – Overall Results, Sept. 2002, at 8.
SUV drivers are also less likely to speed in a fatal rollover crash. • Fifty-three percent of passenger car drivers were speeding when they got into fatal
single-vehicle rollover crashes, while 39 percent of SUV drivers were. • Speed is an important factor in the fatality of rollover crashes. In 2001, nearly three
quarters of all fatal rollovers took place where the speed limit was 55 miles per hour or higher. Yet rollover deaths in SUVs remain disastrously high. Source: National Highway Traffic Safety Administration, Characteristics of Fatal Rollover Crashes, DOT HS 809 438, April 2002, at 34.
SUV drivers are less likely to be drunk when they get involved in a fatal rollover. • Drivers of SUVs who were involved in fatal rollover crashes were less likely to have
a high positive Blood Alcohol Concentration than were drivers of passenger cars. Overall, 39 percent of passenger car drivers had a 0.10 BAC or more in a fatal rollovers while 27 percent of SUV drivers did. Source: National Highway Traffic Safety Administration, Characteristics of Fatal Rollover Crashes, DOT HS 809 438, April 2002, at 37.

Appendix B
16.4417.78
16.24
11.87
16.13
0
2
4
6
8
10
12
14
16
18
Occupant Fatality Rate Per 100,000
Registered Vehicles
Passenger Car SUV Pickup Truck Van Total
Vehicle Type
Source: NCSA, Characteristics of Rollover Crashes, DOT HS 809 438, (Apr. 2002) at 22.
Occupant Fatality Rates by Vehicle Type 1999 - All Crash Types
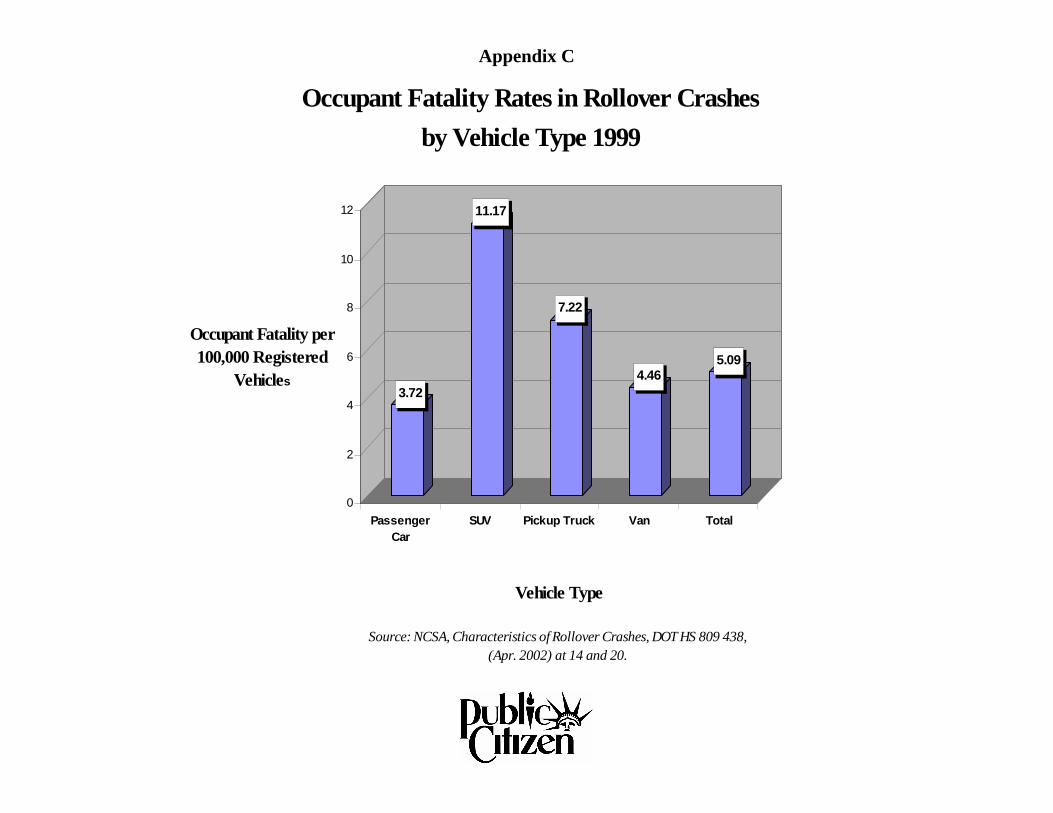
Appendix C
3.72
11.17
7.22
4.465.09
0
2
4
6
8
10
12
Occupant Fatality per 100,000 Registered
Vehicles
PassengerCar
SUV Pickup Truck Van Total
Vehicle Type
Source: NCSA, Characteristics of Rollover Crashes, DOT HS 809 438, (Apr. 2002) at 14 and 20.
Occupant Fatality Rates in Rollover Crashes by Vehicle Type 1999
Appendix D
Industry Falsehoods and Obstruction Have Delayed Development of Meaningful Rollover Crash
Protections for Thirty Years
GM Lied to NHTSA About the Need To Test Both Sides of Car Roofs
On January 6, 1971, NHTSA proposed a roof intrusion protection rule that would test both front corners of the roof on passenger vehicles. General Motors Corporation (GM) and the Automobile Manufacturers Association (which later became the Alliance of Autombile Manufacturers) argued in comments to the docket that testing both sides of the roof was unnecessary because it “in most cases roof structure damage is distributed to only one side of the roof in an actual rollover and that, because the roof is symmetrical it makes no difference which side of the roof is selected for testing.” NHTSA subsequently published a roof crush requirement, which remains in effect today that tests only a single side of the vehicle roof. Litigation in Lambert v. GM subsequently revealed documents showing that in testing following NHTSA’s proposal, in March of 1971, GM tested six production car bodies on both sides of the roof and five of the six failed to meet the test. NHTSA should at a minimum, do as it had initially proposed and require manufacturers to meet a test that applies a more real-world scenario by testing both the leading and following sides of the roof in a rollover crash. Industry Claims Passengers “Dive” Into Roofs, Yet Roof Strength Is Still Key
The auto industry has tried to obscure the engineering principles which would have emphasized maintaining survival space by arguing in court and to NHTSA that occupants "dive" into the roof. This ignores the obvious fact that if the seat structures and safety belts held occupants in place during a roll, and if the roof was strong enough to withstand the weight of the car, and the roofs were well padded, the head and spine of occupants would be far safer. In addition, safety engineer and attorney Don Slavik has shown through accident investigations that injuries among occupants directly correlates with the location of roof intrusion in the vehicle. Where there is roof crush, occupants are injured, and where someone remains uninjured, there is little or no roof crush.

GM Blames Belt Use Rates for Rollover Ejection Deaths and Ignores Safety Belt Design Flaws General Motors, in its press release following Dr. Runge’s recent statement, faulted occupant ejections and the lack of safety belt use for the high death rate in rollover crashes, claiming that, “according to NHTSA, of the 9,882 people killed in rollovers in the year 2000, 75 percent perished not because of the vehicle, but because they were unbelted and ejected from the vehicle.”1 Because decent crash protection could save many lives, this argument sidesteps the industry’s responsibility to better protect the 28 percent of belted occupants who perish needlessly in rollover crashes each year.
Of course, better crash protection, including roofs, doors, door latches and side windows and windshields, along with window curtain airbags, could keep ejection portals from opening in a rollover crash, helping to retain occupants inside the vehicle. GM also confuses causation with correlation: NHTSA never has concluded that those ejected were killed by the ejection. On the contrary, safety experts have argued that as many as half of those ejected may have been first injured or killed by roof intrusion within the vehicle prior to being ejected.2
Moreover, SUV and passenger car belt-use rates are virtually identical in fatal
rollover crashes, proving nothing about the safety of either type of vehicle. Sixty-eight percent of passenger car occupants and 69 percent of SUV occupants killed in fatal rollover crashes presumably were not using restraints.3 Far from proving that SUVs are safe and fatalities are the occupants’ fault, GM’s assertion shows the continuing failure to install safety design features that could save many lives. According to a major 2002 NHTSA study, 78 percent of SUV and van occupants use safety belts, while 77 percent of passenger car occupants did.4 Yet, in 2000, a whopping 61.7 percent of SUV occupant fatalities were attributable to rollovers, while 36.5 percent of van fatalities and only 22.0 percent of passenger car fatalities were.5 Obviously, seat belt use rates do little to explain the high death rates in SUV rollovers.
This statistical discrepancy also raises a question about the effectiveness of
current safety belts in rollover crashes. Because most are not constructed to stay tight, or “pretension,” during a rollover crash, safety belts do not offer the same degree of protection to occupants in these type of crashes. Research has shown that passengers may be ejected in a rollover despite the use of safety belts due to “inertial unlatching” during the roll.6 Despite the possibility of design flaws in most belts, crash investigators often assume that someone ejected in a rollover crash was unbelted, leading to under-reporting in the extent to which inertial-unlatching may occur.
Even occupants who are able to remain belted may slide free from their safety belt
during a rollover and be injured or killed. In one 1986 NHTSA simulation of a four-roll event at 60 miles per hour using typical safety belt designs, in seven out of seven tests, the test “occupant” slid out of the shoulder belt, permitting extreme torso flailing to

occur.7 Other research has confirmed that current safety belt design allows far too much movement by occupants to adequately protect them in rollover crashes.8 Congress should ask NHTSA to conduct further tests to measure the performance of safety belts in rollover crashes, and should require safety belts that will keep occupants in place during a rollover crash.
Of course, GM’s decision to blame belt use rates by consumers is fare easier—and far less effective-- than fixing SUVs through engineering changes available today. The real solution is to impose a meaningful roof crush standard, require rollover crash protection measures in all passenger vehicles, and establish a minimum standard for rollover propensity. Given the survivability of these crashes and the availability of lifesaving and limb-saving technology, NHTSA should have a goal of bringing the fatalities from rollover and roof crush to virtually zero, with the ultimate aim of achieving the same level of protection from injury and death for the public as is now enjoyed by professional race car drivers. 1 See press release by General Motors, by Jay Cooney, GM Safety Communications. Jan. 15, 2003 (GM notes, “72 percent of those killed in fatal rollover crashes were not using safety belts.” ). 2 See Comments of Public Citizen Regarding 49 CFR Part 571, Federal Motor Vehicle Safety Standards: Roof Crush Resistance at 9-11. 3 National Center for Statistics and Analysis, Characteristics of Rollover Crashes, April 2002, at 47. 4 National Center Statistics and Analysis, Safety Belt and Helmet Use in 2002 – Overall Results, September 2002, at 8. 5 National Center for Statistics and Analysis, Characteristics of Rollover Crashes, April 2002, at 14. 6 See Blick, et al, “Theoretical and Experimental Analysis of Inertial Release of Seat Belt Buckles,” AAAM (1996). 7 See NHTSA Research Paper, SAE 861876 (1986). 8 Rains, Elias, Mowrey; “Evaluation of Restraints Effectiveness in Simulated Rollover Conditions,” 98-S8-W-34 (1998).
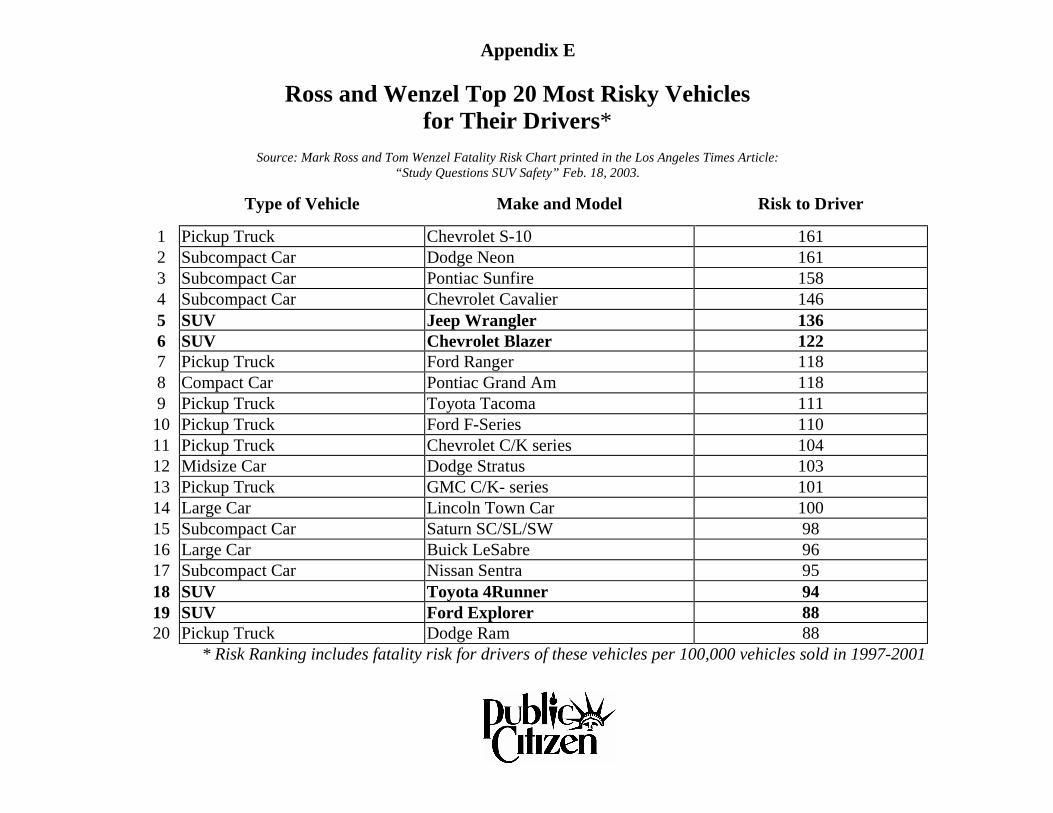
Appendix E
Ross and Wenzel Top 20 Most Risky Vehicles for Their Drivers*
Source: Mark Ross and Tom Wenzel Fatality Risk Chart printed in the Los Angeles Times Article:
“Study Questions SUV Safety” Feb. 18, 2003.
Type of Vehicle Make and Model Risk to Driver
1 Pickup Truck Chevrolet S-10 161 2 Subcompact Car Dodge Neon 161 3 Subcompact Car Pontiac Sunfire 158 4 Subcompact Car Chevrolet Cavalier 146 5 SUV Jeep Wrangler 136 6 SUV Chevrolet Blazer 122 7 Pickup Truck Ford Ranger 118 8 Compact Car Pontiac Grand Am 118 9 Pickup Truck Toyota Tacoma 111 10 Pickup Truck Ford F-Series 110 11 Pickup Truck Chevrolet C/K series 104 12 Midsize Car Dodge Stratus 103 13 Pickup Truck GMC C/K- series 101 14 Large Car Lincoln Town Car 100 15 Subcompact Car Saturn SC/SL/SW 98 16 Large Car Buick LeSabre 96 17 Subcompact Car Nissan Sentra 95 18 SUV Toyota 4Runner 94 19 SUV Ford Explorer 88 20 Pickup Truck Dodge Ram 88
* Risk Ranking includes fatality risk for drivers of these vehicles per 100,000 vehicles sold in 1997-2001
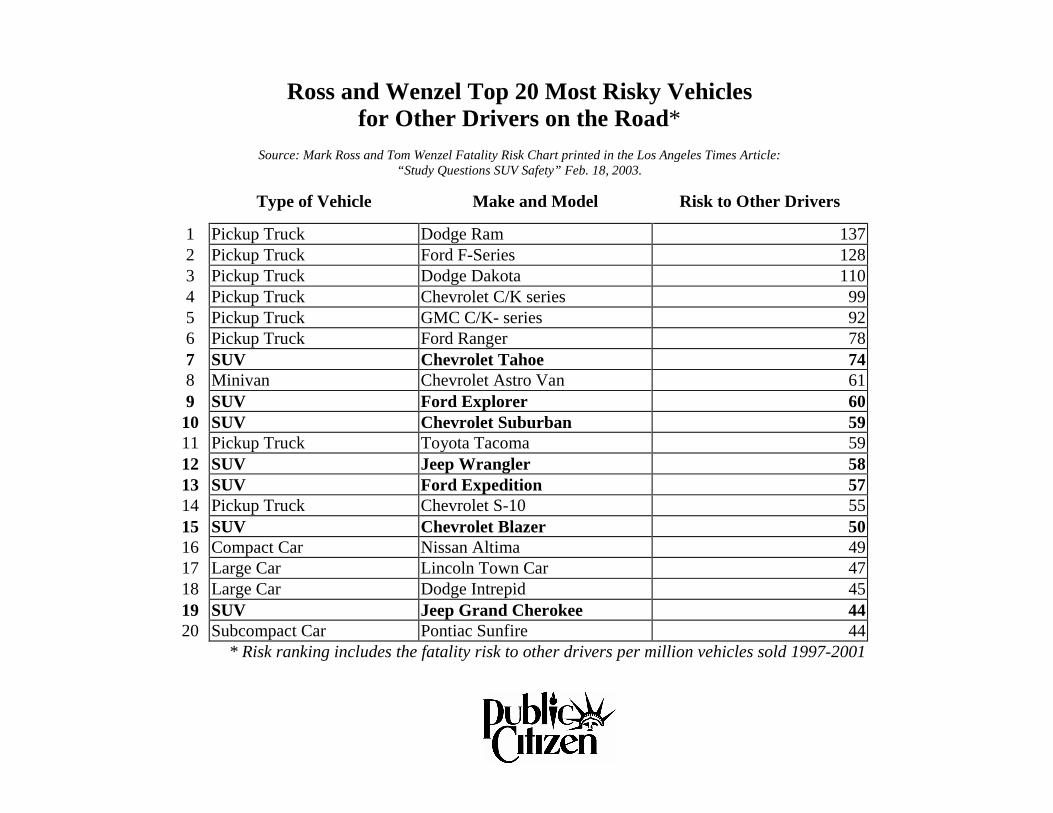
Ross and Wenzel Top 20 Most Risky Vehicles
for Other Drivers on the Road*
Source: Mark Ross and Tom Wenzel Fatality Risk Chart printed in the Los Angeles Times Article: “Study Questions SUV Safety” Feb. 18, 2003.
Type of Vehicle Make and Model Risk to Other Drivers
1 Pickup Truck Dodge Ram 1372 Pickup Truck Ford F-Series 1283 Pickup Truck Dodge Dakota 1104 Pickup Truck Chevrolet C/K series 995 Pickup Truck GMC C/K- series 926 Pickup Truck Ford Ranger 787 SUV Chevrolet Tahoe 748 Minivan Chevrolet Astro Van 619 SUV Ford Explorer 60
10 SUV Chevrolet Suburban 5911 Pickup Truck Toyota Tacoma 5912 SUV Jeep Wrangler 5813 SUV Ford Expedition 5714 Pickup Truck Chevrolet S-10 5515 SUV Chevrolet Blazer 5016 Compact Car Nissan Altima 4917 Large Car Lincoln Town Car 4718 Large Car Dodge Intrepid 4519 SUV Jeep Grand Cherokee 4420 Subcompact Car Pontiac Sunfire 44
* Risk ranking includes the fatality risk to other drivers per million vehicles sold 1997-2001

Appendix F
Auto Manufacturers Spend Billions Marketing SUVs to American Consumers
♦ SUV advertising rose nearly nine-fold from $172.5 million in 1990 to $1.5 billion in
2000.1 ♦ Automakers and their dealers spent $9 billion advertising the SUV from 1990 through
September 30, 2001.2 ♦ General Motors was the #1 advertiser in the U.S. in 2000 and 2001 spending
$3,945,000,000 in 2000 and $3,374,000,000 in 2001.3 ♦ The “Big Three,” ranked #1 for General Motors ($3,374,000,000), #3 for Ford
($2,408,000,000), #6 for Daimler/Chrysler ($1,985,000,000), and spent a combined $7,767,000,000 in 2001.4
♦ The automotive industry overall spent $14,490,700,000 in 2001 in total ad spending.5
Top Ten Advertisers of 2001 and Revenue per Advertising Dollar Expenditure6
2001 Rank Advertiser 2001 Spending Revenue per Advertising
Dollar Expenditure 1 General Motors $3,374,000,000 $39.20 2 Proctor & Gamble Co. $2,541,000,000 $8.00 3 Ford Motor Co. $2,408,000,000 $44.97 4 PepsiCo $2,210,000,000 $8.20 5 Pfizer $2,189,000,000 $9.10 6 DaimlerChrysler $1,985,000,000 $36.60 7 AOL Time Warner $1,885,000,000 $17.30 8 Phillip Morris $1,816,000,000 $28.70 9 Walt Disney Co. $1,757,000,000 $11.90 10 Johnson & Johnson $1,618,000,000 $12.50
1 See Bradsher, Keith, High and Mighty: SUVs- The World’s Most Dangerous Vehicles and How They Got That Way, 2002, at 112. 2 Id. at 112. 3 See AdvertisingAge’s 100 Leading National Advertisers: 47th Annual Report, June 24, 2002, at 3. 4 Id. at 3. 5 See AdvertisingAge’s Domestic Spending by Category: Ranked by measured U.S. expenditures in 2001 at http://www.adage.com/page.cms?pageId=916, visited February 19, 2003. 6 See AdvertisingAge’s Revenue Per Advertising Dollar Expenditure at http://www.adage.com/page.cms?pageId=915, visited February 19, 2003.
Appendix G
SUVs are Regulatory Renegades
SUVs are loophole vehicles across-the-board, but SUVs over 6,000 lbs. collect special exemptions like candy. These wasteful, dangerous vehicles are not held to some of the same crash safety standards as cars and are given outrageously exorbitant tax breaks — creating incentives to churn out more of them while public safety suffers. Special favors for Large SUVs: Side Impact Crash Protection
• Large SUVs are held to a less protective side impact standard than applies to cars. Roof Strength Protection
• Large SUVs need not meet any roof strength standard. Tax Breaks
• When businesses purchase an SUV (or other light truck) over 6,000 lbs., they can immediately deduct $25,000 off of the vehicle’s price.
• The Bush stimulus package of 2002 granted another 30 percent deduction off of the balance of a vehicle’s sticker price.
• The administration’s latest stimulus package seeks to raise the initial deduction up to 75,000 dollars.1 It would pay in full for every vehicle over 6,000 lbs. except the Hummer.
• These special interest tax breaks do not preclude businesses from taking the standard 20 percent deduction annually over five years.
Above 8,500 lbs., SUVs are also exempt from: Fuel Economy Standards
• Vehicles need not comply with the extremely low federal fuel economy standards for light trucks, nor must they report production numbers, miles-per-gallon, or total sales to regulatory agencies.
Emissions
• Currently all vehicles over 8,500 lbs are treated as medium duty passenger vehicles, which have significantly more lax emission requirements. Under EPA's Tier 2 rules, medium duty passenger vehicles (between 8,500 and 10,000 pounds) will be phased into the passenger vehicle emission requirements over time. Light trucks, as classified by EPA, also are permitted to emit more pollutants than cars, an exemption also currently scheduled for phase out.
Child Restraint Anchorage Systems • Requirements do not apply to vehicles greater than 8,500 lbs., meaning they need
not install anchorage systems to accommodate child restraints.
Below is a table of the SUVs eligible for luxury loophole tax breaks:
Sample List of Vehicles that Would Qualify for the SUV Tax Break2
Vehicle Model Weight (lbs.) Sticker Price 2003 Deductions without Bush tax break
Caddilac Escalade ESV 7200 $56,160 $38,710 Chevrolet Suburban 2500 8600 $41,280 $32,160 Tahoe 6800 $38,530 $30,955 Dodge Durango 6400 $33,280 $28,645 Ford Excursion 8900 $43,650 $33,205 Expedition 6650 $37,185 $30,360 GMC Yukon XL Denali 7200 $44,695 $33,665 Hummer H1 10300 $111,845 $63,210 H2 8600 $50,590 $36,260 Land Rover Discovery 6064 $37,995 $30,720 Range Rover 6724 $71,865 $45,620 Lincoln Navigator 4WD 7450 $51,960 $36,860 Mercedes M-Class 6283 $51,970 $36,865 Toyota Land Cruiser 6860 $53,915 $37,725 Sequoia 4WD 6600 $38,080 $30,755
1 McCarthy, Sheryl, “Eliminate SUV Tax Giveaway Which Helps Rich and Busts Budget,” The Detroit News, Feb. 14, 2003. 2Roder, Aileen, Moinster, Lucas, Taxpayers for Common Sense, http://www.taxpayer.net/TCS/whitepapers/SUVtaxbreak.htm#12, (visited on February 20, 2003)