Embed Size (px)
Citation preview

Statement ofRobert F. Hale
Assistant DirectorNational Security Division
Congressional Budget Office
before theSubcommittee on Conventional Forces and Alliance Defense
and theSubcommittee on Defense Industry and Technology
Committee on Armed ServicesUnited States Senate
March 17,1987
NOTICE
This statement is notavailable for public re-lease until it is deliveredat 2:00 p.m. (EST)Tuesday, March 17,1987.

Mr. Chairman, I am pleased to be here today to testify for the
Congressional Budget Office (CBO) on the pace of weapons production for
the Department of Defense (DoD). My testimony presents preliminary
results of a study being done at the request of the present Committee
Chairman.
Many DoD weapons are currently being procured at rates well below
maximum. Higher production rates would offer important advantages:
more weapons would get into the field more quickly, and unit and total
program costs would be lower. But higher production rates also have some
potential disadvantages. Key among them are higher near-term program
costs. These costs would probably require offsetting budget reductions,
including perhaps the deferral for a few years of new weapons systems with
accompanying delays in the benefits of their new technology. Thus, the
choice of how fast to produce DoD weapons involves trade-offs. My
testimony will illustrate the nature of these trade-offs—quantifying them
where possible.
PRODUCTION RATES IN RECENT YEARS
What constitutes a low rate of production? DoD defines three rates of
production:
o The maximum economic rate (point A in attached Figure) is

CO)E0)
DEFINITIONS OF ECONOMIC PRODUCTION RATES
V)o
CJ MinimumSustaining Rate (C)
Ok_
Q. MinimumEconomic Rate (B)
MaximumEconomic Rate (A)
1 1 1Production Rate

defined as the highest rate of production permitted by existing
(or planned) plant capacity, tooling, or test equipment.
o The minimum economic rate (point B) is the lowest production
rate that still offers an acceptable rate of return on the
investment made by the contractor and the government; it is
usually not the point with lowest unit cost, however, since unit
costs generally decline until the maximum rate is reached.
o The minimum sustaining rate (point C) is the lowest production
rate that can maintain an active production base and is often
associated with the minimum production using one shift of
workers five days a week, eight hours per day.
Attaching specific rates to each of these definitions involves considerable
judgment, particularly for the minimum economic rate. (Indeed, DoD has
decided not to require the reporting of minimum economic rates in the
future.) CBO has used the judgments of the services about these rates in its
analysis of past procurement trends.
For 40 major weapons systems, CBO compared actual production in
1983 to 1987 with these three target rates. There were indeed cases where
production was undertaken at or above DoD's definition of minimum
economic rates. Nineteen of the 40 systems (48 percent) had average rates
of production that met or exceeded their minimum economic rate over the
five years. Most of these systems are listed first in Table 1 and include such

TABLE 1. PRODUCTION RATES OF SELECTED WEAPONS, ACTUAL AND TARGET
1983-1987Annual Procurement Rates
Minimum a/ Maximum Average a/ b/
MinimumSustaining
Rate
MinimumEconomic
Rate
MaximumEconomic
Rate
Systems Bought at Higher Than Minimum Economic Kate
AH -64 Apache HelicopterMl Abrams TankM2 Bradley Fighting VehiclePatriot MissileStinger MissileF/A- 18 AircraftStandard Missile 2 c/Sparrow Missile d/B- IB BomberC-5B TransportF- 16 AircraftHellfire Missile d/Multiple Launch Rocket SystemF-14A AircraftKC - 10 Tanker/Cargo Aircraft
112790600287
1,95684
1,1501,700
108
1204,870
21,821158
138855716700
6,25084
1,3842,445
4821
1807,304
72,0002412
117825647485
3,53984
1,2382,015
3115
1556,131
49,905219
24360336240
1,20036
N/A600
124
721,200
24,000128
72720540240
1,80084
8401,200
244
1081,500
36,000128
1441,080
792840
11,520145
1,3243,804
4824
3246,720
72,0009624
Systems Bought Below Minimum Economic Rate
AV-8B AircraftA -6E AircraftF- 15 AircraftGround Launched Cruise MissileHarpoon MissileMX MissileP-3C AircraftPhoenix MissileSH - 60B Lamps HelicopterTomahawk Missile
216
367696125
1081751
461148
120354219
26527
315
348
4199
267178
22221
184
306
48120180126
10821
120
SOURCE: Compiled by the Congressional Budget Office from Department of Defense, Procurement Summary (P- 1),
3612
1201203602116
24060
300
various years.
7272
1446006604824
42060
540
a. Excludes initial two years of production.b. Average over years within the period 1983-1987 when the system was actually procured.c. Combined procurement of medium-range and extended- range versions.d. Combined procurement of all services.

programs as the Ml tank, Bradley Fighting Vehicle, Apache helicopter,
F/A-18 aircraft, Sparrow missile, B-1B bomber, C-5B transport, and the
F-16 aircraft. Fifteen of these 19 systems were bought at or above their
minimum economic rate in every year of the 1983-1987 period. (Since it
normally takes some time for a production program to reach its economical
rate, CBO overlooked low rates in the first two years of production in this
and subsequent assessments.)
On the other hand, only four of the 40 systems ever reached their
reported maximum economic production rate and then for only a few of the
five years examined. Indeed, for the systems shown in Table 1, production
averaged only about 50 percent of the maximum rate.
Moreover, fully 21 systems (53 percent of the 40) reviewed by CBO
were procured at average rates below their minimum economic rate, and 9
of these 21 systems never achieved their minimum economic rate in any
year during the 1983 to 1987 period. This number would be higher except
that minimum economic rates reported by the services are sometimes very
low. For example, the Navy reported that the minimum economic rate for
three aircraft-the E-2C Hawkeye, EA-6B Prowler, and SH-2F Seasprite-is
only six per year.
Finally, procurement rates for certain systems sometimes fell below
their minimum sustaining rate. Nine of these 40 systems were procured at
levels below that rate during at least one year in the 1983 to 1987 period.
These low rates run counter to DoD policy. In 1981, DoD put forth a
set of directives collectively known as the Department of Defense
Acquisition Improvement Program (better known as the Carlucci Initiatives).

One of these initiatives was to achieve more economical rates of production
for selected systems. Of the 40 systems CBO reviewed, 32 were on DoD's
target list.
The low rates also occurred despite a relatively favorable budget
climate. Over the 1983 to 1987 period, total funds appropriated for the
procurement of weapons systems increased greatly compared with the
preceding five-year period. In constant 1988 dollars, funds in 1983 to 1987
were 73 percent greater than those in 1978 to 1982 (for details, see Table
A-l in the appendix to my testimony). Weapons were also procured in
greater numbers than in previous years, though percentage increases in
numbers were often less than those in dollars. Nonetheless, rates of
production were frequently quite low, suggesting that this problem will get
worse if budget growth remains low or even negative.
Program managers generally planned to procure systems at higher
rates, but program stretch-outs were common. For the 40 systems discussed
above, CBO examined production in 1983 to 1987—first as DoD planned it in
1983, then at the levels DoD requested in each of the years, and finally at
the levels actually produced (Table A-2 shows details). As DoD revised its
budget each year, procurement of many systems tended to fall from planned
levels. On average, DoD asked the Congress to approve production of only
88 percent of what they planned to buy as of 1983. Actual procurement
averaged 84 percent of those original plans. For 24 of the 40 systems, the
sum of DoD's requests fell below its plans as of 1983--and sometimes well
below.

Failure to meet planned rates in some cases resulted from
developmental or production problems. The AMRAAM missile, for instance,
was delayed two years in development; production of several missiles was
halted to resolve quality control concerns. In many other cases, budget cuts
probably led to the stretch-outs.
DoD's latest budget request shows more examples of rate cuts. Of the
20 largest DoD weapons programs, 10 have requested rates in 1988 that are
lower than planned as of a year ago. Four of those requested rates would
put the systems below their minimum sustaining rate.
PROS AND CONS OF HIGHER PRODUCTION RATES
Should DoD produce weapons at higher rates? Certain disadvantages must
be weighed against the merits of higher rates.
Disadvantages of Higher Production Rates
The most imporant disadvantage of higher production rates is the delay or
cancellation of new weapons systems that would almost certainly be needed
to pay for the higher rates. As I will note later, higher production rates
often lower the cost per unit of a weapon. But producing 100 items rather
than 50 in a particular year will almost always increase the total funding
required in that year. Even if unit costs are lower, the higher numbers more
than offset reduced costs per weapon. With a fixed budget, these higher

program costs would have to be offset. That could be accomplished by
reducing numbers of forces or readiness, but such a proposal seems unlikely
to find favor. More likely, added costs would have to be offset by canceling
or deferring new weapons. This approach would delay putting those new
weapons-which are almost always technologically more advanced--in the
hands of U.S. fighting forces.
Higher rates have other potential disadvantages as well, though they
often apply only in specific circumstances. DoD has been emphasizing the
development of a second contractor for many missile programs, since
experience has shown that competitive pressure often leads to lower prices.
But this policy requires diverting orders from the first contractor to qualify
the second source, reducing the production rate for the former just when it
has the potential to shift to a high rate of production. A comparison of
savings using a second source with the potential savings from higher
production rates is a subject for separate analysis, but the trade-off is
evident.
Higher production rates may also increase costs of modifications.
Even a successful weapons system undergoes many modifications over its
lifetime. It is usually cheaper to incorporate these modifications as units
are produced. With high production rates, more systems may have to be
recalled for modifications, a costly procedure. High production rates also
limit the option to cancel a system if, for example, it became obsolete.
Finally, high rates may make it more difficult to maintain active
producers. Higher production rates mean shorter production periods, if
acquisitions are fixed. Shorter periods would increase the likelihood of a
8

production gap, because procurement of one generation of weapons might
end before development of the next generation is completed. Yet, in order
to facilitate transition to the next generation of weapons, it is important to
keep together the accumulated knowledge and skills of engineers and key
production managers. The ideal solution, of course, would be to buy existing
systems quickly and efficiently and then move on to new ones. Short of this,
foreign military sales might help to fill production gaps without sacrificing
production efficiency.
Advantages of Higher Rates
While there are disadvantages to higher production rates, there are also
compelling reasons for DoD to support them. Higher production rates mean
more systems could be deployed sooner. Theater commanders emphasize
that they are short of critical "war-stoppers"—modern munitions capable of
blunting an enemy attack. They explicitly mention items such as the
Sparrow, Sidewinder, High Speed Antiradiation Missile (HARM), Maverick,
MLRS~systems for which production rates are an issue.
Higher production rates would also limit the effects of technological
obsolescence that can overtake a weapon system before large numbers are
in the hands of U.S. forces. Table 2 shows the number of years that would
be required to meet DoD objectives for acquiring 26 selected weapons
systems assuming that procurement rates planned for 1989 continue. The
table also shows the number of years these systems have already been in

TABLE 2. YEARS TO ACQUIRE SELECTED MAJOR WEAPONS SYSTEMS
TotalProgram
System Quantity
AMRAAM Missile b/ 24 , 320AV-8B Aircraft ~ 328A-6E/F 345CH/MH-53E Helicopter 153E-2C Aircraft 141EA-6B Aircraft 80F-14A/D Aircraft 710F- 15A/D/E Aircraft 1 , 266F - 16A/B/C/D Aircraft 2 , 729F/A- 18 Aircraft 1,157HARM Missile b/ 14,619Harpoon Missile 3,971Hellfire Missile c/ 48,696IIR Maverick Missile d/ 60,664Ml Tank 7,844M2 Fighting Vehicle 6 , 882Multiple Launch Rocket
System 440,322MX Missile 223Patriot Missile 6,452Phoenix Missile 7 , 204SH-60F Aircraft 175Standard Missile 2 14 , 677Stinger Missile c/ 50 , 370Tomahawk Missile 3 , 994TOW 2 Missile c/ 125,856UH- 60 Helicopter c/ 1,111
SOURCE: Computed by the Congressional
Neededto
Complete
24,140148150323042
132342
1,230580
7,098886
27,61450,7442,0862,549
180,000157
3,6025,904
1689,375
31,6312,958
48,623252
Budget Office
Yearsin
Production
16
1811184
17151097
136698
84881
121087
11
based on DoD
Procurement Rates1988
63032121466
1242
18084
2,514124
5,0002,100
600616
72,00021
71543018
1,1504,200
4759,416
61
data contained in
Years to1989 Complete a/
1,80032181469
1242
18072
2,659138
4,0001,900
534618
36,00021
81556018
1,6355,000
5108,719
72
Congressional
1459355
11978377
2744
485
111067664
Data Sheets,
TotalYears
15112714239
28241717102013331312
12121319111817141315
SelectionAcquisition Reports, and Procurement Summary (P- 1).
a. Based on 1989 rate.b. Combined Air Force- Navy procurement.c. Army procurement only.d. Air Force (AGM - 65D/G) version only.

production. If planned 1989 rates continue, it will have taken an average of
16 years since production began to meet DoD's objectives for acquiring
these systems; for 6 of the 27 systems, it would take 20 years or more.
While many of these systems have been modified during these long
production periods, there are limits to what these modifications can do to
meet increasing foreign threats. Completing the acquisition of these
systems sooner would make room in future budgets for new weapons.
There are also good business reasons for maintaining high production
rates. CBO discussed these with a number of defense contractors. They
emphasized the following points:
o Once the basic investment in tooling and test equipment has
been made, there are clear economies of scale in producing at
higher rates.
o Program stretch-outs are disruptive. Sometimes they involve
laying off trained and experienced workers. They also add to
costs by forcing contractors to store long-lead items already
bought. In many cases, engineering changes may make these
stored items obsolete or require reworking before they can be
used.
o Low production rates limit the incentive to invest in techniques
to save labor and material, since it is difficult for the contractor
to recover its investment,
o Low production rates discourage potential suppliers and
11

subcontractors from competing for defense business, thus adding
to these costs.
All these points suggest that higher production rates could reduce the costs
of defense systems. Let me now discuss the potential magnitude for such
savings.
ANALYSIS OF EFFECT OF PRODUCTION RATE ON UNIT COSTS
CBO estimated the effects of production rates on the real (inflation-
adjusted) unit costs for 13 selected missile and aircraft systems. The
analysis relies on results from contractors, the military services, and CBO's
own analysis of budget data. CBO found that increasing production rates by
50 percent would decrease real unit costs by from 5 percent to more than 25
percent, depending on the system. In the extreme case, according to the Air
Force, unit costs for the MX missile would be reduced by 29 percent, if it
were produced at the minimum economic rate of 21 missiles per year (see
Table 3). Tactical missiles, such as IIR Maverick and Phoenix, offer
potential savings of 12 percent to 20 percent, were production rates
increased by 50 percent. Mature aircraft programs, such as the A-6 and
F-14, appear to offer lower potential for cost reduction. Even for these
programs, however, savings of 5 percent to 10 percent appear feasible if
production rates increase by 50 percent.
Unit cost reductions result from a combination of factors. Reductions
are realized by spreading fixed production costs (such as plant overhead)
12

TABLE 3. ESTIMATES OF THE EFFECT OF PRODUCTION RATE ON UNIT COST FORSELECTED SYSTEMS
CO
Production Rate Increase
SystemFiscal Year 1988
Quantity Requested
PercentIncrease
in Quantity
PercentDecrease
in Unit Cost Source for Estimated Rate Effect
AH -64A-6FC-17CH/MH-53EE-2CEA-6BF-14DF-15EKC-135R
AMRAAMII R MaverickMX MissilePhoenix
67122
14667
4236
6302,100
21430
Aircraft
455050435050504344
Missiles
33506050
510 a/22
71255
113
13122919
McDonnell Douglas Helicopter Co.GrummanU.S. Air ForceCBOGrummanCBOCBOU.S. Air ForceU.S. Air Force
U.S. Air ForceU.S. Air ForceU.S. Air ForceHughes
SOURCES: Congressional Budget Office; McDonnell Douglas Helicopter Company; Grumman Corporation; U.S. Air Force;Hughes Aircraft Company.
a. Estimated based on cost relationship for earlier A - 6E model.

over a larger number of units. Economies result from quantity discounts on
purchases of parts and components. Labor savings are achieved by assigning
a larger crew of workers more specific tasks, allowing them to be more
proficient, and avoiding delays associated with changing jobs. Similar
savings are possible in the use of machinery, since a larger number of units
can be run off more economically once a machine has been set up to
perform a given task. If production rates warrant, special purpose machines
may be acquired to perform tasks more efficiently than is possible with
general purpose tools.
Discounting can offset the unit cost advantages of higher production
rates, though usually only partially. Raising production rates involves
spending more money now in order to achieve savings later. But future
savings are worth less when expressed in terms comparable to near-term
costs. Economists usually use the discount rate to achieve this
comparability. CBO's preferred discount rate is 2 percent in real terms,
which means that $1 saved today is comparable to $1.02 saved next year.
At a rate of 2 percent, higher production rates still lead to savings for a
number of weapons systems (see Table A-3 for examples). By direction of
the Office of Management and Budget, DoD uses a real discount rate of 10
percent in cost-benefit analyses. At that rate, many fewer systems would
show long-term savings if bought at higher production rates.
Even ignoring discounting, not all systems showed unit cost reductions
with higher production rates. Program managers and contractors supplied
CBO with a few examples (the Sparrow missile, KC-135R modification
14

program) that showed limited effects when production rates were increased.
CBO's own statistical analysis of budget data revealed more examples.
Indeed, fewer than half the systems CBO examined using budget data
revealed significant rate effects, perhaps because these effects are
obscured by other factors-such as system modifications and support costs.
A BUDGET ALTERNATIVE THATACHIEVES HIGHER PRODUCTION RATES
As my discussion suggests, there are many trade-offs involved in electing
higher production rates. More weapons would be in the hands of fighting
forces sooner and at lower unit costs, but near-term costs would be larger,
which might require deferral of new weapons. To illustrate these effects,
CBO formulated a budget alternative which assumed that, over the next five
years, production rates for 12 major DoD weapons would be increased
significantly. The 12 illustrative systems cover all the services and most
major types of weapons; they include two aircraft, three helicopters, five
missiles, and two combat vehicles. Table 4 lists the weapons and the
increases considered for each.
Increasing production of these weapons would make many more of
them available to U.S. forces. Compared with the Administration's plans for
the next five years, this alternative would buy an additional 1,263 modern
aircraft, 34,252 latest-generation missiles, and 3,109 new combat vehicles
15

TABLE 4. COSTS AND EFFECTS OF ACCELERATING PRODUCTION OF SELECTED WEAPONS SYSTEMS(Costs in billions of dollars)
Number of Units AcquiredThrough 1992
System
AH -64 ApacheF-15E EagleF/A- 18 HornetSH-60FCV HelicopterUH-60ABlackhawk
Total, Aircraft
HARMHarpoonIIR MaverickStandard Missile 2Stinger
Total, Missiles
Ml Abrams TankM2 Bradley Fighting
Vehicle
Total, CombatVehicles
Total Cost of AllAdditional Systems
Administration's AlternativePlan Plan
59326094985
1,111
2,998
14,6193,971
25,8203,973
43,939
92,322
7,844
6,882
14,726
Aircraft
1,102392
1,157175
1,435
4,261
Missiles
23,5424,599
43,4204,643
50,370
126,574
Combat Vehicles
9,718
8,117
17,835
AdditionalUnits Purchased
Number
50913220890
324
1,263
8,923628
17,600670
6,431
34,252
1,874
1,235
3,109
Percent
86512210629
42
6116681715
37
24
18
21
Added Costs1988
0.30.50.2
a/0.2
1.2
0.20.10.4
a/0.1
0.8
a/
a/
a/
2.0
1988-1992
6.05.16.01.51.6
20.2
2.10.61.60.30.3
4.9
4.2
1.5
5.7
30.8
SOURCE: Congressional Budget Office,
a. Less than $50 million.

(see Table 4). Many of these systems have been cited by Unified
Commanders as critical items in short supply.
These faster purchases would speed attainment of service goals for
modernizing and sustaining U.S. forces. The alternative plan would, for
example, attain the Army's entire goal for attack helicopters by 1992
because it buys 86 percent more Apache helicopters than the Administration
plans. (For purposes of determining portions and goals that are met, all
weapons purchased by 1992 are assumed to have entered the inventory.)
Increasing Ml purchases by 1,874 tanks would mean that 95 percent of the
Ml tank objective would be met compared with 76 percent under the
Administration's plan. Plans to modernize tactical aircraft forces would be
substantially accelerated, often meeting objectives fully by 1992.
Accelerated purchases of missiles under the alternative would improve the
war reserves of these critical items as well.
The total cost of buying the weapons would also be less under this
alternative than the cost of buying the same number under Administration
plans. Typically, this alternative accelerates production over planned rates
by between 40 percent and 100 percent. The preceding discussion of unit
costs suggests that real costs could be lower by between 4 percent and 50
percent, depending on the system. (These reductions are only partially
reflected in CBO's cost analysis because of difficulties of translating the
unit cost reductions discussed above into long-term budget plans.)
While it is eventually cheaper to buy at high rates, more funding is
required in the near term. In 1988, these higher buy rates would add $2.0
17
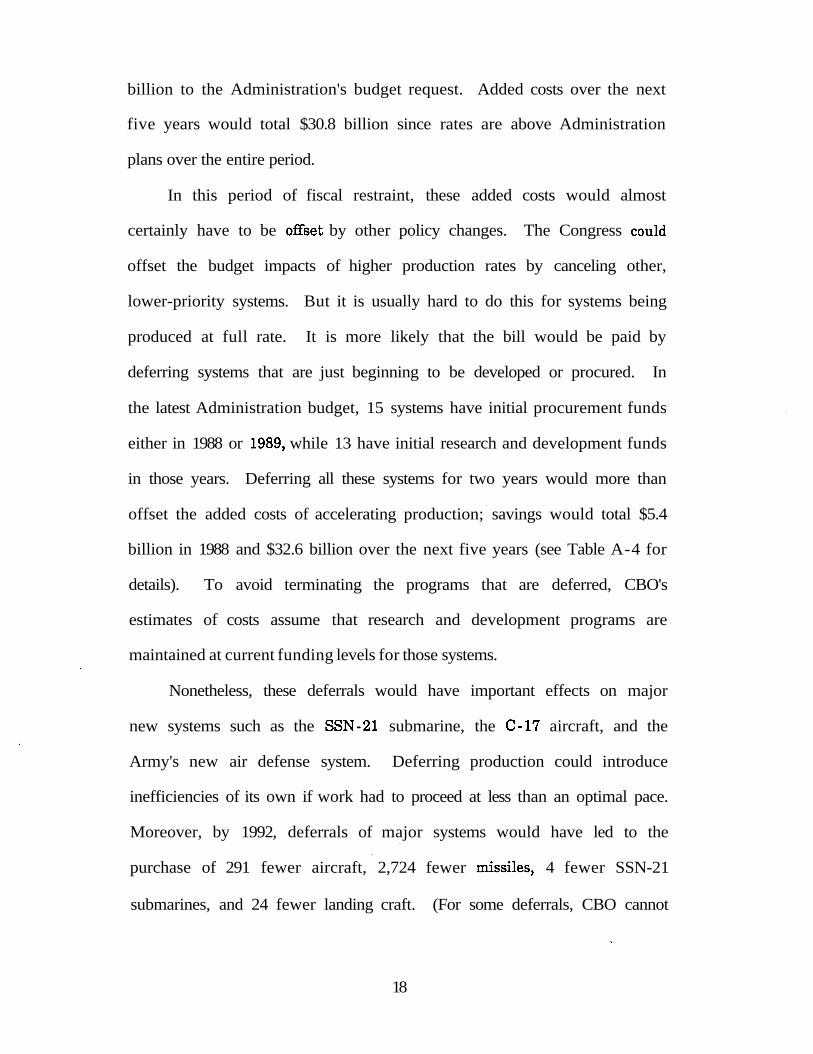
billion to the Administration's budget request. Added costs over the next
five years would total $30.8 billion since rates are above Administration
plans over the entire period.
In this period of fiscal restraint, these added costs would almost
certainly have to be offset by other policy changes. The Congress could
offset the budget impacts of higher production rates by canceling other,
lower-priority systems. But it is usually hard to do this for systems being
produced at full rate. It is more likely that the bill would be paid by
deferring systems that are just beginning to be developed or procured. In
the latest Administration budget, 15 systems have initial procurement funds
either in 1988 or 1989, while 13 have initial research and development funds
in those years. Deferring all these systems for two years would more than
offset the added costs of accelerating production; savings would total $5.4
billion in 1988 and $32.6 billion over the next five years (see Table A-4 for
details). To avoid terminating the programs that are deferred, CBO's
estimates of costs assume that research and development programs are
maintained at current funding levels for those systems.
Nonetheless, these deferrals would have important effects on major
new systems such as the SSN-21 submarine, the C-17 aircraft, and the
Army's new air defense system. Deferring production could introduce
inefficiencies of its own if work had to proceed at less than an optimal pace.
Moreover, by 1992, deferrals of major systems would have led to the
purchase of 291 fewer aircraft, 2,724 fewer missiles, 4 fewer SSN-21
submarines, and 24 fewer landing craft. (For some deferrals, CBO cannot
18

determine the reduction in quantity, since procurement plans are still
indefinite or classified.) Perhaps most important, deferrals would delay the
planned buildup in these weapons by two years, and so would postpone the
benefits of improved technology.
Thus, this illustrative example highlights a key trade-off. Maintaining
higher production rates for current weapons may well delay the benefits of
the newest technology for a few years. This disadvantage must be weighed
against the disadvantage inherent in current plans; these plans leave today's
forces with many old weapons, while waiting until budgets permit the
newest weapons to be purchased in large numbers.
The trade-off, however, need not be as far-reaching as this alternative
depicts. This alternative involves large numbers of deferrals coupled with
large increases in production rates. The Congress could garner some of the
benefits of higher rates, while also deferring fewer new systems, under a
more modest approach that involves fewer systems.
CONCLUSION
In summary, Mr. Chairman, DoD often buys weapons below its target rates.
Of 40 major systems examined by CBO, nine had production below minimum
sustaining rates sometime in 1983 to 1987; overall production averaged
about 50 percent of maximum rates. The situation continues in the 1988
budget and could grow worse if overall budget limits hold down future
19

defense spending. Higher production rates, however, require more near-
term funds. Finding these funds would almost certainly necessitate
offsetting policy changes such as the deferral of new weapons, which would
delay the benefits of the newest technology for a few years. This
disadvantage must be weighed against the clear advantages offered by
higher production rates: they get weapons in the field more quickly,
replacing old systems with reasonably modern ones, while also lowering unit
costs of production.
20

SUPPLEMENTARY TABLES
21

TABLE A-l. QUANTITIES AND COSTS OF SELECTED MAJORWEAPONS SYSTEMS(Costs in billions of constant 1988 budget year dollars)
Systems
Fixed Wing AircraftCombatAirliftTrainer
Rotary WingAircraft
Total AircraftTotal Cost
Fiscal Years1978-1982
2,188150177
819
3,33459.9
Fiscal Years1983-1987
Aircraft
2,196248
85
1,378
3,907106.0
Increase/Decrease (-)
898
-92
559
57346.1
PercentChange
a/65
-52
68
1777
Missiles
Strategic TheaterNuclear
Tactical
1,840 2,425
Tracked Vehicles
585
SOURCE: Department of Defense Procurement Summaries.
a. Less than 0.5 percent.b. Excludes MLRS rounds.
32
r-launchedirface launched b/
Total MissilesTotal Cost
24,61795,564
122,02123.5
68,060105,816
176,30140.0
43,44310,252
54,28016.5
17611
4470
Heavy CombatVehicles
Light CombatVehicles
Other Vehicles
Total VehiclesTotal Cost
Grand Total Cost
4,324
2,8721,487
8,68311.5
94.9
7,358
2,6712,906
12,93518.6
164.6
3,034
-2011,419
4,2527.1
69.7
70
-795
4962
73
22

TABLE A-2. PLANNED AND ACTUAL PROCUREMENT RATES FOR SELECTED SYSTEMS
N>co
1983-1987 Budgets
System
EA-6B AircraftP-3C AircraftSidewinder MissileLaser Maverick MissileAH -64 HelicopterTOW 2 MissileE-2C AircraftF-16C/D AircraftKC-10A AircraftUH- 60 HelicopterMultiple Launch Rocket
SystemB-l BomberC-2A AircraftC-5B AircraftEH -60A HelicopterGround Launched Cruise
MissileCH/MH-53E HelicopterHARM MissileHarpoon MissileM2 Fighting VehicleMl TankA -6E AircraftAV-8B AircraftF/A- 18 AircraftSM- 2 MR MissileSparrow MissileF-14A AircraftHellftre Missile
PlannedProcurement a/
3026
8,3183,490
43567,510
3072042
414
254,11299395066
49561
7,4161,5913,8975,096
52216552
3,75013,705
14430,958
SumofDoDRequests
4238
9,8274,155
59295,304
3078644
414
254,11299415366
53160
8,4621,4893,4963,896
37170456
2,7059,312
10523,885
Percent ofPlan
140146118119138141100109105100
100100105106100
10798
11494907671798372687377
QuantityApproved
4438
10,6114,175
51577,412
3477444
426
254,11299395066
49560
7,2741,3353,2334,125
42168420
2,75910,099
10522,363
Percent ofPlan
147146128120118115113108105103
100100100100100
100989884838181787674747372
(Continued)

TABLE A-2. (Continued)
1983- 1987 Budgets
System
Patriot MissileSM- 2 ER MissileSH-2F HelicopterSH-60B HelicopterPhoenix MissileE-6A AircraftTomahawk MissileF-15D AircraftStinger MissileIIR Maverick MissileMX MissileAMRAAM Missile
Average
PlannedProcurement a/
3,7422,525
72186
1,9369
1,720390
36,04735,410
2263,639
SumofDoDRequests
2,7711,550
48122
1,2685
997234
20,00018,664
145524
Percent ofPlan
746167666556586055536414
88
QuantityApproved
2,4271,480
42107
1,1085
928207
17,69710,334
66180
Percent ofPlan
65595858575654534929295
84
SOURCES: Department of Defense, Procurement Summary (P- 1) (various years) and Congressional Data Sheets.
a. As of February 1982 Five-Year Defense Plan.

toen
TABLE A-3. EFFECTS OF DISCOUNTING ON COSTS UNDER HIGHER PRODUCTION RATES(Costs in millions of 1987 dollars)
Average AnnualProduction Rates
System
CH/MH-53 Helicopter
F-15E Arcraft
F-14D Aircraft
EA-6B Aircraft
January1986Plan
14
48
31
12
CBOAlternative
18
84
56
24
Added Costsof CBO Plan
160 a/
4,250 b/
4,930 c/
730 a/
GrossSavings
280
4,860
5,630
1,020
Net ofAddedCosts
120
610
700
290
Long-Term SavingsPercent ofTotal Cost
of CBOAlternative
11.3
4.9
5.4
12.3
DiscountedSavings
2 Percent 10 Percent
100
330
260
240
60
-380
-750
90
SOURCE: Congressional Budget Office.
a. Through 1989.b. Through 1991.c. Through 1994.
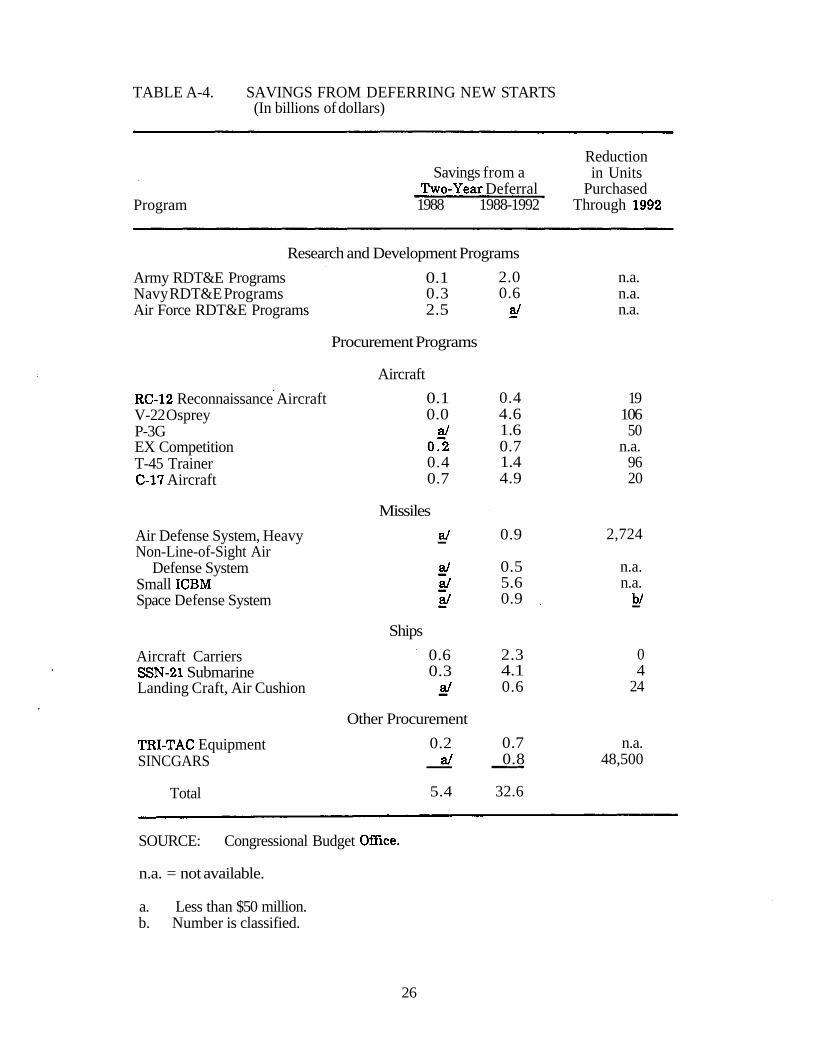
TABLE A-4. SAVINGS FROM DEFERRING NEW STARTS(In billions of dollars)
Savings from aTwo- Year Deferral
Program 1988 1988-1992
Reductionin Units
PurchasedThrough 1992
Research and Development Programs
Army RDT&E ProgramsNavy RDT&E ProgramsAir Force RDT&E Programs
RC-12 Reconnaissance AircraftV-22 OspreyP-3GEX CompetitionT-45 TrainerC-17 Aircraft
Air Defense System, HeavyNon-Line-of-Sight Air
Defense SystemSmall ICBMSpace Defense System
Aircraft CarriersSSN-21 SubmarineLanding Craft, Air Cushion
TRI-TAC EquipmentSINCGARS
Total
0.10.32.5
Procurement Programs
Aircraft
0.10.0
a/0."20.40.7
Missiles
a/
a/a/a/
Ships
0.60.3
a/
Other Procurement
0.2a/
5.4
2.00.6
a/
0.44.61.60.71.44.9
0.9
0.55.60.9
2.34.10.6
0.70.8
32.6
n.a.n.a.n.a.
1910650
n.a.9620
2,724
n.a.n.a.
b/
04
24
n.a.48,500
SOURCE: Congressional Budget Office,
n.a. = not available.
a. Less than $50 million.b. Number is classified.
26