Embed Size (px)
Citation preview

Testing Reverse Osmosis Membranes Against Time and Wear - Grant Proposal
Image: Photo by Lowell, Spencer. Article written by Atherton, Kelsey D. “In Photos: Dubai’s Massive Desalination Plant.” Popular Science, Popular Science, 17 Feb, 2017.
iCons 1 - Independent Case Study
Team M
Emily Laus, Niamh Lyons, Jill Taylor
2
Table of Contents
Project Summary…………………………………………………………………………………..3
Background………………………………………….…………………………….…….………...4
Methods……………………………………………………………………….……...…………....6
Overview of Study Design………………………………………….……………………..6
Data Collection Procedures………………………………………….…………………….8
Design of RO Testing System………………………………………….………………...10
Potential Sources of Error………………………………………….………………..…...13
Assumptions………………………………………….………………..………………....13
Data Analysis………………………………………….………………..……………......15
Anticipated Results………………………....……………………………………………………15
Timeline………….………………………....……………………………………………………18
Materials & Budget………………………....……………………………………………………19
Key Personnel………………………....……………………………………………………....…21
Relevance of Proposed Study & Broader Impacts………………………....…………………….22
Relevance of the Proposed Study………………………………………………………..22
Broader Impacts………………………………………….………………………………24
Glossary………………………………………….………………………………….…………...25
References……………………….....……………………………………………………...…......26

3
I. Project Summary
Pertaining to reverse osmosis, how effective are graphene oxide membranes compared to
membranes commonly used in industries today (specifically thin-film composite and cellulose
acetate) in terms of their desalination abilities and longevity?
In order to answer this question, we propose a study comparing four different types of reverse
osmosis membranes using water of varying salt concentrations. We will be testing two
membranes that are more commonly used in industries today (cellulose acetate and thin-film
composite), as well as two graphene oxide membranes (one with the addition of negatively
charged ions and one without).
Based on our current knowledge and understanding of reverse osmosis membranes, we predict
that the graphene oxide membranes will be the most effective due to their high water
permeability and ability to repel ions. Furthermore, we expect the graphene oxide membrane
with the negatively charged ions added to the structure to ultimately be the most effective in
terms of its ability to repel ions, thus we expect it to decrease water salinity more than any other
RO (reverse osmosis) membrane that we test.
Being able to answer our proposed question will not only impact the global scientific
community, but it will benefit the world as a whole; by providing new knowledge of the
effectiveness of reverse osmosis membranes, both industries and consumers can be informed
4
about the ideal materials for reverse osmosis. Using this research, we can optimize the process of
reverse osmosis to provide clean, fresh water around the planet.
II. Background With the continuous increase in human population and global pollution, scarcity of fresh and
clean water is becoming a more prevalent issue by the day. Globally, more than 1 out of 10
people lack access to clean drinking water, and more than 800 children under the age of 5 die
each day due to drinking unsanitized water (Reid 2020). In order to address issues such as these,
we need to be able to utilize the finite amount of water on our planet. Furthermore, if we can
purify water that is currently not safe for human consumption in an effective and affordable way,
we can hope to sustain life around the world as a whole.
A common means used globally to secure fresh water is desalination, a process that removes salt
from saline water (sea water) in order to make it safe to drink (“Desalination” 2020). There are
over 20,000 industry-level desalination plants around the world, and the top six produce over 4.5
million cubic meters (equivalent to over 1.2 billion gallons) of water per day through the use of
desalination (Aquatech 2019). (For comparison, the average person in the United States uses
around 80-100 gallons of water per day, meaning that the desalinization production from the top
six plants could support over 12 million U.S. citizens (“Water Q&A” 2020).)
In particular, one of the methods used around the world to achieve desalination is reverse
osmosis. Arid countries such as Saudi Arabia, the United Arab Emirates, and Israel rely on

5
reverse osmosis as one of their essential means to attain clean and fresh water (Aquatech 2019).
Membranes that are commonly used for reverse osmosis today -- such as cellulose acetate
membranes and thin-film composite membranes -- are made of polyamides (Elimelech 1997).
The main differences between these membranes are their chlorine tolerance. For example, the
cellulose acetate membrane is chlorine tolerant and not susceptible to fouling from bacteria, but
it does not reject as much salt as a thin-film composite membrane (Elimelech 1997). Meanwhile,
the thin-film composite membrane rejects most salt and other ions, but it is more susceptible to
fouling than cellulose acetate and it can only treat chlorine free water (Elimelech 1997).
Industries specialized in reverse osmosis have generally confirmed these facts about cellulose
acetate (“Cellulose Acetate” 2018) and thin-film composite (“Polyamide Membranes” 2018) up
through present time.
Recent studies show that the use of graphene oxide as an alternative membrane may be more
effective in terms of desalination, fouling prevention, and energy efficiency than other
commonly used membranes (Elbahri and Homaeigohar 2017). Regular graphene has a thin,
honeycomb structure that allows water to pass through very easily while separating it from salt
and other ions, allowing for little fouling to occur and increasing its longevity (Boretti 2018).
However, the biggest problem we face is how to apply this on an industrial scale because, as of
now, research studies involving graphene have only been done with low salt concentrations
(Elbahri and Homaeigohar 2017). Meanwhile, the water that we need to use reverse osmosis for
often has very high levels of salinity, ranging from around 25,000 ppm to 40,000 ppm

6
(Entekhabi 2018). We need to test graphene oxide membranes with concentrations of salt that are
realistic to seawater salinities today, so that we can compare graphene oxide’s desalination
abilities to the membranes commonly used in industries (specifically cellulose acetate and
thin-film composite).
For our experiment, we hope to test two different types of graphene oxide membranes: graphene
without added ions and graphene with added ions. In order to further prevent salt and other ions
from passing through the membrane, negatively charged ions could be linked to the honeycomb
structure of a regular graphene oxide membrane. This may help repel any ions trying to pass
through, and may ultimately make the membrane more effective (Elbahri and Homaeigohar
2017). Therefore, we hope to test regular graphene oxide membranes and graphene oxide
membranes with negatively charged ions in order to compare them to cellulose acetate and
thin-film composite.
III. Methods Overview of Study Design
We are proposing an experimental study in order to assess our question: “Pertaining to reverse
osmosis, how effective are graphene oxide membranes compared to membranes commonly used
in industries today (specifically thin-film composite and cellulose acetate) in terms of their
desalination abilities and longevity?”

7
Overall, this experiment involves the assessment of four different types of reverse osmosis (RO)
membranes. We will be assessing two membranes which are commonly used in reverse osmosis
systems today and are already known to work: a cellulose acetate membrane and a thin-film
composite membrane. We will also be assessing two, newer membranes that recent studies
suggest may work as better alternatives to cellulose acetate and thin film composite (TFC)
membranes: a graphene oxide membrane and a graphene oxide membrane with negatively
charged ions added to the structure (Elbahri and Homaeigohar 2017). We will test each of these
membranes over the duration of three months. Puretec Industries -- a reverse osmosis group
based on the west coast of the United States -- advises for an average RO membrane to be
cleaned around every three months at most (Puretec Industrial Water 2020). Therefore, we are
testing these membranes over this period of time to prevent having to clean the membranes
which could affect our results. By testing each of these membranes over the duration of three
months, we will focus on their effectiveness towards desalinization and their longevity.
For our proposal, we would like to subject ten of each type of RO (reverse osmosis) membrane
to varying levels of salinity concentration. Ocean salinity maps from NASA (Entekhabi 2018)
demonstrate that ocean salt concentrations generally range from around 25,000 ppm to 40,000
ppm; therefore, we suggest that our membranes are tested in increments of 5,000 ppm. For
instance, we propose that ten of each type of membrane is tested at 25,000 ppm, ten of each type
is tested at 30,000, and so on (up to 40,000 ppm). While we suggest the testing of ten of each
type of membrane in order to get the most accurate results, we realize that obtaining this many
membranes can be expensive. Therefore, we also suggest that the testing of at least three of each
membrane type would be sufficient enough to get a good comparison of the differences in

8
effectiveness between membranes. However, these results may not be as accurate as if you were
to use ten of each membrane (this will be explained in more detail in Data Collection
Procedures).
Our suggested control for this experiment is deionized water (which has a salinity of 0 ppm). By
using deionized water for a group of each type of membrane, we can assure that the design for
each membrane and RO system is generally functional; at the same time, we can assess how each
membrane ages over time with and without the intrusion of salt.
The only independent variable in our experiment is the salinity of the water that each membrane
is being subjected through. Everything else must remain constant among all of the membranes.
For instance, all of the water should come from the same source: the pH, temperature, chemical
structure, and pressure of the water entering the membranes should be kept as consistent as
possible. Furthermore, the age of the membranes and the design of the systems in which the
membranes are held should be approximately identical. (Our design of the testing system for the
RO membranes is included in an upcoming section: Design of RO Testing System, on page 10.)
Data Collection Procedures
We propose that we test the effectiveness and longevity of four different types of RO membranes
(cellulose acetate, TFC, graphene oxide without negative ions, and graphene oxide with negative
ions) against varying salinity concentrations. The size of each membrane should be
approximately the same. Each membrane should measure 3x3 square centimeters (Albiba.com).
Ideally, we suggest ten of each type of membrane per salinity concentration. The reason that we

9
suggest so many membranes is because of the possibility for variation in the membranes’
construction and the water flowing through them. Even though we advise that all membranes are
constructed in an identical fashion, the slightest variability in any conditions may lead to
uncertain viability in the data. Therefore, by using ten of each membrane, we can come close to
ensuring that our overall data is sound. However, in the case that ten of each membrane is not
possible, we suggest a minimum of three of each type of membrane so that a regular trend can be
observed among the data.
Furthermore, we suggest five different concentrations of salt based on average salinity levels in
oceans: 0 ppm (deionized water; our control), 25,000 ppm, 30,000 ppm, 35,000 ppm, and 40,000
ppm.
Based on these suggestions, there will ideally be a total of 200 membranes being used (10
individual membranes of each type x 4 types of membranes x 5 salinity concentration levels). At
minimum, we suggest a total of 60 membranes (3 individual membranes of each type x 4 types
of membranes x 5 salinity levels).
The design of our RO system consists of an individual membrane and salinity measurement
meters in effluent receiving pipes. Overall, water of a certain salinity should flow through the
membranes at a certain pressure, and the output water should be measured for salinity
continuously. (We hope to partner with a research group that has experience in testing RO
membranes, such as MIT. Our RO system design is explained in more detail in the flow chart
and paragraphs following this one.) Each membrane should have its own receiving pipe and its
own salinity meter so that water among different membranes is not mixed and so the data is

10
reliable. These meters will ideally be taking measurements on a constant time basis, sending its
data to a program that records the fluctuation in salinity into a storage document (such as Excel).
At the end of the day, this program will store the entire day’s data set, calculate average salinity
of the day, and determine the difference in the maximum and minimum salinity levels (the data’s
range). The range of the data is recorded in order to consider the possibility of outliers and
anomalies. This document is saved and every result that has been recorded can be reviewed in
real time as well as at a later date.
Design of RO Testing System
Constants: ● Water source ● Water temperature
11
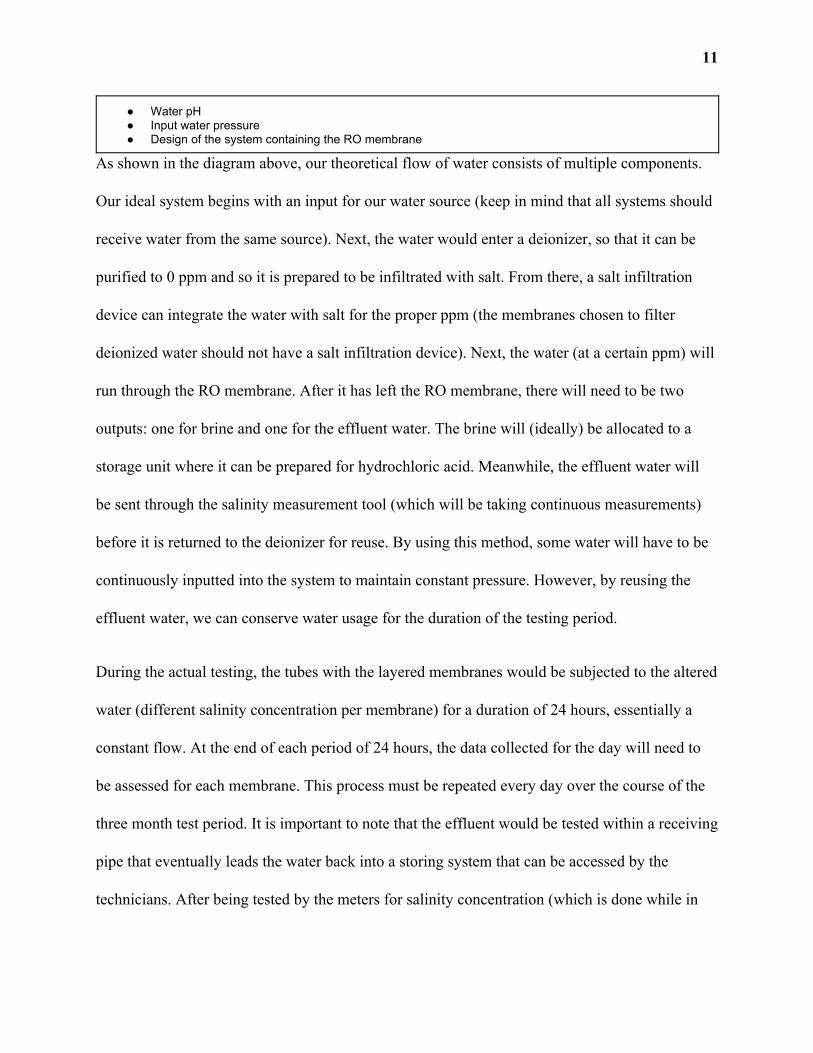
● Water pH ● Input water pressure ● Design of the system containing the RO membrane
As shown in the diagram above, our theoretical flow of water consists of multiple components.
Our ideal system begins with an input for our water source (keep in mind that all systems should
receive water from the same source). Next, the water would enter a deionizer, so that it can be
purified to 0 ppm and so it is prepared to be infiltrated with salt. From there, a salt infiltration
device can integrate the water with salt for the proper ppm (the membranes chosen to filter
deionized water should not have a salt infiltration device). Next, the water (at a certain ppm) will
run through the RO membrane. After it has left the RO membrane, there will need to be two
outputs: one for brine and one for the effluent water. The brine will (ideally) be allocated to a
storage unit where it can be prepared for hydrochloric acid. Meanwhile, the effluent water will
be sent through the salinity measurement tool (which will be taking continuous measurements)
before it is returned to the deionizer for reuse. By using this method, some water will have to be
continuously inputted into the system to maintain constant pressure. However, by reusing the
effluent water, we can conserve water usage for the duration of the testing period.
During the actual testing, the tubes with the layered membranes would be subjected to the altered
water (different salinity concentration per membrane) for a duration of 24 hours, essentially a
constant flow. At the end of each period of 24 hours, the data collected for the day will need to
be assessed for each membrane. This process must be repeated every day over the course of the
three month test period. It is important to note that the effluent would be tested within a receiving
pipe that eventually leads the water back into a storing system that can be accessed by the
technicians. After being tested by the meters for salinity concentration (which is done while in

12
the receiving pipe), the effluent water is then once again deionized and filtered for usage in the
experiment. Essentially, this is a closed loop system that will feed itself the water needed in order
to run the experiment and re-add the predetermined number of salt concentrations needed for the
water to be measured in the proper amount. There will be individual systems for each salinity
level in order to prevent any possible mixture between different salinity levels in different trials.
In order to portray the data for final analysis, projections of water salinity versus time will need
to be made for each membrane (this is explained in more detail in Data Analysis).
To ensure all conditions are kept the same, the pressure that the water will flow at through the
tubes will be high, around 600-1200 psi. This same water will have been pretreated not only to
alter the salinity concentration, but also the temperature and pH levels. In order to ensure the
water conditions would be similar to a real commercial setting, the temperature will be changed
to 80.2°F (Weather Atlas) and the pH level would be kept roughly around 8.1 (Abdulrasoul
2015).
The materials that are altered throughout the experiment in some fashion, whether by wear or by
the scientists conducting the experiment, are mainly the membranes and the water. The water
that will be used in this experiment is deionized water that has been designed in a lab previously
and then altered to add the different salinity levels. Because we are testing the effectiveness and
longevity of the membranes themselves, the age of the membranes is very important. To quantify
the longevity of each membrane, we will observe the change in effectiveness of each membrane
over time and how long they last after constant use for three months. These membranes must be
new, not used, and made roughly around the same time in order to shorten the possibility of age
13
as a contributing factor to our data. Any decrease in effectiveness will suggest deterioration of
the membrane, which could be due to fouling or due to the structure not being able to withstand
subjection to pressure over such a period of time.
Potential Sources of Error
Sources of error may arise from potential variations in our water passing through each
membrane; any changes in the water pressure, temperature, or pH could potentially alter our data
in a way that we cannot predict or properly analyze. At the same time, there may be a potential
source of error if the reverse osmosis systems that are containing each membrane are not
identical; variations in design could potentially lead to values in our data which we will not be
able to properly assess.
In order to obtain data as reliable as possible, we will need to time our data collection to be at the
end of each 24-hour time period. Potential error could arise if data is collected at different times
each day due to varying amounts of data for each collection.
We advise for this kind of experiment to be done in a controlled laboratory setting, ideally where
RO membranes have been tested in the past. By collecting the data in this kind of environment,
there is a higher likelihood that the proper equipment to test the membranes is available for
experimental use.
Assumptions

14
Our study’s design and constants are based on regions that have shown to use desalination
significantly as a means to obtain clean water. For instance, the temperature and pH standards we
suggested are based on the general ocean climate of Saudia Arabia, a nation that is known for its
desalination practices. Therefore, we are making the assumption that the results of this study will
be especially useful for the people who already rely on desalination for their clean water
supplies.
In addition, we are assuming that our overall composition of water outside of salt will not affect
our results. For instance, we are aware that ocean water obtained for desalination may generally
have components within it other than salt. However, since we are testing our membranes purely
on their ability to decrease overall water salinity, we are not putting anything other than salt into
our water used for testing.
Another assumption that we are making is that the reverse osmosis membranes and containment
devices will be made identically and to the best of the creator’s ability. This proposal is meant to
reach scientists and/or engineers who have some kind of expertise in the design of reverse
osmosis systems, so that any faults or inconsistencies in the data will not come from the design
itself.
Finally, we assume for our initial predictions that the addition of negatively charged ions to the
graphene structure will make the membrane more able to repel salt and other ions (Elbahri and
Homaeigohar 2017). This will overall lead to a better possible alternative for a reverse osmosis
membrane than what is currently being used in many industries by lowering water salinity once
it has passed through the membrane.

15
Data Analysis
At the end of each 24-hour period after water of a certain salinity has been filtered through a
membrane, data will be collected for each membrane on the salinity of the drainage water over
time. From these collections of data, we will calculate the average salinity of the water over time
for each individual membrane. For instance, there will be ten (or at least three) different average
salinity measurements for the ten (or at least three) cellulose acetate membranes filtered with
water initially at 30,000 ppm. The data should be examined each day to make sure that there are
no significant outliers in the data (due to some unforeseen or unexpected circumstance unrelated
to the membrane itself).
If all of the collections have been made over the course of only three months for ten of each
membrane, there should be around 18,000 averages stored (200 individual membranes x 1
average per day x 90 days of testing). If collections are made for three months or if there are less
than ten membranes, the number averages should change accordingly.
IV. Anticipated Results
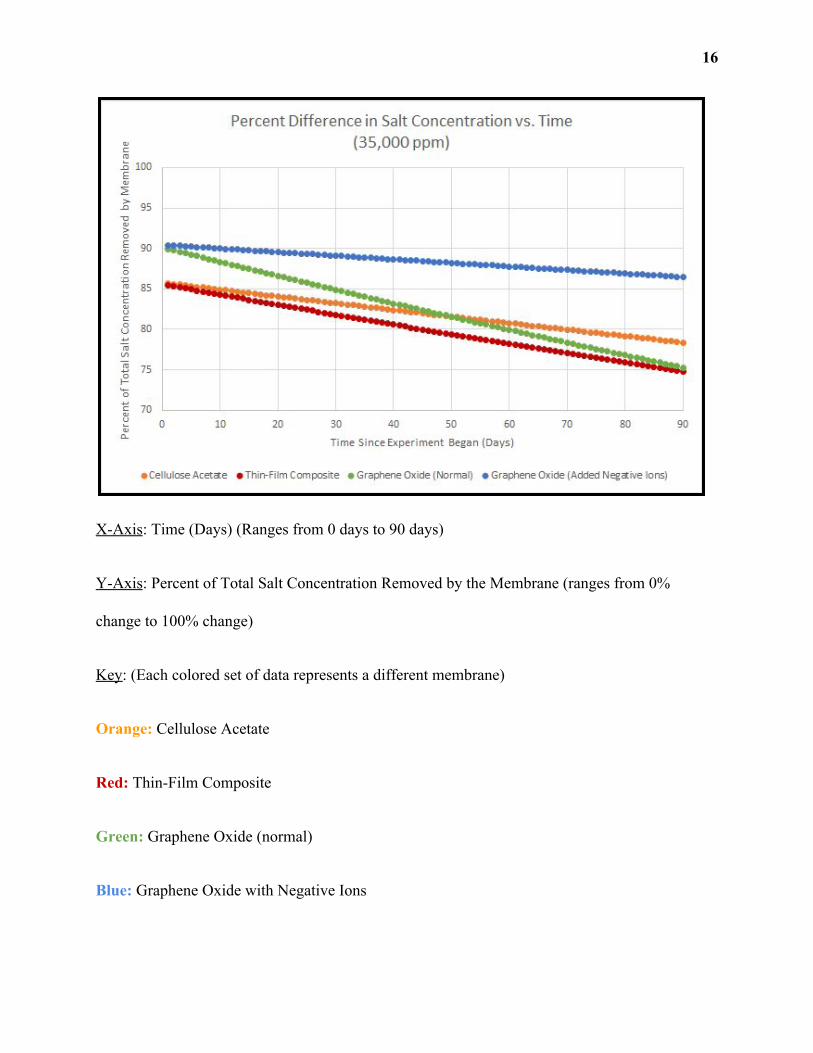
The graph shown below is an example graph for the percent change in salt concentration over
time (for a test period of three months). This particular graph is labeled “35,000 ppm” because it
contains the “data” from membranes subjected to a salinity of 35,000 ppm.
16
X-Axis: Time (Days) (Ranges from 0 days to 90 days)
Y-Axis: Percent of Total Salt Concentration Removed by the Membrane (ranges from 0%
change to 100% change)
Key: (Each colored set of data represents a different membrane)
Orange: Cellulose Acetate
Red: Thin-Film Composite
Green: Graphene Oxide (normal)
Blue: Graphene Oxide with Negative Ions

17
For any confusion on terminology presented in this section, make sure to refer to the glossary
(Section IX, page 24-25).
We are currently unsure of how effective each membrane will be in comparison to each other
and over time; our graph is drawn based on what we know from past scientific research
regarding membranes currently used in industries (Elimelech 1997) and graphene oxide (Elbahri
and Homaeigohar 2017). For example, we expect that the thin-film composite membrane is
generally better at rejecting salt than the cellulose acetate (Elimelech 1997), but also that it is
more susceptible to fouling (Elimelech 1997); as a result, we expect that the thin-film composite
will initially reject more salt than the cellulose acetate, but will deteriorate quicker than the
cellulose acetate over the three month test period. Furthermore, based on Puretec’s cleaning
advice for the average RO membrane, we expect that the membranes commonly used in
industries (cellulose acetate and thin film composite) will lose effectiveness by the end of their
test period (especially if the test is run for three months) (Puretec Industrial Water 2020).
At the same time, we have found little preliminary evidence showing whether graphene is more
or less effective than cellulose acetate or thin-film composite for desalination (which is one of
the reasons why we hope to conduct this test). We expect that the graphene oxide membrane
without the added ions will deteriorate more quickly than that with the added ions (Elbahri and
Homaeigohar 2017). The graphene oxide membrane with the added negatively charged ions will
repel any salt trying to get through (Elbahri and Homaeigohar 2017). Therefore, this membrane
will likely be more effective and will likely take more time to deteriorate than the other

18
membranes in our test (Elbahri and Homaeigohar 2017); it will be able to withstand higher salt
concentrations, and there will be extra structural support provided by the ions.
Note: Our graph contains individual data points and lines for each membrane. Each data point
represents the average percent change in water salinity for the day (a measurement of how much
salt was removed by the RO membrane). Since we propose for ten of each membrane to be
tested, by the end of each 24-hour period, there will be ten averages for each membrane in terms
of percent change in water salinity. However, the graph above combines the ten averages per
membrane to make one overall average per membrane.
V. Timeline We expect to need around 1-2 weeks to properly construct or alter our reverse osmosis system
and its membranes, depending on where our resources for membranes and their production are. If
more time is required, the important aspect is that all of the membranes are relatively the same
age.
Due to our uncertainty with the creation time period for membranes and systems, this project will
be conducted in collaboration with other research groups that have experience in developing or
obtaining RO membranes and systems. For instance, MIT has made their own graphene sheets in
the past (Brown 2015).

19
Depending on where we conduct this experiment, we may need time (a few days) to set up all of
the materials and systems for testing. We will need three months for data collection, testing each
membrane at each salt concentration once a day.
We will collect data at the end of each trial and compile data in an easy to read table format,
which will assist in data analysis. This analysis will include making conclusions based on
effectiveness in desalination and the longevity of each membrane. The analysis portion of this
experiment may take up to two weeks for each membrane, as there will be a lot of data to look
through and trends to find. From here, the writing process can begin. The report on the findings
of the project are projected to take no more than two months. This is under the assumption that
the main personnel will all have a hand in writing the report and part of the report may have
already been written (background, materials, procedure, etc.). On top of this, there will be a
period of at least six months for peer review.
VI. Materials and Budget The table below consists of our estimated costs for this entire project based on the materials that
we expect to need. Overall, the costs consist of the materials for our reverse osmosis membranes,
the costs to build each RO system, and the costs for hiring qualified staff to regulate certain
components of the experiment.
Item Description Cost for One Amount of Item Cost for All
Cellulose Acetate Membrane
One type of membrane being tested
$169.70 (Cytiva)
50 ~$8,485.00

20
Thin-Film Composite Membrane
One type of membrane being tested
$4.00-$7.00 (Albiba.com)
50 ~$275.00
Graphene Oxide Membrane (without ions)
One type of membrane being tested
$52.20-154.80 (Albiba.com)
50 ~$5,175.00
Graphene Oxide Membrane (with ions)
One type of membrane being tested
$52.00-154.00 (Albiba.com)
50 ~$5,150.00
Deionizer Meant to re-purify the output water from the membrane so that it can be reused
$900.00-1,300.00 (Albiba.com)
200 (1 per membrane)
~$220,000.00
Water salinity measurement tool
Used to continuously measure salinity of the water leaving the membranes
$230.00-$250.00 (Albiba.com)
200 (1 per membrane)
~$48,000.00
Salt water pump Meant to add salt to our water after it has been deionized (depending on the membrane)
$139.99 (Intex Recreation Corp.)
160 (1 per membrane, not including those subjected to deionized water)
~$22,398.40
Technician Hired for three months to observe the membranes and the collected data
$35,000/year 1-2 ~$11,667 - $23,333 (for 3 months of work)
Total ~$326,983.40

21
Note: Our table above does not include the cost for water or energy usage. These costs will
depend on where the test is conducted and they may vary. Our table does, however, include the
individual components needed for our RO system design. In the case that the company we
partner with already has some research equipment available, then we can save on costs in those
areas.
VII. Key Personnel Each team member has a great willingness and desire to further their knowledge on the subject of
water purification and desalination. Being able to provide access to clean water to people who
need it is important to us, which drives our research question and design. Each team member is
organized and has well thought out ideas, which is critical for this study because there are many
contributing factors that need to be accounted for. Specifically, we are all science majors, whose
focus areas include biochemistry and molecular biology and public health sciences, natural
resource conservation, and physics. A background in public health provides knowledge and
interest about why water scarcity is a growing problem in many countries and why desalination
is important for the overall health of populations. Knowledge of natural resource conservation is
crucial for understanding why a resource such as water needs to be purified in the most energy
and cost efficient way, and ultimately the most effective way. A background in physics provides
knowledge on how to create a system that will work well for measuring salinity and pumping
water through each of the membranes. With this in mind, each team member will play a part in
every step of the way, but with someone taking charge when the process is better suited to their
field. For example, a physics major can offer a lot of help in designing an energy efficient

22
structure, or data analysis and graph building. A public health and science background may
contribute a great deal into reaching out to research groups for collaboration purposes, as well as
funding organizations, to explain the importance of the project and gather support. A natural
resource conservation major may understand the mechanisms behind desensitization best and as
such is better suited for leading the process of trials and testing in the experiment.
VIII. Relevance of Proposed Study & Broader Impacts Relevance of the Proposed Study
We currently predict that the graphene oxide membranes (both with and without added ions) will
prove to be more effective in terms of desalination than cellulose acetate and thin-film
composite, based on the proven results of graphene oxide at low salt concentrations (Elbahri and
Homaeigohar 2017). At the same time, we expect the graphene oxide with negative ions to have
the greatest longevity of any of our tested membranes, based on past research of the negative
ions and their support for graphene (Elbahri and Homaeigohar 2017).
The results gathered from this experiment will be essential both for industries and consumers
around the world, especially in the regions that currently rely on reverse osmosis as a primary
means to obtain fresh water. Based on the results that we collect, we will be able to assess the
effectiveness of the types of RO membranes that we test in terms of their desalinization abilities
and their longevity. Furthermore, we will be able to compare the membranes commonly used in
industries today (cellulose acetate and thin-film composite) to membranes less known (graphene

23
oxide with and without negative ions). Based on this comparison, we can make informed
decisions in the future about the RO membrane material needed for optimal reverse osmosis.
On an industry-level, the research obtained from this experiment can be used to determine which
type of reverse osmosis membrane will be best for large-scale desalination. Since our
experimental procedure consists of running membranes through salinity levels realistic to those
of the Earth’s oceans over the period of multiple months, the results that we find will be relevant
to the conditions that our own reverse osmosis plants encounter daily. Furthermore, plants that
are currently operational can make changes to their own designs by replacing the RO membranes
if deemed necessary; those in charge of building plants in the future can be more aware of their
actions when they decide which type RO membrane to use for their systems.
On a consumer-level, this experiment can reveal the possibilities for how to potentially improve
the process of reverse osmosis in the future. If our tests reveal that graphene oxide (with or
without negative ions) is more effective than cellulose acetate and thin-film composite, then
changes may begin to take place. For example, consumers who receive their water from reverse
osmosis plants may begin to obtain water that has a lower salinity than before (in the case that
industries change their RO membranes to one that is more effective than what they currently
use). At the same time, any change in the use of RO membranes may result in a change of costs
for the reverse osmosis practice; as a result, the prices that consumers pay for their water may
change as a result of this experiment.
If we are to receive our expected results (such that graphene oxide proves to be more effective in
terms of desalination and longevity than cellulose acetate and longevity), then there is potential

24
for the practice of reverse osmosis to change as a whole. As more of a demand may be placed on
graphene oxide membranes, an economic change may take place for anyone particularly
involved in reverse osmosis in some way (whether they are in charge of an RO plant,
manufacture RO membranes, or drink water from an RO system). At the same time, depending
on how much more effective the graphene oxide could be than other membranes, there could be
a significant change in the average water salinity distributed in regions that use reverse osmosis.
Overall, as time progresses and naturally fresh water becomes more finite, the relevance of our
expected results (on both an industry and consumer level) will grow.
Broader Impacts
Scientists will benefit from this work by being able to use these results to conduct further, larger
experiments. This will also benefit the general public, specifically countries who cannot afford
current reverse osmosis membranes and do not have access to clean water. Access to clean water
is a basic human right. The desalination of water with a more effective and efficient membrane
will give people access to cleaner water by production of this membrane in an industrialized
setting. In order to communicate our findings, they will be written in a technical report and
submitted to various other groups and people working in this field for peer review before being
published on a larger scale. The findings can also be converted into a small and easy to
understand presentation to be given to industry representatives and other groups who share
interests in this field.
Another important thing to note is that, if possible, the excess brine from this experiment could
be collected to make hydrochloric acid. As established by other testing facilities (Brown 2015),

25
hydrochloric acid can easily be made on site from waste brine using established chemical
processing methods, and can then be used for cleaning parts of the desalination plant. As an
added touch, it can also be widely used in chemical production and as a source of hydrogen. This
could be helpful in future experiments by making desalination more effective in terms of being
able to clean more often and in a more efficient manner.
IX. Glossary
“Desalination Ability” - The ability of an RO membrane to remove salt from water. The more
salt that an RO membrane can remove from water, the greater its desalination ability.
“Deterioration” - The decreasing effectiveness in an RO membrane to remove salt from water
(desalinize). The effect of deterioration could be a result of failing structural integrity of the
membrane (for instance, if it begins to fall apart), due to fouling, or due to some unexpected or
unpredictable cause.
“Effective” - The measurement for an RO membrane’s ability to remove salt over a period of
time. The “effectiveness” of RO membranes in this experiment is measured in both how much
salt the membrane removes and how consistent it is in removing that salt. (For instance, if the
membrane removes 90% of the salt on one day and 60% of the salt the next day, it is not very
effective in terms of longevity. However, if the membrane consistently only removes 40% of salt
each day, it is effective in terms of longevity but not in terms of desalination ability.)
“Fouling” - The build-up of undesirable materials on an RO membrane, including bacteria. The
intention of our use of water only containing salt is meant to minimize the interference of fouling

26
for the testing of RO membranes in this experiment. However, based on an RO membrane’s
tendency for fouling, there is a possibility for it to decrease the effectiveness of the membrane
and to make the membrane deteriorate.
“Longevity” - How long the membrane is able to last in terms of desalination abilities. On one
hand, an RO membrane has a high longevity if it can consistently remove a certain amount of
salt from water for a long duration of time. On the other hand, an RO membrane has a low
longevity if the amount of salt it can remove from water decreases significantly in a short period
of time. The longevity of an RO membrane may be impacted by the membrane's tendency for
fouling or by its structural integrity.
X. References Abdulrasoul, Al-Omran, and Altuquq, Abdullah. “Drinking Water Quality Assessment and
Water Quality Index of Riyadh, Saudi Arabia.” Water Quality Research Journal, IWA
Publishing, 1 Aug. 2015,
iwaponline.com/wqrj/article/50/3/287/21614/Drinking-water-quality-assessment-and-wat
er.
Boretti, Albert, et al. “Outlook for Graphene-Based Desalination Membranes.” Nature News,
Nature Publishing Group, 24 May 2018, www.nature.com/articles/s41545-018-0004-z.
Brown, Eric. “Desalination Gets a Graphene Boost.” MIT News, 2 Nov. 2015,
news.mit.edu/2015/desalination-gets-graphene-boost-jeffrey-grossman-1102.

27
“Cellulose Acetate Membranes - Reverse Osmosis Systems.” RO Chemicals, Reverse Osmosis
Chemicals International, 2018,
reverseosmosischemicals.com/reverse-osmosis-guides/reverse-osmosis-glossary-terms/ce
llulose-acetate-membranes-reverse-osmosis-systems.
“Desalination.” Water Science School, USGS, 2020,
www.usgs.gov/special-topic/water-science-school/science/desalination?qt-science_center
_objects=0#qt-science_center_objects.
“Does Size Matter? Meet Six of the World’s Largest Desalination Plants.” Aquatech, RAI
Amsterdam, 15 Jan. 2019,
www.aquatechtrade.com/news/desalination/worlds-largest-desalination-plants/.
Elimelech, Menachem, et al. “Role of Membrane Surface Morphology in Colloidal Fouling of
Cellulose Acetate and Composite Aromatic Polyamide Reverse Osmosis Membranes.”
Journal of Membrane Science, vol. 127, no. 1, 1997, pp. 101–109.,
doi:10.1016/s0376-7388(96)00351-1.
Entekhabi, Dara, and PST. “SMAP Sees Sea Surface Salinity – SMAP.” NASA, NASA, 26 Apr.
2018, smap.jpl.nasa.gov/news/1265/smap-sees-sea-surface-salinity/.
“Glass Fiber Wrap Polyamide Thin Film Composite Le Industrial Ro 8040 Ro Membrane
Manufacturer Filtering Suspended Matter Sapstone.” , Thin Film Composite Membranes
Suppliers and Manufacturers at Alibaba.com,
www.alibaba.com/showroom/thin-film-composite-membranes.html.

28
Homaeigohar, Shahin, and Mady Elbahri. “Graphene Membranes for Water Desalination.”
Nature News, Nature Publishing Group, 25 Aug. 2017,
www.nature.com/articles/am2017135#Sec2.
“Jeddah, Saudi Arabia - April Weather Forecast and Climate Information.” Weather Atlas, 2020,
www.weather-atlas.com/en/saudi-arabia/jeddah-weather-april.
“Krystal Clear Saltwater System CG-26667, 110-120V with GFCI.” Intex Recreation Corp.,
www.intexcorp.com/products/above-ground-pools/krystal-clear-filtration-sanitation/saltw
ater-systems/krystal-clear-saltwater-system-cg-26667-110-120v-with-gfci/.
“Laboratory Deionized Water Machine System Equipment For Lithium Ion Battery Cathode
Materials Mixing Water - Buy Deionized Water Machine,Deionized Water
System,Deionized Water Equipment Product on Alibaba.com.” Www.alibaba.com,
www.alibaba.com/product-detail/Laboratory-Deionized-Water-Machine-System-Equipm
ent_60817423541.html?spm=a2700.7724857.normalList.13.301f3674qDqrWJ&s=p&full
FirstScreen=true.
Manufacturers, Suppliers, Exporters & Importers from the World's Largest Online B2B
Marketplace-Alibaba.com,
www.alibaba.com/product-detail/High-Quality-Graphene-Oxide-Film-Graphene_607667
16421.html?spm=a2700.7724857.normalList.1.155b3890fY3EqW.
Manufacturers, Suppliers, Exporters & Importers from the World's Largest Online B2B
Marketplace, Alibaba.com,
29
www.alibaba.com/product-detail/High-Quality-Graphene-Oxide-Film-Graphene_607667
16421.html?spm=a2700.7724857.normalList.2.1dc2322aMpy1m7&bypass=true.
Manufacturers, Suppliers, Exporters & Importers from the World's Largest Online B2B
Marketplace, Alibaba.com,
www.alibaba.com/product-detail/ORP-TDS-Salinity-Temp-Ph-Multiparameter_6082848
5193.html?spm=a2700.7724857.normalList.100.2b3d5391LNzreQ&bypass=true.
Manufacturers, Suppliers, Exporters & Importers from the World's Largest Online B2B
Marketplace, Alibaba.com,
www.alibaba.com/product-detail/polyamide-thin-film-composite-membranes-free_605903
73784.html?spm=a2700.7724857.normalList.12.72724202W2mFca&bypass=true.
“Polyamide Membranes - Reverse Osmosis Systems.” RO Chemicals, Reverse Osmosis
Chemicals International, 2018,
reverseosmosischemicals.com/reverse-osmosis-guides/reverse-osmosis-glossary-terms/pol
yamide-membranes-reverse-osmosis-systems.
Reid, Kathryn. “Global Water Crisis: Facts, FAQs, and How to Help.” World Vision, 19 Mar.
2020, www.worldvision.org/clean-water-news-stories/global-water-crisis-facts.
“RO Membrane Cleaning.” Puretec Industrial Water, Puretec Industrial Water, 2020,
puretecwater.com/reverse-osmosis/reverse-osmosis-membrane-cleaning.

30
Schirber, Michael. “Why Desalination Doesn't Work (Yet).” LiveScience, Purch, 25 June 2007,
www.livescience.com/4510-desalination-work.html.
“Water Q&A: How Much Water Do I Use at Home Each Day?” Water Science School, USGS,
2020,
www.usgs.gov/special-topic/water-science-school/science/water-qa-how-much-water-do-
i-use-home-each-day?qt-science_center_objects=0#qt-science_center_objects.
“Whatman Cellulose Acetate Membrane Filters.” Cytiva, 2020,
www.cytivalifesciences.com/en/us/shop/whatman-laboratory-filtration/membranes