Embed Size (px)
Citation preview
Tests using CMC Method for Optical Image
Correlations of Cartridge Cases Fired from
Consecutively Manufactured Pistol Slides
Mingsi Tong, John Song, Wei Chu, Johannes Soons, and Robert M. Thompson
National Institute of Standards and Technology
1
Disclaimer
Certain commercial equipment,
instruments, or materials are identified
in this report in order to specify the
experimental procedure adequately.
Such identification is not intended to
imply recommendation or endorsement
by the National Institute of Standards
and Technology, nor is it intended to
imply that the materials or equipment
identified are necessarily the best
available for the purpose.
2
3
1. Test Samples
The test samples are from a study by the Miami
Dade Crime Laboratory. 40 cartridge cases fired
from handguns with the 10 consecutively
manufactured slides were correlated with one
another. That includes 20 known cartridge cases
(2 per slide) for references and 20 unknown
cartridge cases for the validation test. There are
a total of 780 pair combinations; comprising 63
known-matching (KM) and 717 known-non-
matching (KNM). The topography images of
these samples had been tested by NIST.
4
Test Samples (continued)
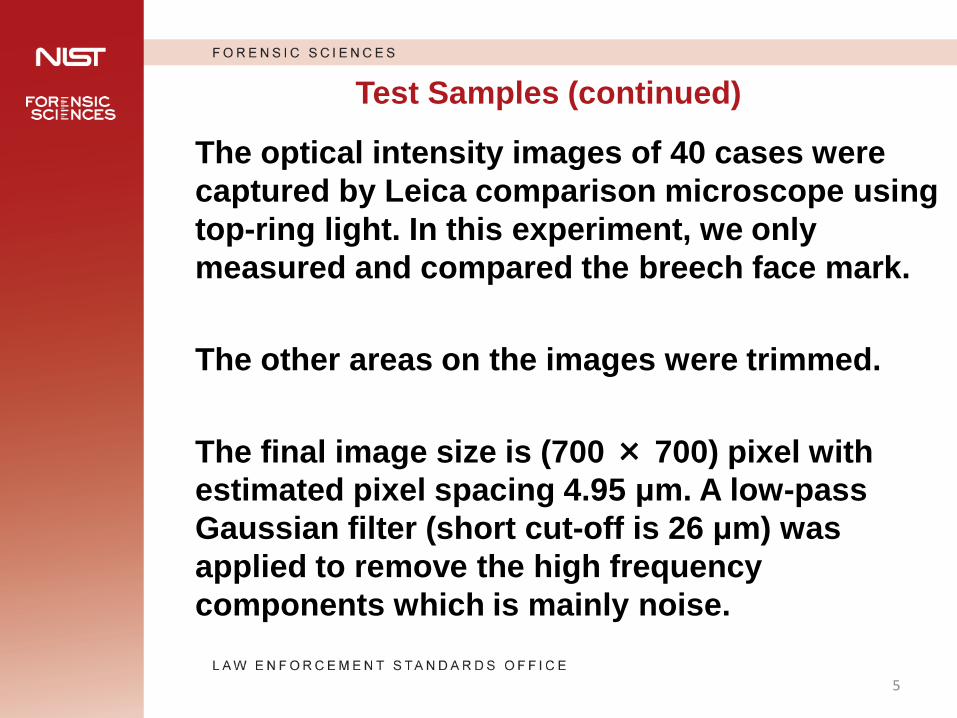
The optical intensity images of 40 cases were
captured by Leica comparison microscope using
top-ring light. In this experiment, we only
measured and compared the breech face mark.
The other areas on the images were trimmed.
The final image size is (700 × 700) pixel with
estimated pixel spacing 4.95 μm. A low-pass
Gaussian filter (short cut-off is 26 μm) was
applied to remove the high frequency
components which is mainly noise.
5
Test Samples (continued)
6
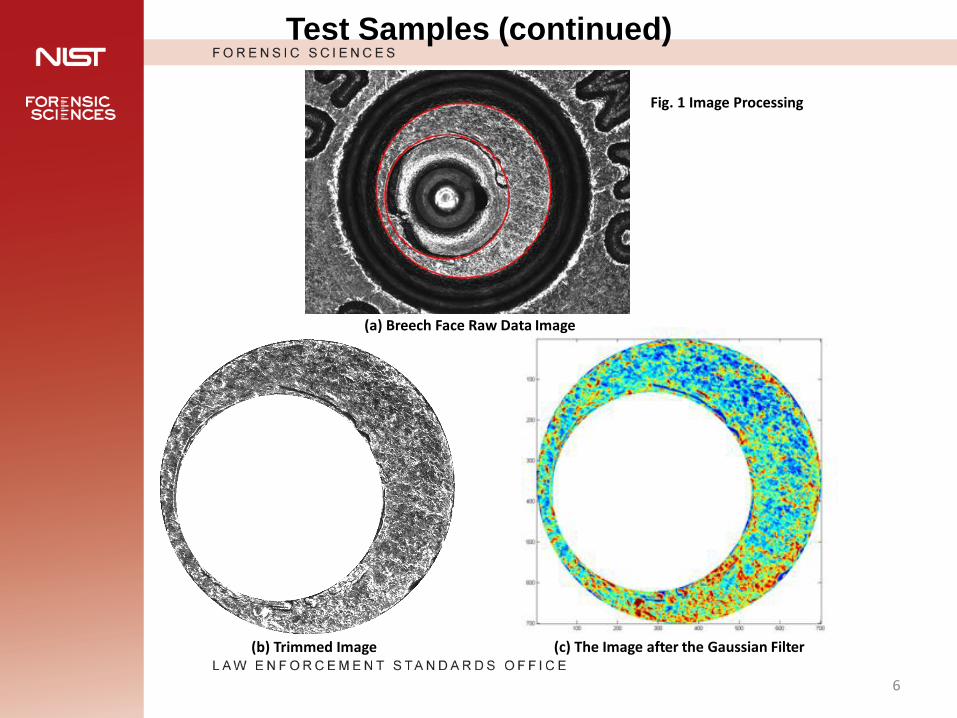
(a) Breech Face Raw Data Image
(b) Trimmed Image (c) The Image after the Gaussian Filter
Fig. 1 Image Processing
2. Implement of CMC Method
CMC Method
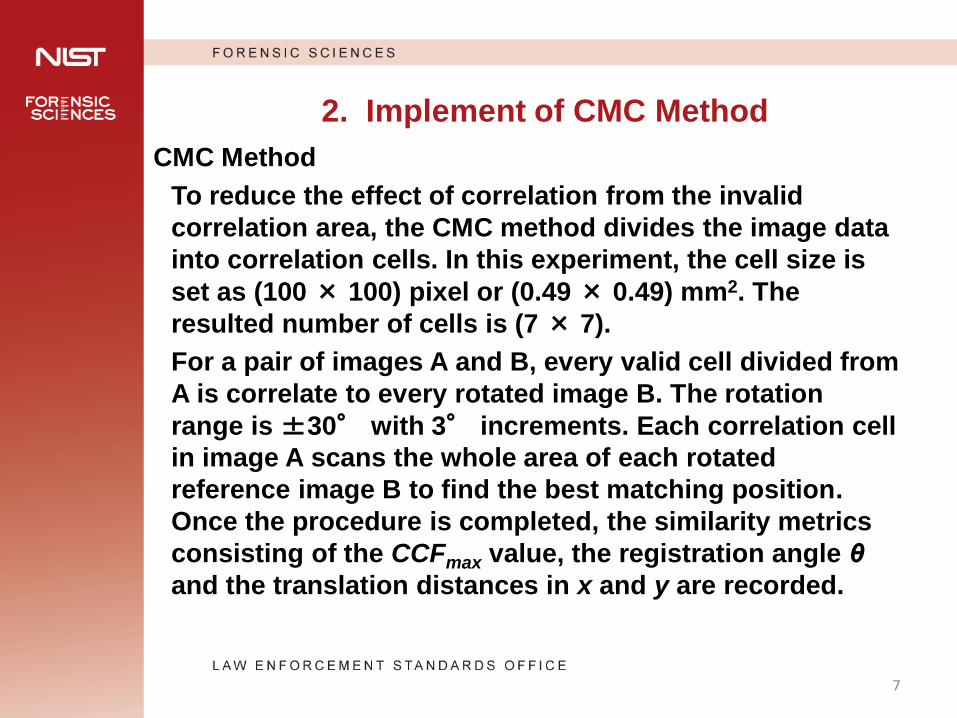
To reduce the effect of correlation from the invalid
correlation area, the CMC method divides the image data
into correlation cells. In this experiment, the cell size is
set as (100 × 100) pixel or (0.49 × 0.49) mm2. The
resulted number of cells is (7 × 7).
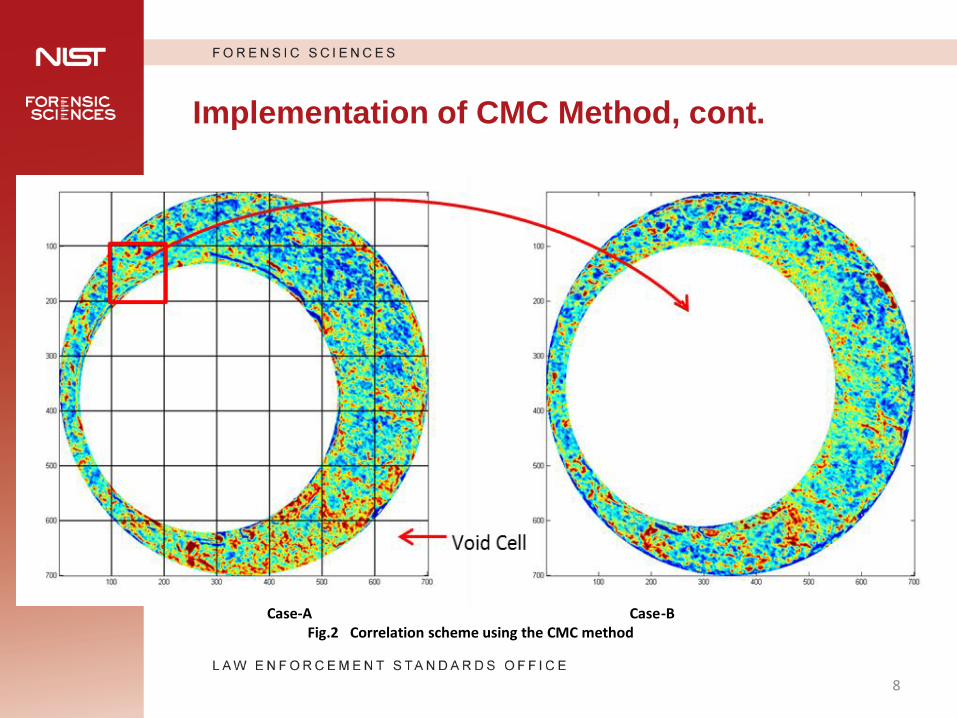
For a pair of images A and B, every valid cell divided from
A is correlate to every rotated image B. The rotation
range is ±30° with 3° increments. Each correlation cell
in image A scans the whole area of each rotated
reference image B to find the best matching position.
Once the procedure is completed, the similarity metrics
consisting of the CCFmax value, the registration angle θ
and the translation distances in x and y are recorded.
7
Implementation of CMC Method, cont.
8
Case-A Case-B Fig.2 Correlation scheme using the CMC method
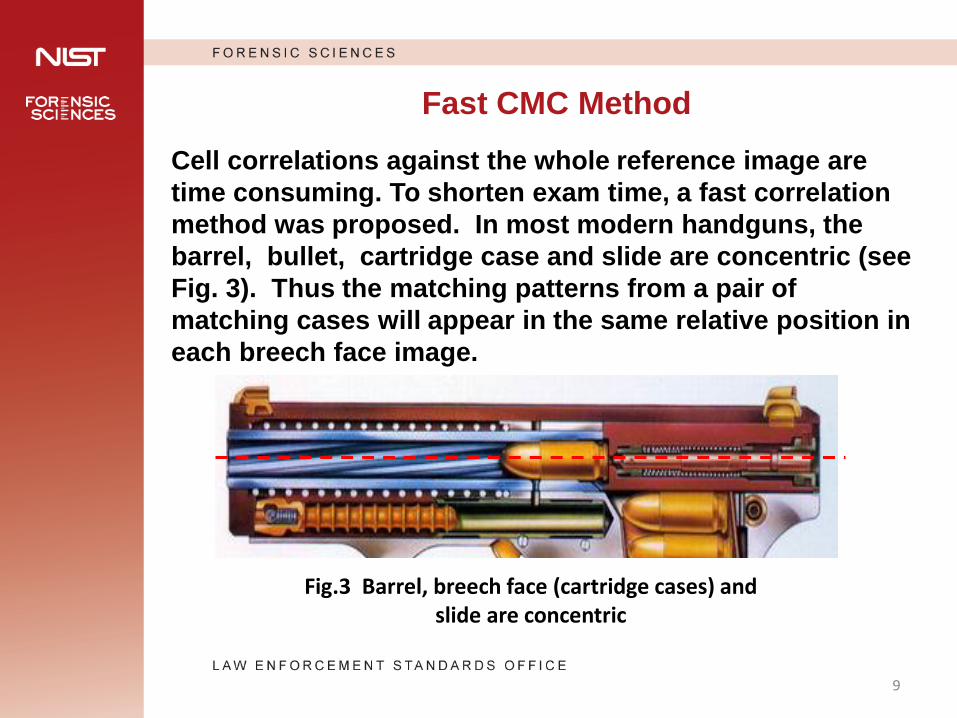
Fast CMC Method
Cell correlations against the whole reference image are
time consuming. To shorten exam time, a fast correlation
method was proposed. In most modern handguns, the
barrel, bullet, cartridge case and slide are concentric (see
Fig. 3). Thus the matching patterns from a pair of
matching cases will appear in the same relative position in
each breech face image.
9
Fig.3 Barrel, breech face (cartridge cases) and slide are concentric
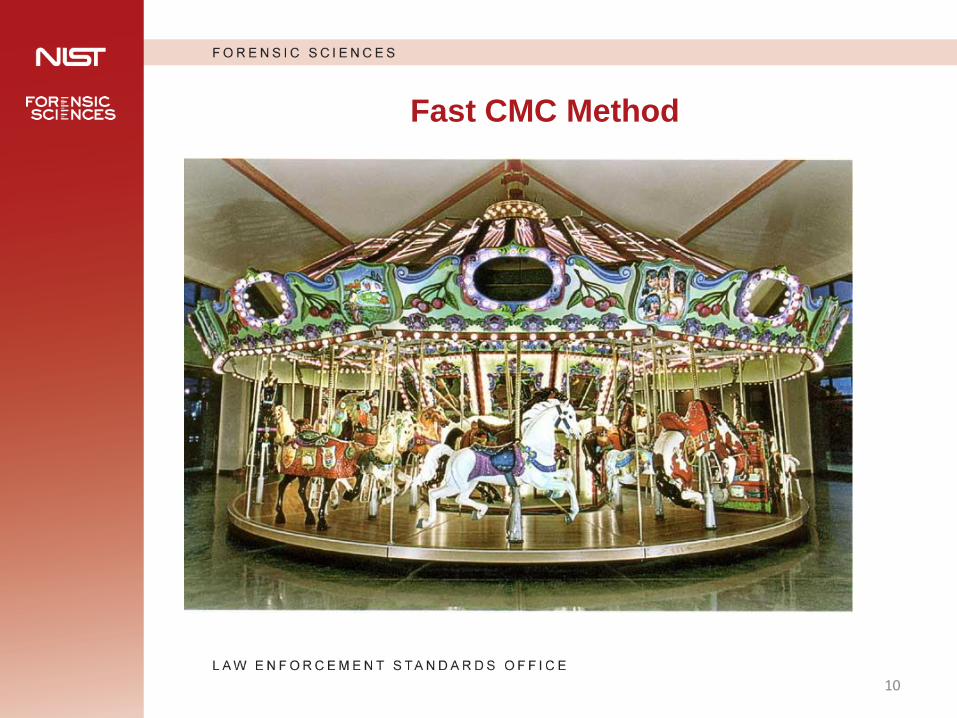
Fast CMC Method
• Observer is in Reference position, Carousel is being
compared
10
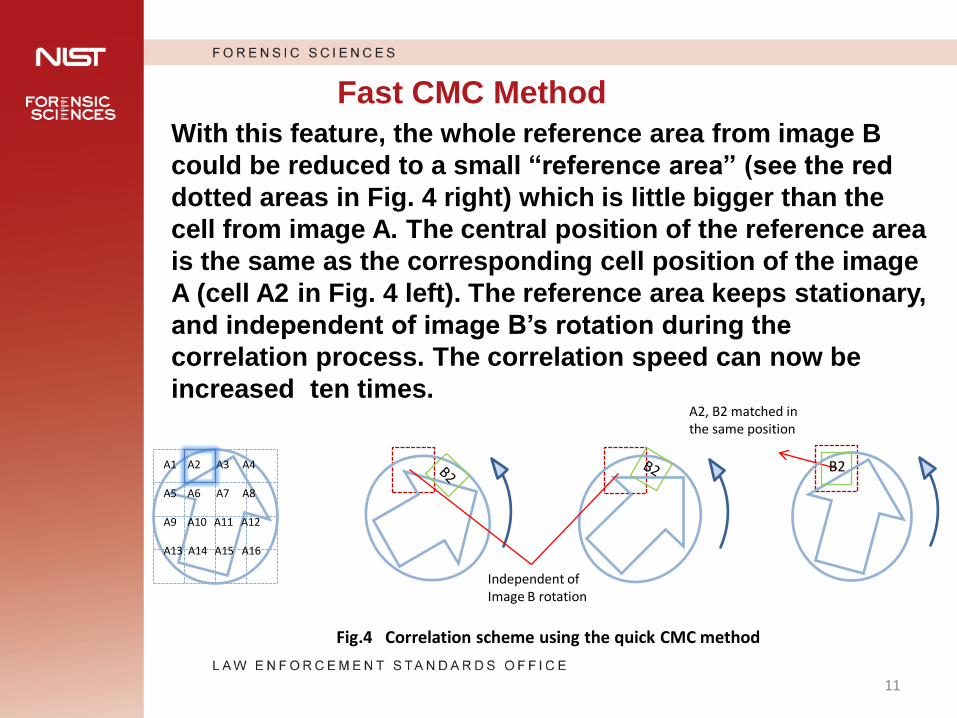
Fast CMC Method
With this feature, the whole reference area from image B
could be reduced to a small “reference area” (see the red
dotted areas in Fig. 4 right) which is little bigger than the
cell from image A. The central position of the reference area
is the same as the corresponding cell position of the image
A (cell A2 in Fig. 4 left). The reference area keeps stationary,
and independent of image B’s rotation during the
correlation process. The correlation speed can now be
increased ten times.
11
A1 A2 A3 A4 A5 A6 A7 A8 A9 A10 A11 A12 A13 A14 A15 A16
B2
Independent of Image B rotation
A2, B2 matched in the same position
Fig.4 Correlation scheme using the quick CMC method
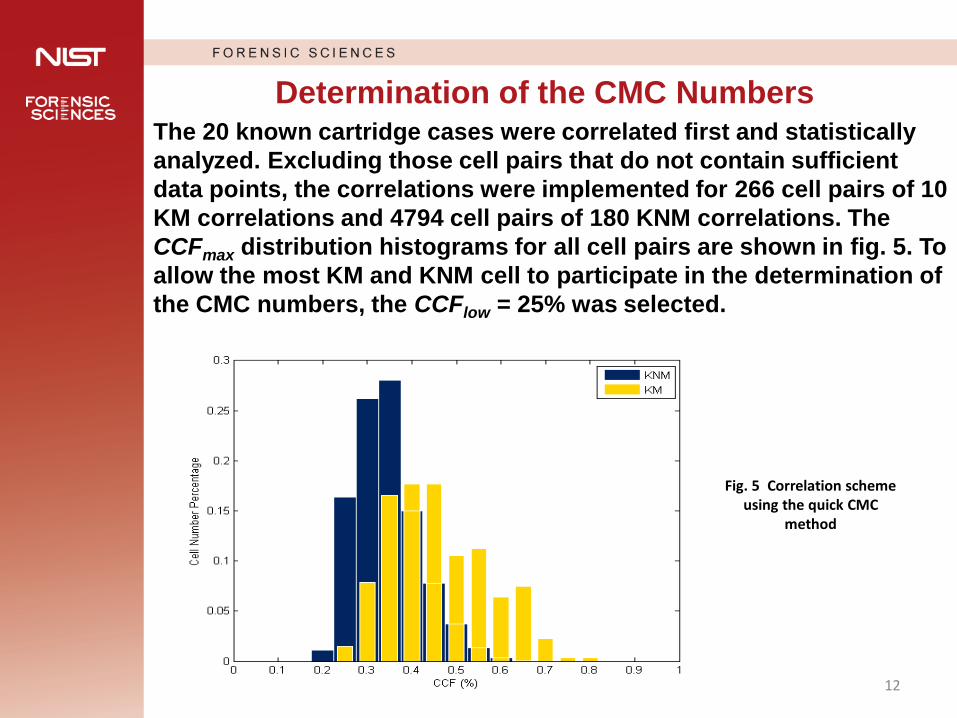
Determination of the CMC Numbers The 20 known cartridge cases were correlated first and statistically
analyzed. Excluding those cell pairs that do not contain sufficient
data points, the correlations were implemented for 266 cell pairs of 10
KM correlations and 4794 cell pairs of 180 KNM correlations. The
CCFmax distribution histograms for all cell pairs are shown in fig. 5. To
allow the most KM and KNM cell to participate in the determination of
the CMC numbers, the CCFlow = 25% was selected.
12
Fig. 5 Correlation scheme using the quick CMC
method
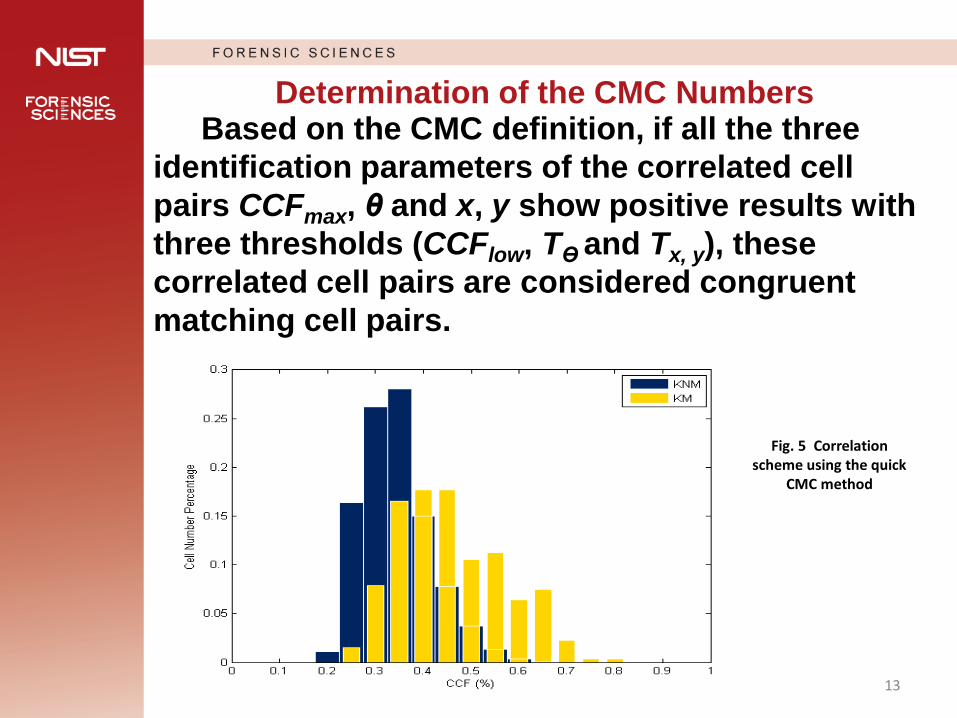
Determination of the CMC Numbers Based on the CMC definition, if all the three
identification parameters of the correlated cell
pairs CCFmax, θ and x, y show positive results with
three thresholds (CCFlow, TƟ and Tx, y), these
correlated cell pairs are considered congruent
matching cell pairs.
13
Fig. 5 Correlation scheme using the quick
CMC method
3. Analysis of Correlation Results
14
Based on the CMC definition, a program was made
which can search the difference between the min
CMC number of KM group and the max CMC
number of KNM group in all different TƟ and Tx, y
combination with a given CCFlow value.
Analysis of Correlation Results
For the 20 known cartridge cases, Fig. 6 shows the
distribution of the CMC differences for the selected 190
correlations with CCFlow = 25%. The CMC difference
achieves the maximum as shown in the area of white frame
(see Fig. 6). By selecting the thresholds in this area (TƟ =
3°, Tx, y = 25 pixel), Fig. 7 shows the CMC distribution
based on these thresholds.
The KM and KNM distributions are well separated. The
maximum CMC number of the 180 KNM correlations is 5,
and the minimum CMC number for the 10 KM correlations
is 12. There is a gap of 6 CMCs, which indicates no
misidentification or missed identification.
15
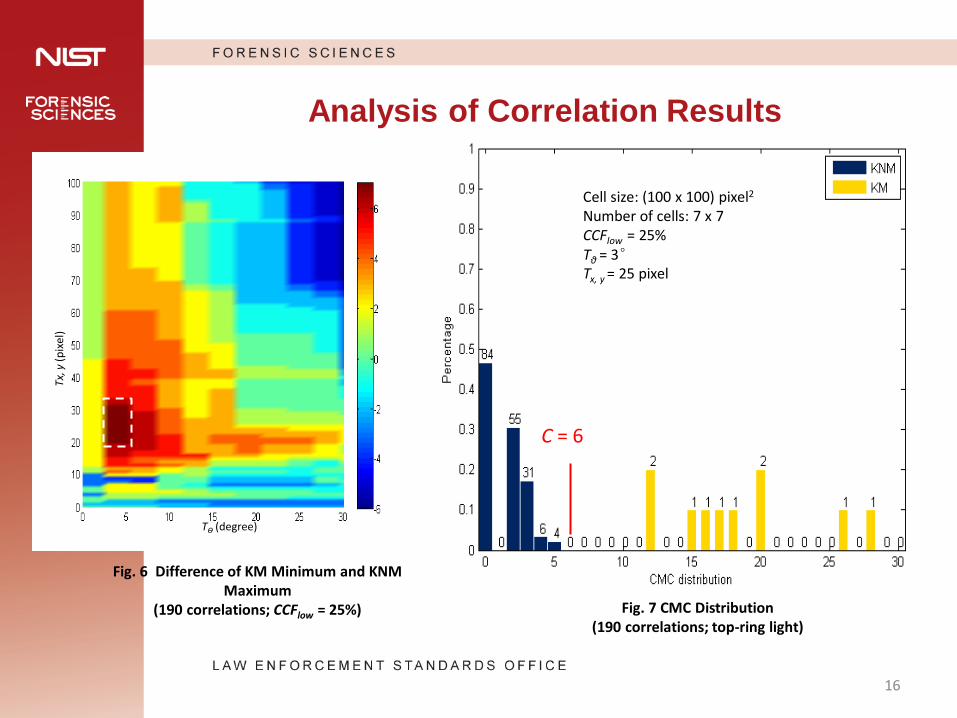
Cell size: (100 x 100) pixel2 Number of cells: 7 x 7
CCFlow = 25%
Tθ = 3°
Tx, y = 25 pixel
C = 6
Analysis of Correlation Results
16
Fig. 6 Difference of KM Minimum and KNM Maximum
(190 correlations; CCFlow = 25%) Fig. 7 CMC Distribution (190 correlations; top-ring light)
Tx, y
(p
ixel
)
TƟ (degree)
Analysis of Correlation Results
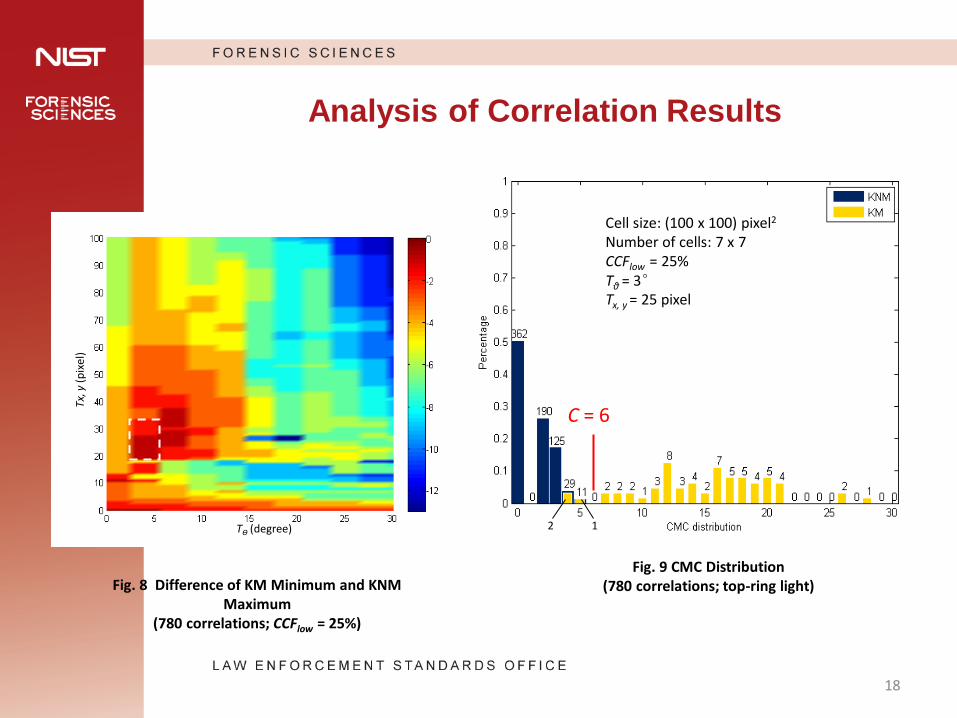
• The same processing was now conducted on all
of the 40 cartridge cases. The difference
distribution of 63 KM and the 717 KNM is shown
in Fig. 8. The max difference is -1. It means there
has been a misidentification or missed
identification.
• The max CMC difference area of 780 correlations
(see Fig. 8) is the same as the max CMC
difference area of 190 correlations (see Fig. 6). By
using the same thresholds, the CMC distribution
of 780 correlations is showed in Fig. 9. In this
result, the distribution of KNM doesn’t have an
obvious change.
17
Analysis of Correlation Results
18
Tx, y
(p
ixel
)
TƟ (degree)
C = 6
Cell size: (100 x 100) pixel2 Number of cells: 7 x 7
CCFlow = 25%
Tθ = 3°
Tx, y = 25 pixel
2 1
Fig. 8 Difference of KM Minimum and KNM Maximum
(780 correlations; CCFlow = 25%)
Fig. 9 CMC Distribution (780 correlations; top-ring light)
4. Correlation Analysis by Angle
19
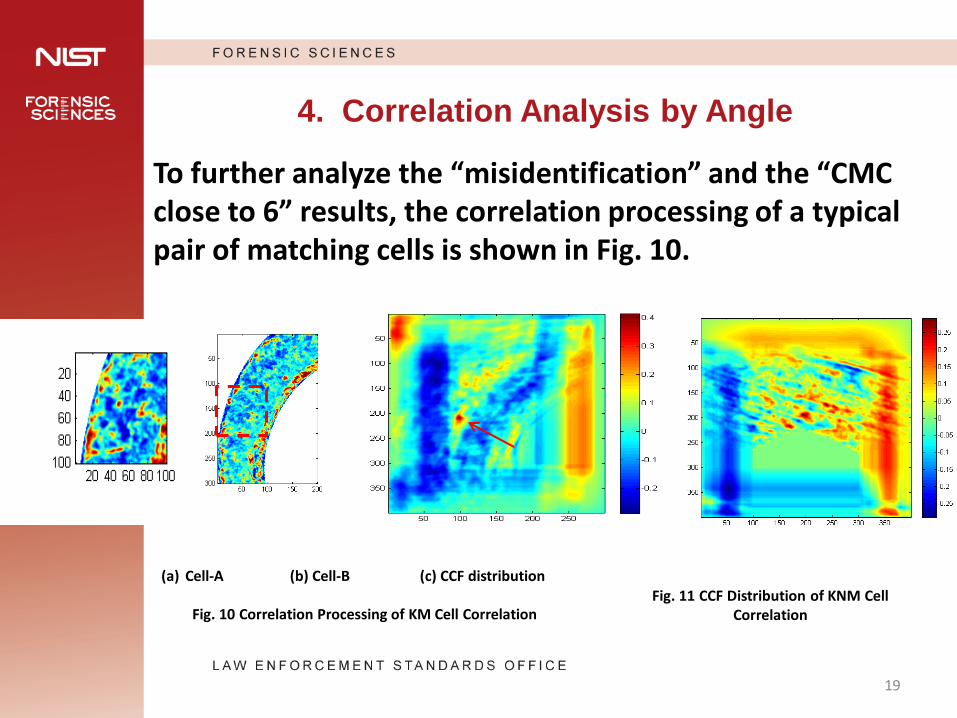
(a) Cell-A (b) Cell-B (c) CCF distribution
Fig. 10 Correlation Processing of KM Cell Correlation Fig. 11 CCF Distribution of KNM Cell
Correlation
To further analyze the “misidentification” and the “CMC close to 6” results, the correlation processing of a typical pair of matching cells is shown in Fig. 10.
Correlation Analysis by Angle (continued)
20
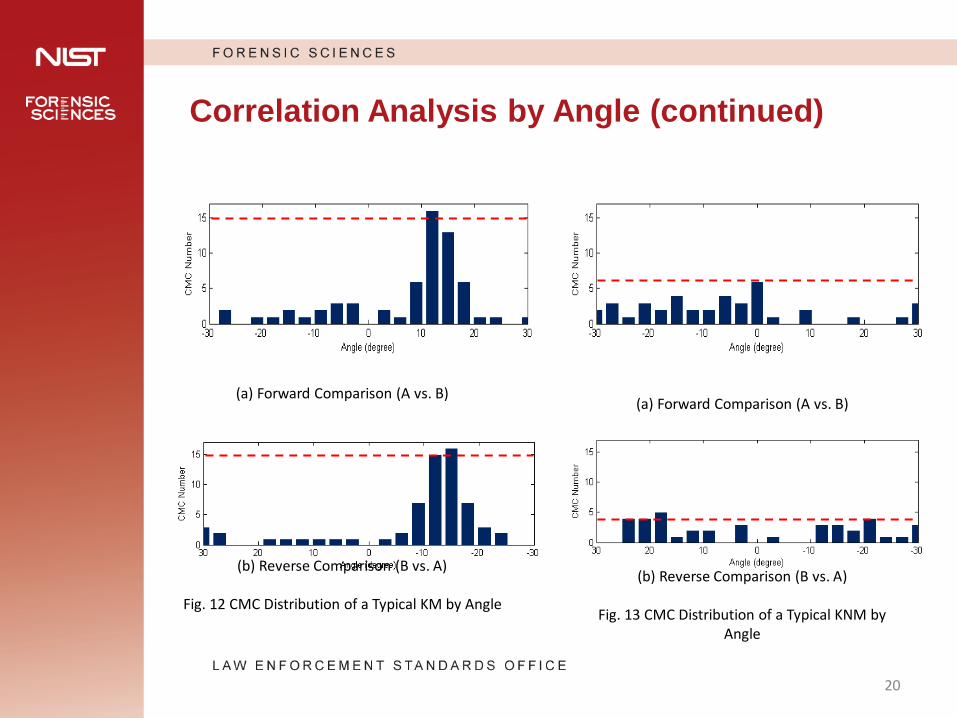
(a) Forward Comparison (A vs. B)
(b) Reverse Comparison (B vs. A)
Fig. 12 CMC Distribution of a Typical KM by Angle
(a) Forward Comparison (A vs. B)
(b) Reverse Comparison (B vs. A)
Fig. 13 CMC Distribution of a Typical KNM by Angle
Correlation Analysis by Angle
We propose two methods to increase the
accuracy:
1) Using “High CMC Number” replace the max
CMC number to find the matched angle. In KM
correlations, if existing angles which CMC number
is a little less than the maximum (less 1 or 2),
these angles are usually close to the peak angle.
But in KNM correlations, these angles are usually
randomly distribute in the whole range.
21
Correlation Analysis by Angle
22
A A vs. B B B vs. A
Fig. 14 Forward and Reverse Correlations
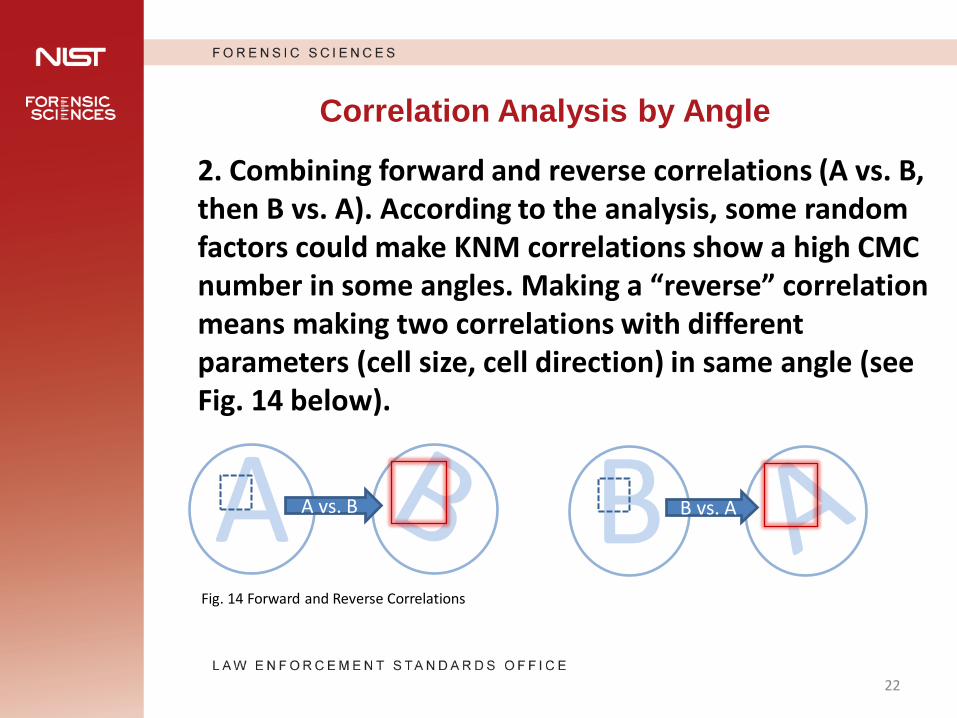
2. Combining forward and reverse correlations (A vs. B, then B vs. A). According to the analysis, some random factors could make KNM correlations show a high CMC number in some angles. Making a “reverse” correlation means making two correlations with different parameters (cell size, cell direction) in same angle (see Fig. 14 below).
Result of Correlation Analysis by Angle
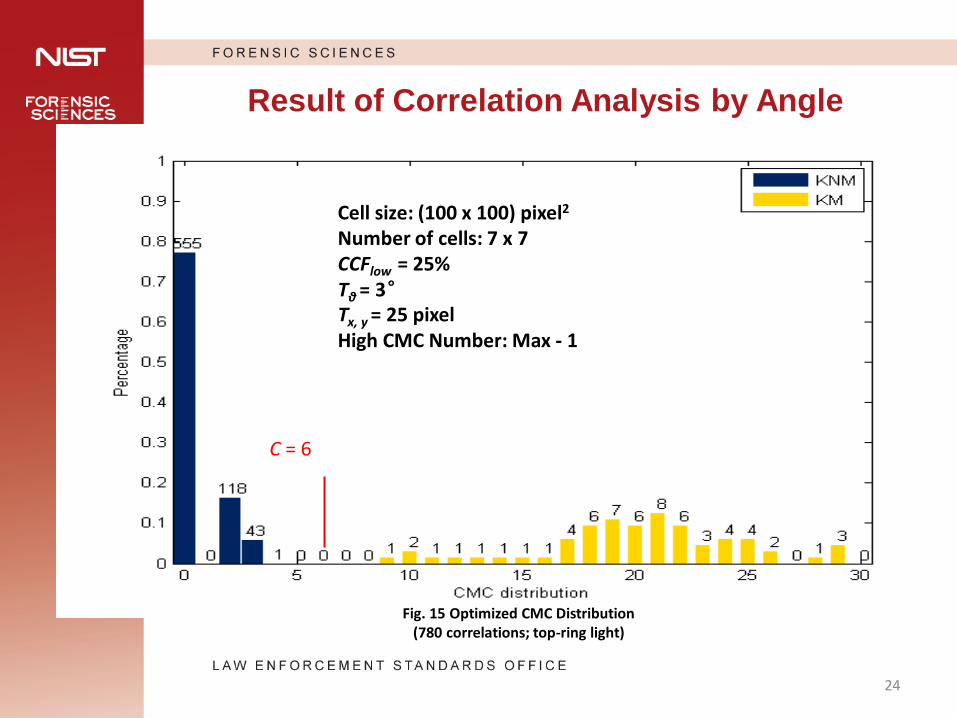
Based on the lower result of a pair of
correlations (forward and reverse correlations)
with the original CMC method, and using the
assisted analysis results then an optimized
result with no misidentification or missed
identification is shown in Fig. 15 following.
23
24
Result of Correlation Analysis by Angle
Cell size: (100 x 100) pixel2 Number of cells: 7 x 7
CCFlow = 25%
Tθ = 3°
Tx, y = 25 pixel High CMC Number: Max - 1
C = 6
Fig. 15 Optimized CMC Distribution (780 correlations; top-ring light)
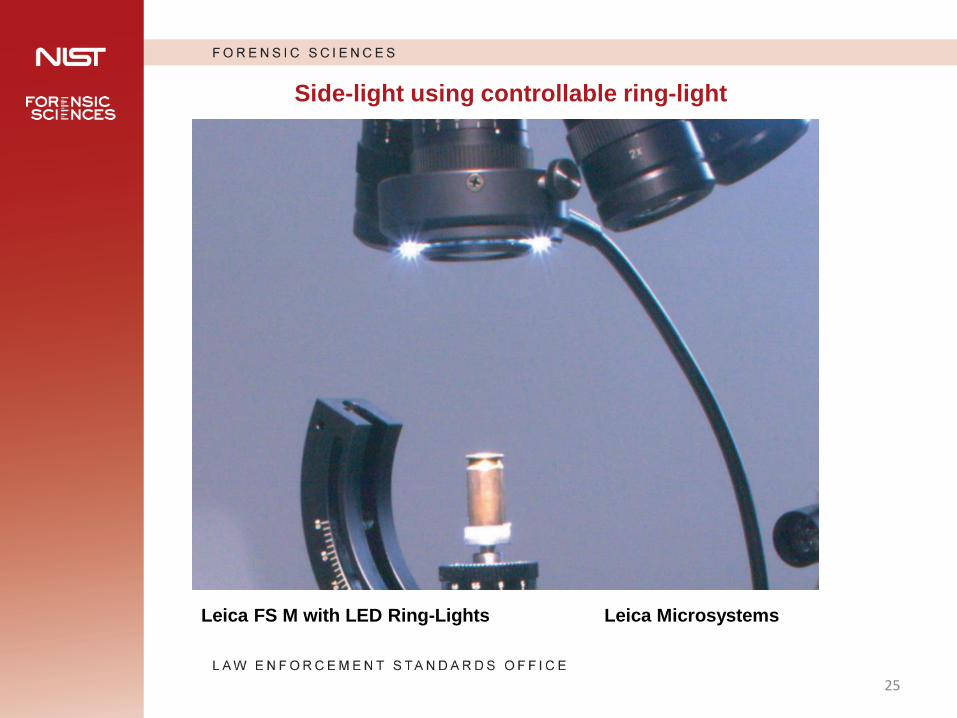
Side-light using controllable ring-light
Leica FS M with LED Ring-Lights Leica Microsystems
25
5. Side Light Test and Result
Examiners typically use a side light when they are
reviewing comparisons. The side light adds surface
contrasts that in turn give a better sense of depth and
texture of the primer surface.*
We made an initial test using the CMC method for side
light images. Images from all 40 cases were captured
using side light. The correlations gave much better
results than ring light (see Fig. 16).
(* National Research Council of the National Academies, Ballistic
Imaging:182)
26
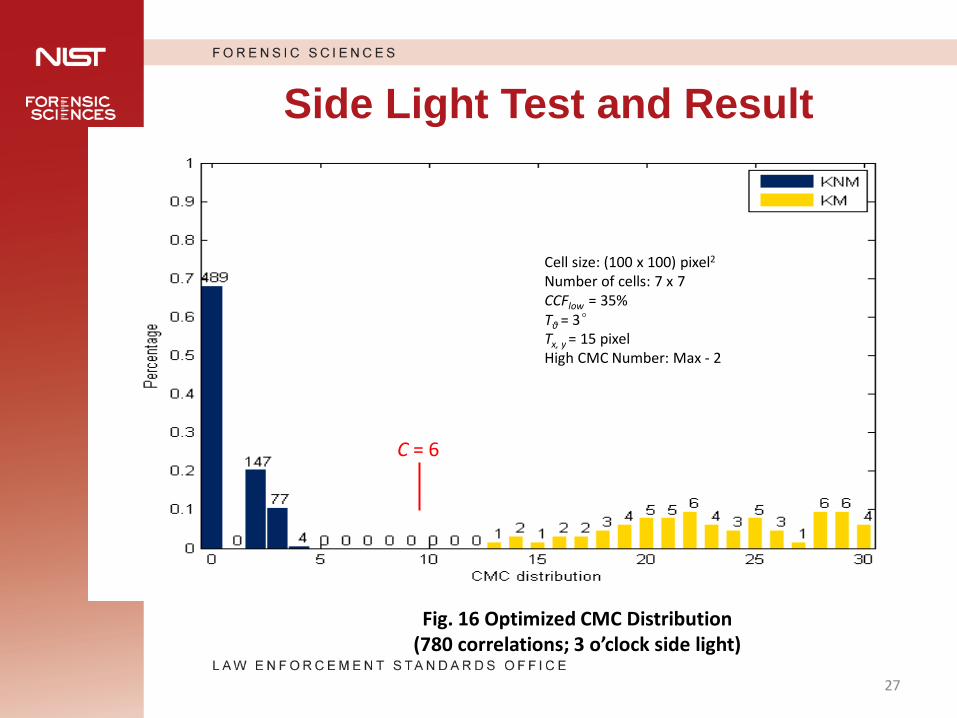
Side Light Test and Result
27
Cell size: (100 x 100) pixel2 Number of cells: 7 x 7
CCFlow = 35%
Tθ = 3°
Tx, y = 15 pixel High CMC Number: Max - 2
C = 6
Fig. 16 Optimized CMC Distribution (780 correlations; 3 o’clock side light)
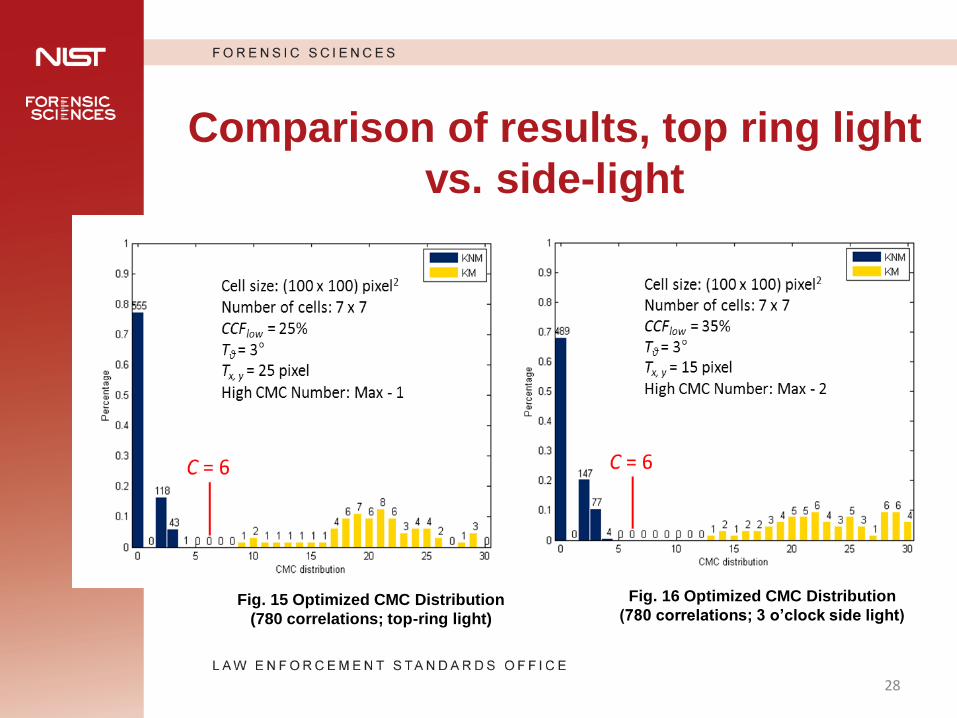
Comparison of results, top ring light
vs. side-light
Fig. 15 Optimized CMC Distribution
(780 correlations; top-ring light)
Fig. 16 Optimized CMC Distribution
(780 correlations; 3 o’clock side light)
28
6. Conclusions and Future Work
The CMC method and the proposed numerical
identification criterion (C ≥ 6) for ballistic
identification were proven effective in three-
dimensional topography images of cartridge case
by NIST. Results were obtained without any false
positive or false negative identification.
In the optical images of the same 40 samples test,
one case was “Falsely excluded” using the
original CMC method. This might indicate that
topography data is still better suited for ballistics
identification than optical images.
29
Conclusions and Future Work
However, the proposed assisted analysis method
based on features of CMC can effectively enhance
this identification accuracy. The correlation
results show a significant separation between the
KM and KNM distributions without any false
positive or false negative identification. As an
assisted technology, initial tests show promise.
Additionally, these improvements can also used
for topography comparisons and identification.
30
Conclusions and Future Work
In the initial test, the side light images
demonstrate better results than ring light, and
close to topography correlation results.
However the side light approach lacks a unified
illumination standard that may limit the side light
applications in search systems. In our future
work, more lighting variables will be tested and
analyzed.
31
Conclusions and Future Work
In our future plans, more impression “signatures”
on cartridge case will be tested, including firing
pin and ejector marks, using derivatives of the
CMC method.
We are also finalizing an error rate reporting
method for ballistics identification based on the
CMC method.
32

Thanks for your attention!
Questions?
33