Embed Size (px)
Citation preview
Texas Workers’ Compensation System Trends
Presentation for the Workers’ Compensation 2012 Biennial Rate Hearing
Texas Department of InsuranceWorkers’ Compensation Research and Evaluation Group
December, 2012
2
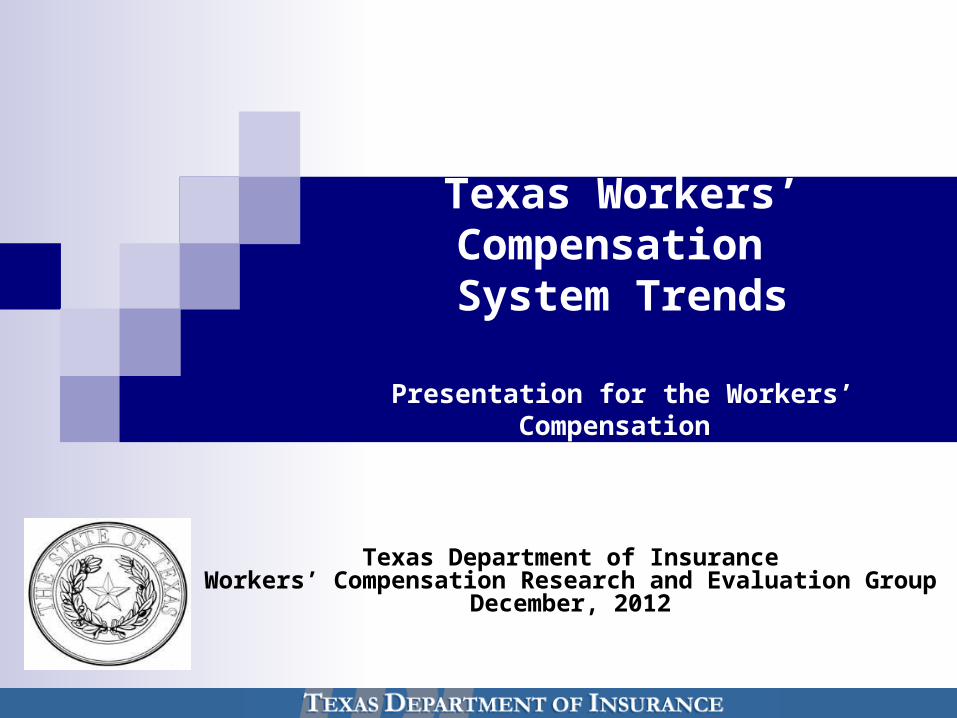
Key Legislative and Regulatory Implementation Dates 2001-2011
June 17, 2001 – HB 2600 (Rep. Brimer, Sen. Duncan)
August 1, 2003 – effective date of new Medicare-based professional service fee guideline
September 1, 2005 - HB 7 (Rep. Solomons, Sen. Staples)
April 2006 – first workers’ compensation network certified
May 1, 2007 – effective date of adoption of treatment and return-to-work guidelines
March 1, 2008 – effective date of new professional service, inpatient and outpatient hospital fee guidelines
September 1, 2011 – effective date of pharmacy closed formulary

3
Occupational Injury Trends
4
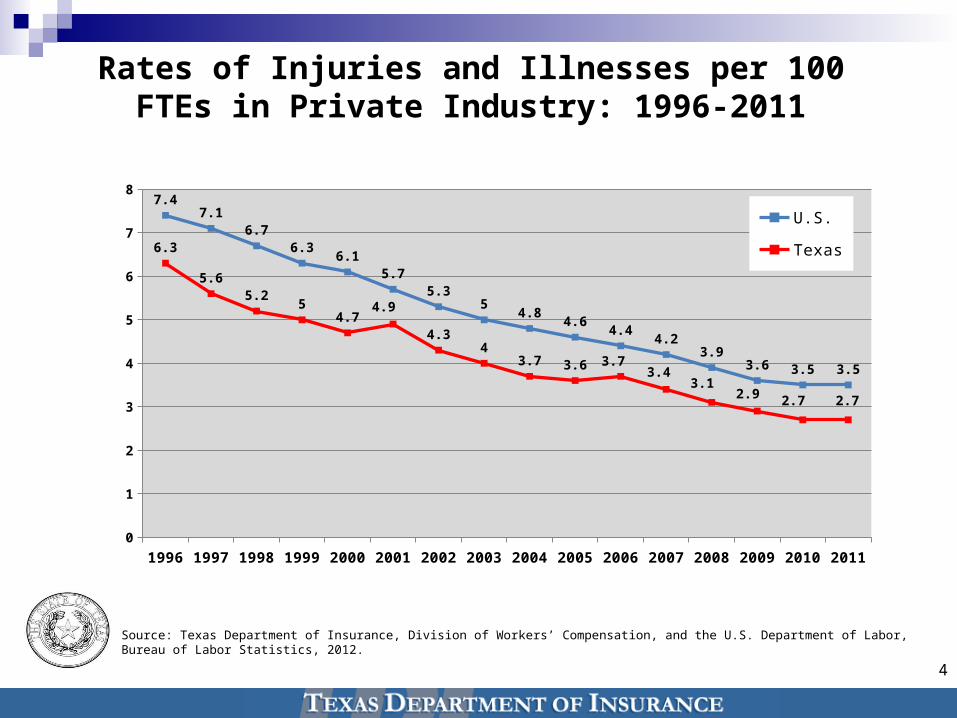
Rates of Injuries and Illnesses per 100 FTEs in Private Industry: 1996-2011
Source: Texas Department of Insurance, Division of Workers’ Compensation, and the U.S. Department of Labor, Bureau of Labor Statistics, 2012.
1996 1997 1998 1999 2000 2001 2002 2003 2004 2005 2006 2007 2008 2009 2010 20110
1
2
3
4
5
6
7
87.4
7.16.7
6.36.1
5.75.3
54.8
4.64.4
4.23.9
3.6 3.5 3.5
6.3
5.65.2
54.7
4.9
4.34
3.7 3.6 3.73.4
3.12.9 2.7 2.7
U.S.
Texas
5
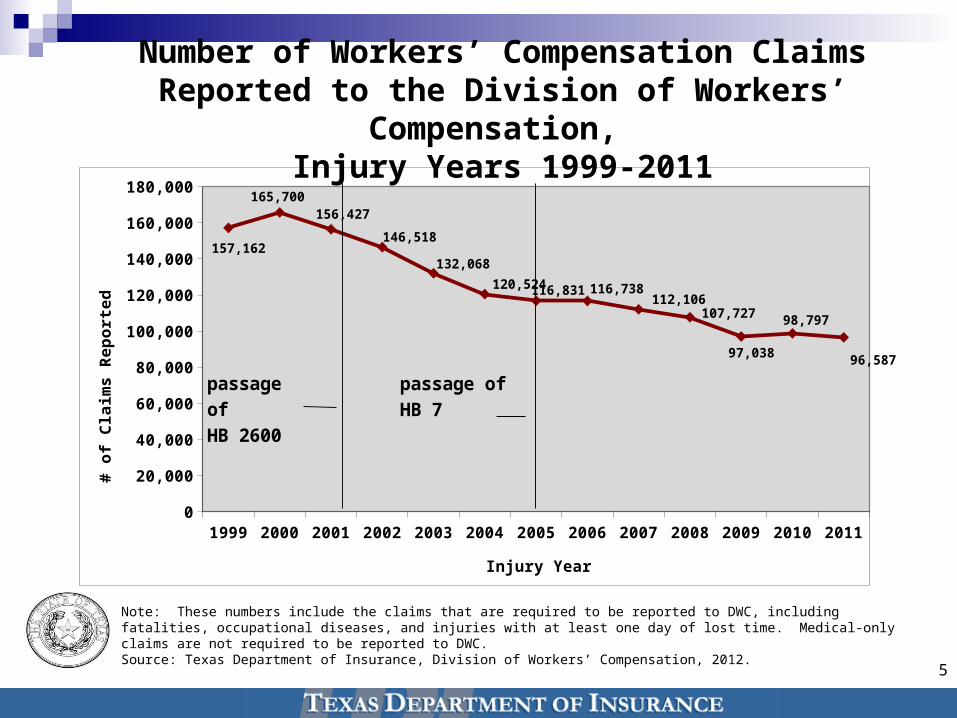
Number of Workers’ Compensation Claims Reported to the Division of Workers’ Compensation,
Injury Years 1999-2011
1999 2000 2001 2002 2003 2004 2005 2006 2007 2008 2009 2010 20110
20,000
40,000
60,000
80,000
100,000
120,000
140,000
160,000
180,000
157,162
165,700156,427
146,518
132,068
120,524116,831 116,738112,106
107,727
97,038
98,797
96,587
Injury Year
# o
f Cla
ims
Rep
ort
ed
passage of HB 2600
passage of HB 7
Note: These numbers include the claims that are required to be reported to DWC, including fatalities, occupational diseases, and injuries with at least one day of lost time. Medical-only claims are not required to be reported to DWC.Source: Texas Department of Insurance, Division of Workers’ Compensation, 2012.
6
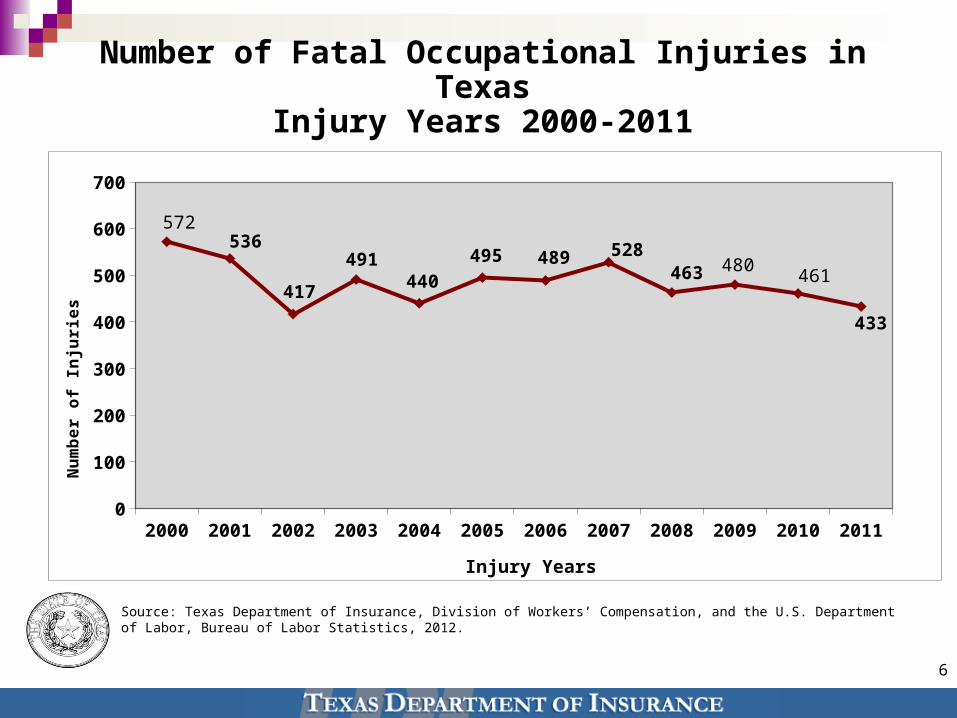
Number of Fatal Occupational Injuries in TexasInjury Years 2000-2011
2000 2001 2002 2003 2004 2005 2006 2007 2008 2009 2010 20110
100
200
300
400
500
600
700
572536
417
491440
495 489 528463 480
461
433
Injury Years
Nu
mb
er
of
Inju
rie
s
Source: Texas Department of Insurance, Division of Workers’ Compensation, and the U.S. Department of Labor, Bureau of Labor Statistics, 2012.

7
Return-to-Work Outcomesfor Texas Injured Workers
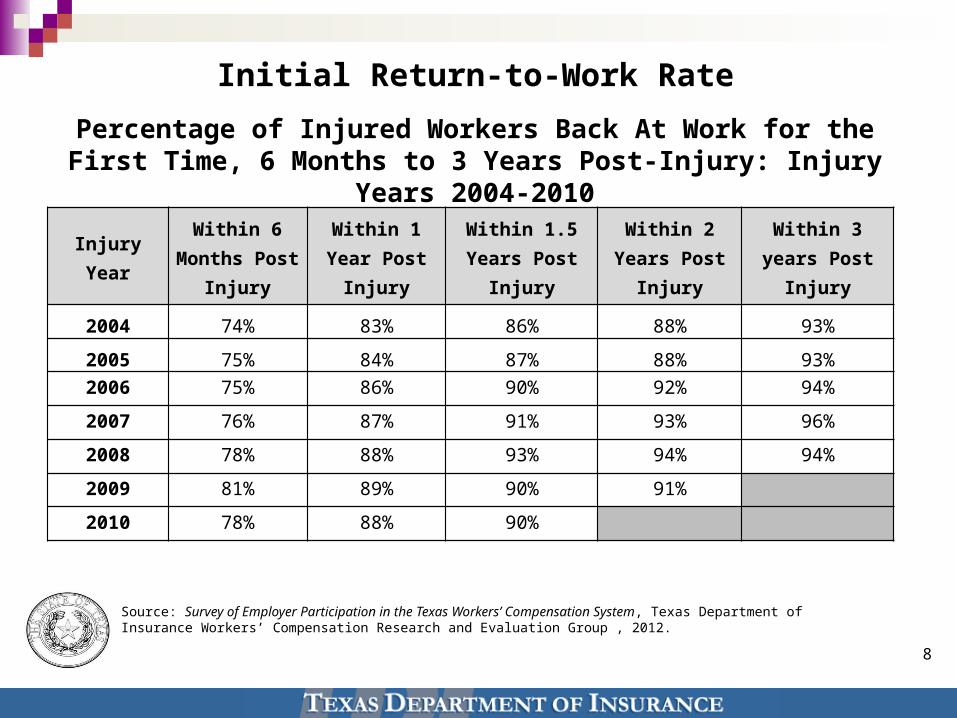
Percentage of Injured Workers Back At Work for the First Time, 6 Months to 3 Years Post-Injury: Injury Years 2004-2010
8
Source: Survey of Employer Participation in the Texas Workers’ Compensation System, Texas Department of Insurance Workers’ Compensation Research and Evaluation Group , 2012.
Injury YearWithin 6
Months Post Injury
Within 1 Year Post Injury
Within 1.5 Years Post
Injury
Within 2 Years Post Injury
Within 3 years Post Injury
2004 74% 83% 86% 88% 93%
2005 75% 84% 87% 88% 93%
2006 75% 86% 90% 92% 94%
2007 76% 87% 91% 93% 96%
2008 78% 88% 93% 94% 94%
2009 81% 89% 90% 91%
2010 78% 88% 90%
Initial Return-to-Work Rate
9
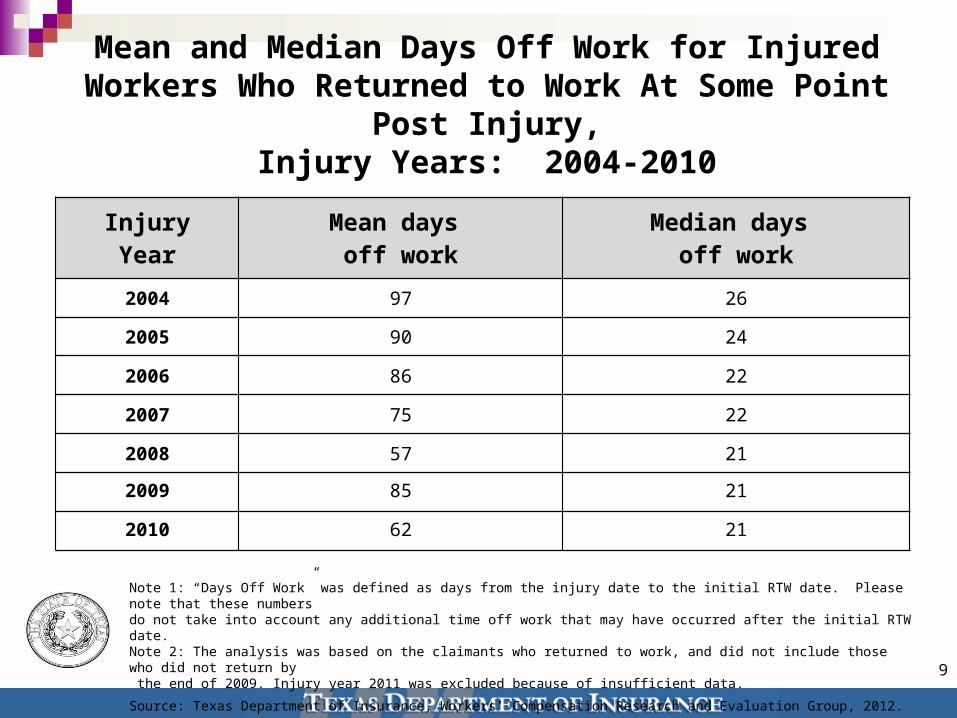
Mean and Median Days Off Work for Injured Workers Who Returned to Work At Some Point Post Injury,
Injury Years: 2004-2010
Note 1: “Days Off Work” was defined as days from the injury date to the initial RTW date. Please note that these numbers do not take into account any additional time off work that may have occurred after the initial RTW date. Note 2: The analysis was based on the claimants who returned to work, and did not include those who did not return by the end of 2009. Injury year 2011 was excluded because of insufficient data.
Source: Texas Department of Insurance, Workers’ Compensation Research and Evaluation Group, 2012.
InjuryYear
Mean days off work
Median days off work
2004 97 26
2005 90 24
2006 86 22
2007 75 22
2008 57 21
2009 85 21
2010 62 21
10
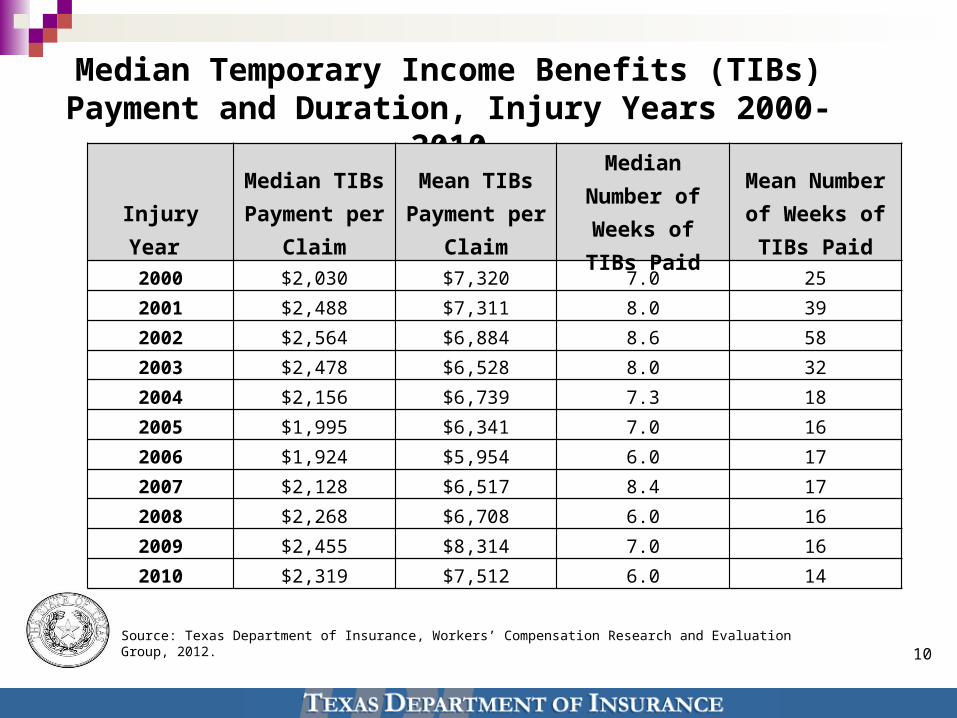
Median Temporary Income Benefits (TIBs) Payment and Duration, Injury Years 2000-2010
Injury Year
Median TIBs Payment per
Claim
Mean TIBs Payment per
Claim
Median Number of
Weeks of TIBs Paid
Mean Number of Weeks of TIBs Paid
2000 $2,030 $7,320 7.0 25
2001 $2,488 $7,311 8.0 39
2002 $2,564 $6,884 8.6 58
2003 $2,478 $6,528 8.0 32
2004 $2,156 $6,739 7.3 18
2005 $1,995 $6,341 7.0 16
2006 $1,924 $5,954 6.0 17
2007 $2,128 $6,517 8.4 17
2008 $2,268 $6,708 6.0 16
2009 $2,455 $8,314 7.0 16
2010 $2,319 $7,512 6.0 14
Source: Texas Department of Insurance, Workers’ Compensation Research and Evaluation Group, 2012.
11
MedicalCosts and Utilization
12
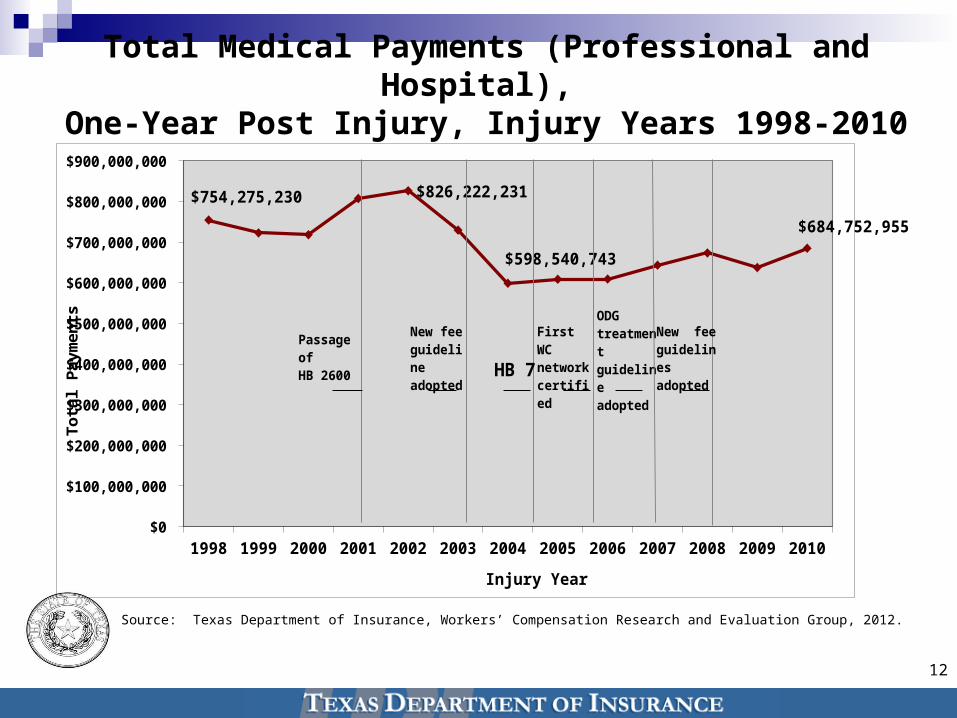
Total Medical Payments (Professional and Hospital), One-Year Post Injury, Injury Years 1998-2010
1998 1999 2000 2001 2002 2003 2004 2005 2006 2007 2008 2009 2010$0
$100,000,000
$200,000,000
$300,000,000
$400,000,000
$500,000,000
$600,000,000
$700,000,000
$800,000,000
$900,000,000
$754,275,230 $826,222,231
$598,540,743
$684,752,955
Injury Year
To
tal
Pay
men
ts
Passage of HB 2600
New fee guideline adopted
HB 7
ODG treatment guideline adopted
First WC network certified
New fee guidelines adopted
Source: Texas Department of Insurance, Workers’ Compensation Research and Evaluation Group, 2012.
13
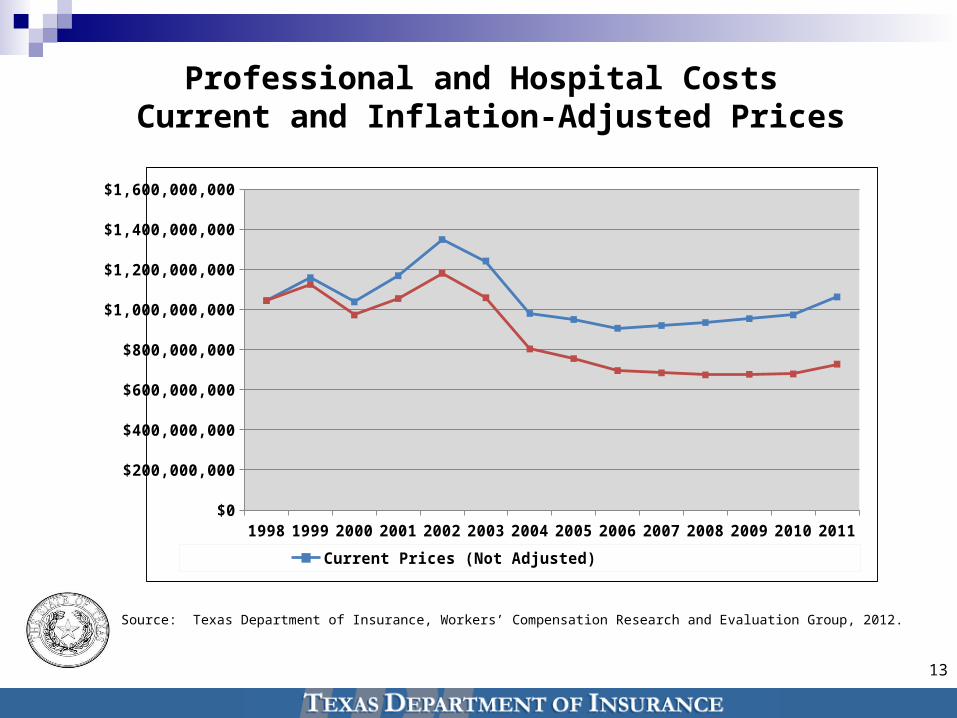
Professional and Hospital Costs Current and Inflation-Adjusted Prices
Source: Texas Department of Insurance, Workers’ Compensation Research and Evaluation Group, 2012.
1998 1999 2000 2001 2002 2003 2004 2005 2006 2007 2008 2009 2010 2011$0
$200,000,000
$400,000,000
$600,000,000
$800,000,000
$1,000,000,000
$1,200,000,000
$1,400,000,000
$1,600,000,000
Current Prices (Not Adjusted) 1998 Constant Prices (Adjusted for Inflation)
14
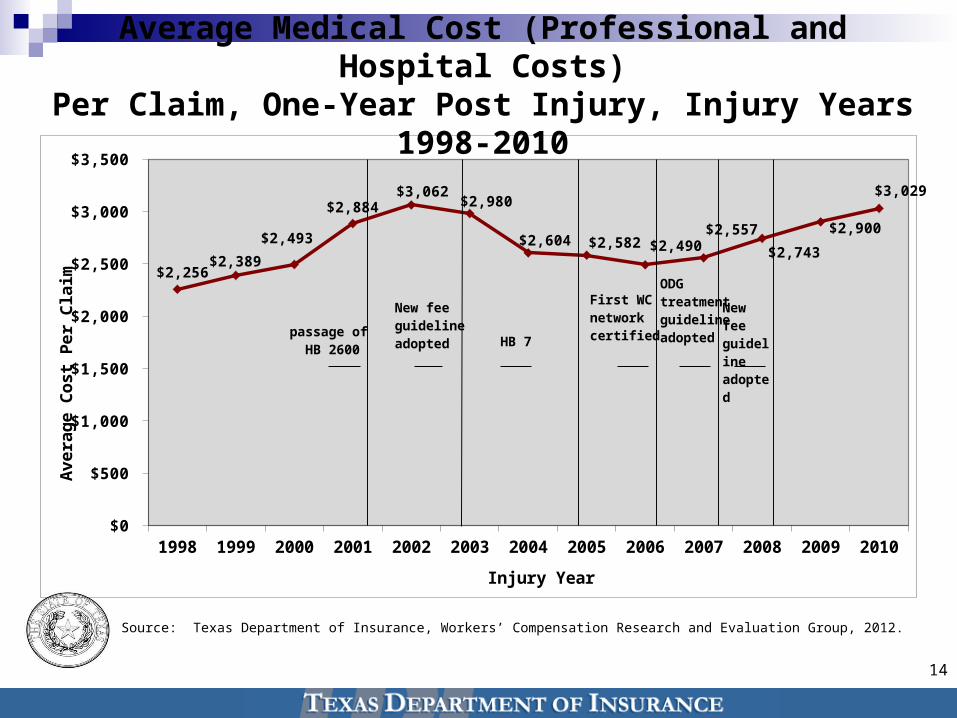
Average Medical Cost (Professional and Hospital Costs)Per Claim, One-Year Post Injury, Injury Years 1998-2010
1998 1999 2000 2001 2002 2003 2004 2005 2006 2007 2008 2009 2010$0
$500
$1,000
$1,500
$2,000
$2,500
$3,000
$3,500
$2,256 $2,389
$2,493
$2,884 $3,062
$2,980
$2,604 $2,582 $2,490 $2,557
$2,743
$2,900
$3,029
Injury Year
Ave
rag
e C
ost
Per
Cla
im
passage of HB 2600
HB 7
First WC network cer-tified
New fee guideline adopted
ODG treat-ment guideline adoptedNew fee guide-
line adopted
Source: Texas Department of Insurance, Workers’ Compensation Research and Evaluation Group, 2012.
15
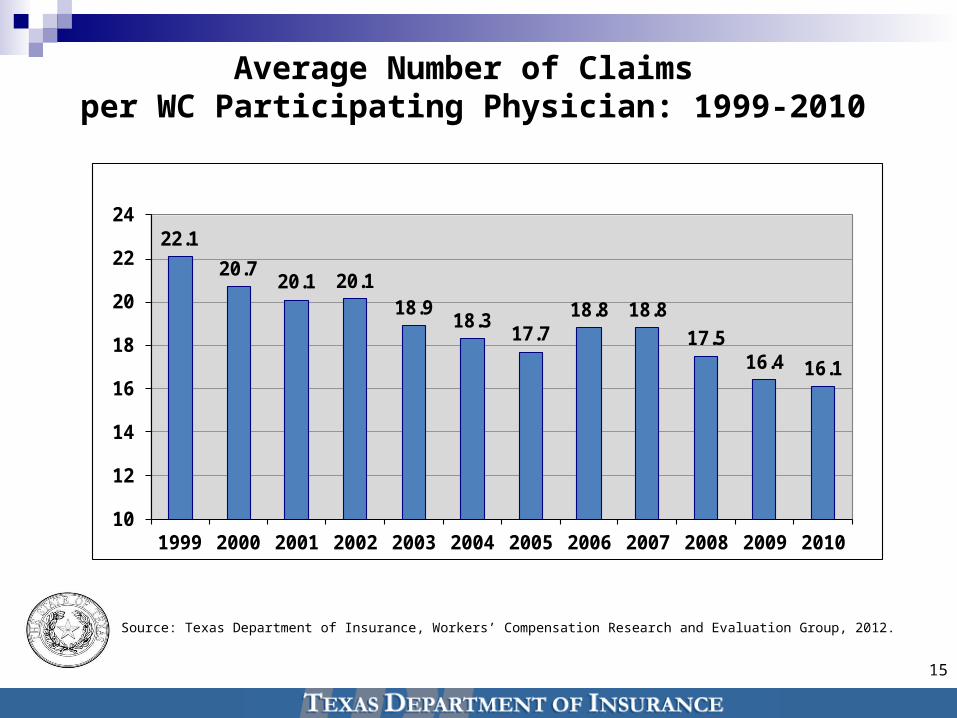
Average Number of Claims per WC Participating Physician: 1999-2010
Source: Texas Department of Insurance, Workers’ Compensation Research and Evaluation Group, 2012.
22.1
20.720.1 20.1
18.918.3
17.718.8 18.8
17.516.4 16.1
10
12
14
16
18
20
22
24
1999 2000 2001 2002 2003 2004 2005 2006 2007 2008 2009 2010
16
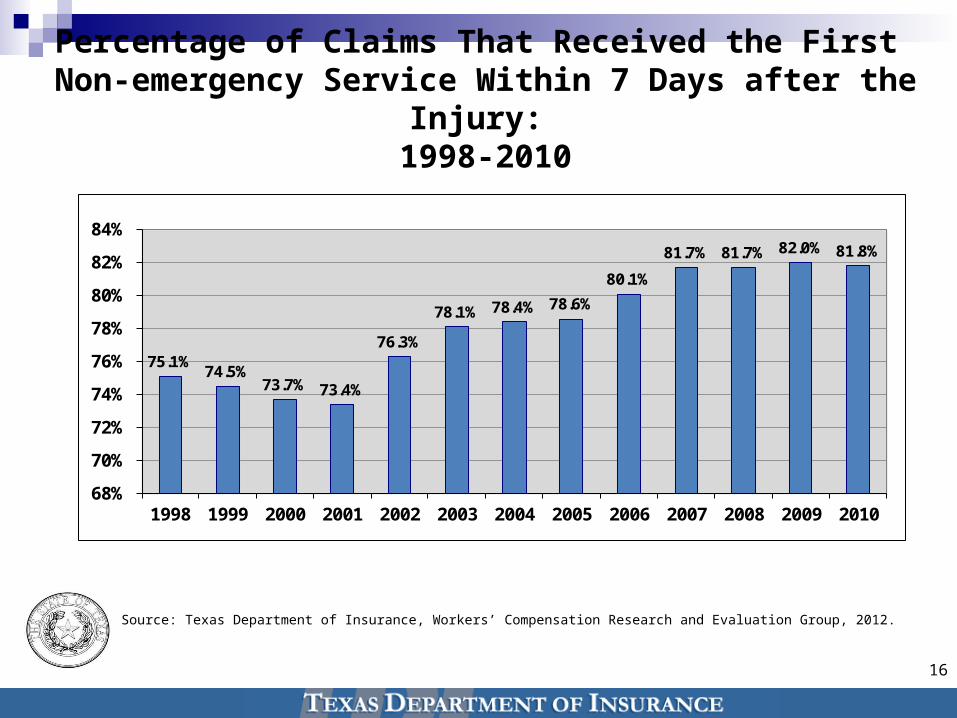
Percentage of Claims That Received the First Non-emergency Service Within 7 Days after the Injury:
1998-2010
75.1%74.5%
73.7% 73.4%
76.3%
78.1% 78.4% 78.6%
80.1%
81.7% 81.7% 82.0% 81.8%
68%
70%
72%
74%
76%
78%
80%
82%
84%
1998 1999 2000 2001 2002 2003 2004 2005 2006 2007 2008 2009 2010
Source: Texas Department of Insurance, Workers’ Compensation Research and Evaluation Group, 2012.
17
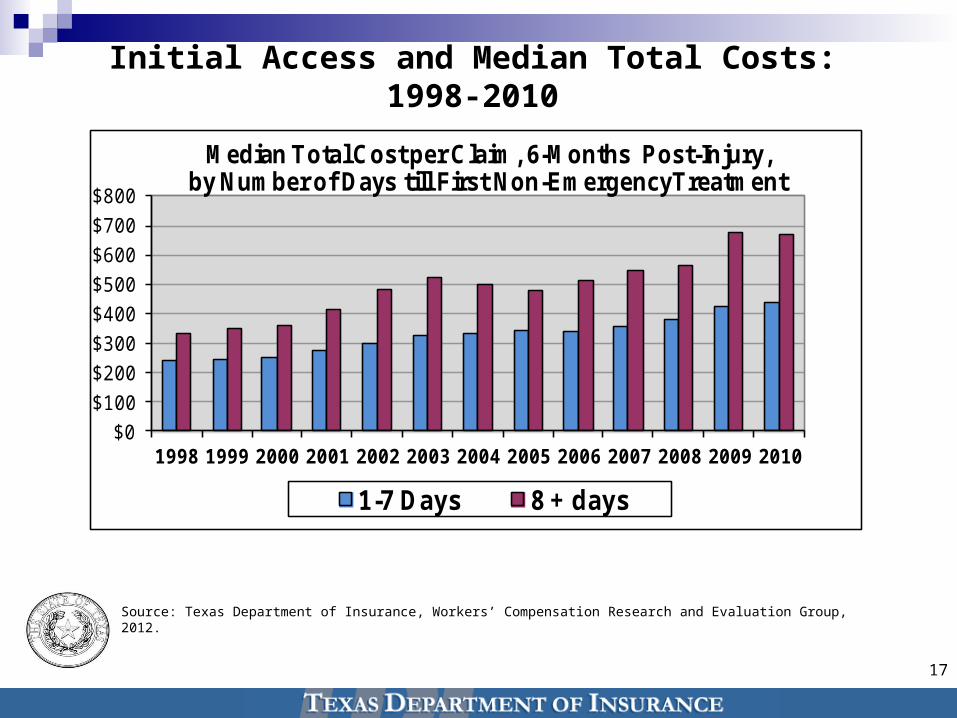
Initial Access and Median Total Costs: 1998-2010
$0
$100
$200
$300
$400
$500
$600
$700
$800
1998 1999 2000 2001 2002 2003 2004 2005 2006 2007 2008 2009 2010
Median Total Cost per Claim, 6-Months Post-Injury,by Number of Days till First Non-EmergencyTreatment
1-7 Days 8 + days
Source: Texas Department of Insurance, Workers’ Compensation Research and Evaluation Group, 2012.

18
Claim and Medical Denial Trends
19
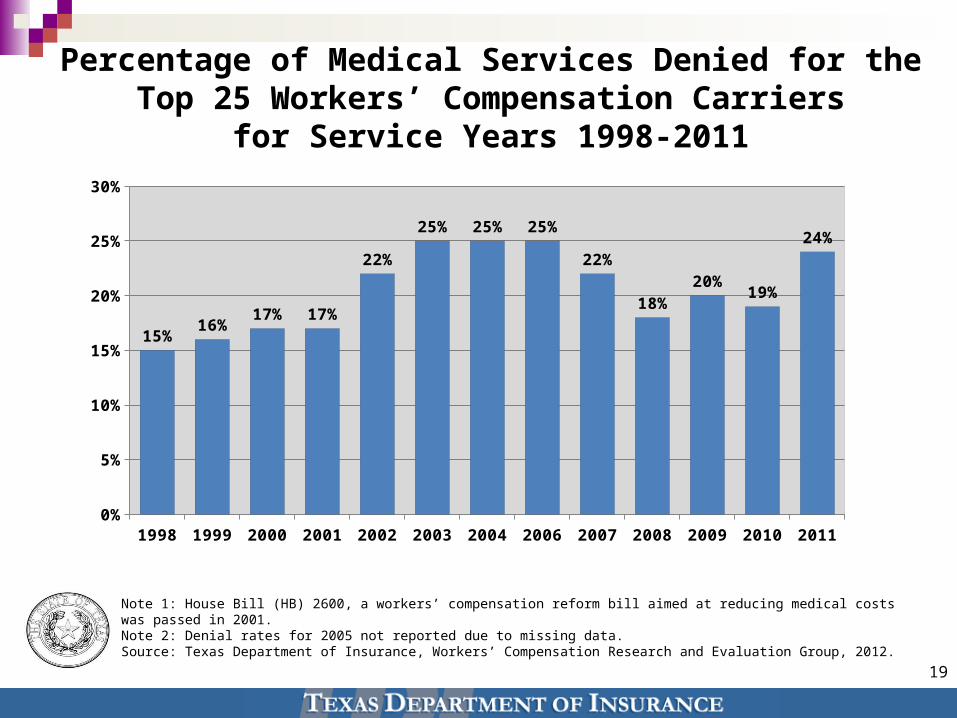
Note 1: House Bill (HB) 2600, a workers’ compensation reform bill aimed at reducing medical costs was passed in 2001.Note 2: Denial rates for 2005 not reported due to missing data. Source: Texas Department of Insurance, Workers’ Compensation Research and Evaluation Group, 2012.
Percentage of Medical Services Denied for the Top 25 Workers’ Compensation Carriers
for Service Years 1998-2011
1998 1999 2000 2001 2002 2003 2004 2006 2007 2008 2009 2010 20110%
5%
10%
15%
20%
25%
30%
15%16%
17% 17%
22%
25% 25% 25%
22%
18%20%
19%
24%
20
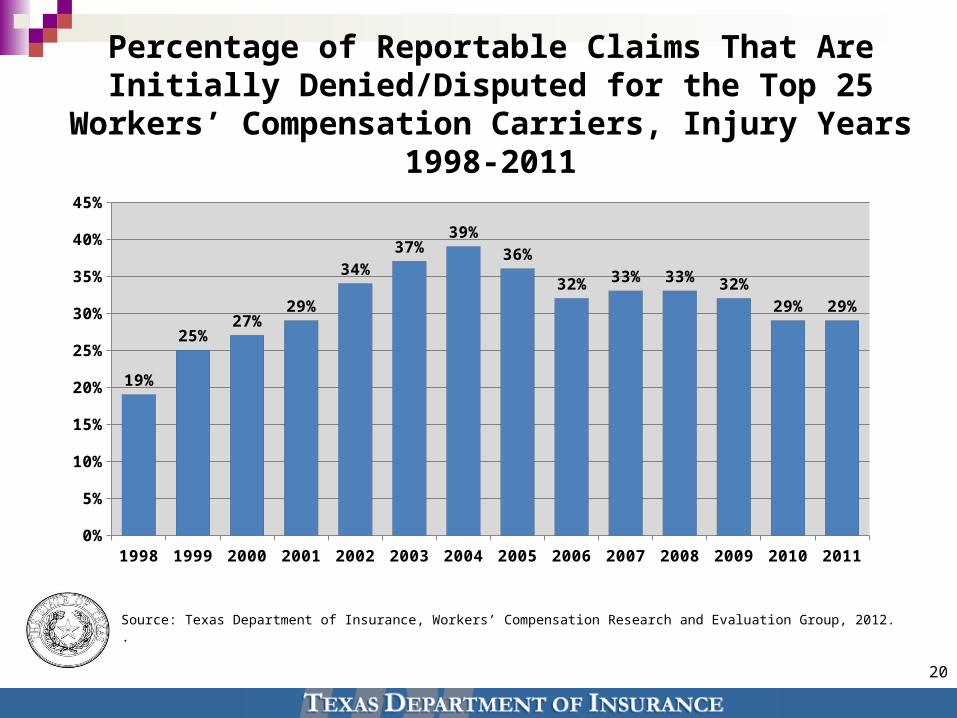
Source: Texas Department of Insurance, Workers’ Compensation Research and Evaluation Group, 2012..
Percentage of Reportable Claims That Are Initially Denied/Disputed for the Top 25 Workers’ Compensation
Carriers, Injury Years 1998-2011
1998 1999 2000 2001 2002 2003 2004 2005 2006 2007 2008 2009 2010 20110%
5%
10%
15%
20%
25%
30%
35%
40%
45%
19%
25%27%
29%
34%
37%39%
36%
32% 33% 33% 32%
29% 29%
21
Employer and Employee Participation Rates in the
Texas WC System
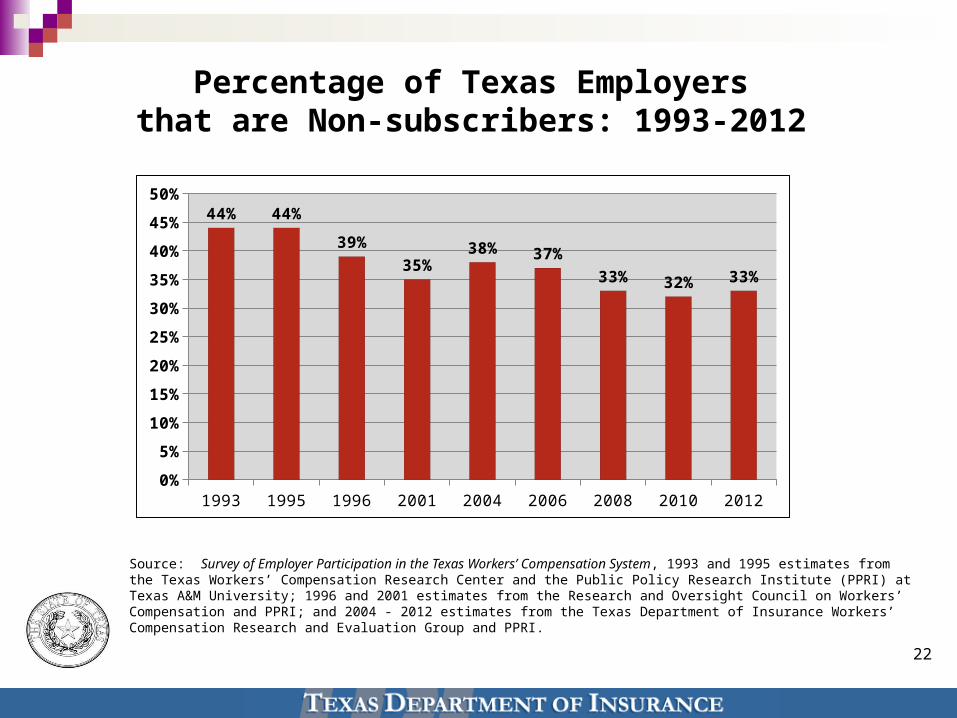
Percentage of Texas Employersthat are Non-subscribers: 1993-2012
22
Source: Survey of Employer Participation in the Texas Workers’ Compensation System, 1993 and 1995 estimates from the Texas Workers’ Compensation Research Center and the Public Policy Research Institute (PPRI) at Texas A&M University; 1996 and 2001 estimates from the Research and Oversight Council on Workers’ Compensation and PPRI; and 2004 - 2012 estimates from the Texas Department of Insurance Workers’ Compensation Research and Evaluation Group and PPRI.
1993 1995 1996 2001 2004 2006 2008 2010 20120%
5%
10%
15%
20%
25%
30%
35%
40%
45%
50%
44% 44%
39%
35%38% 37%
33% 32% 33%
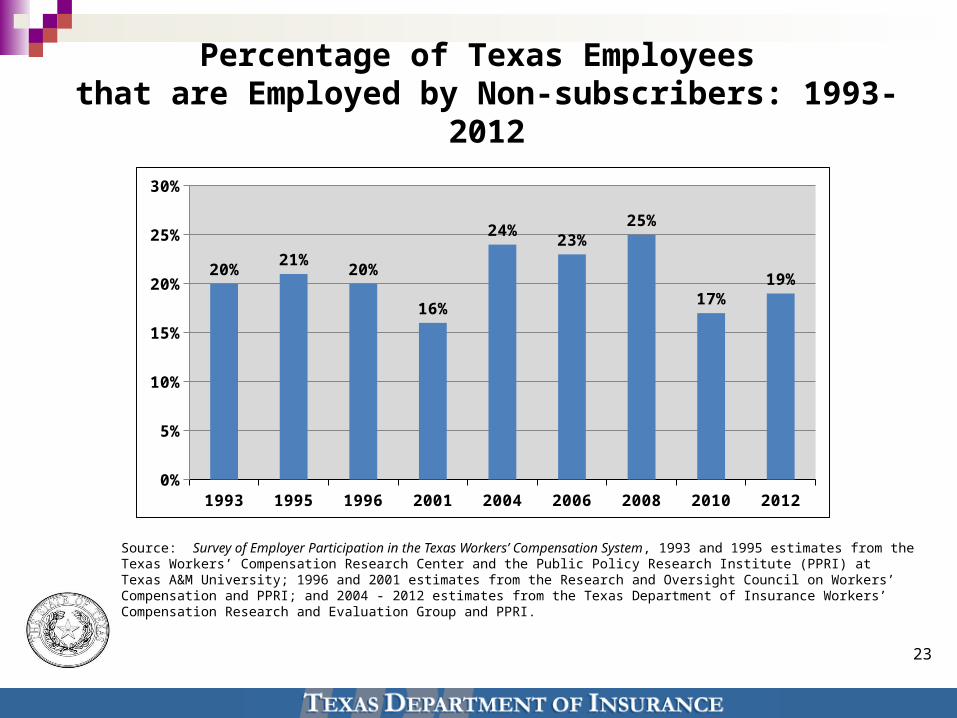
Percentage of Texas Employees that are Employed by Non-subscribers: 1993-2012
23
Source: Survey of Employer Participation in the Texas Workers’ Compensation System, 1993 and 1995 estimates from the Texas Workers’ Compensation Research Center and the Public Policy Research Institute (PPRI) at Texas A&M University; 1996 and 2001 estimates from the Research and Oversight Council on Workers’ Compensation and PPRI; and 2004 - 2012 estimates from the Texas Department of Insurance Workers’ Compensation Research and Evaluation Group and PPRI.
1993 1995 1996 2001 2004 2006 2008 2010 20120%
5%
10%
15%
20%
25%
30%
20%21%
20%
16%
24%23%
25%
17%19%
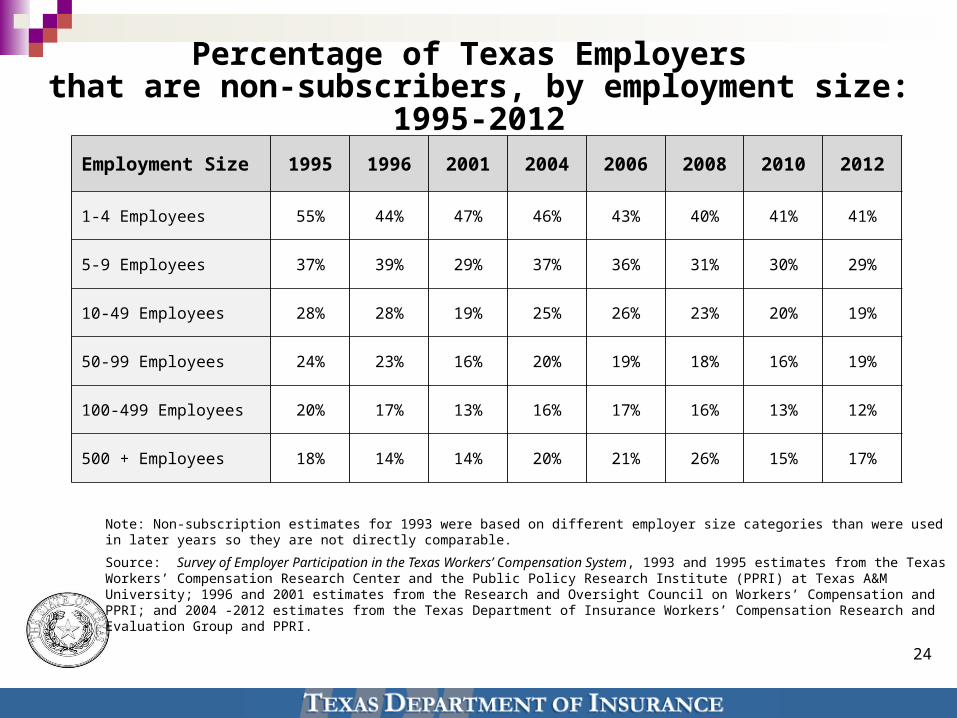
Percentage of Texas Employers that are non-subscribers, by employment size: 1995-2012
Employment Size 1995 1996 2001 2004 2006 2008 2010 2012
1-4 Employees 55% 44% 47% 46% 43% 40% 41% 41%
5-9 Employees 37% 39% 29% 37% 36% 31% 30% 29%
10-49 Employees 28% 28% 19% 25% 26% 23% 20% 19%
50-99 Employees 24% 23% 16% 20% 19% 18% 16% 19%
100-499 Employees 20% 17% 13% 16% 17% 16% 13% 12%
500 + Employees 18% 14% 14% 20% 21% 26% 15% 17%
24
Note: Non-subscription estimates for 1993 were based on different employer size categories than were used in later years so they are not directly comparable.
Source: Survey of Employer Participation in the Texas Workers’ Compensation System, 1993 and 1995 estimates from the Texas Workers’ Compensation Research Center and the Public Policy Research Institute (PPRI) at Texas A&M University; 1996 and 2001 estimates from the Research and Oversight Council on Workers’ Compensation and PPRI; and 2004 -2012 estimates from the Texas Department of Insurance Workers’ Compensation Research and Evaluation Group and PPRI.
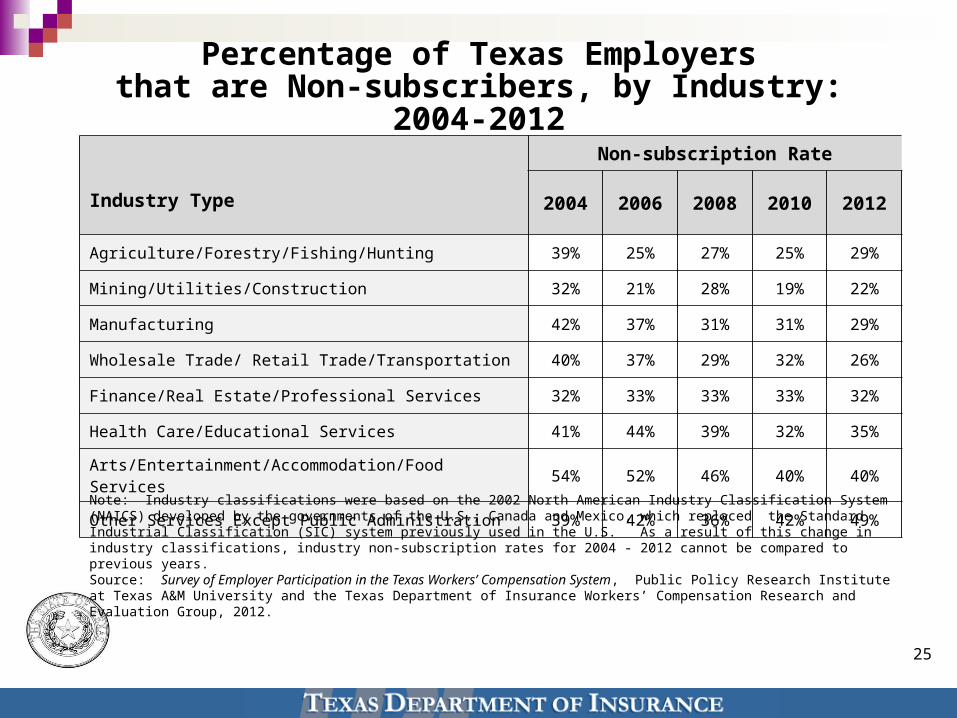
Percentage of Texas Employersthat are Non-subscribers, by Industry: 2004-2012
25
Industry Type
Non-subscription Rate
2004 2006 2008 2010 2012
Agriculture/Forestry/Fishing/Hunting 39% 25% 27% 25% 29%
Mining/Utilities/Construction 32% 21% 28% 19% 22%
Manufacturing 42% 37% 31% 31% 29%
Wholesale Trade/ Retail Trade/Transportation 40% 37% 29% 32% 26%
Finance/Real Estate/Professional Services 32% 33% 33% 33% 32%
Health Care/Educational Services 41% 44% 39% 32% 35%
Arts/Entertainment/Accommodation/Food Services 54% 52% 46% 40% 40%
Other Services Except Public Administration 39% 42% 36% 42% 49%Note: Industry classifications were based on the 2002 North American Industry Classification System (NAICS) developed by the governments of the U.S., Canada and Mexico, which replaced the Standard Industrial Classification (SIC) system previously used in the U.S. As a result of this change in industry classifications, industry non-subscription rates for 2004 - 2012 cannot be compared to previous years.Source: Survey of Employer Participation in the Texas Workers’ Compensation System, Public Policy Research Institute at Texas A&M University and the Texas Department of Insurance Workers’ Compensation Research and Evaluation Group, 2012.
26
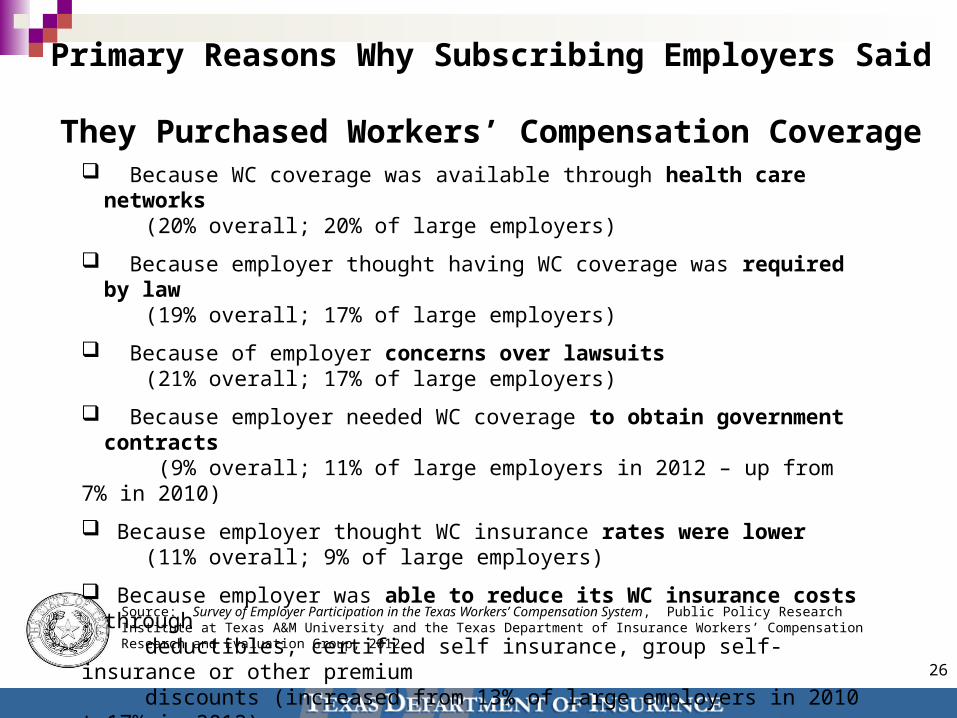
Primary Reasons Why Subscribing Employers Said They Purchased Workers’ Compensation Coverage
Source: Survey of Employer Participation in the Texas Workers’ Compensation System, Public Policy Research Institute at Texas A&M University and the Texas Department of Insurance Workers’ Compensation Research and Evaluation Group, 2012.
Because WC coverage was available through health care networks (20% overall; 20% of large employers)
Because employer thought having WC coverage was required by law (19% overall; 17% of large employers)
Because of employer concerns over lawsuits (21% overall; 17% of large employers)
Because employer needed WC coverage to obtain government contracts (9% overall; 11% of large employers in 2012 – up from 7% in 2010)
Because employer thought WC insurance rates were lower (11% overall; 9% of large employers)
Because employer was able to reduce its WC insurance costs through deductibles, certified self insurance, group self-insurance or other premium discounts (increased from 13% of large employers in 2010 to17% in 2012)
27
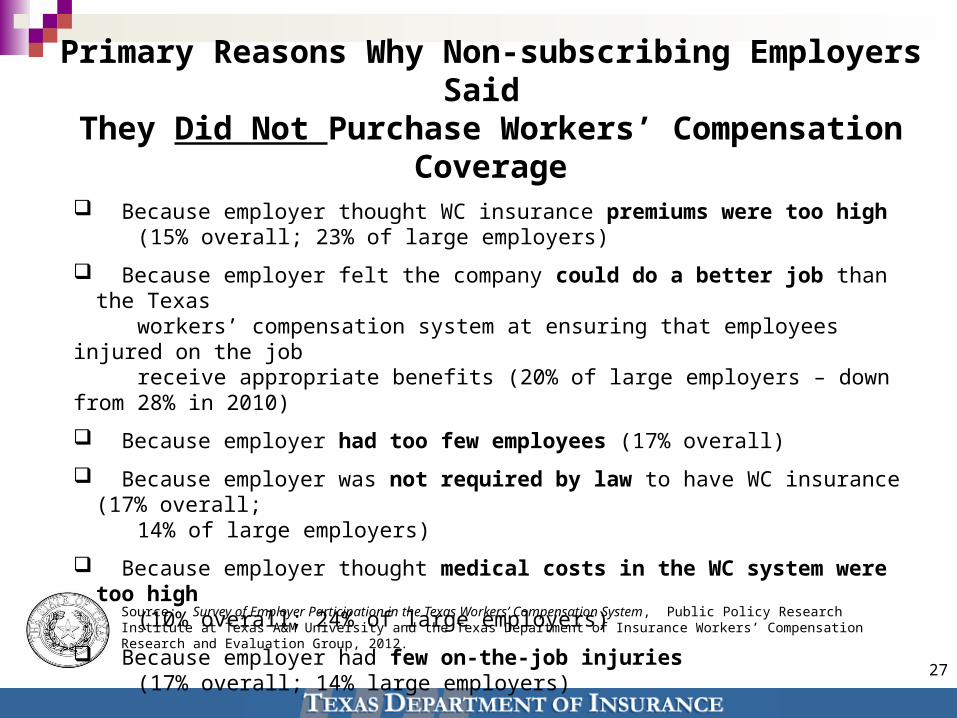
Primary Reasons Why Non-subscribing Employers Said They Did Not Purchase Workers’ Compensation Coverage
Source: Survey of Employer Participation in the Texas Workers’ Compensation System, Public Policy Research Institute at Texas A&M University and the Texas Department of Insurance Workers’ Compensation Research and Evaluation Group, 2012.
Because employer thought WC insurance premiums were too high (15% overall; 23% of large employers)
Because employer felt the company could do a better job than the Texas workers’ compensation system at ensuring that employees injured on the job receive appropriate benefits (20% of large employers – down from 28% in 2010)
Because employer had too few employees (17% overall)
Because employer was not required by law to have WC insurance (17% overall; 14% of large employers)
Because employer thought medical costs in the WC system were too high (10% overall; 24% of large employers)
Because employer had few on-the-job injuries (17% overall; 14% large employers)
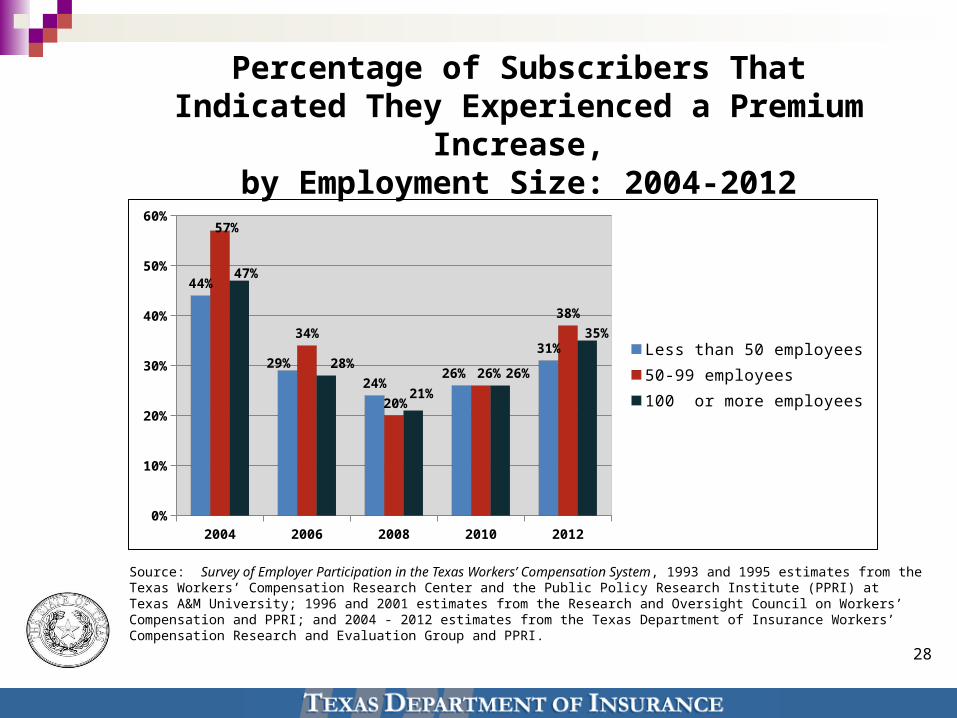
Percentage of Subscribers That Indicated They Experienced a Premium Increase,by Employment Size: 2004-2012
28
Source: Survey of Employer Participation in the Texas Workers’ Compensation System, 1993 and 1995 estimates from the Texas Workers’ Compensation Research Center and the Public Policy Research Institute (PPRI) at Texas A&M University; 1996 and 2001 estimates from the Research and Oversight Council on Workers’ Compensation and PPRI; and 2004 - 2012 estimates from the Texas Department of Insurance Workers’ Compensation Research and Evaluation Group and PPRI.
2004 2006 2008 2010 20120%
10%
20%
30%
40%
50%
60%
44%
29%
24%26%
31%
57%
34%
20%
26%
38%
47%
28%
21%
26%
35%
Less than 50 employees50-99 employees100 or more employees
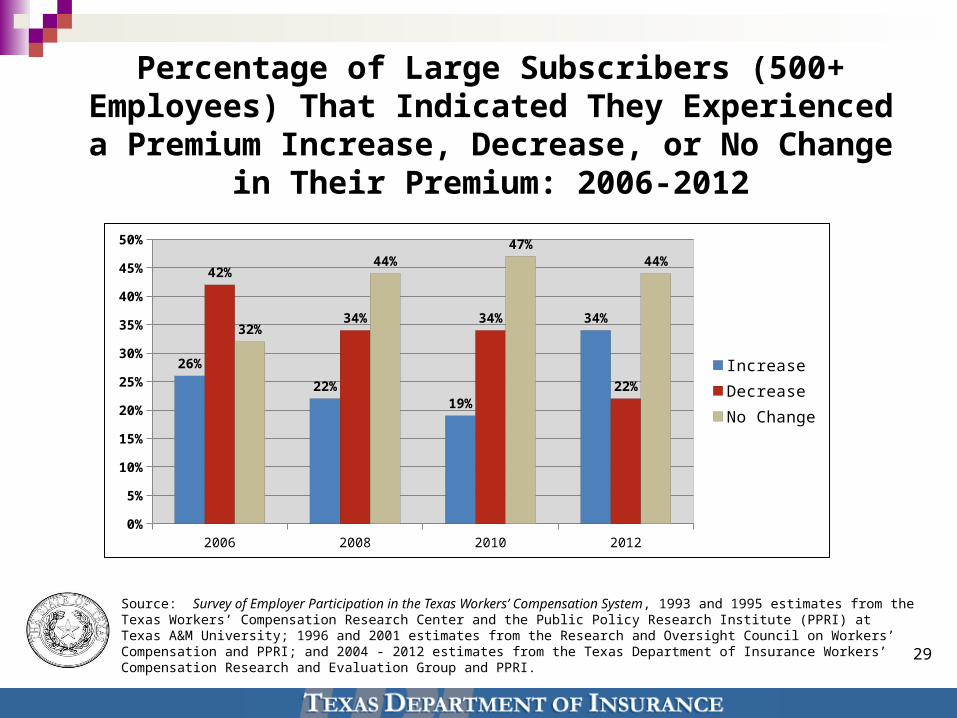
Percentage of Large Subscribers (500+ Employees) That Indicated They Experienced a Premium Increase, Decrease, or No Change in Their Premium: 2006-2012
29
Source: Survey of Employer Participation in the Texas Workers’ Compensation System, 1993 and 1995 estimates from the Texas Workers’ Compensation Research Center and the Public Policy Research Institute (PPRI) at Texas A&M University; 1996 and 2001 estimates from the Research and Oversight Council on Workers’ Compensation and PPRI; and 2004 - 2012 estimates from the Texas Department of Insurance Workers’ Compensation Research and Evaluation Group and PPRI.
2006 2008 2010 20120%
5%
10%
15%
20%
25%
30%
35%
40%
45%
50%
26%
22%19%
34%
42%
34% 34%
22%
32%
44%47%
44%
IncreaseDecreaseNo Change

30
Workers’ Compensation Network Participation
Levels
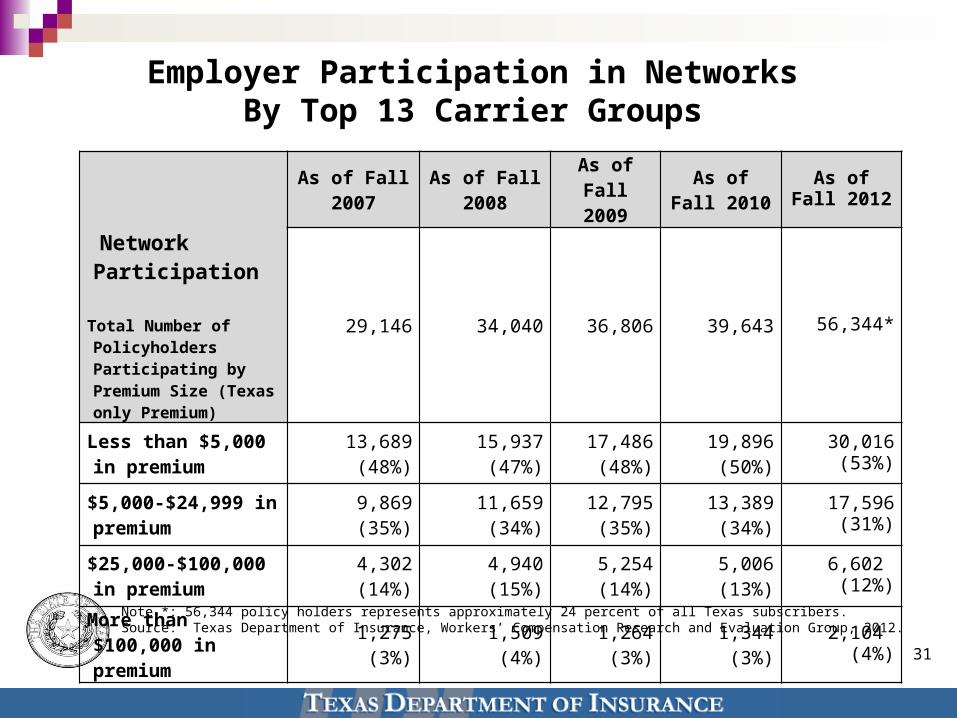
Note *: 56,344 policy holders represents approximately 24 percent of all Texas subscribers.Source: Texas Department of Insurance, Workers’ Compensation Research and Evaluation Group, 2012.
31
Network Participation
Total Number of Policyholders Participating by Premium Size (Texas only Premium)
As of Fall 2007
As of Fall 2008
As of Fall 2009
As of Fall 2010
As of Fall 2012
29,146 34,040 36,806 39,643 56,344*
Less than $5,000 in premium
13,689(48%)
15,937(47%)
17,486(48%)
19,896(50%)
30,016 (53%)
$5,000-$24,999 in premium
9,869(35%)
11,659(34%)
12,795(35%)
13,389(34%)
17,596(31%)
$25,000-$100,000 in premium
4,302(14%)
4,940(15%)
5,254(14%)
5,006(13%)
6,602 (12%)
More than $100,000 in premium
1,275(3%)
1,509(4%)
1,264(3%)
1,344(3%)
2,104 (4%)
Employer Participation in NetworksBy Top 13 Carrier Groups
32
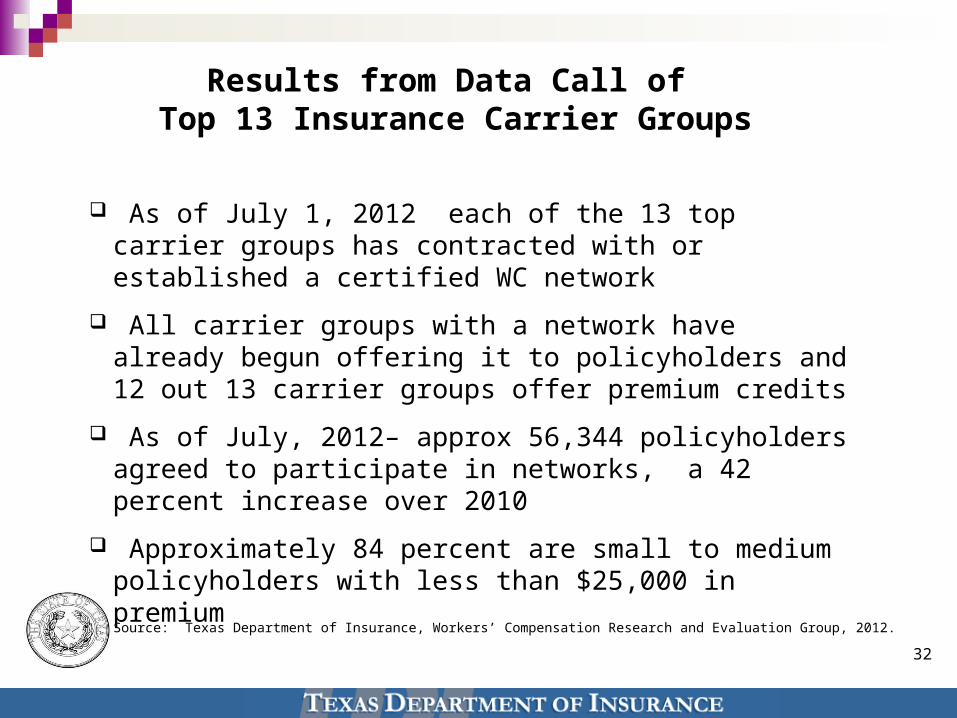
As of July 1, 2012 each of the 13 top carrier groups has contracted with or established a certified WC network
All carrier groups with a network have already begun offering it to policyholders and 12 out 13 carrier groups offer premium credits
As of July, 2012– approx 56,344 policyholders agreed to participate in networks, a 42 percent increase over 2010
Approximately 84 percent are small to medium policyholders with less than $25,000 in premium
Results from Data Call of Top 13 Insurance Carrier Groups
Source: Texas Department of Insurance, Workers’ Compensation Research and Evaluation Group, 2012.
33
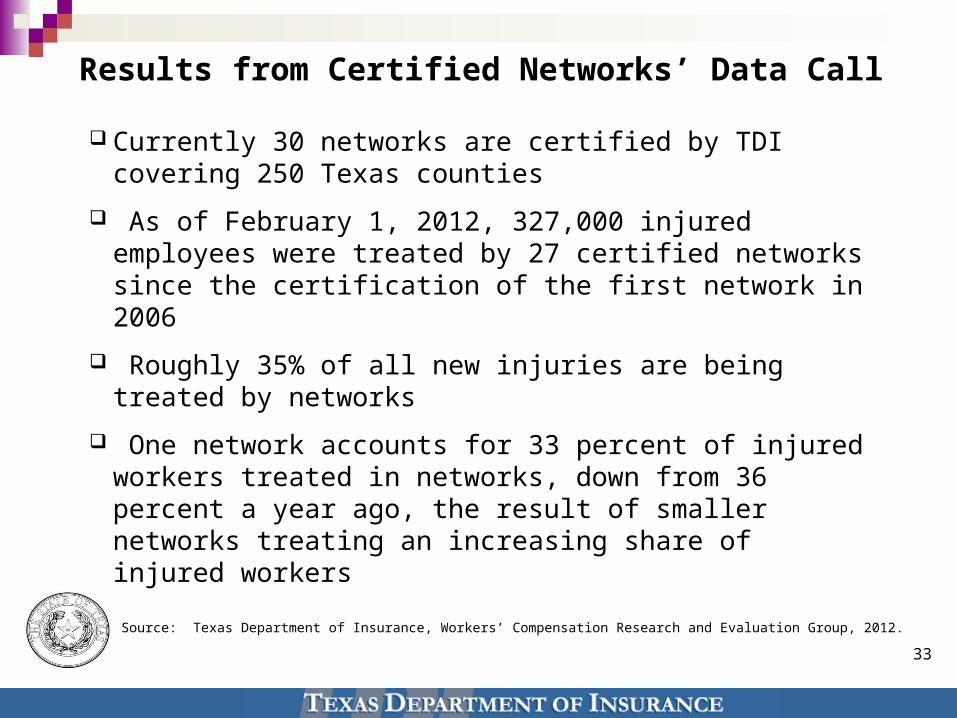
Currently 30 networks are certified by TDI covering 250 Texas counties
As of February 1, 2012, 327,000 injured employees were treated by 27 certified networks since the certification of the first network in 2006
Roughly 35% of all new injuries are being treated by networks
One network accounts for 33 percent of injured workers treated in networks, down from 36 percent a year ago, the result of smaller networks treating an increasing share of injured workers
Results from Certified Networks’ Data Call
Source: Texas Department of Insurance, Workers’ Compensation Research and Evaluation Group, 2012.
34
Workers’ Compensation Network Report Card 2012
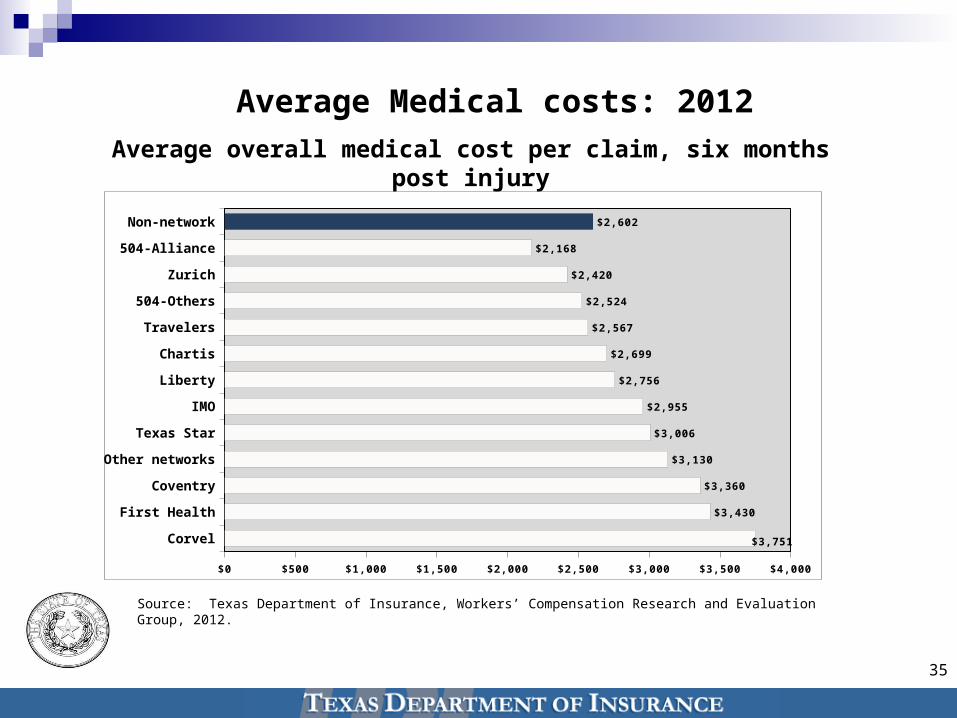
Average overall medical cost per claim, six months post injury
Average Medical costs: 2012
35
Non-network
504-Alliance
Zurich
504-Others
Travelers
Chartis
Liberty
IMO
Texas Star
Other networks
Coventry
First Health
Corvel
$0 $500 $1,000 $1,500 $2,000 $2,500 $3,000 $3,500 $4,000
$2,602
$2,168
$2,420
$2,524
$2,567
$2,699
$2,756
$2,955
$3,006
$3,130
$3,360
$3,430
$3,751
Source: Texas Department of Insurance, Workers’ Compensation Research and Evaluation Group, 2012.
36
Non-network
IMO
Corvel
Coventry
First Health
Liberty
Zurich
Texas Star
504-Others
Other networks
Travelers
504-Alliance
0% 20% 40% 60% 80%
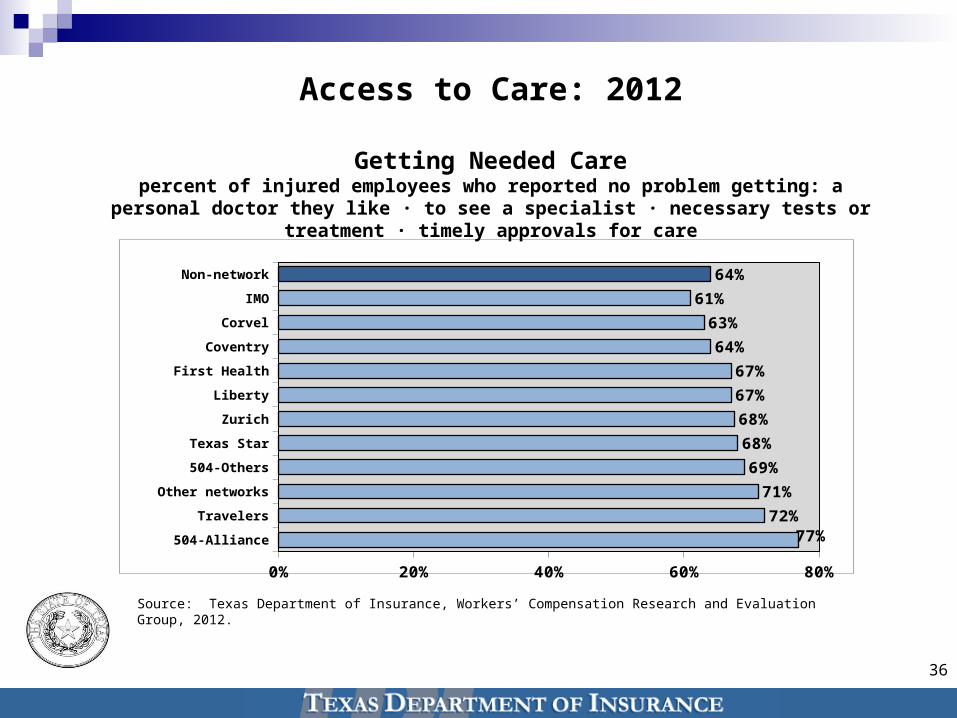
64%
61%
63%
64%
67%
67%
68%
68%
69%
71%
72%77%
Access to Care: 2012
Getting Needed Carepercent of injured employees who reported no problem getting: a personal doctor they
like · to see a specialist · necessary tests or treatment · timely approvals for care
Source: Texas Department of Insurance, Workers’ Compensation Research and Evaluation Group, 2012.
37
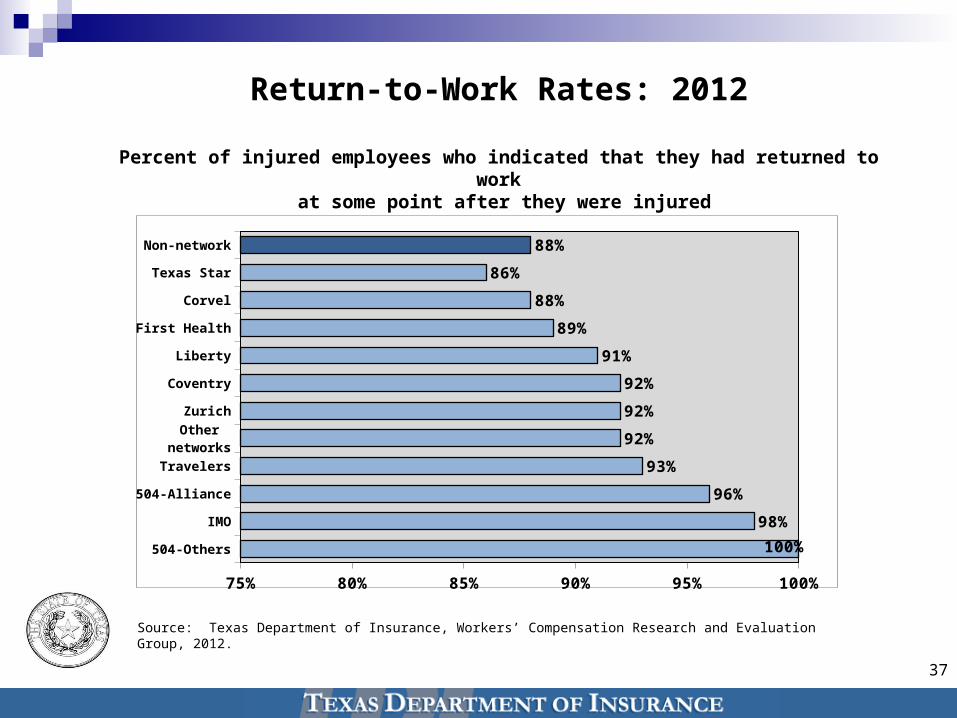
Return-to-Work Rates: 2012
Percent of injured employees who indicated that they had returned to work at some point after they were injured
Non-network
Texas Star
Corvel
First Health
Liberty
Coventry
Zurich
Other networks
Travelers
504-Alliance
IMO
504-Others
75% 80% 85% 90% 95% 100%
88%
86%
88%
89%
91%
92%
92%
92%
93%
96%
98%
100%
Source: Texas Department of Insurance, Workers’ Compensation Research and Evaluation Group, 2012.
38
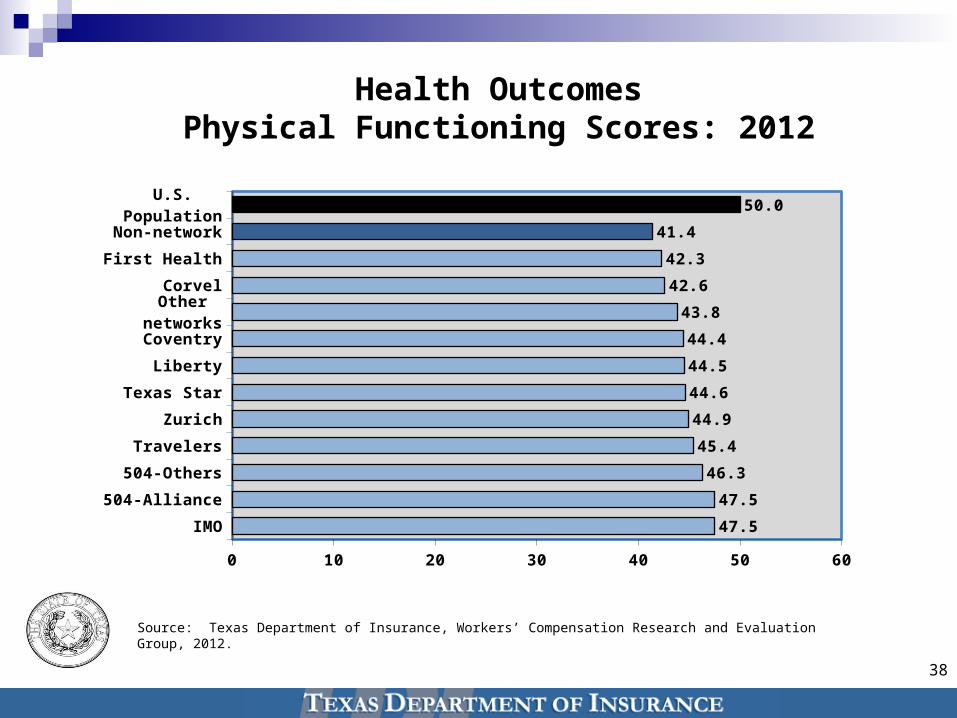
Health OutcomesPhysical Functioning Scores: 2012
Source: Texas Department of Insurance, Workers’ Compensation Research and Evaluation Group, 2012.
U.S. Population
Non-network
First Health
Corvel
Other networks
Coventry
Liberty
Texas Star
Zurich
Travelers
504-Others
504-Alliance
IMO
0 10 20 30 40 50 60
50.0
41.4
42.3
42.6
43.8
44.4
44.5
44.6
44.9
45.4
46.3
47.5
47.5

39
Impact of the Texas Pharmacy Closed Formulary
40
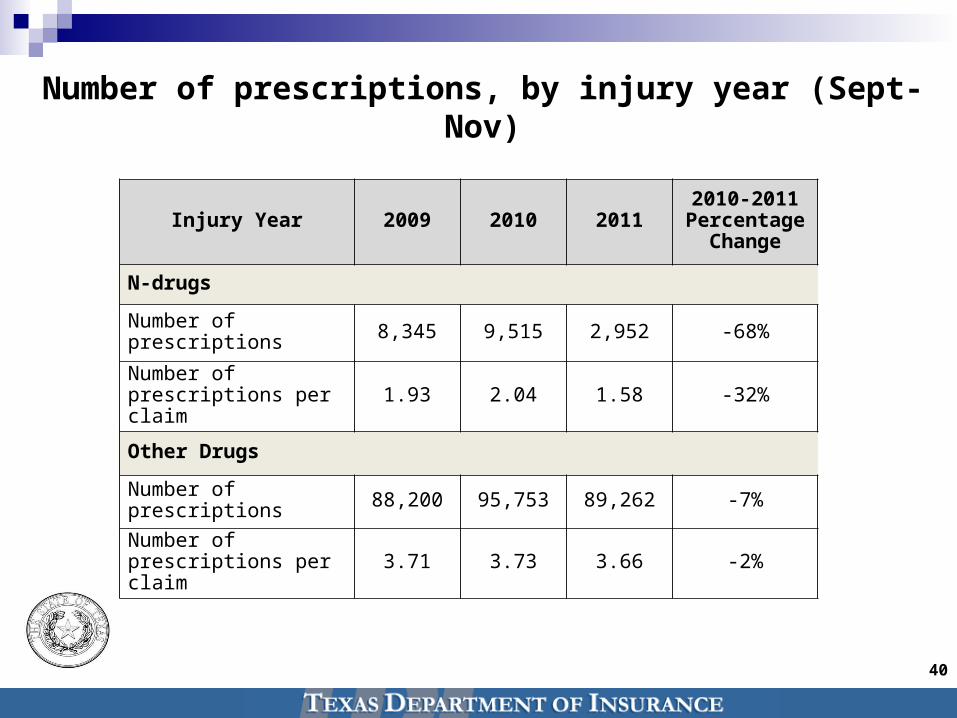
Injury Year 2009 2010 20112010-2011
Percentage Change
N-drugs
Number of prescriptions 8,345 9,515 2,952 -68%
Number of prescriptions per claim 1.93 2.04 1.58 -32%
Other Drugs
Number of prescriptions 88,200 95,753 89,262 -7%
Number of prescriptions per claim 3.71 3.73 3.66 -2%
Number of prescriptions, by injury year (Sept-Nov)
41
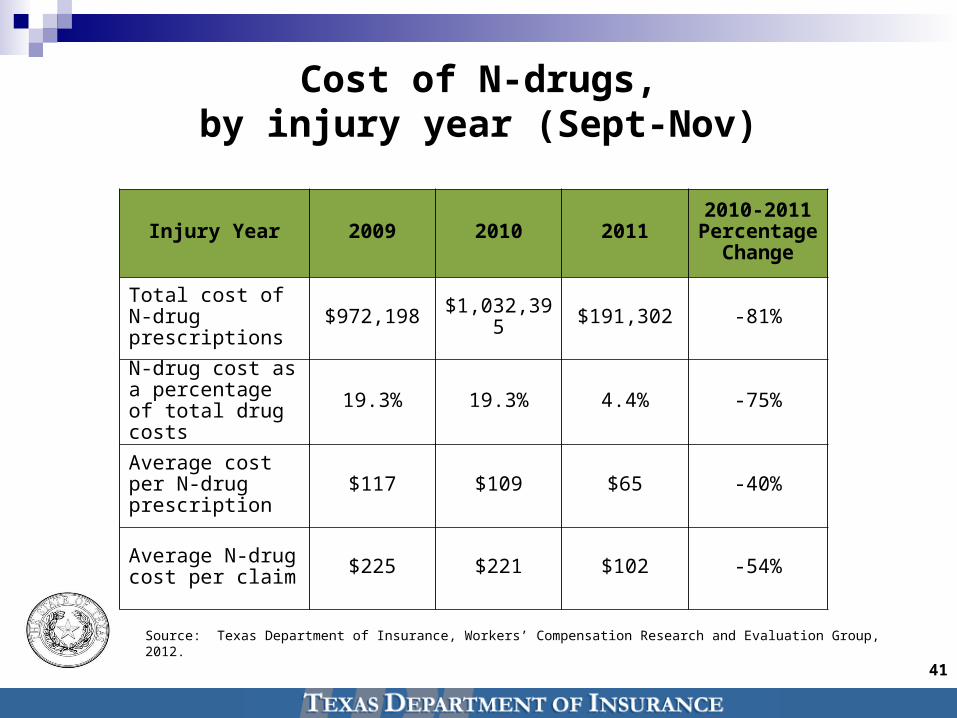
Cost of N-drugs,by injury year (Sept-Nov)
Injury Year 2009 2010 20112010-2011
Percentage Change
Total cost of N-drug prescriptions $972,198 $1,032,395 $191,302 -81%
N-drug cost as a percentage of total drug costs
19.3% 19.3% 4.4% -75%
Average cost per N-drug prescription $117 $109 $65 -40%
Average N-drug cost per claim $225 $221 $102 -54%
Source: Texas Department of Insurance, Workers’ Compensation Research and Evaluation Group, 2012.
42
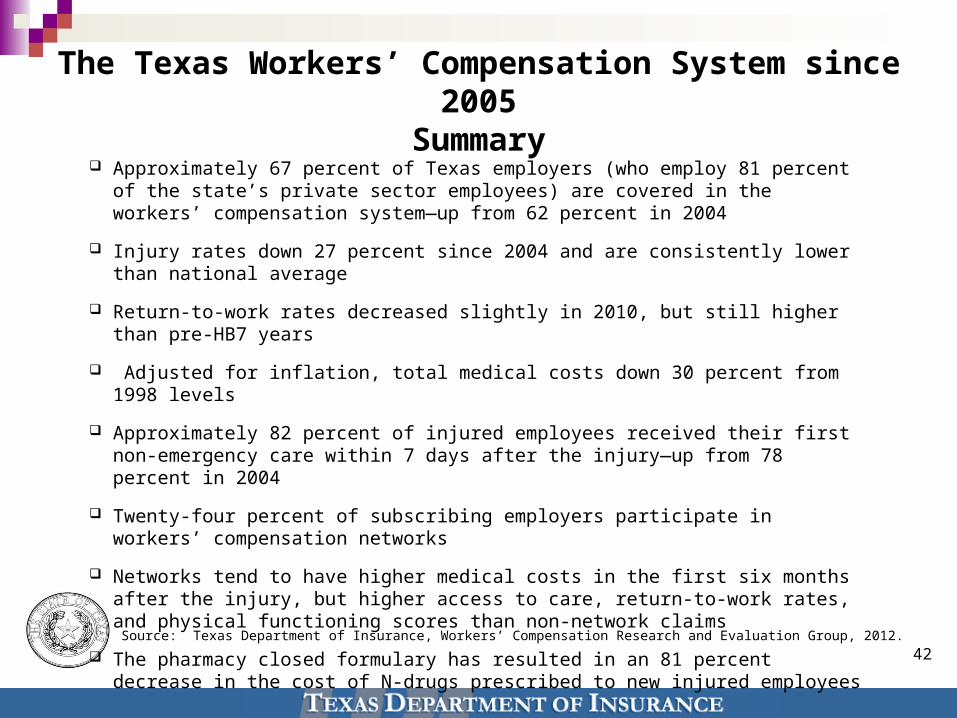
Approximately 67 percent of Texas employers (who employ 81 percent of the state’s private sector employees) are covered in the workers’ compensation system—up from 62 percent in 2004
Injury rates down 27 percent since 2004 and are consistently lower than national average
Return-to-work rates decreased slightly in 2010, but still higher than pre-HB7 years
Adjusted for inflation, total medical costs down 30 percent from 1998 levels
Approximately 82 percent of injured employees received their first non-emergency care within 7 days after the injury—up from 78 percent in 2004
Twenty-four percent of subscribing employers participate in workers’ compensation networks
Networks tend to have higher medical costs in the first six months after the injury, but higher access to care, return-to-work rates, and physical functioning scores than non-network claims
The pharmacy closed formulary has resulted in an 81 percent decrease in the cost of N-drugs prescribed to new injured employees
The Texas Workers’ Compensation System since 2005Summary
Source: Texas Department of Insurance, Workers’ Compensation Research and Evaluation Group, 2012.