Embed Size (px)
Citation preview

Text Classification from Labeled and Unlabeled
Documents using EM
Kamal NigamAndrew K. McCallumSebastian ThrunTom Mitchell
Machine Learning (2000)
Presented by Andrew Smith, May 12, 2003

Presentation Outline
Motivation and Background The Naive Bayes classifier Incorporating unlabeled data with EM (basic
algorithm) Enhancement 1 – Modulating the influence of the
unlabeled data Enhancement 2 – A different probabilistic model Conclusions

Motivation
The task: - Given a set of news articles, automatically find documents on the same topic.
- We would like to require as few labeled documents as possible, since labeling documents by hand is expensive.
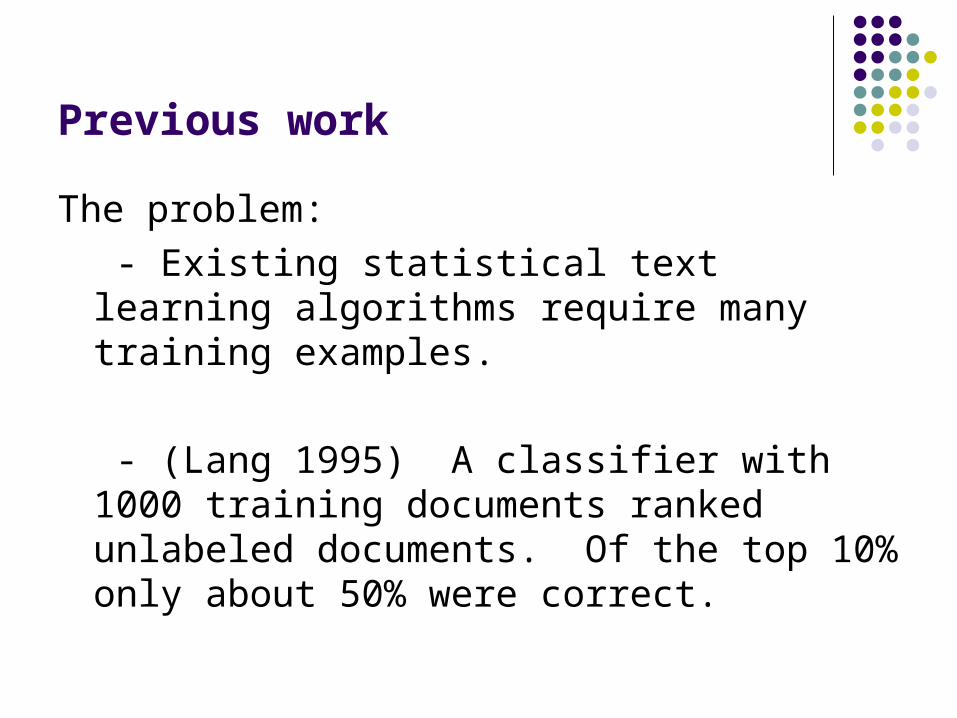
Previous work
The problem: - Existing statistical text learning algorithms require many training examples.
- (Lang 1995) A classifier with 1000 training documents ranked unlabeled documents. Of the top 10% only about 50% were correct.

Motivation
Can we somehow use unlabeled documents?- Yes! Unlabeled data provide information about the joint probability distribution.
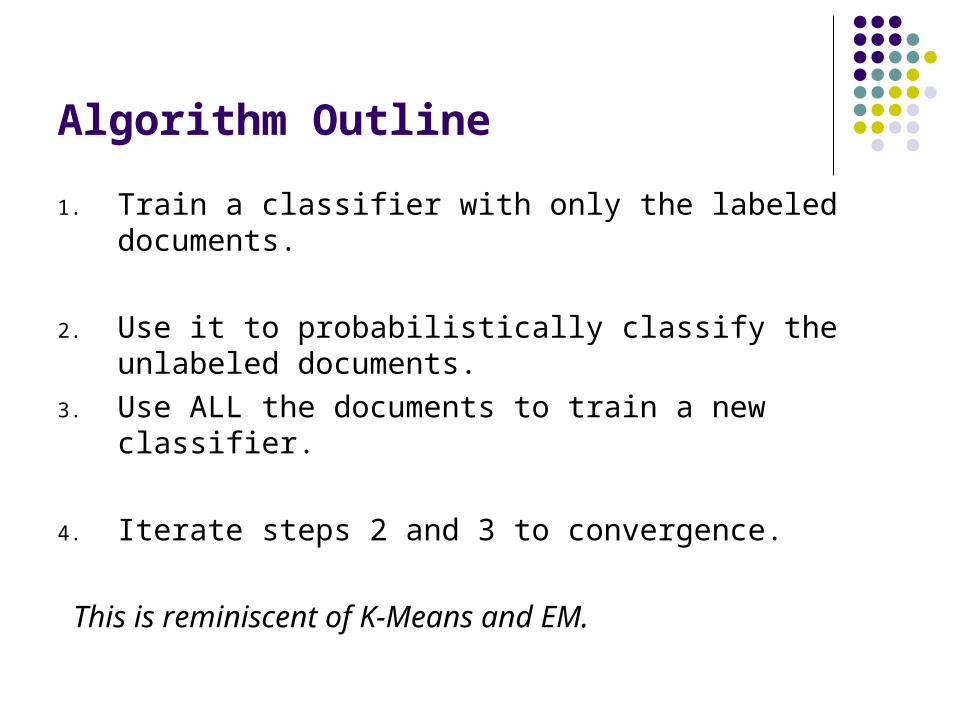
Algorithm Outline
1. Train a classifier with only the labeled documents.
2. Use it to probabilistically classify the unlabeled documents.
3. Use ALL the documents to train a new classifier.
4. Iterate steps 2 and 3 to convergence.
This is reminiscent of K-Means and EM.

Presentation Outline
Motivation and Background The Naive Bayes classifier Incorporating unlabeled data with EM (basic
algorithm) Enhancement 1 – Modulating the influence of the
unlabeled data Enhancement 2 – A different probabilistic model Conclusions

Probabilistic Framework
Assumptions:- The data are produced by a mixture model. Mixture components and class labels- There is a one-to-one correspondence between
mixture components and document classes.- Documents- Indicator variables. This statement
means the i th document belongs to class j.
}{
}{
...,
...,
ji
|D|1,i
|C|1,i
cy
ddDd
ccCc

Probabilistic Framework (2)
Mixture Weights
Probability of class j generating document i
j,d
,2d,1di
t
21
i
ii
w
... , w,w d
w
wwV
}{ ,... ,
the vocabulary (indexed over t)
Documents are ordered word lists.
indicates the word at position j in document i.
indicates a word in the vocabulary.
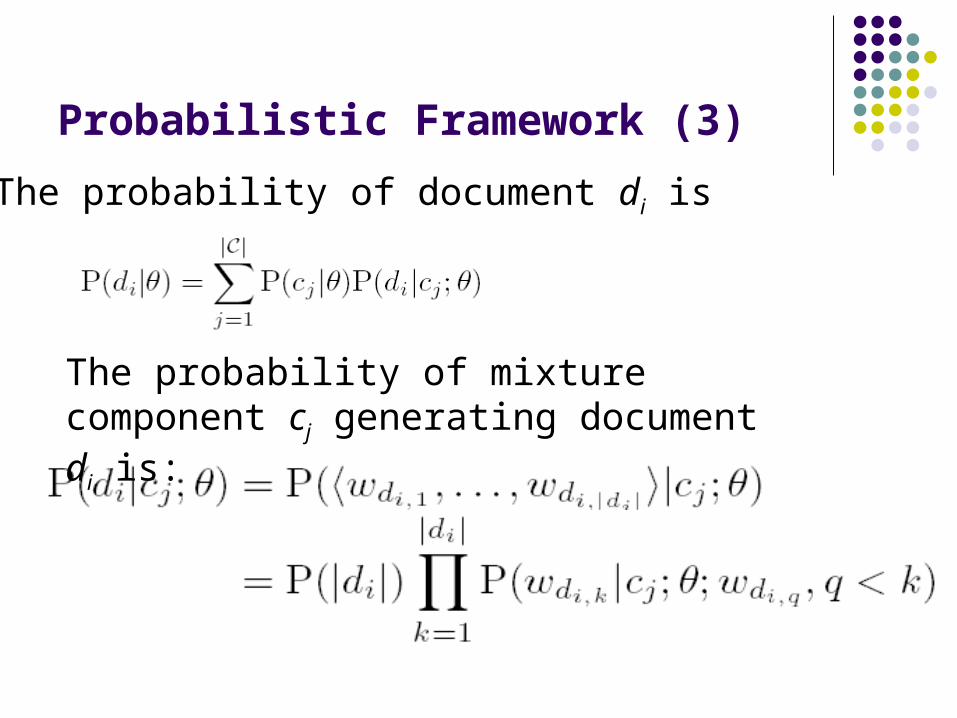
Probabilistic Framework (3)
The probability of document di is
The probability of mixture component cj generating document di is:

Probabilistic Framework (4)
The Naive Bayes assumption: The words of a document are generated independently of their order in the document, given the class.

Probabilistic Framework (5)
Now the probability of a document given its class becomes
We can use Bayes Rule to classify documents: find the class with highest probability given a novel document.

Probabilistic Framework (6)
To learn the parameters of the classifier, use ML; find the most likely set of parameters given the data set:
The two parameters we need to find are the word probability estimates and the mixture weights, written
=
and

Probabilistic Framework (6)
The maximization yields parameters that are word frequency counts:
1 + No. of occurrences of wt in class j
|V| + No. of words in class j
1 + No. of documents in class j
|C| + |D|
Laplace smoothing gives each word a prior probability.

Probabilistic Framework (7)
Formally Number of occurrences of
word t in document i
This is 1 if document i is in
class j, or 0 otherwise.

Probabilistic Framework (8)
Using Bayes Rule:

Presentation Outline
Motivation and Background The Naive Bayes classifier Incorporating unlabeled data with EM (basic
algorithm) Enhancement 1 – Modulating the influence of the
unlabeled data Enhancement 2 – A different probabilistic model

Application of EM to NB
1) Estimate with only labeled data2) Assign probabilistically weighted class-
labels to unlabeled data.3) Use all class labels (given and estimated)
to find new parameters .
4) Repeat 2 and 3 until does not change.

More Notation
Set of unlabeled documentsSet of labeled documents

Deriving the basic Algorithm (1)
The probability of all the data is:
For unlabeled data, the component of the probability is a sum across all mixture components.

Deriving the basic Algorithm (2)
Easier to maximize the log-likelihood:
This contains a log of sums, which makes maximization intractable.

Deriving the basic Algorithm (3)
Suppose we have access to the labels for the unlabeled documents, expressed as a matrix of indicator variables z, where if document i is in class j, and 0 otherwise (so rows are documents and columns are classes). Then the terms of
are nonzero only when zij = 1; we treat the labeled and unlabeled documents the same.

Deriving the basic Algorithm (4)
The complete log-likelihood becomes:
If we replace z with its expected value according to the current classifier, then this equation bounds from below the exact log-likelihood, so iteratively increasing this equation will increase the log-likelihood.

Deriving the basic Algorithm (5)
This leads to the basic algorithm:
E-step:
M-step:

Data sets
20 Newsgroups data set: 20017 articles drawn evenly from 20 newsgroups Many categories fall into confusable clusters. Words from a stoplist of common short words are
removed. 62258 unique words occurring more than once Word counts of documents are scaled so each document
has the same length.

Data sets
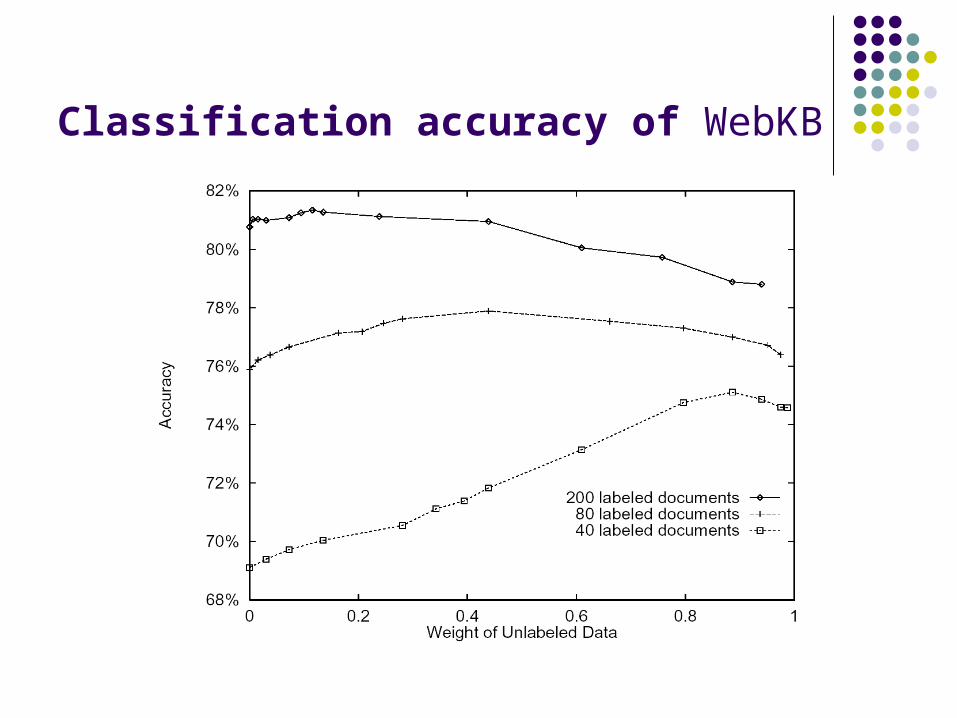
WebKB data set: 4199 web pages from university CS departments Divided into four categories (student, faculty, course,
project) with pages. No stoplist or stemming used. Only 300 most informative words used (mutual
information with class variable). Validation with a leave-one-university-out approach to
prevent idiosyncrasies of particular universities from inflating success measures.
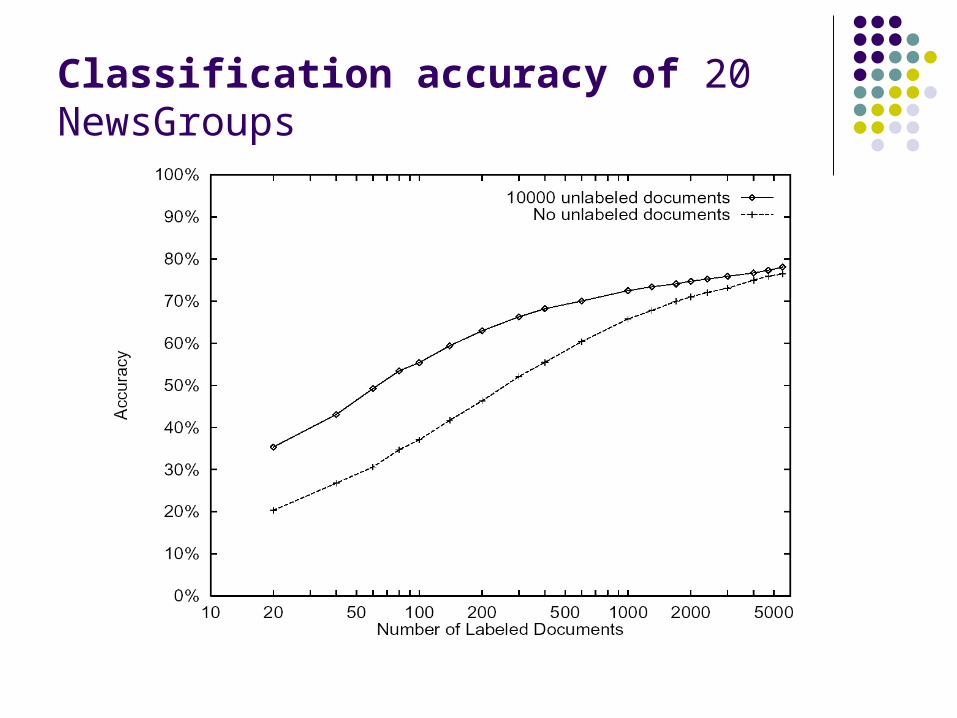
Classification accuracy of 20 NewsGroups

Classification accuracy of 20 NewsGroups

Classification accuracy of WebKB

Predictive words found with EMIteration 0 Iteration 1 Iteration 2Intelligence DD DDD D DDartificial lecture lectureunderstanding cc ccDDw D* DD:DDdist DD:DD dueidentical handout D*rus due homeworkarrange problem assignmentgames set handoutdartmouth tay setnatural DDam hwcognitive yurttas examlogic homework problemproving kkfoury DDamprolog sec postscriptknowledge postscript solutionhuman exam quizrepresentation solution chapterfield assaf ascii

Presentation Outline
Motivation and Background The Naive Bayes classifier Incorporating unlabeled data with EM (basic
algorithm) Enhancement 1 – Modulating the influence of the
unlabeled data Enhancement 2 – A different probabilistic model Conclusions

The problem
Suppose you have a few labeled documents and many more unlabeled documents.
Then the algorithm almost becomes unsupervised clustering! The only function of the labeled data is to assign class labels to the mixture components.
When the mixture-model assumptions are not true, the basic algorithm will find components that don’t correspond to different class labels.

The solution: EM-
Modulate the influence of unlabeled data with a parameter And maximize
Unlabeled Documents
labeled documents

EM-
The E-step is exactly as before, assign probabilistic class labels.
The M-step is modified to reflect . Define:
as a weighting factor to modify the frequency counts.

EM-The new NB parameter estimates become
sum over all words and documents
Probabilistic class assignmentWord
count
Weight
Classification accuracy of WebKB

Classification accuracy of WebKB
Presentation Outline
Motivation and Background The Naive Bayes classifier Incorporating unlabeled data with EM (basic
algorithm) Enhancement 1 – Modulating the influence of the
unlabeled data Enhancement 2 – A different probabilistic model Conclusions

The idea
EM- reduced the effects of violated assumptions with the parameter.
Alternatively, we can change our assumptions. Specifically, change the requirement of a one-to-one correspondence between classes and mixture components to a many-to-one correspondence.
For textual data, this corresponds to saying that a class may consist of several different sub-topics, each best characterized by a different word distribution.

More Notation
now represents only mixture components, not classes.represents the ath class (“topic”)
is the assignment of mixture components to classes
This assignment is pre-determined, deterministic, and permanent; once assigned to a particular class, mixture components do not change assignment.

The Algorithm
M-step: same as before, find estimates for the mixture components using Laplace priors (MAP).
E-step: - For unlabeled documents, calculate the probabilistic mixture component memberships exactly as before.- For labeled documents, we previously considered to be a fixed indicator (0 or 1) of class membership. Now we allow it to vary between 1 and 0 for mixture components in the same class as di . We set it to zero for mixture components belonging to classes other than the one containing di.

Algorithm details
Initialize the mixture components for each class by randomly setting for components in the correct class.
Documents are classified by summing up the mixture component probabilities of one class to form a class probability:

Another data set
Reuters (21578 Distribution 1.0) data set: 12902 news articles in 90 topics from Reuters
newswire, only the ten most populous classes are used.
No stemming used. Documents are split into early and late
categories (by date). The task is to predict the topics of the later articles with classifiers trained on the early ones.
For all experiments on Reuters, 10 binary classifiers are trained – one per topic.

Performance Metrics
To evaluate the performance, define the two quantities
The recall-precision breakeven point is the value when the two quantities are equal.
The breakeven point is used instead of accuracy (fraction correctly classified). Because the data sets have a much higher frequency of negative examples, the classifier could achieve high accuracy by always predicting negative.
True Pos.
False Pos.
False Neg.
True Neg.
Actual valuePos. Neg.
Pos.
Neg.
Prediction
True Pos.
True Pos. + False Neg.
True Pos.
True Pos. + False Pos.
Recall =
Precision =

Classification of Reuters(breakeven
points)

Classification accuracy of Reuters

Classification of Reuters
Using different numbers of mixture components
(breakeven points)

Classification of Reuters
Naive Bayes with different numbers of mixture components
(breakeven points)

Classification of Reuters
Using cross-validation or best-EM to select the number of mixture components
(breakeven points)

Conclusions
Cross-validation tends to underestimate the best number of mixture components.
Incorporating unlabeled data into any classifier is important because of the high cost of hand-labeling documents.
Classifiers based on generative models that make incorrect assumptions can still achieve high accuracy.
The new algorithm does not produce binary classifiers that are much better than NB.