Embed Size (px)
Citation preview
Software Defect Predictionon Unlabeled Datasets
- PhD Thesis Defence -
July 23, 2015Jaechang Nam
Department of Computer Science and Engineering
HKUST
2
Software Defect Prediction• General question of software defect
prediction– Can we identify defect-prone entities (source
code file, binary, module, change,...) in advance?• # of defects• buggy or clean
• Why? (applications)
– Quality assurance for large software(Akiyama@IFIP’71)
– Effective resource allocation• Testing (Menzies@TSE`07, Kim@FSE`15)
• Code review (Rahman@FSE’11)
3
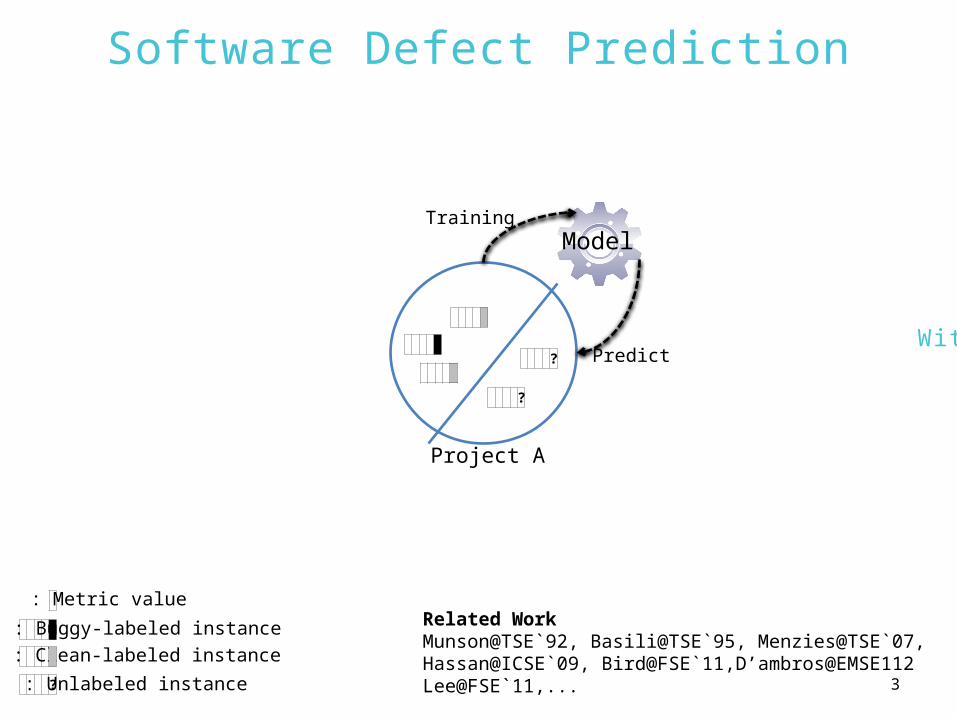
Predict
Training
?
?
Model
Project A
: Metric value
: Buggy-labeled instance: Clean-labeled instance
?: Unlabeled instance
Software Defect Prediction
Related WorkMunson@TSE`92, Basili@TSE`95, Menzies@TSE`07,Hassan@ICSE`09, Bird@FSE`11,D’ambros@EMSE112Lee@FSE`11,...
Within-Project Defect Prediction (WPDP)
4
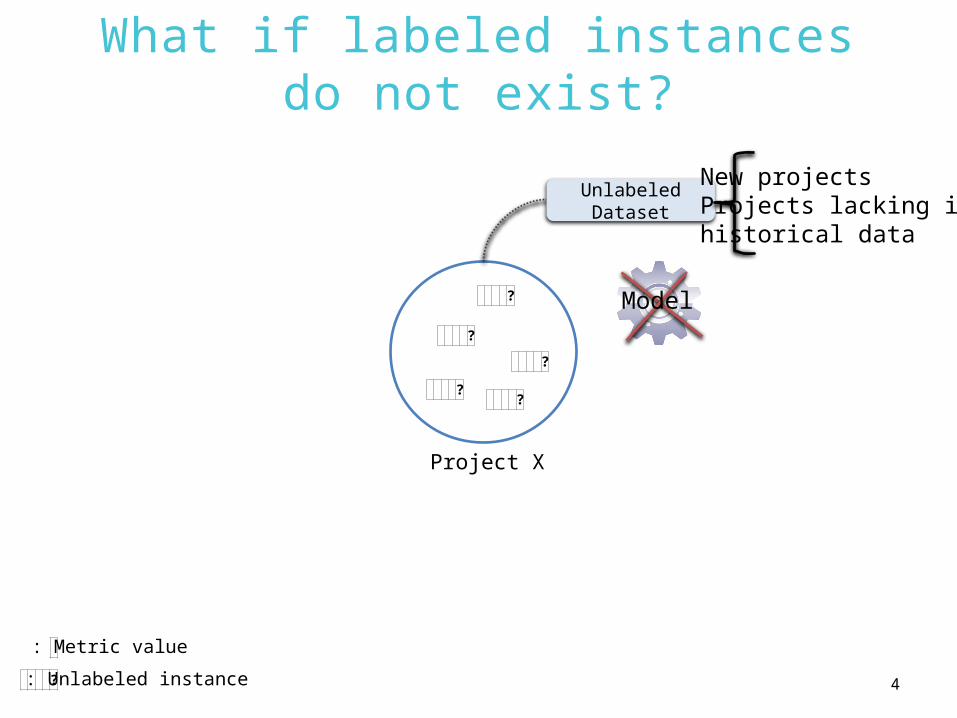
What if labeled instances do not exist?
?
?
?
??
Project X
Unlabeled Dataset
?: Unlabeled instance
: Metric value
Model
New projectsProjects lacking inhistorical data
5
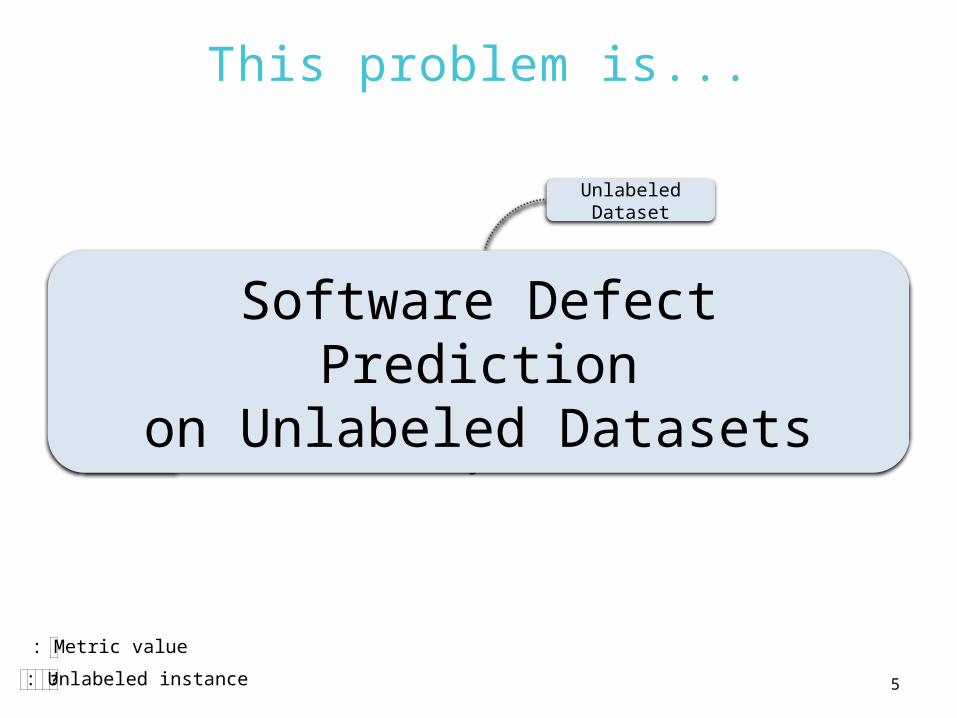
This problem is...
?
?
?
??
Project X
Unlabeled Dataset
?: Unlabeled instance
: Metric value
Software Defect Predictionon Unlabeled Datasets
6
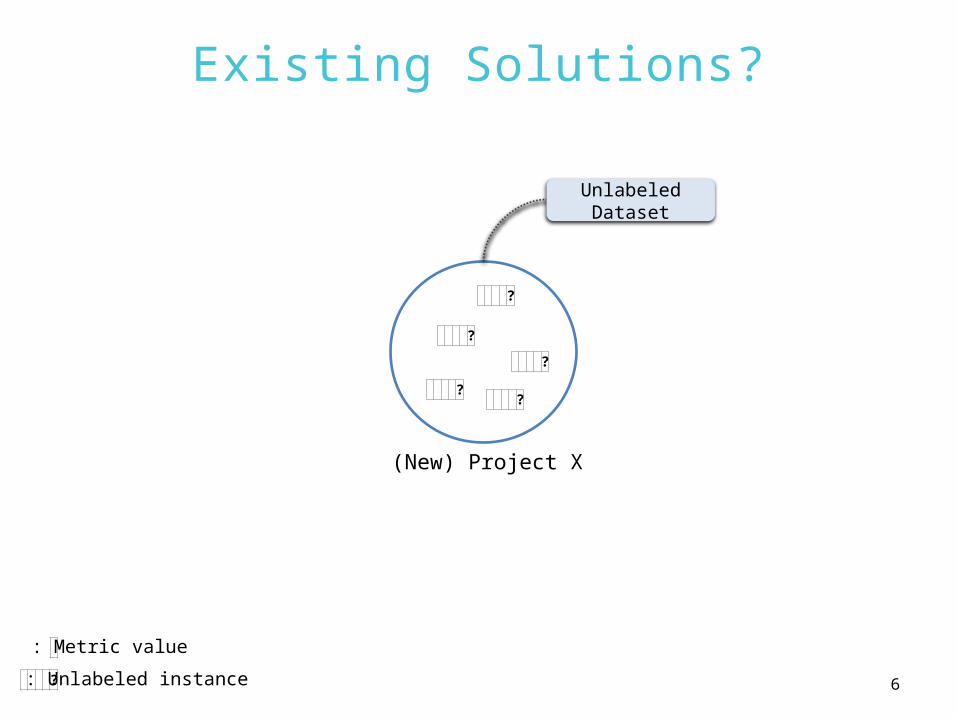
Existing Solutions?
?
?
?
??
(New) Project X
Unlabeled Dataset
?: Unlabeled instance
: Metric value
7
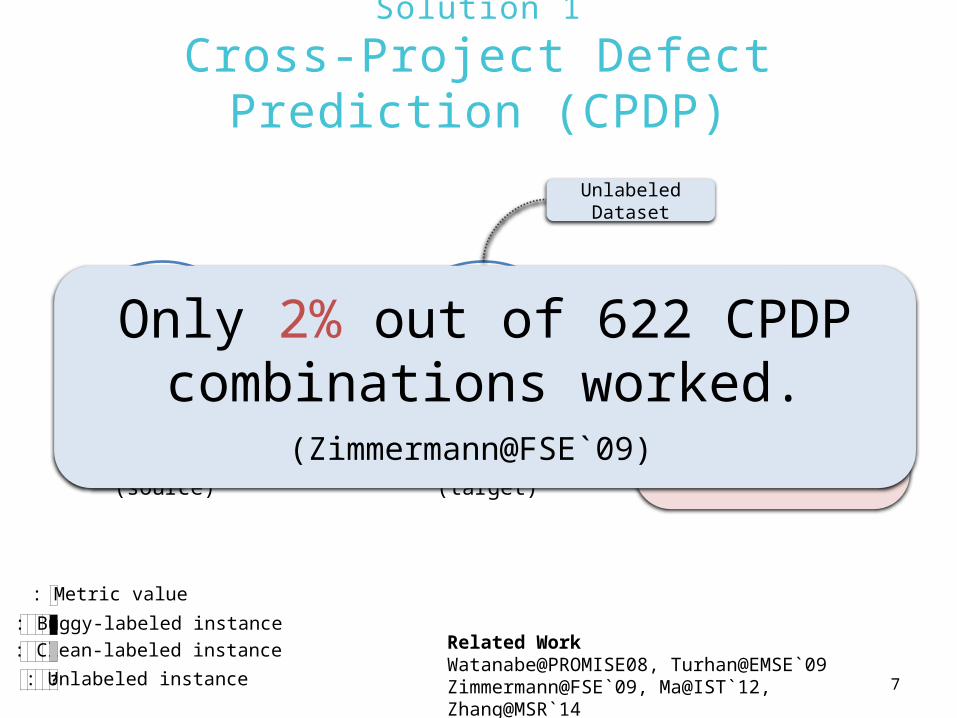
Solution 1
Cross-Project Defect Prediction (CPDP)
?
?
?
??
Training
Predict
Model
Project A(source)
Project X(target)
Unlabeled Dataset
: Metric value
: Buggy-labeled instance: Clean-labeled instance
?: Unlabeled instance
Related WorkWatanabe@PROMISE08, Turhan@EMSE`09Zimmermann@FSE`09, Ma@IST`12, Zhang@MSR`14
Challenges
Same metric set(same feature space)
• Worse than WPDP
• Heterogeneousmetrics betweensource and target
Only 2% out of 622 CPDP combinations worked.
(Zimmermann@FSE`09)
8
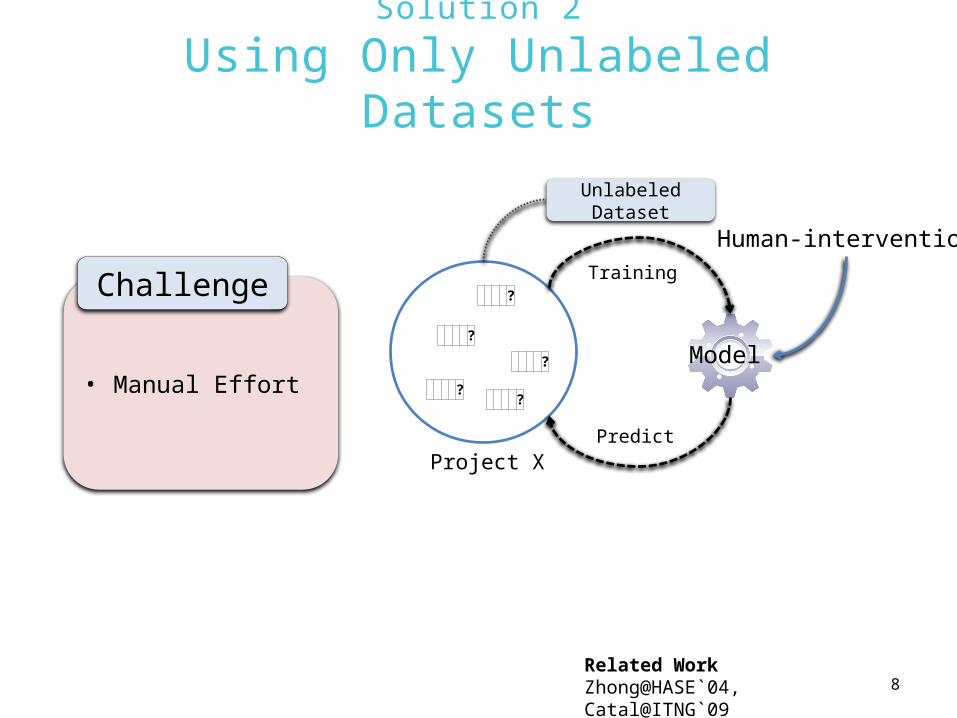
Solution 2
Using Only Unlabeled Datasets
?
?
?
??
Project X
Unlabeled Dataset
Training
Model
Predict
Related WorkZhong@HASE`04, Catal@ITNG`09
• Manual Effort
Challenge
Human-intervention
9
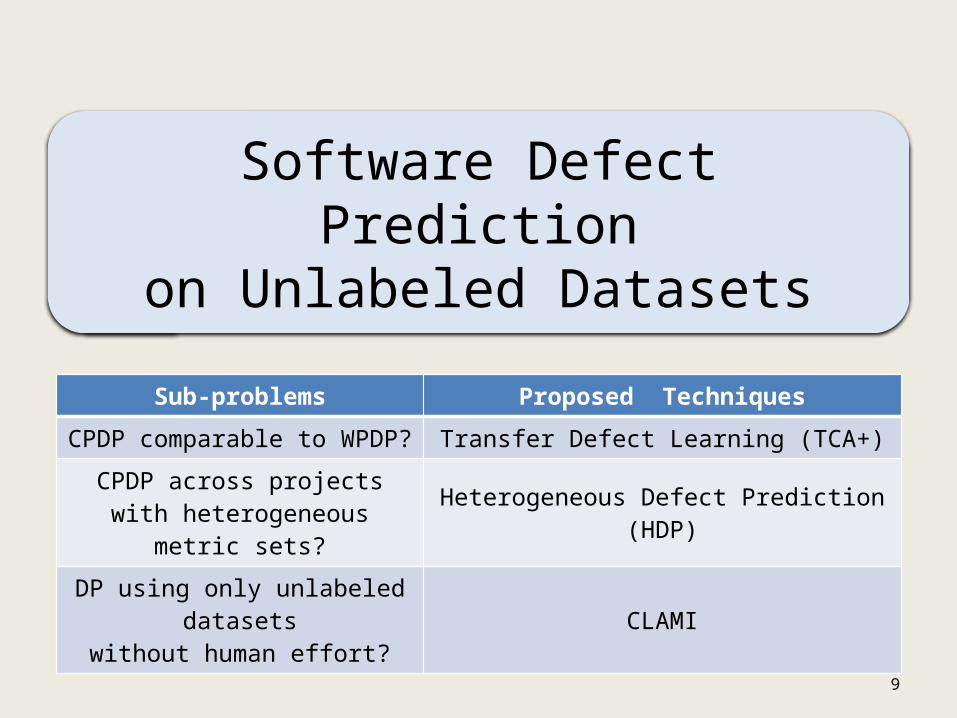
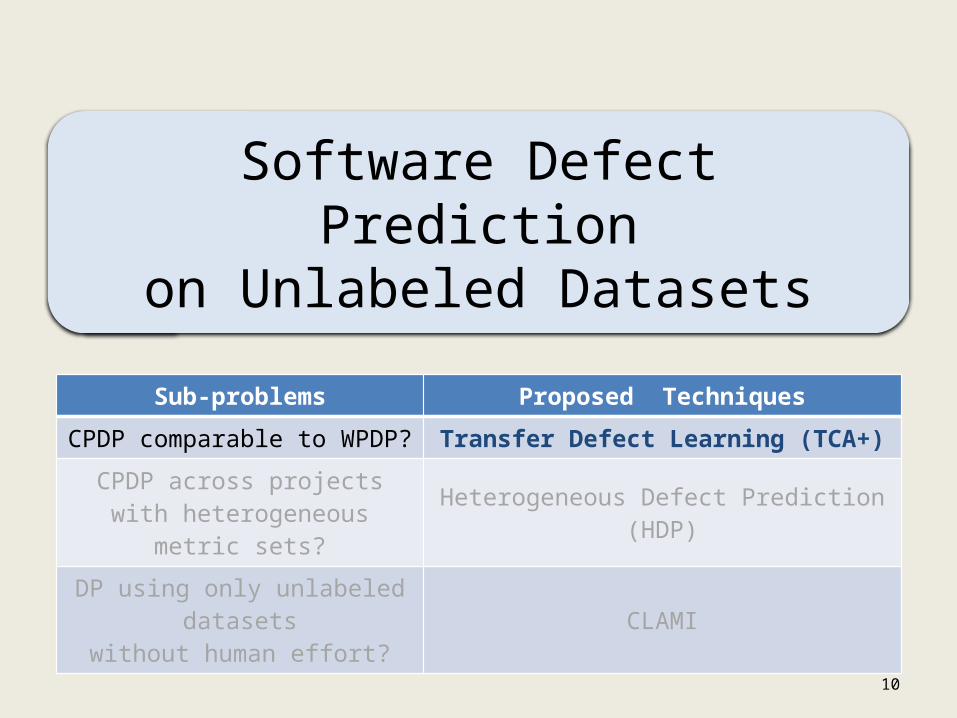
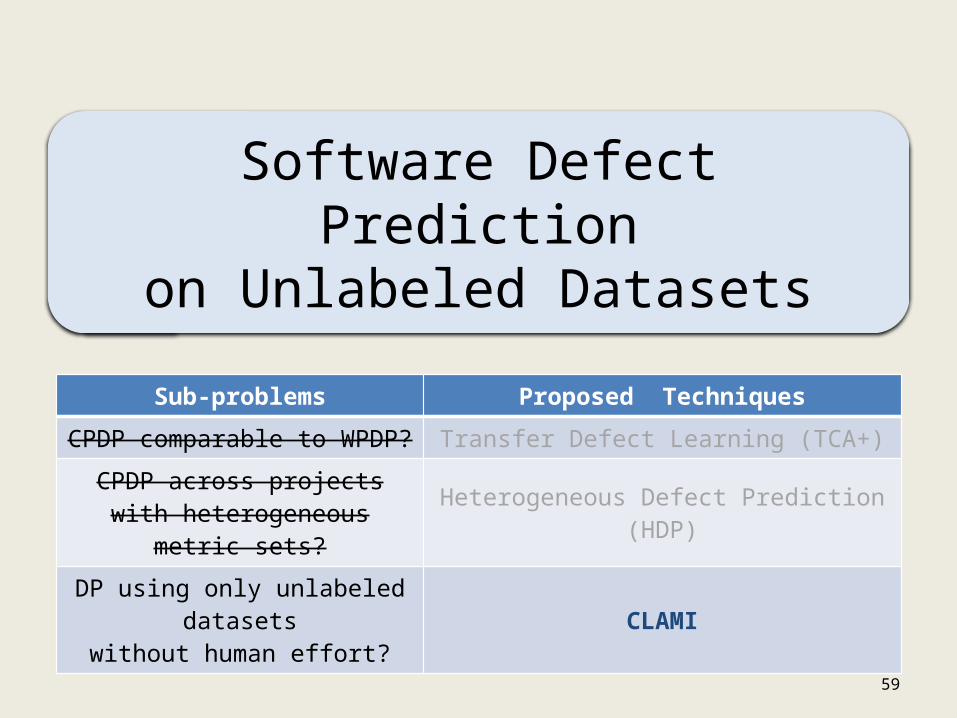
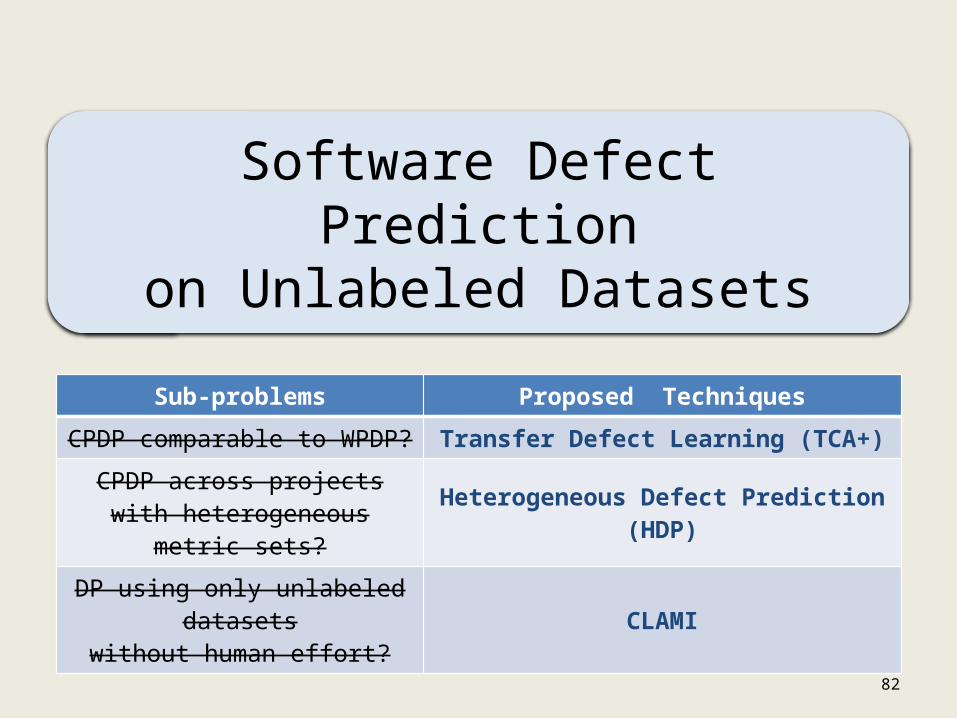
Software Defect Predictionon Unlabeled Datasets
Sub-problems Proposed Techniques
CPDP comparable to WPDP? Transfer Defect Learning (TCA+)
CPDP across projects with heterogeneous metric sets?
Heterogeneous Defect Prediction (HDP)
DP using only unlabeled datasets
without human effort?CLAMI
10
Software Defect Predictionon Unlabeled Datasets
Sub-problems Proposed Techniques
CPDP comparable to WPDP? Transfer Defect Learning (TCA+)
CPDP across projects with heterogeneous metric sets?
Heterogeneous Defect Prediction (HDP)
DP using only unlabeled datasets
without human effort?CLAMI

11
CPDP
• Reason for poor prediction performance of CPDP– Different distributions of source and
target datasets (Pan et al@TKDE`09)
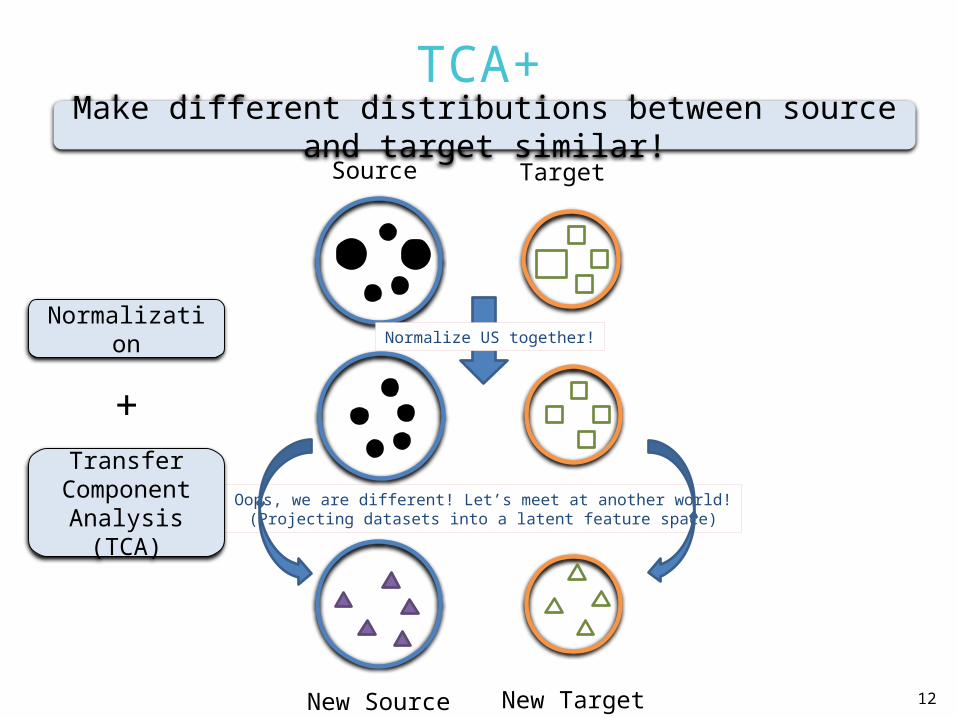
TCA+
12
Source Target
Oops, we are different! Let’s meet at another world!(Projecting datasets into a latent feature space)
New Source New Target
Normalize US together!Normalization
Transfer Component
Analysis (TCA)
+
Make different distributions between source and target similar!
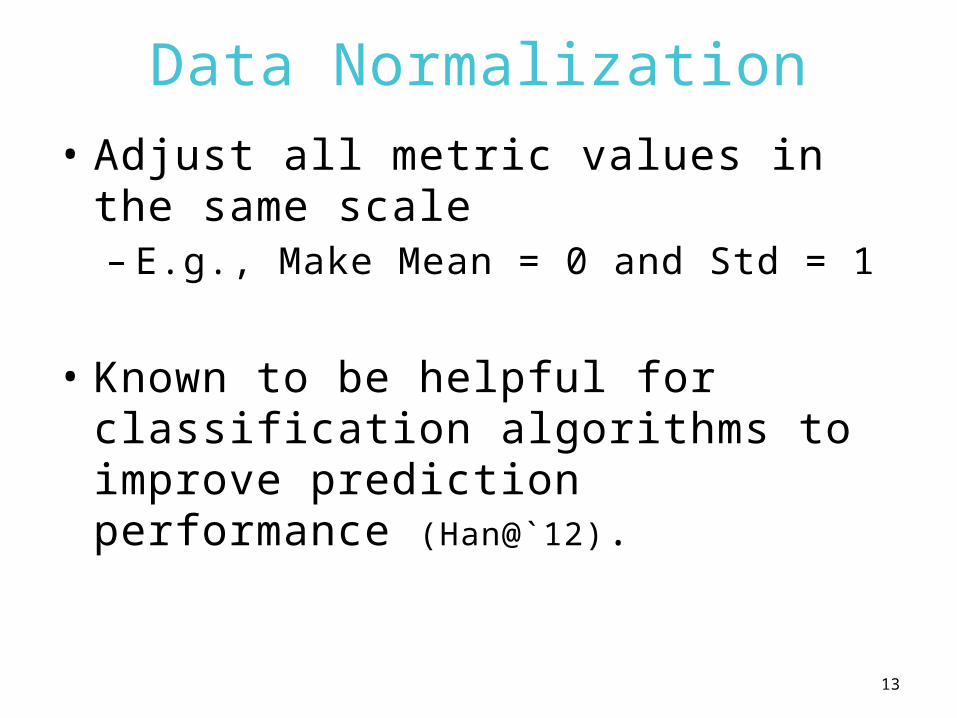
Data Normalization• Adjust all metric values in the
same scale– E.g., Make Mean = 0 and Std = 1
• Known to be helpful for classification algorithms to improve prediction performance (Han@`12).
13
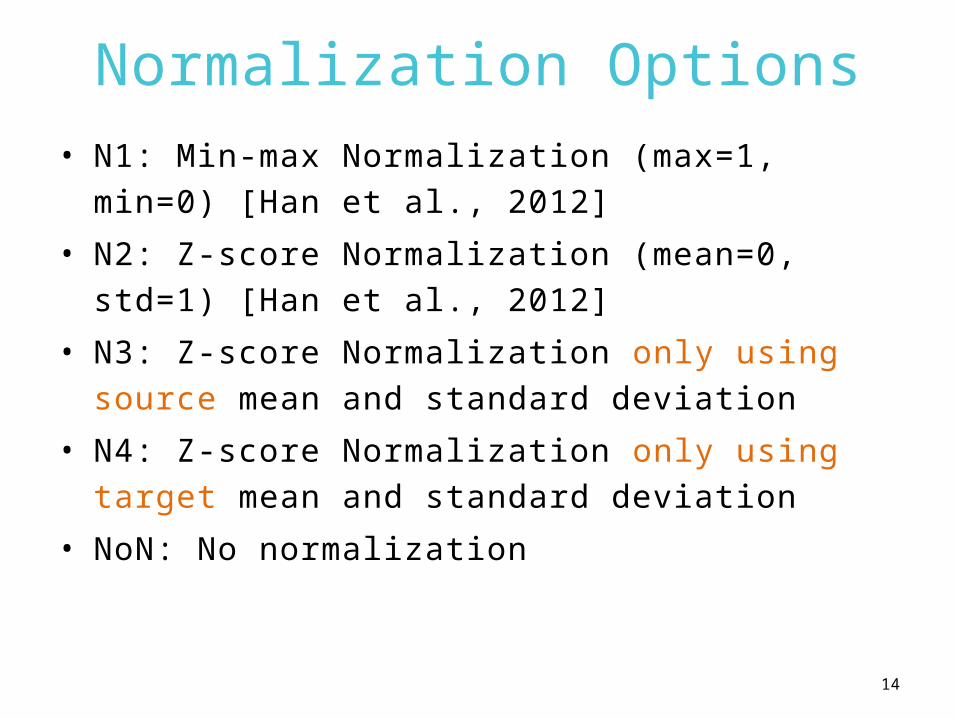
Normalization Options• N1: Min-max Normalization (max=1, min=0)
[Han et al., 2012]
• N2: Z-score Normalization (mean=0, std=1) [Han et al., 2012]
• N3: Z-score Normalization only using source mean and standard deviation
• N4: Z-score Normalization only using target mean and standard deviation
• NoN: No normalization
14
Decision Rules for Normalization
• Find a suitable normalization• Steps–#1: Characterize a dataset–#2: Measure similarity
between source and target datasets
–#3: Decision rules
15
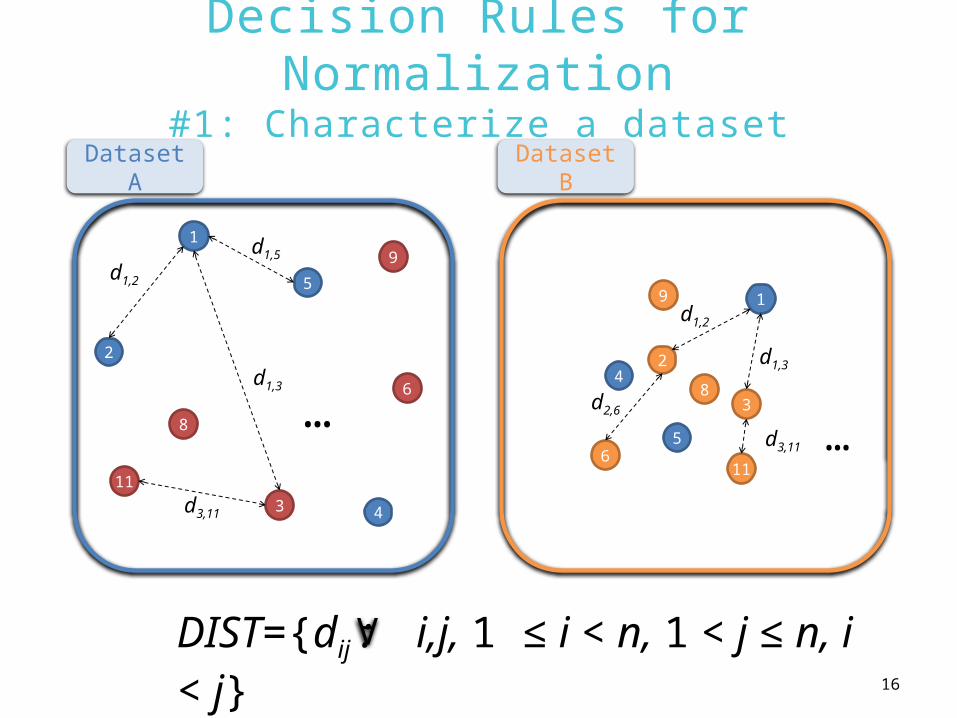
Decision Rules for Normalization#1: Characterize a dataset
3
1
…
Dataset A
Dataset B
2
4
5
8
9
6
11
d1,
2
d1,
5
d1,
3
d3,11
3
1
…
24
5
8
9
611
d2,
6
d1,
2 d1,
3
d3,11
DIST={dij : i,j, 1 ≤ i < n, 1 < j ≤ n, i < j}
A
16
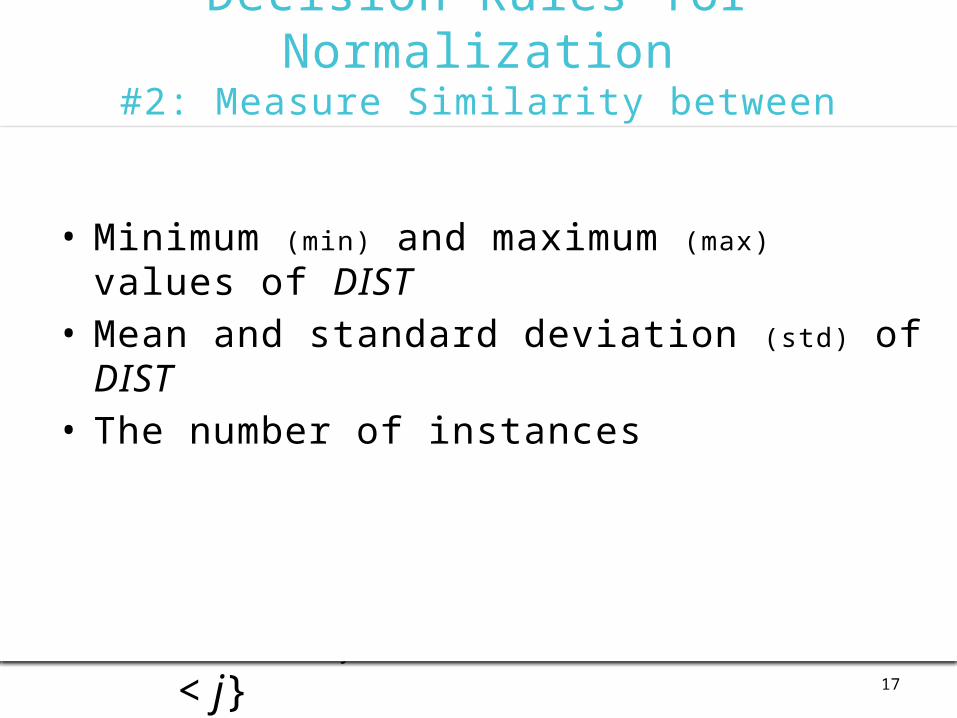
Decision Rules for Normalization#2: Measure Similarity between source
and target
3
1
…
Dataset A
Dataset B
2
4
5
8
9
6
11
d1,
2
d1,
5
d1,
3
d3,11
3
1
…
24
5
8
9
611
d2,
6
d1,
2 d1,
3
d3,11
DIST={dij : i,j, 1 ≤ i < n, 1 < j ≤ n, i < j}
A
17
• Minimum (min) and maximum (max) values of DIST
• Mean and standard deviation (std) of DIST• The number of instances
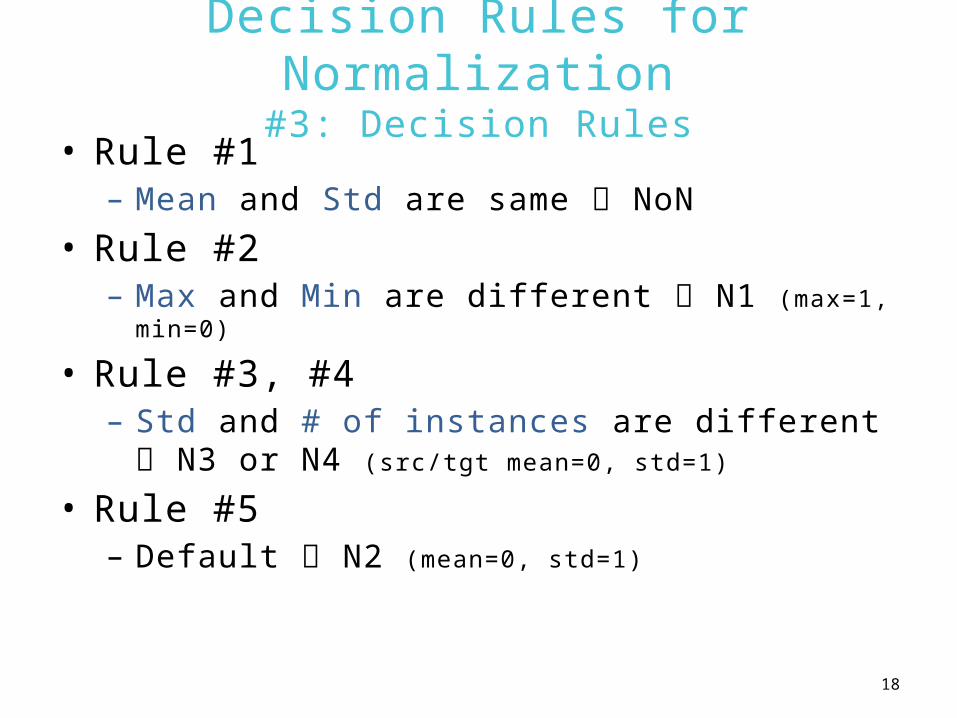
Decision Rules for Normalization#3: Decision Rules
• Rule #1– Mean and Std are same NoN
• Rule #2– Max and Min are different N1 (max=1,
min=0)
• Rule #3, #4– Std and # of instances are different
N3 or N4 (src/tgt mean=0, std=1)
• Rule #5– Default N2 (mean=0, std=1)
18
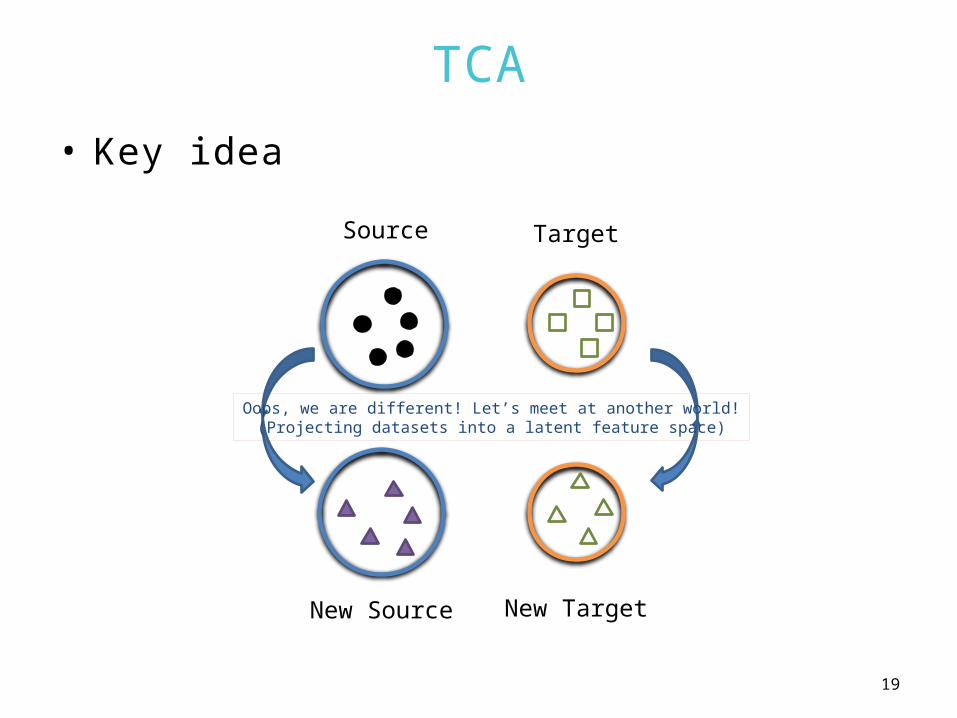
TCA
• Key idea
Source Target
New Source New Target
Oops, we are different! Let’s meet at another world!(Projecting datasets into a latent feature space)
19
20
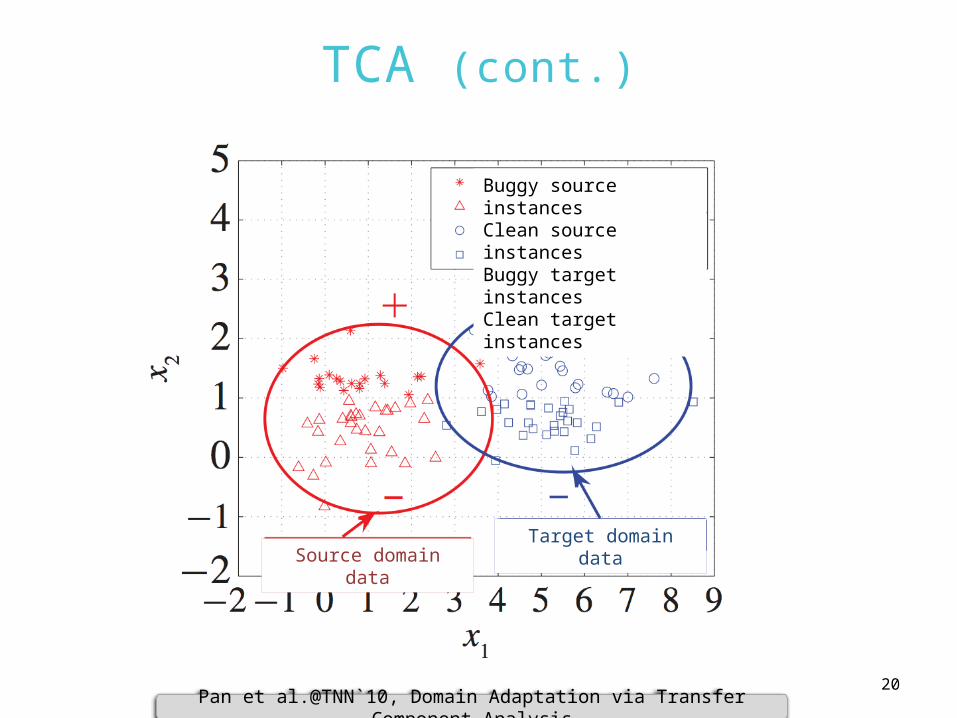
TCA (cont.)
Pan et al.@TNN`10, Domain Adaptation via Transfer Component Analysis
Target domain dataSource domain data
Buggy source instancesClean source instancesBuggy target instancesClean target instances
21
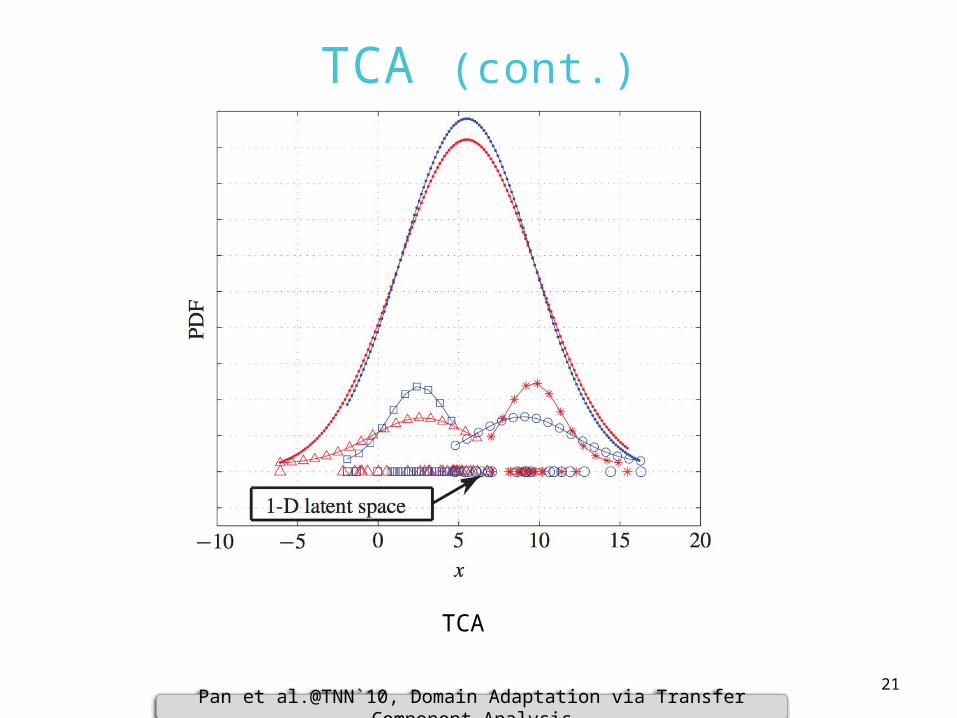
TCA (cont.)
TCA
Pan et al.@TNN`10, Domain Adaptation via Transfer Component Analysis
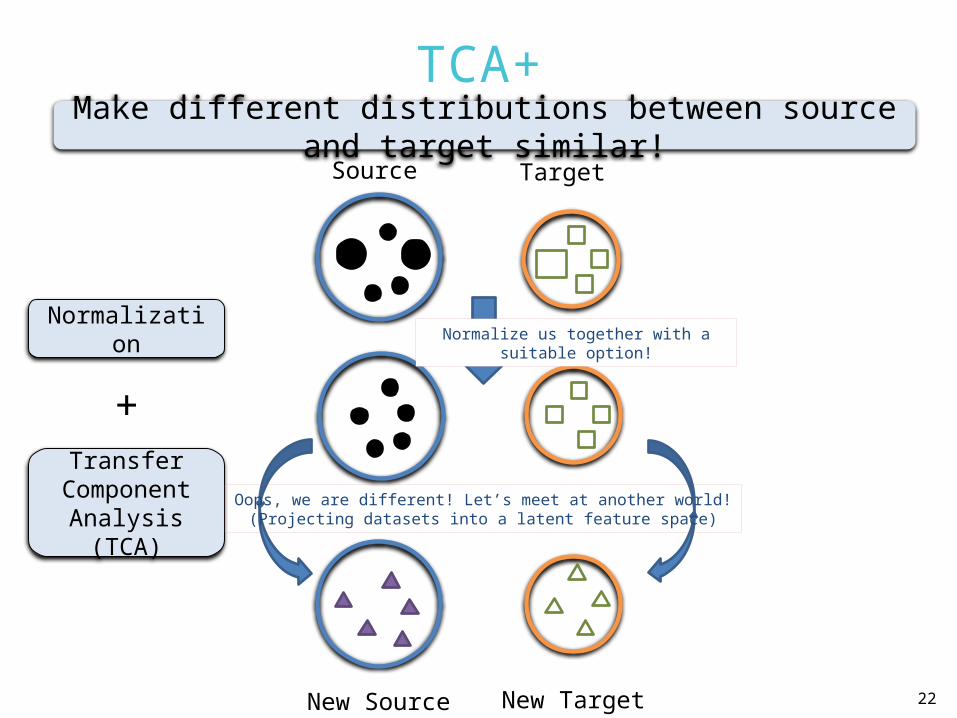
TCA+
22
Source Target
New Source New Target
Normalize us together with a suitable option!
Normalization
Transfer Component
Analysis (TCA)
+
Make different distributions between source and target similar!
Oops, we are different! Let’s meet at another world!(Projecting datasets into a latent feature space)

EVALUATION
23
24
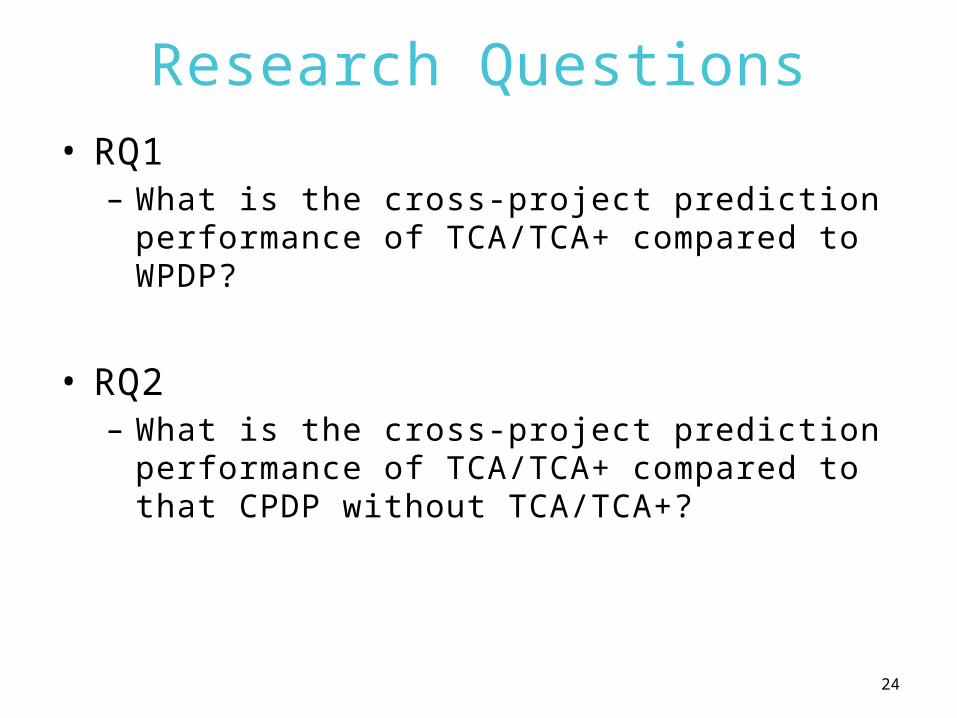
Research Questions• RQ1– What is the cross-project prediction
performance of TCA/TCA+ compared to WPDP?
• RQ2– What is the cross-project prediction
performance of TCA/TCA+ compared to that CPDP without TCA/TCA+?
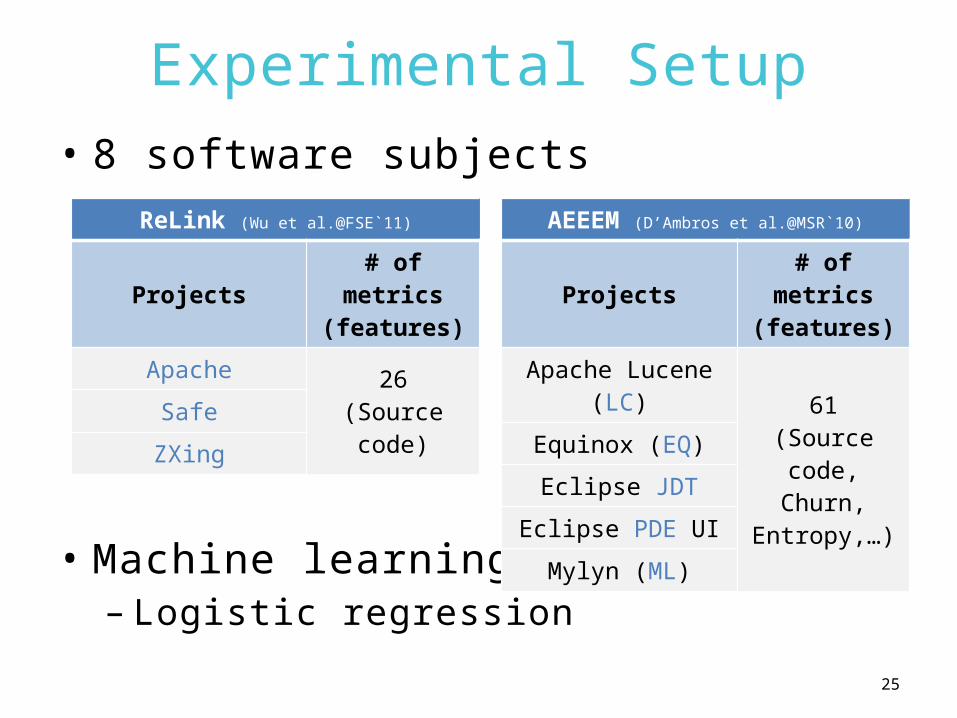
Experimental Setup• 8 software subjects
• Machine learning algorithm– Logistic regression
ReLink (Wu et al.@FSE`11)
Projects# of
metrics (features)
Apache 26(Source code)
Safe
ZXing
AEEEM (D’Ambros et al.@MSR`10)
Projects# of
metrics (features)
Apache Lucene (LC) 61
(Source code,Churn,
Entropy,…)
Equinox (EQ)
Eclipse JDT
Eclipse PDE UI
Mylyn (ML)
25
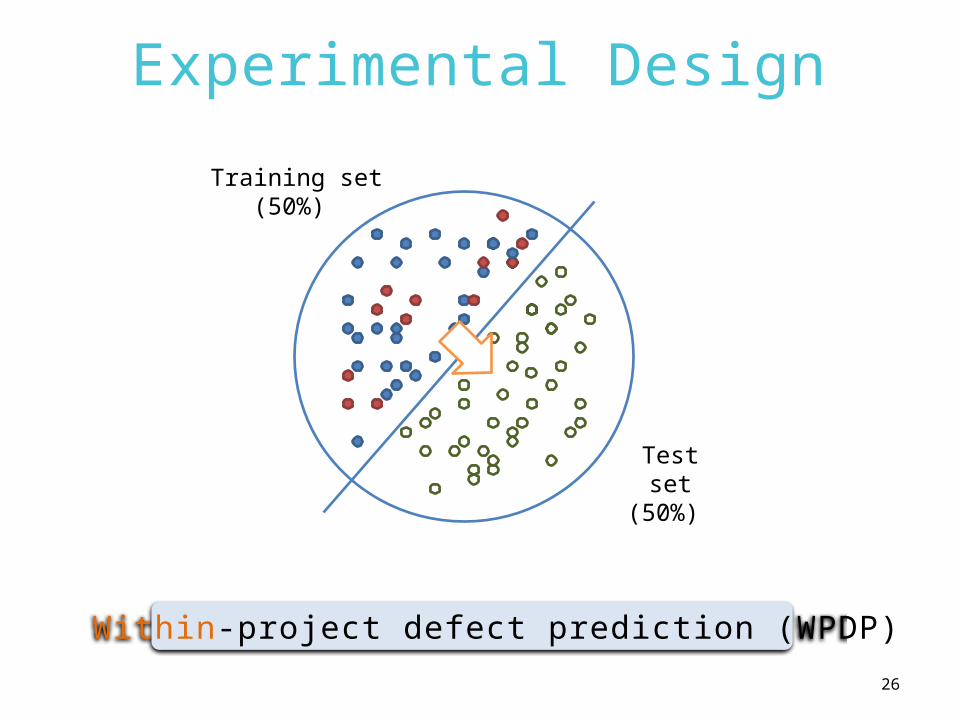
Experimental Design
Test set(50%)
Training set(50%)
Within-project defect prediction (WPDP)
26
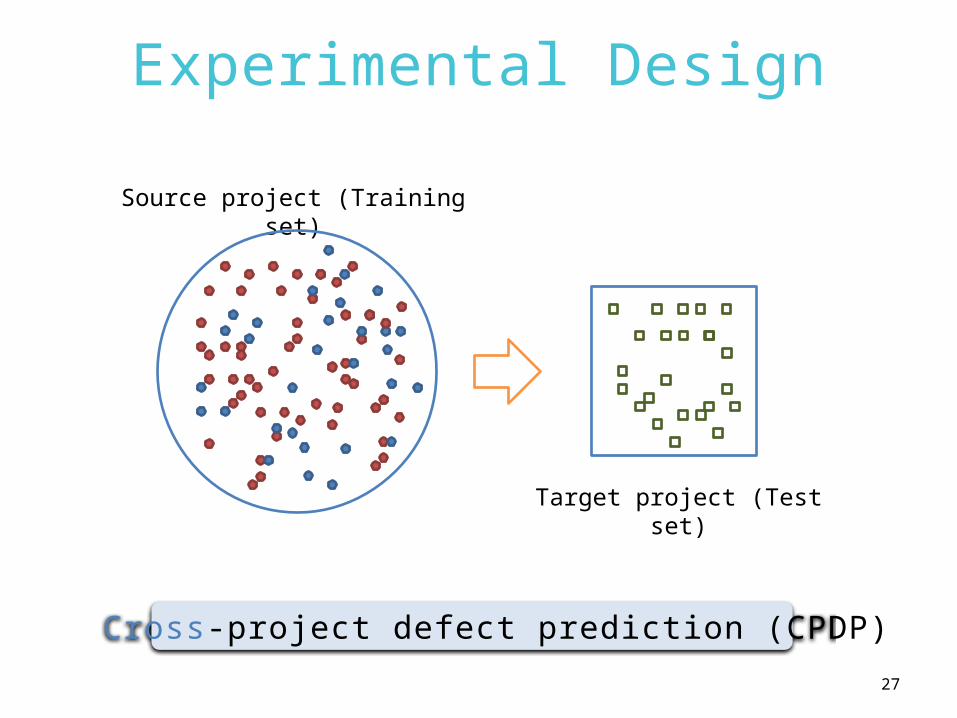
Experimental Design
Target project (Test set)
Source project (Training set)
Cross-project defect prediction (CPDP)
27
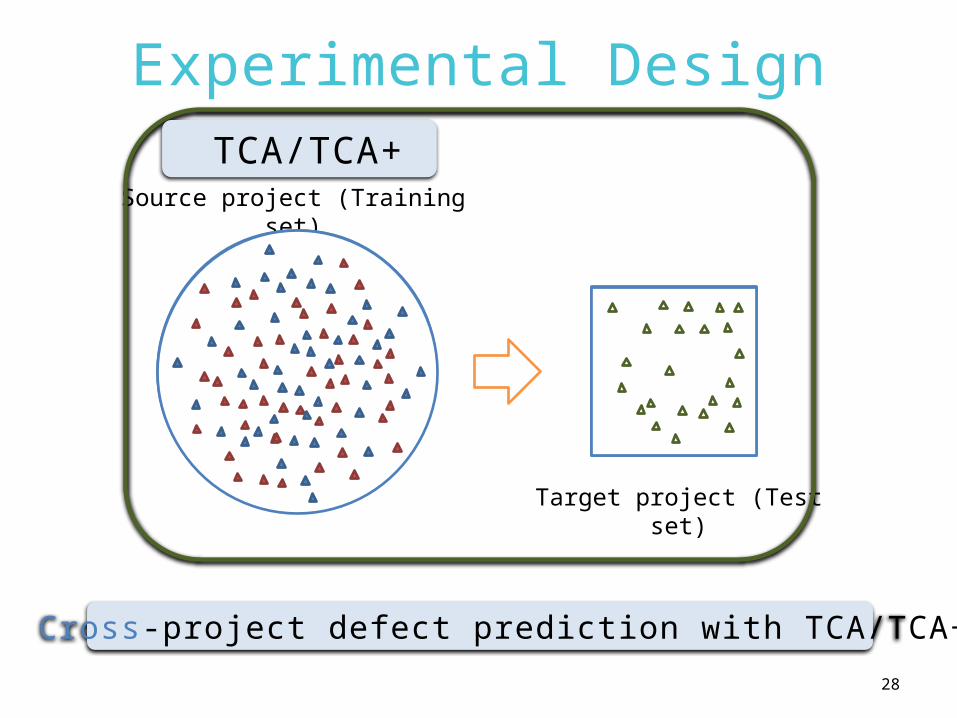
Experimental Design
Target project (Test set)
Source project (Training set)
Cross-project defect prediction with TCA/TCA+
TCA/TCA+
28

RESULTS
29
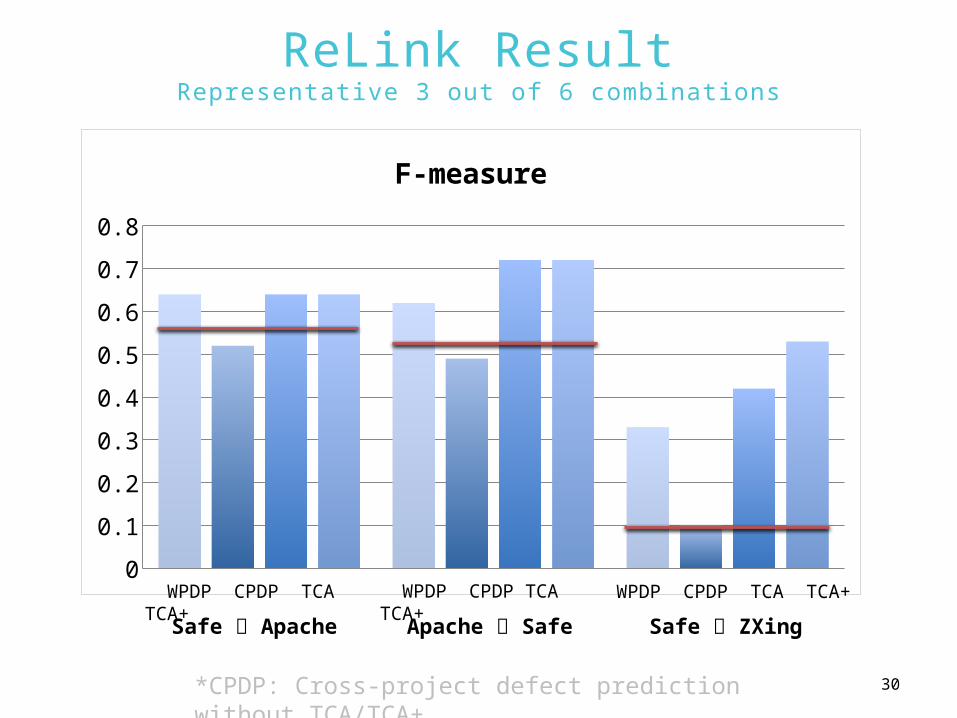
ReLink ResultRepresentative 3 out of 6 combinations
*CPDP: Cross-project defect prediction without TCA/TCA+
0
0.1
0.2
0.3
0.4
0.5
0.6
0.7
0.8
F-measure
WPDP CPDP TCA TCA+
Safe Apache Apache Safe Safe ZXing
WPDP CPDP TCA TCA+ WPDP CPDP TCA TCA+
30
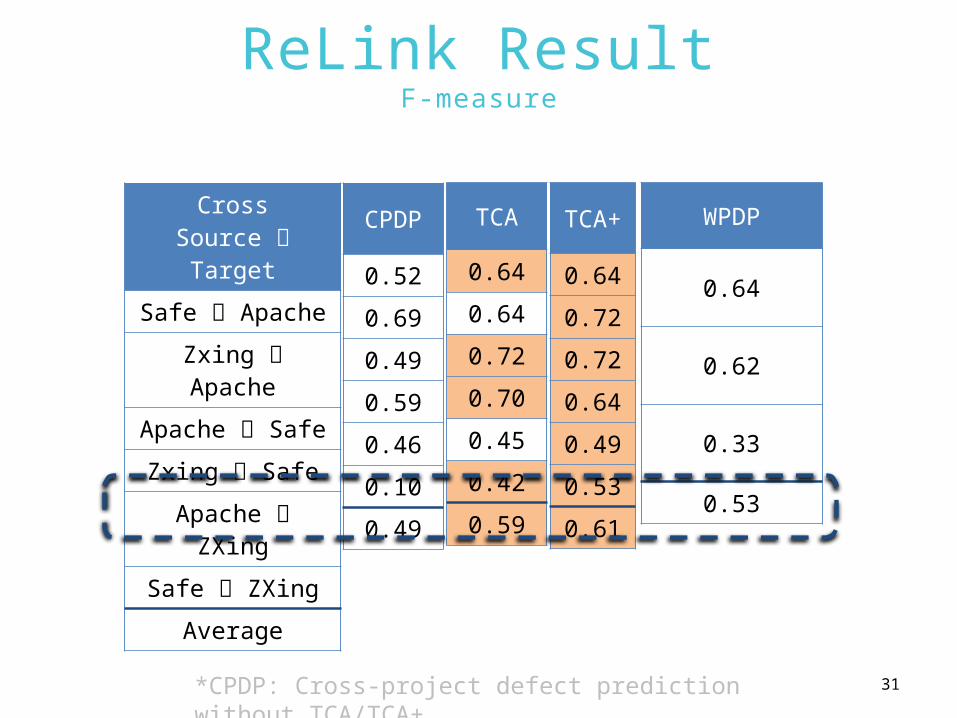
ReLink ResultF-measure
CrossSource Target
Safe Apache
Zxing Apache
Apache Safe
Zxing Safe
Apache ZXing
Safe ZXing
Average
CPDP
0.52
0.69
0.49
0.59
0.46
0.10
0.49
TCA
0.64
0.64
0.72
0.70
0.45
0.42
0.59
TCA+
0.64
0.72
0.72
0.64
0.49
0.53
0.61
WPDP
0.64
0.62
0.33
0.53
*CPDP: Cross-project defect prediction without TCA/TCA+
31
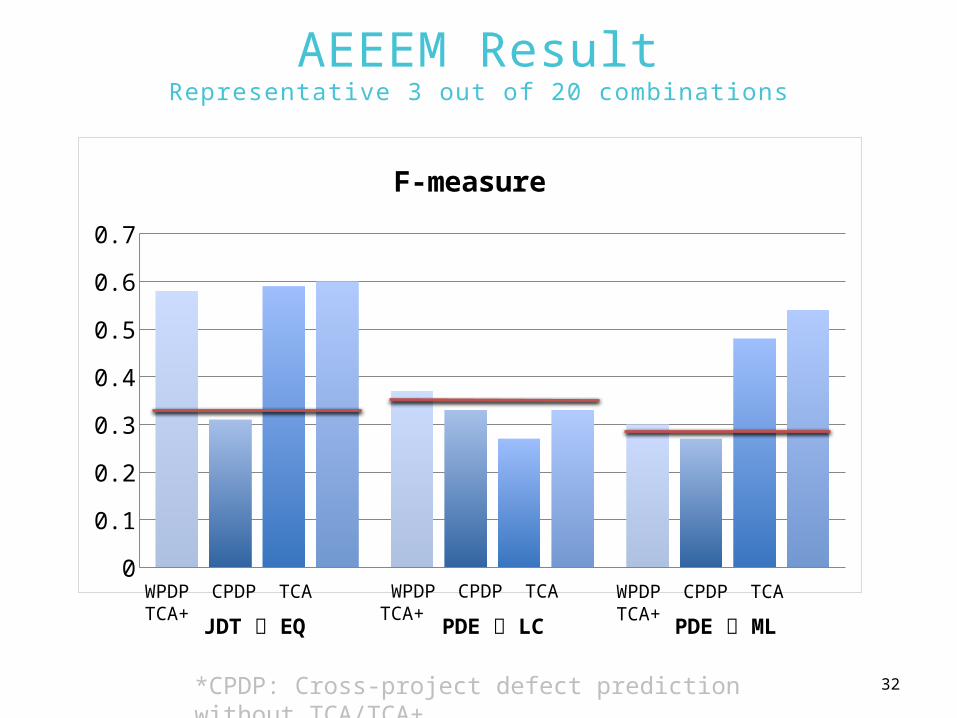
AEEEM ResultRepresentative 3 out of 20 combinations
*CPDP: Cross-project defect prediction without TCA/TCA+
0
0.1
0.2
0.3
0.4
0.5
0.6
0.7
F-measure
WPDP CPDP TCA TCA+
JDT EQ PDE LC PDE ML
WPDP CPDP TCA TCA+
WPDP CPDP TCA TCA+
32
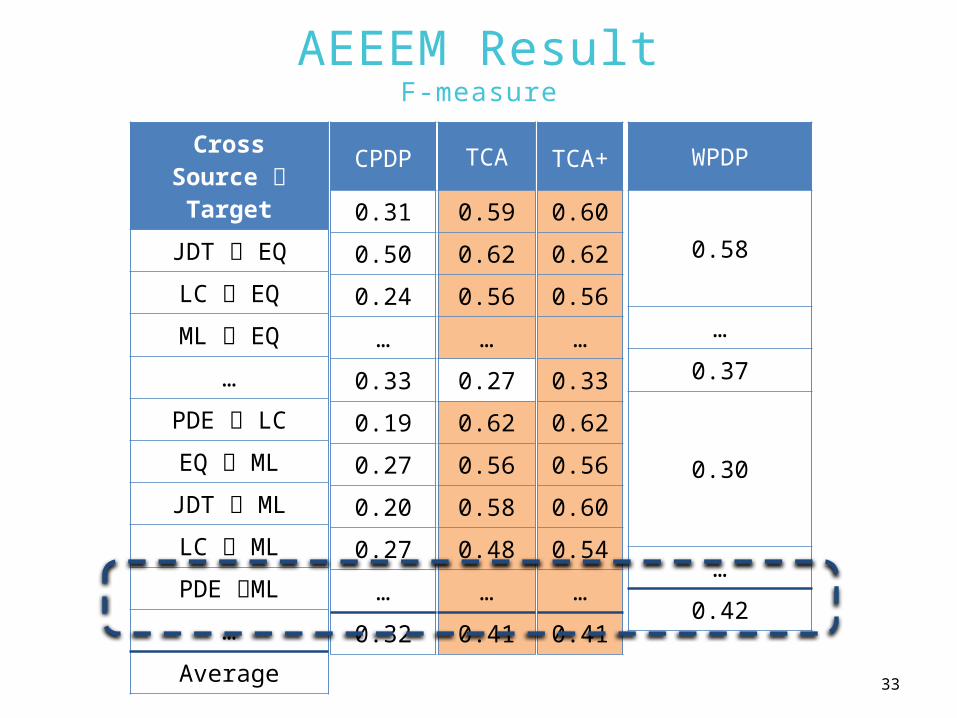
AEEEM ResultF-measure
CrossSource Target
JDT EQ
LC EQ
ML EQ…
PDE LC
EQ ML
JDT ML
LC ML
PDE ML…
Average
CPDP
0.31
0.50
0.24
…
0.33
0.19
0.27
0.20
0.27
…
0.32
TCA
0.59
0.62
0.56
…
0.27
0.62
0.56
0.58
0.48
…
0.41
TCA+
0.60
0.62
0.56
…
0.33
0.62
0.56
0.60
0.54
…
0.41
WPDP
0.58
…
0.37
0.30
…
0.42
33
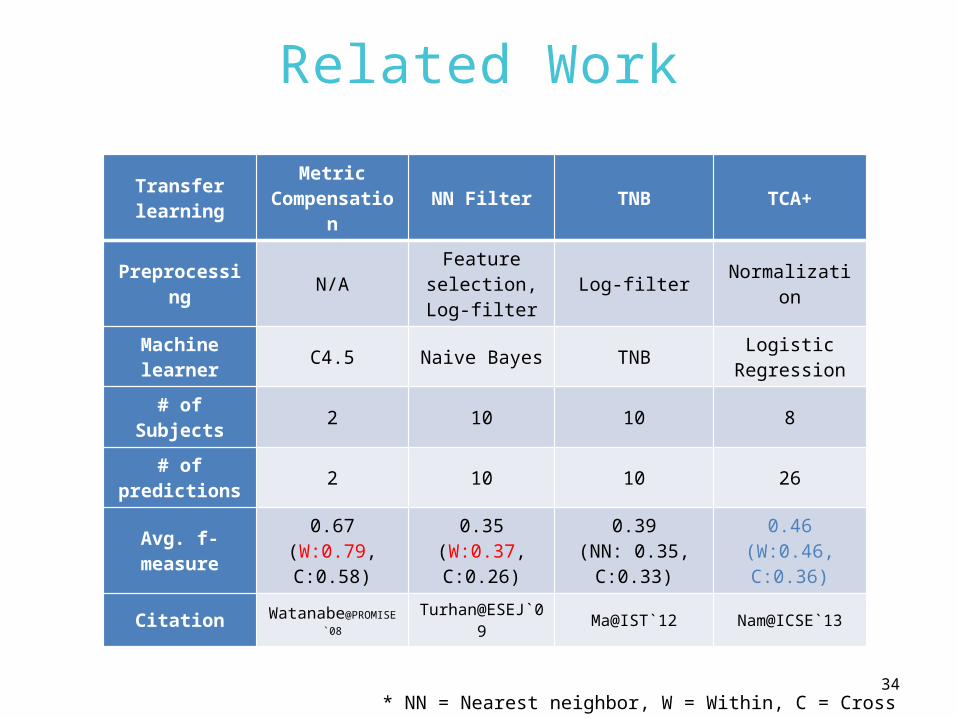
Related Work
Transfer learning
Metric Compensati
onNN Filter TNB TCA+
Preprocessing
N/AFeature
selection,Log-filter
Log-filter Normalization
Machine learner
C4.5 Naive Bayes TNBLogistic
Regression
# of Subjects
2 10 10 8
# of predictions
2 10 10 26
Avg. f-measure
0.67(W:0.79, C:0.58)
0.35(W:0.37, C:0.26)
0.39(NN: 0.35,
C:0.33)
0.46(W:0.46, C:0.36)
Citation Watanabe@PROMISE`08
Turhan@ESEJ`09
Ma@IST`12 Nam@ICSE`13
* NN = Nearest neighbor, W = Within, C = Cross34
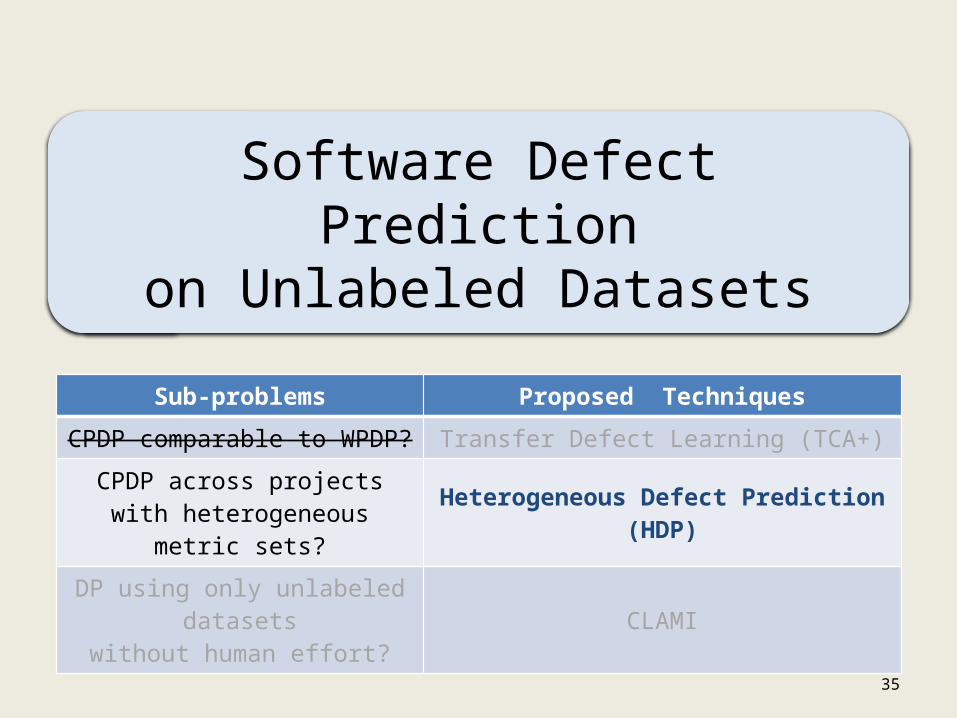
35
Software Defect Predictionon Unlabeled Datasets
Sub-problems Proposed Techniques
CPDP comparable to WPDP? Transfer Defect Learning (TCA+)
CPDP across projects with heterogeneous metric sets?
Heterogeneous Defect Prediction (HDP)
DP using only unlabeled datasets
without human effort?CLAMI
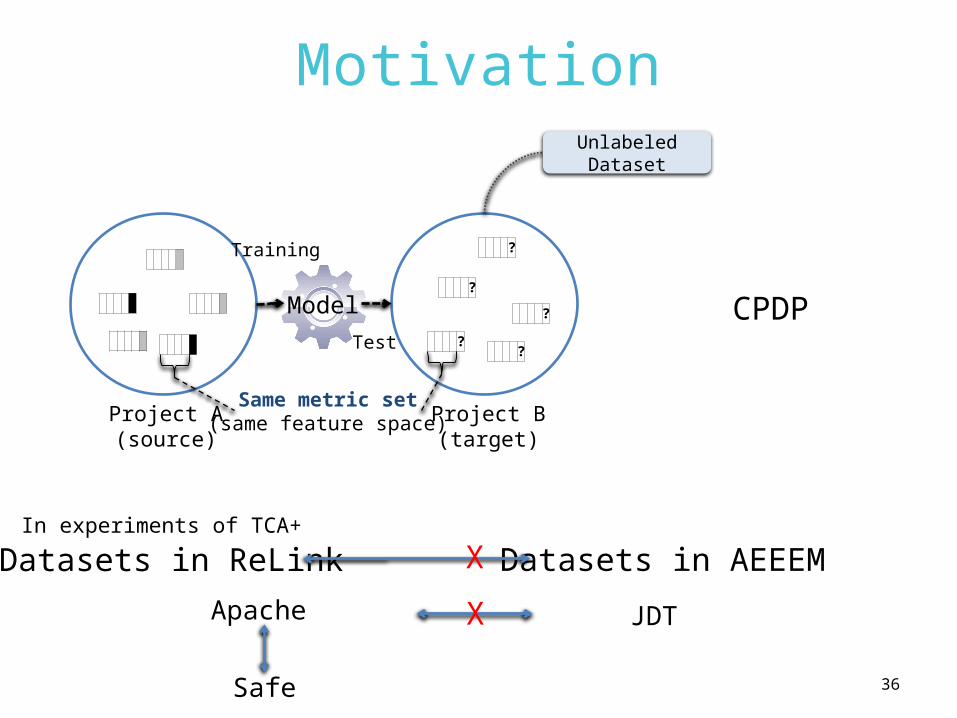
36
Motivation
?
?
?
??
Training
Test
Model
Project A(source)
Project B(target)
Same metric set(same feature space)
CPDP
In experiments of TCA+ Datasets in ReLink Datasets in AEEEMX
Unlabeled Dataset
Apache
Safe
JDTX
37
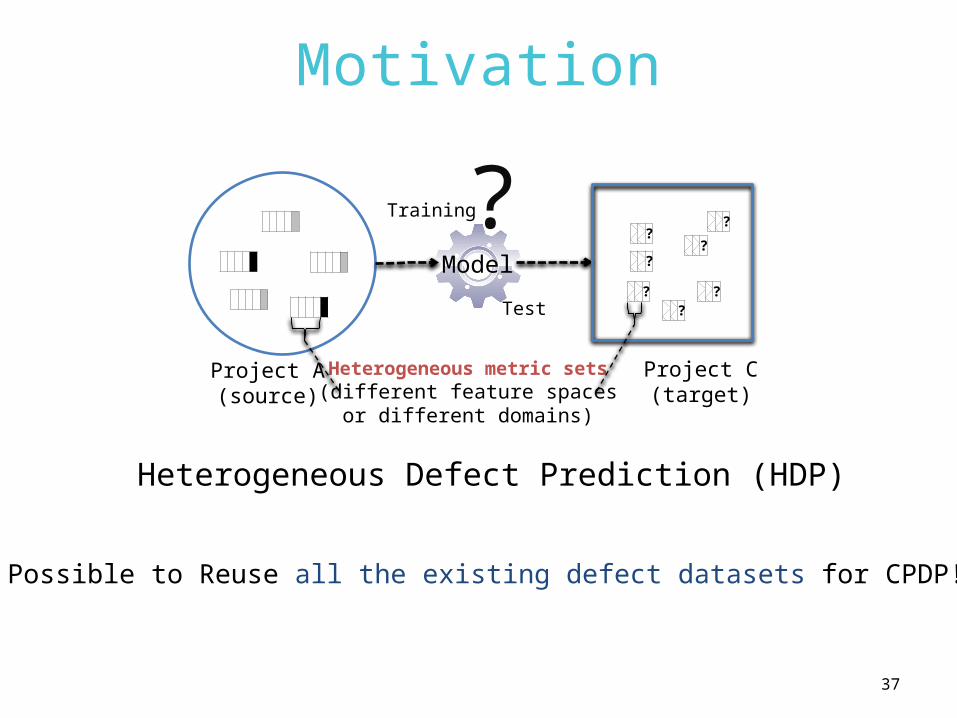
Motivation
?
Training
Test
Model
Project A(source)
Project C(target)
?
?
?
?
?
?
?
Heterogeneous metric sets(different feature spaces
or different domains)
Possible to Reuse all the existing defect datasets for CPDP!
Heterogeneous Defect Prediction (HDP)
38
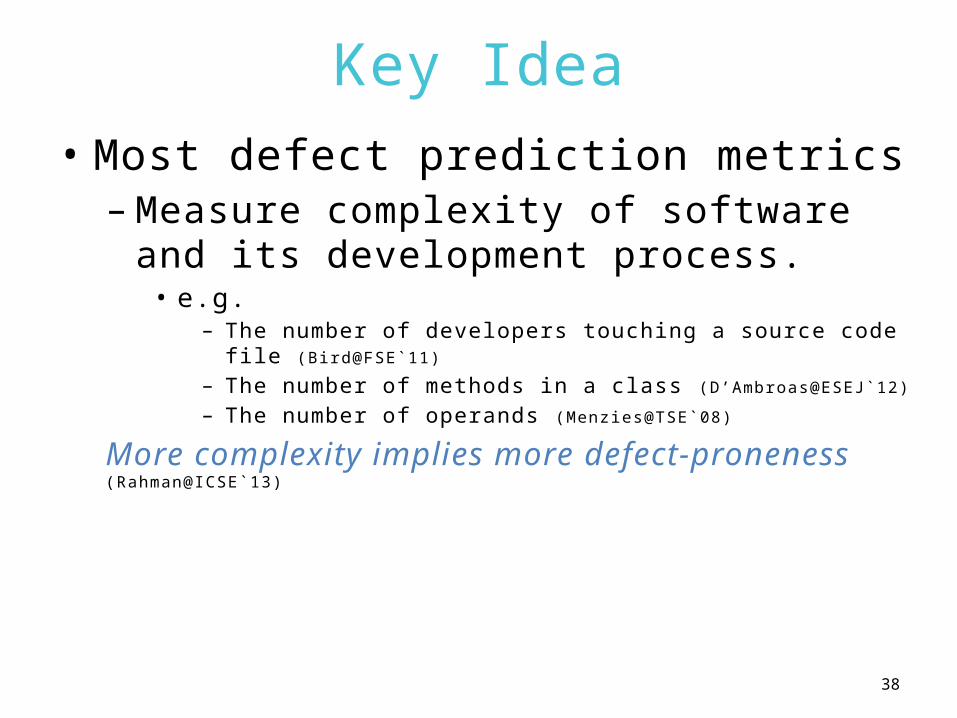
Key Idea• Most defect prediction metrics–Measure complexity of software and its
development process.• e.g.
– The number of developers touching a source code fi le (Bird@FSE`11)
– The number of methods in a class (D’Ambroas@ESEJ`12)
– The number of operands (Menzies@TSE`08)
More complexity implies more defect-proneness (Rahman@ICSE`13)
39
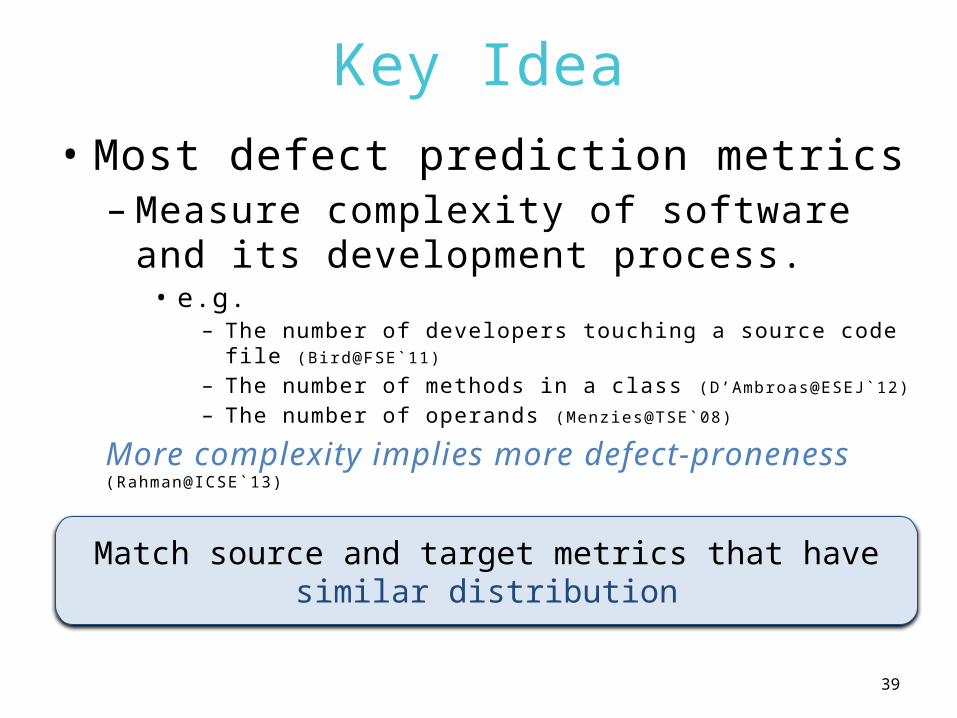
Key Idea• Most defect prediction metrics–Measure complexity of software and its
development process.• e.g.
– The number of developers touching a source code fi le (Bird@FSE`11)
– The number of methods in a class (D’Ambroas@ESEJ`12)
– The number of operands (Menzies@TSE`08)
More complexity implies more defect-proneness (Rahman@ICSE`13)
Match source and target metrics that have similar distribution
40
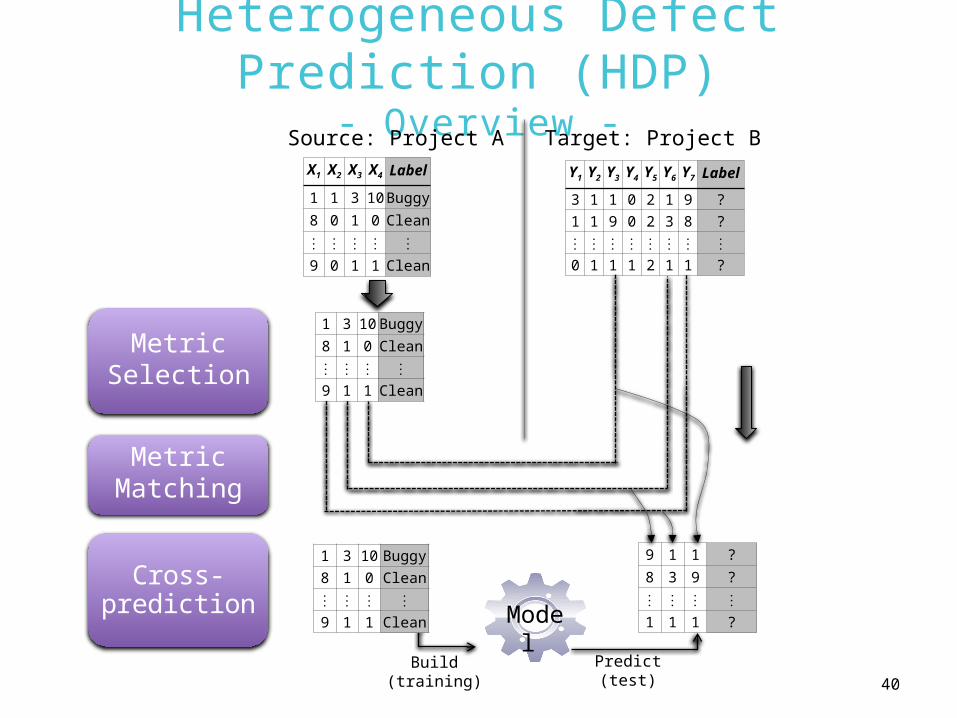
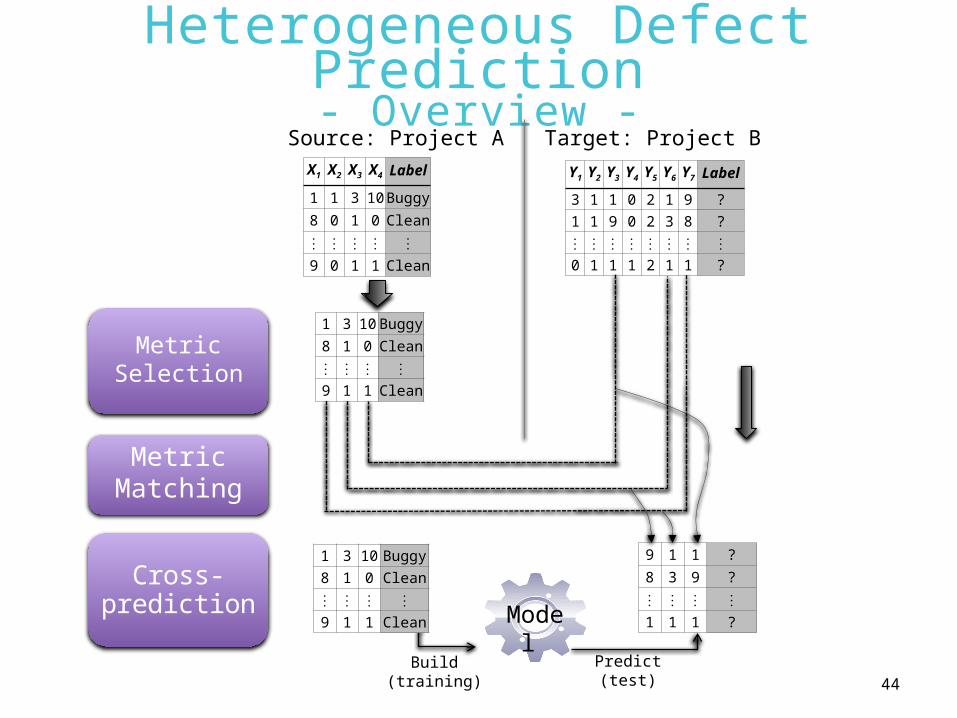
Heterogeneous Defect Prediction (HDP)
- Overview -X1 X2 X3 X4 Label
1 1 3 10 Buggy
8 0 1 0 Clean
⋮ ⋮ ⋮ ⋮ ⋮
9 0 1 1 Clean
MetricMatching
Source: Project A Target: Project B
Cross-prediction Mode
l Build
(training)Predict(test)
MetricSelection
Y1 Y2 Y3 Y4 Y5 Y6 Y7 Label
3 1 1 0 2 1 9 ?1 1 9 0 2 3 8 ?⋮ ⋮ ⋮ ⋮ ⋮ ⋮ ⋮ ⋮
0 1 1 1 2 1 1 ?
1 3 10 Buggy8 1 0 Clean⋮ ⋮ ⋮ ⋮
9 1 1 Clean
1 3 10 Buggy8 1 0 Clean⋮ ⋮ ⋮ ⋮
9 1 1 Clean
9 1 1 ?
8 3 9 ?
⋮ ⋮ ⋮ ⋮
1 1 1 ?
41
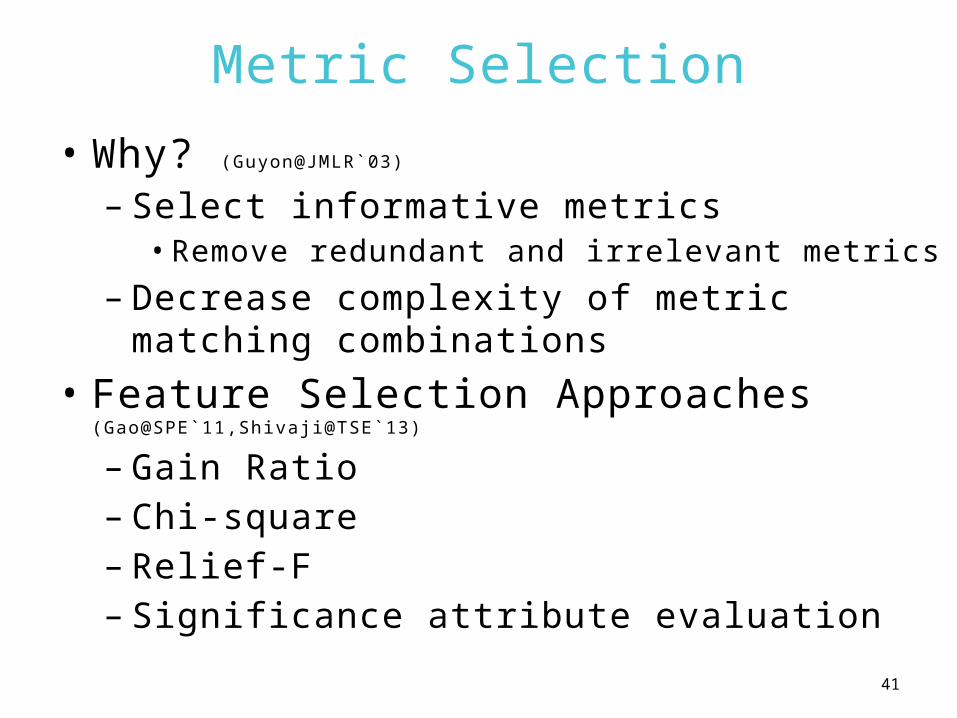
Metric Selection
• Why? (Guyon@JMLR`03)
– Select informative metrics• Remove redundant and irrelevant metrics
– Decrease complexity of metric matching combinations
• Feature Selection Approaches
(Gao@SPE`11,Shivaji@TSE`13)
– Gain Ratio– Chi-square– Relief-F– Significance attribute evaluation
42
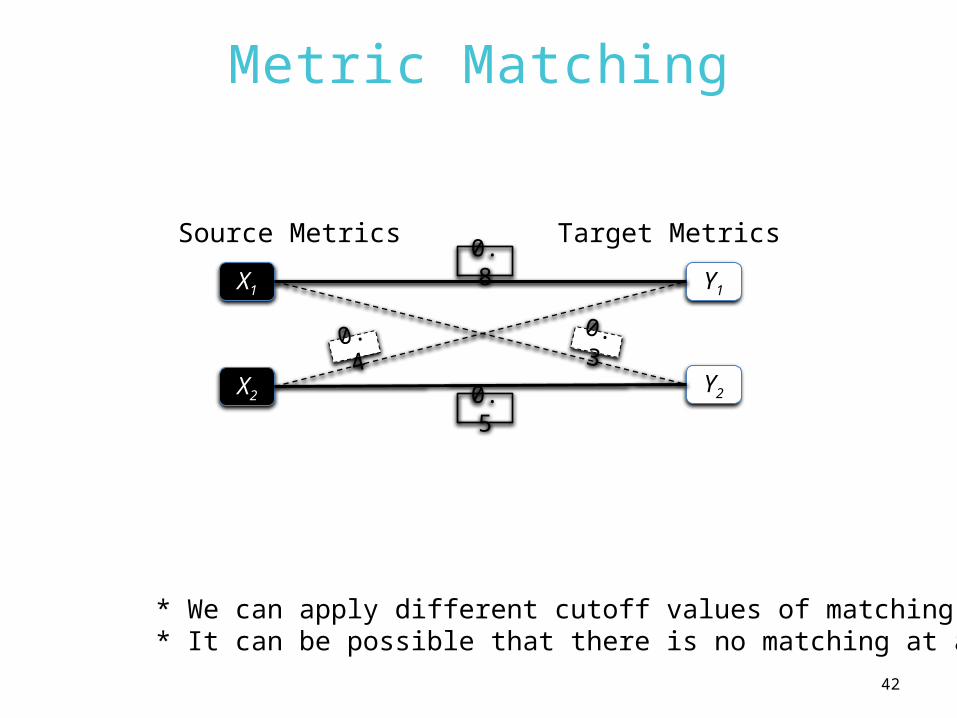
Metric Matching
Source Metrics Target Metrics
X1
X2
Y1
Y2
0.8
0.4
0.5
0.3
* We can apply different cutoff values of matching scores.* It can be possible that there is no matching at all.
43
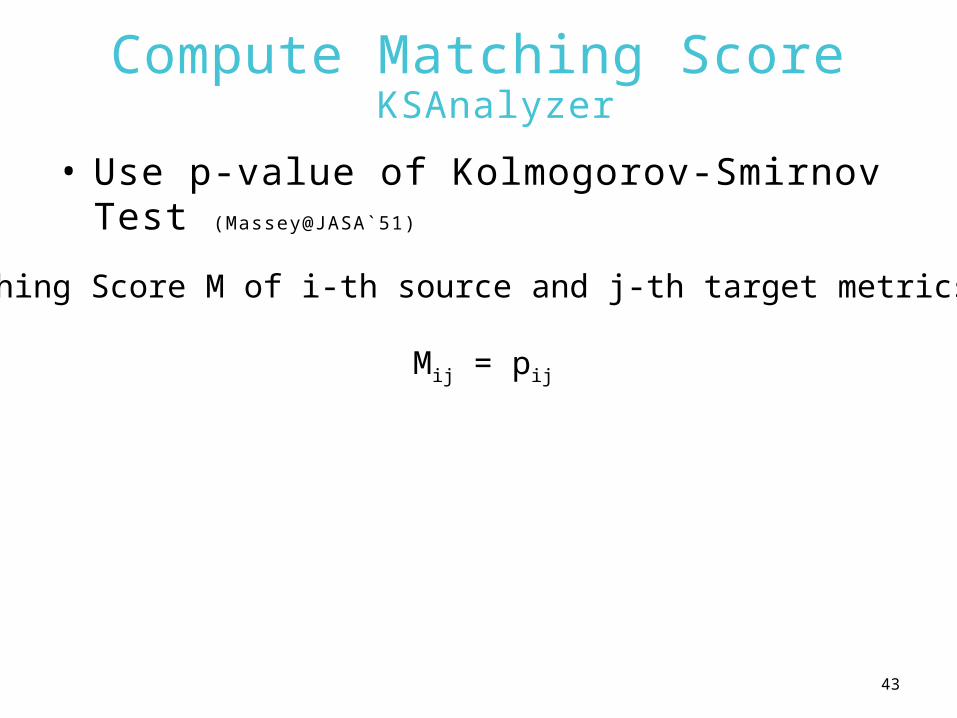
Compute Matching Score KSAnalyzer
• Use p-value of Kolmogorov-Smirnov Test (Massey@JASA`51)
Matching Score M of i-th source and j-th target metrics:
Mij = pij
44
Heterogeneous Defect Prediction- Overview -
X1 X2 X3 X4 Label
1 1 3 10 Buggy
8 0 1 0 Clean
⋮ ⋮ ⋮ ⋮ ⋮
9 0 1 1 Clean
MetricMatching
Source: Project A Target: Project B
Cross-prediction Mode
l Build
(training)Predict(test)
MetricSelection
Y1 Y2 Y3 Y4 Y5 Y6 Y7 Label
3 1 1 0 2 1 9 ?1 1 9 0 2 3 8 ?⋮ ⋮ ⋮ ⋮ ⋮ ⋮ ⋮ ⋮
0 1 1 1 2 1 1 ?
1 3 10 Buggy8 1 0 Clean⋮ ⋮ ⋮ ⋮
9 1 1 Clean
1 3 10 Buggy8 1 0 Clean⋮ ⋮ ⋮ ⋮
9 1 1 Clean
9 1 1 ?
8 3 9 ?
⋮ ⋮ ⋮ ⋮
1 1 1 ?

EVALUATION
45
46
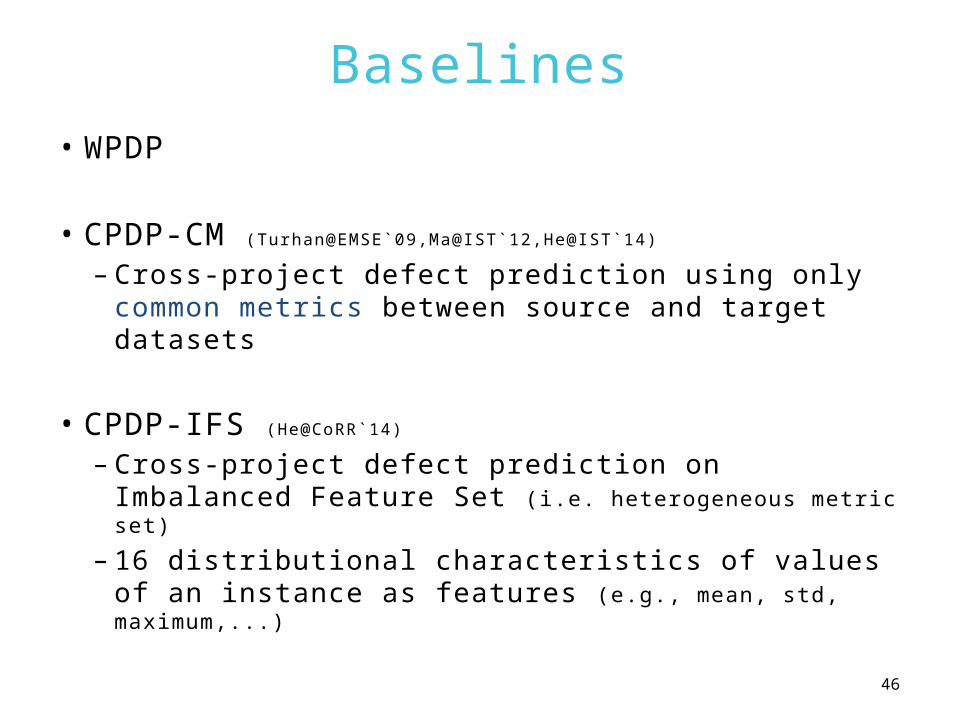
Baselines• WPDP
• CPDP-CM (Turhan@EMSE`09,Ma@IST`12,He@IST`14)
– Cross-project defect prediction using only common metrics between source and target datasets
• CPDP-IFS (He@CoRR`14)
– Cross-project defect prediction on Imbalanced Feature Set (i.e. heterogeneous metric set)
– 16 distributional characteristics of values of an instance as features (e.g., mean, std, maximum,...)
47
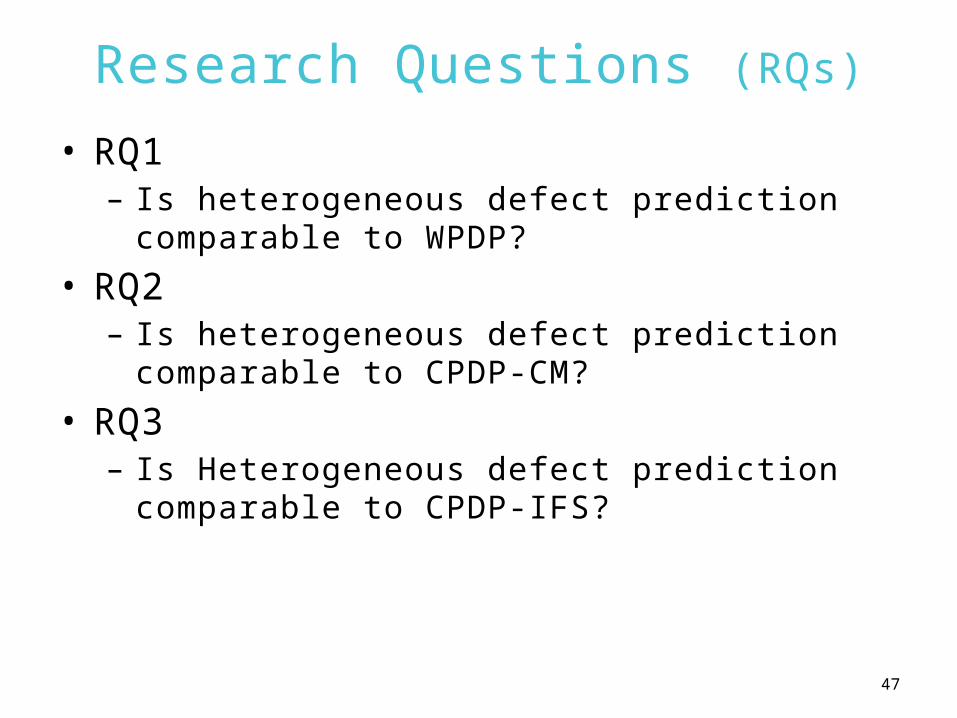
Research Questions (RQs)
• RQ1– Is heterogeneous defect prediction
comparable to WPDP?
• RQ2– Is heterogeneous defect prediction
comparable to CPDP-CM?
• RQ3– Is Heterogeneous defect prediction
comparable to CPDP-IFS?
48
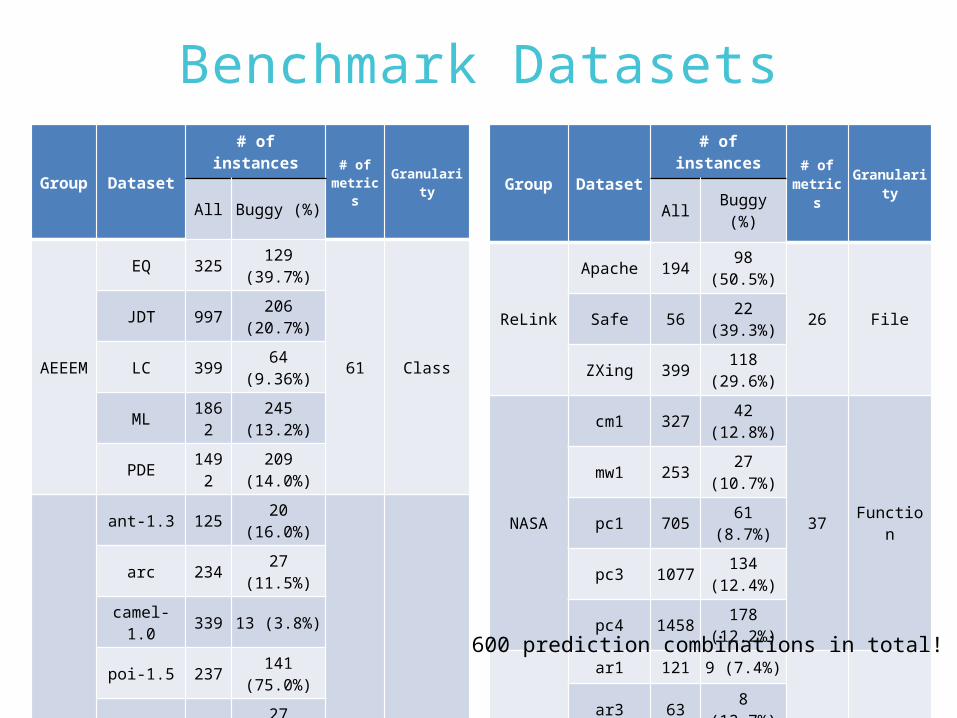
Benchmark Datasets
Group Dataset
# of instances # of
metrics
Granularity
All Buggy (%)
AEEEM
EQ 325129
(39.7%)
61 Class
JDT 997206
(20.7%)
LC 39964
(9.36%)
ML186
2245
(13.2%)
PDE149
2209
(14.0%)
MORPH
ant-1.3 12520
(16.0%)
20 Class
arc 23427
(11.5%)
camel-1.0 339 13 (3.8%)
poi-1.5 237141
(75.0%)
redaktor 17627
(15.3%)
skarbonka
45 9 (20.0%)
tomcat 858 77 (9.0%)
velocity-1.4
196147
(75.0%)
xalan-2.4 723110
(15.2%)
xerces-1.2
44071
(16.1%)
Group Dataset
# of instances # of
metrics
Granularity
AllBuggy
(%)
ReLink
Apache 19498
(50.5%)
26 FileSafe 5622
(39.3%)
ZXing 399118
(29.6%)
NASA
cm1 32742
(12.8%)
37 Function
mw1 25327
(10.7%)
pc1 70561
(8.7%)
pc3 1077134
(12.4%)
pc4 1458178
(12.2%)
SOFTLAB
ar1 121 9 (7.4%)
29 Function
ar3 638
(12.7%)
ar4 10720
(18.7%)
ar5 368
(22.2%)
ar6 10115
(14.9%)
600 prediction combinations in total!
49
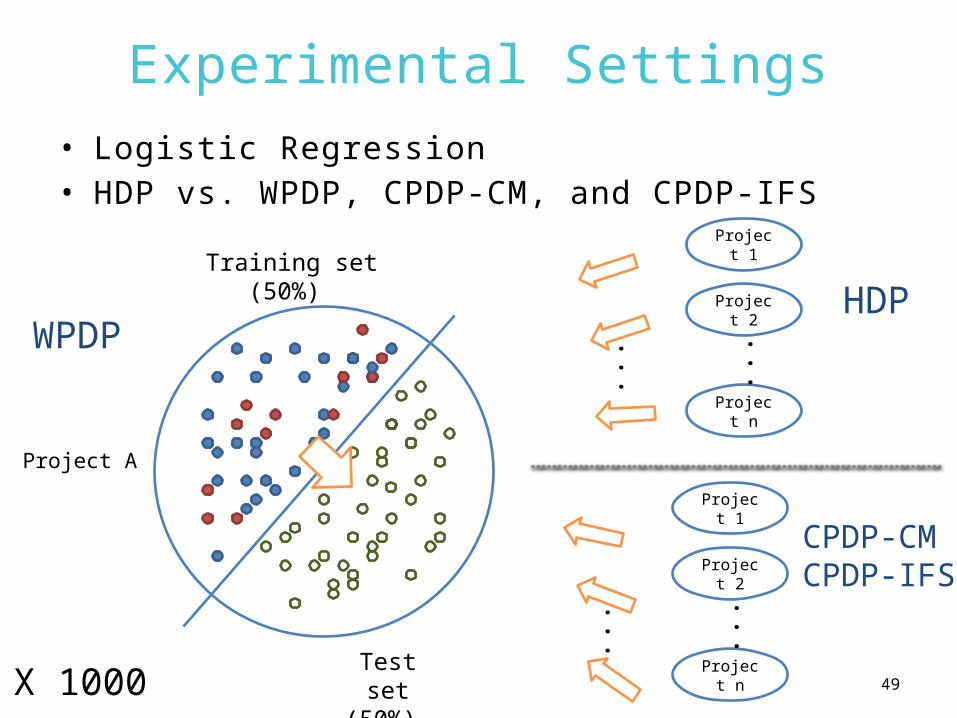
Experimental Settings• Logistic Regression• HDP vs. WPDP, CPDP-CM, and CPDP-IFS
Test set(50%)
Training set(50%)
Project 1
Project 2
Project n
......
X 1000
Project 1
Project 2
Project n
......
CPDP-CMCPDP-IFS
HDPWPDP
Project A
50
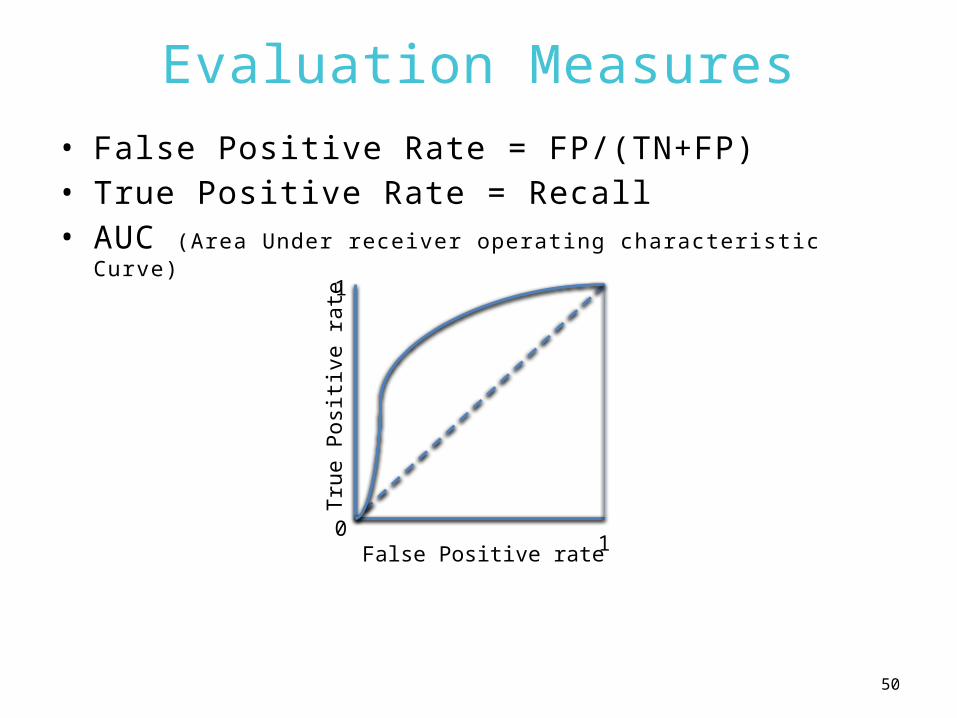
Evaluation Measures• False Positive Rate = FP/(TN+FP)• True Positive Rate = Recall• AUC (Area Under receiver operating characteristic Curve)
False Positive rate
True P
osi
tive r
ate
01
1
51
Evaluation Measures
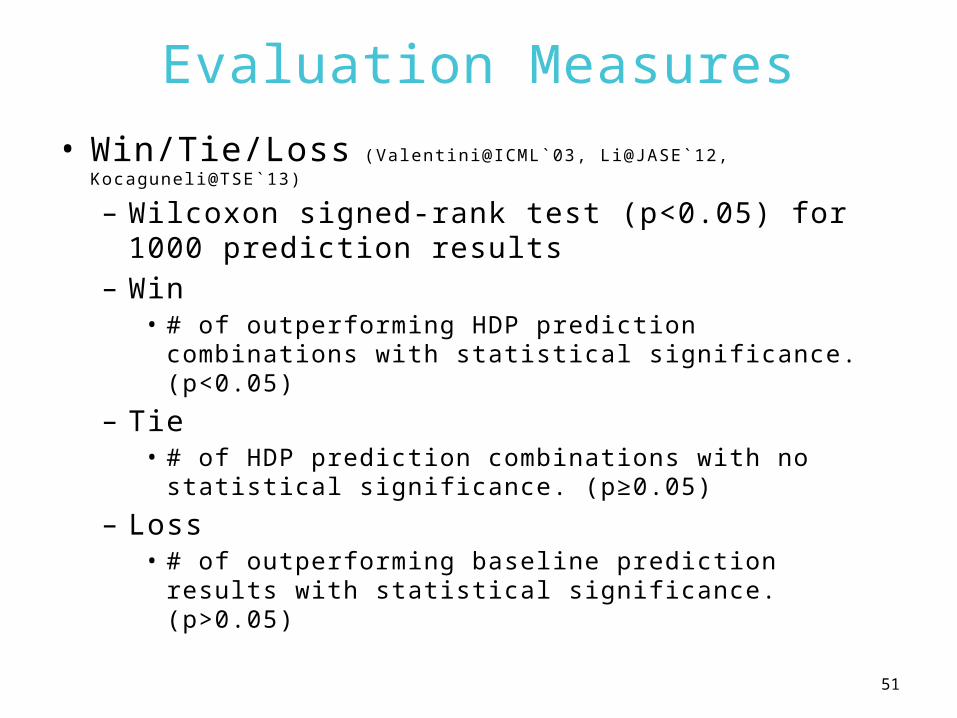
• Win/Tie/Loss (Valentini@ICML`03, Li@JASE`12, Kocaguneli@TSE`13)
– Wilcoxon signed-rank test (p<0.05) for 1000 prediction results
– Win• # of outperforming HDP prediction
combinations with statistical significance. (p<0.05)
– Tie• # of HDP prediction combinations with no
statistical significance. (p≥0.05)
– Loss• # of outperforming baseline prediction results
with statistical significance. (p>0.05)

RESULT
52
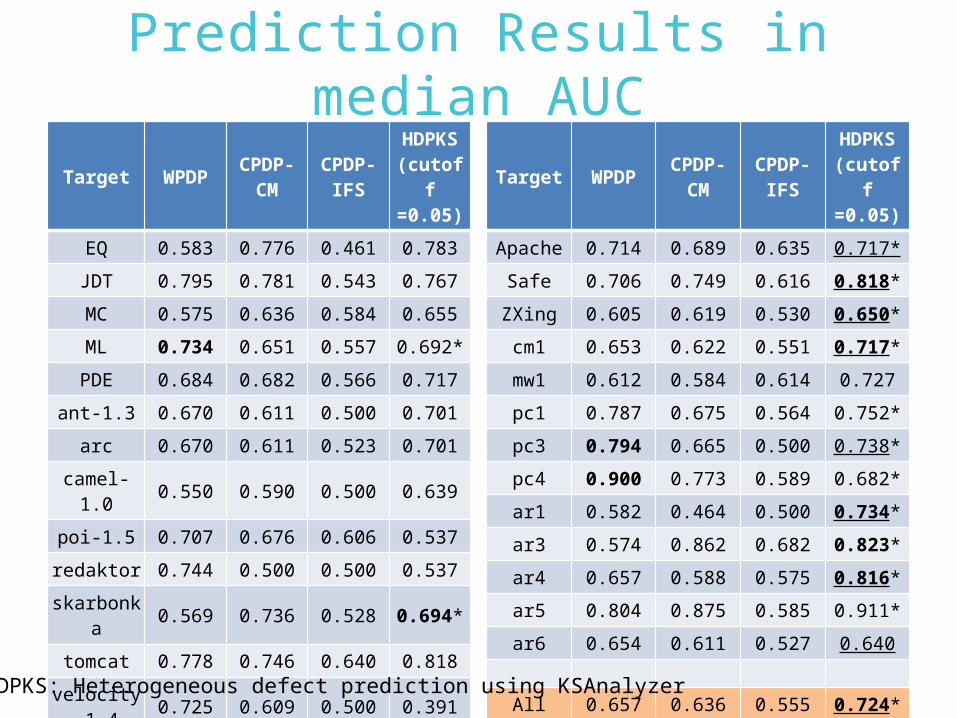
Prediction Results in median AUC
Target WPDPCPDP-
CMCPDP-
IFS
HDPKS(cutoff=0.05)
EQ 0.583 0.776 0.461 0.783
JDT 0.795 0.781 0.543 0.767
MC 0.575 0.636 0.584 0.655
ML 0.734 0.651 0.557 0.692*
PDE 0.684 0.682 0.566 0.717
ant-1.3 0.670 0.611 0.500 0.701
arc 0.670 0.611 0.523 0.701
camel-1.0
0.550 0.590 0.500 0.639
poi-1.5 0.707 0.676 0.606 0.537
redaktor 0.744 0.500 0.500 0.537
skarbonka
0.569 0.736 0.528 0.694*
tomcat 0.778 0.746 0.640 0.818
velocity-1.4
0.725 0.609 0.500 0.391
xalan-2.4 0.755 0.658 0.499 0.751
xerces-1.2
0.624 0.453 0.500 0.489
53
Target WPDPCPDP-
CMCPDP-
IFS
HDPKS(cutoff=0.05)
Apache 0.714 0.689 0.635 0.717*
Safe 0.706 0.749 0.616 0.818*
ZXing 0.605 0.619 0.530 0.650*
cm1 0.653 0.622 0.551 0.717*
mw1 0.612 0.584 0.614 0.727
pc1 0.787 0.675 0.564 0.752*
pc3 0.794 0.665 0.500 0.738*
pc4 0.900 0.773 0.589 0.682*
ar1 0.582 0.464 0.500 0.734*
ar3 0.574 0.862 0.682 0.823*
ar4 0.657 0.588 0.575 0.816*
ar5 0.804 0.875 0.585 0.911*
ar6 0.654 0.611 0.527 0.640
All 0.657 0.636 0.555 0.724*
HDPKS: Heterogeneous defect prediction using KSAnalyzer
54
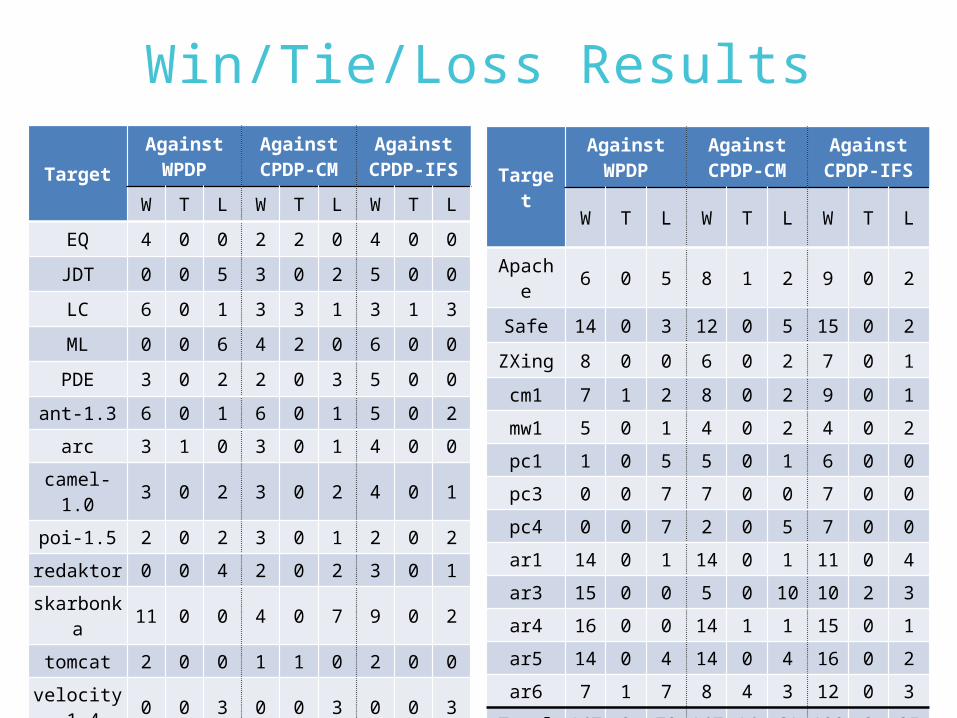
Win/Tie/Loss Results
TargetAgainst WPDP
Against CPDP-
CM
AgainstCPDP-
IFS
W T L W T L W T L
EQ 4 0 0 2 2 0 4 0 0
JDT 0 0 5 3 0 2 5 0 0
LC 6 0 1 3 3 1 3 1 3
ML 0 0 6 4 2 0 6 0 0
PDE 3 0 2 2 0 3 5 0 0
ant-1.3 6 0 1 6 0 1 5 0 2
arc 3 1 0 3 0 1 4 0 0
camel-1.0
3 0 2 3 0 2 4 0 1
poi-1.5 2 0 2 3 0 1 2 0 2
redaktor 0 0 4 2 0 2 3 0 1
skarbonka
11 0 0 4 0 7 9 0 2
tomcat 2 0 0 1 1 0 2 0 0
velocity-1.4
0 0 3 0 0 3 0 0 3
xalan-2.4 0 0 1 1 0 0 1 0 0
xerces-1.2
0 0 3 3 0 0 1 0 2
Target
AgainstWPDP
AgainstCPDP-CM
AgainstCPDP-IFS
W T L W T L W T L
Apache
6 0 5 8 1 2 9 0 2
Safe 14 0 3 12 0 5 15 0 2
ZXing 8 0 0 6 0 2 7 0 1
cm1 7 1 2 8 0 2 9 0 1
mw1 5 0 1 4 0 2 4 0 2
pc1 1 0 5 5 0 1 6 0 0
pc3 0 0 7 7 0 0 7 0 0
pc4 0 0 7 2 0 5 7 0 0
ar1 14 0 1 14 0 1 11 0 4
ar3 15 0 0 5 0 10 10 2 3
ar4 16 0 0 14 1 1 15 0 1
ar5 14 0 4 14 0 4 16 0 2
ar6 7 1 7 8 4 3 12 0 3
Total 147 3 72 147 14 61 182 3 35
% 66.2%
1.4%
32.4%
66.2%
6.3%
27.5%
82.0%
1.3%
16.7%
55
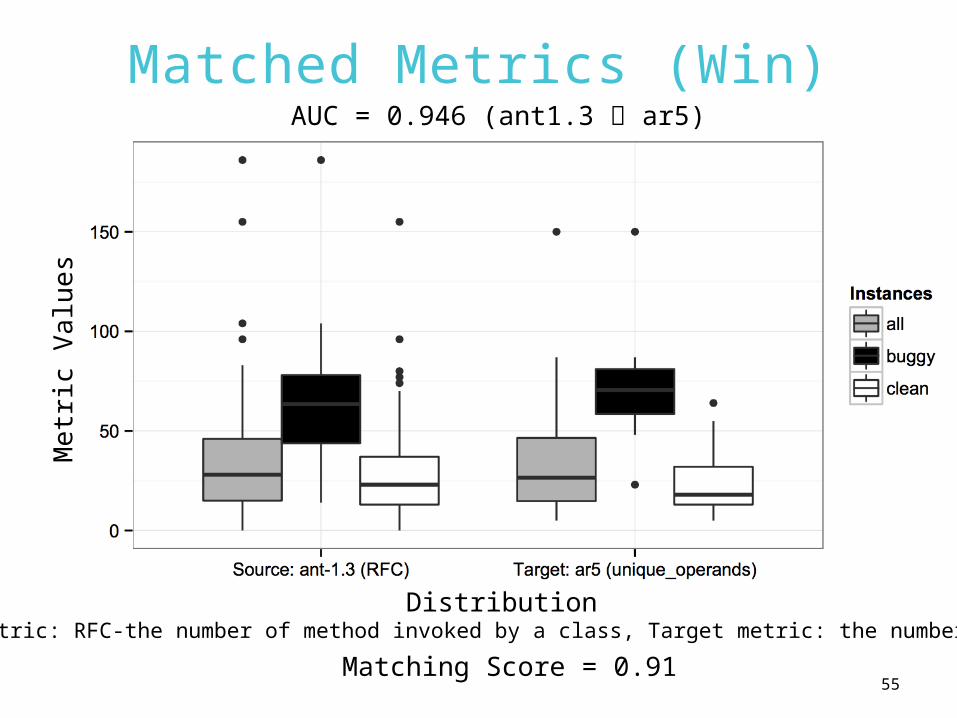
Matched Metrics (Win)M
etr
ic V
alu
es
Distribution(Source metric: RFC-the number of method invoked by a class, Target metric: the number of operands)
Matching Score = 0.91
AUC = 0.946 (ant1.3 ar5)
56
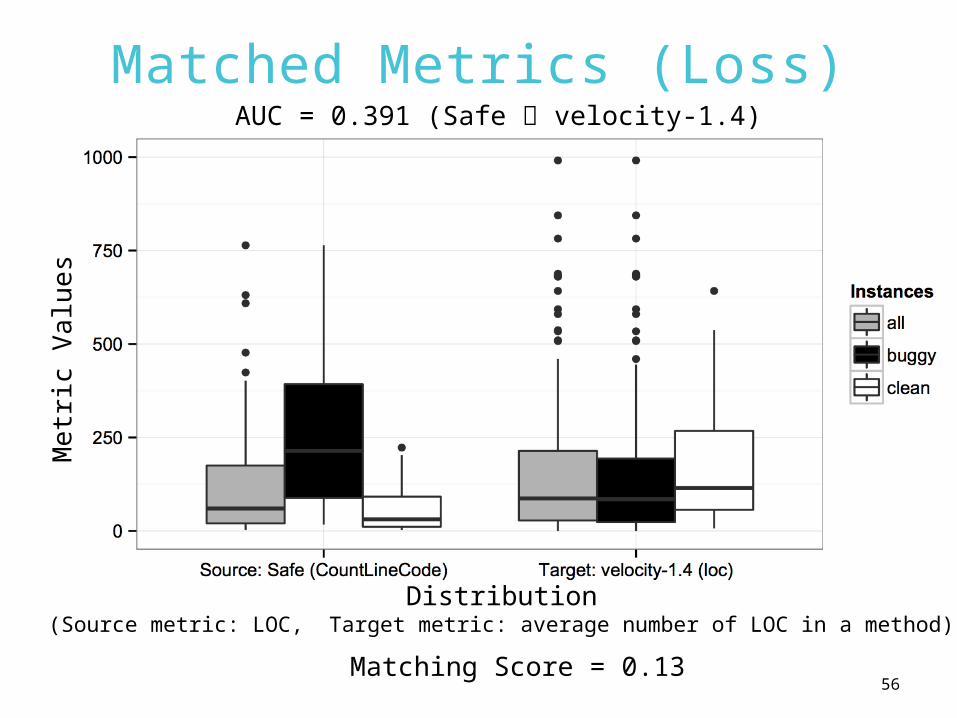
Matched Metrics (Loss)M
etr
ic V
alu
es
Distribution(Source metric: LOC, Target metric: average number of LOC in a method)
Matching Score = 0.13
AUC = 0.391 (Safe velocity-1.4)
57
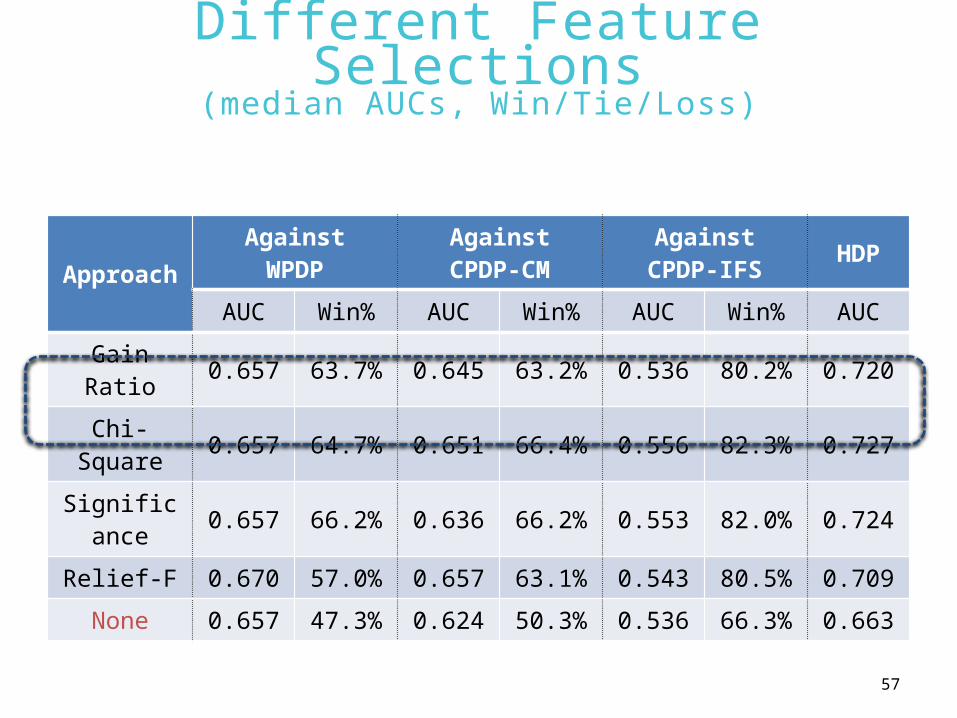
Different Feature Selections(median AUCs, Win/Tie/Loss)
Approach
AgainstWPDP
AgainstCPDP-CM
AgainstCPDP-IFS HDP
AUC Win% AUC Win% AUC Win% AUC
Gain Ratio 0.657 63.7% 0.645 63.2% 0.536 80.2% 0.720
Chi-Square 0.657 64.7% 0.651 66.4% 0.556 82.3% 0.727
Significance 0.657 66.2% 0.636 66.2% 0.553 82.0% 0.724
Relief-F 0.670 57.0% 0.657 63.1% 0.543 80.5% 0.709
None 0.657 47.3% 0.624 50.3% 0.536 66.3% 0.663
58
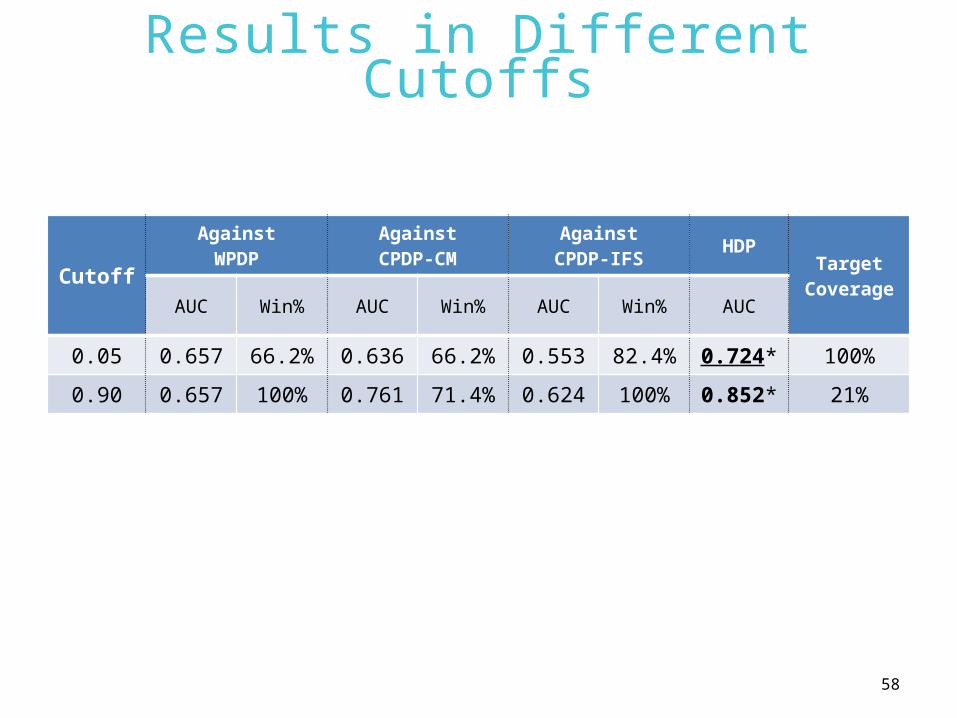
Results in Different Cutoffs
Cutoff
AgainstWPDP
AgainstCPDP-CM
AgainstCPDP-IFS
HDPTarget
CoverageAUC Win% AUC Win% AUC Win% AUC
0.05 0.657 66.2% 0.636 66.2% 0.553 82.4% 0.724* 100%
0.90 0.657 100% 0.761 71.4% 0.624 100% 0.852* 21%
59
Software Defect Predictionon Unlabeled Datasets
Sub-problems Proposed Techniques
CPDP comparable to WPDP? Transfer Defect Learning (TCA+)
CPDP across projects with heterogeneous metric sets?
Heterogeneous Defect Prediction (HDP)
DP using only unlabeled datasets
without human effort?CLAMI
60
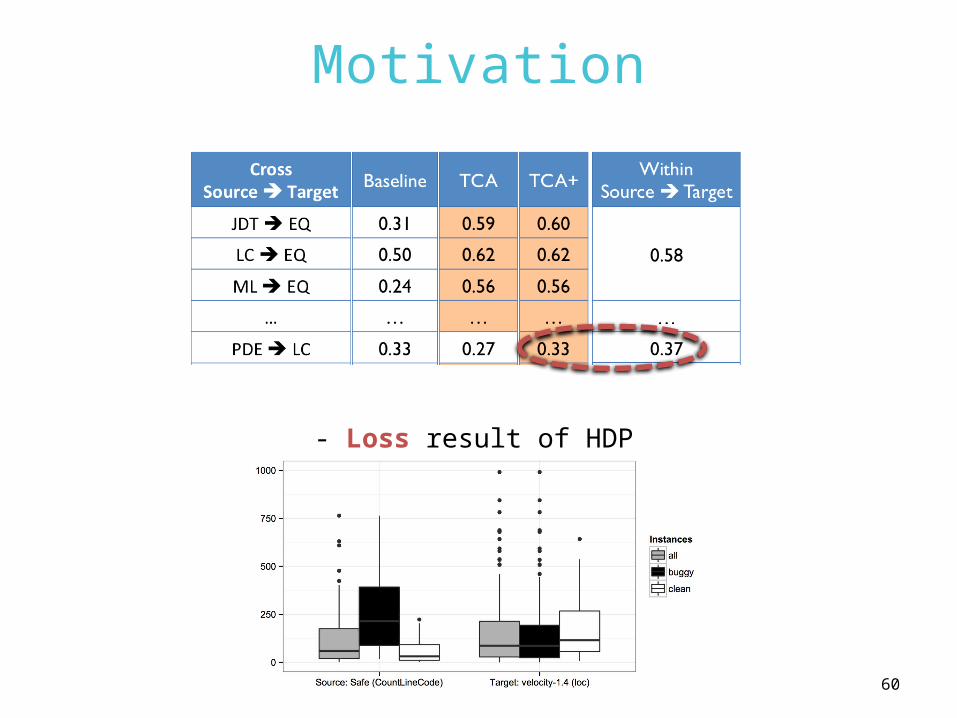
Motivation
- Loss result of HDP
61
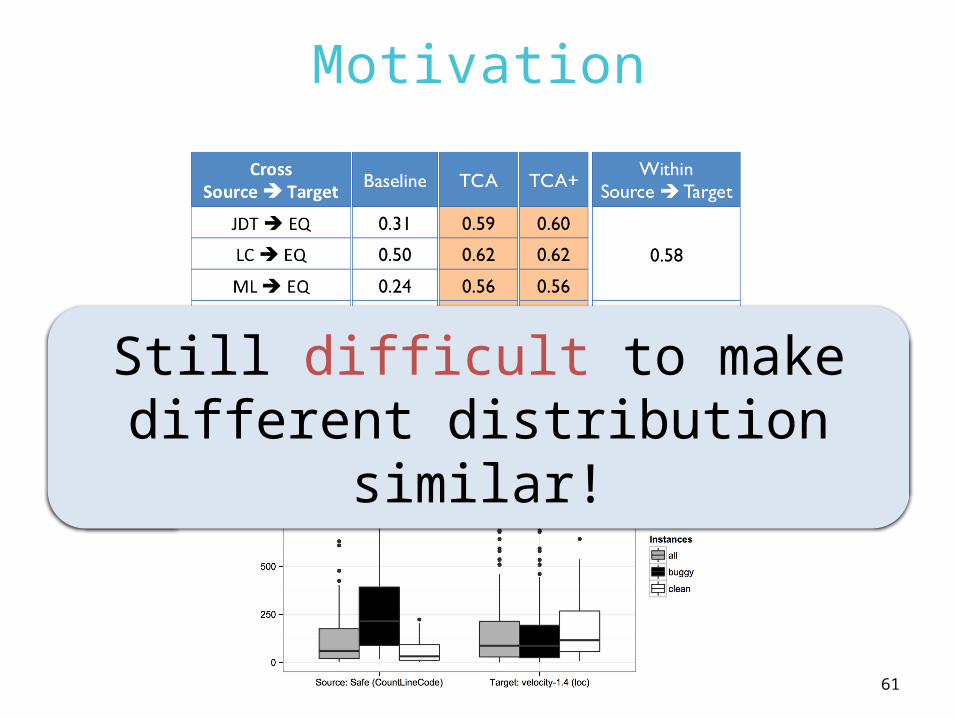
Motivation
- Loss result of HDP
Still difficult to make different distribution similar!
62
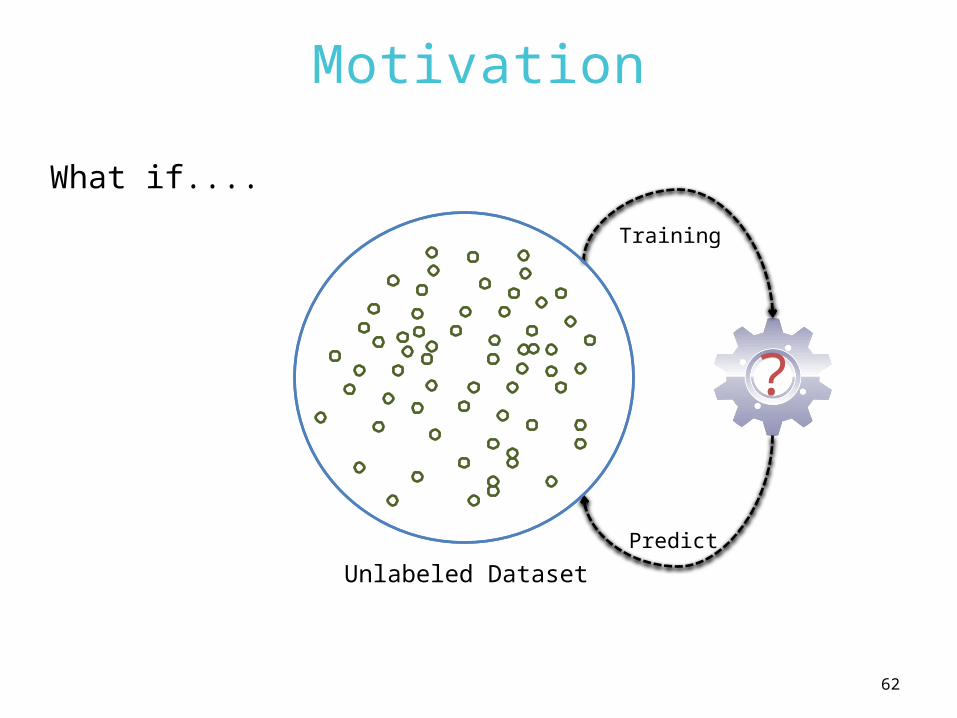
Motivation
Training
Predict
Unlabeled Dataset
What if....
?
63
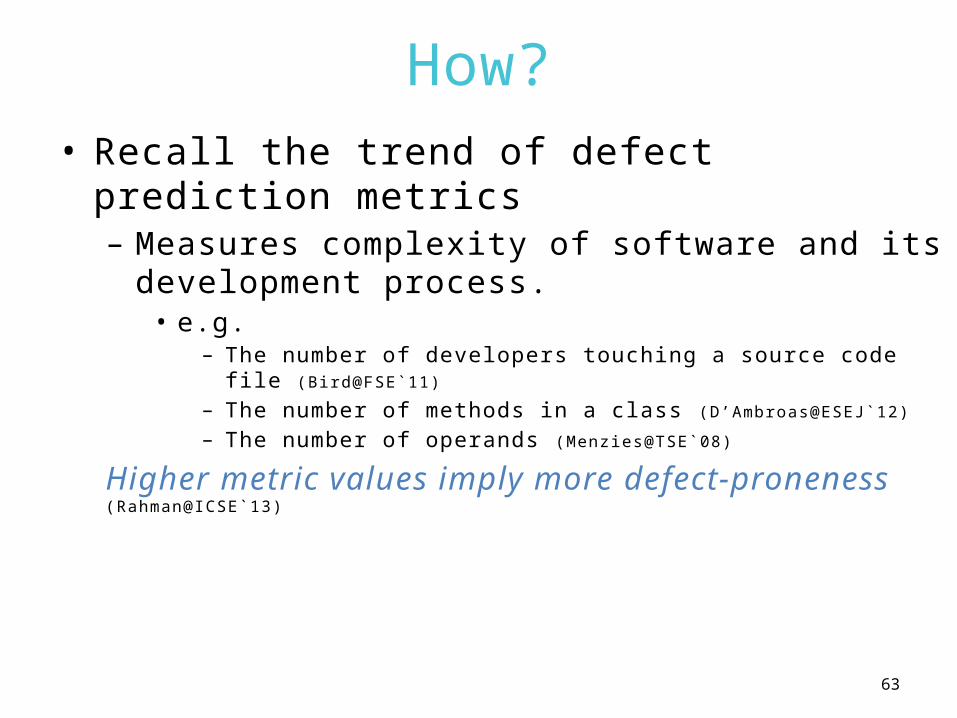
How?• Recall the trend of defect prediction
metrics– Measures complexity of software and its
development process.• e.g.
– The number of developers touching a source code fi le (Bird@FSE`11)
– The number of methods in a class (D’Ambroas@ESEJ`12)
– The number of operands (Menzies@TSE`08)
Higher metric values imply more defect-proneness (Rahman@ICSE`13)
64
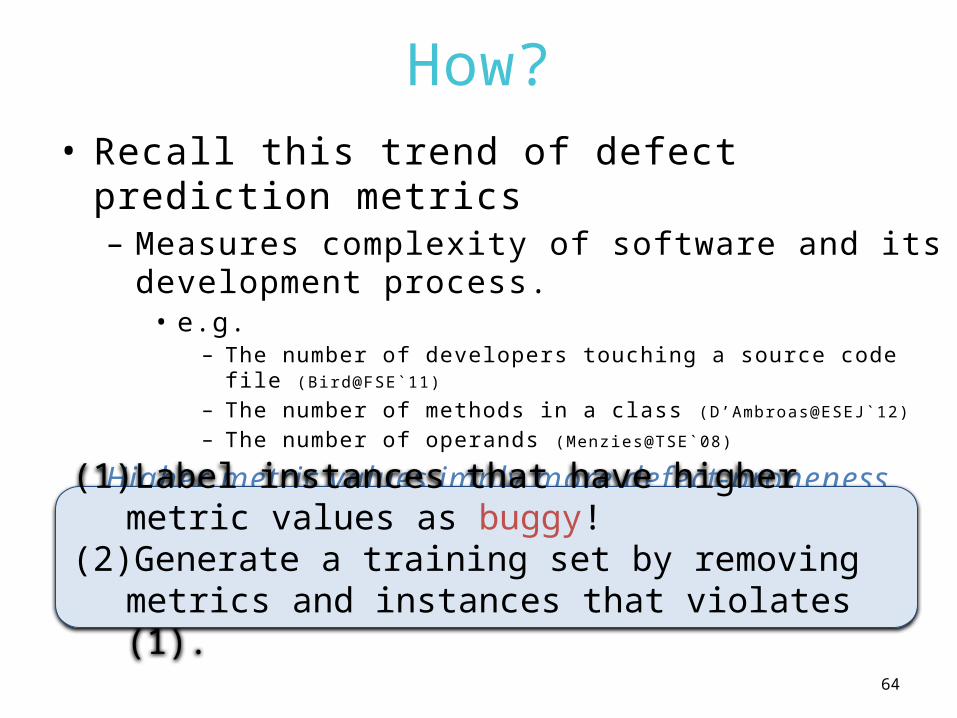
How?• Recall this trend of defect prediction
metrics– Measures complexity of software and its
development process.• e.g.
– The number of developers touching a source code fi le (Bird@FSE`11)
– The number of methods in a class (D’Ambroas@ESEJ`12)
– The number of operands (Menzies@TSE`08)
Higher metric values imply more defect-proneness (Rahman@ICSE`13)
(1)Label instances that have higher metric values as buggy!
(2)Generate a training set by removing metrics and instances that violates (1).

65
CLAMI Approach Overview
UnlabeledDataset
(1) Clustering
(2) LAbeling
(3) Metric Selection
(4) Instance Selection
(5) Metric Selection
CLAMIModel
Build
Predict
Training dataset
Test dataset
66
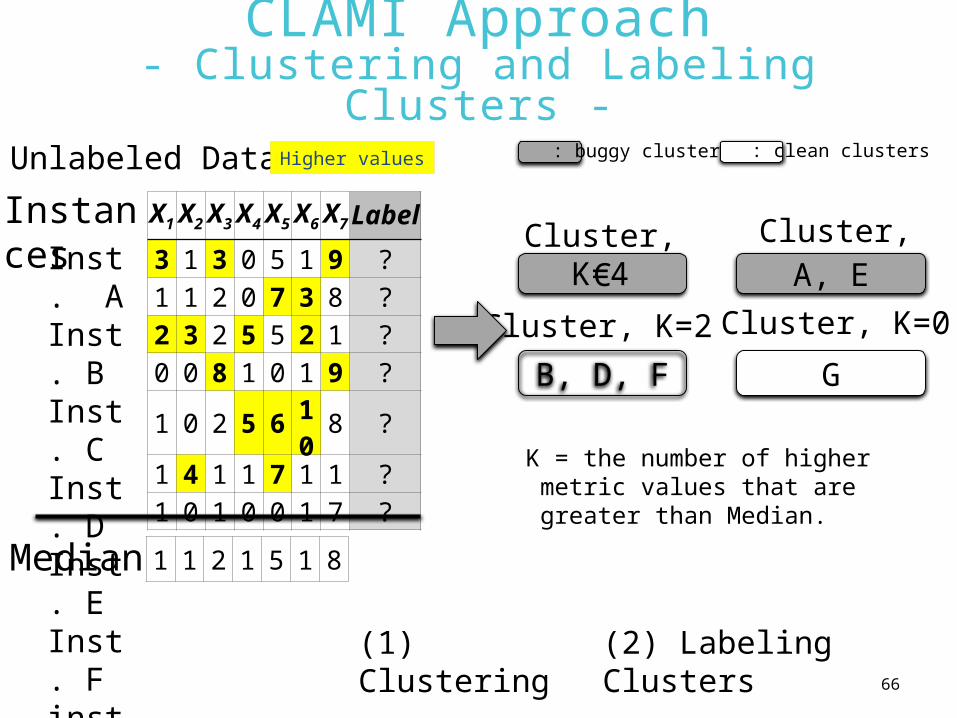
CLAMI Approach- Clustering and Labeling Clusters -
Cluster, K=3
Unlabeled Dataset
X1 X2 X3 X4 X5 X6 X7 Label
3 1 3 0 5 1 9 ?1 1 2 0 7 3 8 ?2 3 2 5 5 2 1 ?0 0 8 1 0 1 9 ?1 0 2 5 6 10 8 ?1 4 1 1 7 1 1 ?1 0 1 0 0 1 7 ?
1 1 2 1 5 1 8Median
Inst. AInst. BInst. CInst. DInst. EInst. Finst. G
Instances
K = the number of higher metric values that are greater than
Median.
CCluster, K=4
A, E
B, D, F
Cluster, K=2
G
Cluster, K=0
(1) Clustering
(2) Labeling Clusters
Higher values : buggy clusters : clean clusters
67
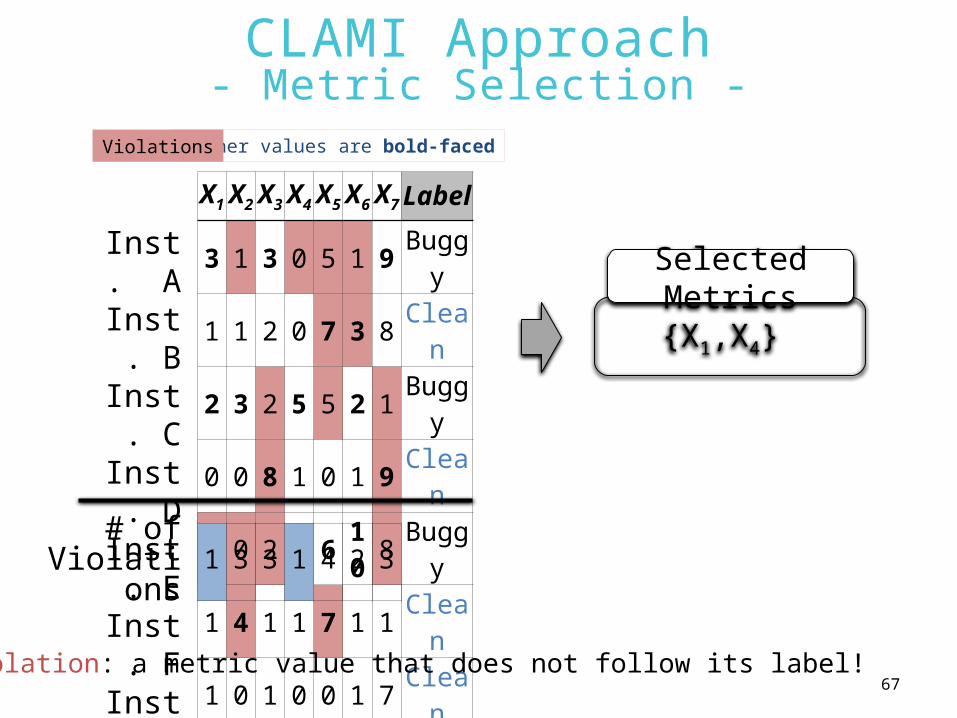
CLAMI Approach- Metric Selection -
{X1,X4}
X1 X2 X3 X4 X5 X6 X7 Label
3 1 3 0 5 1 9 Buggy1 1 2 0 7 3 8 Clean2 3 2 5 5 2 1 Buggy0 0 8 1 0 1 9 Clean1 0 2 5 6 10 8 Buggy1 4 1 1 7 1 1 Clean1 0 1 0 0 1 7 Clean
Inst. A
Inst. B
Inst. C
Inst. D
Inst. E
Inst. F
Inst. G
1 3 3 1 4 2 3# of
Violations
Selected Metrics
Violation: a metric value that does not follow its label!
Higher values are bold-facedViolations
68
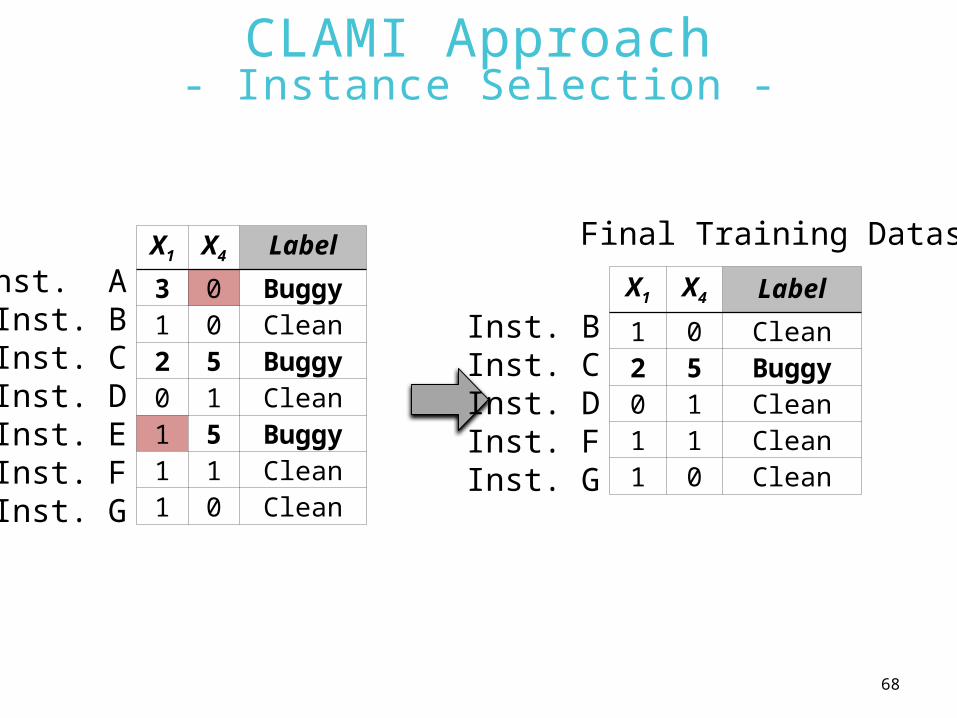
CLAMI Approach- Instance Selection -
X1 X4 Label
3 0 Buggy1 0 Clean2 5 Buggy0 1 Clean1 5 Buggy1 1 Clean1 0 Clean
Inst. AInst. BInst. CInst. DInst. EInst. FInst. G
X1 X4 Label
1 0 Clean2 5 Buggy0 1 Clean1 1 Clean1 0 Clean
Inst. BInst. CInst. DInst. FInst. G
Final Training Dataset
69
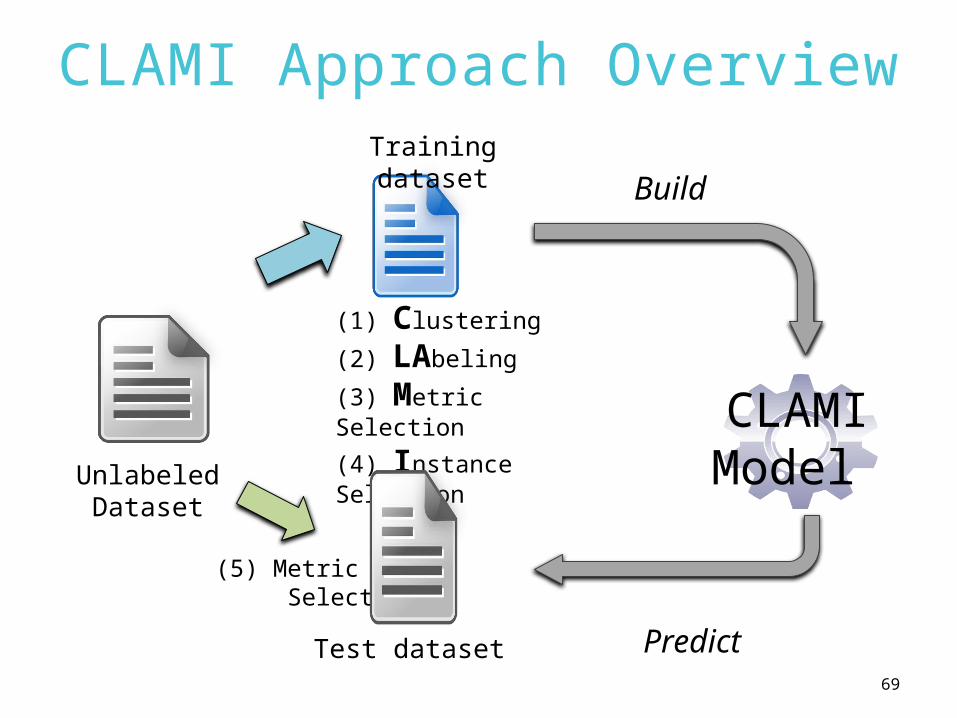
CLAMI Approach Overview
UnlabeledDataset
(1) Clustering
(2) LAbeling
(3) Metric Selection
(4) Instance Selection
(5) Metric Selection
CLAMIModel
Build
Predict
Training dataset
Test dataset

EVALUATION
70
71
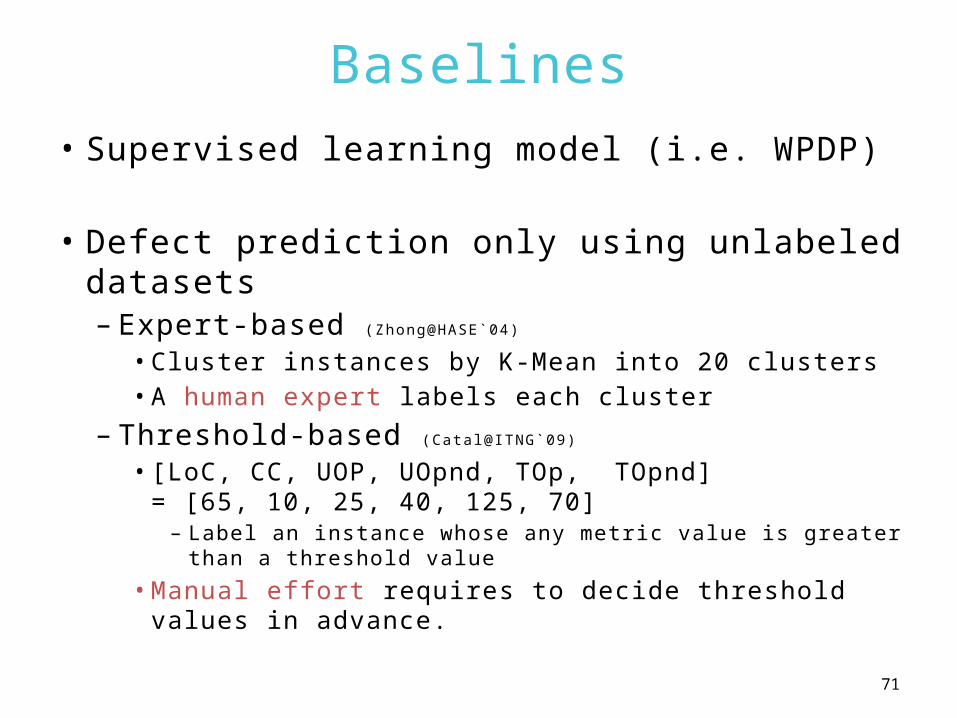
Baselines• Supervised learning model (i.e. WPDP)
• Defect prediction only using unlabeled datasets– Expert-based (Zhong@HASE`04)
• Cluster instances by K-Mean into 20 clusters• A human expert labels each cluster
– Threshold-based (Catal@ITNG`09)
• [LoC, CC, UOP, UOpnd, TOp, TOpnd]= [65, 10, 25, 40, 125, 70]– Label an instance whose any metric value is greater than a
threshold value
• Manual effort requires to decide threshold values in advance.
72
Research Questions (RQs)
• RQ1– CLAMI vs. Supervised learning model?
• RQ2– CLAMI vs. Expert-/threshold-based
approaches? (Zhong@HASE`04, Catal@ITNG`09)
73
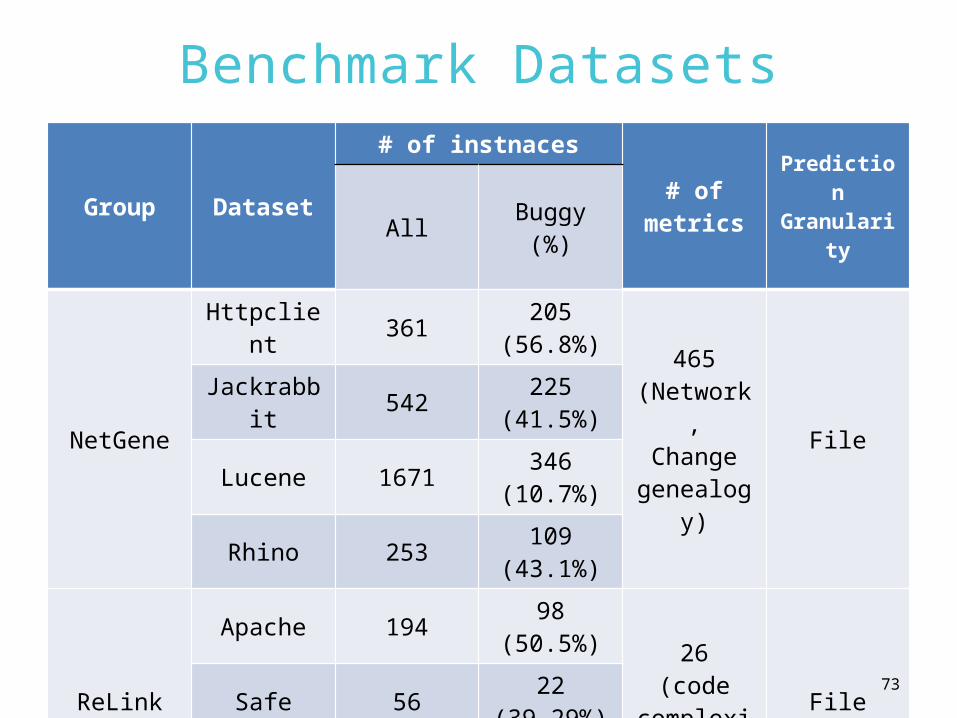
Benchmark Datasets
Group Dataset
# of instnaces# of
metrics
Prediction Granularit
yAll Buggy (%)
NetGene
Httpclient 361 205 (56.8%)
465(Network,Change
genealogy)
FileJackrabbit 542 225
(41.5%)
Lucene 1671 346 (10.7%)
Rhino 253 109 (43.1%)
ReLink
Apache 194 98 (50.5%) 26
(code complexit
y)
FileSafe 56 22 (39.29%)
ZXing 399 118 (29.6%)
74
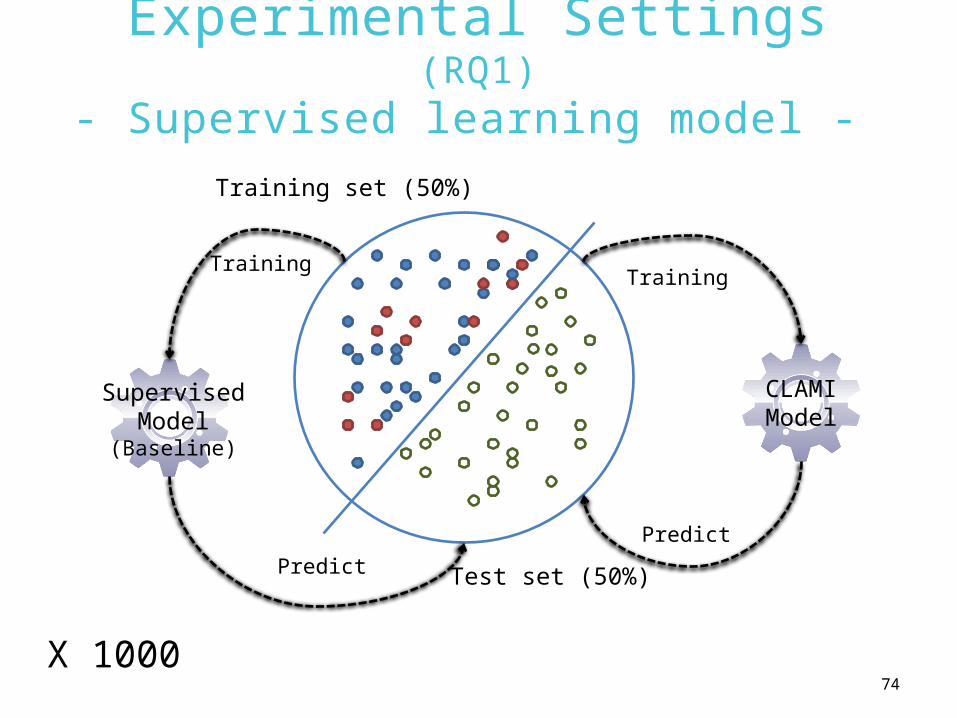
Experimental Settings (RQ1)- Supervised learning model -
Test set (50%)
Training set (50%)
SupervisedModel
(Baseline)
Training
Predict
X 1000
CLAMIModel
Training
Predict
75
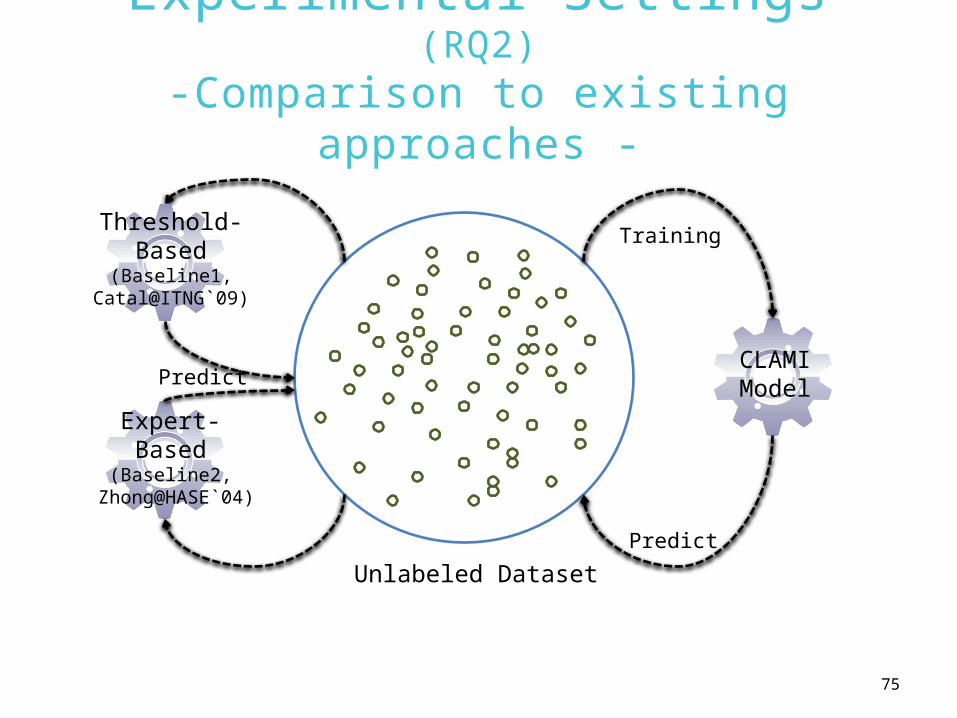
Experimental Settings (RQ2)-Comparison to existing approaches
-
Unlabeled Dataset
CLAMIModelPredict
Training
Predict
Threshold-Based
(Baseline1,Catal@ITNG`09)
Expert-Based
(Baseline2, Zhong@HASE`04)
76
Measure
• F-measure• AUC

RESULT
77
78
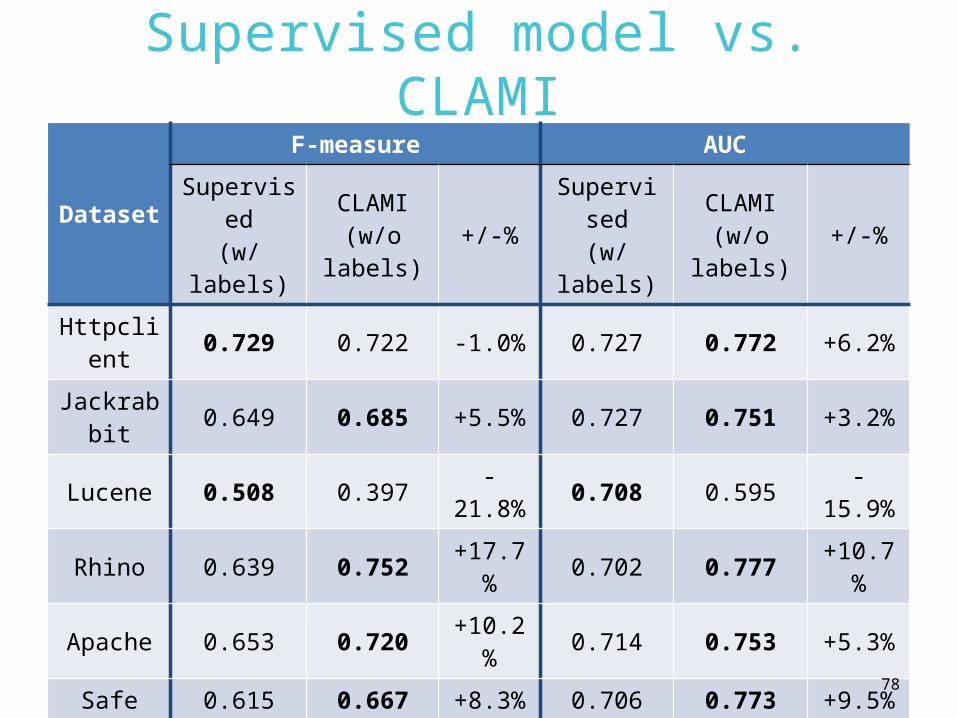
Supervised model vs. CLAMI
Dataset
F-measure AUC
Supervised(w/
labels)
CLAMI(w/o
labels)+/-%
Supervised(w/
labels)
CLAMI(w/o
labels)+/-%
Httpclient 0.729 0.722 -1.0% 0.727 0.772 +6.2%
Jackrabbit 0.649 0.685 +5.5% 0.727 0.751 +3.2%
Lucene 0.508 0.397 -21.8% 0.708 0.595 -
15.9%
Rhino 0.639 0.752 +17.7% 0.702 0.777 +10.7
%
Apache 0.653 0.720 +10.2% 0.714 0.753 +5.3%
Safe 0.615 0.667 +8.3% 0.706 0.773 +9.5%
ZXing 0.333 0.497 +49.0% 0.605 0.644 +6.4%
Median 0.639 0.685 +7.2% 0.707 0.753 +6.3%
79
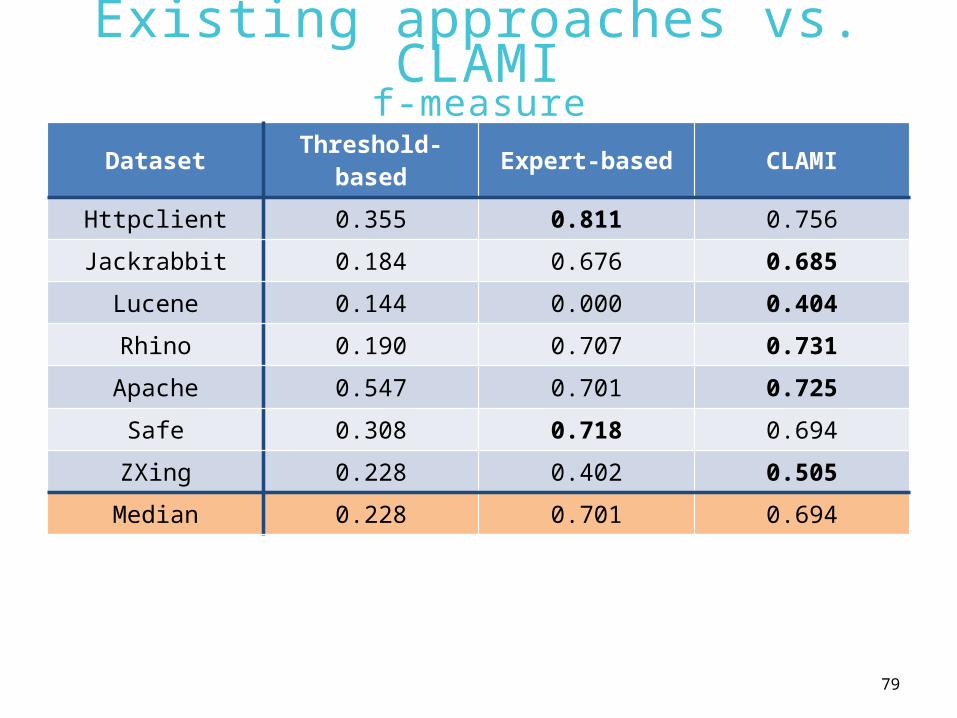
Existing approaches vs. CLAMI
f-measureDataset Threshold-
based Expert-based CLAMI
Httpclient 0.355 0.811 0.756
Jackrabbit 0.184 0.676 0.685
Lucene 0.144 0.000 0.404
Rhino 0.190 0.707 0.731
Apache 0.547 0.701 0.725
Safe 0.308 0.718 0.694
ZXing 0.228 0.402 0.505
Median 0.228 0.701 0.694
80
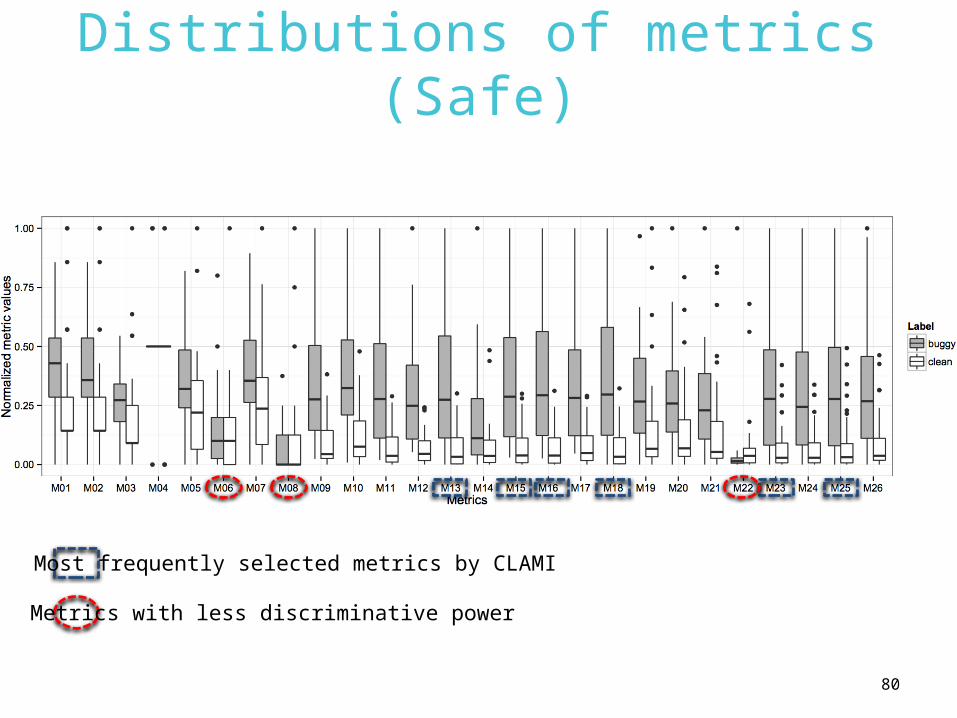
Distributions of metrics (Safe)
Most frequently selected metrics by CLAMI
Metrics with less discriminative power
81
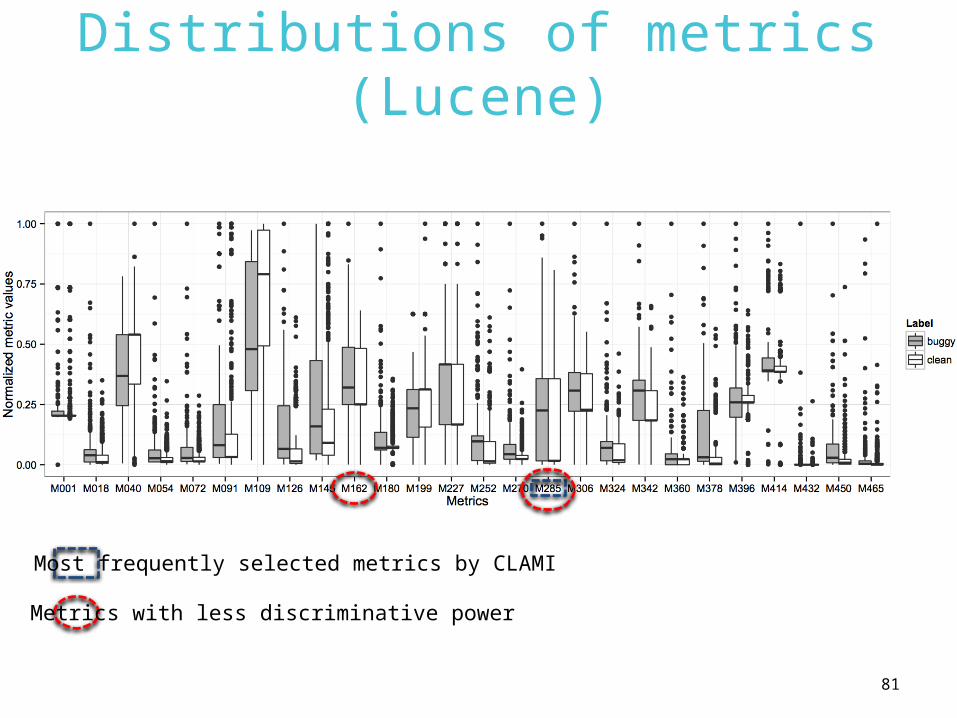
Distributions of metrics (Lucene)
Most frequently selected metrics by CLAMI
Metrics with less discriminative power
82
Software Defect Predictionon Unlabeled Datasets
Sub-problems Proposed Techniques
CPDP comparable to WPDP? Transfer Defect Learning (TCA+)
CPDP across projects with heterogeneous metric sets?
Heterogeneous Defect Prediction (HDP)
DP using only unlabeled datasets
without human effort?CLAMI
83
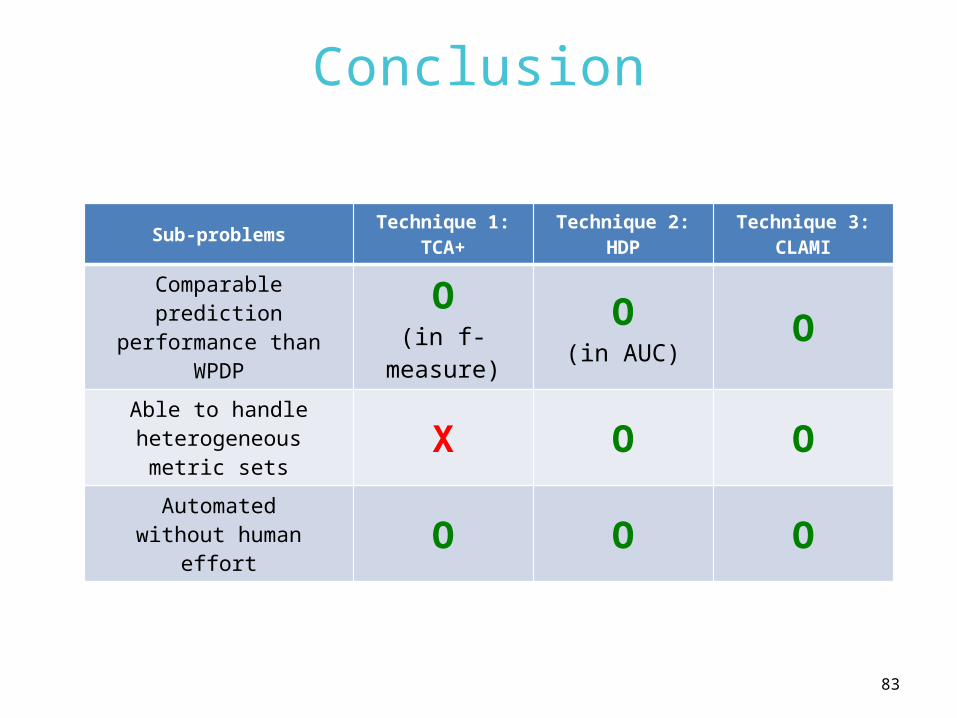
Conclusion
Sub-problemsTechnique 1:
TCA+Technique 2:
HDPTechnique 3:
CLAMI
Comparable prediction performance than
WPDP
O(in f-
measure)
O(in AUC)
O
Able to handle heterogeneous metric
setsX O O
Automatedwithout human effort O O O
84
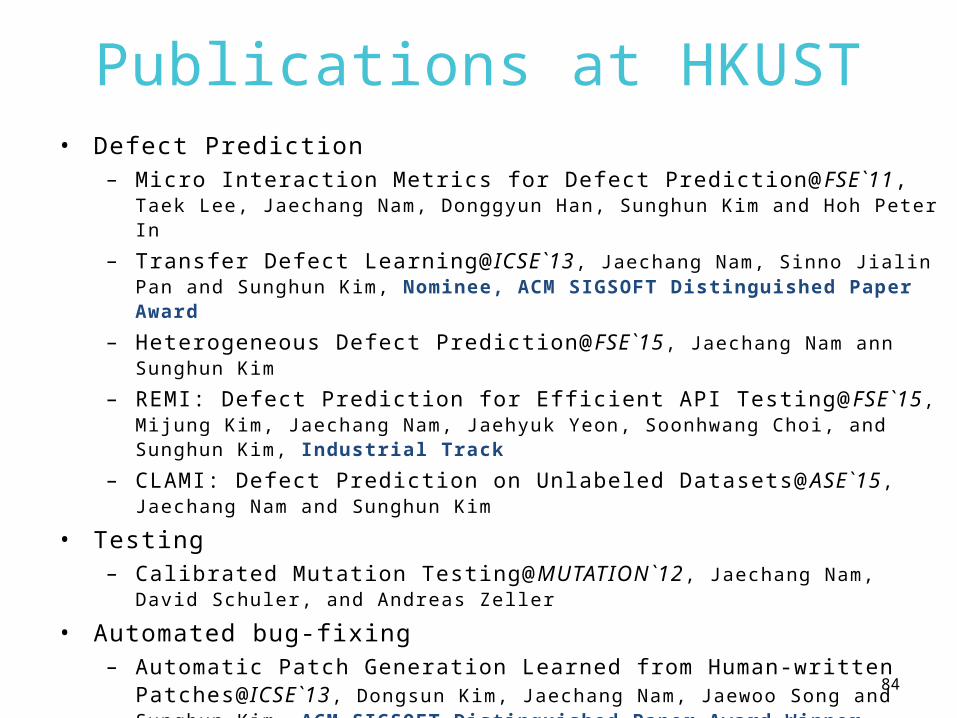
Publications at HKUST• Defect Prediction
– Micro Interaction Metrics for Defect Prediction@FSE`11, Taek Lee, Jaechang Nam, Donggyun Han, Sunghun Kim and Hoh Peter In
– Transfer Defect Learning@ ICSE`13 , Jaechang Nam, Sinno Jialin Pan and Sunghun Kim, Nominee, ACM SIGSOFT Distinguished Paper Award
– Heterogeneous Defect Prediction@FSE`15, Jaechang Nam ann Sunghun Kim
– REMI: Defect Prediction for Effi cient API Testing@FSE`15, Mijung Kim, Jaechang Nam, Jaehyuk Yeon, Soonhwang Choi, and Sunghun Kim, Industrial Track
– CLAMI: Defect Prediction on Unlabeled Datasets@ASE`15 , Jaechang Nam and Sunghun Kim
• Testing– Calibrated Mutation Testing@MUTATION`12 , Jaechang Nam, David
Schuler, and Andreas Zeller
• Automated bug-fixing– Automatic Patch Generation Learned from Human-written
Patches@ICSE`13 , Dongsun Kim, Jaechang Nam, Jaewoo Song and Sunghun Kim, ACM SIGSOFT Distinguished Paper Award Winner
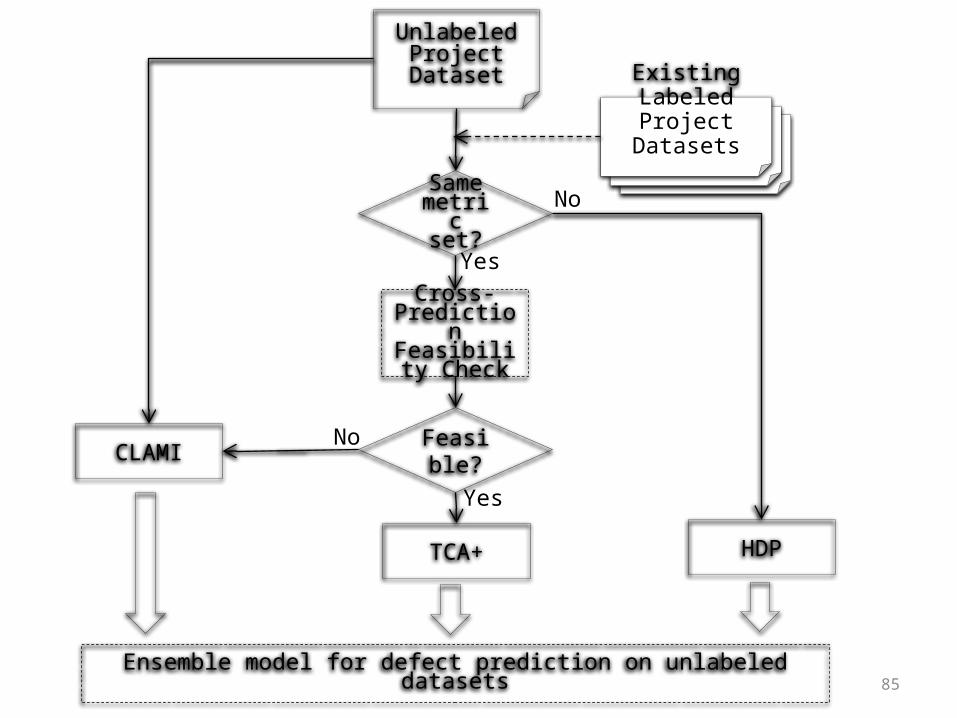
Cross-PredictionFeasibility
Check
CLAMI
NoSame metric set?
TCA+
Feasible?
Yes
No
Yes
HDP
Unlabeled ProjectDataset Existing
LabeledProject
Datasets
Ensemble model for defect prediction on unlabeled datasets85

86
Q&ATHANK YOU!


![SoundNet: Learning Sound Representations from Unlabeled …vondrick/soundnet.pdfthe emergence of massive labeled datasets [31, 42, 10] and learned deep representations [17, 33, 10,](https://img.pdfslide.net/doc/110x75/5f17725fcae7a5753e7d38fa/soundnet-learning-sound-representations-from-unlabeled-vondricksoundnetpdf-the.jpg)


![K. Punitha, B. Latha -fuzzy sustava s Naive Bayes ISSN ... · software defect have lesser defective modules than the defect-free datasets [11]. As many of the datasets are found to](https://img.pdfslide.net/doc/110x75/600d690a29249c0e7e48db65/k-punitha-b-latha-fuzzy-sustava-s-naive-bayes-issn-software-defect-have.jpg)