Embed Size (px)
Citation preview

TF Joint Operations ReviewIntroduction
C Neumeyer
2/10/05
Scope and Outline of ReviewSummary of Findings from 2004 RunReview of Joint Force, Pressure and Moment ConceptsImprovements made on Rebuilt CoilOverview of New AnalysisNew Operating Envelope

Committee Members
P Anderson (GA)L Dudek (PPPL) - ChairJ Irby (MIT)B Nelson (ORNL)A Von Halle (PPPL)
Chit forms have been forwarded to off-site members

Scope of Review
Declare targeted operating scenarios/envelope
Provide justification for operating envelope
Describe protection method to enforce operating envelope
Describe commissioning plan

Outline of Review
Introduction (40 min)
Description of New Potting Process (30 min)
Simplified Modeling and Protection (30 minutes)
Commissioning Plan (20 minutes)
Summary (15 minutes)
2+ hours

Results from 2004 Operations• Approximately 2800 pulses were executed with Bt ≤ 4.5kG (January - July)
• Measurements from initial commissioning results were not well understood and did not benchmark well with design basis (January- February)
• Efforts were initiated to develop refined analytic models and tools to promote better understand of behavior and interpretation of measurement data (February)
• Deeper understanding and tool development, along with upward trending of resistance data, led to concern that structural support system was not functioning properly (June)
•Additional measurements were made which confirmed excess motion of flags and excess moment being applied to joint (July)
• Operating level was reduced to Bt ≤ 3.0kG after ~ 2200 shots (July)
• Disassembly revealed defects in potting of flags in boxes, along with pitting on the contact surfaces (August)

Trending Measurements
• Resistance MeasuredAt 5kA At Start of Pulse (SOP) And At Other Times (SOFT, EOFT) During Pulse
•Maximum (MAX) Also Recorded Each Pulse
• Resistance MeasuredAt 5kA At Start of Pulse (SOP) And At Other Times (SOFT, EOFT) During Pulse
•Maximum (MAX) Also Recorded Each Pulse

Typ. Resistance Trends at 5kA Pedestal
Includes all test shots and plasma shots

Typ. Max Resistance During Test Shots
3kG3kG4.5kG4.5kG
Includes test shots only

JxB Forces on Flags and Bundle
Forces noted are maximum possible valuesForces noted are maximum possible values

FrictionFriction
Vertical Loads Taken By Friction and Shear Shoe
Shear ShoeShear Shoe
F_vertical

Moments Shared by Structure and Joint
_copper_copper
_potting_potting
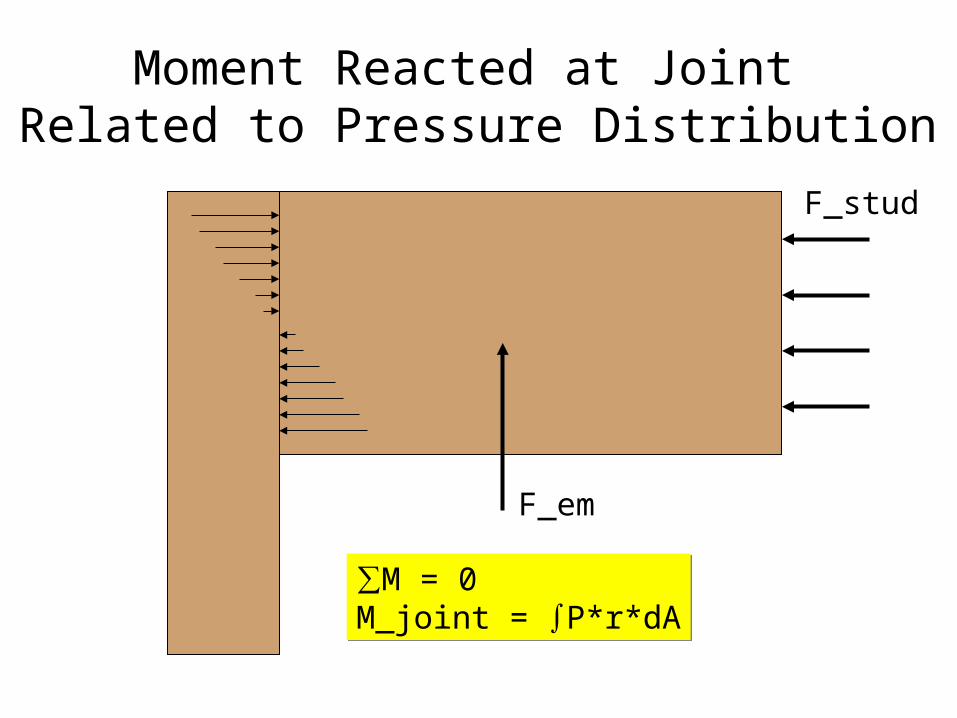
Moment Reacted at Joint Related to Pressure Distribution
∑M = 0M_joint = ∫P*r*dA∑M = 0M_joint = ∫P*r*dA
F_stud
F_em

Reaction of Moment By PottingIs Key Factor in Joint Behavior
Excess moment leads to skewed pressure distribution and…
- shift in current pattern- liftoff during pulse- excess copper stress
Excess moment leads to skewed pressure distribution and…
- shift in current pattern- liftoff during pulse- excess copper stress

In-Plane Contact Pressure Distribution
0
5000
10000
15000
20000
25000
0 1 2 3 4 5
Height Along Flag (inch)
Pressure (psi)
P(Initial)P(Threshold)P(Liftoff)
In-Plane Contact Pressure Distribution
0
5000
10000
15000
20000
25000
0 1 2 3 4 5
Height Along Flag (inch)
Pressure (psi)
P(Initial)P(Threshold)P(Liftoff)
Contact Pressure Distribution is Key Factor
2D Concept of Contact Pressure and “Liftoff”

3D Pressure Distribution at Joint - Initial
Initial Pressure ~ 5ksiInitial Pressure ~ 5ksi
0.0000.375
0.7501.125
1.5001.875
2.2502.625
3.0003.375
3.7504.125
4.5004.875
0.000
0.781
0
2000
4000
6000
4000-6000
2000-4000
0-2000
0.0000.375
0.7501.125
1.5001.875
2.2502.625
3.0003.375
3.7504.125
4.5004.875
0.000
0.781
0
2000
4000
6000
4000-6000
2000-4000
0-2000

3D Pressure Distribution at Joint: In-Plane Only
In-Plane EffectIn-Plane Effect
0.0000.375
0.7501.125
1.5001.875
2.2502.625
3.0003.375
3.7504.125
4.5004.875
0.000
0.781
0
2000
4000
6000
8000
10000
12000
10000-12000
8000-10000
6000-8000
4000-6000
2000-4000
0-2000
0.0000.375
0.7501.125
1.5001.875
2.2502.625
3.0003.375
3.7504.125
4.5004.875
0.000
0.781
0
2000
4000
6000
8000
10000
12000
10000-12000
8000-10000
6000-8000
4000-6000
2000-4000
0-2000

3D Pressure Distribution at Joint: Out-of-Plane Only
Out-of-Plane EffectOut-of-Plane Effect
0.0000.375
0.7501.125
1.5001.875
2.2502.625
3.0003.375
3.7504.125
4.5004.875
0.000
0.781
0
2000
4000
6000
8000
10000
12000
14000
12000-14000
10000-12000
8000-10000
6000-8000
4000-6000
2000-4000
0-2000
0.0000.375
0.7501.125
1.5001.875
2.2502.625
3.0003.375
3.7504.125
4.5004.875
0.000
0.781
0
2000
4000
6000
8000
10000
12000
14000
12000-14000
10000-12000
8000-10000
6000-8000
4000-6000
2000-4000
0-2000

3D Pressure Distribution at Joint: Combined Loading
Combined EffectCombined Effect
0.0000.375
0.7501.125
1.5001.875
2.2502.625
3.0003.375
3.7504.125
4.5004.875
0.000
0.781
020004000600080001000012000140001600018000200002200024000260002800030000
28000-30000
26000-28000
24000-26000
22000-24000
20000-22000
18000-20000
16000-18000
14000-16000
12000-14000
10000-12000
8000-10000
6000-8000
4000-6000
2000-4000
0-2000

Apparent Joint Resistance vs. In-Plane Moment
1
10
100
1000
10000
0 10000 20000 30000 40000 50000
Moment (in-lbf)
Resistance (nOhm)
Apparent Joint Resistance vs. In-Plane Moment
1
10
100
1000
10000
0 10000 20000 30000 40000 50000
Moment (in-lbf)
Resistance (nOhm)
Liftoff
Bes
t Joi
nt
Wor
st J
oint
App
lied
~ 4
0K
Analysis During Last Run Showed That StructureWas Not Reacting the Moment As Intended
Des
ign
~ 11
k

Potting Was Found to be Defective

Liftoff of Joint Led to Pitting Damage
PittingPitting
MidplaneOf NSTXMidplaneOf NSTX
• There was a wide range in degree of pitting damage
• This joint is one of the worst examples
•This is not a new phenomenon

Effect of Liftoff and Pitting
• Based on prior run, we do expect pitting phenomenon to occur with liftoff
• Pitting should occur to a much lesser degree with potting improvements
• We anticipate that this type of phenomenon will stabilize after some erosion takes place, and that current will find alternate pathways in regions not subject to liftoff (zflag >> liftoff length)
• Exact mechanism is not known but two theories have been hypothesized
-microscopic pinching off of current pathways
-macroscopic instability due to high current density

Theories to Explain Pitting• Surface peaks (asperities) at microscopic level become disconnected leading to current pinching and small melt regions
• Small localized regions with high current density swell up as they heat more than surrounding areas, increasing local contact pressure, increasing local current density, and so on, in an unstable fashion
Before Liftoff, low current density
During Liftoff, high current density and
circuit breaking,local melting
High current density, e.g. near holes
Swelling, increased
pressure and conductivity,
These are hypotheses, not proven

Models would Predict Local Yielding on Some Joints, However, No Visible Evidence
Worst case joint IP moment ~ 27kin-lbf (67% of IP moment to joint instead of 29% expected)
Local Pressure > 30ksi assuming 2.7kin-lbf OOP moment
0.0000.500
1.0001.500
2.0002.500
3.0003.500
4.0004.500
5.000
0.000
0.781
0
5000
10000
15000
20000
25000
30000
25000-30000
20000-25000
15000-20000
10000-15000
5000-10000
0-5000
0.0000.500
1.0001.500
2.0002.500
3.0003.500
4.0004.500
5.000
0.000
0.781
0
5000
10000
15000
20000
25000
30000
25000-30000
20000-25000
15000-20000
10000-15000
5000-10000
0-5000

Repair of Contact Surfaces
• Pitted contact surfaces on flags were re-machined
• Pitted surfaces of bundle conductors were manually honed (high spots removed)
• All flags were measured, and the worst case out-of flatness measurement on the flag surfaces after machining was 1.1 mil
• Two of the bundle contact surfaces were measured for flatness down the center and were within 2 mils
• This slightly exceeds original drawing spec of 1 mil
• Pressure sensitive paper was used to assess all joint fit-ups after re-work

Condition of Repaired Surfaces
Corner defectdue to original out-of-flatness
and/or manual re-working
Corner defectdue to original out-of-flatness
and/or manual re-working
Areas eroded byPitting, then
reworked
Areas eroded byPitting, then
reworked
MidplaneMidplane
Area missing aroundinsert
Area missing aroundinsert
No obvious indication of deformation at cornersNo obvious indication of deformation at corners

Effect of Surface Irregularities
• We anticipate that contact regions lost to surface irregularities are tolerable since current will find alternate pathways in regions further up the flag
• We anticipate that pitting will stabilize because current will eventually avoid eroded areas and find alternate pathways in regions further up the flag
• Structural integrity of joint is not significantly effected by surface irregularities
• Area lost around inserts is probably most critical, will cause higher local temperatures than predicted in analysis
• Analysis of joints with missing contact area has not been performed

Flag Stud and Insert Stresses
•Although more moment was transmitted to joints than intended, axial loads on flag studs and inserts did not exceed design value
• Moment induced load on flag and stud in parallel (~ equal strain) reduces compression on flag and increases tension on stud
• Most of load reaction comes from flag due to lower elasticity of flag vs. stud/belleville washer stack
• Design basis (NASTRAN) ∆F ~ 200lbf over 5klbf preload
• Fatigue (design and test to 100kcycles) based on ∆F = 1klbf
• NASTRAN (run 64N) for no-potting case at 4.5kG is ∆F = 850lbf

Potting ImprovementsExtensive development program was conducted to optimize potting process
- improved vacuum seals- improved electrical insulation- different resin (long pot life)- improved process- all potted flags will be tested for mechanical properties

Hub Disk ImprovementsHigh friction coating developed to enhance friction shear interface between hub disks and flag boxes
- diamond grit coating - full scale mock-ups tested at PPPL- COF > 0.5 (~ 2x base SS COF)- design review held on 10/27/04

New Analysis - Structural• NASTRAN (I Zatz)
increased mesh density at joint included additional length of flex link in force calculation incorporated revised PF1a coil in force calculation

New Analysis - Structural

New Analysis - Structural• No significant differences from findings reported at August ‘04 FDR
• More cases run and more data extracted
• Developed influence matrix for in-plane and out-of-plane moments at joint
RUN CASE OUTER FLAG IN-PLANE MOMENT (in-lbs)
OUTER FLAG O-O-P MOMENT (in-lbs)
4.5 kG – SOFT – No PF – Run 47NA 11490 -
4.5 kG – SOFT – 100% PF – Run 70N 10920 2667
4.5 kG – OHSS – 100% PF – Run 71N 10430 2827
4.5 kG – EOFT – 100% = No PF – Run 48N 10340 13
4.5 kG – SOFT – 24 kA OH, only – Run 72N 10810 2542
4.5 kG – SOFT – 5 kA PF3, only – Run 73N 11461 179
4.5 kG – SOFT – 5 kA PF1A, only – Run 74N 11460 33
4.5 kG – SOFT – 10 kA PF2, only – Run 77N 11390 461
4.5 kG – SOFT – 20 kA PF5, only – Run 78N 11360 336
6.0 kG – SOFT – 100% PF – Run 75N 17770 3390
6.0 kG – OHSS/EOFT – 100% PF – Run 76N 10340 3424

New Analysis - Joint Behavior•ANSYS
Developed fine mesh 3d ANSYS model of joint
- Captures nuances of pressure distribution and conductivity near insertsand at corners
- Used to develop “Rosetta Stone” translation data base of apparent resistance measured by voltage probe vs. in-plane and out-of-plane moments at joint

New Analysis - Joint Behavior• MATLAB
Developing tools for “data mining” of MDS+ voltage probe measurements so actual in-plane and out-of-plane moments at joint can be extracted from voltage data and performance of structure can be assessed.
Apparent Joint Resistance vs. In-Plane Moment
1
10
100
1000
10000
0 10000 20000 30000 40000 50000
Moment (in-lbf)
Resistance (nOhm)
Apparent Joint Resistance vs. In-Plane Moment
1
10
100
1000
10000
0 10000 20000 30000 40000 50000
Moment (in-lbf)
Resistance (nOhm)

New Analysis - Electrical/Thermal• FEMLAB
Developed 2d and 3d models of joint including transient electrical and thermal analysis with in-plane moments and TF current applied as a function of time

New Analysis - Electrical/Thermal• FEMLAB
Developed 2d and 3d models of joint including transient electrical and thermal analysis with in-plane moments and TF current applied as a function of time

Target Operating Envelope - 4.5kG
• Bt ≤ 4.5kG
- 1.0 second flat top
- full OH (-/+24kA)
- other PF’s…
|I_pf1a| ≤ 15kA|I_pf1b| ≤ 10kA|I_pf2| ≤ 10kA|I_pf3| ≤ 15kA|I_pf5| ≤ 20kA
- test shot waveform timing as indicated
Test Shot Waveforms
-60.0
-40.0
-20.0
0.0
20.0
40.0
60.0
-0.50 0.00 0.50 1.00 1.50
Time (sec)
Current (kA)
IohIpf1aIpf1bIpf2Ipf3Ipf4Ipf5ItfIp/20
Test Shot Waveforms
-60.0
-40.0
-20.0
0.0
20.0
40.0
60.0
-0.50 0.00 0.50 1.00 1.50
Time (sec)
Current (kA)
IohIpf1aIpf1bIpf2Ipf3Ipf4Ipf5ItfIp/20
PF Current Range Consistent with Upcoming Plasma OperationsPF Current Range Consistent with Upcoming Plasma Operations

Target Operating Envelope - 4.5kG Predicted joint performance…
M_ip ~ 11kin-lbfM_oop ~ 2.7kin-lbfminimal lift-off
P_max < 20ksi (excluding local peaks)Box stud friction SF > 2T_max < 150C
TF Joint Loads during Test Shot
-4000
-2000
0
2000
4000
6000
8000
10000
12000
14000
-0.50 0.00 0.50 1.00 1.50
Time (sec)
Moment (in-lbf) and Force (lbf)
MOOP
MIP
TF Joint Loads during Test Shot
-4000
-2000
0
2000
4000
6000
8000
10000
12000
14000
-0.50 0.00 0.50 1.00 1.50
Time (sec)
Moment (in-lbf) and Force (lbf)
MOOP
MIP
0.0000.500
1.0001.500
2.0002.500
3.0003.500
4.0004.500
5.000
0.000
0.781
02000400060008000100001200014000
16000
18000
16000-18000
14000-16000
12000-14000
10000-12000
8000-10000
6000-8000
4000-6000
2000-4000
0-20000.000
0.5001.000
1.5002.000
2.5003.000
3.5004.000
4.5005.000
0.000
0.781
02000400060008000100001200014000
16000
18000
16000-18000
14000-16000
12000-14000
10000-12000
8000-10000
6000-8000
4000-6000
2000-4000
0-2000

Target Operating Envelope - 6.0kG • Bt ≤ 6.0kG
0.5 second flat top
full OH (-/+24kA)
other PF’s…
|I_pf1a| ≤ 15kA|I_pf1b| ≤ 10kA|I_pf2| ≤ 10kA|I_pf3| ≤ 15kA|I_pf5| ≤ 20kA
test shot waveform timing as indicated
Test Shot Waveforms
-60.0
-40.0
-20.0
0.0
20.0
40.0
60.0
80.0
-0.50 0.00 0.50 1.00 1.50
Time (sec)
Current (kA)
Ioh
Ipf1a
Ipf1b
Ipf2
Ipf3
Ipf4
Ipf5
Itf
Ip/20
Test Shot Waveforms
-60.0
-40.0
-20.0
0.0
20.0
40.0
60.0
80.0
-0.50 0.00 0.50 1.00 1.50
Time (sec)
Current (kA)
Ioh
Ipf1a
Ipf1b
Ipf2
Ipf3
Ipf4
Ipf5
Itf
Ip/20
PF Current Range Consistent with Upcoming Plasma OperationsPF Current Range Consistent with Upcoming Plasma Operations

Target Operating Envelope - 6.0kG Predicted joint performance…
M_ip ~ 20kin-lbfM_oop ~ 3.5kin-lbfLiftoff to first bolt
P_max < 30ksi (excluding local peaks)Box stud friction SF > 1.5T_max < 150C
TF Joint Loads during Test Shot
-5000
0
5000
10000
15000
20000
25000
-0.50 0.00 0.50 1.00 1.50
Time (sec)
Moment (in-lbf) and Force (lbf)
MOOP
MIP
TF Joint Loads during Test Shot
-5000
0
5000
10000
15000
20000
25000
-0.50 0.00 0.50 1.00 1.50
Time (sec)
Moment (in-lbf) and Force (lbf)
MOOP
MIP
0.0000.500
1.0001.500
2.0002.500
3.0003.500
4.0004.500
5.000
0.000
0.781
0
5000
10000
15000
20000
25000
30000
25000-30000
20000-25000
15000-20000
10000-15000
5000-10000
0-5000
0.0000.500
1.0001.500
2.0002.500
3.0003.500
4.0004.500
5.000
0.000
0.781
0
5000
10000
15000
20000
25000
30000
25000-30000
20000-25000
15000-20000
10000-15000
5000-10000
0-5000