Embed Size (px)
Citation preview

Presented By
Benjamin Nugent
Thermal & Fluids Analysis Workshop
TFAWS 2019
August 26-30, 2019
NASA Langley Research Center
Hampton, VA
TFAWS Interdisciplinary Paper Session
On-Orbit Xenon Refueling
Loading Times and Transient Analysis
Thomas Tomsik
Benjamin Nugent
Ryan Gilligan
NASA Glenn Research Center

Background
• The Power and Propulsion Element (PPE) of the Lunar
Orbital Platform-Gateway will demonstrate the first on-
orbit refueling of xenon propellant for a solar electric
propulsion system.
• Due to xenon’s non-ideal behavior, loading xenon into a
pressurized tank causes large thermal property changes
and makes optimizing tank parameters difficult.
2

Presentation Overview
• Purpose: Provide summary of transient loading analyses
assuming gas conduction only to assess the effects of
xenon refueling duration for PPE based on the following
parameters:
– Xenon Mass: 2000, 2100 and 2500 kg
– Xenon Tank Pressures: 1000 - 3000 PSIA
– Xenon Tank Diameters: 29” and 46”
– Xenon Flow Rates: Basic 10.8 kg/hr and various other flow rates
– PPE Spacecraft Bus Temperatures: -15, 0 and 20°C
– Residual Xenon Mass in the tank at the start of refueling: 2% and
20%
– Comparison of gas conduction and convection models at
variable gravitational constants
3

Nomenclature
4
c specific heat
cp specific heat at constant pressure
cv specific heat at constant volume
𝐶𝑡 Thermal capacitance
Δ() incremental change
D diameter
E blackbody emissivity (σT4)
ε emissivity
ε* MLI effective insulation emissivity
F view factor
𝑔𝑐 Gravitational constant
h Enthalpy
J radiosity
k Thermal conductivity
L Length of cylinder
m mass
ሶ𝑚 mass flow rate
Q heat transfer rate
ሶ𝑞 rate of energy generation per unit volume
ρ density, reflectivity
r radius
R Thermal resistance
t time
T temperature
u internal energy
V volume
Subscripts
bus spacecraft shell structure
g gas
i inside
w wall
r radiation
t thermal
0 stagnation
∞ outside
Superscripts
p indicates which time step, t=pΔt

Key Assumptions
5
• PPE Spacecraft Bus Temperatures: -15, 0 and 20°C
• Inlet Xenon Temperature: 20°C
• Propellant Utilization Efficiencies (PUE): 98% and 80%
• Constant Tank Diameters: 29” and 46” – Small dimension from previous ARRM analysis
– Large dimension from PPE Commercially Derived Vehicle study
• If gas temperature exceeds 50 ⁰C in the loading model,
mass flow stops and the gas is allowed to cool to a set
lower value (22 ⁰C) before resuming loading– Upper gas temperature limit for flow shutoff results in cycling xenon flow
on/off during refuel.
• Thermal Control System on PPE assumed to radiate
internally generated heat from Xenon tank COPV surface
during refueling

Key Assumptions (cont’d)
6
• Tank volume for 29” and 46” OD tanks scaled to final fill
pressure based on Xenon mass at 40°C ground load
• Radiation heat transfer to spacecraft bus from Xenon
tank(s) based on ARRM configuration
• Constant inlet mass flow rate at constant temperature
(for each case analyzed)
• Initial wall and MLI temperature 30 ⁰C (heater control
range is 20-40 ⁰C)
• Thermal conductivity and specific heat of carbon fiber
and epoxy are constant
• h0,in≈ hin (experience with Xenon ground loading and
lower inlet velocity)
• The analysis is design specific and will need to be
updated once a spacecraft vendor is on board.

Approach
• Discretize Xenon gas, COPV wall, MLI, into single node each
• Perform energy balance on each node to yield a governing equation per node
• Use an explicit, forward marching finite difference method to solve the governing equations for each node
Right: Nodal
network used to
solve transient heat
transfer problem.
7
ṁin,h0in
mPT
Qi
Tw
Qo Tbus
MLI MLI
TMLI
Control volume

Governing Equations: Gas Temp
• NRG balance on Xe in tank: 𝑑
𝑑𝑡𝑚𝑢 = ሶ𝑚𝑖𝑛ℎ0𝑖𝑛 − ሶ𝑄𝑖 (1)
• ሶ𝑄𝑖 =1
𝑅𝑡(𝑇𝑔 − 𝑇𝑤) (2)
• 𝑚 Τ𝑑𝑢𝑑𝑡 = ሶ𝑚 ℎ0𝑖𝑛 − 𝑢 − ሶ𝑄𝑖 but Τ𝑑𝑢
𝑑𝑡 ≈ 𝑐𝑣 Τ𝑑𝑇𝑑𝑡
• 𝑚𝑐𝑣 Τ𝑑𝑇𝑑𝑡 = ሶ𝑚 ℎ0𝑖𝑛 − 𝑢 −
𝟏
𝑹𝒕(𝑇𝑔 − 𝑇𝑤) (3)
• Assumed uniform bulk gas temperature Tg
– Low thermal diffusivity of gas at initial and final conditions indicates
real gas behavior will not be uniform, but short of performing CFD
analysis this simplifying assumption is used in the analysis
– Knudsen # throughout loading was Kn~10−8
– General criterion for continuum heat transfer is Kn < 0.01
8

Governing Equations: Wall temp
• Energy balance on COPV: 𝑑𝑈𝑊
𝑑𝑡= (𝐶𝑡)𝑊
𝑑𝑇𝑊
𝑑𝑡= ሶ𝑄𝑖 − ሶ𝑄𝒓 (4)
• ሶ𝑄𝑟 is radiation from the MLI
• Assume uniform COPV wall temperature
– Biot number approximated throughout analysis using conductivity of
T1000 Carbon Fiber (CF) overwrap for various geometric sections
of the tank (see Inside Heat Transfer Coefficient slides)
– CF used because it is 82% of the total thickness of the COPV
– Highest Biot # throughout loading was for dome ends and was 0.42
– General criterion for lumped capacitance is Bi < 0.1
– Max Biot # for cylindrical section is 0.1 and cylindrical section
accounts for 83% of tank surface area and 75% of the mass, so
uniform temperature assumption is okay
9

Finite Difference Equations
• Let t=pΔt
• Superscript p indicates the value of the variable at the current
time step
• Solving Equations 3 and 4 for the temperatures in the
following time step yields:
𝑇𝑔𝑝+1
=∆𝑡
(𝑚𝑔𝑝+𝑚𝑔
𝑝+1
2) 𝑐𝑣
𝑝
ሶ𝑚 ℎ0,𝑖𝑛𝑝
− 𝑢𝑝 −1
𝑅𝑡𝑇𝑔𝑝− 𝑇𝑤
𝑝+ 𝑇𝑔
𝑝(5)
𝑇𝑤𝑝+1
=∆𝑡
𝐶𝑡,𝑤
1
𝑅𝑡𝑇𝑔𝑝− 𝑇𝑤
𝑝− 𝑄𝑟
𝑃 + 𝑇𝑤𝑝
(6)
10

• Steady state gas conduction with uniform heat generation
for a solid cylinder:
– .
• Steady state gas conduction with uniform heat generation
for a solid sphere:
– .
– .
– .
Steady State Gas Conduction with Uniform Heat Generation
11
𝑇(𝑟) =ሶ𝑞𝑟02
6𝑘1 −
𝑟2
𝑟02 +𝑇𝑤 (7)
*Fundamentals of Heat and Mass
Transfer [1], Appendix C
𝑇(𝑟) =ሶ𝑞𝑟02
4𝑘1 −
𝑟2
𝑟02 +𝑇𝑤 (8)
ሶ𝑞 =𝑄
𝑉(9)
𝑅𝑡 =Δ𝑇
𝑄(10)

• Solving equations 7, 9, and 10, and 8, 9, and 10 for thermal
resistance at r=0 yields:
– .
– .
– .
– .
Steady State Gas Conduction with Uniform Heat Generation
12
𝑅𝑡,𝑐𝑜𝑛𝑑,𝑐𝑦𝑙 =Δ𝑇
𝑄=
𝑟2
4𝑘𝑉=
1
4𝜋𝑘𝐿(11)
𝑅𝑡,𝑐𝑜𝑛𝑑,ℎ𝑒𝑎𝑑 =Δ𝑇
𝑄=
𝑟02
6𝑘𝑉=
1
4𝜋𝑘𝐷0(12)
1
𝑅𝑡,𝑐𝑜𝑛𝑑,𝑡𝑜𝑡𝑎𝑙=
1
𝑅𝑡,𝑐𝑜𝑛𝑑,𝑐𝑦𝑙+
1
𝑅𝑡,𝑐𝑜𝑛𝑑,ℎ𝑒𝑎𝑑(13)
𝑄𝑖 =𝑇𝑔−𝑇𝑤
𝑅𝑡,𝑐𝑜𝑛𝑑,𝑡𝑜𝑡𝑎𝑙(14)

Other Assumptions
• Constant inlet mass flow rate at constant temperature
– Allows for time (and mass) to be marched forward
• Initial wall and MLI temperature 30 ⁰C (heater control range is
20-40 ⁰C) and initial tank pressures of 34 psia, 80 psia, 89
psia, and 107 psia for the 1000 psia case, 1500 psia, 1750
psia case, and 3000 psia case, respectively (corresponds to a
98% propellant utilization efficiency).
• Thermal conductivity and specific heat of carbon fiber and
epoxy are constant
• h0,in≈hin (experience with Xenon ground loading and
lower inlet velocity)
• Constant bus temperature at -15 ⁰C (based on
thermal analysis by John Siamidis for ARRM [4])
13

COPV Tank Diagram & Sizing Equations
• For the four
pressure cases, a
constant Di of 29”
and 46” were used.
14
Ellipsoidal
head
Di LT
Ri
LC
ho
Ro
ho
=
tc
2
th
hi
hCTc
ii
ih
CiC
oTC
coi
hoi
oo
VVV
hh
DV
LDV
hLL
tDD
thh
Rh
342
4
2
2
2
2
2

ALL Red surfaces = 0.78
ALL Blue surfaces = 0.024
15
• Note that the model is not considering heat transfer from the bus exterior surface to
space so the important emissivity is that of the inner surface which is 0.024
Spacecraft Emissivity Information [3]
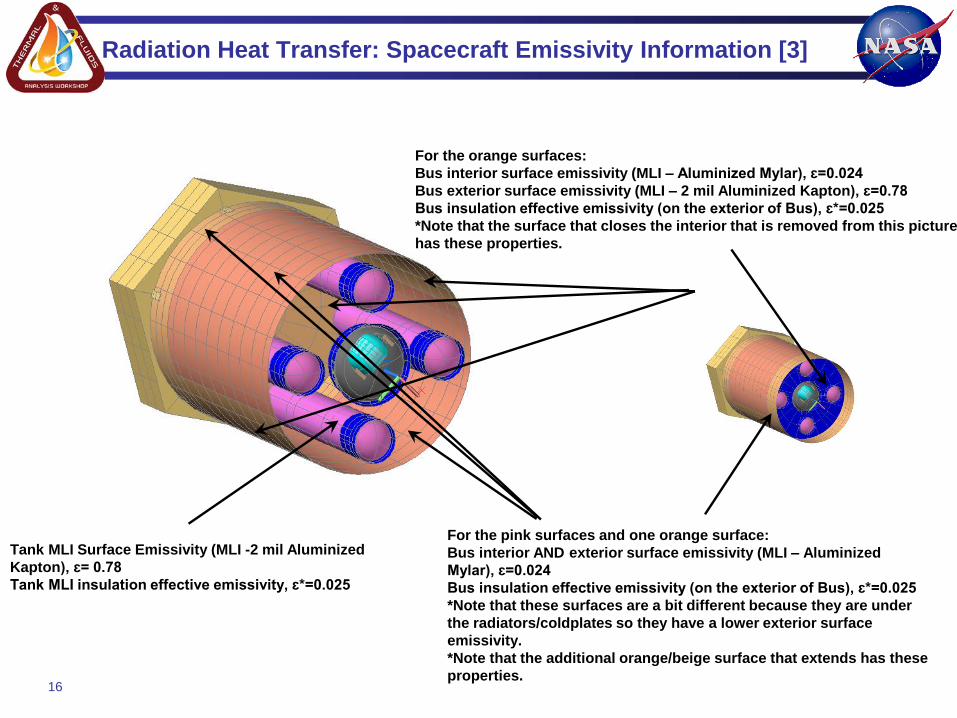
Radiation Heat Transfer: Spacecraft Emissivity Information [3]
16
For the orange surfaces:
Bus interior surface emissivity (MLI – Aluminized Mylar), ɛ=0.024
Bus exterior surface emissivity (MLI – 2 mil Aluminized Kapton), ɛ=0.78
Bus insulation effective emissivity (on the exterior of Bus), ɛ*=0.025
*Note that the surface that closes the interior that is removed from this picture
has these properties.
Tank MLI Surface Emissivity (MLI -2 mil Aluminized
Kapton), ɛ= 0.78
Tank MLI insulation effective emissivity, ɛ*=0.025
For the pink surfaces and one orange surface:
Bus interior AND exterior surface emissivity (MLI – Aluminized
Mylar), ɛ=0.024
Bus insulation effective emissivity (on the exterior of Bus), ɛ*=0.025
*Note that these surfaces are a bit different because they are under
the radiators/coldplates so they have a lower exterior surface
emissivity.
*Note that the additional orange/beige surface that extends has these
properties.

Radiation Heat Transfer-Thermal Circuit
Definition of Terms• E: blackbody emissivity (σT4)
• J: radiosity (E+ρG)
• where ρ is reflectivity & G is irradiation
• F: view factor
• ε*: MLI blanket effective insulation
emissivity =0.024
• εMLI: tank MLI Surface Emissivity (MLI -
2 mil Aluminized Kapton), ɛ= 0.78
• εbus: bus interior surface emissivity (MLI
– Aluminized Mylar), ɛ=0.024
• Qr: radiative heat rejected from Xe tank
wall to spacecraft bus
17

• Need to consider 3 surfaces: COPV, outer layer of
MLI, and inside of spacecraft bus
• Using the Thermal circuit to calculate the heat transfer:
𝑄𝒓 =𝜎(𝑇𝑐𝑜𝑝𝑣
4 −𝑇𝑏𝑢𝑠4 )
(1
𝜀∗𝐴𝑐𝑜𝑝𝑣+
1−𝜀𝑀𝐿𝐼𝜀𝑀𝐿𝐼𝐴𝐶𝑂𝑃𝑉
+1
𝐴𝑐𝑜𝑝𝑣𝐹𝑐𝑜𝑝𝑣−𝑏𝑢𝑠+
1−𝜀𝑏𝑢𝑠𝜀𝑏𝑢𝑠𝐴𝑏𝑢𝑠
)
• Note still neglecting radiation exchange from other
tanks and interior spacecraft structure
• Majority of heat transfer should
be to spacecraft bus
– If tanks are loaded simultaneously
can assume they are at the same
temperature so net heat transfer
between tanks equals zero
18
External Radiation Heat Transfer Continued

View Factor
• Equation for view factor for parallel cylinders of
different radii [1]:
Where
• s=distance between the edges of the cylinders
• ri is the radius of the xenon tank
• Since the tanks are not different radii
set R=1 one and solve for view factor
between tank 1 and tanks 2, 3, 4
so 𝐹1−5 = 1 − 𝐹1−2 − 𝐹1−3 − 𝐹1−4
19
𝐹𝑖𝑗 =1
2𝜋{𝜋 + [𝐶2 − 𝑅 + 1 2] ൗ
12− 𝐶2 − 𝑅 − 1 2 ൗ1 2 + (𝑅 − 1) cos−1
𝑅
𝐶−
1
𝐶− (𝑅 + 1) cos−1[
𝑅
𝐶+
1
𝐶]}
𝑅 =𝑟𝑗𝑟𝑖
𝐶 = 1 + 𝑅 + 𝑆 𝑆 = ൗ𝑠 𝑟𝑖
1
𝑛
𝐹1−𝑛 = 1
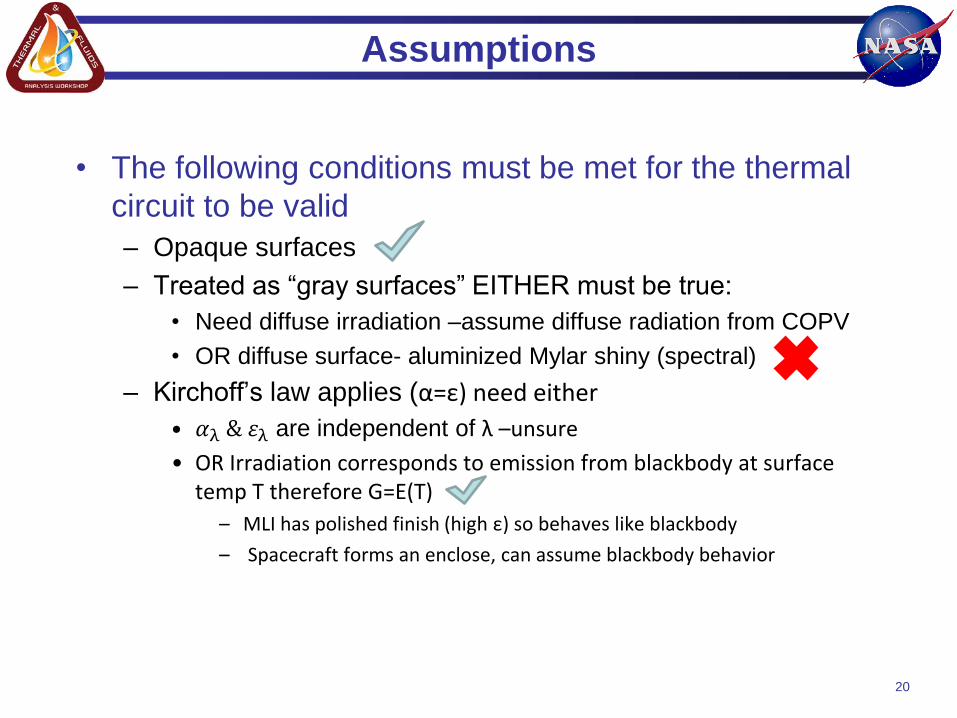
Assumptions
• The following conditions must be met for the thermal
circuit to be valid
– Opaque surfaces
– Treated as “gray surfaces” EITHER must be true:
• Need diffuse irradiation –assume diffuse radiation from COPV
• OR diffuse surface- aluminized Mylar shiny (spectral)
– Kirchoff’s law applies (α=ε) need either
• 𝛼λ & 𝜀λ are independent of λ –unsure
• OR Irradiation corresponds to emission from blackbody at surface temp T therefore G=E(T)
– MLI has polished finish (high ε) so behaves like blackbody
– Spacecraft forms an enclose, can assume blackbody behavior
20

Gas Temperature Control Scheme
• If gas temperature exceeds 50 ⁰C in the loading model,
mass flow stops and the gas is allowed to cool to a set
lower value (22 ⁰C) before resuming loading
– Upper gas temperature limit for flow shutoff results in
cycling xenon flow on/off during refuel.
• The flow rate input was varied in an effort to characterize
the time required to fill the two different tanks with 2000
kg and 2500 of Xenon
21

Xenon Tank Parameters
22
Case:
Small (2)
Tank OD
Pressure
(psia)
Diameter
(m)
Volume
(m³)
Total
Length
(m)
Tank
Mass (kg) (1)
Outside
Surface
Area (m²)
Low 1000 0.7366 3.27 7.88 215 18.70
Medium 1500 0.7366 1.36 3.38 100 8.12
Nominal 1750 0.7366 1.21 3.05 92 7.34
High 3000 0.7366 1.00 2.56 80 6.19
(1) Tank mass consists of carbon fiber and aluminum liner.
(2) Tank sizes based on 2000 kg of xenon capacity at 40°C (ground load temperature rating)
(3) Tank mass consists of carbon fiber and aluminum liner.
(4) Tank sizes based on 2500 kg of xenon capacity at 40°C (ground load temperature rating)
Case:
Large (4)
Tank OD
Pressure
(psia)
Diameter
(m)
Volume
(m³)
Total
Length
(m)
Tank
Mass (kg) (3)
Outside
Surface
Area (m²)
Low 1000 1.1684 4.09 4.12 203 15.7
Medium 1500 1.1684 1.69 1.89 113 7.43
Nominal 1750 1.1684 1.52 1.72 106 6.82
High 3000 1.1684 1.26 1.48 96 5.92

PPE On-Orbit Xenon Propellant Refueling
23
Xenon Mass Loaded vs Time -29” tank vs 46” tank
*A 10.8 kg/hr flow rate was selected to correspond with ESA’s 3 g/s design point. [5]
Loading to 2500 kg Xe at 10.8
kg/hr*, 3000 psia, 29” tank (383 hrs)
Loading to 2500 kg Xe at 10.8
kg/hr*, 3000 psia, 46” tank (516 hrs)
29” Diameter Tank 46” Diameter Tank

PPE On-Orbit Xenon Propellant Refueling
24
Temperature of Gas and Wall vs Time -29” tank vs 46” tank
*A 10.8 kg/hr flow rate was selected to correspond with ESA’s 3 g/s design point. [5]
Loading to 2500 kg Xe at 10.8 kg/hr*,
3000 psia, 29” tank (383 hrs)
Loading to 2500 kg Xe at 10.8
kg/hr*, 3000 psia, 46” tank (516 hrs)
29” Diameter Tank 46” Diameter Tank
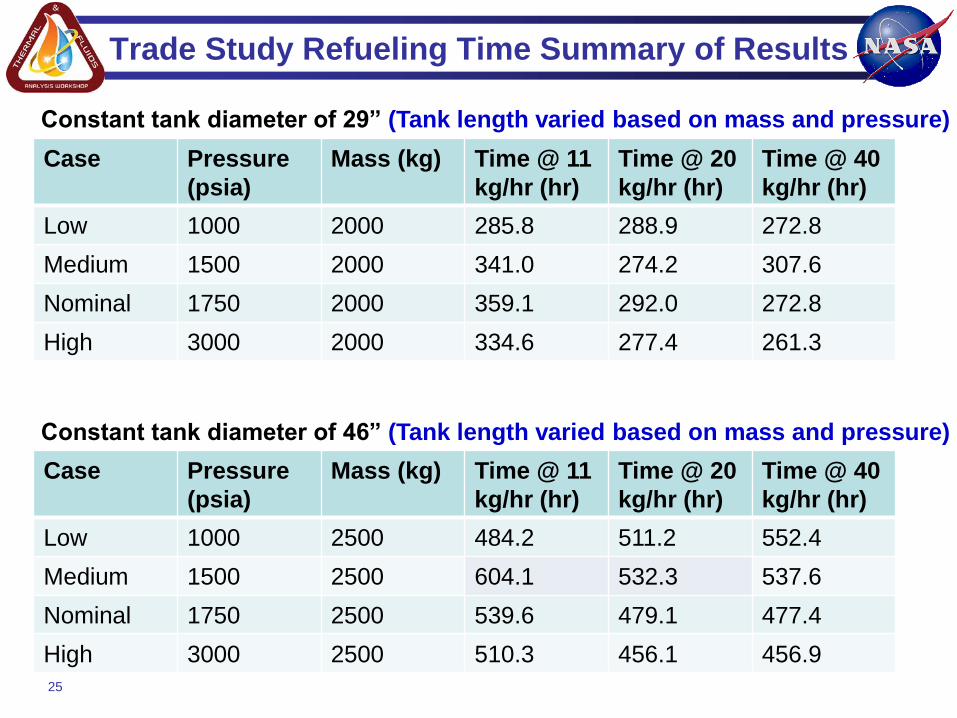
Trade Study Refueling Time Summary of Results
Case Pressure
(psia)
Mass (kg) Time @ 11
kg/hr (hr)
Time @ 20
kg/hr (hr)
Time @ 40
kg/hr (hr)
Low 1000 2000 285.8 288.9 272.8
Medium 1500 2000 341.0 274.2 307.6
Nominal 1750 2000 359.1 292.0 272.8
High 3000 2000 334.6 277.4 261.3
25
Case Pressure
(psia)
Mass (kg) Time @ 11
kg/hr (hr)
Time @ 20
kg/hr (hr)
Time @ 40
kg/hr (hr)
Low 1000 2500 484.2 511.2 552.4
Medium 1500 2500 604.1 532.3 537.6
Nominal 1750 2500 539.6 479.1 477.4
High 3000 2500 510.3 456.1 456.9
Constant tank diameter of 46” (Tank length varied based on mass and pressure)
Constant tank diameter of 29” (Tank length varied based on mass and pressure)

PPE On-Orbit Xenon Propellant Refueling
26
Temperature of Gas and Wall vs Time
Loading to 2000 kg Xe at 10.8
kg/hr*, 1500 psia (346 hrs)
Loading to 2000 kg Xe at 10.8
kg/hr*, 3000 psia (339 hrs)
*A 10.8 kg/hr flow rate was selected to correspond with ESA’s 3 g/s design point. [5]
29” Diameter Tank 29” Diameter Tank
PPE On-Orbit Xenon Propellant Refueling
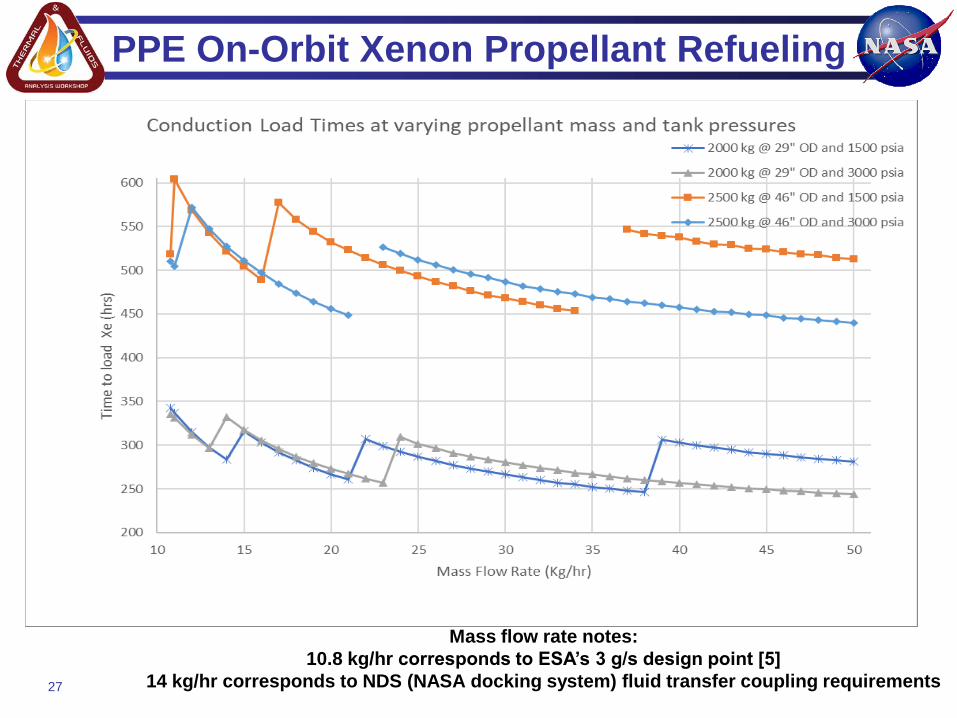
27
Mass flow rate notes:
10.8 kg/hr corresponds to ESA’s 3 g/s design point [5]
14 kg/hr corresponds to NDS (NASA docking system) fluid transfer coupling requirements

Conduction vs Convection Load Times, 29” Tank OD
28

PPE On-Orbit Xenon Propellant Refueling
29
Loading times for 2000 kg, 29” OD tank at different PUE*
values:
𝑃𝑈𝐸 =𝑚𝑖−𝑚𝑓
𝑚𝑖x 100% =
2000−𝑚𝑓
2000x 100% *Initial mass prior to refueling.

Impact of initial xenon tank mass with loading time
• 400 kg of initial xenon mass in 2000 kg capacity, 29”
tank with 3000 psia design pressure
30
Mass flow is never cycled on/off since the shutoff temperature is never exceeded.
Total load time is 148 hours, reducing the time by 56% compared to the 40 kg initial xenon mass.
29” Diameter Tank 29” Diameter Tank
Refueling Time 148
hrs
PPE On-Orbit Xenon Propellant Refueling
31
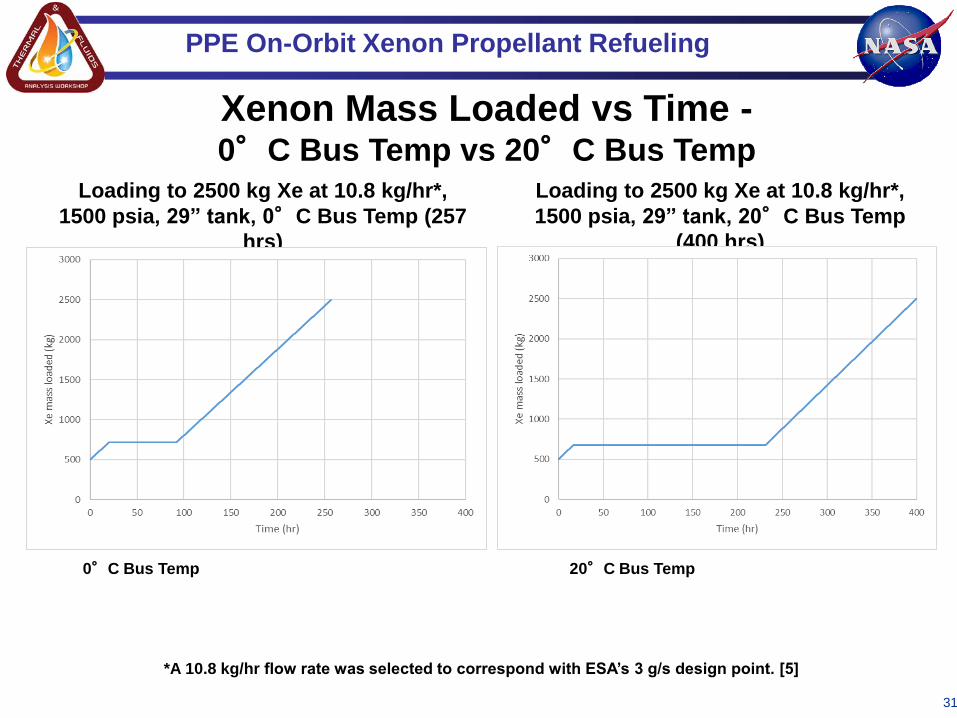
Xenon Mass Loaded vs Time -0°C Bus Temp vs 20°C Bus Temp
*A 10.8 kg/hr flow rate was selected to correspond with ESA’s 3 g/s design point. [5]
Loading to 2500 kg Xe at 10.8 kg/hr*,
1500 psia, 29” tank, 0°C Bus Temp (257
hrs)
Loading to 2500 kg Xe at 10.8 kg/hr*,
1500 psia, 29” tank, 20°C Bus Temp
(400 hrs)
0°C Bus Temp 20°C Bus Temp
Bus Temperature Trade Study
Refueling Time Summary of Results
Case Pressure Mass (kg) PUE Loading Time @
10.8 kg/hr (days)
-15°C Bus Temp 1500 2500 80% 7.7
0°C Bus Temp 1500 2500 80% 10.7
20°C Bus Temp 1500 2500 80% 16.7
32
Constant tank diameter of 29”
Case Pressure Mass (kg) PUE Loading Time @
10.8 kg/hr (days)
-15°C Bus Temp 3000 2500 80% 7.7
0°C Bus Temp 3000 2500 80% 7.7
20°C Bus Temp 3000 2500 80% 7.7
Case Pressure Mass (kg) PUE Loading Time @
10.8 kg/hr (days)
-15°C Bus Temp 3000 2500 98% 14.7
0°C Bus Temp 3000 2500 98% 18.4
20°C Bus Temp 3000 2500 98% 45.3

Propellant Loading Time vs Bus Temperature
• 2500 kg, 29” OD, 10.8 kg/hr, 98% PUE
33
-18 -13 - 8 -3 2 7 12 17 22
oC

Discussion and Conclusions
• For 29” COPV, the analysis predicts a 14.4 day time for loading 2000kg of Xenon at a
design pressure of 1500 psia, a feed rate of 10.8 kg/hr of Xenon and a spacecraft bus
temperature of -15C. With a design pressure of 3000 psia, this loading time would drop to
14.1 days.
– The maximum refueling time per ESA report is a combined 20 days for xenon and
hydrazine refueling. [5]
• Due to temperature spike at the beginning of loading (with very little Xenon in the tank),
the 50oC limit of the temperature control band is quickly reached which results in many
oscillations between “fill” and “cool down” states for the first 6-7 days of loading.
– The duration of the “fill” state increases throughout loading as with each cycle the Xe
in the tank has more thermal capacitance, reducing the temperature rise rate
• The spikes in loading time at specific mass flow rates makes selecting an optimal mass
feed rate less straight forward.
• A conduction only heat transfer model yields higher loading times than a natural
convection only model.
• The initial mass of propellant in the 29” tank has a large effect on the overall loading time.
– For 400 kg of initial xenon mass (20% residual), the model predicts a loading time of
6.2 days and eliminates the cycling of the xenon flow during refuel for the 3,000 psia
tank design pressure case.
34
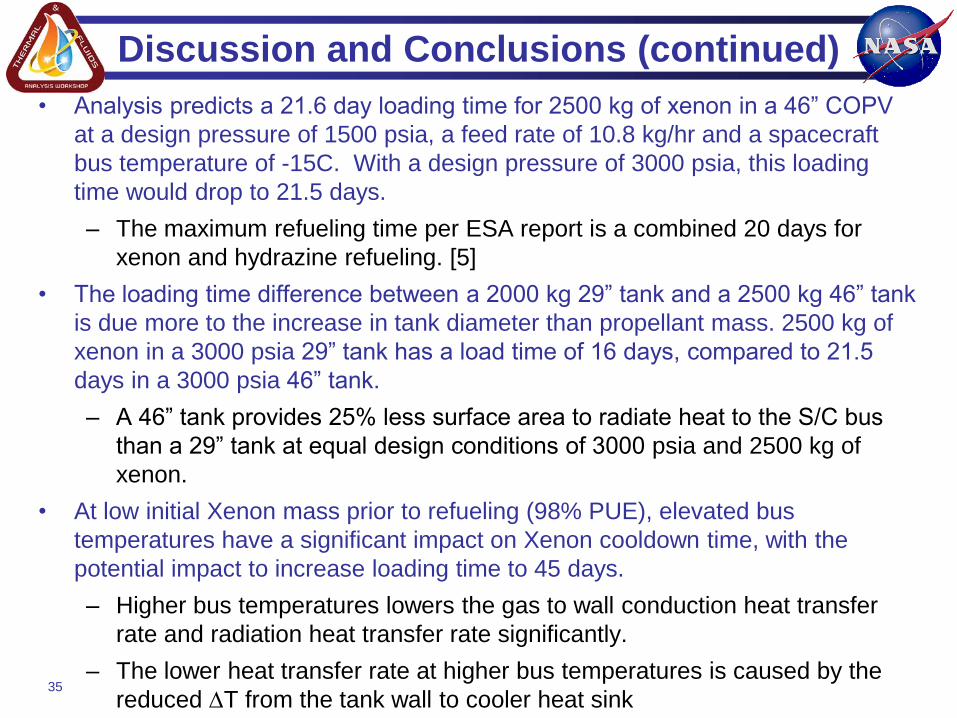
Discussion and Conclusions (continued)
• Analysis predicts a 21.6 day loading time for 2500 kg of xenon in a 46” COPV
at a design pressure of 1500 psia, a feed rate of 10.8 kg/hr and a spacecraft
bus temperature of -15C. With a design pressure of 3000 psia, this loading
time would drop to 21.5 days.
– The maximum refueling time per ESA report is a combined 20 days for
xenon and hydrazine refueling. [5]
• The loading time difference between a 2000 kg 29” tank and a 2500 kg 46” tank
is due more to the increase in tank diameter than propellant mass. 2500 kg of
xenon in a 3000 psia 29” tank has a load time of 16 days, compared to 21.5
days in a 3000 psia 46” tank.
– A 46” tank provides 25% less surface area to radiate heat to the S/C bus
than a 29” tank at equal design conditions of 3000 psia and 2500 kg of
xenon.
• At low initial Xenon mass prior to refueling (98% PUE), elevated bus
temperatures have a significant impact on Xenon cooldown time, with the
potential impact to increase loading time to 45 days.
– Higher bus temperatures lowers the gas to wall conduction heat transfer
rate and radiation heat transfer rate significantly.
– The lower heat transfer rate at higher bus temperatures is caused by the
reduced DT from the tank wall to cooler heat sink35

Discussion and Conclusions (continued)
• For the high pressure design case (3000 psia), constant loading is still
achievable with an 80% propellant utilization efficiency, allowing for a load
time of 7.7 days over a bus temperature ranging from -15 oC to 20 oC.
– The constant loading timelines over the bus temp. range occurs because
the gas never reaches the 50 oC shutoff temperature limit. Then with 500
kg initially in the tank, the Xe flow remains on and the flow rates constant
throughout the loading cycle and the refuel time is simply:
• From these preliminary analysis trade studies for PPE, the following design
and operational parameters were shown to result in reduced Xenon refueling
times:
– Smaller tank diameter for equal Xe capacity
• Same as increased tank L/D ratio
– Larger initial Xenon mass prior to refuel
– Increased design pressure at constant tank diameter
• Secondary effect which is not true for all ṁ conditions
– Lower bus temperature36
𝒕 =𝒎
ሶ𝒎=
𝟐𝟎𝟎𝟎 𝒌𝒈
𝟏𝟎.𝟖 ൗ𝒌𝒈𝒉𝒓 𝟐𝟒 ൗ𝒉𝒓
𝒅𝒂𝒚
= 𝟕. 𝟕 𝒅𝒂𝒚𝒔

Major Observations
• Tank pressure over 1500-3000 psi range does not significantly affect
refuel time
• Amount of xenon remaining in tank at refuel events can significantly
affect refuel time
• Ability to move heat from tank to spacecraft dependent on thermal
resistance between tank and spacecraft bus.
– Xenon tanks need to be insulated but insulation results in
restricting thermal flow path to spacecraft bus during refueling
• These set of analysis with associated assumptions are refueling-
method generic
– PPE Aft Refueling via commercial interface
– ESPRIT to PPE Aft refueling
– Refueling vehicle (at Radial UM port) to ESPRIT
• Applying the assumptions made for this analysis, refueling of xenon
can be accomplished within the 21 day, between-Orbit-maintenance,
limit.
37

References
1. Incropera, Dewitt, Bergman, and Lavine, Fundamentals of Heat
and Mass Transfer. John Wiley & Sons, Inc., 2013.
2. Malroy. “Free Molecular Heat Transfer Programs for Setup and
Dynamic Updating the Conductors in Thermal Desktop” NASA
Johnson Space Center. Internal report.
3. Clayman, Lauren. “Xe Tank and Bus Emissivity_04212016.” Email
attachment. 21 April 2016.
4. Siamidis, John. “SEP ARRM-Option B. Thermal Control System
(TCS) Design & Thermal Analysis for DAC-3, 8-Tank
configuration.” July 1, 2015. NASA internal document. File name:
SEP ARM DAC3 OptionB MegaFlex 07012015.pptx
5. ESA/TAS-F/OHB/ADS-F. “IECST – ESPRIT Refuelling Splinter.”
July 9, 2018. File name: IECST-09072018-ESPRIT-Refueling-
v1.1-1.pptx
6. Bussi G., Colasurdo G. “Heat Transfer Analysis in Pressurizer
Tank Under Microgravity”, SAE Transactions, Vol. 95 Section 7:
Aerospace, pp. 272-277, 1986.38

BACKUP
39

Xenon Properties
40
Xenon
Symbol: Xe
MW: 131.293 lb/lb-mol
Acentric Factor: 0.00363
o Normal Boiling Point: 297.09 oR (-108.1 oC / 165.05 K)
o Triple Point:
o Temperature: 290.5 oR (-111.7 oC)
o Pressure: 11.86 psia
Xenon Critical Properties
State: Supercritical fluid
Critical Temp: 61.9 oF (16.6 oC / 289.75 K)
Critical Pressure: 847.3 psia
Critical Density: 68.85 lb/ft3 (1.103 g/cm3)
o Entropy at Tc, Pc: 0.0648 Btu/lbm-oR
Xenon at Standard Conditions (STP)
o Temp: 77 oF (20 oC)
o Pressure: 14.696 psia
o Density: 0.3427 lb/ft3 (5.49 x 10⁻³ g/cm3)
o Compressibility Factor:
g = Cp/Cv : 1.678
o State: GasSource: NIST Refprop

Xenon Properties vs Hydrogen/Argon - Compressibility
41
Xenon – X-axis is pressure, Y-axis is
property, each line is a different
constant Temperature.
Hydrogen
Argon

Xenon Properties vs Hydrogen/Argon - Cv
42
Xenon – X-axis is pressure, Y-axis is
property, each line is a different
constant Temperature.
Hydrogen
Argon
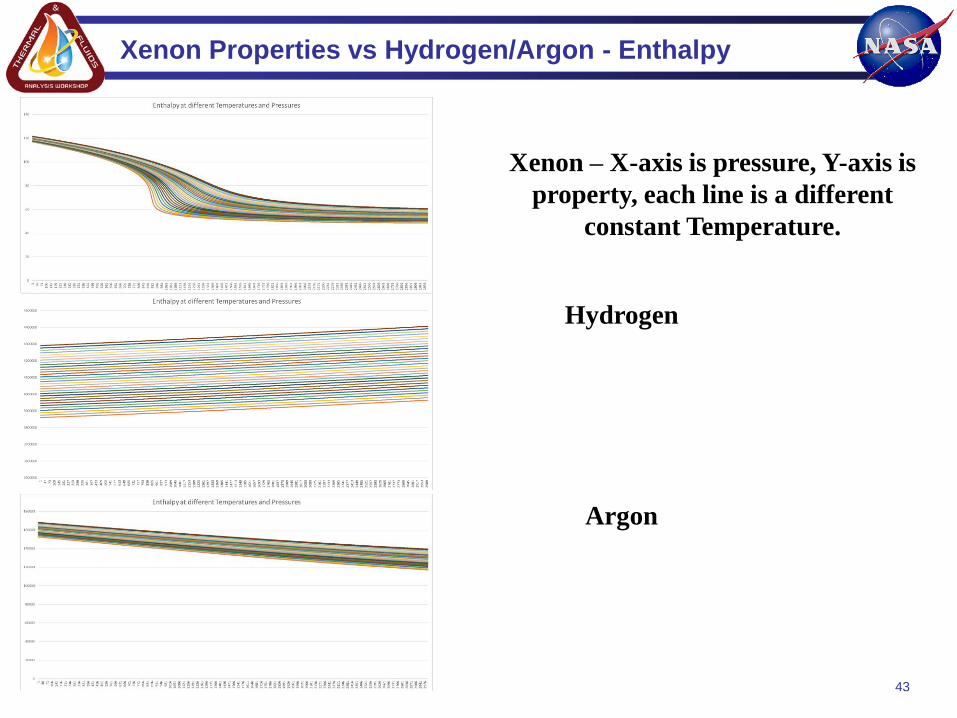
Xenon Properties vs Hydrogen/Argon - Enthalpy
43
Xenon – X-axis is pressure, Y-axis is
property, each line is a different
constant Temperature.
Hydrogen
Argon

Xenon Properties vs Hydrogen/Argon - Density
44
Xenon – X-axis is pressure, Y-axis is
property, each line is a different
constant Temperature.
Hydrogen
Argon

Xenon Properties vs Hydrogen/Argon – Thermal Conductivity
45
Xenon – X-axis is pressure, Y-axis is
property, each line is a different
constant Temperature.
Hydrogen
Argon

PPE On-Orbit Xenon Propellant Refueling
46
Comparing convection load times at varying mass flows
and different gravitational constants

PPE On-Orbit Xenon Propellant Refueling
47
Xenon Mass Loaded vs TimeLoading to 2000 kg Xe at 10.8 kg/hr, 1000 psia (292 hrs) (Top)
Loading to 2000 kg Xe at 10.8 kg/hr, 1750 psia (318 hrs) (Btm) Loading to 2000 kg Xe at 10.8 kg/hr, 3000 psia (339 hrs) (Btm)
Loading to 2000 kg Xe at 10.8 kg/hr, 1500 psia (346 hrs) (Top)

PPE On-Orbit Xenon Propellant Refueling
48
Temperature of Gas and Wall vs Time
Loading to 2000 kg Xe at 10.8 kg/hr, 1000 psia (292 hrs) (Top)
Loading to 2000 kg Xe at 10.8 kg/hr, 1750 psia (318 hrs) (Btm) Loading to 2000 kg Xe at 10.8 kg/hr, 3000 psia (339 hrs) (Btm)
Loading to 2000 kg Xe at 10.8 kg/hr, 1500 psia (346 hrs) (Top)

PPE On-Orbit Xenon Propellant Refueling
49
Tank Pressure vs TimeLoading to 2000 kg Xe at 10.8 kg/hr, 1000 psia (292 hrs) (Top)
Loading to 2000 kg Xe at 10.8 kg/hr, 1750 psia (318 hrs) (Btm) Loading to 2000 kg Xe at 10.8 kg/hr, 3000 psia (339 hrs) (Btm)
Loading to 2000 kg Xe at 10.8 kg/hr, 1500 psia (346 hrs) (Top)

PPE On-Orbit Xenon Propellant Refueling
50
Gas to wall heat transfer rate vs Time
Loading to 2000 kg Xe at 10.8 kg/hr, 1000 psia (292 hrs) (Top)
Loading to 2000 kg Xe at 10.8 kg/hr, 1750 psia (318 hrs) (Btm) Loading to 2000 kg Xe at 10.8 kg/hr, 3000 psia (339 hrs) (Btm)
Loading to 2000 kg Xe at 10.8 kg/hr, 1500 psia (346 hrs) (Top)

PPE On-Orbit Xenon Propellant Refueling
51
Comparing conduction and convection load times at varying mass flows
and different gravitational constants, for ARRM case 1250 kg Xenon

PPE On-Orbit Xenon Propellant Refueling
52
Comparing thermal
conductivity vs
temperature at
different constant
pressures.

PPE On-Orbit Xenon Propellant Refueling
53
Comparing thermal
conductivity vs
pressure at different
constant
temperatures.


![TFAWS Interdisciplinary Paper Session · Radiometer Heat flux gauge ... [F] Time [seconds] iCQ02n01 iCQ09p00 iCQ11n00 iCQ14n00 iCQ17n01 iCQ21p01 iCQ21p00 iCQ21n00 iCQ21n01 iCQ24p00](https://img.pdfslide.net/doc/110x75/5e607b0c63c81137db3459e8/tfaws-interdisciplinary-paper-session-radiometer-heat-flux-gauge-f-time-seconds.jpg)


![TFAWS Interdisciplinary Paper SessionFluid Properties Shell Inlet Fluid Properties Control Volume Fluid Properties Specific Heat (Cp) [kJ/kgK] 1.006 1.089Temperature (T) [ ] 25 117TFAWS](https://img.pdfslide.net/doc/110x75/6004cbe51169367db95d8e20/tfaws-interdisciplinary-paper-session-fluid-properties-shell-inlet-fluid-properties.jpg)