Embed Size (px)
Citation preview
TGS | EARNINGS RELEASE 30 JULY 2015
TGS EARNINGS RELEASE 2nd QUARTER RESULTS
2nd QUARTER HIGHLIGHTS
Consolidated net revenues were USD 140 million, compared to USD 205 million in Q2 2014.
Net late sales totaled USD 82 million, down 40% from USD 137 million in Q2 2014.
Net pre-funding revenues were USD 53 million, down 12% from Q2 2014, funding 45% of the Company’s operational multi-
client investments during Q2 (investments of USD 116 million, up 2% from Q2 2014).
Proprietary revenues were USD 5 million, compared to USD 8 million in Q2 2014.
Operating profit (EBIT) was USD 36 million (26% of net revenues), compared to USD 82 million (40% of net revenues) in Q2
2014.
Cash flow from operations was USD 86 million, compared to USD 66 million in Q2 2014.
Earnings per share (fully diluted) were USD 0.24, down from USD 0.59 in Q2 2014.
6 MONTHS FINANCIAL HIGHLIGHTS
Consolidated net revenues were USD 311 million, down from USD 427 million in 2014.
Net late sales from the multi-client library totaled USD 153 million, down 44% from USD 274 million in 2014.
Net pre-funding revenues were USD 146 million, up 9% from 2014, funding 52% of the Company’s operational multi-client
investments during H1 2015 (investments of USD 279 million, up 15% from 2014).
Proprietary revenues were USD 11 million, compared to USD 19 million in 2014.
Operating profit (EBIT) was USD 73 million (23% of net revenues), compared to USD 176 million (41% of net revenues) in
2014.
Cash flow from operations was USD 346 million compared to USD 287 million in 2014, an increase of 21%.
Earnings per share (fully diluted) were USD 0.52, down from 1.25 in 2014.
“Demand for seismic data continues to be under pressure and the outlook for improvement in the market remains quite uncertain. Despite this uncertainty, TGS continues to be uniquely positioned within our industry with a strong balance sheet combined with a flexible asset-light business model,” TGS’ CEO Robert Hobbs stated. “Our 2015 revenue guidance remains unchanged”.
Multi‐client Seismic86%
Propr.Seismic4%
GPS10%
KEY FIGURES
REVENUE BREAKDOWN
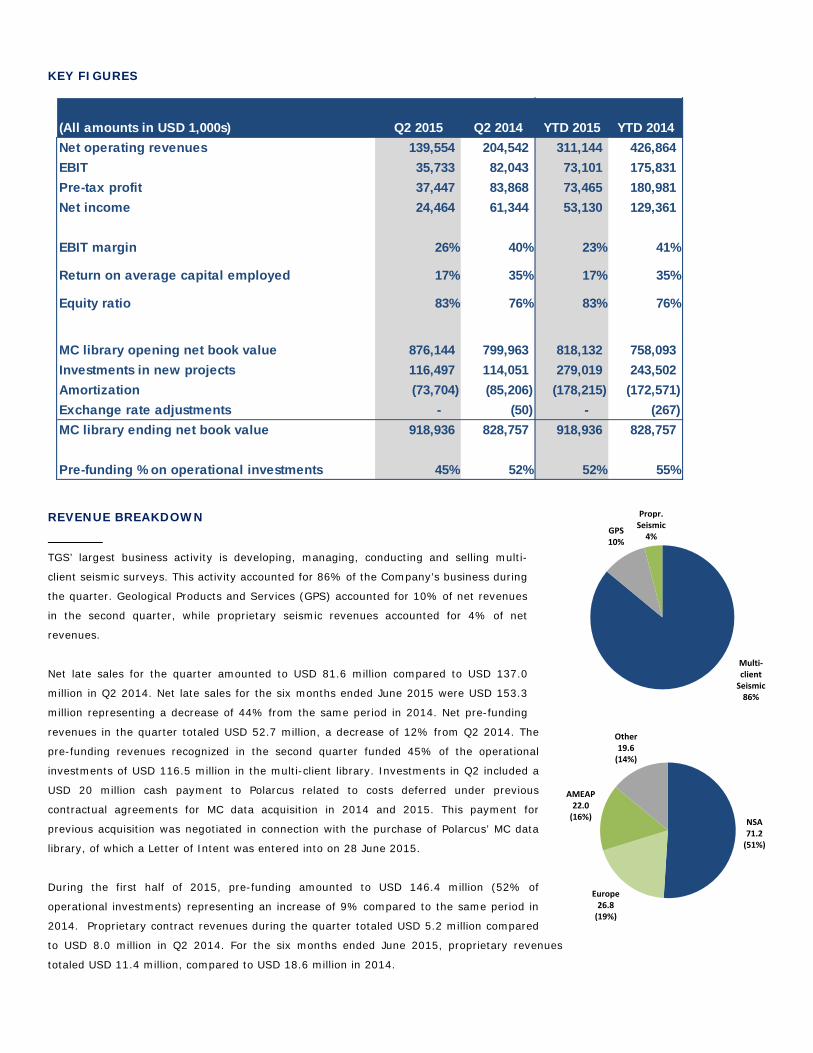
TGS’ largest business activity is developing, managing, conducting and selling multi-
client seismic surveys. This activity accounted for 86% of the Company’s business during
the quarter. Geological Products and Services (GPS) accounted for 10% of net revenues
in the second quarter, while proprietary seismic revenues accounted for 4% of net
revenues.
Net late sales for the quarter amounted to USD 81.6 million compared to USD 137.0
million in Q2 2014. Net late sales for the six months ended June 2015 were USD 153.3
million representing a decrease of 44% from the same period in 2014. Net pre-funding
revenues in the quarter totaled USD 52.7 million, a decrease of 12% from Q2 2014. The
pre-funding revenues recognized in the second quarter funded 45% of the operational
investments of USD 116.5 million in the multi-client library. Investments in Q2 included a
USD 20 million cash payment to Polarcus related to costs deferred under previous
contractual agreements for MC data acquisition in 2014 and 2015. This payment for
previous acquisition was negotiated in connection with the purchase of Polarcus’ MC data
library, of which a Letter of Intent was entered into on 28 June 2015.
During the first half of 2015, pre-funding amounted to USD 146.4 million (52% of
operational investments) representing an increase of 9% compared to the same period in
2014. Proprietary contract revenues during the quarter totaled USD 5.2 million compared
to USD 8.0 million in Q2 2014. For the six months ended June 2015, proprietary revenues
totaled USD 11.4 million, compared to USD 18.6 million in 2014.
(All amounts in USD 1,000s) Q2 2015 Q2 2014 YTD 2015 YTD 2014
Net operating revenues 139,554 204,542 311,144 426,864
EBIT 35,733 82,043 73,101 175,831
Pre-tax profit 37,447 83,868 73,465 180,981
Net income 24,464 61,344 53,130 129,361
EBIT margin 26% 40% 23% 41%
Return on average capital employed 17% 35% 17% 35%
Equity ratio 83% 76% 83% 76%
MC library opening net book value 876,144 799,963 818,132 758,093
Investments in new projects 116,497 114,051 279,019 243,502
Amortization (73,704) (85,206) (178,215) (172,571)
Exchange rate adjustments - (50) - (267)
MC library ending net book value 918,936 828,757 918,936 828,757
Pre-funding % on operational investments 45% 52% 52% 55%
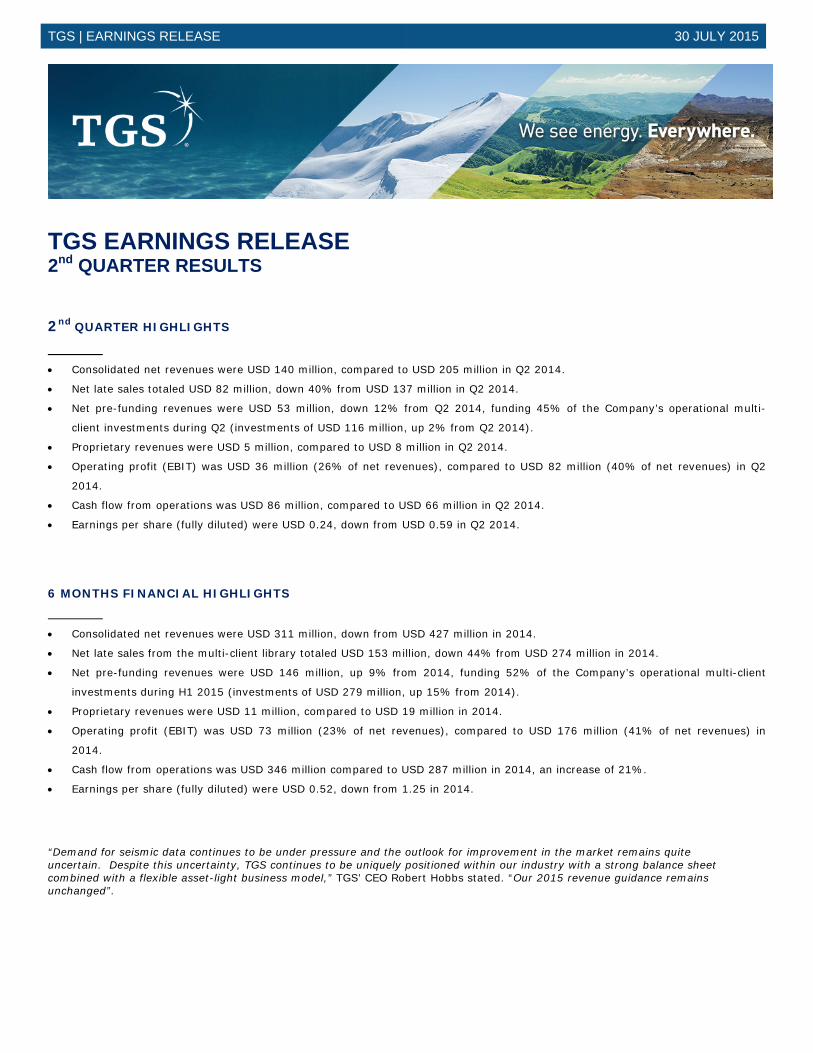
NSA 71.2 (51%)
Europe26.8(19%)
AMEAP22.0(16%)
Other 19.6(14%)
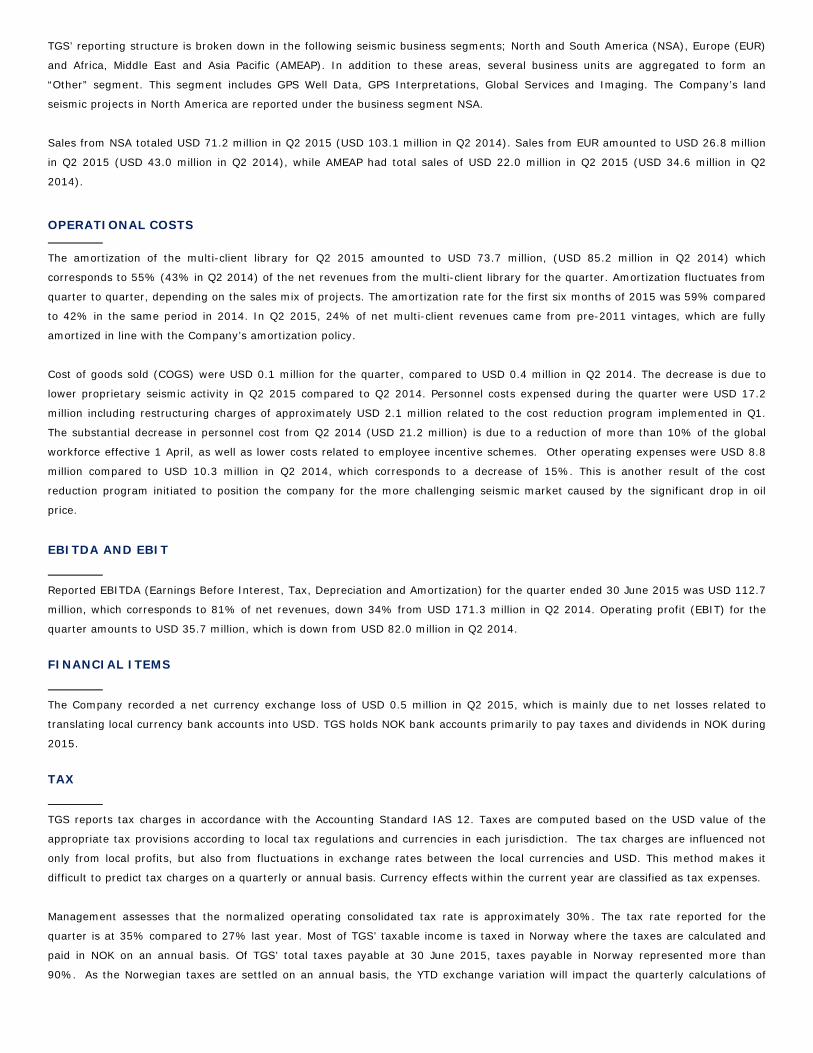
TGS’ reporting structure is broken down in the following seismic business segments; North and South America (NSA), Europe (EUR)
and Africa, Middle East and Asia Pacific (AMEAP). In addition to these areas, several business units are aggregated to form an
“Other” segment. This segment includes GPS Well Data, GPS Interpretations, Global Services and Imaging. The Company’s land
seismic projects in North America are reported under the business segment NSA.
Sales from NSA totaled USD 71.2 million in Q2 2015 (USD 103.1 million in Q2 2014). Sales from EUR amounted to USD 26.8 million
in Q2 2015 (USD 43.0 million in Q2 2014), while AMEAP had total sales of USD 22.0 million in Q2 2015 (USD 34.6 million in Q2
2014).
OPERATIONAL COSTS
The amortization of the multi-client library for Q2 2015 amounted to USD 73.7 million, (USD 85.2 million in Q2 2014) which
corresponds to 55% (43% in Q2 2014) of the net revenues from the multi-client library for the quarter. Amortization fluctuates from
quarter to quarter, depending on the sales mix of projects. The amortization rate for the first six months of 2015 was 59% compared
to 42% in the same period in 2014. In Q2 2015, 24% of net multi-client revenues came from pre-2011 vintages, which are fully
amortized in line with the Company’s amortization policy.
Cost of goods sold (COGS) were USD 0.1 million for the quarter, compared to USD 0.4 million in Q2 2014. The decrease is due to
lower proprietary seismic activity in Q2 2015 compared to Q2 2014. Personnel costs expensed during the quarter were USD 17.2
million including restructuring charges of approximately USD 2.1 million related to the cost reduction program implemented in Q1.
The substantial decrease in personnel cost from Q2 2014 (USD 21.2 million) is due to a reduction of more than 10% of the global
workforce effective 1 April, as well as lower costs related to employee incentive schemes. Other operating expenses were USD 8.8
million compared to USD 10.3 million in Q2 2014, which corresponds to a decrease of 15%. This is another result of the cost
reduction program initiated to position the company for the more challenging seismic market caused by the significant drop in oil
price.
EBITDA AND EBIT
Reported EBITDA (Earnings Before Interest, Tax, Depreciation and Amortization) for the quarter ended 30 June 2015 was USD 112.7
million, which corresponds to 81% of net revenues, down 34% from USD 171.3 million in Q2 2014. Operating profit (EBIT) for the
quarter amounts to USD 35.7 million, which is down from USD 82.0 million in Q2 2014.
FINANCIAL ITEMS
The Company recorded a net currency exchange loss of USD 0.5 million in Q2 2015, which is mainly due to net losses related to
translating local currency bank accounts into USD. TGS holds NOK bank accounts primarily to pay taxes and dividends in NOK during
2015.
TAX
TGS reports tax charges in accordance with the Accounting Standard IAS 12. Taxes are computed based on the USD value of the
appropriate tax provisions according to local tax regulations and currencies in each jurisdiction. The tax charges are influenced not
only from local profits, but also from fluctuations in exchange rates between the local currencies and USD. This method makes it
difficult to predict tax charges on a quarterly or annual basis. Currency effects within the current year are classified as tax expenses.
Management assesses that the normalized operating consolidated tax rate is approximately 30%. The tax rate reported for the
quarter is at 35% compared to 27% last year. Most of TGS’ taxable income is taxed in Norway where the taxes are calculated and
paid in NOK on an annual basis. Of TGS’ total taxes payable at 30 June 2015, taxes payable in Norway represented more than
90%. As the Norwegian taxes are settled on an annual basis, the YTD exchange variation will impact the quarterly calculations of
taxes. Accordingly, the high tax rate in Q2 2015 is mainly due to currency effects for the Parent Company on the taxes payables and
to changes in temporary differences measured in NOK.
NET INCOME AND EARNINGS PER SHARE (EPS)
Net income for Q2 2015 was USD 24.5 million (18% of net revenues), down from USD 61.3 million in Q2 2014. Quarterly earnings
per share (EPS) were USD 0.24 fully diluted (USD 0.24 undiluted), which is down 60% from Q2 2014.
MULTI-CLIENT INVESTMENTS AND LIBRARY
Exchange rate adjustments are related to libraries with functional currencies other than USD
BALANCE SHEET AND CASH FLOW
The net cash flow from operations for the quarter, after taxes, before investments, totaled USD 86.0 million compared to USD 66.0
million in Q2 2014. A dividend of USD 98.7 million for the 2014 accounting year was paid on 21 May 2015, while dividend
withholding taxes of approximately USD 15 million will be paid during July 2015. As of 30 June 2015, the Company’s total cash
holdings amounted to USD 175.9 million compared to USD 256.4 million at 31 December 2014.
The Company has not recognized any impairments to goodwill or other intangible assets during Q2 2015.
TGS currently does not have any interest bearing debt. The company has an undrawn credit facility of USD 50 million and has
received a commitment from its existing lender to expand this facility to USD 75 million during Q3. This will enable the company to
continue to pursue attractive investment opportunities in a challenging market.
Total equity per 30 June 2015 was USD 1,277.2 million, representing 83% of total assets. During the quarter, the Company
transferred 2,000 treasury shares to cover the exercise of options by key employees and distributed 8,250 treasury shares to Board
members. Further, the Company distributed 8,764 treasury shares as a final payment to former owners of Volant Solutions in
accordance with the share purchase agreement signed in May 2012. The shareholders decided at the Annual General Meeting on 6
May 2015 to cancel 1,048,298 treasury shares at that date. Following a mandatory six weeks waiting period, the shares were
cancelled in late June. As of 30 June 2015, TGS held 852,800 treasury shares.
MUSDBeginning net book valueNon-operational investmentsOperational investmentsAmortizationExchange Rate AdjustmentEnding net book value
2014758.1
-
Q2 2014 6M 2015 6M 2014
243.5 (172.6)
279.0 -
876.1 800.0 - - -
(178.2)
Q2 2015
918.9
114.1 (85.2)
116.5 (387.3)
828.8 828.8 - (0.1) -
(329.8)
818.1 758.1
(73.7) (0.3) (5.6) (2.1) -
462.3 (396.7)
651.2 758.1
2012511.1 31.1
496.2
2013651.2
- 438.9
918.9 818.1
MUSDNet MC revenuesChange in MC revenueChange in MC investmentAmort. in % of net MC revs.Change in net book value
90%
902.0 196.6 299.7 Q2 2014
59%408.2
6M 2014
-1%
55% 43%2%
40%16%
7%
9%12%
4%42%59%
5% 4%
15% 3%-9%
-17%
2013 Q2 2015 134.4
-32%
6M 2015
-27%824.1
43%
2012
27%
2014877.7
7%5%
45%8%
BACKLOG
TGS’ backlog amounted to USD 242.4 million at the end of Q2 2015, an increase of 8% from Q2 2014 and 26% higher than last
quarter. The increase is mainly due to final seismic permits granted in Mexico in Q2, allowing existing prefunding commitments to
be recognized as backlog.
OPERATIONAL HIGHLIGHTS
Vessels operating for TGS during all or parts of Q2 included two 3D vessels, three 2D vessels and one Wide Azimuth (WAZ) 3D crew.
TGS was also a participant in one 3D ocean bottom seismic joint venture project, three 3D seismic joint venture projects, one P-
CableTM seismic joint venture project and one electromagnetics (EM) joint venture project. In addition, three land crews operated
under 100% owned TGS projects in Q2 2015.
North and South America
In early Q2, TGS received a seismic permit for the acquisition of a 181,500 km regional 2D seismic survey in the Gulf of Mexico. TGS
will utilize four Seabird vessels to acquire an extensive regional grid of 2D multi-client seismic with 12,000 meters offsets. The
survey will cover the vast offshore sector of Mexico, including world class producing trends such as the Perdido fold belt and
Campeche Bay, and line ties will be made in to the US Gulf of Mexico regional grids previously acquired by TGS. The first two vessels
started recording in Mexican waters in late Q2.
In June, TGS commenced acquisition of a 4,300 km² multi-client 3D survey offshore Eastern Canada. This survey is conducted in
partnership with PGS. Data will be acquired during the summer season 2015 with final data available to clients in Q3 2016.
In collaboration with FairfieldNodal, TGS continued work in Q2 on phase 2 of the Ogo FAN project located in the Eugene Island
protraction area of the US Gulf of Mexico shelf. The project will continue through the full year 2015 and will cover 136 shelf blocks in
total when completed.
In early Q4 last year, the Company commenced acquisition of its latest multi-wide azimuth (M-WAZ) program in the Mississippi
Canyon area of the Central Gulf of Mexico. An extension to the project was announced in Q1 2015 and represents an additional
3,000 km2 of data with acquisition completed in early Q2 2015. The survey, Declaration, utilizes a variation of CGG’s StagSeisTM
technology to integrate with previously acquired wide azimuth data. The resulting dataset provides long-offset rich azimuth imaging
in one of the most prolific hydrocarbon basins in the world. Including the extension, the Declaration project totals 9,600 km2.
Three land crews in North America operated under TGS control in Q2. The Company continued acquisition of the 1,777 km2 Freeport
3D survey in eastern Ohio. Despite weather and permit delays in Q2, TGS expects to complete recording in Q3 of 2015. Also in Q2,
the company started acquisition of the 1,100 km2 Blanchard 3D survey in the South Central Oklahoma Oil Play (SCOOP), Oklahoma.
This survey has also experienced delays due to the unusual and unexpected record rains this year. TGS expects the survey to
complete in Q4, including an industry funded extension of approximately 300 km2.
Europe and Russia
In early Q2, TGS commenced acquisition of a 2,900 km² 3D survey in the South-East Norwegian Barents Sea. The survey, Europa,
was completed in Q2 and the same vessel immediately started data acquisition of another 3,000 km² 3D survey in the Norwegian
Barents Sea. This survey, Hjalmar, is an extension to TGS’ current 3D coverage in the Hoop area with more than 25,000 km² of
data.
In partnership with Dolphin, TGS commenced and completed acquisition in Q2 of a 4,100 km² 3D survey (Ringvassøy) in the
Hammerfest Basin in the Norwegian Barents Sea.
In early May, TGS and WGP Survey Ltd commenced acquisition of a 500 km2 high resolution survey campaign in the Norwegian
Barents Sea. The partnership is utilizing WGP’s 3D P-CableTM technology and the survey is adding to the 500 km2 acquired last
season.
Together with EMGS, TGS completed in Q2 an electromagnetic survey covering nine blocks in the Norwegian Barents Sea.
Africa, Middle East and Asia Pacific
In May, TGS commenced acquisition of a 2,500 km² multi-client 3D survey in the North Carnarvon Basin, offshore Australia. This
survey is conducted in partnership with Dolphin. The acquisition of data was completed in Q2.
TGS completed in early Q2 a 17,500 km 2D survey offshore northeast New Zealand. In addition, the Company finished acquisition of
the second phase of its Nerites 3D survey in the Great Australian Bight of Australia. In total, the two phases represent 21,300 km2
of data in a highly prospective area.
Other Segments
The Geologic Products and Services Division continued to add to its inventory of multi-client products in the quarter. The well data
library grew with the addition of 53,673 new digital well logs, 3,307 new enhanced digital well logs and over 73,000 new Validated
Well Headers. The division also initiated new multi-client interpretive projects geared towards supplying customers with information
on stratigraphy, structure and basin maturity in Norway, the UK, East Africa, Eastern Canada, and the US.
OTHER MATTERS
TGS refers to the Q4 2014 earnings release of 5 February 2015 announcing the Board of Directors’ decision to propose a dividend of
NOK 8.5 per share to the shareholders at the 6 May 2015 Annual General Meeting. Based on the 2015 General Meeting’s resolution
regarding the dividend of NOK 8.5 per share, the shares were quoted exclusive of dividend on 7 May 2015. Dividend was paid out on
21 May 2015 to shareholders of record as of the date of the General Meeting.
The Board of Directors has reviewed the Company's financial situation, including the Company's distributable reserves according to
the annual accounts for 2014. On this basis and in accordance with the Company's resolved dividend policy, the Board of Directors
was authorized by the General Meeting to distribute quarterly dividend payments from Q1 2016. Reference is made to the Notice to
the Annual General Meeting published on 13 April 2015 for more information on the quarterly dividend proposal.
On 29 June, TGS announced that it had entered into a Letter of Intent to acquire Polarcus' multi-client library, with the exception of
Australia, for a price of USD 27.5 million on a cash and debt free basis. The transaction is subject to due diligence and final definitive
documents with target closing date in early August 2015. The multi-client library in Northwest Europe and West Africa consists of 22
3D seismic surveys comprising a total area of 40,000 sq. km and one 2D survey comprising 5,000 linear km. The data covers prime
locations within the established hydrocarbon provinces of six countries along the western Atlantic margin corridor acquired since
2011.
TGS has appointed Sven Børre Larsen as the Company's new Chief Financial Officer. The effective date of Larsen's employment is 1
September 2015 and he will be based in TGS' Asker office. Larsen replaces Kristian Johansen as CFO. Johansen's promotion to COO
of TGS was announced in December of 2014 and he will continue to also serve as interim CFO until 1 September.
OUTLOOK
Demand for seismic data has significantly deteriorated over the first six months of 2015 and TGS does not expect the market to
improve for the remainder of the year. The Company is in constant communication with its customers and many of these energy
companies are facing pressure to reduce spending significantly for 2015.
From these discussions and an assumption that the price of oil will remain under pressure, TGS implemented a Cost Reduction
Program in Q1. A key element of this program was a reduction of more than 10% of TGS' global workforce effective from April. The
company expects annual cost savings of approximately USD 10 million from the Cost Reduction Program. In addition to the
reduction in headcount, Management has taken concrete actions to recognize additional operational cost savings and the Company
will continue to adapt to the challenging market conditions.
Despite these near-term market challenges, TGS believes the long-term future of its business, and particularly the Company’s
focused asset light multi-client model, is strong. Energy companies continue to demand higher resolution subsurface images in
mature basins, as well as new regional data in frontier basins to guide their exploration efforts. Companies exploring and producing
unconventional shale plays continue to seek high quality wellbore-based information to guide their petrophysical analysis. TGS’
customers see the economic value of the multi-client business model and are increasingly comfortable accessing their geoscience
data through this method.
For 2015, the Company has secured adequate land and marine crew capacity at very favorable arrangements. This has encouraged
TGS to continue investments in prolific areas with proven returns. This countercyclical approach has historically proven successful
and TGS will continue to take advantage of the asset-light business model combined with a strong balance sheet.
In line with its counter cyclical investment approach, the company has identified a number of attractive investment opportunities for
the remainder of the year. One of these opportunities is the purchase of the Polarcus data library, which includes payments of 2014
and 2015 acquisition costs deferred under previous contractual agreements. Another significant investment in H2 2015 is the
181,500 km regional 2D survey in Mexico that commenced in June. This survey will utilize four vessels to acquire an extensive
regional grid of 2D multi-client seismic, drawing from the Company’s long success in the US Gulf of Mexico. Management expects
that 2015 investments for these reasons will be approximately USD 490 million.
TGS expects annual net revenues of approximately USD 630 million for 2015 as communicated to the market in early Q2.
Asker, 29 July 2015
The Board of Directors of TGS-NOPEC Geophysical Company ASA
ABOUT TGS
TGS provides multi-client geoscience data to oil and gas Exploration and Production companies worldwide. In addition to extensive
global geophysical and geological data libraries that include multi-client seismic data, magnetic and gravity data, digital well logs,
production data and directional surveys, TGS also offers advanced processing and imaging services, interpretation products and data
integration solutions.
TGS-NOPEC Geophysical Company ASA is listed on the Oslo Stock Exchange (OSLO:TGS).
TGS sponsored American Depositary Shares trade on the U.S. over-the-counter market under the symbol "TGSGY”.
Website: www.tgs.com
CONTACT FOR ADDITIONAL INFORMATION
Kristian Johansen, COO/ Interim CFO tel +47 47 60 33 34
Will Ashby, Director, Finance Western Hemisphere & Investor Relations tel +1-713-860-2184 *************************************************************************************************************************
All statements in this earnings release other than statements of historical fact are forward-looking statements, which are subject to a number of risks,
uncertainties and assumptions that are difficult to predict, and are based upon assumptions as to future events that may not prove accurate. These
factors include TGS’ reliance on a cyclical industry and principal customers, TGS’ ability to continue to expand markets for licensing of data, and TGS’
ability to acquire and process data products at costs commensurate with profitability. Actual results may differ materially from those expected or
projected in the forward-looking statements. TGS undertakes no responsibility or obligation to update or alter forward-looking statements.
*************************************************************************************************************************
TGS | EARNINGS RELEASE 30 JULY 2015
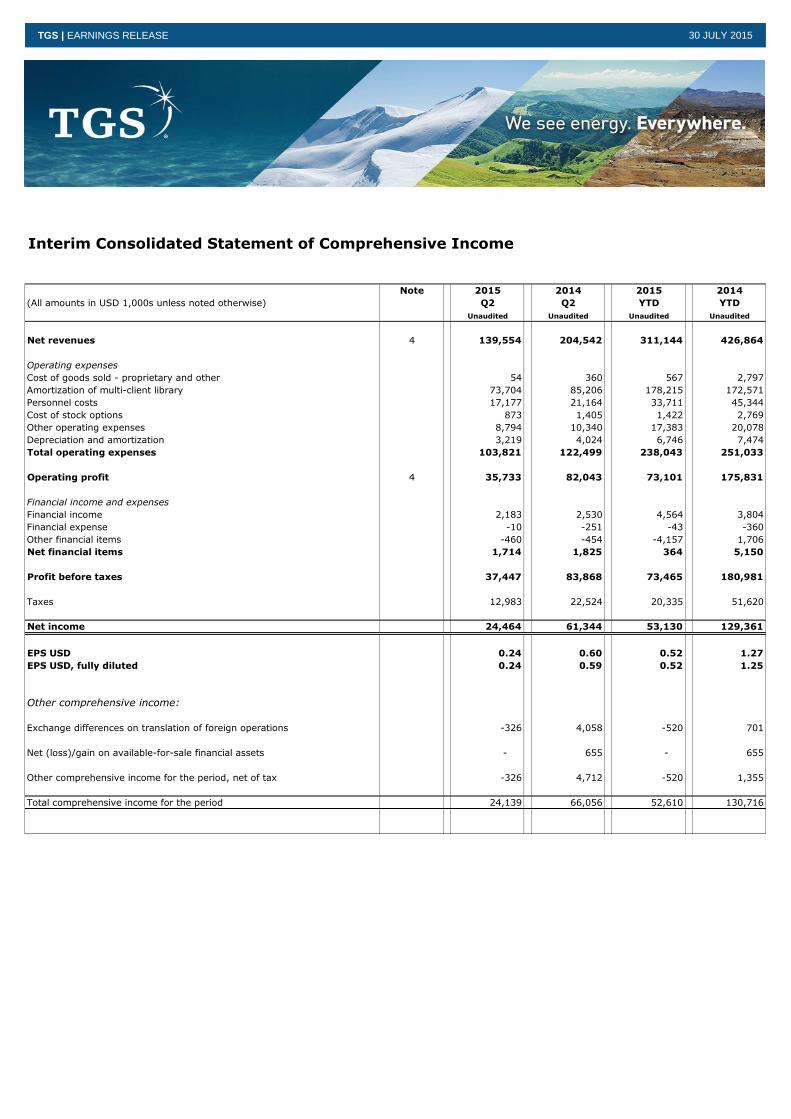
Interim Consolidated Statement of Comprehensive Income
Note 2015 2014 2015 2014
(All amounts in USD 1,000s unless noted otherwise) Q2 Q2 YTD YTD
Unaudited Unaudited Unaudited Unaudited
Net revenues 4 139,554 204,542 311,144 426,864
Operating expenses
Cost of goods sold - proprietary and other 54 360 567 2,797
Amortization of multi-client library 73,704 85,206 178,215 172,571
Personnel costs 17,177 21,164 33,711 45,344
Cost of stock options 873 1,405 1,422 2,769
Other operating expenses 8,794 10,340 17,383 20,078
Depreciation and amortization 3,219 4,024 6,746 7,474
Total operating expenses 103,821 122,499 238,043 251,033
Operating profit 4 35,733 82,043 73,101 175,831
Financial income and expenses
Financial income 2,183 2,530 4,564 3,804
Financial expense -10 -251 -43 -360
Other financial items -460 -454 -4,157 1,706
Net financial items 1,714 1,825 364 5,150
Profit before taxes 37,447 83,868 73,465 180,981
Taxes 12,983 22,524 20,335 51,620
Net income 24,464 61,344 53,130 129,361
EPS USD 0.24 0.60 0.52 1.27
EPS USD, fully diluted 0.24 0.59 0.52 1.25
Other comprehensive income:
Exchange differences on translation of foreign operations -326 4,058 -520 701
Net (loss)/gain on available-for-sale financial assets - 655 - 655
Other comprehensive income for the period, net of tax -326 4,712 -520 1,355
Total comprehensive income for the period 24,139 66,056 52,610 130,716
October 29th, 2009February 11, 2010
TGS EARNINGS RELEASE7 February 2013
TGS | EARNINGS RELEASE 30 JULY 2015
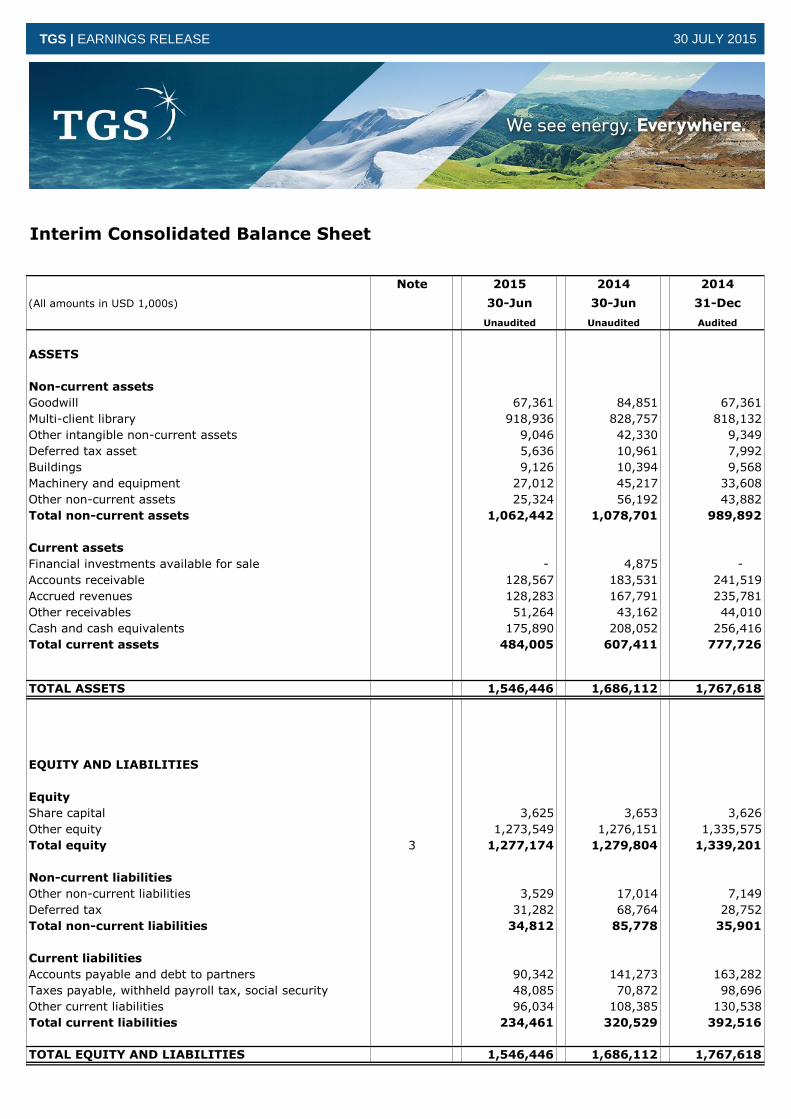
Interim Consolidated Balance Sheet
Note 2015 2014 2014
(All amounts in USD 1,000s) 30-Jun 30-Jun 31-Dec
Unaudited Unaudited Audited
ASSETS
Non-current assets
Goodwill 67,361 84,851 67,361
Multi-client library 918,936 828,757 818,132
Other intangible non-current assets 9,046 42,330 9,349
Deferred tax asset 5,636 10,961 7,992
Buildings 9,126 10,394 9,568
Machinery and equipment 27,012 45,217 33,608
Other non-current assets 25,324 56,192 43,882
Total non-current assets 1,062,442 1,078,701 989,892
Current assets
Financial investments available for sale - 4,875 -
Accounts receivable 128,567 183,531 241,519
Accrued revenues 128,283 167,791 235,781
Other receivables 51,264 43,162 44,010
Cash and cash equivalents 175,890 208,052 256,416
Total current assets 484,005 607,411 777,726
TOTAL ASSETS 1,546,446 1,686,112 1,767,618
EQUITY AND LIABILITIES
Equity
Share capital 3,625 3,653 3,626
Other equity 1,273,549 1,276,151 1,335,575
Total equity 3 1,277,174 1,279,804 1,339,201
Non-current liabilities
Other non-current liabilities 3,529 17,014 7,149
Deferred tax 31,282 68,764 28,752
Total non-current liabilities 34,812 85,778 35,901
Current liabilities
Accounts payable and debt to partners 90,342 141,273 163,282
Taxes payable, withheld payroll tax, social security 48,085 70,872 98,696
Other current liabilities 96,034 108,385 130,538
Total current liabilities 234,461 320,529 392,516
TOTAL EQUITY AND LIABILITIES 1,546,446 1,686,112 1,767,618
October 29th, 2009February 11, 2010
TGS EARNINGS RELEASE7 February 2013
TGS | EARNINGS RELEASE 30 JULY 2015
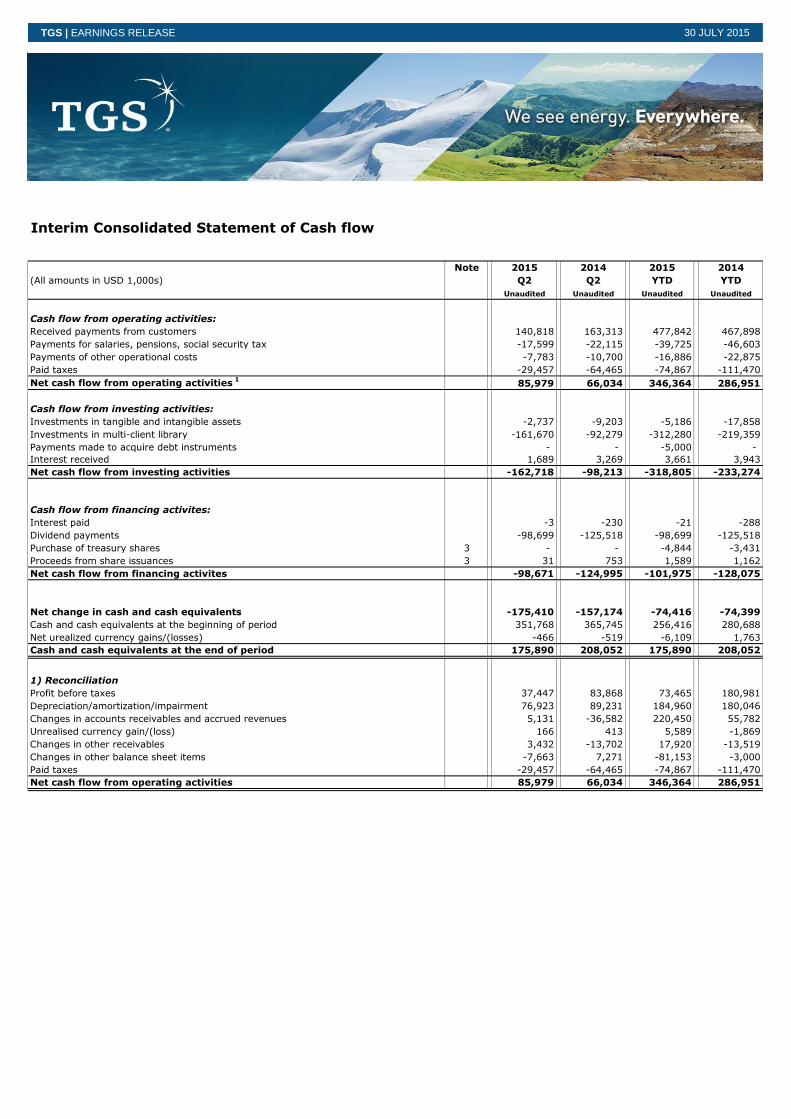
Interim Consolidated Statement of Cash flow
Note 2015 2014 2015 2014
(All amounts in USD 1,000s) Q2 Q2 YTD YTD
Unaudited Unaudited Unaudited Unaudited
Cash flow from operating activities:
Received payments from customers 140,818 163,313 477,842 467,898
Payments for salaries, pensions, social security tax -17,599 -22,115 -39,725 -46,603
Payments of other operational costs -7,783 -10,700 -16,886 -22,875
Paid taxes -29,457 -64,465 -74,867 -111,470
Net cash flow from operating activities 1
85,979 66,034 346,364 286,951
Cash flow from investing activities:
Investments in tangible and intangible assets -2,737 -9,203 -5,186 -17,858
Investments in multi-client library -161,670 -92,279 -312,280 -219,359
Payments made to acquire debt instruments - - -5,000 -
Interest received 1,689 3,269 3,661 3,943
Net cash flow from investing activities -162,718 -98,213 -318,805 -233,274
Cash flow from financing activites:
Interest paid -3 -230 -21 -288
Dividend payments -98,699 -125,518 -98,699 -125,518
Purchase of treasury shares 3 - - -4,844 -3,431
Proceeds from share issuances 3 31 753 1,589 1,162
Net cash flow from financing activites -98,671 -124,995 -101,975 -128,075
Net change in cash and cash equivalents -175,410 -157,174 -74,416 -74,399
Cash and cash equivalents at the beginning of period 351,768 365,745 256,416 280,688
Net urealized currency gains/(losses) -466 -519 -6,109 1,763
Cash and cash equivalents at the end of period 175,890 208,052 175,890 208,052
1) Reconciliation
Profit before taxes 37,447 83,868 73,465 180,981
Depreciation/amortization/impairment 76,923 89,231 184,960 180,046
Changes in accounts receivables and accrued revenues 5,131 -36,582 220,450 55,782
Unrealised currency gain/(loss) 166 413 5,589 -1,869
Changes in other receivables 3,432 -13,702 17,920 -13,519
Changes in other balance sheet items -7,663 7,271 -81,153 -3,000
Paid taxes -29,457 -64,465 -74,867 -111,470
Net cash flow from operating activities 85,979 66,034 346,364 286,951
October 29th, 2009February 11, 2010
TGS EARNINGS RELEASE7 February 2013
TGS | EARNINGS RELEASETGS | EARNINGS RELEASE 30 JULY 2015
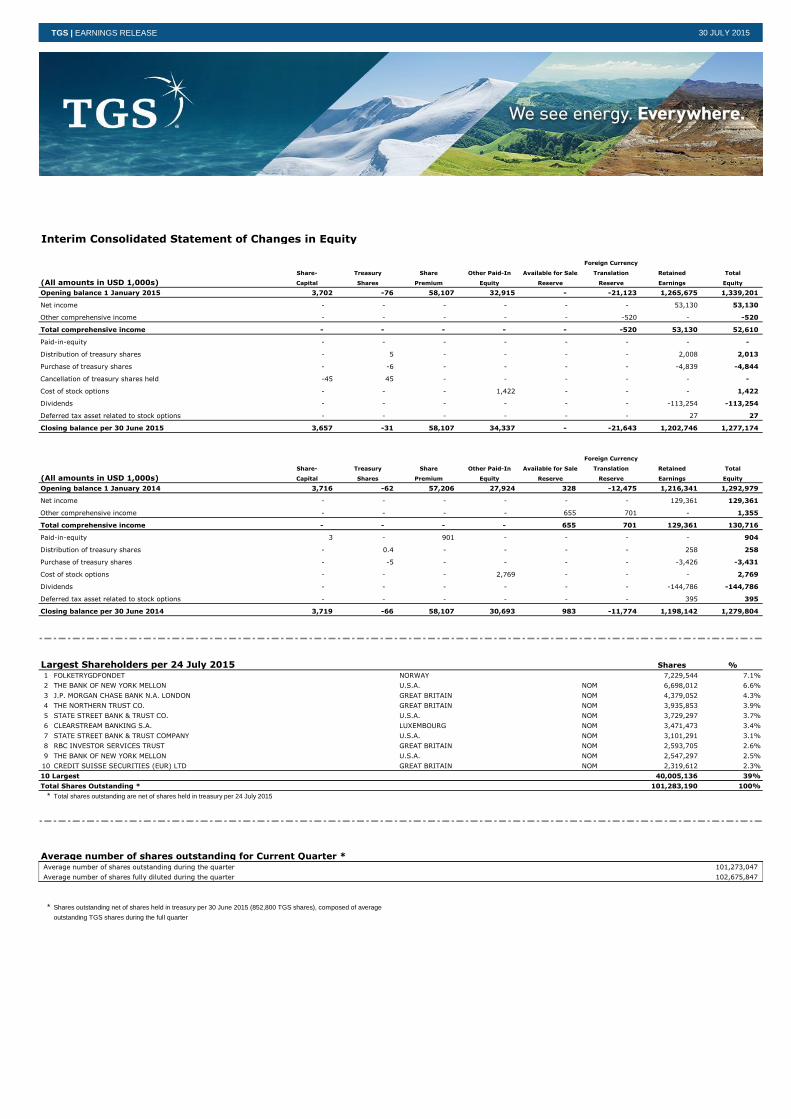
Interim Consolidated Statement of Changes in Equity
Foreign Currency
Share- Treasury Share Other Paid-In Available for Sale Translation Retained Total
(All amounts in USD 1,000s) Capital Shares Premium Equity Reserve Reserve Earnings Equity
Opening balance 1 January 2015 3,702 -76 58,107 32,915 - -21,123 1,265,675 1,339,201
Net income - - - - - - 53,130 53,130
Other comprehensive income - - - - - -520 - -520
Total comprehensive income - - - - - -520 53,130 52,610
Paid-in-equity - - - - - - - -
Distribution of treasury shares - 5 - - - - 2,008 2,013
Purchase of treasury shares - -6 - - - - -4,839 -4,844
Cancellation of treasury shares held -45 45 - - - - - -
Cost of stock options - - - 1,422 - - - 1,422
Dividends - - - - - - -113,254 -113,254
Deferred tax asset related to stock options - - - - - - 27 27
Closing balance per 30 June 2015 3,657 -31 58,107 34,337 - -21,643 1,202,746 1,277,174
Foreign Currency
Share- Treasury Share Other Paid-In Available for Sale Translation Retained Total
(All amounts in USD 1,000s) Capital Shares Premium Equity Reserve Reserve Earnings Equity
Opening balance 1 January 2014 3,716 -62 57,206 27,924 328 -12,475 1,216,341 1,292,979
Net income - - - - - - 129,361 129,361
Other comprehensive income - - - - 655 701 - 1,355
Total comprehensive income - - - - 655 701 129,361 130,716
Paid-in-equity 3 - 901 - - - - 904
Distribution of treasury shares - 0.4 - - - - 258 258
Purchase of treasury shares - -5 - - - - -3,426 -3,431
Cost of stock options - - - 2,769 - - - 2,769
Dividends - - - - - - -144,786 -144,786
Deferred tax asset related to stock options - - - - - - 395 395
Closing balance per 30 June 2014 3,719 -66 58,107 30,693 983 -11,774 1,198,142 1,279,804
Largest Shareholders per 24 July 2015 Shares %
1 FOLKETRYGDFONDET NORWAY 7,229,544 7.1%
2 THE BANK OF NEW YORK MELLON U.S.A. NOM 6,698,012 6.6%
3 J.P. MORGAN CHASE BANK N.A. LONDON GREAT BRITAIN NOM 4,379,052 4.3%
4 THE NORTHERN TRUST CO. GREAT BRITAIN NOM 3,935,853 3.9%
5 STATE STREET BANK & TRUST CO. U.S.A. NOM 3,729,297 3.7%
6 CLEARSTREAM BANKING S.A. LUXEMBOURG NOM 3,471,473 3.4%
7 STATE STREET BANK & TRUST COMPANY U.S.A. NOM 3,101,291 3.1%
8 RBC INVESTOR SERVICES TRUST GREAT BRITAIN NOM 2,593,705 2.6%
9 THE BANK OF NEW YORK MELLON U.S.A. NOM 2,547,297 2.5%
10 CREDIT SUISSE SECURITIES (EUR) LTD GREAT BRITAIN NOM 2,319,612 2.3%
10 Largest 40,005,136 39%
Total Shares Outstanding * 101,283,190 100%
* Total shares outstanding are net of shares held in treasury per 24 July 2015
Average number of shares outstanding for Current Quarter *Average number of shares outstanding during the quarter
Average number of shares fully diluted during the quarter
* Shares outstanding net of shares held in treasury per 30 June 2015 (852,800 TGS shares), composed of average
outstanding TGS shares during the full quarter
102,675,847
101,273,047
October 29th, 2009February 11, 2010
TGS EARNINGS RELEASE7 February 2013
TGS | EARNINGS RELEASE 30 JULY 2015
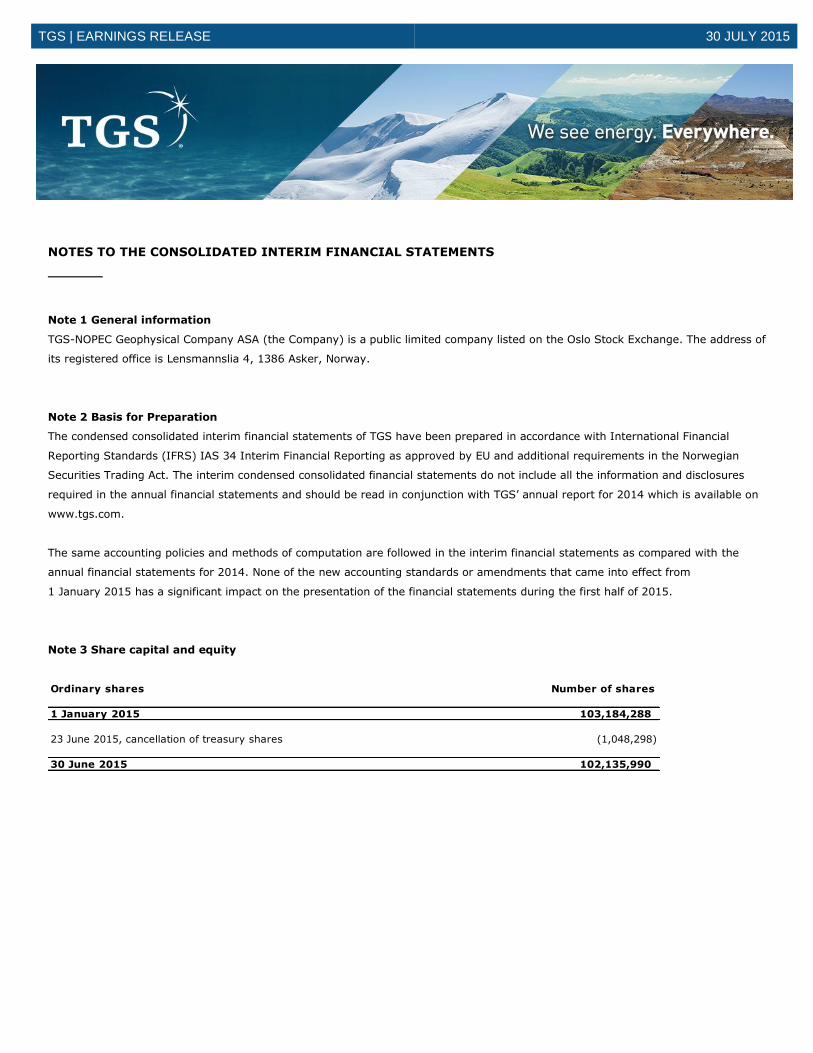
NOTES TO THE CONSOLIDATED INTERIM FINANCIAL STATEMENTS
Note 1 General information
TGS-NOPEC Geophysical Company ASA (the Company) is a public limited company listed on the Oslo Stock Exchange. The address of
its registered office is Lensmannslia 4, 1386 Asker, Norway.
Note 2 Basis for Preparation
The condensed consolidated interim financial statements of TGS have been prepared in accordance with International Financial
Reporting Standards (IFRS) IAS 34 Interim Financial Reporting as approved by EU and additional requirements in the Norwegian
Securities Trading Act. The interim condensed consolidated financial statements do not include all the information and disclosures
required in the annual financial statements and should be read in conjunction with TGS’ annual report for 2014 which is available on
www.tgs.com.
The same accounting policies and methods of computation are followed in the interim financial statements as compared with the
annual financial statements for 2014. None of the new accounting standards or amendments that came into effect from
1 January 2015 has a significant impact on the presentation of the financial statements during the first half of 2015.
Note 3 Share capital and equity
Ordinary shares Number of shares
1 January 2015 103,184,288
23 June 2015, cancellation of treasury shares (1,048,298)
30 June 2015 102,135,990
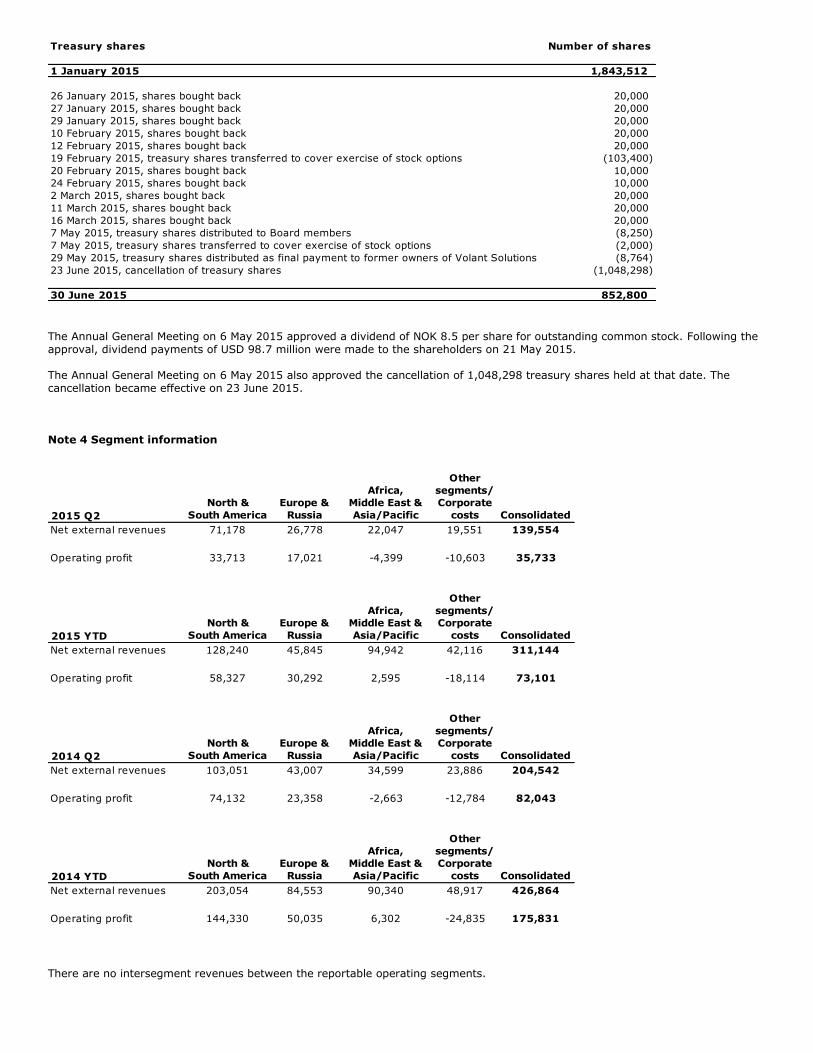
The Annual General Meeting on 6 May 2015 approved a dividend of NOK 8.5 per share for outstanding common stock. Following the approval, dividend payments of USD 98.7 million were made to the shareholders on 21 May 2015. The Annual General Meeting on 6 May 2015 also approved the cancellation of 1,048,298 treasury shares held at that date. The cancellation became effective on 23 June 2015.
Note 4 Segment information
There are no intersegment revenues between the reportable operating segments.
Treasury shares Number of shares
1 January 2015 1,843,512
26 January 2015, shares bought back 20,000
27 January 2015, shares bought back 20,000
29 January 2015, shares bought back 20,000
10 February 2015, shares bought back 20,000
12 February 2015, shares bought back 20,000
19 February 2015, treasury shares transferred to cover exercise of stock options (103,400)
20 February 2015, shares bought back 10,000
24 February 2015, shares bought back 10,000
2 March 2015, shares bought back 20,000
11 March 2015, shares bought back 20,000
16 March 2015, shares bought back 20,000
7 May 2015, treasury shares distributed to Board members (8,250)
7 May 2015, treasury shares transferred to cover exercise of stock options (2,000)
29 May 2015, treasury shares distributed as final payment to former owners of Volant Solutions (8,764)
23 June 2015, cancellation of treasury shares (1,048,298)
30 June 2015 852,800
2015 Q2
North &
South America
Europe &
Russia
Africa,
Middle East &
Asia/Pacific
Other
segments/
Corporate
costs Consolidated
Net external revenues 71,178 26,778 22,047 19,551 139,554
Operating profit 33,713 17,021 -4,399 -10,603 35,733
2015 YTD
North &
South America
Europe &
Russia
Africa,
Middle East &
Asia/Pacific
Other
segments/
Corporate
costs Consolidated
Net external revenues 128,240 45,845 94,942 42,116 311,144
Operating profit 58,327 30,292 2,595 -18,114 73,101
2014 Q2
North &
South America
Europe &
Russia
Africa,
Middle East &
Asia/Pacific
Other
segments/
Corporate
costs Consolidated
Net external revenues 103,051 43,007 34,599 23,886 204,542
Operating profit 74,132 23,358 -2,663 -12,784 82,043
2014 YTD
North &
South America
Europe &
Russia
Africa,
Middle East &
Asia/Pacific
Other
segments/
Corporate
costs Consolidated
Net external revenues 203,054 84,553 90,340 48,917 426,864
Operating profit 144,330 50,035 6,302 -24,835 175,831

The Company does not allocate all cost items to its reportable operating segments during the year. Unallocated cost items are
reported as “Other segments/Corporate costs”.
Note 5 Related parties
No material transactions with related parties took place during the second quarter of 2015.
Note 6 Letter of Intent signed to acquire Polarcus’ multi-client library
On 28 June 2015, TGS entered into a letter of intent to acquire Polarcus' multi-client library, with the exception of Australia, for a
price of USD 27.5 million on a cash and debt free basis. The transaction is subject to due diligence and final definitive documents
with expected closing in early August 2015. Polarcus will continue to have rights to revenue share from the library after TGS has
realized a predetermined return on its initial investment.
The transaction will be financed with available cash. To maintain its strong balance sheet and liquidity position, TGS has available a
credit facility in the amount USD 50 million, none of which is outstanding, and has received a commitment from its existing lender to
expand the facility to USD 75 million.
Responsibility Statement
We confirm to the best of our knowledge that the condensed set of financial statements for the period 1 January to 30 June 2015 has
been prepared in accordance with IAS 34 – Interim Financial Reporting as adopted by EU, and additional requirements found in the
Norwegian Securities Trading Act, and gives a true and fair view of the Company’s consolidated assets, liabilities, financial position
and result for the period. We also confirm to the best of our knowledge that the financial review includes a fair review of important
events that have occurred during the first six months of the financial year and their impact on the financial statements, any major
related parties transactions, and a description of the principal risks and uncertainties for the remaining six months of the financial
year.
Asker, 29 July 2015
Hank Hamilton (Board Chairman) Mark Leonard Elisabeth Harstad Tor Magne Lønnum
Vicki Messer Jørgen C. Arentz Rostrup Wenche Agerup
Robert Hobbs (CEO)