Embed Size (px)
Citation preview
Solid data from a solid company.
2008 Annual Report
TGS-NOPEC Geophysical Company
2008 Annual Report
2 TGS-NOPEC Geophysical Company
click to return to Table of Contents
soliddata
1
2008 Annual Report
Table of Contents
Financial Highlights 2
Letter to Our Shareholders 4
From Our Board 7
Group Financials 12
Notes to Group Financial Statements 16
Parent Company Financials 41
Notes to Parent Financial Statements 46
Auditor’s Report 57
Corporate Governance 58
Investor Relations 65
Contact Information 66
2008 Annual Report
2 TGS-NOPEC Geophysical Company
click to return to Table of Contents
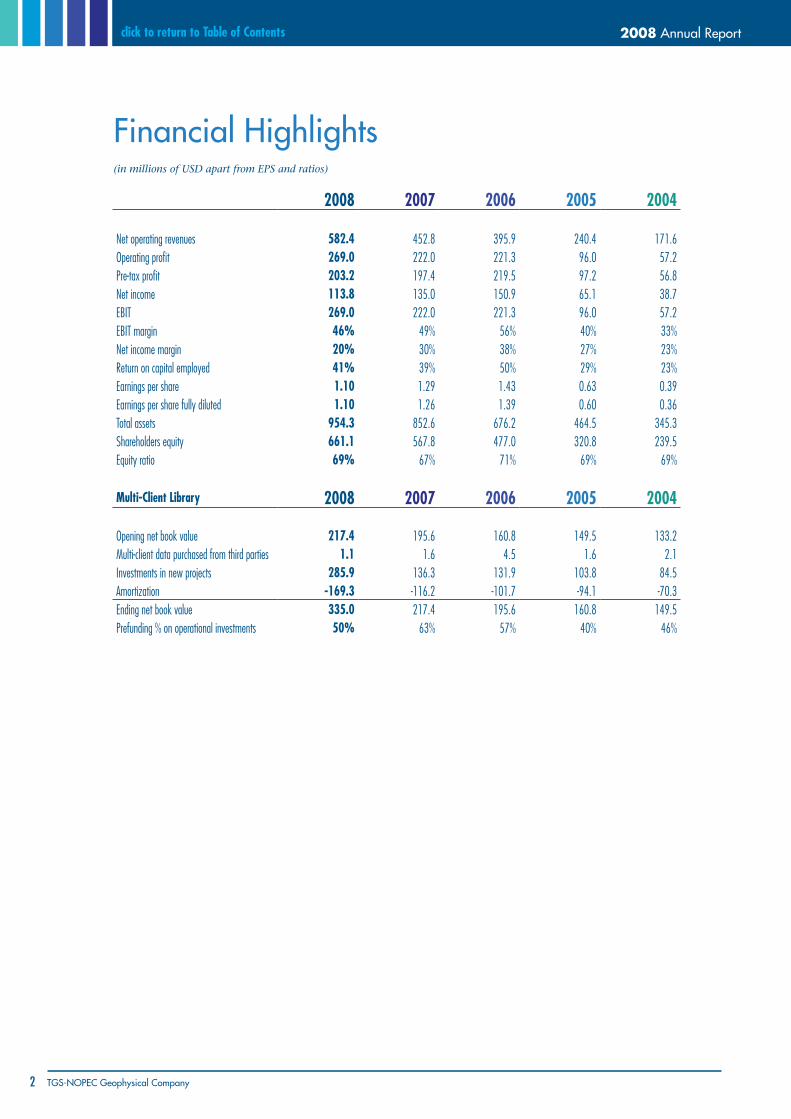
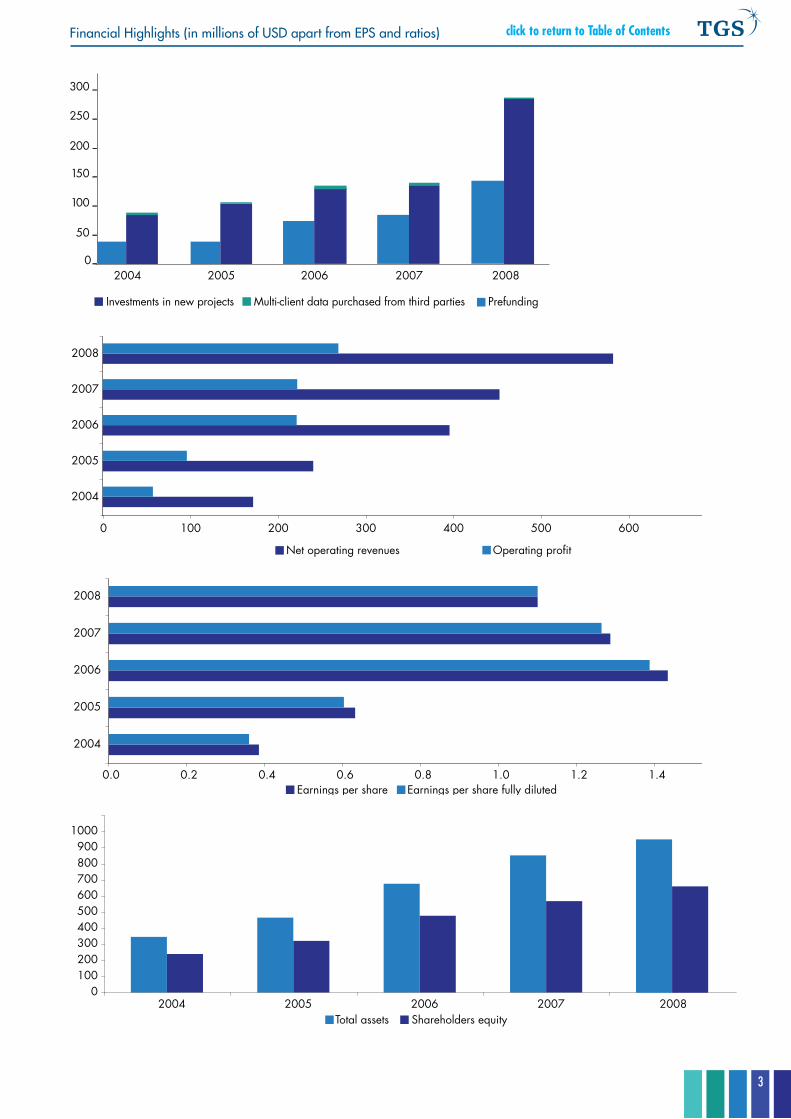
Financial Highlights(in millions of USD apart from EPS and ratios)
2008 2007 2006 2005 2004
Net operating revenues 582.4 452.8 395.9 240.4 171.6Operating profit 269.0 222.0 221.3 96.0 57.2Pre-tax profit 203.2 197.4 219.5 97.2 56.8Net income 113.8 135.0 150.9 65.1 38.7EBIT 269.0 222.0 221.3 96.0 57.2EBIT margin 46% 49% 56% 40% 33%Net income margin 20% 30% 38% 27% 23%Return on capital employed 41% 39% 50% 29% 23%Earnings per share 1.10 1.29 1.43 0.63 0.39Earnings per share fully diluted 1.10 1.26 1.39 0.60 0.36Total assets 954.3 852.6 676.2 464.5 345.3Shareholders equity 661.1 567.8 477.0 320.8 239.5Equity ratio 69% 67% 71% 69% 69% Multi-Client Library 2008 2007 2006 2005 2004
Opening net book value 217.4 195.6 160.8 149.5 133.2Multi-client data purchased from third parties 1.1 1.6 4.5 1.6 2.1Investments in new projects 285.9 136.3 131.9 103.8 84.5Amortization -169.3 -116.2 -101.7 -94.1 -70.3Ending net book value 335.0 217.4 195.6 160.8 149.5Prefunding % on operational investments 50% 63% 57% 40% 46%
3
click to return to Table of ContentsFinancial Highlights (in millions of USD apart from EPS and ratios)
NET REVENUES 2008
25% Pre-funding58% Late sales 14% Contract 3% Other
NET REVENUES 2008
48% Western Hemisphere
52% Eastern Hemisphere
NET MULTI-CLIENT REVENUES 2008
50% 3D
38% 2D 12% Geological Products
NET BOOK VALUE OF SEISMIC LIBRARY BY YEAR
% Year 42% WIP 37% 2008 7% 2007 14% 2006 1% 2005
NET BOOK VALUE OFLIBRARY BY DATA TYPE
49% 3D
39% 2D
12% Well Logs & Integrated Products
0 100 200 300 400 500 600
2004
2005
2006
2007
2008
Net operating revenues Operating profit
0.0 0.2 0.4 0.6 0.8 1.0 1.2 1.4
2004
2005
2006
2007
2008
Earnings per share Earnings per share fully diluted
0100200300400500600700800900
1000
2004 2005 2006 2007Total assets Shareholders equity
NET REVENUES 2008
48% Western Hemisphere
52% Eastern Hemisphere
FIGURE 3
NET MULTI-CLIENT REVENUES 2008
50% 3D
38% 2D 12% Geological Products
FIGURE 4
NET BOOK VALUE OF SEISMIC LIBRARY BY YEAR
% Year 42% WIP 37% 2008 7% 2007 14% 2006 1% 2005
FIGURE 5
NET BOOK VALUE OFLIBRARY BY DATA TYPE
49% 3D
39 2D
12% Well Logs & Integrated Products
0
50
100
150
200
250
300
Investments in new projects Multi-client data purchased from third parties Prefunding
2004 2005 2006 2007 2008
61%
8%4%10%
2%
14%
42%37%
7%14%
1%0%0%10%20%30%40%50%60%70%
Pre-2005 2005 2006 2007 2008 WIP/MISC
050.0
100.0150.0200.0250.0300.0
2004 2005 2006 2007 2008 WIPTotal Project Investments Net Book Value
67%45%
31%22%
10%0%
Net Revenues in % of total Net Book Value in % of total
NET REVENUES 2008
25% Pre-funding58% Late sales 14% Contract 3% Other
2008
49% Norway 19% USA 18% Great Britain5% Luxembourg9% other
NET REVENUES 2008
25% Pre-funding58% Late sales 14% Contract 3% Other
NET REVENUES 2008
48% Western Hemisphere
52% Eastern Hemisphere
NET MULTI-CLIENT REVENUES 2008
50% 3D
38% 2D 12% Geological Products
NET BOOK VALUE OF SEISMIC LIBRARY BY YEAR
% Year 42% WIP 37% 2008 7% 2007 14% 2006 1% 2005
NET BOOK VALUE OFLIBRARY BY DATA TYPE
49% 3D
39% 2D
12% Well Logs & Integrated Products
0 100 200 300 400 500 600
2004
2005
2006
2007
2008
Net operating revenues Operating profit
0.0 0.2 0.4 0.6 0.8 1.0 1.2 1.4
2004
2005
2006
2007
2008
Earnings per share Earnings per share fully diluted
0100200300400500600700800900
1000
2004 2005 2006 2007Total assets Shareholders equity
NET REVENUES 2008
48% Western Hemisphere
52% Eastern Hemisphere
FIGURE 3
NET MULTI-CLIENT REVENUES 2008
50% 3D
38% 2D 12% Geological Products
FIGURE 4
NET BOOK VALUE OF SEISMIC LIBRARY BY YEAR
% Year 42% WIP 37% 2008 7% 2007 14% 2006 1% 2005
FIGURE 5
NET BOOK VALUE OFLIBRARY BY DATA TYPE
49% 3D
39 2D
12% Well Logs & Integrated Products
0
50
100
150
200
250
300
Investments in new projects Multi-client data purchased from third parties Prefunding
2004 2005 2006 2007 2008
61%
8%4%10%
2%
14%
42%37%
7%14%
1%0%0%10%20%30%40%50%60%70%
Pre-2005 2005 2006 2007 2008 WIP/MISC
050.0
100.0150.0200.0250.0300.0
2004 2005 2006 2007 2008 WIPTotal Project Investments Net Book Value
67%45%
31%22%
10%0%
Net Revenues in % of total Net Book Value in % of total
NET REVENUES 2008
25% Pre-funding58% Late sales 14% Contract 3% Other
2008
49% Norway 19% USA 18% Great Britain5% Luxembourg9% other
2008 Annual Report
4 TGS-NOPEC Geophysical Company
click to return to Table of Contents
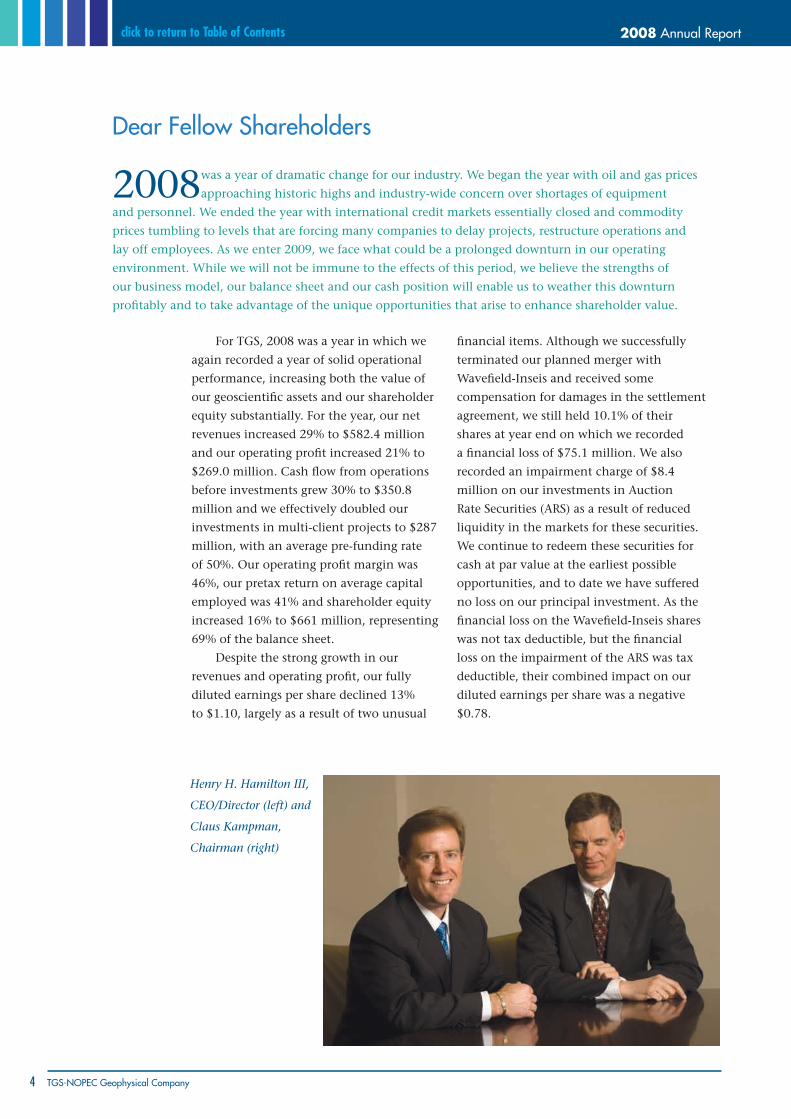
Dear Fellow Shareholders
2008 was a year of dramatic change for our industry. We began the year with oil and gas prices
approaching historic highs and industry-wide concern over shortages of equipment
and personnel. We ended the year with international credit markets essentially closed and commodity
prices tumbling to levels that are forcing many companies to delay projects, restructure operations and
lay off employees. As we enter 2009, we face what could be a prolonged downturn in our operating
environment. While we will not be immune to the effects of this period, we believe the strengths of
our business model, our balance sheet and our cash position will enable us to weather this downturn
profitably and to take advantage of the unique opportunities that arise to enhance shareholder value.
Henry H. Hamilton III,
CEO/Director (left) and
Claus Kampman,
Chairman (right)
For TGS, 2008 was a year in which we
again recorded a year of solid operational
performance, increasing both the value of
our geoscientific assets and our shareholder
equity substantially. For the year, our net
revenues increased 29% to $582.4 million
and our operating profit increased 21% to
$269.0 million. Cash flow from operations
before investments grew 30% to $350.8
million and we effectively doubled our
investments in multi-client projects to $287
million, with an average pre-funding rate
of 50%. Our operating profit margin was
46%, our pretax return on average capital
employed was 41% and shareholder equity
increased 16% to $661 million, representing
69% of the balance sheet.
Despite the strong growth in our
revenues and operating profit, our fully
diluted earnings per share declined 13%
to $1.10, largely as a result of two unusual
financial items. Although we successfully
terminated our planned merger with
Wavefield-Inseis and received some
compensation for damages in the settlement
agreement, we still held 10.1% of their
shares at year end on which we recorded
a financial loss of $75.1 million. We also
recorded an impairment charge of $8.4
million on our investments in Auction
Rate Securities (ARS) as a result of reduced
liquidity in the markets for these securities.
We continue to redeem these securities for
cash at par value at the earliest possible
opportunities, and to date we have suffered
no loss on our principal investment. As the
financial loss on the Wavefield-Inseis shares
was not tax deductible, but the financial
loss on the impairment of the ARS was tax
deductible, their combined impact on our
diluted earnings per share was a negative
$0.78.
5
click to return to Table of ContentsLetter to our Shareholders
Geophysical Library ExpansionWe made substantial strides in the expansion of our core multi-client seismic data library, adding
over 100,000 kilometers of 2D and more than 37,000 square kilometers of 3D. In January, we initiated the
Freedom wide azimuth (WAZ) multi-client 3D seismic survey in conjunction with WesternGeco. One of
the largest WAZ surveys in the world, the Freedom survey will cover over 650 OCS blocks (approximately
15,000 square kilometers) in the highly prolific Mississippi Canyon area of the Gulf of Mexico. Although we
temporarily suspended field operations in October, we resumed production subsequent to year end with a
higher capacity configuration including two ten-streamer recording vessels designed to keep the project on
schedule.
Broadening the geographical scope of our multi-client 3D seismic portfolio, we acquired a highly
successful 1,500 square kilometer survey in the Barents Sea in preparation for Norway’s 20th licensing round,
and in October, we began acquiring a highly pre-funded 9,000 square kilometer project offshore Liberia.
Milestones in Geological Products and Services Group Our geological products and services division secured underwriting commitments from 11 customers
to begin an exciting and ambitious project of converting our onshore US well log library to LAS (Log Ascii
Standard) format, a much higher value product that is necessary for exploration in the growing shale or
“resource” plays. To support this effort and accelerate the creation of fully digitized LAS files, we acquired
Center Line Data, a provider of well log digitizing software and services, and our production increased from
5,000 wells per month at the start of the year to 11,000 wells per month by the end of the year.
Our Oyster program, a subscription based plan offering unlimited access to our US onshore and offshore
well log raster data, was rapidly adopted by the industry as over 130 companies signed commitments for the
service within four months of its commencement.
Internationally, we reached a significant milestone when we initiated a new multi-client interpretive
study utilizing our proprietary Facies Map Browser (FMB) application to map the depositional systems offshore
Brazil. This project represents the first significant use of this technology outside Northwest Europe, where it
has been established as the industry standard well and interpreted facies database and visualization tool.
Advances in Subsalt Imaging CapabilitiesOur imaging services group continued to develop and commercialize new algorithms and techniques
for seismic imaging underneath complex salt overburdens. Utilizing anisotropic parameter estimation and
subsalt tomographic methods, we produced a new Kirchhoff depth migrated 3D volume in the Gulf of
Mexico that was calibrated with 247 wells from our geological products division, resulting in unprecedented
quality beneath and around numerous highly deformed salt bodies in the area.
In March, we announced the commercialization of a new reverse time migration (RTM) algorithm,
a state-of-the-art technique which combines the best of previously used wave equation and Kirchhoff
methods. We used this new application to create an upgraded multi-client product on our Stanley 3D project
and to win several proprietary data processing contracts from our customers.
2009 OutlookAs we enter 2009, the smaller oil and gas companies faced with limited access to capital and sharply
reduced revenues are slashing exploration and production expenditures. National oil companies, major
international oil companies and well-capitalized large independents are reviewing their expenditure levels,
but at this juncture are still striving to advance long-term programs. In this environment, we expect
exploration and production spending to decline about 10-20% annually. We also see that rates from seismic
vessel suppliers have peaked and we expect further significant declines in the second half of the year as the
industry reaches overcapacity.
For TGS, these dynamics pose both challenges and opportunities. We are scaling back our planned
spending on new projects as appropriate. We are, however, well-positioned in the vessel charter market.
As a result of our settlement with Wavefield-Inseis, we will not only receive $12.5 million in two annual
2008 Annual Report
6 TGS-NOPEC Geophysical Company
click to return to Table of Contents
payments but we also have an 18-month 2D vessel charter at attractive rates and options for up to 24
months of 3D vessel time at favorable rates. Since the majority of our existing vessel charters end in 2009,
we will look to secure more flexible capacity arrangements at even lower rates, enabling further organic
expansion of our library at lower unit costs.
In this market cycle we also believe that our strong cash position may enable us to make selective
acquisitions in complementary libraries, businesses or technologies at compelling risk/reward ratios. We
will continue to carefully evaluate opportunities and pursue prudent acquisitions to expand or further
strengthen our operations.
In 2008 we repurchased 1,679,700 TGS shares for $15 million. We will continue to evaluate share
repurchases in the current economic environment as a way to create more shareholder value.
We recently announced a few planned changes to our leadership. After seven years as a director and
five years as Chairman, Claus Kampmann will retire in June 2009. After nearly 14 years as CEO and 11
years as a director, Hank Hamilton will retire from the CEO position and will be nominated to succeed
Claus as Chairman. Robert Hobbs will be promoted from his current COO role to replace Hank as CEO. We
view these changes as a natural succession plan that is designed to provide continuity in TGS. This means
continuity in vision and strategy, continuity in management philosophy, and continuity in operations.
The Value of Our Business ModelThroughout TGS’s history as a public company we have emphasized the value of having a flexible
business model and a strong balance sheet. When oil prices hit $10/barrel the 4th quarter of 1998 - marking
a distinct trough in the oil industry business cycle - our lean fixed cost base, strong balance sheet and unique
business model enabled TGS to not only withstand that disruptive period, but to expand and gain market
share.
At that time, however, critics claimed that our business model would not perform equally well at the
peak of a cycle. 2008 was clearly the peak of our most recent cycle and even when faced with constraints on
vessels and personnel, TGS’s model performed well and we once again delivered exceptional performance.
Today we know that our business model has been well tested. And today, perhaps more than ever
before, we believe its resilience to be of critical importance to our success. In an operating environment
shaped by an unprecedented collapse in the credit markets and a precipitous decline in oil and gas
commodity prices, we believe our model, our solid balance sheet and our healthy cash position will enable
TGS to navigate the downturn and emerge with a significant competitive advantage when economic and
industry conditions improve. We believe the long-term future of the seismic business is compelling. We also
believe TGS will be at the forefront of that future.
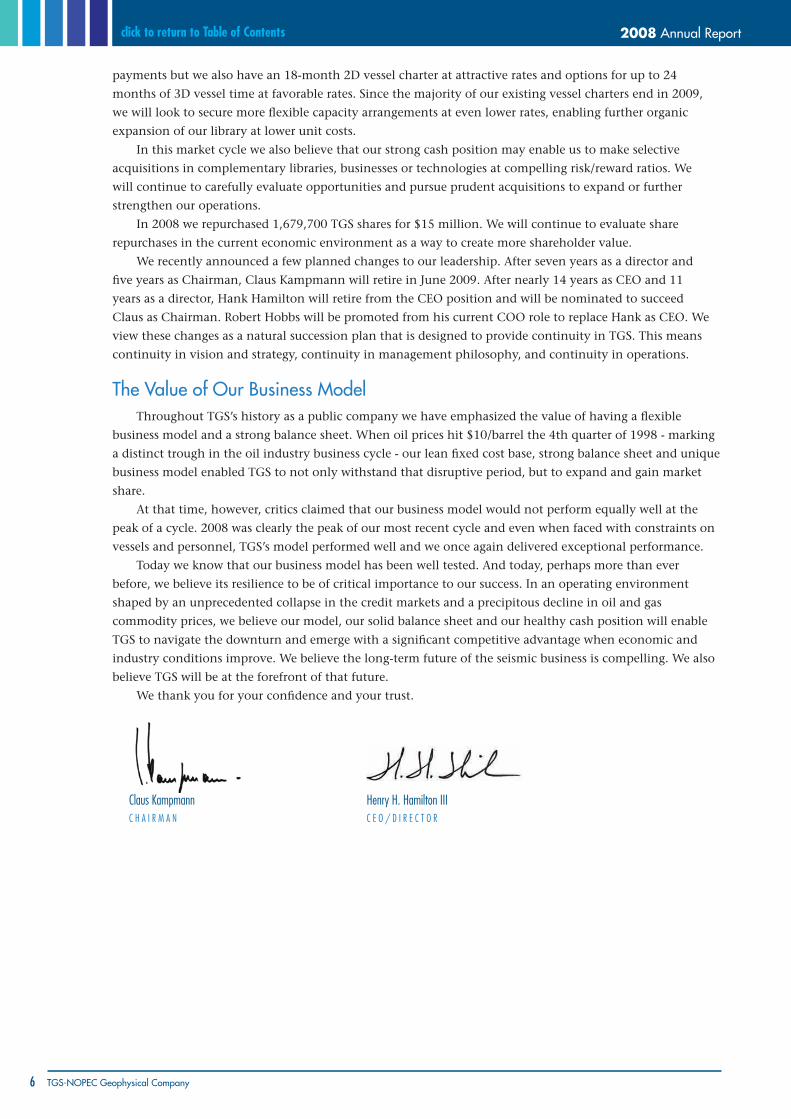
We thank you for your confidence and your trust.
Claus KampmannC h A I R M A N
henry h. hamilton IIIC E O / D I R E C T O R
7
From Our Board click to return to Table of Contents
We also possess the world’s largest online
well-log database, and provide multi-client
interpretive products and well data management and
subsurface consulting services to the industry. We
operate worldwide and are presently active in North
and South America, Europe, Africa, Asia and Australia.
Our parent company is located in Asker, Norway.
Our main subsidiary is in Houston, Texas, U.S.A. and
we also have regional offices in the United Kingdom,
Australia, Russia and in Denver, Colorado, U.S.A. All
financial statements in this report are presented on
the basis of a “going concern” assumption, and the
Board of Directors confirms that it is of the opinion
that the prerequisites for a going concern assumption
are indeed present. To the best of the Directors’
knowledge, no subsequent events not described in
this report have occurred since December 31st, 2008,
that would alter the accounts as presented for 2008.
OperationsTGS’ geoscientific data library is one of the
industry’s most comprehensive non-exclusive
resources, encompassing a wide range of geophysical,
geological, gravity magnetic and bathymetry data.
The following table summarizes our data inventory at
year end.
From Our Board
TGS-NOPEC Geophysical Company ASA (TGS) is a principal resource for global geoscientific data products
and services in the oil and gas industry. We specialize in the design, acquisition and processing of multi-client
seismic surveys worldwide and deliver advanced high performance seismic imaging and software solutions.
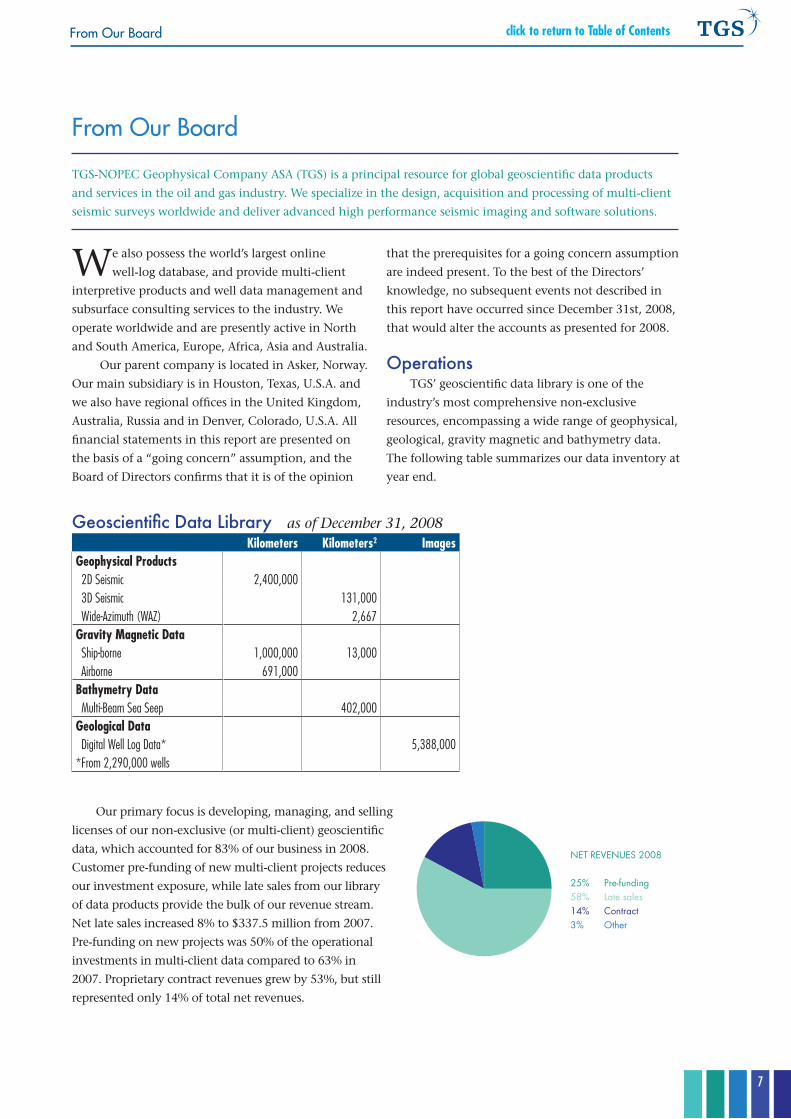
Geoscientific Data Library as of December 31, 2008Kilometers Kilometers2 Images
Geophysical Products 2D Seismic 2,400,000 3D Seismic 131,000 Wide-Azimuth (WAZ) 2,667Gravity Magnetic Data Ship-borne 1,000,000 13,000 Airborne 691,000Bathymetry Data Multi-Beam Sea Seep 402,000Geological Data Digital Well Log Data* 5,388,000 *From 2,290,000 wells
Our primary focus is developing, managing, and selling
licenses of our non-exclusive (or multi-client) geoscientific
data, which accounted for 83% of our business in 2008.
Customer pre-funding of new multi-client projects reduces
our investment exposure, while late sales from our library
of data products provide the bulk of our revenue stream.
Net late sales increased 8% to $337.5 million from 2007.
Pre-funding on new projects was 50% of the operational
investments in multi-client data compared to 63% in
2007. Proprietary contract revenues grew by 53%, but still
represented only 14% of total net revenues.
NET REVENUES 2008
25% Pre-funding58% Late sales 14% Contract 3% Other
NET REVENUES 2008
48% Western Hemisphere
52% Eastern Hemisphere
NET MULTI-CLIENT REVENUES 2008
50% 3D
38% 2D 12% Geological Products
NET BOOK VALUE OF SEISMIC LIBRARY BY YEAR
% Year 42% WIP 37% 2008 7% 2007 14% 2006 1% 2005
NET BOOK VALUE OFLIBRARY BY DATA TYPE
49% 3D
39% 2D
12% Well Logs & Integrated Products
0 100 200 300 400 500 600
2004
2005
2006
2007
2008
Net operating revenues Operating profit
0.0 0.2 0.4 0.6 0.8 1.0 1.2 1.4
2004
2005
2006
2007
2008
Earnings per share Earnings per share fully diluted
0100200300400500600700800900
1000
2004 2005 2006 2007Total assets Shareholders equity
NET REVENUES 2008
48% Western Hemisphere
52% Eastern Hemisphere
FIGURE 3
NET MULTI-CLIENT REVENUES 2008
50% 3D
38% 2D 12% Geological Products
FIGURE 4
NET BOOK VALUE OF SEISMIC LIBRARY BY YEAR
% Year 42% WIP 37% 2008 7% 2007 14% 2006 1% 2005
FIGURE 5
NET BOOK VALUE OFLIBRARY BY DATA TYPE
49% 3D
39 2D
12% Well Logs & Integrated Products
0
50
100
150
200
250
300
Investments in new projects Multi-client data purchased from third parties Prefunding
2004 2005 2006 2007 2008
61%
8%4%10%
2%
14%
42%37%
7%14%
1%0%0%10%20%30%40%50%60%70%
Pre-2005 2005 2006 2007 2008 WIP/MISC
050.0
100.0150.0200.0250.0300.0
2004 2005 2006 2007 2008 WIPTotal Project Investments Net Book Value
67%45%
31%22%
10%0%
Net Revenues in % of total Net Book Value in % of total
NET REVENUES 2008
25% Pre-funding58% Late sales 14% Contract 3% Other
2008
49% Norway 19% USA 18% Great Britain5% Luxembourg9% other
2008 Annual Report
8 TGS-NOPEC Geophysical Company
click to return to Table of Contents
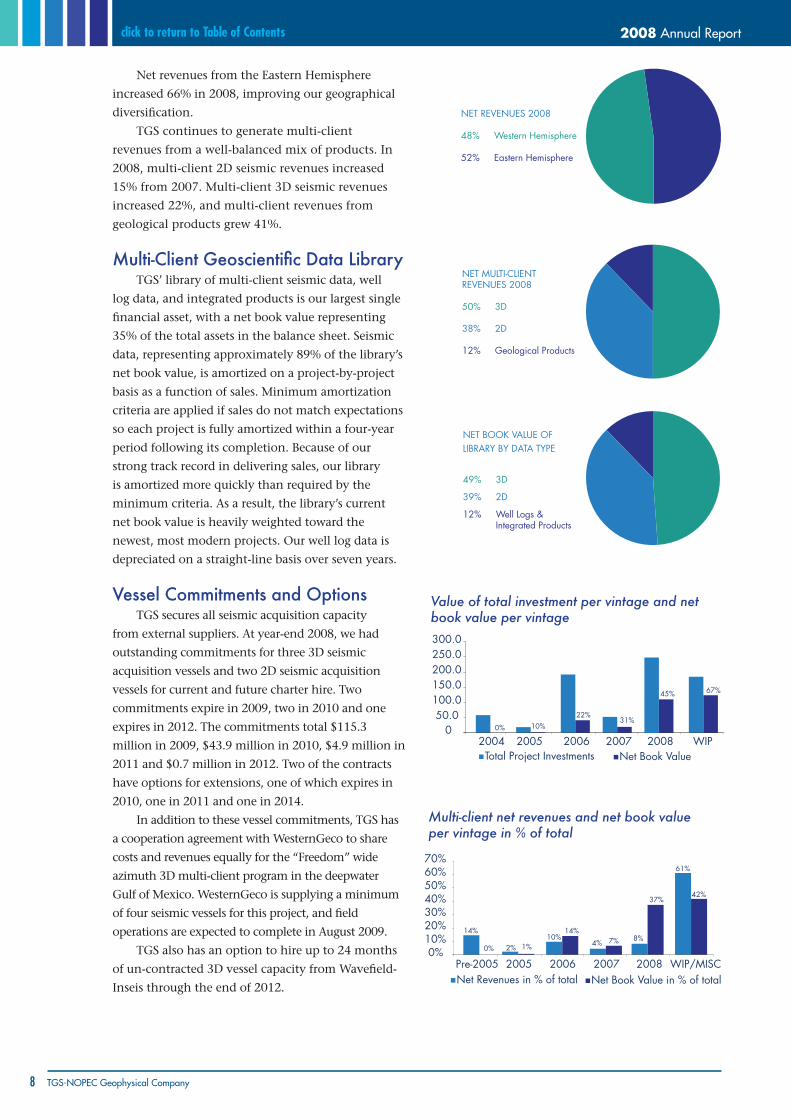
Net revenues from the Eastern Hemisphere
increased 66% in 2008, improving our geographical
diversification.
TGS continues to generate multi-client
revenues from a well-balanced mix of products. In
2008, multi-client 2D seismic revenues increased
15% from 2007. Multi-client 3D seismic revenues
increased 22%, and multi-client revenues from
geological products grew 41%.
Multi-Client Geoscientific Data LibraryTGS’ library of multi-client seismic data, well
log data, and integrated products is our largest single
financial asset, with a net book value representing
35% of the total assets in the balance sheet. Seismic
data, representing approximately 89% of the library’s
net book value, is amortized on a project-by-project
basis as a function of sales. Minimum amortization
criteria are applied if sales do not match expectations
so each project is fully amortized within a four-year
period following its completion. Because of our
strong track record in delivering sales, our library
is amortized more quickly than required by the
minimum criteria. As a result, the library’s current
net book value is heavily weighted toward the
newest, most modern projects. Our well log data is
depreciated on a straight-line basis over seven years.
Vessel Commitments and OptionsTGS secures all seismic acquisition capacity
from external suppliers. At year-end 2008, we had
outstanding commitments for three 3D seismic
acquisition vessels and two 2D seismic acquisition
vessels for current and future charter hire. Two
commitments expire in 2009, two in 2010 and one
expires in 2012. The commitments total $115.3
million in 2009, $43.9 million in 2010, $4.9 million in
2011 and $0.7 million in 2012. Two of the contracts
have options for extensions, one of which expires in
2010, one in 2011 and one in 2014.
In addition to these vessel commitments, TGS has
a cooperation agreement with WesternGeco to share
costs and revenues equally for the “Freedom” wide
azimuth 3D multi-client program in the deepwater
Gulf of Mexico. WesternGeco is supplying a minimum
of four seismic vessels for this project, and field
operations are expected to complete in August 2009.
TGS also has an option to hire up to 24 months
of un-contracted 3D vessel capacity from Wavefield-
Inseis through the end of 2012.
NET REVENUES 2008
25% Pre-funding58% Late sales 14% Contract 3% Other
NET REVENUES 2008
48% Western Hemisphere
52% Eastern Hemisphere
NET MULTI-CLIENT REVENUES 2008
50% 3D
38% 2D 12% Geological Products
NET BOOK VALUE OF SEISMIC LIBRARY BY YEAR
% Year 42% WIP 37% 2008 7% 2007 14% 2006 1% 2005
NET BOOK VALUE OFLIBRARY BY DATA TYPE
49% 3D
39% 2D
12% Well Logs & Integrated Products
0 100 200 300 400 500 600
2004
2005
2006
2007
2008
Net operating revenues Operating profit
0.0 0.2 0.4 0.6 0.8 1.0 1.2 1.4
2004
2005
2006
2007
2008
Earnings per share Earnings per share fully diluted
0100200300400500600700800900
1000
2004 2005 2006 2007Total assets Shareholders equity
NET REVENUES 2008
48% Western Hemisphere
52% Eastern Hemisphere
FIGURE 3
NET MULTI-CLIENT REVENUES 2008
50% 3D
38% 2D 12% Geological Products
FIGURE 4
NET BOOK VALUE OF SEISMIC LIBRARY BY YEAR
% Year 42% WIP 37% 2008 7% 2007 14% 2006 1% 2005
FIGURE 5
NET BOOK VALUE OFLIBRARY BY DATA TYPE
49% 3D
39 2D
12% Well Logs & Integrated Products
0
50
100
150
200
250
300
Investments in new projects Multi-client data purchased from third parties Prefunding
2004 2005 2006 2007 2008
61%
8%4%10%
2%
14%
42%37%
7%14%
1%0%0%10%20%30%40%50%60%70%
Pre-2005 2005 2006 2007 2008 WIP/MISC
050.0
100.0150.0200.0250.0300.0
2004 2005 2006 2007 2008 WIPTotal Project Investments Net Book Value
67%45%
31%22%
10%0%
Net Revenues in % of total Net Book Value in % of total
NET REVENUES 2008
25% Pre-funding58% Late sales 14% Contract 3% Other
2008
49% Norway 19% USA 18% Great Britain5% Luxembourg9% other
NET REVENUES 2008
25% Pre-funding58% Late sales 14% Contract 3% Other
NET REVENUES 2008
48% Western Hemisphere
52% Eastern Hemisphere
NET MULTI-CLIENT REVENUES 2008
50% 3D
38% 2D 12% Geological Products
NET BOOK VALUE OF SEISMIC LIBRARY BY YEAR
% Year 42% WIP 37% 2008 7% 2007 14% 2006 1% 2005
NET BOOK VALUE OFLIBRARY BY DATA TYPE
49% 3D
39% 2D
12% Well Logs & Integrated Products
0 100 200 300 400 500 600
2004
2005
2006
2007
2008
Net operating revenues Operating profit
0.0 0.2 0.4 0.6 0.8 1.0 1.2 1.4
2004
2005
2006
2007
2008
Earnings per share Earnings per share fully diluted
0100200300400500600700800900
1000
2004 2005 2006 2007Total assets Shareholders equity
NET REVENUES 2008
48% Western Hemisphere
52% Eastern Hemisphere
FIGURE 3
NET MULTI-CLIENT REVENUES 2008
50% 3D
38% 2D 12% Geological Products
FIGURE 4
NET BOOK VALUE OF SEISMIC LIBRARY BY YEAR
% Year 42% WIP 37% 2008 7% 2007 14% 2006 1% 2005
FIGURE 5
NET BOOK VALUE OFLIBRARY BY DATA TYPE
49% 3D
39 2D
12% Well Logs & Integrated Products
0
50
100
150
200
250
300
Investments in new projects Multi-client data purchased from third parties Prefunding
2004 2005 2006 2007 2008
61%
8%4%10%
2%
14%
42%37%
7%14%
1%0%0%10%20%30%40%50%60%70%
Pre-2005 2005 2006 2007 2008 WIP/MISC
050.0
100.0150.0200.0250.0300.0
2004 2005 2006 2007 2008 WIPTotal Project Investments Net Book Value
67%45%
31%22%
10%0%
Net Revenues in % of total Net Book Value in % of total
NET REVENUES 2008
25% Pre-funding58% Late sales 14% Contract 3% Other
2008
49% Norway 19% USA 18% Great Britain5% Luxembourg9% other
Multi-client net revenues and net book valueper vintage in % of total
NET REVENUES 2008
25% Pre-funding58% Late sales 14% Contract 3% Other
NET REVENUES 2008
48% Western Hemisphere
52% Eastern Hemisphere
NET MULTI-CLIENT REVENUES 2008
50% 3D
38% 2D 12% Geological Products
NET BOOK VALUE OF SEISMIC LIBRARY BY YEAR
% Year 42% WIP 37% 2008 7% 2007 14% 2006 1% 2005
NET BOOK VALUE OFLIBRARY BY DATA TYPE
49% 3D
39% 2D
12% Well Logs & Integrated Products
0 100 200 300 400 500 600
2004
2005
2006
2007
2008
Net operating revenues Operating profit
0.0 0.2 0.4 0.6 0.8 1.0 1.2 1.4
2004
2005
2006
2007
2008
Earnings per share Earnings per share fully diluted
0100200300400500600700800900
1000
2004 2005 2006 2007Total assets Shareholders equity
NET REVENUES 2008
48% Western Hemisphere
52% Eastern Hemisphere
FIGURE 3
NET MULTI-CLIENT REVENUES 2008
50% 3D
38% 2D 12% Geological Products
FIGURE 4
NET BOOK VALUE OF SEISMIC LIBRARY BY YEAR
% Year 42% WIP 37% 2008 7% 2007 14% 2006 1% 2005
FIGURE 5
NET BOOK VALUE OFLIBRARY BY DATA TYPE
49% 3D
39 2D
12% Well Logs & Integrated Products
0
50
100
150
200
250
300
Investments in new projects Multi-client data purchased from third parties Prefunding
2004 2005 2006 2007 2008
61%
8%4%10%
2%
14%
42%37%
7%14%
1%0%0%10%20%30%40%50%60%70%
Pre-2005 2005 2006 2007 2008 WIP/MISC
050.0
100.0150.0200.0250.0300.0
2004 2005 2006 2007 2008 WIPTotal Project Investments Net Book Value
67%45%
31%22%
10%0%
Net Revenues in % of total Net Book Value in % of total
NET REVENUES 2008
25% Pre-funding58% Late sales 14% Contract 3% Other
2008
49% Norway 19% USA 18% Great Britain5% Luxembourg9% other
Value of total investment per vintage and net book value per vintage
NET REVENUES 2008
25% Pre-funding58% Late sales 14% Contract 3% Other
NET REVENUES 2008
48% Western Hemisphere
52% Eastern Hemisphere
NET MULTI-CLIENT REVENUES 2008
50% 3D
38% 2D 12% Geological Products
NET BOOK VALUE OF SEISMIC LIBRARY BY YEAR
% Year 42% WIP 37% 2008 7% 2007 14% 2006 1% 2005
NET BOOK VALUE OFLIBRARY BY DATA TYPE
49% 3D
39% 2D
12% Well Logs & Integrated Products
0 100 200 300 400 500 600
2004
2005
2006
2007
2008
Net operating revenues Operating profit
0.0 0.2 0.4 0.6 0.8 1.0 1.2 1.4
2004
2005
2006
2007
2008
Earnings per share Earnings per share fully diluted
0100200300400500600700800900
1000
2004 2005 2006 2007Total assets Shareholders equity
NET REVENUES 2008
48% Western Hemisphere
52% Eastern Hemisphere
FIGURE 3
NET MULTI-CLIENT REVENUES 2008
50% 3D
38% 2D 12% Geological Products
FIGURE 4
NET BOOK VALUE OF SEISMIC LIBRARY BY YEAR
% Year 42% WIP 37% 2008 7% 2007 14% 2006 1% 2005
FIGURE 5
NET BOOK VALUE OFLIBRARY BY DATA TYPE
49% 3D
39 2D
12% Well Logs & Integrated Products
0
50
100
150
200
250
300
Investments in new projects Multi-client data purchased from third parties Prefunding
2004 2005 2006 2007 2008
61%
8%4%10%
2%
14%
42%37%
7%14%
1%0%0%10%20%30%40%50%60%70%
Pre-2005 2005 2006 2007 2008 WIP/MISC
050.0
100.0150.0200.0250.0300.0
2004 2005 2006 2007 2008 WIPTotal Project Investments Net Book Value
67%45%
31%22%
10%0%
Net Revenues in % of total Net Book Value in % of total
NET REVENUES 2008
25% Pre-funding58% Late sales 14% Contract 3% Other
2008
49% Norway 19% USA 18% Great Britain5% Luxembourg9% other
9
From Our Board click to return to Table of Contents
Results from OperationsIn 2008, TGS’ net revenues increased 29% to $582.4 million from $452.8 million in 2007.
Operating profit (EBIT) in 2008 was $269.0 million, up 21% from $ 222.0 million in 2007. Our operating
profit margin was 46% in 2008, down from 49% in 2007 due to a shifting revenue mix. The different mix
resulted in a higher average amortization rate and a higher contribution from proprietary contract revenues
that yielded lower margins than multi-client sales.
Our operating results fulfilled all expectations issued by TGS for 2008, even with the deterioration in
business conditions in the fourth quarter. For the year, we extended our longstanding record of industry
leadership in shareholder value as measured by the following key statistics.
Shareholder Value Metrics Multi-client net revenues / average net book value ratio: 1.74Operating Profit (EBIT) margin: 46%Pre-tax Return on Average Capital Employed (ROCE) 41%Shareholders Equity as % of Balance Sheet 69%
Merger and AcquisitionsOn June 2, 2008, TGS acquired substantially all of the assets of Center Line Data Corporation, a privately
held Denver-based provider of well log digitizing software and services. The purchase price was approximately
$5 million in cash and 30,600 shares of TGS. No new shares were issued related to this transaction.
The Center Line transaction is a strategic acquisition for our geologic products and services operations, as
it provides a proprietary well log digitizing software that allows us to greatly accelerate the creation of LAS files
from our comprehensive well log image inventory.
On November 9th, 2008, TGS and Wavefield-Inseis agreed to settle their previous dispute related to the
merger process between the two companies. Under terms of the settlement, Wavefield agreed to pay $12.5
million to TGS and we agreed to charter a 2D vessel from Wavefield at favorable rates for an 18-month period
beginning in April 2009. We also received an option to hire up to 24 months of un-contracted 3D vessel
capacity from Wavefield over the next four years at favorable rates. All claims either party have against the
other party, its shareholders, board members, employees or advisors were waived as a part of this settlement.
For a more detailed account, see Note 23 to the Consolidated Accounts.
Investments, Capital, Financing and DividendTGS is listed on the OBX List on the Oslo Stock Exchange, being among the 25 most liquid stocks in
Norway. We did not raise any new equity in the market during 2008. The Board does not anticipate issuing
any new equity during 2009, apart from issues of stock options to employees, unless necessary to finance the
acquisition of another company or a major business opportunity.
During 2008, in addition to merger and acquisition transactions, TGS invested $287.0 million in our
multi-client library and recorded $3.6 million in additional capital expenditures.
Also during 2008, we repurchased 1,679,700 of our shares for $15 million. Total holdings of treasury
shares were 4,054,900 on December 31st, 2008.
In conjunction with the planned merger with Wavefield-Inseis ASA (WAVE), we purchased 1,200,000
WAVE shares in February 2008 for $17.3 million to add to the 11,200,012 WAVE shares bought from 31 July
through 14 September 2007. As of 31 December, 2008 TGS held 10.1% of Wavefield-Inseis ASA. During 2008,
we recognized an unrealized loss of $75.1 million on this holding. All WAVE shares were sold to CGG-Veritas
in January 2009 at NOK 15.17 per share, which will result in a gain of $0.3 million to be recorded in the first
quarter of 2009.
We classify our holdings of Auction Rate Securities (ARS) as current financial investments available for sale.
The market for these securities is still distressed. As we have no need to liquidate these securities within the near
future at discounted prices, we have valued the ARS at year-end at fair value based on a third party valuation that
considered actual market trades as well as a discounted cash flow valuation method. This resulted in a write-down
amounting to $7.7 million recorded as a financial loss in 2008. A more detailed discussion on the ARS can be found
in Note 14 to the Consolidated Accounts.
2008 Annual Report
10 TGS-NOPEC Geophysical Company
click to return to Table of Contents
As of December 31, 2008, our total cash holdings amounted to $148.3 million compared to $116.4 million
at September 30, 2008 and $82.0 million at December 31, 2007.
In 2004, TGS issued a five-year 300 MNOK bond loan. The bond loan matures in May 2009. To eliminate
the currency risk associated with the NOK bond loan we entered into a derivative currency swap contract at
the same time that fixes the amount to be repaid at maturity at $43.7 million.
TGS has sufficient cash and financial capacity to finance our operations, repay our bond loan of $43.7
million in May 2009, and cover other known potential liabilities.
Because of the extremely cyclical nature of the oil services industry, TGS’ Board of Directors remains
convinced that the TGS Group‘s unique business model, our strong balance sheet and our strong cash position
are essential to our financial health, risk management and future growth. With this in mind, the Board will
continue to carefully evaluate investment opportunities for growth. In addition, the Board may consider using
cash reserves to repurchase shares in 2009. The Board does not propose to issue a dividend for 2008. As of
December 31st, 2008, the Parent Company’s free equity was NOK 806,185 (USD 115,187).
Risk Management and Internal ControlThe activities of TGS Group’s clients, exploration and production companies within the oil and gas
industry, typically vary with fluctuations in oil and gas commodity prices, or perceived expectations of change.
This impacts the TGS Group’s activity and profitability. A more thorough discussion of our risk management
and internal control processes is contained in Note 13 to the Consolidated Financial Statements and Section
10 of the Corporate Governance portion of this annual report.
TGS is constantly striving to maintain and improve our internal controls. Our primary business activity is
building our non-exclusive geoscientific data library, our largest financial asset, through multiple investments
in new data for sale to clients. We utilize custom investment proposal models and reporting tools in order to
assess and monitor the status and performance of our multi-client projects.
Organization, Working Environment and Equal OpportunityTGS’ Parent Company had 37 employees as of December 31st, 2008. The TGS Group had 531 employees
in the United States, 54 employees in Norway, 95 employees in the United Kingdom, 9 employees in Australia
and 7 employees in Russia, totaling 679 employees. The number of employees during 2008 averaged 660.
The Board considers the working environment in the TGS Group to be excellent. The Board and management
believe that employees of diversified gender, race, and nationality are treated equally within the TGS Group, and we
have not seen it necessary to take special measures regarding discrimination.
Health, Safety and Environmental IssuesTGS interacts with the external environment through the collection of seismic, gravity and magnetic data
and the operation of vessels and aircraft. TGS is dedicated to maintaining the environment in which we work
and providing a safe, healthy workplace for our employees and contractors through the active implementation
of comprehensive policies. Not only does TGS comply with mandated legislation and local regulations, but we
also work closely with industry associations in an effort to investigate ways to mitigate the impact of seismic
operations on marine fauna.
In 2008 TGS incurred one lost time incident in 4,283,680 man hours giving a lost time incident frequency
of 0.2 per million man hours. The 2008 rate for absence due to sickness was 0.3% compared to 1.0% in 2007.
Board Structure and Corporate Governance PolicyThe Board of Directors consists of six directors including the CEO, each serving a one-year term.
The Board’s Audit, Compensation, and Corporate Governance Committees are composed exclusively of
independent directors. No material transactions have occurred between the Company and its management,
directors, or shareholders.
The independent Nomination Committee, elected by the shareholders for a two-year term at the Annual
General Meeting on June 6th, 2007, consists of the following members: Nils B. Gulnes, Committee Chairman,
Jarl Ulvin, and Tor Himberg Larsen.
TGS emphasizes independence and integrity in all matters among the Board, management and the
shareholders.
11
From Our Board click to return to Table of Contents
It is the opinion of the Board of Directors that the Company complies with the Norwegian Code of
Practice for Corporate Governance published December 4th, 2007. The Board fully endorses the section
entitled “Corporate Governance” found on page 58 of this Annual Report.
Salary and Other CompensationTGS-NOPEC compensates its employees according to market conditions that are reviewed on an annual
basis by the Compensation Committee. Compensation includes base salary, insurance and retirement benefit
programs, a profit-sharing bonus plan based on performance and in certain cases a stock option plan. For
further details please refer to the paragraph “Salary and other compensation” in item 12 in the section
“Corporate Governance” and Note 7 to the Consolidated Accounts.
The directors, apart from the CEO, do not participate in any bonus, profit-sharing, or stock option plan.
Application of ProfitIt is proposed that the Parent Company’s net income be applied as follows:
Allocated to Other Equity NOK 199,969
Total NOK 199,969
Confirmation from the Board of Directors and CEOWe confirm, to the best of our knowledge, that the financial statements for the period January 1, 2008 to
31 December 31, 2008 have been prepared in accordance with current applicable accounting standards, and
give a true and fair view of the assets, liabilities, financial position and profit or loss of the entity and the group
taken as a whole. We also confirm that this report of the Board of Directors with references to the notes to the
accounts and the Corporate Governance section of the annual report includes a true and fair review of the
development and performance of the business and the position of the entity and the Group, together with a
description of the principal risks and uncertainties facing the Parent Company and the Group.
March 24th, 2009
Claus KampmannC h A I R M A N
henry h. hamilton IIIC E O / D I R E C T O R
Arne-Kristian Maeland, D I R E C T O R
Elisabeth harstadD I R E C T O R
Colette LewinerD I R E C T O R
Kathleen ArthurD I R E C T O R
2008 Annual Report
12 TGS-NOPEC Geophysical Company
click to return to Table of Contents
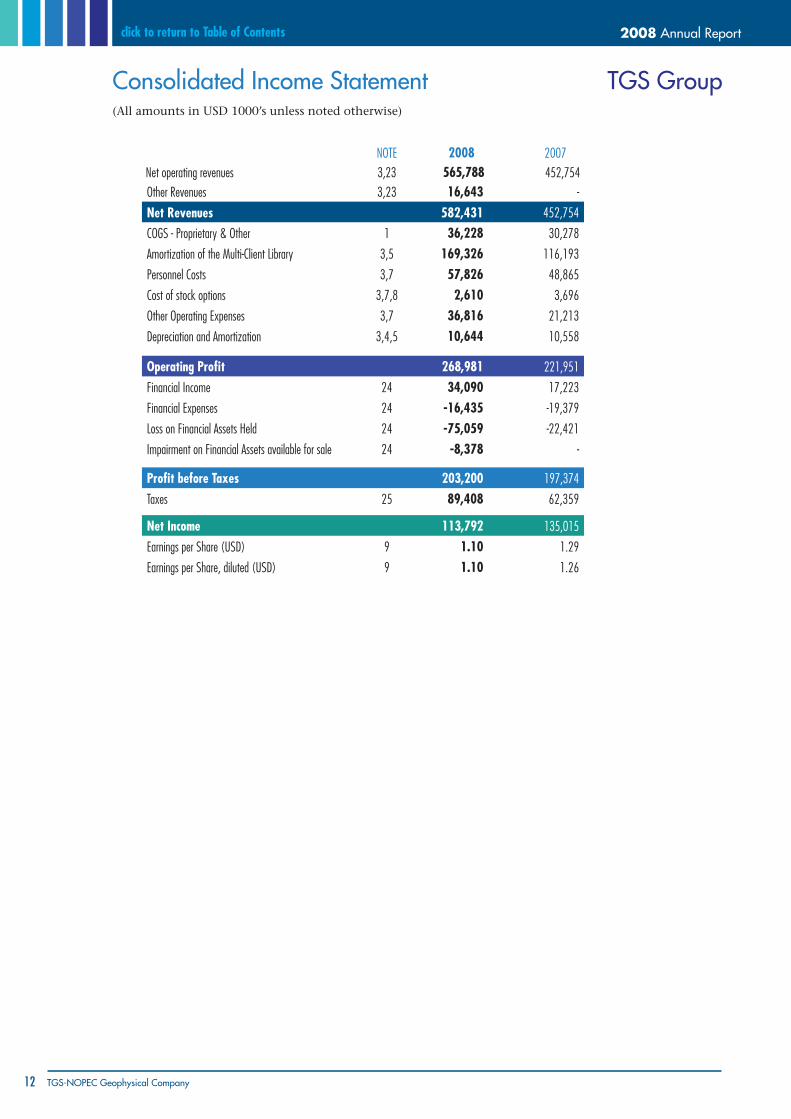
Consolidated Income Statement TGS Group (All amounts in USD 1000’s unless noted otherwise)
NOTE 2008 2007Net operating revenues 3,23 565,788 452,754Other Revenues 3,23 16,643 -
Net Revenues 582,431 452,754
COGS - Proprietary & Other 1 36,228 30,278
Amortization of the Multi-Client Library 3,5 169,326 116,193
Personnel Costs 3,7 57,826 48,865
Cost of stock options 3,7,8 2,610 3,696
Other Operating Expenses 3,7 36,816 21,213
Depreciation and Amortization 3,4,5 10,644 10,558
Operating Profit 268,981 221,951
Financial Income 24 34,090 17,223
Financial Expenses 24 -16,435 -19,379
Loss on Financial Assets held 24 -75,059 -22,421
Impairment on Financial Assets available for sale 24 -8,378 -
Profit before Taxes 203,200 197,374
Taxes 25 89,408 62,359
Net Income 113,792 135,015
Earnings per Share (USD) 9 1.10 1.29
Earnings per Share, diluted (USD) 9 1.10 1.26
13
click to return to Table of ContentsGroup Financials
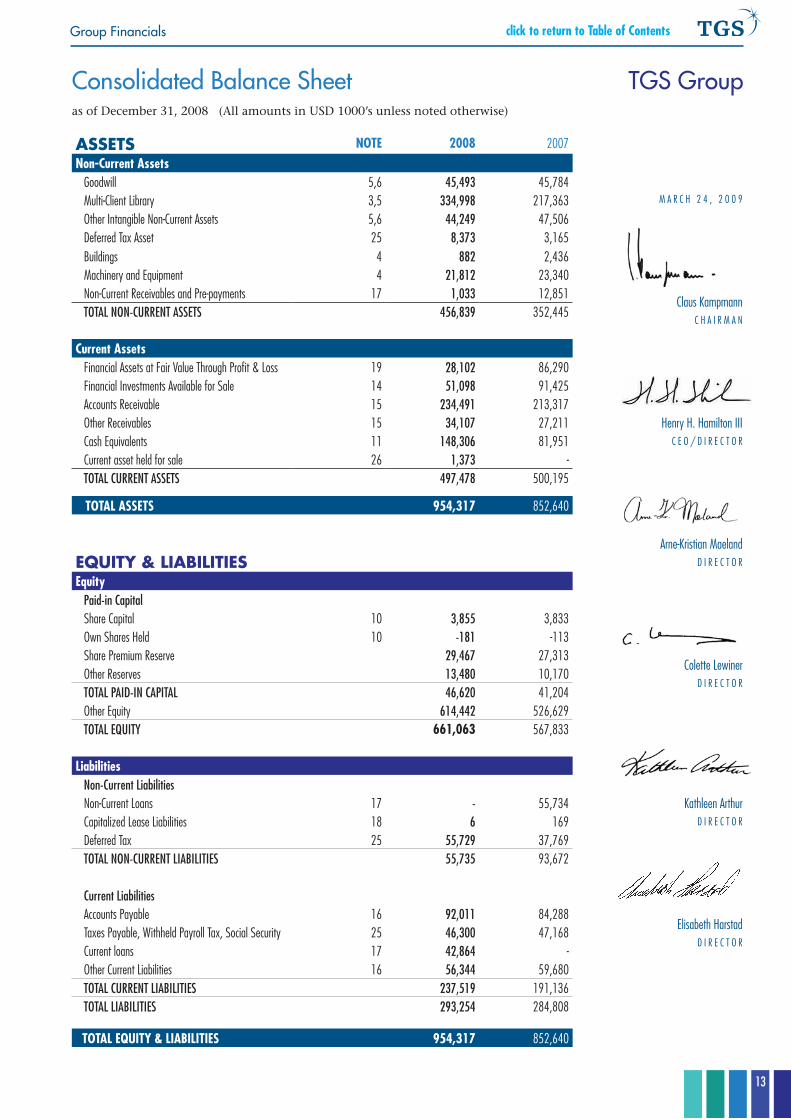
Consolidated Balance Sheet TGS Group
ASSETS NOTe 2008 2007Non-Current Assets Goodwill 5,6 45,493 45,784 Multi-Client Library 3,5 334,998 217,363 Other Intangible Non-Current Assets 5,6 44,249 47,506 Deferred Tax Asset 25 8,373 3,165 Buildings 4 882 2,436 Machinery and Equipment 4 21,812 23,340 Non-Current Receivables and Pre-payments 17 1,033 12,851 ToTal NoN-CurreNT asseTs 456,839 352,445
Current Assets Financial Assets at Fair Value Through Profit & Loss 19 28,102 86,290 Financial Investments Available for Sale 14 51,098 91,425 Accounts Receivable 15 234,491 213,317 Other Receivables 15 34,107 27,211 Cash Equivalents 11 148,306 81,951 Current asset held for sale 26 1,373 - ToTal CurreNT asseTs 497,478 500,195
TOTAL AsseTs 954,317 852,640
EquiTy & LiAbiLiTiESequity Paid-in Capital Share Capital 10 3,855 3,833 Own Shares held 10 -181 -113 Share Premium Reserve 29,467 27,313 Other Reserves 13,480 10,170 ToTal Paid-iN CaPiTal 46,620 41,204 Other Equity 614,442 526,629 ToTal equiTy 661,063 567,833
Liabilities Non-Current liabilities Non-Current Loans 17 - 55,734 Capitalized Lease Liabilities 18 6 169 Deferred Tax 25 55,729 37,769 ToTal NoN-CurreNT liabiliTies 55,735 93,672
Current liabilities Accounts Payable 16 92,011 84,288 Taxes Payable, Withheld Payroll Tax, Social Security 25 46,300 47,168 Current loans 17 42,864 - Other Current Liabilities 16 56,344 59,680 ToTal CurreNT liabiliTies 237,519 191,136 ToTal liabiliTies 293,254 284,808
TOTAL equITy & LIABILITIes 954,317 852,640
M A R C h 2 4 , 2 0 0 9
Claus KampmannC h A I R M A N
henry h. hamilton IIIC E O / D I R E C T O R
Arne-Kristian MaelandD I R E C T O R
Colette LewinerD I R E C T O R
Kathleen ArthurD I R E C T O R
Elisabeth harstadD I R E C T O R
as of December 31, 2008 (All amounts in USD 1000’s unless noted otherwise)
2008 Annual Report
14 TGS-NOPEC Geophysical Company
click to return to Table of Contents
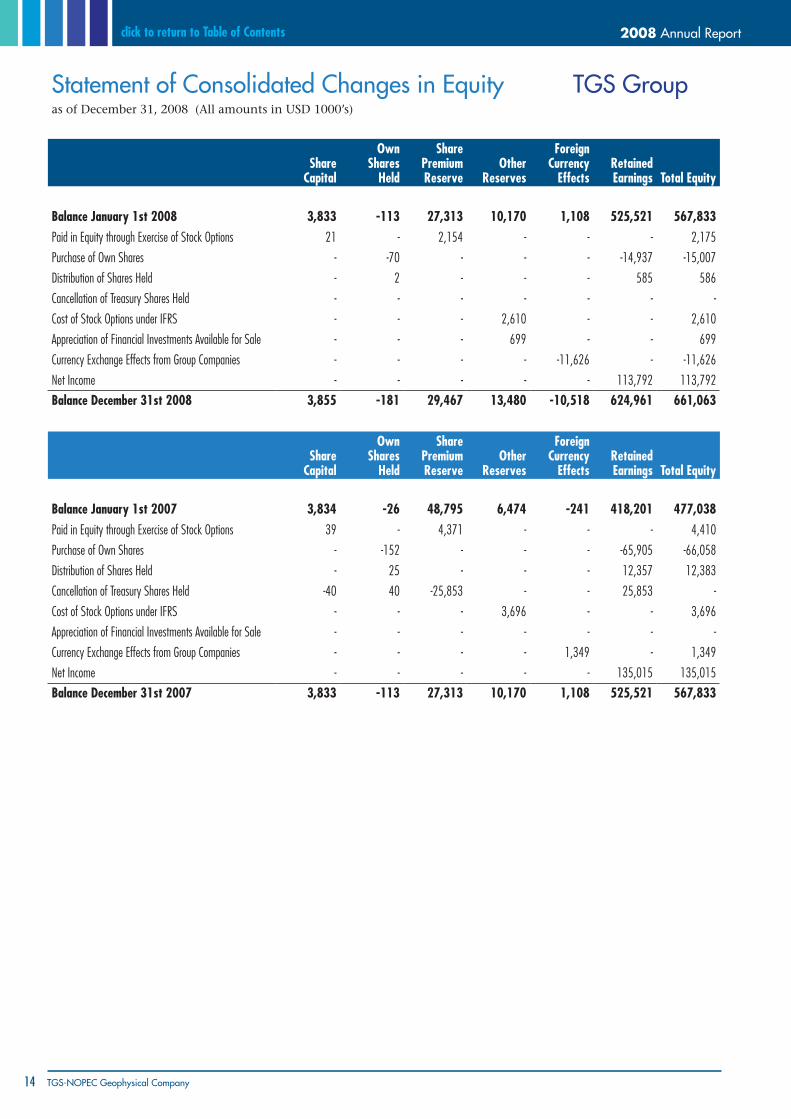
Statement of Consolidated Changes in Equity TGS Groupas of December 31, 2008 (All amounts in USD 1000’s)
share Capital
Own shares
Held
share Premium Reserve
Other Reserves
Foreign Currency
effectsRetained earnings Total equity
Balance January 1st 2008 3,833 -113 27,313 10,170 1,108 525,521 567,833 Paid in Equity through Exercise of Stock Options 21 - 2,154 - - - 2,175
Purchase of Own Shares - -70 - - - -14,937 -15,007
Distribution of Shares held - 2 - - - 585 586
Cancellation of Treasury Shares held - - - - - - -
Cost of Stock Options under IFRS - - - 2,610 - - 2,610
Appreciation of Financial Investments Available for Sale - - - 699 - - 699
Currency Exchange Effects from Group Companies - - - - -11,626 - -11,626
Net Income - - - - - 113,792 113,792 Balance December 31st 2008 3,855 -181 29,467 13,480 -10,518 624,961 661,063
share Capital
Own shares
Held
share Premium Reserve
Other Reserves
Foreign Currency
effectsRetained earnings Total equity
Balance January 1st 2007 3,834 -26 48,795 6,474 -241 418,201 477,038 Paid in Equity through Exercise of Stock Options 39 - 4,371 - - - 4,410
Purchase of Own Shares - -152 - - - -65,905 -66,058
Distribution of Shares held - 25 - - - 12,357 12,383
Cancellation of Treasury Shares held -40 40 -25,853 - - 25,853 -
Cost of Stock Options under IFRS - - - 3,696 - - 3,696
Appreciation of Financial Investments Available for Sale - - - - - - -
Currency Exchange Effects from Group Companies - - - - 1,349 - 1,349
Net Income - - - - - 135,015 135,015 Balance December 31st 2007 3,833 -113 27,313 10,170 1,108 525,521 567,833
15
click to return to Table of ContentsGroup Financials
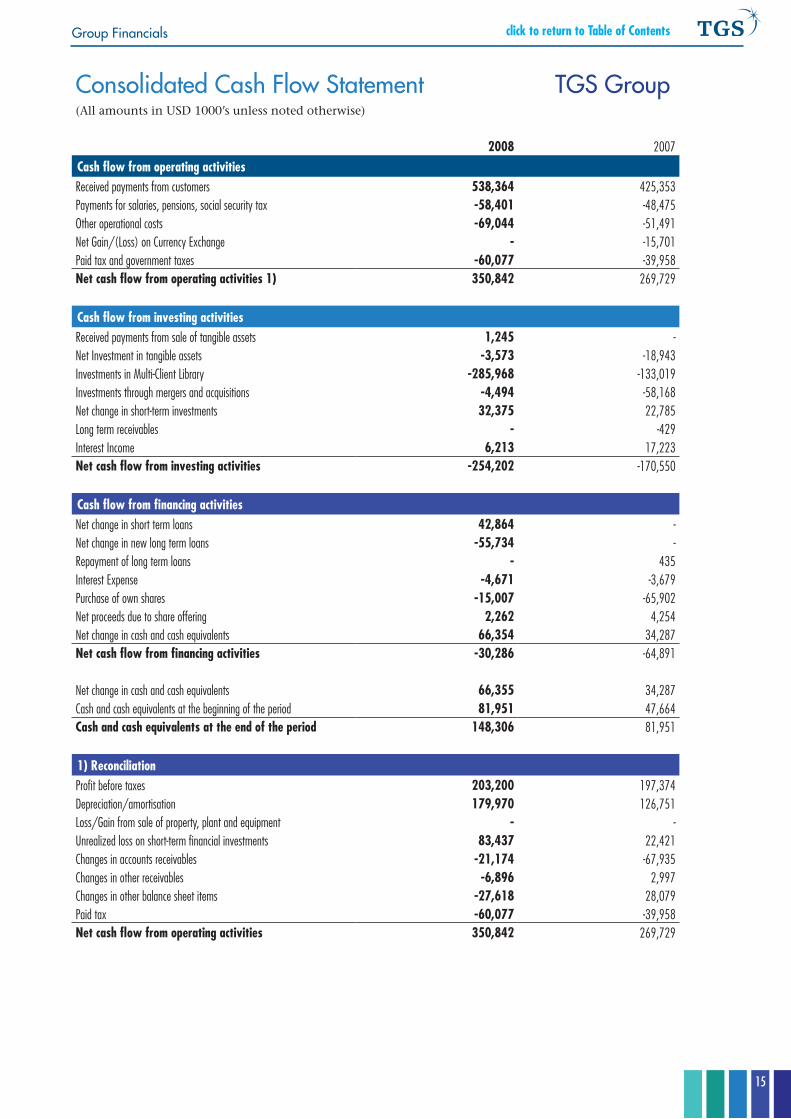
Consolidated Cash Flow Statement TGS Group(All amounts in USD 1000’s unless noted otherwise)
2008 2007Cash flow from operating activitiesReceived payments from customers 538,364 425,353 Payments for salaries, pensions, social security tax -58,401 -48,475 Other operational costs -69,044 -51,491 Net Gain/(Loss) on Currency Exchange - -15,701 Paid tax and government taxes -60,077 -39,958 Net cash flow from operating activities 1) 350,842 269,729
Cash flow from investing activitiesReceived payments from sale of tangible assets 1,245 - Net Investment in tangible assets -3,573 -18,943 Investments in Multi-Client Library -285,968 -133,019 Investments through mergers and acquisitions -4,494 -58,168 Net change in short-term investments 32,375 22,785 Long term receivables - -429 Interest Income 6,213 17,223 Net cash flow from investing activities -254,202 -170,550
Cash flow from financing activitiesNet change in short term loans 42,864 - Net change in new long term loans -55,734 - Repayment of long term loans - 435 Interest Expense -4,671 -3,679 Purchase of own shares -15,007 -65,902 Net proceeds due to share offering 2,262 4,254 Net change in cash and cash equivalents 66,354 34,287 Net cash flow from financing activities -30,286 -64,891
Net change in cash and cash equivalents 66,355 34,287Cash and cash equivalents at the beginning of the period 81,951 47,664 Cash and cash equivalents at the end of the period 148,306 81,951
1) ReconciliationProfit before taxes 203,200 197,374 Depreciation/amortisation 179,970 126,751 Loss/Gain from sale of property, plant and equipment - - Unrealized loss on short-term financial investments 83,437 22,421 Changes in accounts receivables -21,174 -67,935 Changes in other receivables -6,896 2,997 Changes in other balance sheet items -27,618 28,079 Paid tax -60,077 -39,958 Net cash flow from operating activities 350,842 269,729
2008 Annual Report
16 TGS-NOPEC Geophysical Company
click to return to Table of Contents
Notes to Group Financial Statements(All amounts in USD 1000s)
Note 1: General Accounting Policies
General informationTGS-NOPEC Geophysical Company ASA (the Company) is a public limited company incorporated in Norway on August 21,
1996. The address of its registered office is Hagaløkkveien 13, 1383 Asker, Norway. The Company is listed on the Oslo Stock Exchange.The TGS Group consolidated financial statements were authorized by the Board of Directors on March 24, 2009.
basis of PreparationThe consolidated financial statements of the Company and all its subsidiaries (the TGS Group), have been prepared
in accordance with International Financial Reporting Standards (IFRS) as adopted by the European Union (EU) in effect as of December 31, 2008 and consist of the Income Statement, the Balance Sheet, the Cash Flow Statement, the Statement of Changes in Equity, and Notes to the accounts.
The consolidated financial statements for the TGS Group have been prepared on a historical cost basis, except for derivative financial instruments and financial assets at fair value through profit and loss and financial investments available for sale that have been measured at fair value. The financial statements of the subsidiaries have been prepared for the same reporting year as the Parent Company, using consistent accounting policies. All intra-group balances, balance sheet transactions, and profit and loss transactions are eliminated in full. In applying the basic accounting principles and presenting transactions and other issues, a substance over form view is taken.
Management judgments apart from estimations that may have significant effect on the amounts recognized in the financial statements are as follows:
The TGS Group’s main asset is it’s multi-client library. The profitability of the future sales from the multi-client library, and also the holding value of the other intangible assets, as assessed by management, are affected over time by the changes in the general outlook for the TGS Group’s business, shift in competition, and geopolitical stability.
Principles of ConsolidationCompanies Consolidated – The consolidated financial statements include subsidiaries in which the Parent Company and its subsidiaries directly or indirectly have a controlling interest.
The consolidated financial statements show the TGS Group’s financial status, the result of the year’s activity, and cash flows as one financial entity. Short-term investments, which form part of a trading portfolio and are bought and sold on a continuous basis, are not consolidated unless the TGS Group has control over the entity. All the consolidated companies have applied the same accounting principles. Acquired subsidiaries are consolidated in the financial statements from the effective date the TGS Group obtains a controlling interest. Subsidiaries sold are consolidated in the financial statements until the effective date of the sale agreement. Material subsidiaries sold are presented as discontinued operations or disposal groups of assets and liabilities as of the date when the transaction is highly probable.
Successive share purchases in subsidiaries are consolidated using the fair value of the subsidiary’s assets and debt from the time at which TGS obtains a controlling interest. Further acquisitions of ownership will not change the assessment of assets and debt in consolidation; however, each transaction is treated separately for the purpose of determining net excess values and goodwill to be recognized on that transaction.Subsidiaries with Functional Currency Other Than USD – The balance sheets of subsidiaries with functional currency other than USD are translated into USD using the year-end exchange rate. The income statement items are translated at the average exchange rate for each quarter of the year. Exchange rate differences arising from the translation of financial statements of such subsidiaries are recorded as a separate component of shareholders’ equity. Variations from period to period in financial balance sheet items due to movements of the exchange rate in a currency other than the related functional currency are charged to the income statement under financial items. On disposal of a foreign entity, the deferred cumulative amount recognized in equity relating to that particular foreign operation is recognized in the income statement.
Change in Accounting Policy and DisclosuresThe accounting policies adopted are materially consistent with those of the previous financial year.
Presentation CurrencyThe TGS Group presents its consolidated financial reports in USD. Nearly 100% of the TGS Group’s revenues and the
majority of expenses are denominated in USD, and USD is the functional currency for most of the entities in the TGS Group.The Parent Company continues to report in NOK to Norwegian Authorities, and the Financial Statements of the Parent
Company in NOK are presented separately in this annual report.
Foreign Currency of Transactions and balancesNon-functional currency transactions are translated into the functional currency using the exchange rates
prevailing at the dates of the transactions. Monetary assets and liabilities in non-functional currencies are translated into functional currency at the balance sheet date exchange rates. Foreign exchange gains and losses resulting from the settlement of such transactions and from the translation of monetary assets and liabilities denominated in non-functional currencies are recognized in the income statement. Foreign exchange differences arising in respect of operating business items are included in operating profit in the appropriate income statement account, and those arising in respect of financial assets and liabilities are recorded as financial income and financial expense.
17
click to return to Table of ContentsNotes to Group Financial Statements (All amounts in USD 1000s)
Significant Accounting Judgments, Estimates, and AssumptionsIn the process of applying the TGS Group’s accounting principles, management is required to make estimates,
judgments, and assumptions that affect the amount reported in the consolidated financial statements and accompanying notes. Management bases its estimates and judgments on historical experience and on various other factors that are believed to be reasonable under the circumstances, the results of which will form the basis for making judgments on carrying values of assets and liabilities that are not readily apparent from other sources. Actual results may differ from these estimates. The key sources of judgment and estimation of uncertainties at the balance sheet date, that have a significant risk of causing a material adjustment to the carrying amounts of assets and liabilities within the next financial year, are discussed below.Future Sales Forecasts as Basis for Multi-Client Library Amortization – The TGS Group determines the amortization expense of the multi-client library based on the proportion of net book value versus estimated future revenue for each individual project. The underlying estimates that form the basis for the sales forecast depend on variables such as number of oil companies operating in the area that would be interested in the data, expectations regarding hydrocarbons in the sector, whether licenses to perform exploration in the sectors exist or will be given in the future, etc. Changes in these estimates may potentially affect the estimated amount of future sales and the amortization rate used materially. See also Note 13 concerning political risk.
The carrying amount of the multi-client library on December 31, 2008 and 2007 was USD 334,998 and USD 217,363 respectively.Impairment of Goodwill and Other Intangible Assets – The TGS Group determines whether goodwill and other intangible assets are impaired at least on an annual basis or when there are indicators that the carrying amount may not be recoverable. This requires an estimation of the value in use of the cash-generating units to which the goodwill is allocated. Estimating a value in use amount requires management to make an estimate of the expected future cash flows from the cash-generating unit and also to choose a suitable discount rate in order to calculate the present value of those cash flows. See Note 6.Deferred Tax Assets – Deferred tax assets are recognized for temporary deductible differences and carry forward tax losses to the extent that it is probable that taxable profit will be available against which the losses can be utilized. Significant management judgment is required to determine the amount of deferred tax assets that can be recognized, based upon the likely timing and level of future taxable profits together with future tax planning strategies. The carrying value of recognized tax assets on December 31, 2008 and 2007 was USD 8,373 and USD 91 respectively. Further details are included in Note 25.Acquisition of Subsidiaries – Assets and liabilities acquired in a business combination are to be recognized according to their fair values at the transaction date according to IFRS 3. This requires an estimation of the fair value of the individual assets, liabilities and contingent liabilities acquired, including estimating the expected future cash flow from the different revenue generating assets and a suitable discount rate in order to calculate the present value of those cash flows.Share-Based Payments – The TGS Group measures the cost of the stock option plans for employees by reference to the fair value of the equity instruments at the date at which they are granted. Estimating fair value requires an appropriate valuation model to value the grant of equity instruments. The value is dependent on the terms and conditions of the grant. This also requires determining the appropriate inputs to the valuation model including the expected life of the option, volatility and dividend yield, and making assumptions about them. See Note 8 for details.Revenue Recognition – The TGS Group recognizes revenues from pre-committed multi-client surveys based on percentage of completion at the balance sheet date. This requires management to estimate the level of completion of the various ongoing projects of the TGS Group at that date.
Principles of AssessmentRevenue Recognition – Revenue is recognized when it is probable that the economic benefits from a transaction will flow to the TGS Group and the revenue can be reliably measured. Revenue is measured at fair value of the consideration received, net of discounts and sales taxes or duty. The following describes the specific principles:
Work in Progress – Revenue from work in progress (unfinished projects) at the balance sheet date is recognized on a percentage of completion basis under binding contracts, normally measured according to the acquired and processed volume of data in relation to the estimated total size of the project. Sales made prior to a certain deadline for each project are classified as pre-funding and sales thereafter as late sales.Finished Data – Revenue is recognized for sales of finished data at the time of the transaction; i.e. when the client has gained access to the data under a binding agreement.Revenue Sharing – The TGS Group shares certain multi-client revenue with other companies. Operating revenue is presented net of the portion shared. Proprietary Contracts – Revenue from proprietary contracts for clients is recognized in the same way as work in progress (percentage of completion) according to the specific agreement.Interest Income – Interest income is recognized as interest accrues. Interest income is included in financial income in the income statement.
Cost of Goods Sold (COGS) – Proprietary and Other – Cost of goods sold includes only direct costs related to proprietary contract work, and costs related to delivery of seismic data.Multi-Client Library – The multi-client library includes completed and in-progress geophysical and geological data to be licensed on a non-exclusive basis to oil and gas exploration and production companies. The direct costs related to data acquisition and processing are capitalized and included in the inventory value. The library also includes the cost of data purchased from third parties. The library of finished multi-client seismic data and interpretations is presented at cost reduced by accumulated amortization.
Amortization Related to Sales of Seismic Data – When establishing amortization rates for the multi-client seismic library, management bases their views on estimated future sales for each individual survey. Estimates are adjusted over time with the development of the market.
2008 Annual Report
18 TGS-NOPEC Geophysical Company
click to return to Table of Contents
Amortization is recorded in line with how revenues are recognized for each project, in proportion to the remaining net book value versus the estimated future revenue from that project. The revenue estimates are frequently updated and fully reviewed every 12 months. For work in progress, the amortization is based on estimated total cost versus forecasted total revenues of the project.The consolidated amortization expense reported may vary considerably from one period to another depending on the actual mix of projects sold and changes to estimates.Forced Amortization Policy on Seismic Data – A minimum amortization criteria is applied: the maximum net book value of the individual survey one year after completion is 60% of original cost. The minimum cumulative amortization increases by 20% of cost each year thereafter, with the result that each survey is fully amortized in the balance sheet by the end of the fourth year following its completion.Amortization Policy on Well Logs – The library of multi-client well logs in A2D Technologies is presented at cost, reduced by accumulated amortization. Amortization is recorded as a straight-line amortization over seven years.Impairment Test Library – The library is annually, or when there are indicators that the book value may not be recoverable, tested for impairment either individually per project (seismic and interpretation reports) or at the cash generating unit level (well logs) as appropriate.
Business Combinations and Goodwill – Business combinations are accounted for using the purchase method. This involves recognizing identifiable assets (including previously unrecognized intangible assets) and liabilities (including contingent liabilities but excluding future restructuring) of the purchased business at fair value.
Goodwill acquired in a business combination is initially measured at cost being the excess value paid over the TGS Group’s interest in the net fair value of the acquiree’s identifiable assets, liabilities, and contingent liabilities. Following initial recognition, goodwill is measured at cost less any accumulated impairment losses. For the purpose of impairment testing, goodwill from a business combination is, from the acquisition date, allocated to the TGS Group’s cash generating units, or groups of cash generating units, that are expected to benefit from the synergies of the combination, irrespective of whether other assets or liabilities of the TGS Group are assigned to those units or groups of units. Each unit, or group of units to which the goodwill is allocated, represents the lowest level within the TGS Group at which the goodwill is monitored for internal management purposes.
Should part of an operation carrying goodwill be disposed of, the goodwill which is associated with the disposed operation is then included in the cost value of the operation when determining the gain or loss on the disposal. The goodwill disposed of in this circumstance is determined measured based on the relative values of the operation disposed of and the portion of the cash generating unit retained.
When subsidiaries are sold, the difference between the selling price and the net assets plus cumulative translation differences and unamortized goodwill is recognized in the income statement. Material subsidiaries sold are presented as discontinued operations or disposal groups of assets and liabilities as of the date when the transaction is highly probable.
Goodwill is reviewed for impairment annually or more frequently if events or changes in circumstances indicate that the carrying value may be impaired.
Impairment is determined for goodwill by assessing the recoverable amount of the cash-generating unit (or group of cash-generating units), to which the goodwill relates. Where the recoverable amount of the cash-generating unit (or group of cash-generating units) is less than the book value of the cash-generating unit (group of cash-generating units) to which goodwill has been allocated, an impairment loss is recognized. Impairment losses relating to goodwill cannot be reversed in future periods. Tangible Non-current Assets and Principles of Depreciation – Tangible non-current assets are presented at historical cost less accumulated depreciation and impairment charges. If an indication of impairment exists, an impairment test is performed. If the fair value of a tangible non-current asset is lower than book value, the asset will be written down to the higher of fair value less cost to sell and value in use. Depreciation is determined in light of the asset’s useful life, varying from 2 to 50 years.
Purchases which are expected to have a technical and economic life of at least two years are capitalized as tangible non-current assets. Depreciation begins when the assets are available for use. Tangible non-current assets held for sale are stated at the lower of book value and presumed market value and are not subject to depreciation.Exchange Rate Adjustments/Derivatives – Monetary assets, receivables and liabilities in non-USD currencies are translated at the exchange rate on the balance sheet date. Assets or liabilities for which derivative trade contracts have been entered into are recognized at the fair value of the derivative at the balance sheet date. Changes in fair value are recognized through profit and loss as the TGS Group does not apply hedge accounting.Software Development Costs – Software development costs that do not meet the criteria of capitalization are expensed as incurred. Borrowing Costs – Borrowing costs are recognized as an expense when incurred. Provisions – Provisions are established when the TGS Group has a current obligation (legal or constructive) as result of a past event, it is probable that the TGS Group will be required to settle the obligation, and a reliable estimate can be made of the amount of the obligation.
Income TaxesCurrent Income Tax – Current income tax assets and liabilities for the current and prior periods are measured at the amount expected to be recovered from or paid to the taxation authorities. The tax rates and tax laws used to compute the amount are those that are enacted or substantively enacted by the balance sheet date.Deferred Income Tax – Deferred income tax is provided using the liability method on temporary differences at the balance sheet date between the tax bases of assets and liabilities and their carrying amounts for financial reporting purposes.
Deferred income tax liabilities are recognized for all taxable temporary differences, except:1. where the deferred income tax liability arises from the initial recognition of goodwill or of an asset or liability in a
19
click to return to Table of ContentsNotes to Group Financial Statements (All amounts in USD 1000s)
transaction that is not a business combination and, at the time of the transaction, affects neither the accounting profit nor taxable profit or loss; and
2. in respect of taxable temporary differences associated with investments in subsidiaries, associates and interests in joint ventures, where the timing of the reversal of the temporary differences can be controlled and it is probable that the temporary differences will not reverse in the foreseeable future.
Deferred income tax assets are recognized for all deductible temporary differences, carry forward of unused tax credits and unused tax losses, to the extent that it is probable that taxable profit will be available against which the deductible temporary differences, and the carry forward of unused tax credits and unused tax losses can be utilized.
Deferred income tax assets and deferred income tax liabilities are offset, if a legally enforceable right exists to set off current income tax assets against current income tax liabilities and the deferred income taxes relate to the same taxable company and the same taxation authority. Deferred income tax assets and liabilities are measured at the tax rates that are expected to apply to the year when the asset is realized or the liability is settled, based on tax rates (and tax laws) that have been enacted or substantively enacted at the balance sheet date.
Deferred income tax relating to items recognized directly in equity is recognized in equity and not in the income statement.
The Parent Company pays its tax obligation in NOK and the fluctuations between the NOK and the USD impact currency exchange gains or losses and tax expense and financial items.
Employee Stock Option Scheme – Key employees of the TGS Group receive remuneration in the form of share-based payment whereby employees render services as consideration for equity instruments. The cost of equity-settled transactions with employees, for awards granted after November 7, 2002, is measured by reference to the fair value at the date on which they are granted. The fair value is determined by an external value using an appropriate pricing model.
The cost of equity-settled transactions is recognized, together with a corresponding increase in equity, over the period in which the performance and/or service conditions are fulfilled, ending on the date on which the relevant employees become fully entitled to the award (the vesting date). The cumulative expense recognized for equity-settled transactions at each reporting date until the vesting date reflects the extent to which the vesting period has expired and the TGS Group’s best estimate of the number of equity instruments that will ultimately vest. The income statement charge or credit for a period represents the movement in cumulative expense recognized at the beginning and end of that period. No expense is recognized for awards that do not ultimately vest, except for awards where vesting is conditional upon a market condition, which are treated as vesting irrespective of whether or not the market condition is satisfied, provided that all other performance conditions are satisfied. Financial Investments and Other Financial Instruments – The TGS Group classifies its financial investments in the following categories: financial assets at fair value through profit or loss, loans and receivables, held-to-maturity investments, and available-for-sale financial assets. Currently, the TGS Group has no held-to maturity investments. The classification depends on the purpose for which the investments were acquired. Management determines the classification at initial recognition and re-evaluates this designation at every reporting date. When financial assets are recognized initially, they are measured at fair value, plus, for all financial investments other than those at fair value through profit or loss, directly attributable transaction costs. The purchases and sales of financial assets are recognized at the date of trade.
Financial Assets at Fair Value Through Profit and Loss – Financial assets at fair value through profit and loss are derivative financial instruments and shares held for trading that are quoted in an active market with fair value changes recognized through the profit and loss statement.Outstanding Loans and Receivables – Loans and receivables are non-derivative financial assets with fixed or determinable payments that are not quoted in an active market. After initial measurement, loans and receivables are subsequently carried at amortized cost using the effective interest method less any allowance for impairment. Amortized cost is calculated taking into account any discount or premium on payment and includes fees that are an integral part of the effective interest rate and transaction costs. Gains and losses are recognized in the income statement when the loans and receivables are de-recognized or impaired, the same as through the amortization process.Available-for-Sale Financial Assets – Available-for-sale financial assets are those non-derivative financial assets that are designated as available-for-sale or are not classified in any other category. After initial measurement, the available-for-sale financial assets held are measured at fair value with unrealized gains or losses (save for impairments) being recognized directly to equity. When the asset is finally disposed of, the total gain or loss, de-recognizing amounts previously recorded in equity, is recognized in the income statement. Any impairment of these financial assets is booked in profit and loss.
The fair value of financial investments that are actively traded in organized financial markets is determined by reference to quoted market bid prices at the close of business on the balance sheet date. For investments where there is no active market, fair value is determined applying commonly used valuation techniques.Financial Liabilities – Financial liabilities are classified as financial liabilities at fair value through profit or loss and other financial liabilities. The Company has not used the fair value option that exists in IAS 39, to upon initial recognition designating a financial liability as an instrument at fair value through profit and loss.
The Company’s financial liabilities include trade and other payables and loans.After initial recognition, interest bearing loans are subsequently measured at amortized cost using the effective
interest method.De-Recognition of Financial Assets and Liabilities – A financial asset is de-recognized when:
• the rights to receive cash flows from the asset have expired;• the TGS Group retains the right to receive cash flows from the asset, but has assumed an obligation to pay them in
full without material delay to a third party under a pass through arrangement; or • the TGS Group has transferred its rights to receive cash flows from the asset and either (a) has transferred
substantially all the risks and rewards of the asset, or (b) has neither transferred nor retained substantially all the risks and rewards of the asset, but has transferred control of the asset.
2008 Annual Report
20 TGS-NOPEC Geophysical Company
click to return to Table of Contents
Where the TGS Group has transferred its rights to receive cash flows from an asset but has neither transferred nor retained substantially all the risks and rewards of the asset nor transferred control of the asset, the asset is recognized to the extent of the TGS Group’s continuing involvement in the asset. Continuing involvement that takes the form of a guarantee over the transferred asset is measured at the lower of the original carrying amount of the asset and the maximum amount of consideration that the TGS Group could be required to repay.
Where continuing involvement takes the form of a written and/or purchased option on the transferred asset, the extent of the TGS Group’s continuing involvement is the amount of the transferred asset that the TGS Group may repurchase, except that in the case of a written put option on an asset measured at fair value, the extent of the TGS Group’s continuing involvement is limited to the lower of the fair value of the transferred asset and the option exercise price.
A financial liability is de-recognized when the obligation under the liability is discharged, cancelled, or expires. When an existing financial liability is replaced by another from the same lender on substantially different terms, or the terms of an existing liability are substantially modified, such an exchange or modification is treated as a de-recognition of the original liability and the recognition of a new liability, and the difference in the respective carrying amounts is recognized in the income statement.Non-Current Assets Held for Sale – Non-current assets are classified as held for sale according to IFRS 5 if their book value will be recovered through a sales transaction rather than through continuing use. This condition is regarded as met only when the sale is highly probable within 12 months, and the asset is available for immediate sale in its present condition. Management must be committed to the sale, which should be expected to qualify for recognition as a completed sale within one year from the date of classification.
Non-current assets classified as held for sale are measured at the lower of the assets’ previous book value and fair value less cost to sell. Depreciation of the assets ceases once this classification has been made.Pensions – The TGS Group operates defined-contribution plans in Norway, UK, and in the USA (401k), and covers superannuation in Australia. Contributions are charged to the income statement as they become payable.Leases – Leases are classified as finance leases whenever the terms of the lease transfer substantially all the risks and rewards of ownership to the lessee. All other leases are classified as operating leases. The evaluation is based on the substance of the transaction at the inception date of whether the fulfillment of the arrangement is dependent on the use of a specific asset or assets or the arrangement conveys a right to use the asset.
Finance leases are recorded as assets and liabilities, and lease payments are apportioned between the finance charges and reduction of the lease liability so as to achieve a constant rate of interest on the remaining balance of the liability. Capitalized leased assets are depreciated over the shorter of the estimated useful life of the asset and the lease term if there is no reasonable certainty that the TGS Group will obtain ownership by the end of the lease term.
Operating lease payments are recognized as an expense in the income statement on a straight line basis over the lease term. Contingent rents are recognized as revenue in the period in which they are earned or as expense in the period in which they are incurred. Cash and Cash Equivalents – Cash and cash equivalents in the balance sheet comprise cash in bank accounts and on hand and short-term deposits with an original maturity of three months or less.Accounts Receivable and Other Receivables – Receivables are measured at cost less any amounts expected to be uncollectible.Treasury Shares – TGS-NOPEC Geophysical Company ASA’s shareholding of treasury shares is recorded using the par value method, where the total par value of the shares acquired is debited the treasury stock account, reducing total equity, and the difference between the purchase price and par value is debited other equity. Gains or losses on sales of treasury shares are treated as equity transactions and booked directly to equity.Cash Flow Statement – The cash flow statement is compiled using the direct method.
iFRS and iFRiC not yet effectiveThe following standards and amendments to existing standards have been published and are mandatory for the
group’s accounting periods beginning on or after 1 January 2009 or later periods, but the group has not adopted them yet:• IAS 1 (Revised), ‘Presentation of financial statements’ (effective from 1 January 2009). The revised standard will
prohibit the presentation of items of income and expenses (that is, ‘non-owner changes in equity’) in the statement of changes in equity, requiring ‘non-owner changes in equity’ to be presented separately from owner changes in equity. All non-owner changes in equity will be required to be shown in a performance statement, but entities can choose whether to present one performance statement (the statement of comprehensive income) or two statements (the income statement and statement of comprehensive income). Where entities restate or reclassify comparative information, they will be required to present a restated balance sheet as at the beginning comparative period in addition to the current requirement to present balance sheets at the end of the current period and comparative period. The group will apply IAS 1 (Revised) from 1 January 2009.
• IFRS 3 (Revised), ‘Business combinations’ (effective from 1 July 2009). The revised standard continues to apply the acquisition method to business combinations, with some significant changes. For example, all payments to purchase a business are to be recorded at fair value at the acquisition date, with contingent payments classified as debt subsequently re-measured through the income statement. There is a choice on an acquisition-by-acquisition basis to measure the non-controlling interest in the acquired company either at fair vale or at the non-controlling interest’s proportionate share of the acquirer’s net assets. All acquisition-related costs should be expensed. The group will apply IFRS 3 (Revised) prospectively to all business combinations from 1 January 2010.
• IFRS 5 (Amendment), ‘Non-current assets held-for-sale and discontinued operations’ (and consequential amendment to IFRS 1, ‘First-time adoption’) (effective from 1 January 2009). The amendment is part of the IASB’s annual improvements project published in May 2008. The amendment clarifies that all of a subsidiary’s assets and liabilities are classified as held for sale if a partial disposal sale plan results in loss of control. Relevant disclosure should be
21
click to return to Table of ContentsNotes to Group Financial Statements (All amounts in USD 1000s)
made for this subsidiary if the definition of a discontinued operation is met. A consequential amendment to IFRS 1 states that these amendments are applied prospectively from the date of transition to IFRSs. The group will apply the IFRS 5 (Amendment) prospectively to all partial disposals of subsidiaries from 1 January 2009.
• IFRS 8 ‘Operating segments‘ replaces IAS 14 ‘Segment reporting.’ The standard requires that a management reporting approach is used in identifying the segments. Generally information shall be of the same kind as what is used by the chief operating decision makers to make decisions about resources to be allocated to the segment and assess its performance. The group will apply IFRS 8 from January 1, 2009. It is not expected to have an material impact on the group’s financial reporting.
• IAS 36 (Amendment), ‘Impairment of assets’ (effective from 1 January 2009). The amendment is part of the IASB’s annual improvements project published in May 2008. Where fair value less costs to sell is calculated on the basis of discounted cash flows, disclosures equivalent to those for value-in-use calculation should be made. The group will apply the IAS 28 (Amendment) and provide the required disclosure where applicable for impairment tests from 1 January 2009.
• IAS 38 (Amendment), ‘Intangible assets’ (effective from 1 January 2009). The amendment is part of the IASB’s annual improvements project published in May 2008. A prepayment may only be recognized in the event that payment has been made in advance of obtaining right of access to goods or receipt of services. The group will apply the IAS 38 (Amendment) from 1 January, 2009.
• IAS 39 (Amendment) Financial instruments: Recognition and measurement (effective from 1 January 2009). The amendment is part of the IASB’s annual improvements project published in May 2008.
– This amendment clarifies that it is possible for there to be movements into and out of the fair value through profit or loss category where a derivative commences or ceases to qualify as a hedging instrument in cash flow or net investment hedge.
– The definition of financial asset or financial liability at fair value through profit or loss as it relates to items that are held for trading is also amended. This clarifies that a financial asset or liability that is part of a portfolio of financial instruments managed together with evidence of an actual recent pattern of short-term profit taking is included in such a portfolio on initial recognition.
– The current guidance on designating and documenting hedges states that a hedging instrument needs to involve a party external to the reporting entity and cites a segment as an example of a reporting entity. This means that in order for hedge accounting to be applied at segment level, the requirements for hedge accounting are currently required to be met by the applicable segment. The amendment removes the example of a segment so that the guidance is consistent with IFRS 8, ‘Operating segments’, which requires disclosure for segments to be based on information reported to the chief operating decision-maker.
– When re-measuring the carrying amount of a debt instrument on cessation of fair value hedge accounting, the amendment clarifies that a revised effective interest rate (calculated at the date fair value hedge accounting ceases) are used.
The group will apply the IAS 39 (Amendment) from 1 January 2009. It is not expected to have an impact on the group’s income statement.
• IAS 1 (Amendment), ‘Presentation of financial statements’ (effective from 1 January 2009). The amendment is part of the IASB’s annual improvements project published in May 2008. The amendment clarifies that some rather than all financial assets and liabilities classified as held for trading in accordance with IAS 39, ‘Financial instruments: Recognition and measurement’ are examples of current assets and liabilities respectively. The group will apply the IAS 39 (Amendment) from 1 January 2009. It is not expected to have an impact on the group’s financial statements.
• There are a number of minor amendments to IFRS 7, ‘Financial instruments: Disclosures’, IAS 8, ‘Accounting policies, changes in accounting estimates and errors’, IAS 10, ‘Events after the reporting period’, IAS 18, ‘Revenue’ and IAS 34, ‘Interim financial reporting’, which are part of the IASB’s annual improvements project published in May 2008 (not addressed above). These amendments are unlikely to have an impact on the group’s accounts and have therefore not been analyzed in detail.
• IAS 23 (Amendment), ‘Borrowing costs’ (effective from 1 January 2009). The amendment requires an entity to capitalize borrowing costs directly attributable to the acquisition, construction or production of a qualifying asset (one that takes a substantial period of time to get ready for use or sale) as part of the cost of that asset. The option of immediately expensing those borrowing costs will be removed. The group will apply IAS 23 (Amendment) retrospectively from 1 January 2009 The effect is expected to be immaterial for the group.
• IAS 27 (Revised), ‘Consolidated and separate financial statements’, (effective from 1 January 2009). The revised standard requires the effects of all transactions with non-controlling interests to be recorded in equity if there is no change in control and these transactions will no longer result in goodwill or gains and losses. The standard also specifies the accounting when control is lost. Any remaining interest in the entity is re-measured to fair value, and a gain or loss is recognized in profit or loss. The group will apply IAS 27 (Revised) prospectively to transactions with non-controlling interests from 1 January 2009.
• IFRIC 11, ‘IFRS 2 – Group and treasury share transactions. The Group will apply IFRIC 11 prospectively from 1 January 2009.The effect is expected to be immaterial.
• IFRIC 12, ‘Service concession arrangements. The Group will apply IFRIC 12 prospectively from 1 January 2009. The effect is not expected to be relevant.
• IFRIC 13, ‘Customer loyalty programmes’. The Group will apply IFRIC 13 prospectively from 1 January 2009, but is not expected to be relevant for the Group.
• IFRIC 14, ‘Defined benefit pension plans’ The Group will apply IFRIC 13 prospectively from 1 January 2009, but is not expected to be relevant for the Group.
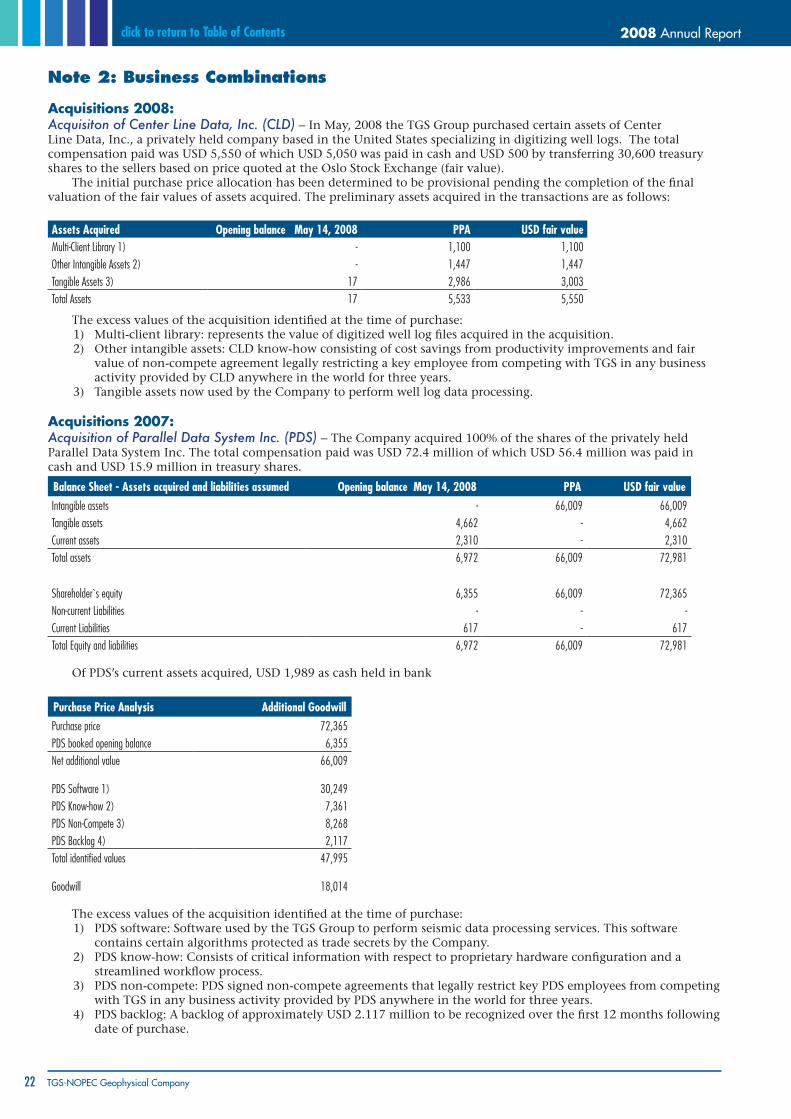
2008 Annual Report
22 TGS-NOPEC Geophysical Company
click to return to Table of Contents
Note 2: Business Combinations
Acquisitions 2008: Acquisiton of Center Line Data, Inc. (CLD) – In May, 2008 the TGS Group purchased certain assets of Center Line Data, Inc., a privately held company based in the United States specializing in digitizing well logs. The total compensation paid was USD 5,550 of which USD 5,050 was paid in cash and USD 500 by transferring 30,600 treasury shares to the sellers based on price quoted at the Oslo Stock Exchange (fair value).
The initial purchase price allocation has been determined to be provisional pending the completion of the final valuation of the fair values of assets acquired. The preliminary assets acquired in the transactions are as follows:
Assets Acquired Opening balance May 14, 2008 PPA usD fair valueMulti-Client Library 1) - 1,100 1,100Other Intangible Assets 2) - 1,447 1,447Tangible Assets 3) 17 2,986 3,003Total Assets 17 5,533 5,550
The excess values of the acquisition identified at the time of purchase:1) Multi-client library: represents the value of digitized well log files acquired in the acquisition.2) Other intangible assets: CLD know-how consisting of cost savings from productivity improvements and fair
value of non-compete agreement legally restricting a key employee from competing with TGS in any business activity provided by CLD anywhere in the world for three years.
3) Tangible assets now used by the Company to perform well log data processing.
Acquisitions 2007: Acquisition of Parallel Data System Inc. (PDS) – The Company acquired 100% of the shares of the privately held Parallel Data System Inc. The total compensation paid was USD 72.4 million of which USD 56.4 million was paid in cash and USD 15.9 million in treasury shares.
Balance sheet - Assets acquired and liabilities assumed Opening balance May 14, 2008 PPA usD fair valueIntangible assets - 66,009 66,009Tangible assets 4,662 - 4,662Current assets 2,310 - 2,310Total assets 6,972 66,009 72,981
Shareholder`s equity 6,355 66,009 72,365Non-current Liabilities - - -Current Liabilities 617 - 617Total Equity and liabilities 6,972 66,009 72,981
Of PDS’s current assets acquired, USD 1,989 as cash held in bank
Purchase Price Analysis Additional GoodwillPurchase price 72,365PDS booked opening balance 6,355Net additional value 66,009
PDS Software 1) 30,249 PDS Know-how 2) 7,361 PDS Non-Compete 3) 8,268 PDS Backlog 4) 2,117 Total identified values 47,995
Goodwill 18,014
The excess values of the acquisition identified at the time of purchase:1) PDS software: Software used by the TGS Group to perform seismic data processing services. This software
contains certain algorithms protected as trade secrets by the Company.2) PDS know-how: Consists of critical information with respect to proprietary hardware configuration and a
streamlined workflow process.3) PDS non-compete: PDS signed non-compete agreements that legally restrict key PDS employees from competing
with TGS in any business activity provided by PDS anywhere in the world for three years.4) PDS backlog: A backlog of approximately USD 2.117 million to be recognized over the first 12 months following
date of purchase.
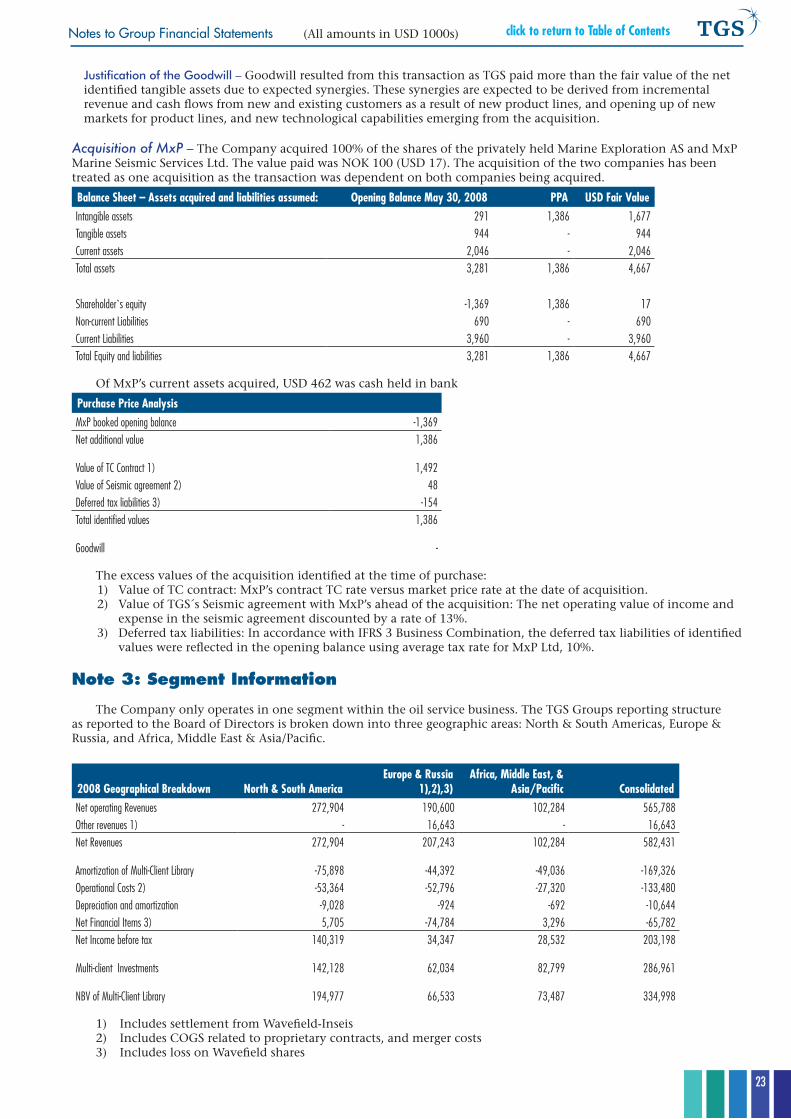
23
click to return to Table of Contents
Justification of the Goodwill – Goodwill resulted from this transaction as TGS paid more than the fair value of the net identified tangible assets due to expected synergies. These synergies are expected to be derived from incremental revenue and cash flows from new and existing customers as a result of new product lines, and opening up of new markets for product lines, and new technological capabilities emerging from the acquisition.
Acquisition of MxP – The Company acquired 100% of the shares of the privately held Marine Exploration AS and MxP Marine Seismic Services Ltd. The value paid was NOK 100 (USD 17). The acquisition of the two companies has been treated as one acquisition as the transaction was dependent on both companies being acquired.
Balance sheet – Assets acquired and liabilities assumed: Opening Balance May 30, 2008 PPA usD Fair ValueIntangible assets 291 1,386 1,677Tangible assets 944 - 944Current assets 2,046 - 2,046Total assets 3,281 1,386 4,667
Shareholder`s equity -1,369 1,386 17Non-current Liabilities 690 - 690Current Liabilities 3,960 - 3,960Total Equity and liabilities 3,281 1,386 4,667
Of MxP’s current assets acquired, USD 462 was cash held in bank
Purchase Price AnalysisMxP booked opening balance -1,369Net additional value 1,386
Value of TC Contract 1) 1,492Value of Seismic agreement 2) 48Deferred tax liabilities 3) -154Total identified values 1,386
Goodwill -
The excess values of the acquisition identified at the time of purchase:1) Value of TC contract: MxP’s contract TC rate versus market price rate at the date of acquisition.2) Value of TGS´s Seismic agreement with MxP’s ahead of the acquisition: The net operating value of income and
expense in the seismic agreement discounted by a rate of 13%.3) Deferred tax liabilities: In accordance with IFRS 3 Business Combination, the deferred tax liabilities of identified
values were reflected in the opening balance using average tax rate for MxP Ltd, 10%.
Note 3: Segment Information
The Company only operates in one segment within the oil service business. The TGS Groups reporting structure as reported to the Board of Directors is broken down into three geographic areas: North & South Americas, Europe & Russia, and Africa, Middle East & Asia/Pacific.
2008 Geographical Breakdown North & south Americaeurope & Russia
1),2),3)Africa, Middle east, &
Asia/Pacific ConsolidatedNet operating Revenues 272,904 190,600 102,284 565,788Other revenues 1) - 16,643 - 16,643Net Revenues 272,904 207,243 102,284 582,431
Amortization of Multi-Client Library -75,898 -44,392 -49,036 -169,326Operational Costs 2) -53,364 -52,796 -27,320 -133,480Depreciation and amortization -9,028 -924 -692 -10,644Net Financial Items 3) 5,705 -74,784 3,296 -65,782Net Income before tax 140,319 34,347 28,532 203,198
Multi-client Investments 142,128 62,034 82,799 286,961
NBV of Multi-Client Library 194,977 66,533 73,487 334,998
1) Includes settlement from Wavefield-Inseis2) Includes COGS related to proprietary contracts, and merger costs3) Includes loss on Wavefield shares
Notes to Group Financial Statements (All amounts in USD 1000s)
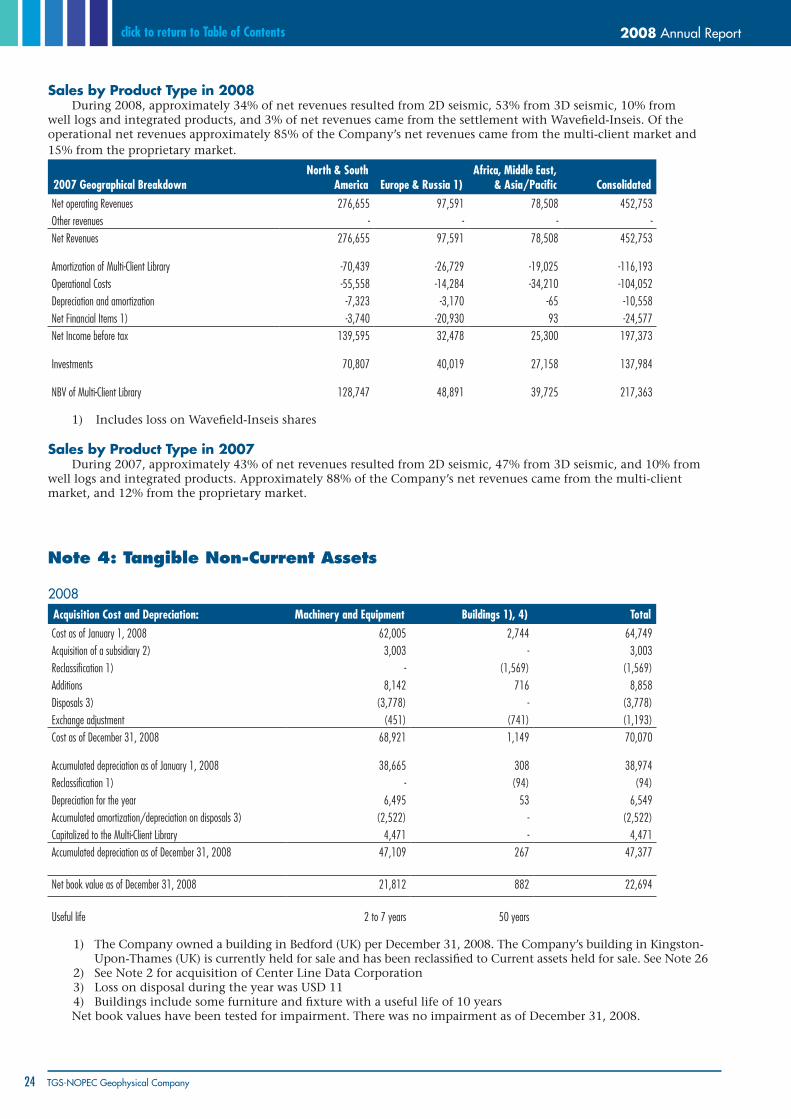
2008 Annual Report
24 TGS-NOPEC Geophysical Company
click to return to Table of Contents
Sales by Product Type in 2008During 2008, approximately 34% of net revenues resulted from 2D seismic, 53% from 3D seismic, 10% from
well logs and integrated products, and 3% of net revenues came from the settlement with Wavefield-Inseis. Of the operational net revenues approximately 85% of the Company’s net revenues came from the multi-client market and 15% from the proprietary market.
2007 Geographical BreakdownNorth & south
America europe & Russia 1)Africa, Middle east,
& Asia/Pacific ConsolidatedNet operating Revenues 276,655 97,591 78,508 452,753Other revenues - - - -Net Revenues 276,655 97,591 78,508 452,753
Amortization of Multi-Client Library -70,439 -26,729 -19,025 -116,193Operational Costs -55,558 -14,284 -34,210 -104,052Depreciation and amortization -7,323 -3,170 -65 -10,558Net Financial Items 1) -3,740 -20,930 93 -24,577Net Income before tax 139,595 32,478 25,300 197,373
Investments 70,807 40,019 27,158 137,984
NBV of Multi-Client Library 128,747 48,891 39,725 217,363
1) Includes loss on Wavefield-Inseis shares
Sales by Product Type in 2007During 2007, approximately 43% of net revenues resulted from 2D seismic, 47% from 3D seismic, and 10% from
well logs and integrated products. Approximately 88% of the Company’s net revenues came from the multi-client market, and 12% from the proprietary market.
Note 4: Tangible Non-Current Assets
2008Acquisition Cost and Depreciation: Machinery and equipment Buildings 1), 4) TotalCost as of January 1, 2008 62,005 2,744 64,749 Acquisition of a subsidiary 2) 3,003 - 3,003 Reclassification 1) - (1,569) (1,569)Additions 8,142 716 8,858 Disposals 3) (3,778) - (3,778)Exchange adjustment (451) (741) (1,193)Cost as of December 31, 2008 68,921 1,149 70,070
Accumulated depreciation as of January 1, 2008 38,665 308 38,974 Reclassification 1) - (94) (94)Depreciation for the year 6,495 53 6,549 Accumulated amortization/depreciation on disposals 3) (2,522) - (2,522)Capitalized to the Multi-Client Library 4,471 - 4,471 Accumulated depreciation as of December 31, 2008 47,109 267 47,377
Net book value as of December 31, 2008 21,812 882 22,694
Useful life 2 to 7 years 50 years 1) The Company owned a building in Bedford (UK) per December 31, 2008. The Company’s building in Kingston-
Upon-Thames (UK) is currently held for sale and has been reclassified to Current assets held for sale. See Note 262) See Note 2 for acquisition of Center Line Data Corporation 3) Loss on disposal during the year was USD 11 4) Buildings include some furniture and fixture with a useful life of 10 years Net book values have been tested for impairment. There was no impairment as of December 31, 2008.
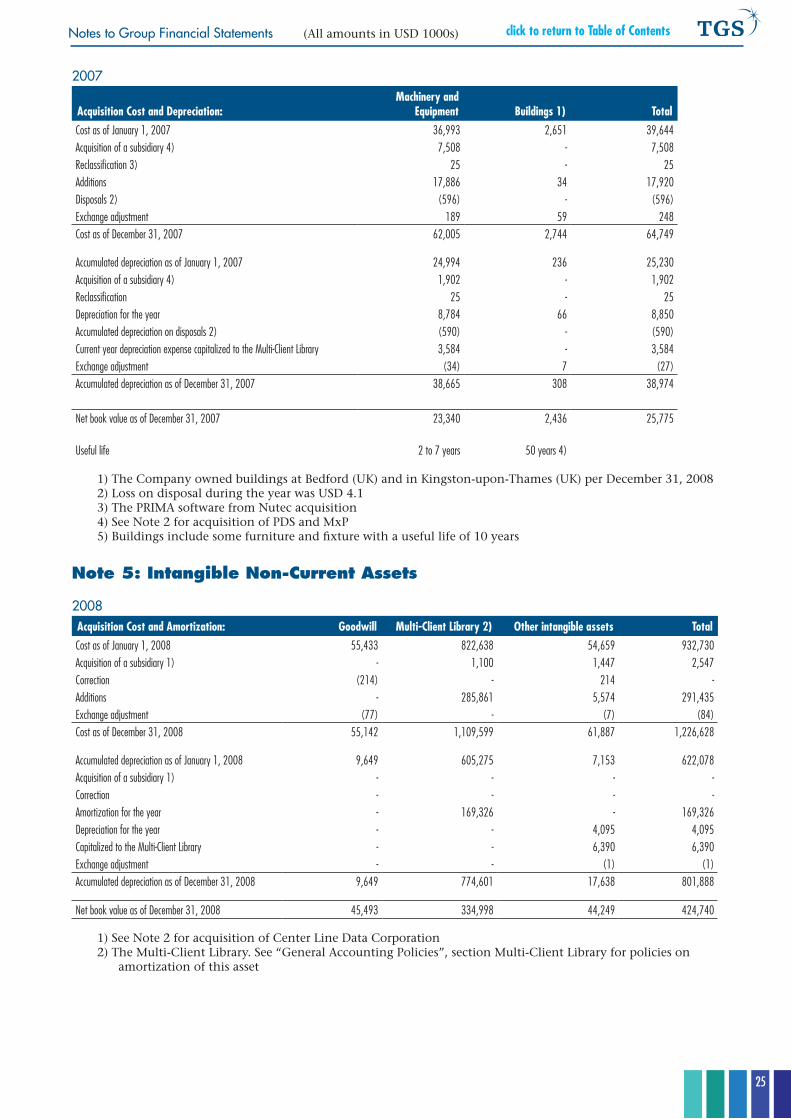
25
click to return to Table of ContentsNotes to Group Financial Statements (All amounts in USD 1000s)
2007
Acquisition Cost and Depreciation: Machinery and
equipment Buildings 1) Total Cost as of January 1, 2007 36,993 2,651 39,644 Acquisition of a subsidiary 4) 7,508 - 7,508 Reclassification 3) 25 - 25 Additions 17,886 34 17,920 Disposals 2) (596) - (596)Exchange adjustment 189 59 248 Cost as of December 31, 2007 62,005 2,744 64,749
Accumulated depreciation as of January 1, 2007 24,994 236 25,230 Acquisition of a subsidiary 4) 1,902 - 1,902 Reclassification 25 - 25 Depreciation for the year 8,784 66 8,850 Accumulated depreciation on disposals 2) (590) - (590)Current year depreciation expense capitalized to the Multi-Client Library 3,584 - 3,584 Exchange adjustment (34) 7 (27)Accumulated depreciation as of December 31, 2007 38,665 308 38,974
Net book value as of December 31, 2007 23,340 2,436 25,775
Useful life 2 to 7 years 50 years 4)
1) The Company owned buildings at Bedford (UK) and in Kingston-upon-Thames (UK) per December 31, 2008 2) Loss on disposal during the year was USD 4.1 3) The PRIMA software from Nutec acquisition 4) See Note 2 for acquisition of PDS and MxP 5) Buildings include some furniture and fixture with a useful life of 10 years
Note 5: Intangible Non-Current Assets
2008Acquisition Cost and Amortization: Goodwill Multi-Client Library 2) Other intangible assets TotalCost as of January 1, 2008 55,433 822,638 54,659 932,730 Acquisition of a subsidiary 1) - 1,100 1,447 2,547 Correction (214) - 214 - Additions - 285,861 5,574 291,435 Exchange adjustment (77) - (7) (84)Cost as of December 31, 2008 55,142 1,109,599 61,887 1,226,628
Accumulated depreciation as of January 1, 2008 9,649 605,275 7,153 622,078 Acquisition of a subsidiary 1) - - - - Correction - - - - Amortization for the year - 169,326 - 169,326 Depreciation for the year - - 4,095 4,095 Capitalized to the Multi-Client Library - - 6,390 6,390 Exchange adjustment - - (1) (1)Accumulated depreciation as of December 31, 2008 9,649 774,601 17,638 801,888
Net book value as of December 31, 2008 45,493 334,998 44,249 424,740
1) See Note 2 for acquisition of Center Line Data Corporation 2) The Multi-Client Library. See “General Accounting Policies”, section Multi-Client Library for policies on
amortization of this asset
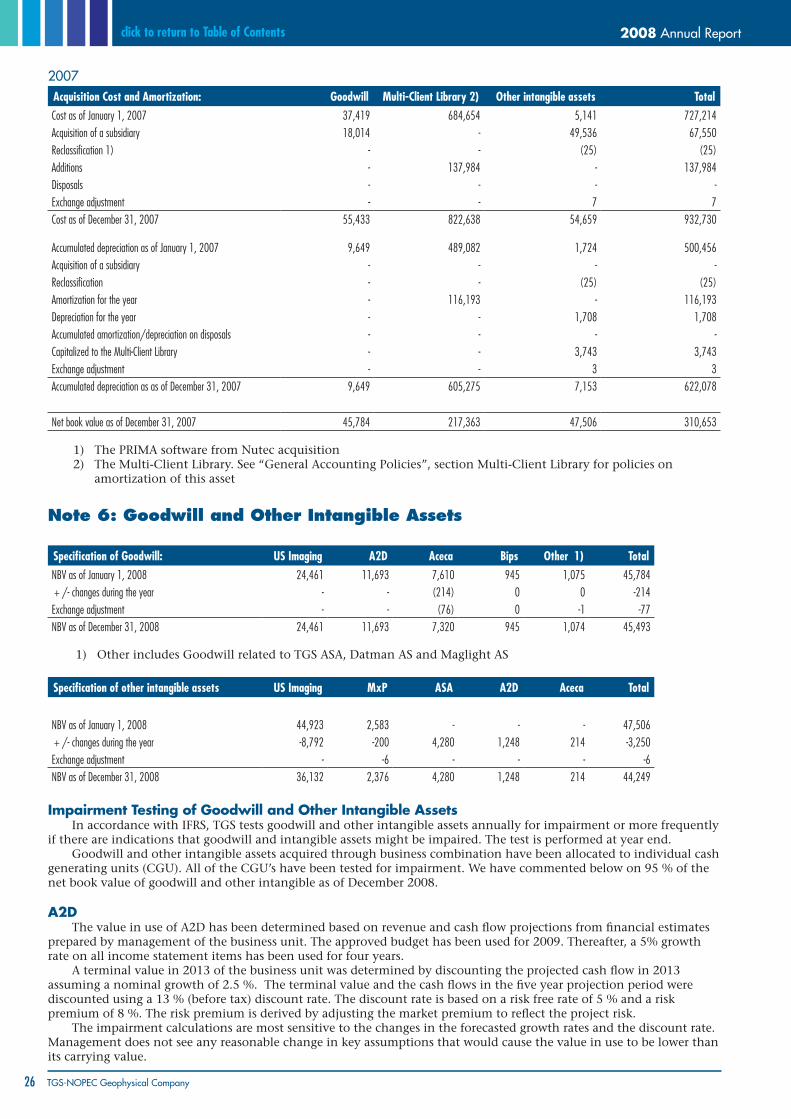
2008 Annual Report
26 TGS-NOPEC Geophysical Company
click to return to Table of Contents
2007Acquisition Cost and Amortization: Goodwill Multi-Client Library 2) Other intangible assets Total Cost as of January 1, 2007 37,419 684,654 5,141 727,214 Acquisition of a subsidiary 18,014 - 49,536 67,550 Reclassification 1) - - (25) (25)Additions - 137,984 - 137,984 Disposals - - - - Exchange adjustment - - 7 7 Cost as of December 31, 2007 55,433 822,638 54,659 932,730
Accumulated depreciation as of January 1, 2007 9,649 489,082 1,724 500,456 Acquisition of a subsidiary - - - - Reclassification - - (25) (25)Amortization for the year - 116,193 - 116,193 Depreciation for the year - - 1,708 1,708 Accumulated amortization/depreciation on disposals - - - - Capitalized to the Multi-Client Library - - 3,743 3,743 Exchange adjustment - - 3 3 Accumulated depreciation as as of December 31, 2007 9,649 605,275 7,153 622,078
Net book value as of December 31, 2007 45,784 217,363 47,506 310,653
1) The PRIMA software from Nutec acquisition 2) The Multi-Client Library. See “General Accounting Policies”, section Multi-Client Library for policies on
amortization of this asset
Note 6: Goodwill and Other Intangible Assets
specification of Goodwill: us Imaging A2D Aceca Bips Other 1) TotalNBV as of January 1, 2008 24,461 11,693 7,610 945 1,075 45,784 + /- changes during the year - - (214) 0 0 -214Exchange adjustment - - (76) 0 -1 -77NBV as of December 31, 2008 24,461 11,693 7,320 945 1,074 45,493
1) Other includes Goodwill related to TGS ASA, Datman AS and Maglight AS
specification of other intangible assets us Imaging MxP AsA A2D Aceca Total
NBV as of January 1, 2008 44,923 2,583 - - - 47,506 + /- changes during the year -8,792 -200 4,280 1,248 214 -3,250Exchange adjustment - -6 - - - -6NBV as of December 31, 2008 36,132 2,376 4,280 1,248 214 44,249
impairment Testing of Goodwill and Other intangible Assets In accordance with IFRS, TGS tests goodwill and other intangible assets annually for impairment or more frequently
if there are indications that goodwill and intangible assets might be impaired. The test is performed at year end.Goodwill and other intangible assets acquired through business combination have been allocated to individual cash
generating units (CGU). All of the CGU’s have been tested for impairment. We have commented below on 95 % of the net book value of goodwill and other intangible as of December 2008.
A2D The value in use of A2D has been determined based on revenue and cash flow projections from financial estimates
prepared by management of the business unit. The approved budget has been used for 2009. Thereafter, a 5% growth rate on all income statement items has been used for four years.
A terminal value in 2013 of the business unit was determined by discounting the projected cash flow in 2013 assuming a nominal growth of 2.5 %. The terminal value and the cash flows in the five year projection period were discounted using a 13 % (before tax) discount rate. The discount rate is based on a risk free rate of 5 % and a risk premium of 8 %. The risk premium is derived by adjusting the market premium to reflect the project risk.
The impairment calculations are most sensitive to the changes in the forecasted growth rates and the discount rate. Management does not see any reasonable change in key assumptions that would cause the value in use to be lower than its carrying value.
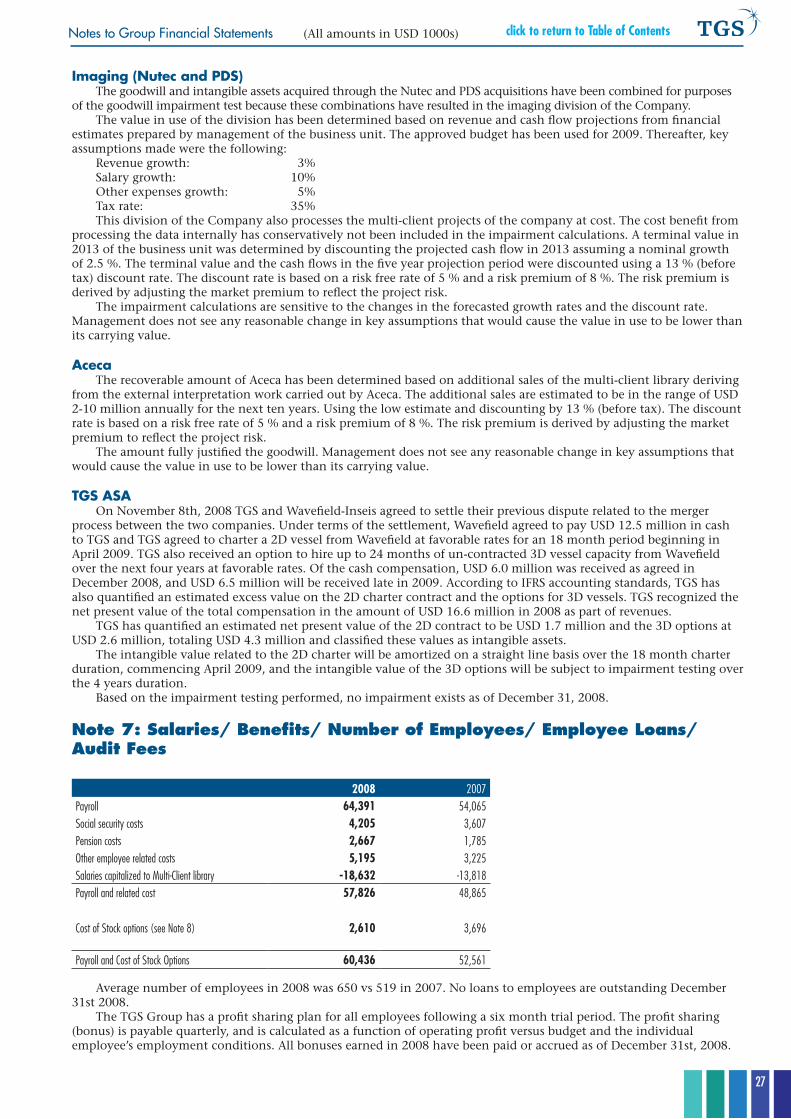
27
click to return to Table of ContentsNotes to Group Financial Statements (All amounts in USD 1000s)
imaging (Nutec and PDS) The goodwill and intangible assets acquired through the Nutec and PDS acquisitions have been combined for purposes
of the goodwill impairment test because these combinations have resulted in the imaging division of the Company.The value in use of the division has been determined based on revenue and cash flow projections from financial
estimates prepared by management of the business unit. The approved budget has been used for 2009. Thereafter, key assumptions made were the following:
Revenue growth: 3% Salary growth: 10%Other expenses growth: 5%Tax rate: 35%This division of the Company also processes the multi-client projects of the company at cost. The cost benefit from
processing the data internally has conservatively not been included in the impairment calculations. A terminal value in 2013 of the business unit was determined by discounting the projected cash flow in 2013 assuming a nominal growth of 2.5 %. The terminal value and the cash flows in the five year projection period were discounted using a 13 % (before tax) discount rate. The discount rate is based on a risk free rate of 5 % and a risk premium of 8 %. The risk premium is derived by adjusting the market premium to reflect the project risk.
The impairment calculations are sensitive to the changes in the forecasted growth rates and the discount rate. Management does not see any reasonable change in key assumptions that would cause the value in use to be lower than its carrying value.
Aceca The recoverable amount of Aceca has been determined based on additional sales of the multi-client library deriving
from the external interpretation work carried out by Aceca. The additional sales are estimated to be in the range of USD 2-10 million annually for the next ten years. Using the low estimate and discounting by 13 % (before tax). The discount rate is based on a risk free rate of 5 % and a risk premium of 8 %. The risk premium is derived by adjusting the market premium to reflect the project risk.
The amount fully justified the goodwill. Management does not see any reasonable change in key assumptions that would cause the value in use to be lower than its carrying value.
TGS ASA On November 8th, 2008 TGS and Wavefield-Inseis agreed to settle their previous dispute related to the merger
process between the two companies. Under terms of the settlement, Wavefield agreed to pay USD 12.5 million in cash to TGS and TGS agreed to charter a 2D vessel from Wavefield at favorable rates for an 18 month period beginning in April 2009. TGS also received an option to hire up to 24 months of un-contracted 3D vessel capacity from Wavefield over the next four years at favorable rates. Of the cash compensation, USD 6.0 million was received as agreed in December 2008, and USD 6.5 million will be received late in 2009. According to IFRS accounting standards, TGS has also quantified an estimated excess value on the 2D charter contract and the options for 3D vessels. TGS recognized the net present value of the total compensation in the amount of USD 16.6 million in 2008 as part of revenues.
TGS has quantified an estimated net present value of the 2D contract to be USD 1.7 million and the 3D options at USD 2.6 million, totaling USD 4.3 million and classified these values as intangible assets.
The intangible value related to the 2D charter will be amortized on a straight line basis over the 18 month charter duration, commencing April 2009, and the intangible value of the 3D options will be subject to impairment testing over the 4 years duration.
Based on the impairment testing performed, no impairment exists as of December 31, 2008.
Note 7: Salaries/ Benefits/ Number of Employees/ Employee Loans/ Audit Fees
2008 2007Payroll 64,391 54,065Social security costs 4,205 3,607Pension costs 2,667 1,785Other employee related costs 5,195 3,225Salaries capitalized to Multi-Client library -18,632 -13,818Payroll and related cost 57,826 48,865
Cost of Stock options (see Note 8) 2,610 3,696
Payroll and Cost of Stock Options 60,436 52,561
Average number of employees in 2008 was 650 vs 519 in 2007. No loans to employees are outstanding December 31st 2008.
The TGS Group has a profit sharing plan for all employees following a six month trial period. The profit sharing (bonus) is payable quarterly, and is calculated as a function of operating profit versus budget and the individual employee’s employment conditions. All bonuses earned in 2008 have been paid or accrued as of December 31st, 2008.
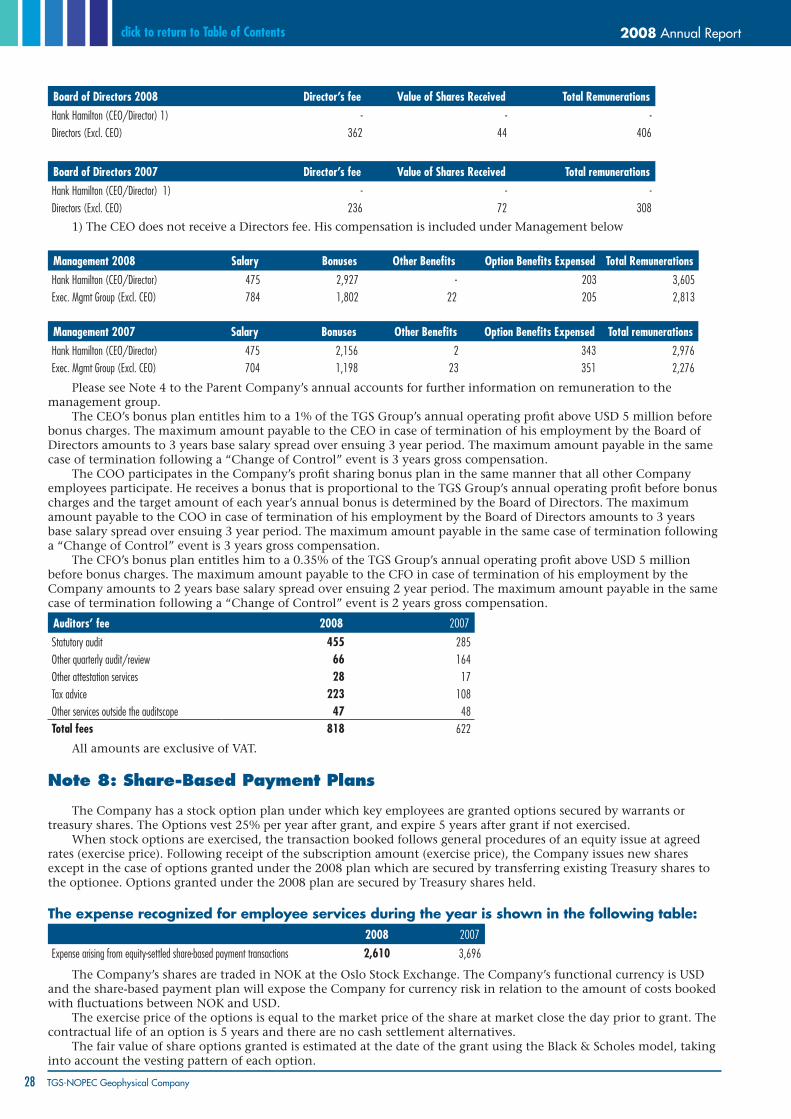
2008 Annual Report
28 TGS-NOPEC Geophysical Company
click to return to Table of Contents
Board of Directors 2008 Director’s fee Value of shares Received Total Remunerationshank hamilton (CEO/Director) 1) - - - Directors (Excl. CEO) 362 44 406
Board of Directors 2007 Director’s fee Value of shares Received Total remunerationshank hamilton (CEO/Director) 1) - - - Directors (Excl. CEO) 236 72 308
1) The CEO does not receive a Directors fee. His compensation is included under Management below
Management 2008 salary Bonuses Other Benefits Option Benefits expensed Total Remunerationshank hamilton (CEO/Director) 475 2,927 - 203 3,605 Exec. Mgmt Group (Excl. CEO) 784 1,802 22 205 2,813
Management 2007 salary Bonuses Other Benefits Option Benefits expensed Total remunerationshank hamilton (CEO/Director) 475 2,156 2 343 2,976 Exec. Mgmt Group (Excl. CEO) 704 1,198 23 351 2,276
Please see Note 4 to the Parent Company’s annual accounts for further information on remuneration to the management group.
The CEO’s bonus plan entitles him to a 1% of the TGS Group’s annual operating profit above USD 5 million before bonus charges. The maximum amount payable to the CEO in case of termination of his employment by the Board of Directors amounts to 3 years base salary spread over ensuing 3 year period. The maximum amount payable in the same case of termination following a “Change of Control” event is 3 years gross compensation.
The COO participates in the Company’s profit sharing bonus plan in the same manner that all other Company employees participate. He receives a bonus that is proportional to the TGS Group’s annual operating profit before bonus charges and the target amount of each year’s annual bonus is determined by the Board of Directors. The maximum amount payable to the COO in case of termination of his employment by the Board of Directors amounts to 3 years base salary spread over ensuing 3 year period. The maximum amount payable in the same case of termination following a “Change of Control” event is 3 years gross compensation.
The CFO’s bonus plan entitles him to a 0.35% of the TGS Group’s annual operating profit above USD 5 million before bonus charges. The maximum amount payable to the CFO in case of termination of his employment by the Company amounts to 2 years base salary spread over ensuing 2 year period. The maximum amount payable in the same case of termination following a “Change of Control” event is 2 years gross compensation.
Auditors’ fee 2008 2007
Statutory audit 455 285Other quarterly audit/review 66 164Other attestation services 28 17Tax advice 223 108Other services outside the auditscope 47 48Total fees 818 622
All amounts are exclusive of VAT.
Note 8: Share-Based Payment Plans
The Company has a stock option plan under which key employees are granted options secured by warrants or treasury shares. The Options vest 25% per year after grant, and expire 5 years after grant if not exercised.
When stock options are exercised, the transaction booked follows general procedures of an equity issue at agreed rates (exercise price). Following receipt of the subscription amount (exercise price), the Company issues new shares except in the case of options granted under the 2008 plan which are secured by transferring existing Treasury shares to the optionee. Options granted under the 2008 plan are secured by Treasury shares held.
The expense recognized for employee services during the year is shown in the following table:2008 2007
Expense arising from equity-settled share-based payment transactions 2,610 3,696
The Company’s shares are traded in NOK at the Oslo Stock Exchange. The Company’s functional currency is USD and the share-based payment plan will expose the Company for currency risk in relation to the amount of costs booked with fluctuations between NOK and USD.
The exercise price of the options is equal to the market price of the share at market close the day prior to grant. The contractual life of an option is 5 years and there are no cash settlement alternatives.
The fair value of share options granted is estimated at the date of the grant using the Black & Scholes model, taking into account the vesting pattern of each option.
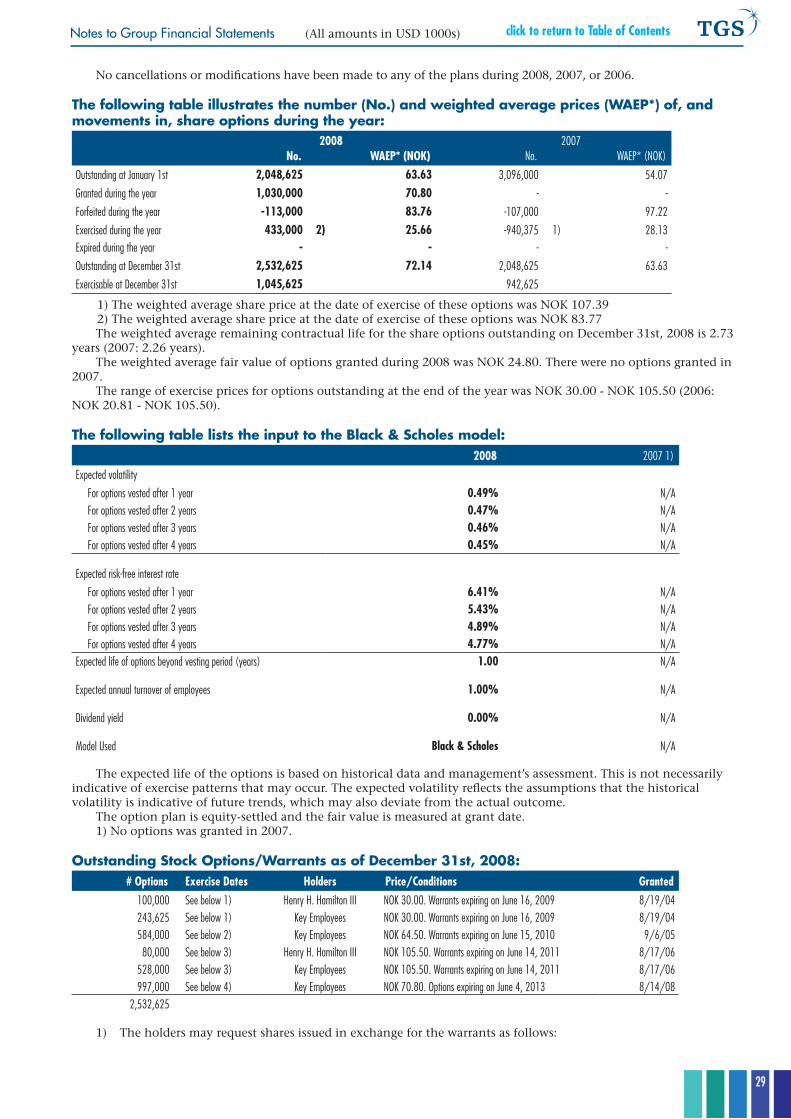
29
click to return to Table of ContentsNotes to Group Financial Statements (All amounts in USD 1000s)
No cancellations or modifications have been made to any of the plans during 2008, 2007, or 2006.
The following table illustrates the number (No.) and weighted average prices (WAEP*) of, and movements in, share options during the year:
2008 2007No. WAeP* (NOK) No. WAEP* (NOK)
Outstanding at January 1st 2,048,625 63.63 3,096,000 54.07
Granted during the year 1,030,000 70.80 - -
Forfeited during the year -113,000 83.76 -107,000 97.22
Exercised during the year 433,000 2) 25.66 -940,375 1) 28.13 Expired during the year - - - -
Outstanding at December 31st 2,532,625 72.14 2,048,625 63.63
Exercisable at December 31st 1,045,625 942,625
1) The weighted average share price at the date of exercise of these options was NOK 107.392) The weighted average share price at the date of exercise of these options was NOK 83.77The weighted average remaining contractual life for the share options outstanding on December 31st, 2008 is 2.73
years (2007: 2.26 years).The weighted average fair value of options granted during 2008 was NOK 24.80. There were no options granted in
2007.The range of exercise prices for options outstanding at the end of the year was NOK 30.00 - NOK 105.50 (2006:
NOK 20.81 - NOK 105.50).
The following table lists the input to the black & Scholes model:2008 2007 1)
Expected volatility
For options vested after 1 year 0.49% N/AFor options vested after 2 years 0.47% N/AFor options vested after 3 years 0.46% N/AFor options vested after 4 years 0.45% N/A
Expected risk-free interest rate
For options vested after 1 year 6.41% N/AFor options vested after 2 years 5.43% N/AFor options vested after 3 years 4.89% N/AFor options vested after 4 years 4.77% N/A
Expected life of options beyond vesting period (years) 1.00 N/A
Expected annual turnover of employees 1.00% N/A
Dividend yield 0.00% N/A
Model Used Black & scholes N/A
The expected life of the options is based on historical data and management’s assessment. This is not necessarily indicative of exercise patterns that may occur. The expected volatility reflects the assumptions that the historical volatility is indicative of future trends, which may also deviate from the actual outcome.
The option plan is equity-settled and the fair value is measured at grant date.1) No options was granted in 2007.
Outstanding Stock Options/Warrants as of December 31st, 2008:# Options exercise Dates Holders Price/Conditions Granted
100,000 See below 1) henry h. hamilton III NOK 30.00. Warrants expiring on June 16, 2009 8/19/04 243,625 See below 1) Key Employees NOK 30.00. Warrants expiring on June 16, 2009 8/19/04 584,000 See below 2) Key Employees NOK 64.50. Warrants expiring on June 15, 2010 9/6/05 80,000 See below 3) henry h. hamilton III NOK 105.50. Warrants expiring on June 14, 2011 8/17/06
528,000 See below 3) Key Employees NOK 105.50. Warrants expiring on June 14, 2011 8/17/06 997,000 See below 4) Key Employees NOK 70.80. Options expiring on June 4, 2013 8/14/08
2,532,625
1) The holders may request shares issued in exchange for the warrants as follows:
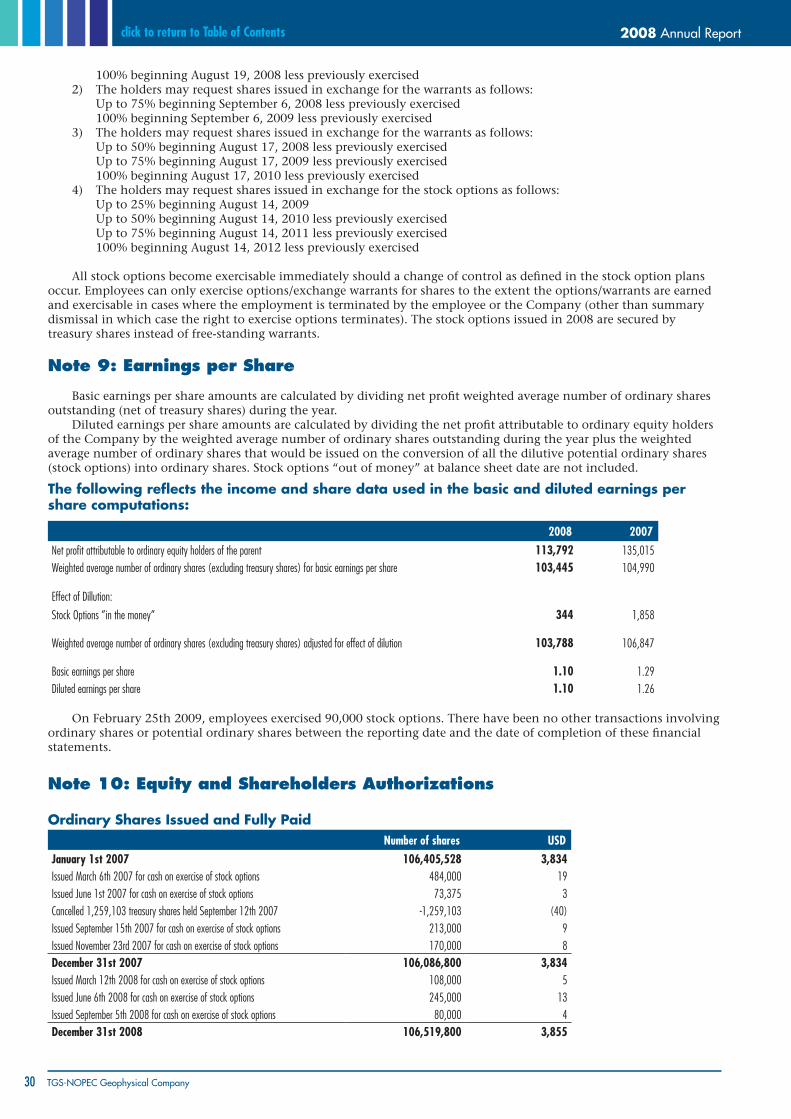
2008 Annual Report
30 TGS-NOPEC Geophysical Company
click to return to Table of Contents
100% beginning August 19, 2008 less previously exercised 2) The holders may request shares issued in exchange for the warrants as follows: Up to 75% beginning September 6, 2008 less previously exercised 100% beginning September 6, 2009 less previously exercised 3) The holders may request shares issued in exchange for the warrants as follows: Up to 50% beginning August 17, 2008 less previously exercised Up to 75% beginning August 17, 2009 less previously exercised 100% beginning August 17, 2010 less previously exercised 4) The holders may request shares issued in exchange for the stock options as follows: Up to 25% beginning August 14, 2009 Up to 50% beginning August 14, 2010 less previously exercised Up to 75% beginning August 14, 2011 less previously exercised 100% beginning August 14, 2012 less previously exercised
All stock options become exercisable immediately should a change of control as defined in the stock option plans occur. Employees can only exercise options/exchange warrants for shares to the extent the options/warrants are earned and exercisable in cases where the employment is terminated by the employee or the Company (other than summary dismissal in which case the right to exercise options terminates). The stock options issued in 2008 are secured by treasury shares instead of free-standing warrants.
Note 9: Earnings per Share
Basic earnings per share amounts are calculated by dividing net profit weighted average number of ordinary shares outstanding (net of treasury shares) during the year.
Diluted earnings per share amounts are calculated by dividing the net profit attributable to ordinary equity holders of the Company by the weighted average number of ordinary shares outstanding during the year plus the weighted average number of ordinary shares that would be issued on the conversion of all the dilutive potential ordinary shares (stock options) into ordinary shares. Stock options “out of money” at balance sheet date are not included.
The following reflects the income and share data used in the basic and diluted earnings per share computations:
2008 2007Net profit attributable to ordinary equity holders of the parent 113,792 135,015Weighted average number of ordinary shares (excluding treasury shares) for basic earnings per share 103,445 104,990
Effect of Dillution:
Stock Options ”in the money” 344 1,858
Weighted average number of ordinary shares (excluding treasury shares) adjusted for effect of dilution 103,788 106,847
Basic earnings per share 1.10 1.29Diluted earnings per share 1.10 1.26
On February 25th 2009, employees exercised 90,000 stock options. There have been no other transactions involving ordinary shares or potential ordinary shares between the reporting date and the date of completion of these financial statements.
Note 10: Equity and Shareholders Authorizations
Ordinary Shares issued and Fully PaidNumber of shares usD
January 1st 2007 106,405,528 3,834 Issued March 6th 2007 for cash on exercise of stock options 484,000 19 Issued June 1st 2007 for cash on exercise of stock options 73,375 3 Cancelled 1,259,103 treasury shares held September 12th 2007 -1,259,103 (40)Issued September 15th 2007 for cash on exercise of stock options 213,000 9 Issued November 23rd 2007 for cash on exercise of stock options 170,000 8 December 31st 2007 106,086,800 3,834 Issued March 12th 2008 for cash on exercise of stock options 108,000 5 Issued June 6th 2008 for cash on exercise of stock options 245,000 13 Issued September 5th 2008 for cash on exercise of stock options 80,000 4 December 31st 2008 106,519,800 3,855
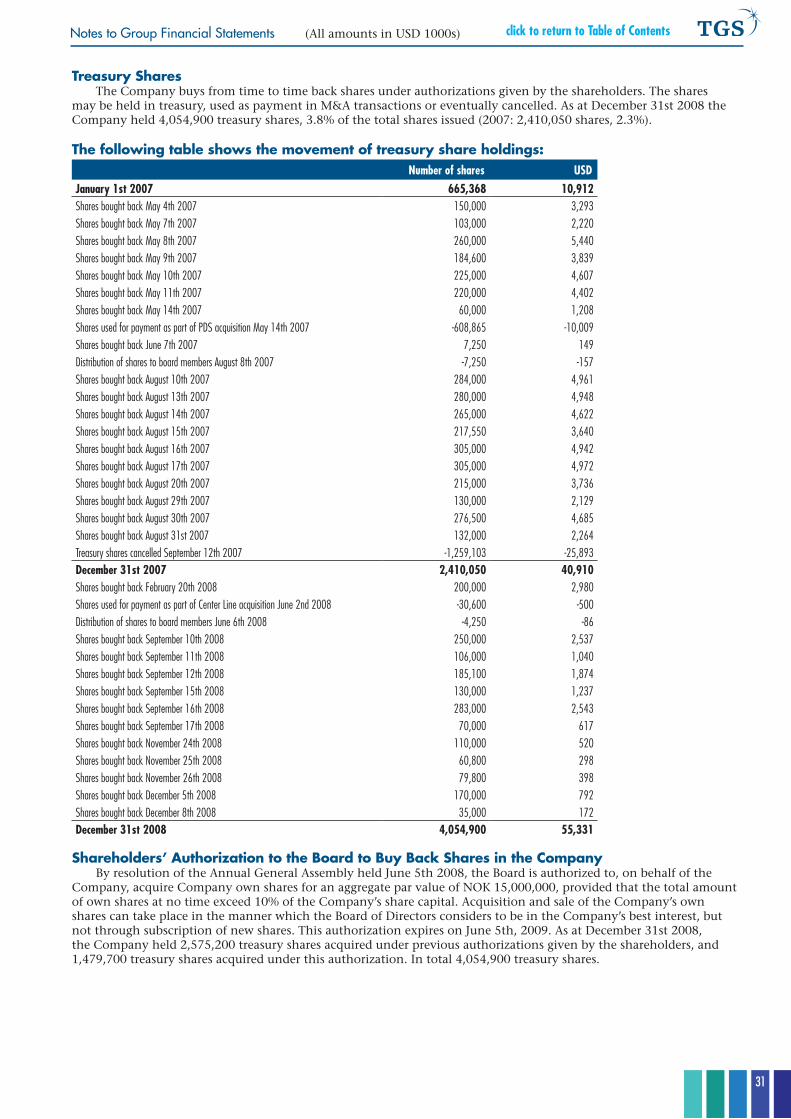
31
click to return to Table of ContentsNotes to Group Financial Statements (All amounts in USD 1000s)
Treasury Shares The Company buys from time to time back shares under authorizations given by the shareholders. The shares
may be held in treasury, used as payment in M&A transactions or eventually cancelled. As at December 31st 2008 the Company held 4,054,900 treasury shares, 3.8% of the total shares issued (2007: 2,410,050 shares, 2.3%).
The following table shows the movement of treasury share holdings:Number of shares usD
January 1st 2007 665,368 10,912Shares bought back May 4th 2007 150,000 3,293Shares bought back May 7th 2007 103,000 2,220Shares bought back May 8th 2007 260,000 5,440Shares bought back May 9th 2007 184,600 3,839Shares bought back May 10th 2007 225,000 4,607Shares bought back May 11th 2007 220,000 4,402Shares bought back May 14th 2007 60,000 1,208Shares used for payment as part of PDS acquisition May 14th 2007 -608,865 -10,009Shares bought back June 7th 2007 7,250 149Distribution of shares to board members August 8th 2007 -7,250 -157Shares bought back August 10th 2007 284,000 4,961Shares bought back August 13th 2007 280,000 4,948Shares bought back August 14th 2007 265,000 4,622Shares bought back August 15th 2007 217,550 3,640Shares bought back August 16th 2007 305,000 4,942Shares bought back August 17th 2007 305,000 4,972Shares bought back August 20th 2007 215,000 3,736Shares bought back August 29th 2007 130,000 2,129Shares bought back August 30th 2007 276,500 4,685Shares bought back August 31st 2007 132,000 2,264Treasury shares cancelled September 12th 2007 -1,259,103 -25,893December 31st 2007 2,410,050 40,910Shares bought back February 20th 2008 200,000 2,980Shares used for payment as part of Center Line acquisition June 2nd 2008 -30,600 -500Distribution of shares to board members June 6th 2008 -4,250 -86Shares bought back September 10th 2008 250,000 2,537Shares bought back September 11th 2008 106,000 1,040Shares bought back September 12th 2008 185,100 1,874Shares bought back September 15th 2008 130,000 1,237Shares bought back September 16th 2008 283,000 2,543Shares bought back September 17th 2008 70,000 617Shares bought back November 24th 2008 110,000 520Shares bought back November 25th 2008 60,800 298Shares bought back November 26th 2008 79,800 398Shares bought back December 5th 2008 170,000 792Shares bought back December 8th 2008 35,000 172December 31st 2008 4,054,900 55,331
Shareholders’ Authorization to the board to buy back Shares in the Company By resolution of the Annual General Assembly held June 5th 2008, the Board is authorized to, on behalf of the
Company, acquire Company own shares for an aggregate par value of NOK 15,000,000, provided that the total amount of own shares at no time exceed 10% of the Company’s share capital. Acquisition and sale of the Company’s own shares can take place in the manner which the Board of Directors considers to be in the Company’s best interest, but not through subscription of new shares. This authorization expires on June 5th, 2009. As at December 31st 2008, the Company held 2,575,200 treasury shares acquired under previous authorizations given by the shareholders, and 1,479,700 treasury shares acquired under this authorization. In total 4,054,900 treasury shares.
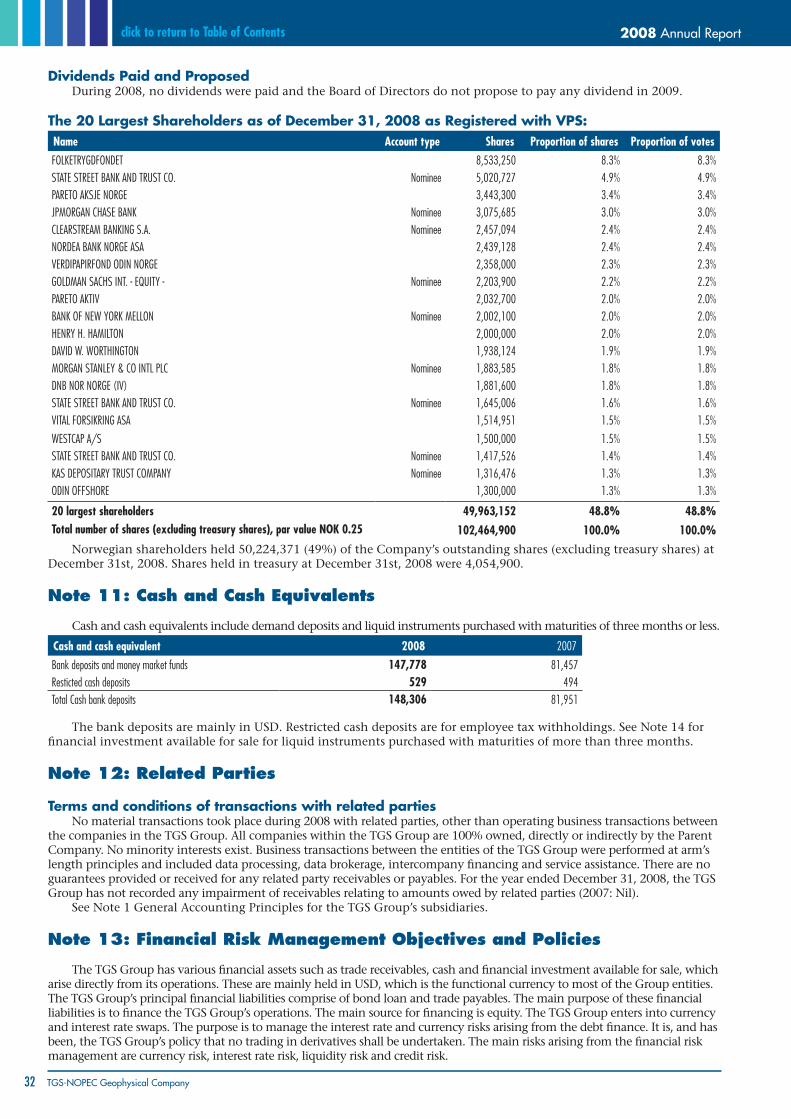
2008 Annual Report
32 TGS-NOPEC Geophysical Company
click to return to Table of Contents
Dividends Paid and Proposed During 2008, no dividends were paid and the Board of Directors do not propose to pay any dividend in 2009.
The 20 Largest Shareholders as of December 31, 2008 as Registered with VPS:Name Account type shares Proportion of shares Proportion of votesFOLKETRYGDFONDET 8,533,250 8.3% 8.3%STATE STREET BANK AND TRUST CO. Nominee 5,020,727 4.9% 4.9%PARETO AKSJE NORGE 3,443,300 3.4% 3.4%JPMORGAN ChASE BANK Nominee 3,075,685 3.0% 3.0%CLEARSTREAM BANKING S.A. Nominee 2,457,094 2.4% 2.4%NORDEA BANK NORGE ASA 2,439,128 2.4% 2.4%VERDIPAPIRFOND ODIN NORGE 2,358,000 2.3% 2.3%GOLDMAN SAChS INT. - EQUITY - Nominee 2,203,900 2.2% 2.2%PARETO AKTIV 2,032,700 2.0% 2.0%BANK OF NEW YORK MELLON Nominee 2,002,100 2.0% 2.0%hENRY h. hAMILTON 2,000,000 2.0% 2.0%DAVID W. WORThINGTON 1,938,124 1.9% 1.9%MORGAN STANLEY & CO INTL PLC Nominee 1,883,585 1.8% 1.8%DNB NOR NORGE (IV) 1,881,600 1.8% 1.8%STATE STREET BANK AND TRUST CO. Nominee 1,645,006 1.6% 1.6%VITAL FORSIKRING ASA 1,514,951 1.5% 1.5%
WESTCAP A/S 1,500,000 1.5% 1.5%STATE STREET BANK AND TRUST CO. Nominee 1,417,526 1.4% 1.4%KAS DEPOSITARY TRUST COMPANY Nominee 1,316,476 1.3% 1.3%ODIN OFFShORE 1,300,000 1.3% 1.3%
20 largest shareholders 49,963,152 48.8% 48.8%Total number of shares (excluding treasury shares), par value NOK 0.25 102,464,900 100.0% 100.0%
Norwegian shareholders held 50,224,371 (49%) of the Company’s outstanding shares (excluding treasury shares) at December 31st, 2008. Shares held in treasury at December 31st, 2008 were 4,054,900.
Note 11: Cash and Cash Equivalents
Cash and cash equivalents include demand deposits and liquid instruments purchased with maturities of three months or less.
Cash and cash equivalent 2008 2007
Bank deposits and money market funds 147,778 81,457 Resticted cash deposits 529 494 Total Cash bank deposits 148,306 81,951
The bank deposits are mainly in USD. Restricted cash deposits are for employee tax withholdings. See Note 14 for financial investment available for sale for liquid instruments purchased with maturities of more than three months.
Note 12: Related Parties
Terms and conditions of transactions with related partiesNo material transactions took place during 2008 with related parties, other than operating business transactions between
the companies in the TGS Group. All companies within the TGS Group are 100% owned, directly or indirectly by the Parent Company. No minority interests exist. Business transactions between the entities of the TGS Group were performed at arm’s length principles and included data processing, data brokerage, intercompany financing and service assistance. There are no guarantees provided or received for any related party receivables or payables. For the year ended December 31, 2008, the TGS Group has not recorded any impairment of receivables relating to amounts owed by related parties (2007: Nil).
See Note 1 General Accounting Principles for the TGS Group’s subsidiaries.
Note 13: Financial Risk Management Objectives and Policies
The TGS Group has various financial assets such as trade receivables, cash and financial investment available for sale, which arise directly from its operations. These are mainly held in USD, which is the functional currency to most of the Group entities. The TGS Group’s principal financial liabilities comprise of bond loan and trade payables. The main purpose of these financial liabilities is to finance the TGS Group’s operations. The main source for financing is equity. The TGS Group enters into currency and interest rate swaps. The purpose is to manage the interest rate and currency risks arising from the debt finance. It is, and has been, the TGS Group’s policy that no trading in derivatives shall be undertaken. The main risks arising from the financial risk management are currency risk, interest rate risk, liquidity risk and credit risk.
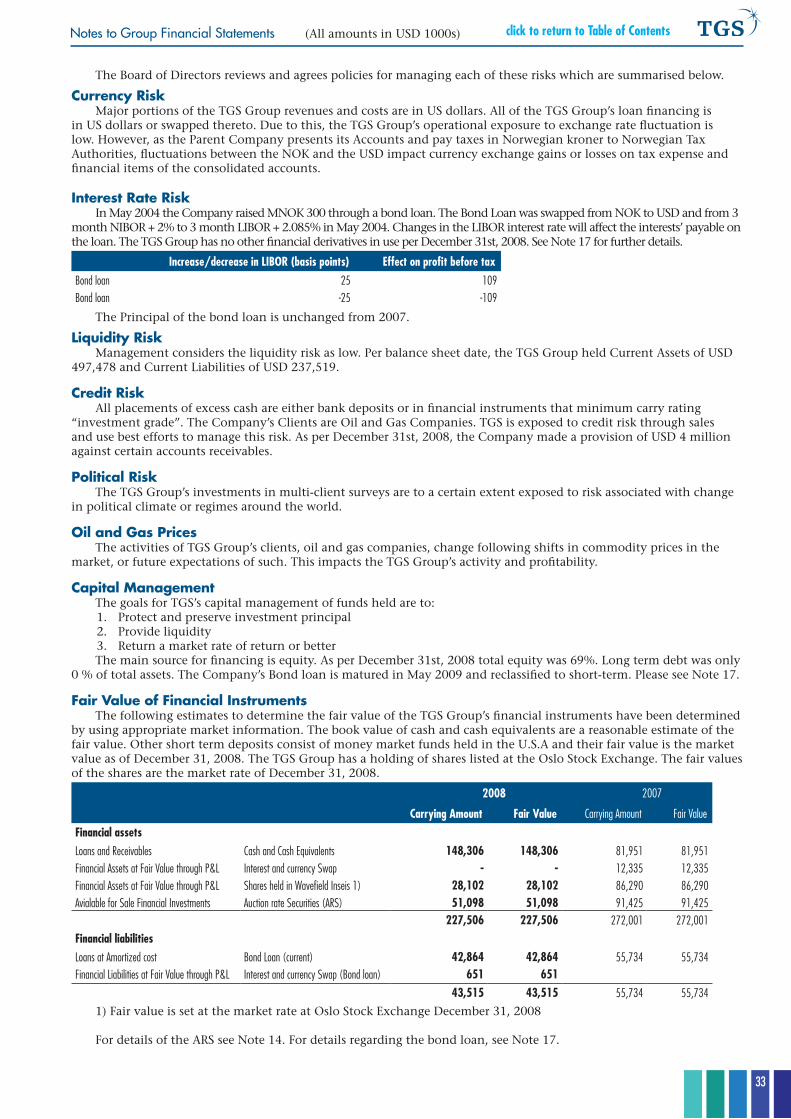
33
click to return to Table of ContentsNotes to Group Financial Statements (All amounts in USD 1000s)
The Board of Directors reviews and agrees policies for managing each of these risks which are summarised below.
Currency Risk Major portions of the TGS Group revenues and costs are in US dollars. All of the TGS Group’s loan financing is
in US dollars or swapped thereto. Due to this, the TGS Group’s operational exposure to exchange rate fluctuation is low. However, as the Parent Company presents its Accounts and pay taxes in Norwegian kroner to Norwegian Tax Authorities, fluctuations between the NOK and the USD impact currency exchange gains or losses on tax expense and financial items of the consolidated accounts.
interest Rate Risk In May 2004 the Company raised MNOK 300 through a bond loan. The Bond Loan was swapped from NOK to USD and from 3
month NIBOR + 2% to 3 month LIBOR + 2.085% in May 2004. Changes in the LIBOR interest rate will affect the interests’ payable on the loan. The TGS Group has no other financial derivatives in use per December 31st, 2008. See Note 17 for further details.
Increase/decrease in LIBOR (basis points) effect on profit before taxBond loan 25 109Bond loan -25 -109
The Principal of the bond loan is unchanged from 2007.
Liquidity Risk Management considers the liquidity risk as low. Per balance sheet date, the TGS Group held Current Assets of USD
497,478 and Current Liabilities of USD 237,519.
Credit Risk All placements of excess cash are either bank deposits or in financial instruments that minimum carry rating
“investment grade”. The Company’s Clients are Oil and Gas Companies. TGS is exposed to credit risk through sales and use best efforts to manage this risk. As per December 31st, 2008, the Company made a provision of USD 4 million against certain accounts receivables.
Political Risk The TGS Group’s investments in multi-client surveys are to a certain extent exposed to risk associated with change
in political climate or regimes around the world.
Oil and Gas Prices The activities of TGS Group’s clients, oil and gas companies, change following shifts in commodity prices in the
market, or future expectations of such. This impacts the TGS Group’s activity and profitability.
Capital Management The goals for TGS’s capital management of funds held are to:1. Protect and preserve investment principal 2. Provide liquidity 3. Return a market rate of return or better The main source for financing is equity. As per December 31st, 2008 total equity was 69%. Long term debt was only
0 % of total assets. The Company’s Bond loan is matured in May 2009 and reclassified to short-term. Please see Note 17.
Fair Value of Financial instruments The following estimates to determine the fair value of the TGS Group’s financial instruments have been determined
by using appropriate market information. The book value of cash and cash equivalents are a reasonable estimate of the fair value. Other short term deposits consist of money market funds held in the U.S.A and their fair value is the market value as of December 31, 2008. The TGS Group has a holding of shares listed at the Oslo Stock Exchange. The fair values of the shares are the market rate of December 31, 2008.
2008 2007
Carrying Amount Fair Value Carrying Amount Fair Value
Financial assetsLoans and Receivables Cash and Cash Equivalents 148,306 148,306 81,951 81,951Financial Assets at Fair Value through P&L Interest and currency Swap - - 12,335 12,335Financial Assets at Fair Value through P&L Shares held in Wavefield Inseis 1) 28,102 28,102 86,290 86,290Avialable for Sale Financial Investments Auction rate Securities (ARS) 51,098 51,098 91,425 91,425
227,506 227,506 272,001 272,001Financial liabilitiesLoans at Amortized cost Bond Loan (current) 42,864 42,864 55,734 55,734Financial Liabilities at Fair Value through P&L Interest and currency Swap (Bond loan) 651 651
43,515 43,515 55,734 55,7341) Fair value is set at the market rate at Oslo Stock Exchange December 31, 2008
For details of the ARS see Note 14. For details regarding the bond loan, see Note 17.
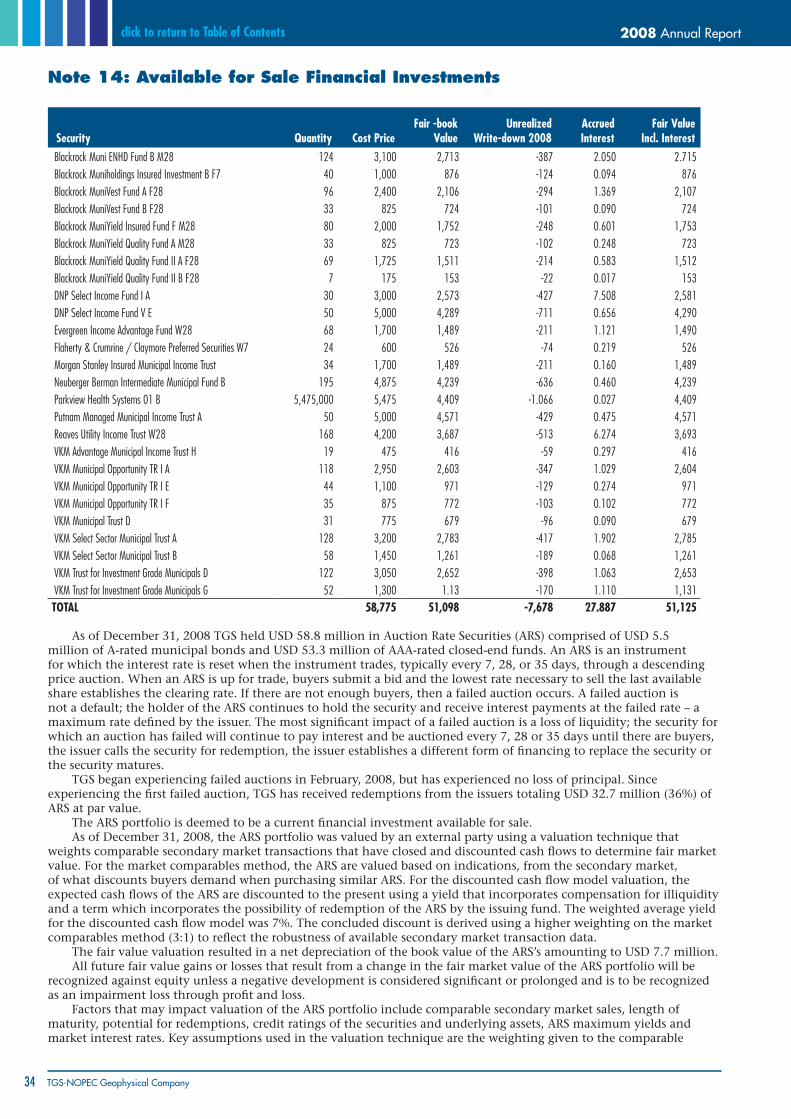
2008 Annual Report
34 TGS-NOPEC Geophysical Company
click to return to Table of Contents
Note 14: Available for Sale Financial Investments
Fair -book Value
unrealized Write-down 2008
Accrued Interest
Fair Value Incl. Interest security quantity Cost Price
Blackrock Muni ENhD Fund B M28 124 3,100 2,713 -387 2.050 2.715 Blackrock Muniholdings Insured Investment B F7 40 1,000 876 -124 0.094 876 Blackrock MuniVest Fund A F28 96 2,400 2,106 -294 1.369 2,107 Blackrock MuniVest Fund B F28 33 825 724 -101 0.090 724 Blackrock MuniYield Insured Fund F M28 80 2,000 1,752 -248 0.601 1,753 Blackrock MuniYield Quality Fund A M28 33 825 723 -102 0.248 723 Blackrock MuniYield Quality Fund II A F28 69 1,725 1,511 -214 0.583 1,512 Blackrock MuniYield Quality Fund II B F28 7 175 153 -22 0.017 153 DNP Select Income Fund I A 30 3,000 2,573 -427 7.508 2,581 DNP Select Income Fund V E 50 5,000 4,289 -711 0.656 4,290 Evergreen Income Advantage Fund W28 68 1,700 1,489 -211 1.121 1,490 Flaherty & Crumrine / Claymore Preferred Securities W7 24 600 526 -74 0.219 526 Morgan Stanley Insured Municipal Income Trust 34 1,700 1,489 -211 0.160 1,489 Neuberger Berman Intermediate Municipal Fund B 195 4,875 4,239 -636 0.460 4,239 Parkview health Systems 01 B 5,475,000 5,475 4,409 -1.066 0.027 4,409 Putnam Managed Municipal Income Trust A 50 5,000 4,571 -429 0.475 4,571 Reaves Utility Income Trust W28 168 4,200 3,687 -513 6.274 3,693 VKM Advantage Municipal Income Trust h 19 475 416 -59 0.297 416 VKM Municipal Opportunity TR I A 118 2,950 2,603 -347 1.029 2,604 VKM Municipal Opportunity TR I E 44 1,100 971 -129 0.274 971 VKM Municipal Opportunity TR I F 35 875 772 -103 0.102 772 VKM Municipal Trust D 31 775 679 -96 0.090 679 VKM Select Sector Municipal Trust A 128 3,200 2,783 -417 1.902 2,785 VKM Select Sector Municipal Trust B 58 1,450 1,261 -189 0.068 1,261 VKM Trust for Investment Grade Municipals D 122 3,050 2,652 -398 1.063 2,653 VKM Trust for Investment Grade Municipals G 52 1,300 1.13 -170 1.110 1,131TOTAL 58,775 51,098 -7,678 27.887 51,125
As of December 31, 2008 TGS held USD 58.8 million in Auction Rate Securities (ARS) comprised of USD 5.5 million of A-rated municipal bonds and USD 53.3 million of AAA-rated closed-end funds. An ARS is an instrument for which the interest rate is reset when the instrument trades, typically every 7, 28, or 35 days, through a descending price auction. When an ARS is up for trade, buyers submit a bid and the lowest rate necessary to sell the last available share establishes the clearing rate. If there are not enough buyers, then a failed auction occurs. A failed auction is not a default; the holder of the ARS continues to hold the security and receive interest payments at the failed rate – a maximum rate defined by the issuer. The most significant impact of a failed auction is a loss of liquidity; the security for which an auction has failed will continue to pay interest and be auctioned every 7, 28 or 35 days until there are buyers, the issuer calls the security for redemption, the issuer establishes a different form of financing to replace the security or the security matures.
TGS began experiencing failed auctions in February, 2008, but has experienced no loss of principal. Since experiencing the first failed auction, TGS has received redemptions from the issuers totaling USD 32.7 million (36%) of ARS at par value.
The ARS portfolio is deemed to be a current financial investment available for sale. As of December 31, 2008, the ARS portfolio was valued by an external party using a valuation technique that
weights comparable secondary market transactions that have closed and discounted cash flows to determine fair market value. For the market comparables method, the ARS are valued based on indications, from the secondary market, of what discounts buyers demand when purchasing similar ARS. For the discounted cash flow model valuation, the expected cash flows of the ARS are discounted to the present using a yield that incorporates compensation for illiquidity and a term which incorporates the possibility of redemption of the ARS by the issuing fund. The weighted average yield for the discounted cash flow model was 7%. The concluded discount is derived using a higher weighting on the market comparables method (3:1) to reflect the robustness of available secondary market transaction data.
The fair value valuation resulted in a net depreciation of the book value of the ARS’s amounting to USD 7.7 million. All future fair value gains or losses that result from a change in the fair market value of the ARS portfolio will be
recognized against equity unless a negative development is considered significant or prolonged and is to be recognized as an impairment loss through profit and loss.
Factors that may impact valuation of the ARS portfolio include comparable secondary market sales, length of maturity, potential for redemptions, credit ratings of the securities and underlying assets, ARS maximum yields and market interest rates. Key assumptions used in the valuation technique are the weighting given to the comparable
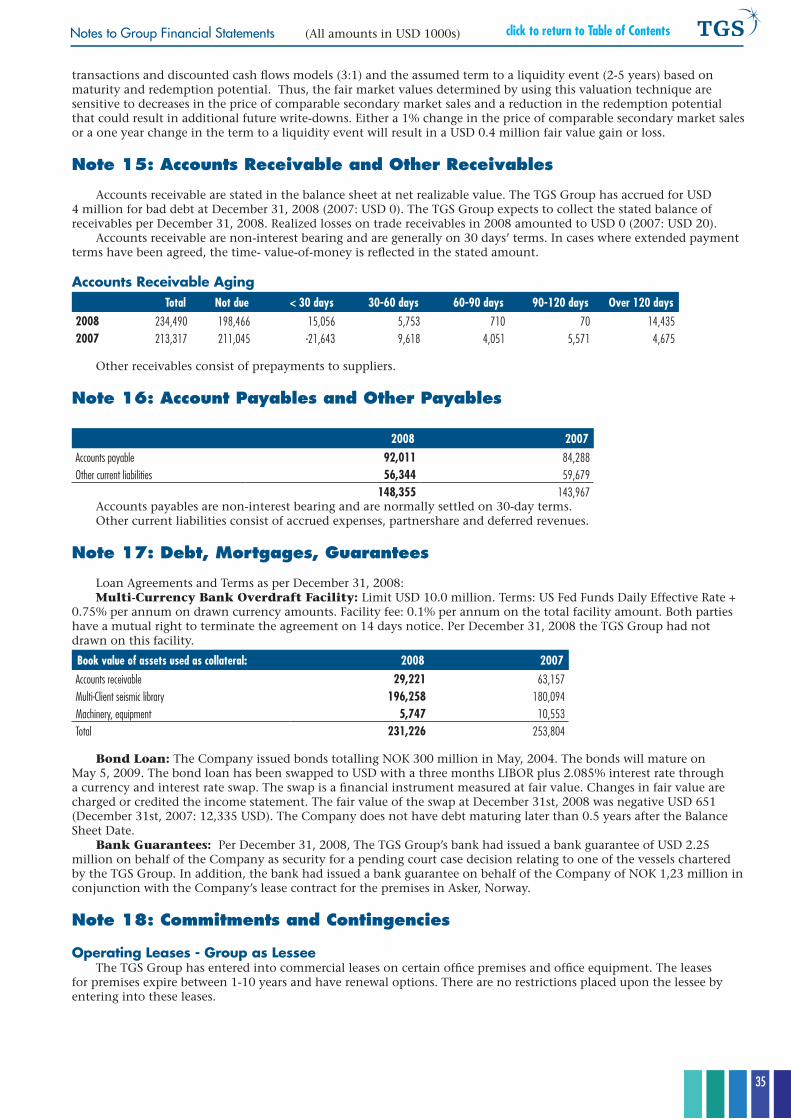
35
click to return to Table of ContentsNotes to Group Financial Statements (All amounts in USD 1000s)
transactions and discounted cash flows models (3:1) and the assumed term to a liquidity event (2-5 years) based on maturity and redemption potential. Thus, the fair market values determined by using this valuation technique are sensitive to decreases in the price of comparable secondary market sales and a reduction in the redemption potential that could result in additional future write-downs. Either a 1% change in the price of comparable secondary market sales or a one year change in the term to a liquidity event will result in a USD 0.4 million fair value gain or loss.
Note 15: Accounts Receivable and Other Receivables
Accounts receivable are stated in the balance sheet at net realizable value. The TGS Group has accrued for USD 4 million for bad debt at December 31, 2008 (2007: USD 0). The TGS Group expects to collect the stated balance of receivables per December 31, 2008. Realized losses on trade receivables in 2008 amounted to USD 0 (2007: USD 20).
Accounts receivable are non-interest bearing and are generally on 30 days’ terms. In cases where extended payment terms have been agreed, the time- value-of-money is reflected in the stated amount.
Accounts Receivable Aging Total Not due < 30 days 30-60 days 60-90 days 90-120 days Over 120 days
2008 234,490 198,466 15,056 5,753 710 70 14,4352007 213,317 211,045 -21,643 9,618 4,051 5,571 4,675
Other receivables consist of prepayments to suppliers.
Note 16: Account Payables and Other Payables
2008 2007Accounts payable 92,011 84,288Other current liabilities 56,344 59,679
148,355 143,967Accounts payables are non-interest bearing and are normally settled on 30-day terms.Other current liabilities consist of accrued expenses, partnershare and deferred revenues.
Note 17: Debt, Mortgages, Guarantees
Loan Agreements and Terms as per December 31, 2008:Multi-Currency Bank Overdraft Facility: Limit USD 10.0 million. Terms: US Fed Funds Daily Effective Rate +
0.75% per annum on drawn currency amounts. Facility fee: 0.1% per annum on the total facility amount. Both parties have a mutual right to terminate the agreement on 14 days notice. Per December 31, 2008 the TGS Group had not drawn on this facility.
Book value of assets used as collateral: 2008 2007Accounts receivable 29,221 63,157Multi-Client seismic library 196,258 180,094Machinery, equipment 5,747 10,553Total 231,226 253,804
Bond Loan: The Company issued bonds totalling NOK 300 million in May, 2004. The bonds will mature on May 5, 2009. The bond loan has been swapped to USD with a three months LIBOR plus 2.085% interest rate through a currency and interest rate swap. The swap is a financial instrument measured at fair value. Changes in fair value are charged or credited the income statement. The fair value of the swap at December 31st, 2008 was negative USD 651 (December 31st, 2007: 12,335 USD). The Company does not have debt maturing later than 0.5 years after the Balance Sheet Date.
Bank Guarantees: Per December 31, 2008, The TGS Group’s bank had issued a bank guarantee of USD 2.25 million on behalf of the Company as security for a pending court case decision relating to one of the vessels chartered by the TGS Group. In addition, the bank had issued a bank guarantee on behalf of the Company of NOK 1,23 million in conjunction with the Company’s lease contract for the premises in Asker, Norway.
Note 18: Commitments and Contingencies
Operating Leases - Group as Lessee The TGS Group has entered into commercial leases on certain office premises and office equipment. The leases
for premises expire between 1-10 years and have renewal options. There are no restrictions placed upon the lessee by entering into these leases.
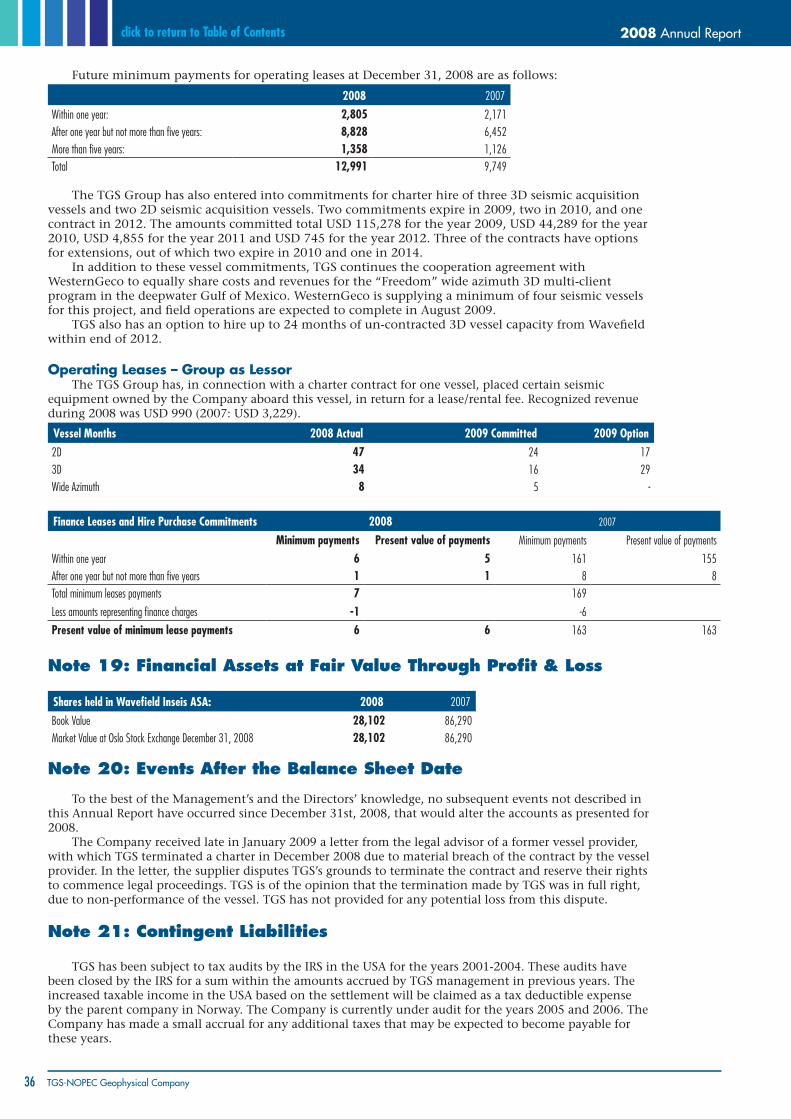
2008 Annual Report
36 TGS-NOPEC Geophysical Company
click to return to Table of Contents
Future minimum payments for operating leases at December 31, 2008 are as follows:
2008 2007
Within one year: 2,805 2,171 After one year but not more than five years: 8,828 6,452 More than five years: 1,358 1,126 Total 12,991 9,749
The TGS Group has also entered into commitments for charter hire of three 3D seismic acquisition vessels and two 2D seismic acquisition vessels. Two commitments expire in 2009, two in 2010, and one contract in 2012. The amounts committed total USD 115,278 for the year 2009, USD 44,289 for the year 2010, USD 4,855 for the year 2011 and USD 745 for the year 2012. Three of the contracts have options for extensions, out of which two expire in 2010 and one in 2014.
In addition to these vessel commitments, TGS continues the cooperation agreement with WesternGeco to equally share costs and revenues for the “Freedom” wide azimuth 3D multi-client program in the deepwater Gulf of Mexico. WesternGeco is supplying a minimum of four seismic vessels for this project, and field operations are expected to complete in August 2009.
TGS also has an option to hire up to 24 months of un-contracted 3D vessel capacity from Wavefield within end of 2012.
Operating Leases – Group as Lessor The TGS Group has, in connection with a charter contract for one vessel, placed certain seismic
equipment owned by the Company aboard this vessel, in return for a lease/rental fee. Recognized revenue during 2008 was USD 990 (2007: USD 3,229).
Vessel Months 2008 Actual 2009 Committed 2009 Option2D 47 24 173D 34 16 29Wide Azimuth 8 5 -
Finance Leases and Hire Purchase Commitments 2008 2007Minimum payments Present value of payments Minimum payments Present value of payments
Within one year 6 5 161 155After one year but not more than five years 1 1 8 8Total minimum leases payments 7 169
Less amounts representing finance charges -1 -6Present value of minimum lease payments 6 6 163 163
Note 19: Financial Assets at Fair Value Through Profit & Loss
shares held in Wavefield Inseis AsA: 2008 2007
Book Value 28,102 86,290Market Value at Oslo Stock Exchange December 31, 2008 28,102 86,290
Note 20: Events After the Balance Sheet Date
To the best of the Management’s and the Directors’ knowledge, no subsequent events not described in this Annual Report have occurred since December 31st, 2008, that would alter the accounts as presented for 2008.
The Company received late in January 2009 a letter from the legal advisor of a former vessel provider, with which TGS terminated a charter in December 2008 due to material breach of the contract by the vessel provider. In the letter, the supplier disputes TGS’s grounds to terminate the contract and reserve their rights to commence legal proceedings. TGS is of the opinion that the termination made by TGS was in full right, due to non-performance of the vessel. TGS has not provided for any potential loss from this dispute.
Note 21: Contingent Liabilities
TGS has been subject to tax audits by the IRS in the USA for the years 2001-2004. These audits have been closed by the IRS for a sum within the amounts accrued by TGS management in previous years. The increased taxable income in the USA based on the settlement will be claimed as a tax deductible expense by the parent company in Norway. The Company is currently under audit for the years 2005 and 2006. The Company has made a small accrual for any additional taxes that may be expected to become payable for these years.
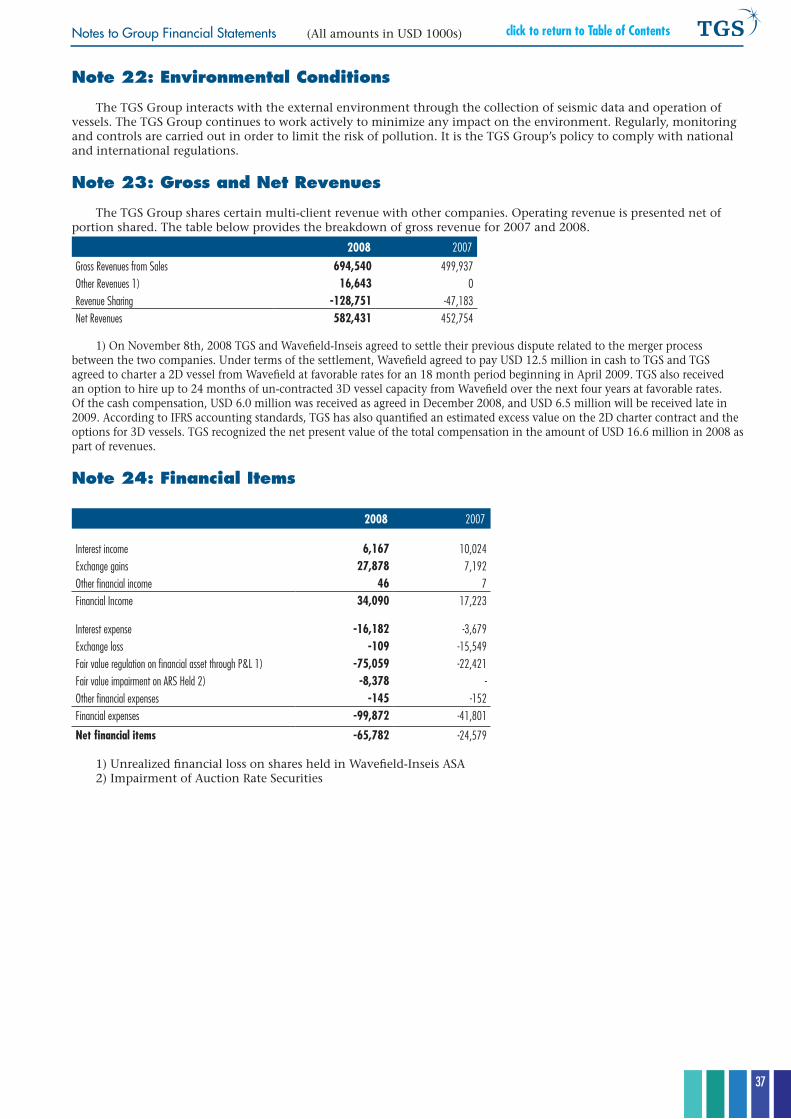
37
click to return to Table of ContentsNotes to Group Financial Statements (All amounts in USD 1000s)
Note 22: Environmental Conditions
The TGS Group interacts with the external environment through the collection of seismic data and operation of vessels. The TGS Group continues to work actively to minimize any impact on the environment. Regularly, monitoring and controls are carried out in order to limit the risk of pollution. It is the TGS Group’s policy to comply with national and international regulations.
Note 23: Gross and Net Revenues
The TGS Group shares certain multi-client revenue with other companies. Operating revenue is presented net of portion shared. The table below provides the breakdown of gross revenue for 2007 and 2008.
2008 2007
Gross Revenues from Sales 694,540 499,937Other Revenues 1) 16,643 0Revenue Sharing -128,751 -47,183Net Revenues 582,431 452,754
1) On November 8th, 2008 TGS and Wavefield-Inseis agreed to settle their previous dispute related to the merger process between the two companies. Under terms of the settlement, Wavefield agreed to pay USD 12.5 million in cash to TGS and TGS agreed to charter a 2D vessel from Wavefield at favorable rates for an 18 month period beginning in April 2009. TGS also received an option to hire up to 24 months of un-contracted 3D vessel capacity from Wavefield over the next four years at favorable rates. Of the cash compensation, USD 6.0 million was received as agreed in December 2008, and USD 6.5 million will be received late in 2009. According to IFRS accounting standards, TGS has also quantified an estimated excess value on the 2D charter contract and the options for 3D vessels. TGS recognized the net present value of the total compensation in the amount of USD 16.6 million in 2008 as part of revenues.
Note 24: Financial Items
2008 2007
Interest income 6,167 10,024Exchange gains 27,878 7,192Other financial income 46 7Financial Income 34,090 17,223
Interest expense -16,182 -3,679Exchange loss -109 -15,549Fair value regulation on financial asset through P&L 1) -75,059 -22,421Fair value impairment on ARS held 2) -8,378 - Other financial expenses -145 -152Financial expenses -99,872 -41,801
Net financial items -65,782 -24,579
1) Unrealized financial loss on shares held in Wavefield-Inseis ASA2) Impairment of Auction Rate Securities
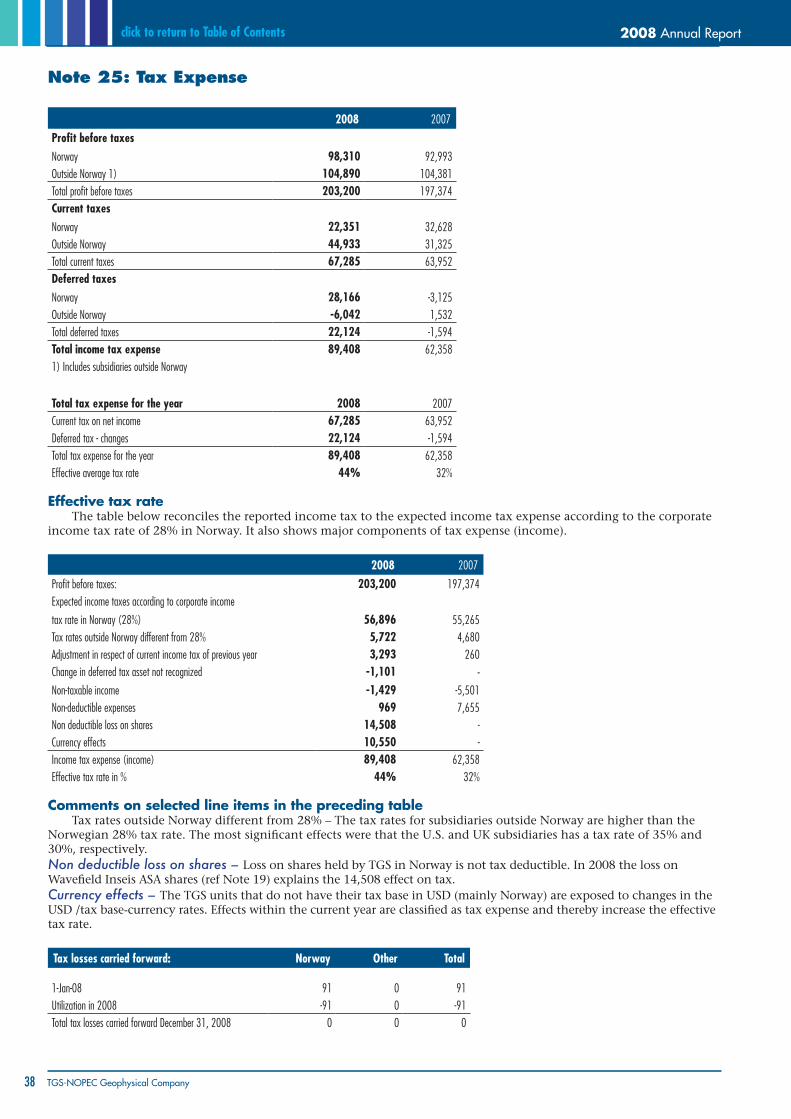
2008 Annual Report
38 TGS-NOPEC Geophysical Company
click to return to Table of Contents
Note 25: Tax Expense
2008 2007
Profit before taxesNorway 98,310 92,993Outside Norway 1) 104,890 104,381Total profit before taxes 203,200 197,374Current taxesNorway 22,351 32,628Outside Norway 44,933 31,325Total current taxes 67,285 63,952Deferred taxesNorway 28,166 -3,125Outside Norway -6,042 1,532Total deferred taxes 22,124 -1,594Total income tax expense 89,408 62,3581) Includes subsidiaries outside Norway
Total tax expense for the year 2008 2007Current tax on net income 67,285 63,952Deferred tax - changes 22,124 -1,594Total tax expense for the year 89,408 62,358Effective average tax rate 44% 32%
Effective tax rate
The table below reconciles the reported income tax to the expected income tax expense according to the corporate income tax rate of 28% in Norway. It also shows major components of tax expense (income).
2008 2007
Profit before taxes: 203,200 197,374Expected income taxes according to corporate income
tax rate in Norway (28%) 56,896 55,265Tax rates outside Norway different from 28% 5,722 4,680Adjustment in respect of current income tax of previous year 3,293 260Change in deferred tax asset not recognized -1,101 -Non-taxable income -1,429 -5,501Non-deductible expenses 969 7,655Non deductible loss on shares 14,508 -Currency effects 10,550 -Income tax expense (income) 89,408 62,358Effective tax rate in % 44% 32%
Comments on selected line items in the preceding table Tax rates outside Norway different from 28% – The tax rates for subsidiaries outside Norway are higher than the
Norwegian 28% tax rate. The most significant effects were that the U.S. and UK subsidiaries has a tax rate of 35% and 30%, respectively. Non deductible loss on shares – Loss on shares held by TGS in Norway is not tax deductible. In 2008 the loss on Wavefield Inseis ASA shares (ref Note 19) explains the 14,508 effect on tax. Currency effects – The TGS units that do not have their tax base in USD (mainly Norway) are exposed to changes in the USD /tax base-currency rates. Effects within the current year are classified as tax expense and thereby increase the effective tax rate.
Tax losses carried forward: Norway Other Total
1-Jan-08 91 0 91Utilization in 2008 -91 0 -91Total tax losses carried forward December 31, 2008 0 0 0
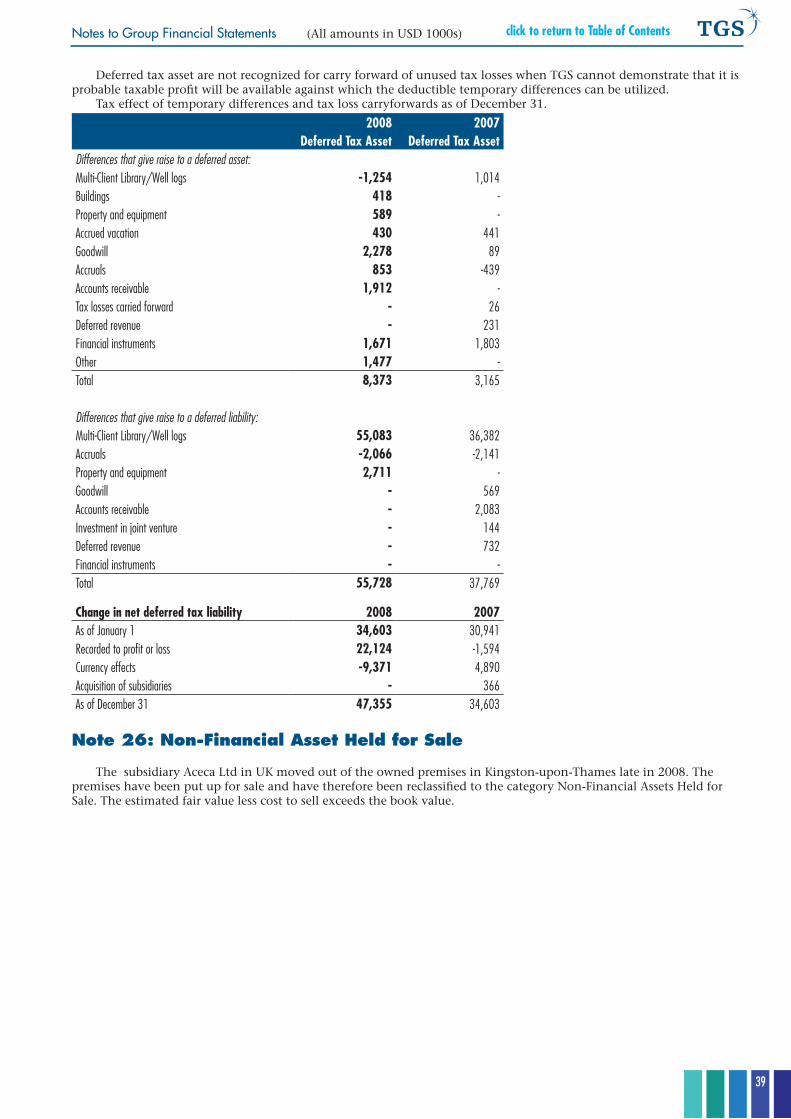
39
click to return to Table of ContentsNotes to Group Financial Statements (All amounts in USD 1000s)
Deferred tax asset are not recognized for carry forward of unused tax losses when TGS cannot demonstrate that it is probable taxable profit will be available against which the deductible temporary differences can be utilized.
Tax effect of temporary differences and tax loss carryforwards as of December 31.
2008 2007Deferred Tax Asset Deferred Tax Asset
Differences that give raise to a deferred asset:Multi-Client Library/Well logs -1,254 1,014Buildings 418 -Property and equipment 589 -Accrued vacation 430 441Goodwill 2,278 89Accruals 853 -439Accounts receivable 1,912 -Tax losses carried forward - 26Deferred revenue - 231Financial instruments 1,671 1,803Other 1,477 -Total 8,373 3,165
Differences that give raise to a deferred liability:Multi-Client Library/Well logs 55,083 36,382Accruals -2,066 -2,141Property and equipment 2,711 -Goodwill - 569Accounts receivable - 2,083Investment in joint venture - 144Deferred revenue - 732Financial instruments - -Total 55,728 37,769
Change in net deferred tax liability 2008 2007As of January 1 34,603 30,941Recorded to profit or loss 22,124 -1,594Currency effects -9,371 4,890Acquisition of subsidiaries - 366As of December 31 47,355 34,603
Note 26: Non-Financial Asset Held for Sale
The subsidiary Aceca Ltd in UK moved out of the owned premises in Kingston-upon-Thames late in 2008. The premises have been put up for sale and have therefore been reclassified to the category Non-Financial Assets Held for Sale. The estimated fair value less cost to sell exceeds the book value.
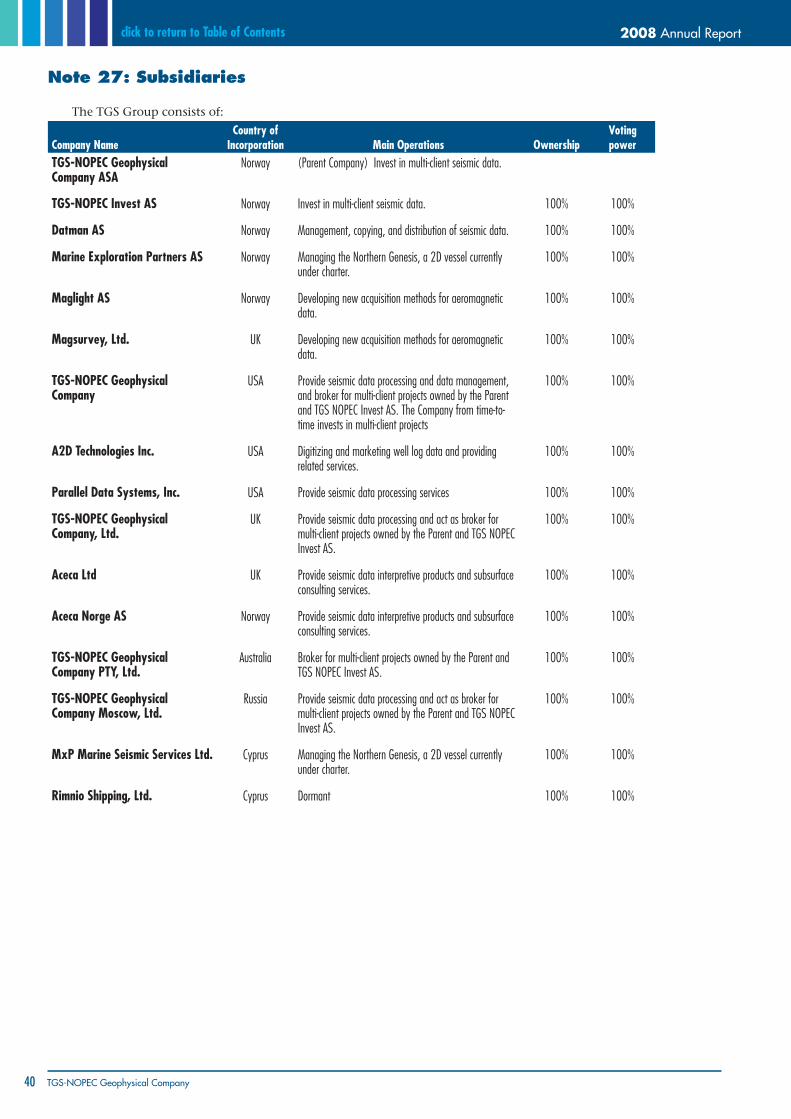
2008 Annual Report
40 TGS-NOPEC Geophysical Company
click to return to Table of Contents
Note 27: Subsidiaries
The TGS Group consists of:
Company NameCountry of
Incorporation Main Operations Ownership Voting power
TGs-NOPeC Geophysical Company AsA
Norway (Parent Company) Invest in multi-client seismic data.
TGs-NOPeC Invest As Norway Invest in multi-client seismic data. 100% 100%
Datman As Norway Management, copying, and distribution of seismic data. 100% 100%
Marine exploration Partners As Norway Managing the Northern Genesis, a 2D vessel currently under charter.
100% 100%
Maglight As Norway Developing new acquisition methods for aeromagnetic data.
100% 100%
Magsurvey, Ltd. UK Developing new acquisition methods for aeromagnetic data.
100% 100%
TGs-NOPeC Geophysical Company
USA Provide seismic data processing and data management, and broker for multi-client projects owned by the Parent and TGS NOPEC Invest AS. The Company from time-to-time invests in multi-client projects
100% 100%
A2D Technologies Inc. USA Digitizing and marketing well log data and providing related services.
100% 100%
Parallel Data systems, Inc. USA Provide seismic data processing services 100% 100%
TGs-NOPeC Geophysical Company, Ltd.
UK Provide seismic data processing and act as broker for multi-client projects owned by the Parent and TGS NOPEC Invest AS.
100% 100%
Aceca Ltd UK Provide seismic data interpretive products and subsurface consulting services.
100% 100%
Aceca Norge As Norway Provide seismic data interpretive products and subsurface consulting services.
100% 100%
TGs-NOPeC Geophysical Company PTy, Ltd.
Australia Broker for multi-client projects owned by the Parent and TGS NOPEC Invest AS.
100% 100%
TGs-NOPeC Geophysical Company Moscow, Ltd.
Russia Provide seismic data processing and act as broker for multi-client projects owned by the Parent and TGS NOPEC Invest AS.
100% 100%
MxP Marine seismic services Ltd. Cyprus Managing the Northern Genesis, a 2D vessel currently under charter.
100% 100%
Rimnio shipping, Ltd. Cyprus Dormant 100% 100%
41
click to return to Table of Contents
41
ParentCompanyFinancials
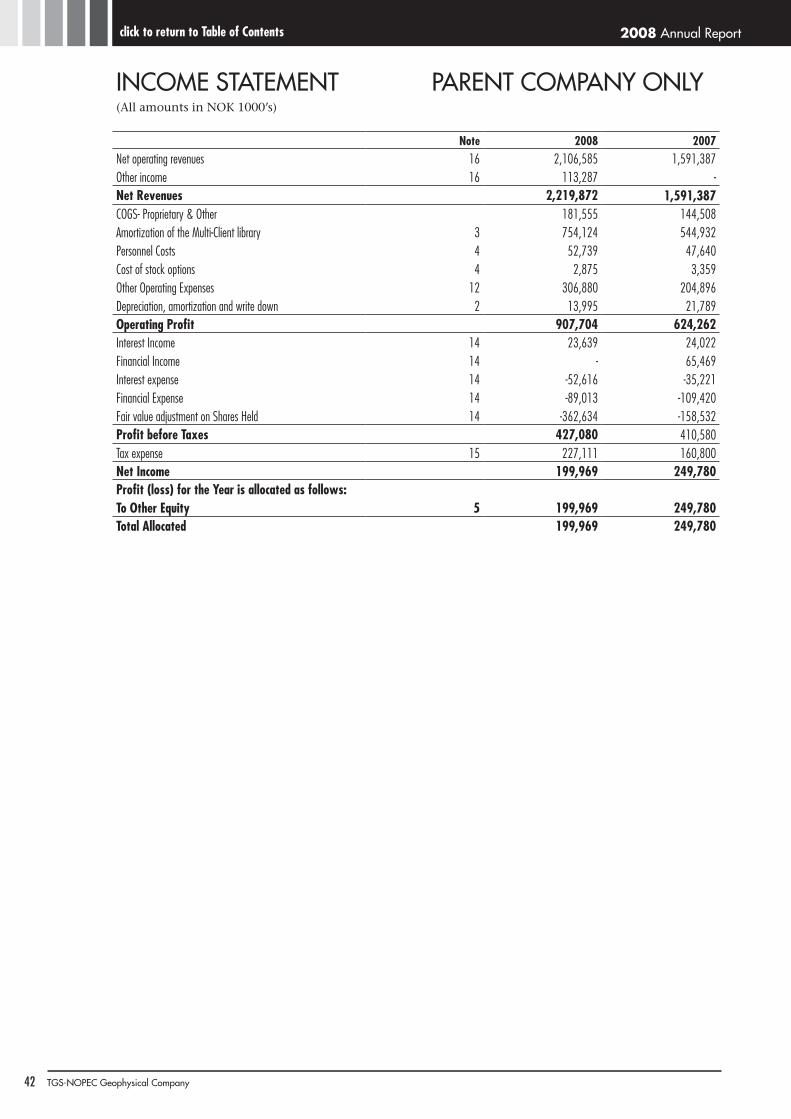
2008 Annual Report
42 TGS-NOPEC Geophysical Company
click to return to Table of Contents
Note 2008 2007Net operating revenues 16 2,106,585 1,591,387Other income 16 113,287 -Net Revenues 2,219,872 1,591,387 COGS- Proprietary & Other 181,555 144,508Amortization of the Multi-Client library 3 754,124 544,932Personnel Costs 4 52,739 47,640Cost of stock options 4 2,875 3,359Other Operating Expenses 12 306,880 204,896Depreciation, amortization and write down 2 13,995 21,789Operating Profit 907,704 624,262Interest Income 14 23,639 24,022Financial Income 14 - 65,469Interest expense 14 -52,616 -35,221Financial Expense 14 -89,013 -109,420Fair value adjustment on Shares held 14 -362,634 -158,532Profit before Taxes 427,080 410,580Tax expense 15 227,111 160,800Net Income 199,969 249,780Profit (loss) for the year is allocated as follows:To Other equity 5 199,969 249,780Total Allocated 199,969 249,780
INCOME STATEMENT PARENT COMPANY ONLY(All amounts in NOK 1000’s)
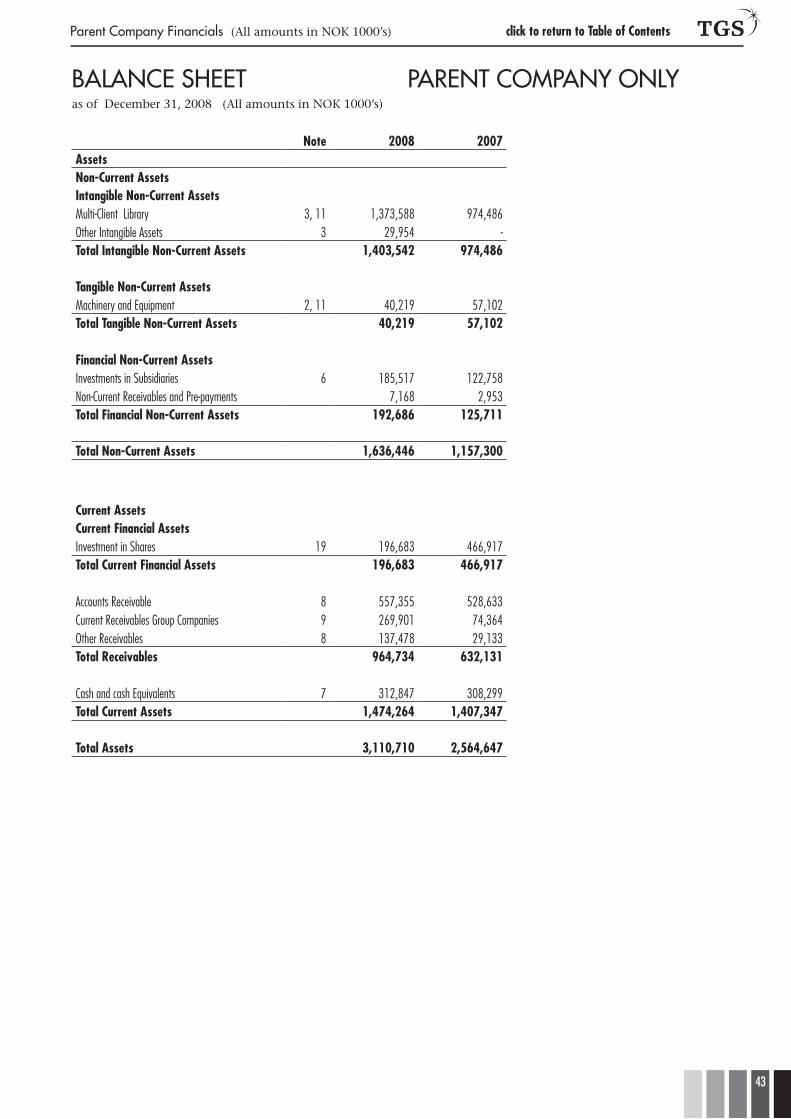
43
click to return to Table of Contents
Note 2008 2007AssetsNon-Current AssetsIntangible Non-Current AssetsMulti-Client Library 3, 11 1,373,588 974,486Other Intangible Assets 3 29,954 -Total Intangible Non-Current Assets 1,403,542 974,486
Tangible Non-Current AssetsMachinery and Equipment 2, 11 40,219 57,102Total Tangible Non-Current Assets 40,219 57,102
Financial Non-Current AssetsInvestments in Subsidiaries 6 185,517 122,758Non-Current Receivables and Pre-payments 7,168 2,953Total Financial Non-Current Assets 192,686 125,711
Total Non-Current Assets 1,636,446 1,157,300
Current AssetsCurrent Financial AssetsInvestment in Shares 19 196,683 466,917Total Current Financial Assets 196,683 466,917
Accounts Receivable 8 557,355 528,633Current Receivables Group Companies 9 269,901 74,364Other Receivables 8 137,478 29,133Total Receivables 964,734 632,131
Cash and cash Equivalents 7 312,847 308,299Total Current Assets 1,474,264 1,407,347
Total Assets 3,110,710 2,564,647
BALANCE SHEET PARENT COMPANY ONLYas of December 31, 2008 (All amounts in NOK 1000’s)
Parent Company Financials (All amounts in NOK 1000’s)
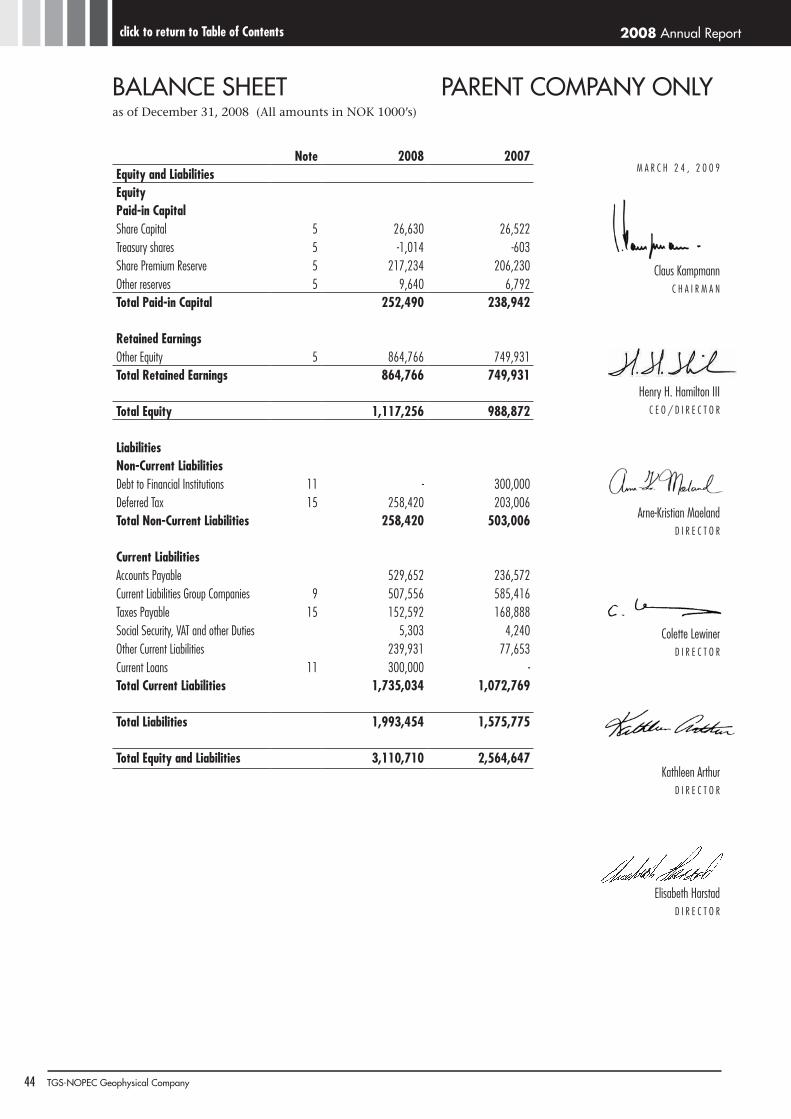
2008 Annual Report
44 TGS-NOPEC Geophysical Company
click to return to Table of Contents
Note 2008 2007equity and LiabilitiesequityPaid-in CapitalShare Capital 5 26,630 26,522Treasury shares 5 -1,014 -603Share Premium Reserve 5 217,234 206,230Other reserves 5 9,640 6,792Total Paid-in Capital 252,490 238,942
Retained earningsOther Equity 5 864,766 749,931Total Retained earnings 864,766 749,931
Total equity 1,117,256 988,872
LiabilitiesNon-Current LiabilitiesDebt to Financial Institutions 11 - 300,000Deferred Tax 15 258,420 203,006Total Non-Current Liabilities 258,420 503,006
Current LiabilitiesAccounts Payable 529,652 236,572Current Liabilities Group Companies 9 507,556 585,416Taxes Payable 15 152,592 168,888Social Security, VAT and other Duties 5,303 4,240Other Current Liabilities 239,931 77,653Current Loans 11 300,000 -Total Current Liabilities 1,735,034 1,072,769
Total Liabilities 1,993,454 1,575,775
Total equity and Liabilities 3,110,710 2,564,647
M A R C h 2 4 , 2 0 0 9
Claus KampmannC h A I R M A N
henry h. hamilton IIIC E O / D I R E C T O R
Arne-Kristian MaelandD I R E C T O R
Colette LewinerD I R E C T O R
Kathleen ArthurD I R E C T O R
Elisabeth harstadD I R E C T O R
BALANCE SHEET PARENT COMPANY ONLYas of December 31, 2008 (All amounts in NOK 1000’s)
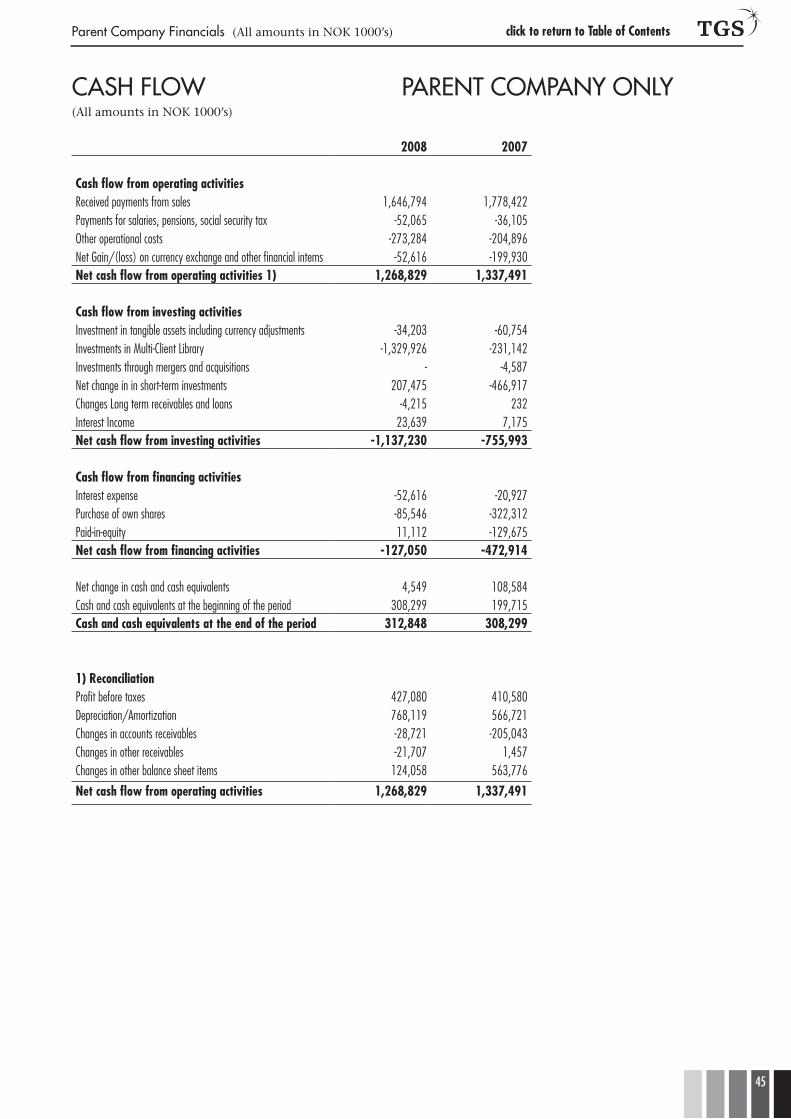
45
click to return to Table of Contents
2008 2007
Cash flow from operating activitiesReceived payments from sales 1,646,794 1,778,422Payments for salaries, pensions, social security tax -52,065 -36,105Other operational costs -273,284 -204,896Net Gain/(loss) on currency exchange and other financial intems -52,616 -199,930Net cash flow from operating activities 1) 1,268,829 1,337,491
Cash flow from investing activitiesInvestment in tangible assets including currency adjustments -34,203 -60,754Investments in Multi-Client Library -1,329,926 -231,142Investments through mergers and acquisitions - -4,587Net change in in short-term investments 207,475 -466,917Changes Long term receivables and loans -4,215 232Interest Income 23,639 7,175Net cash flow from investing activities -1,137,230 -755,993
Cash flow from financing activitiesInterest expense -52,616 -20,927Purchase of own shares -85,546 -322,312Paid-in-equity 11,112 -129,675Net cash flow from financing activities -127,050 -472,914
Net change in cash and cash equivalents 4,549 108,584Cash and cash equivalents at the beginning of the period 308,299 199,715Cash and cash equivalents at the end of the period 312,848 308,299
1) ReconciliationProfit before taxes 427,080 410,580Depreciation/Amortization 768,119 566,721Changes in accounts receivables -28,721 -205,043Changes in other receivables -21,707 1,457Changes in other balance sheet items 124,058 563,776
Net cash flow from operating activities 1,268,829 1,337,491
CASH FLOW PARENT COMPANY ONLY(All amounts in NOK 1000’s)
Parent Company Financials (All amounts in NOK 1000’s)
2008 Annual Report
46 TGS-NOPEC Geophysical Company
click to return to Table of Contents
Notes to Parent Company Financial Statements(All amounts in NOK 1000’s)
Note 1: General Accounting Policies
General informationTGS-NOPEC Geophysical Company ASA (the Company) is a public limited company incorporated in Norway on
August 21st, 1996. The address of its registered office is Hagaløkkveien 13, 1383 Asker, Norway. The Company is listed on the Oslo Stock Exchange.
The Company’s financial statements were authorized for issue by the BOD on March 23, 2009.Reporting Currency – The Parent Company, TGS-NOPEC Geophysical Company ASA has functional currency USD, but reports its financial results in Norwegian Kroner (NOK). General Accounting Policies – The financial statements are presented in compliance with the Norwegian Companies Act, the Norwegian Accounting Act, and generally accepted accounting practises in Norway (NGAAP). Notes are an integral part of the financial statements.
Significant Accounting Judgments, Estimates and Assumptions In the process of applying the Company’s accounting principles, management is required to make estimates,
judgments and assumptions that affect the amount reported in the financial statements and accompanying notes. Management bases its estimates and judgments on historical experience and on various other factors that are believed to be reasonable under the circumstances, the results of which will form the basis for making judgments on carrying values of assets and liabilities that are not readily apparent from other sources. Actual results may differ from these estimates. The key sources of judgment and estimation of uncertainty at the balance sheet date, that have a significant risk of causing a material adjustment to the carrying amounts of assets and liabilities within the next financial year are discussed below.Future sales forecasts as basis for multi-client library amortization – The Company determines the amortization expense of the multi-client library based on the proportion of net book value versus estimated future revenue for each individual project. The underlying estimates that form the basis for the sales forecast depend on variables such as number of oil companies operating in the area that would be interested in the data, expectations regarding hydrocarbons in the sector, whether licenses to perform exploration in the sectors exist or will be given in the future etc. Changes in these estimates may potentially affect the estimated amount of future sales and the amortization rate used materially.Deferred Tax Assets – Deferred tax assets are recognized for all carry forward tax losses to the extent that it is probable that taxable profit will be available against which the losses can be utilized. Significant management judgment is required to determine the amount of deferred tax assets that can be recognized, based upon the likely timing and level of future taxable profits together with future tax planning strategies. The carrying value of recognized tax losses on December 31st, 2008 and 2007 was KNOK 0 and KNOK 0 respectively. Further details are included in notes in the accounts.Share-Based Payments – The Company measure the cost of the stock option plans for employees by reference to the fair value of the equity instruments at the date at which they are granted. Estimating fair value requires appropriate valuation model to value the grant of equity instruments. The value is dependent on the terms and conditions of the grant. This also requires determining the appropriate inputs to the valuation model including the expected life of the option, volatility and dividend yield and making assumption about them. The assumptions and models used are disclosed in Note 4 and the TGS Group Note 8.Revenue Recognition – The Company recognizes revenues from pre-committed multi-client surveys based on percentage of completion at the Balance Sheet Date. This requires management to estimate the level of completion of the various ongoing projects of the Company at that date.
Principles of Assessment Revenue Recognition – Revenue is recognized when it is probable that the economic benefits from a transaction will flow to the Company and the revenue can be reliably measured. Revenue is measured at fair value of the consideration receivable, net of discounts and sales taxes or duty. The following describes the specific principles:
Work in Progress – Revenue from work in progress (unfinished projects) at the Balance Sheet date is recognized on a percentage of completion basis under binding contracts, normally measured according to the acquired and processed volume of data in relation to the estimated total size of the project. Sales made prior to a certain deadline for each project are classified as pre-funding and sales thereafter as late sales.Library Sales – For sales of finished data this is at the time of the transaction, i.e. when the client has gained access to the data under a binding agreement.Revenue Sharing – The Company shares certain multi-client revenue with other companies. Operating revenue is presented net of the portion shared. Proprietary Contracts – Revenue from proprietary contracts for clients is recognized in the same way as work in progress (percentage of completion) according to the specific agreement.
Cost of Goods Sold (COGS) - Proprietary and Other – Cost of goods sold includes only direct cost and related to project contract work and cost related to delivery of seismic data.Multi-Client Library – The multi-client library includes completed and in-progress geophysical data to be licensed on a non-exclusive basis to oil and gas exploration and production companies. The direct costs related to data acquisition and processing are capitalized and included in the inventory value. The library also includes the cost of geophysical data purchased from third parties.
47
click to return to Table of ContentsNotes to Parent Company Financials (All amounts in NOK 1000’s)
The library of finished multi-client seismic data and interpretations is presented at cost reduced by accumulated amortization. Amortization is recorded in line with how revenues are recognized for each project, in proportion to the remaining net book value versus the estimated future revenue from that project. The revenue estimates are continuously updated and fully reviewed every twelve months. For work in progress, amortization is percentage of the Company’s estimate for total cost and revenues of completed projects expected.
When establishing amortization rates for the multi-client seismic library, the management base their view on estimated future sales for each individual survey. Estimates are adjusted over time with the development of the market. The amortization expense recognized may vary considerably from one period to another depending on the actual mix of projects sold and changes to estimates.
A minimum amortization is applied: the maximum net book value of the individual survey one year after completion is 60% of original cost. The minimum cumulative amortization increases by 20% of cost each year thereafter, with the result that each survey is fully amortized in the Balance Sheet by the end of the fourth year following its completion.
The library is annually or when there are indicators that the carrying amount may not be recoverable tested for impairment either individually per project (seismic and interpretation reports) or at the cash generating unit level (Well logs), as appropriate.Goodwill and Other Intangible Assets – Goodwill is depreciated over 10 years. In addition goodwill is reviewed for impairment, annually or more frequently if events or changes in circumstances indicate that the carrying value may be impaired.
Impairment is determined for goodwill and intangible assets by assessing the recoverable amount of the cash-generating unit (or group of cash-generating units), to which the goodwill relates. Where the recoverable amount of the cash-generating unit (or group of cash-generating units) is less than the carrying amount of the cash-generating unit (group of cash-generating units) to which goodwill has been allocated, an impairment loss is recognized.
There was no impairment as of December, 2008.Tangible Non-Current Assets and Principles of Depreciation – Tangible non-current assets are presented at historical cost less accumulated depreciation and impairment charges. If an indication of impairment exists, an impairment test is performed. If the fair value of a tangible non-current asset is lower than book value, the asset will be written down to the higher of fair value less cost to sell and value in use. Depreciation is determined in light of the asset’s economic life, varying from 2 to 50 years. Purchases which are expected to have a technical and economic life of at least two years are capitalized as tangible non-current assets. Depreciation begins when the assets are placed in service. Tangible non-current assets held for sale are stated at the lower of book value and presumed market value and are not subject to depreciation.Exchange Rate Adjustments/Derivatives – Monetary assets, receivables and liabilities are translated at the exchange rate on the Balance Sheet date. Assets or liabilities involved in a derivative trade contract are stated at the fair value of the contract at Balance Sheet date. Variations are expensed in the income statement. Software Development Costs – Software development costs are expensed as incurred. The Company has not capitalized any development cost in 2008.Borrowing Costs – Borrowing costs are recognized as an expense when incurred. Provisions – Provisions are established when the Company has a present obligation (legal or constructive) as result of a past event, it is probable that the Company will be required to settle the obligation, and a reliable estimate can be made of the amount of the obligation. Income Taxes
Current income tax – Current income tax assets and liabilities for the current and prior periods are measured at the amount expected to be recovered from or paid to the taxation authorities. The tax rates and tax laws used to compute the amount are those that are enacted or substantively enacted by the balance sheet date.Deferred Tax Income – Deferred income tax is provided using the liability method on temporary differences at the balance sheet date between the tax bases of assets and liabilities and their carrying amounts for financial reporting purposes.
Deferred income tax liabilities are recognized for all taxable temporary differences, except:• where the deferred income tax liability arises from the initial recognition of goodwill or of an asset or liability
in a transaction that is not a business combination and, at the time of the transaction, affects neither the accounting profit nor taxable profit or loss; and
• in respect of taxable temporary differences associated with investments in subsidiaries, associates and interests in joint ventures, where the timing of the reversal of the temporary differences can be controlled and it is probable that the temporary differences will not reverse in the foreseeable future.Deferred tax assets are recognized for all deductible temporary differences, carry forward of unused tax credits
and unused tax losses, to the extent that it is probable that taxable profit will be available against which the deductible temporary differences, and the carry forward of unused tax credits and unused tax losses can be utilized.
Deferred income tax assets and deferred income tax liabilities are offset, if a legally enforceable right exists to set off current tax assets against current income tax liabilities and the deferred income taxes relate to the same taxable company and the same taxation authority. Deferred income tax assets and liabilities are measured at the tax rates that are expected to apply to the year when the asset is realized or the liability is settled, based on tax rates (and tax laws) that have been enacted or substantively enacted at the balance sheet date.
Deferred income tax relating to items recognized directly in equity is recognized in equity and not in the income statement.
Employee Stock Option Scheme – Key employees of the Company receive remuneration in the form of share-based payment transactions, whereby employees render services as consideration for equity instruments.
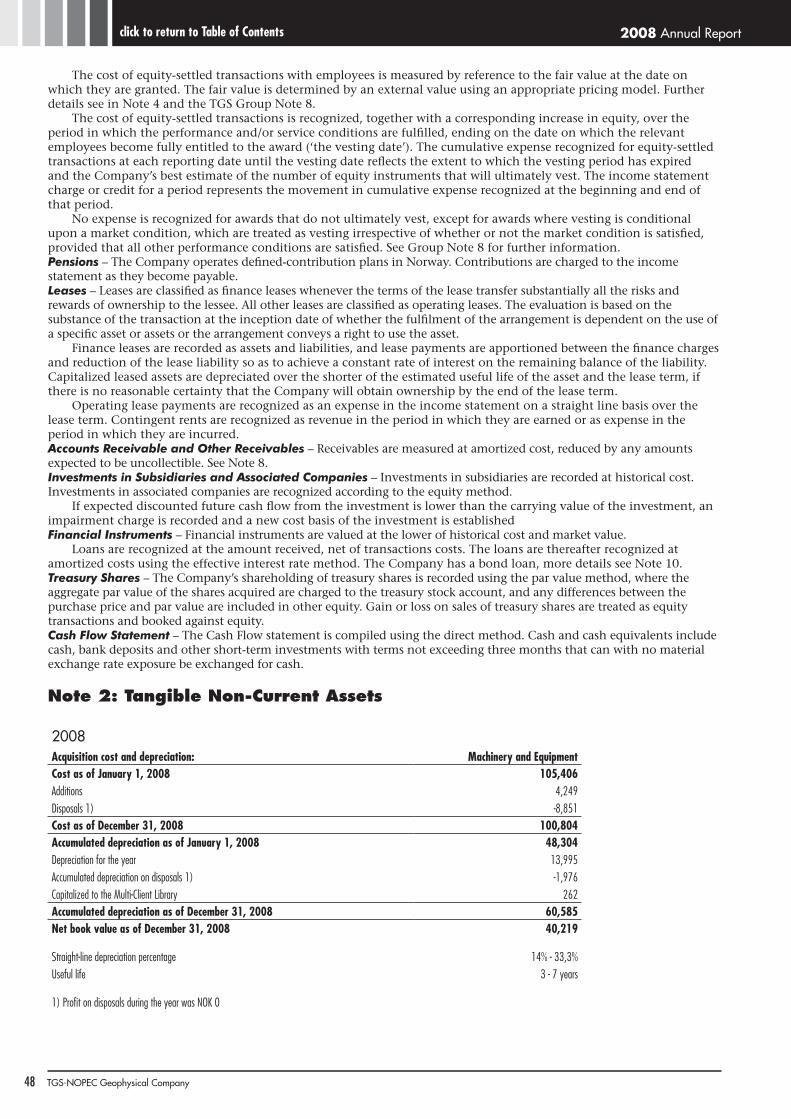
2008 Annual Report
48 TGS-NOPEC Geophysical Company
click to return to Table of Contents
The cost of equity-settled transactions with employees is measured by reference to the fair value at the date on which they are granted. The fair value is determined by an external value using an appropriate pricing model. Further details see in Note 4 and the TGS Group Note 8.
The cost of equity-settled transactions is recognized, together with a corresponding increase in equity, over the period in which the performance and/or service conditions are fulfilled, ending on the date on which the relevant employees become fully entitled to the award (‘the vesting date’). The cumulative expense recognized for equity-settled transactions at each reporting date until the vesting date reflects the extent to which the vesting period has expired and the Company’s best estimate of the number of equity instruments that will ultimately vest. The income statement charge or credit for a period represents the movement in cumulative expense recognized at the beginning and end of that period.
No expense is recognized for awards that do not ultimately vest, except for awards where vesting is conditional upon a market condition, which are treated as vesting irrespective of whether or not the market condition is satisfied, provided that all other performance conditions are satisfied. See Group Note 8 for further information.Pensions – The Company operates defined-contribution plans in Norway. Contributions are charged to the income statement as they become payable. Leases – Leases are classified as finance leases whenever the terms of the lease transfer substantially all the risks and rewards of ownership to the lessee. All other leases are classified as operating leases. The evaluation is based on the substance of the transaction at the inception date of whether the fulfilment of the arrangement is dependent on the use of a specific asset or assets or the arrangement conveys a right to use the asset.
Finance leases are recorded as assets and liabilities, and lease payments are apportioned between the finance charges and reduction of the lease liability so as to achieve a constant rate of interest on the remaining balance of the liability. Capitalized leased assets are depreciated over the shorter of the estimated useful life of the asset and the lease term, if there is no reasonable certainty that the Company will obtain ownership by the end of the lease term.
Operating lease payments are recognized as an expense in the income statement on a straight line basis over the lease term. Contingent rents are recognized as revenue in the period in which they are earned or as expense in the period in which they are incurred.Accounts Receivable and Other Receivables – Receivables are measured at amortized cost, reduced by any amounts expected to be uncollectible. See Note 8.Investments in Subsidiaries and Associated Companies – Investments in subsidiaries are recorded at historical cost. Investments in associated companies are recognized according to the equity method.
If expected discounted future cash flow from the investment is lower than the carrying value of the investment, an impairment charge is recorded and a new cost basis of the investment is establishedFinancial Instruments – Financial instruments are valued at the lower of historical cost and market value.
Loans are recognized at the amount received, net of transactions costs. The loans are thereafter recognized at amortized costs using the effective interest rate method. The Company has a bond loan, more details see Note 10. Treasury Shares – The Company’s shareholding of treasury shares is recorded using the par value method, where the aggregate par value of the shares acquired are charged to the treasury stock account, and any differences between the purchase price and par value are included in other equity. Gain or loss on sales of treasury shares are treated as equity transactions and booked against equity. Cash Flow Statement – The Cash Flow statement is compiled using the direct method. Cash and cash equivalents include cash, bank deposits and other short-term investments with terms not exceeding three months that can with no material exchange rate exposure be exchanged for cash.
Note 2: Tangible Non-Current Assets
2008Acquisition cost and depreciation: Machinery and equipmentCost as of January 1, 2008 105,406Additions 4,249Disposals 1) -8,851Cost as of December 31, 2008 100,804Accumulated depreciation as of January 1, 2008 48,304Depreciation for the year 13,995Accumulated depreciation on disposals 1) -1,976Capitalized to the Multi-Client Library 262Accumulated depreciation as of December 31, 2008 60,585Net book value as of December 31, 2008 40,219
Straight-line depreciation percentage 14% - 33,3%Useful life 3 - 7 years
1) Profit on disposals during the year was NOK 0
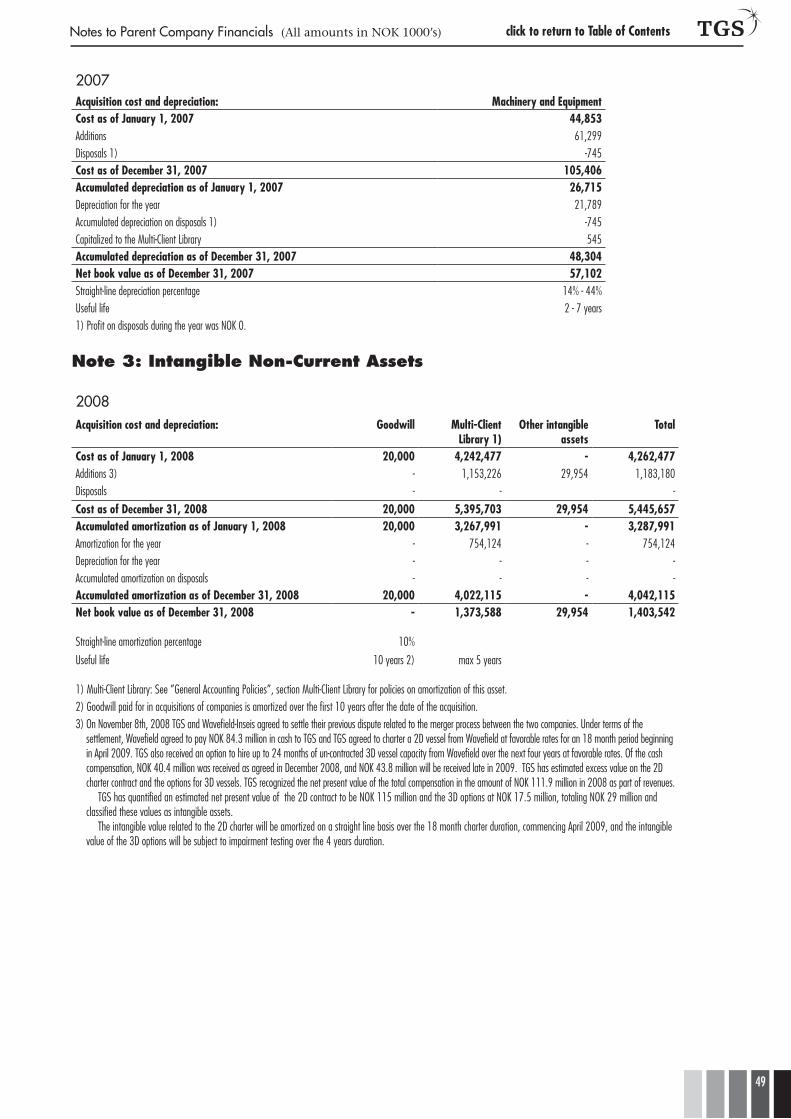
49
Notes to Parent Company Financials (All amounts in NOK 1000’s) click to return to Table of Contents
2007 Acquisition cost and depreciation: Machinery and equipmentCost as of January 1, 2007 44,853Additions 61,299Disposals 1) -745Cost as of December 31, 2007 105,406Accumulated depreciation as of January 1, 2007 26,715Depreciation for the year 21,789Accumulated depreciation on disposals 1) -745Capitalized to the Multi-Client Library 545Accumulated depreciation as of December 31, 2007 48,304Net book value as of December 31, 2007 57,102Straight-line depreciation percentage 14% - 44%Useful life 2 - 7 years1) Profit on disposals during the year was NOK 0.
Note 3: Intangible Non-Current Assets
2008Acquisition cost and depreciation: Goodwill Multi-Client
Library 1)Other intangible
assetsTotal
Cost as of January 1, 2008 20,000 4,242,477 - 4,262,477Additions 3) - 1,153,226 29,954 1,183,180Disposals - - - Cost as of December 31, 2008 20,000 5,395,703 29,954 5,445,657Accumulated amortization as of January 1, 2008 20,000 3,267,991 - 3,287,991Amortization for the year - 754,124 - 754,124Depreciation for the year - - - - Accumulated amortization on disposals - - - - Accumulated amortization as of December 31, 2008 20,000 4,022,115 - 4,042,115Net book value as of December 31, 2008 - 1,373,588 29,954 1,403,542
Straight-line amortization percentage 10%
Useful life 10 years 2) max 5 years
1) Multi-Client Library: See ”General Accounting Policies”, section Multi-Client Library for policies on amortization of this asset.2) Goodwill paid for in acquisitions of companies is amortized over the first 10 years after the date of the acquisition. 3) On November 8th, 2008 TGS and Wavefield-Inseis agreed to settle their previous dispute related to the merger process between the two companies. Under terms of the
settlement, Wavefield agreed to pay NOK 84.3 million in cash to TGS and TGS agreed to charter a 2D vessel from Wavefield at favorable rates for an 18 month period beginning in April 2009. TGS also received an option to hire up to 24 months of un-contracted 3D vessel capacity from Wavefield over the next four years at favorable rates. Of the cash compensation, NOK 40.4 million was received as agreed in December 2008, and NOK 43.8 million will be received late in 2009. TGS has estimated excess value on the 2D charter contract and the options for 3D vessels. TGS recognized the net present value of the total compensation in the amount of NOK 111.9 million in 2008 as part of revenues.
TGS has quantified an estimated net present value of the 2D contract to be NOK 115 million and the 3D options at NOK 17.5 million, totaling NOK 29 million and classified these values as intangible assets.
The intangible value related to the 2D charter will be amortized on a straight line basis over the 18 month charter duration, commencing April 2009, and the intangible value of the 3D options will be subject to impairment testing over the 4 years duration.
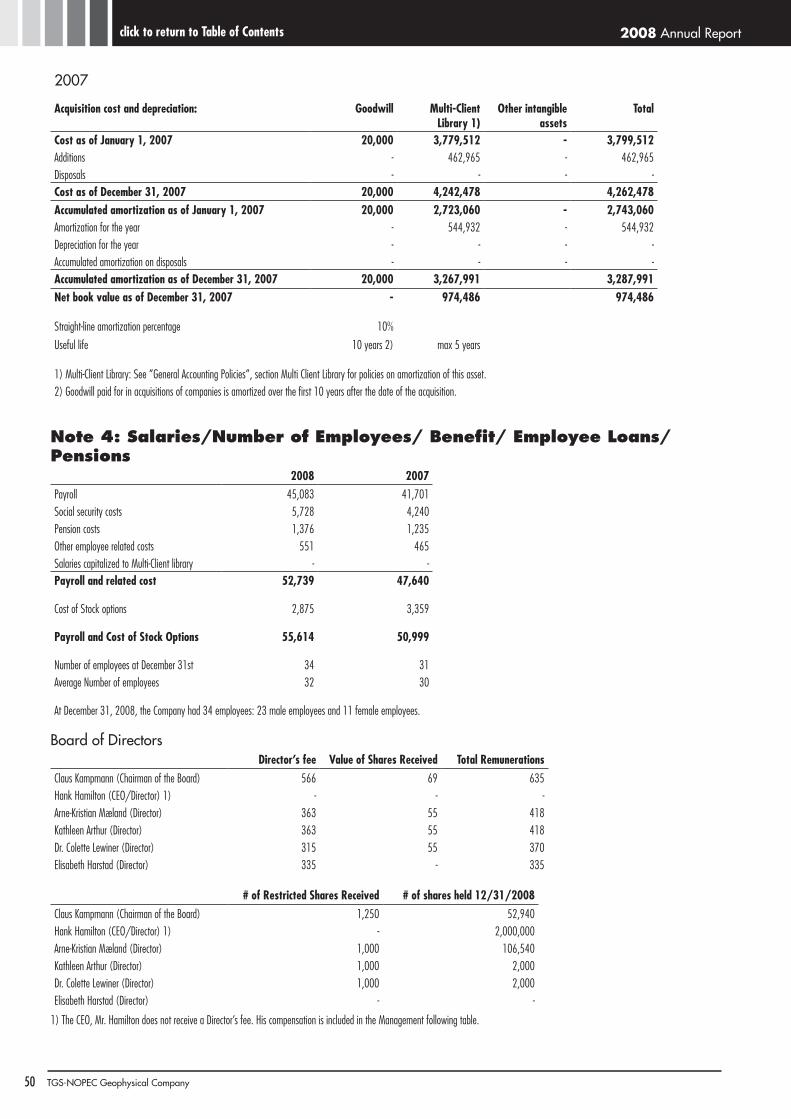
2008 Annual Report
50 TGS-NOPEC Geophysical Company
click to return to Table of Contents
2007
Acquisition cost and depreciation: Goodwill Multi-Client Library 1)
Other intangible assets
Total
Cost as of January 1, 2007 20,000 3,779,512 - 3,799,512Additions - 462,965 - 462,965Disposals - - - - Cost as of December 31, 2007 20,000 4,242,478 4,262,478Accumulated amortization as of January 1, 2007 20,000 2,723,060 - 2,743,060Amortization for the year - 544,932 - 544,932Depreciation for the year - - - - Accumulated amortization on disposals - - - - Accumulated amortization as of December 31, 2007 20,000 3,267,991 3,287,991Net book value as of December 31, 2007 - 974,486 974,486
Straight-line amortization percentage 10%
Useful life 10 years 2) max 5 years
1) Multi-Client Library: See ”General Accounting Policies”, section Multi Client Library for policies on amortization of this asset.2) Goodwill paid for in acquisitions of companies is amortized over the first 10 years after the date of the acquisition.
Note 4: Salaries/Number of Employees/ Benefit/ Employee Loans/ Pensions
2008 2007Payroll 45,083 41,701Social security costs 5,728 4,240Pension costs 1,376 1,235Other employee related costs 551 465Salaries capitalized to Multi-Client library - - Payroll and related cost 52,739 47,640
Cost of Stock options 2,875 3,359
Payroll and Cost of stock Options 55,614 50,999
Number of employees at December 31st 34 31Average Number of employees 32 30
At December 31, 2008, the Company had 34 employees: 23 male employees and 11 female employees.
Board of DirectorsDirector’s fee Value of shares Received Total Remunerations
Claus Kampmann (Chairman of the Board) 566 69 635 hank hamilton (CEO/Director) 1) - - - Arne-Kristian Mæland (Director) 363 55 418 Kathleen Arthur (Director) 363 55 418 Dr. Colette Lewiner (Director) 315 55 370 Elisabeth harstad (Director) 335 - 335
# of Restricted shares Received # of shares held 12/31/2008Claus Kampmann (Chairman of the Board) 1,250 52,940 hank hamilton (CEO/Director) 1) - 2,000,000 Arne-Kristian Mæland (Director) 1,000 106,540 Kathleen Arthur (Director) 1,000 2,000 Dr. Colette Lewiner (Director) 1,000 2,000 Elisabeth harstad (Director) - -
1) The CEO, Mr. hamilton does not receive a Director’s fee. his compensation is included in the Management following table.
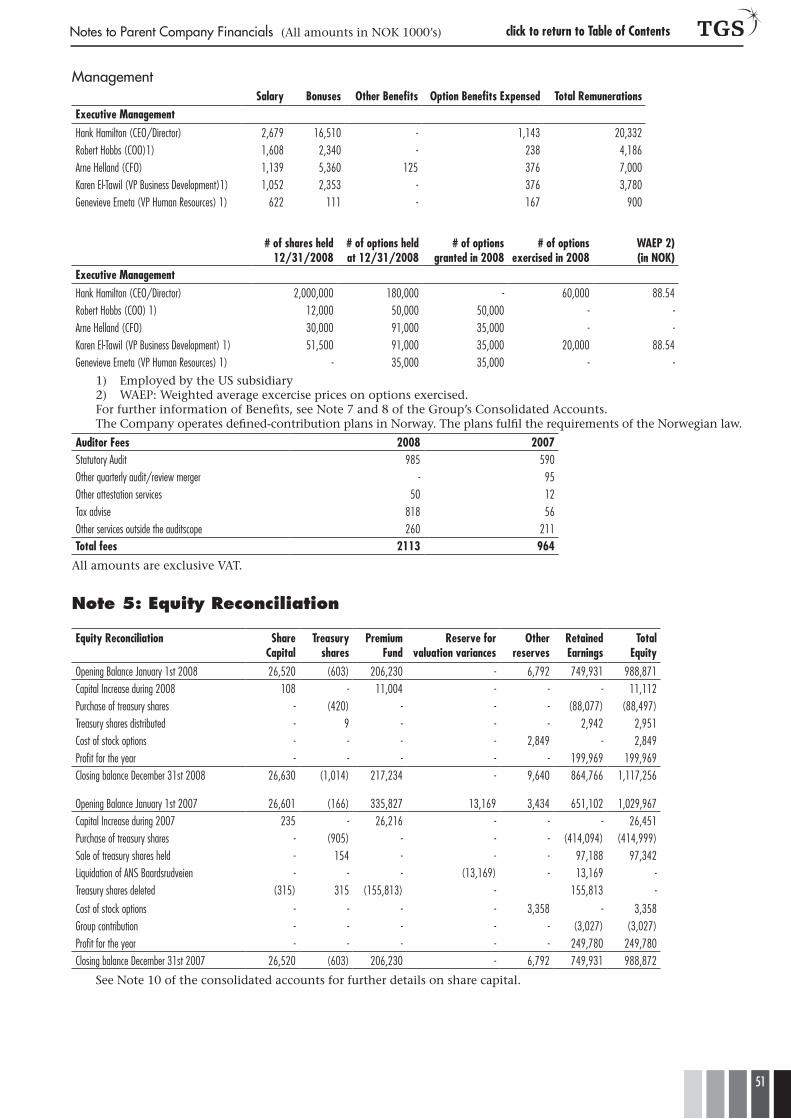
51
Notes to Parent Company Financials (All amounts in NOK 1000’s) click to return to Table of Contents
Managementsalary Bonuses Other Benefits Option Benefits expensed Total Remunerations
executive Managementhank hamilton (CEO/Director) 2,679 16,510 - 1,143 20,332 Robert hobbs (COO)1) 1,608 2,340 - 238 4,186 Arne helland (CFO) 1,139 5,360 125 376 7,000 Karen El-Tawil (VP Business Development)1) 1,052 2,353 - 376 3,780 Genevieve Erneta (VP human Resources) 1) 622 111 - 167 900
# of shares held 12/31/2008
# of options held at 12/31/2008
# of options granted in 2008
# of options exercised in 2008
WAeP 2) (in NOK)
executive Managementhank hamilton (CEO/Director) 2,000,000 180,000 - 60,000 88.54 Robert hobbs (COO) 1) 12,000 50,000 50,000 - - Arne helland (CFO) 30,000 91,000 35,000 - - Karen El-Tawil (VP Business Development) 1) 51,500 91,000 35,000 20,000 88.54 Genevieve Erneta (VP human Resources) 1) - 35,000 35,000 - -
1) Employed by the US subsidiary2) WAEP: Weighted average excercise prices on options exercised.For further information of Benefits, see Note 7 and 8 of the Group’s Consolidated Accounts.The Company operates defined-contribution plans in Norway. The plans fulfil the requirements of the Norwegian law.
Auditor Fees 2008 2007Statutory Audit 985 590Other quarterly audit/review merger - 95Other attestation services 50 12Tax advise 818 56Other services outside the auditscope 260 211Total fees 2113 964
All amounts are exclusive VAT.
Note 5: Equity Reconciliation
equity Reconciliation share Capital
Treasury shares
Premium Fund
Reserve for valuation variances
Other reserves
Retained earnings
Total equity
Opening Balance January 1st 2008 26,520 (603) 206,230 - 6,792 749,931 988,871 Capital Increase during 2008 108 - 11,004 - - - 11,112 Purchase of treasury shares - (420) - - - (88,077) (88,497)Treasury shares distributed - 9 - - - 2,942 2,951 Cost of stock options - - - - 2,849 - 2,849 Profit for the year - - - - - 199,969 199,969 Closing balance December 31st 2008 26,630 (1,014) 217,234 - 9,640 864,766 1,117,256
Opening Balance January 1st 2007 26,601 (166) 335,827 13,169 3,434 651,102 1,029,967 Capital Increase during 2007 235 - 26,216 - - - 26,451 Purchase of treasury shares - (905) - - - (414,094) (414,999)Sale of treasury shares held - 154 - - - 97,188 97,342 Liquidation of ANS Baardsrudveien - - - (13,169) - 13,169 - Treasury shares deleted (315) 315 (155,813) - 155,813 -
Cost of stock options - - - - 3,358 - 3,358 Group contribution - - - - - (3,027) (3,027)Profit for the year - - - - - 249,780 249,780 Closing balance December 31st 2007 26,520 (603) 206,230 - 6,792 749,931 988,872
See Note 10 of the consolidated accounts for further details on share capital.
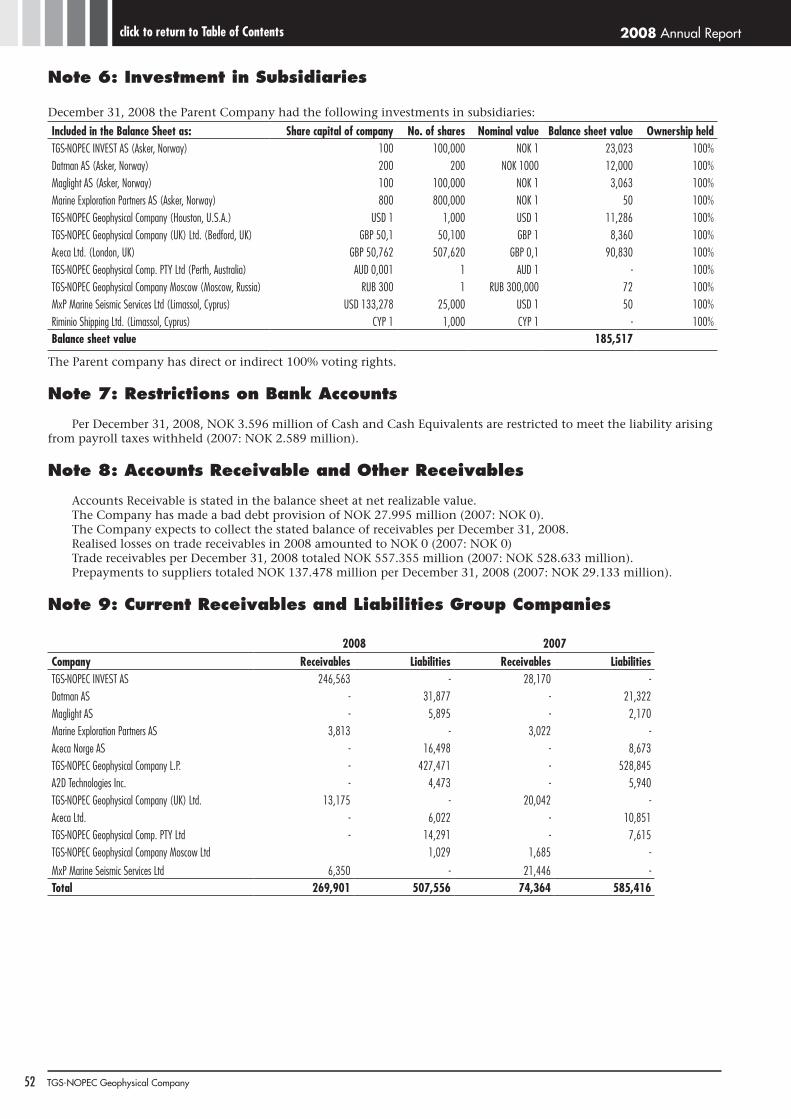
2008 Annual Report
52 TGS-NOPEC Geophysical Company
click to return to Table of Contents
Note 6: Investment in Subsidiaries
December 31, 2008 the Parent Company had the following investments in subsidiaries:
Included in the Balance sheet as: share capital of company No. of shares Nominal value Balance sheet value Ownership heldTGS-NOPEC INVEST AS (Asker, Norway) 100 100,000 NOK 1 23,023 100%Datman AS (Asker, Norway) 200 200 NOK 1000 12,000 100%Maglight AS (Asker, Norway) 100 100,000 NOK 1 3,063 100%Marine Exploration Partners AS (Asker, Norway) 800 800,000 NOK 1 50 100%TGS-NOPEC Geophysical Company (houston, U.S.A.) USD 1 1,000 USD 1 11,286 100%TGS-NOPEC Geophysical Company (UK) Ltd. (Bedford, UK) GBP 50,1 50,100 GBP 1 8,360 100%Aceca Ltd. (London, UK) GBP 50,762 507,620 GBP 0,1 90,830 100%TGS-NOPEC Geophysical Comp. PTY Ltd (Perth, Australia) AUD 0,001 1 AUD 1 - 100%TGS-NOPEC Geophysical Company Moscow (Moscow, Russia) RUB 300 1 RUB 300,000 72 100%MxP Marine Seismic Services Ltd (Limassol, Cyprus) USD 133,278 25,000 USD 1 50 100%Riminio Shipping Ltd. (Limassol, Cyprus) CYP 1 1,000 CYP 1 - 100%Balance sheet value 185,517
The Parent company has direct or indirect 100% voting rights.
Note 7: Restrictions on Bank Accounts
Per December 31, 2008, NOK 3.596 million of Cash and Cash Equivalents are restricted to meet the liability arising from payroll taxes withheld (2007: NOK 2.589 million).
Note 8: Accounts Receivable and Other Receivables
Accounts Receivable is stated in the balance sheet at net realizable value. The Company has made a bad debt provision of NOK 27.995 million (2007: NOK 0). The Company expects to collect the stated balance of receivables per December 31, 2008.Realised losses on trade receivables in 2008 amounted to NOK 0 (2007: NOK 0)Trade receivables per December 31, 2008 totaled NOK 557.355 million (2007: NOK 528.633 million).Prepayments to suppliers totaled NOK 137.478 million per December 31, 2008 (2007: NOK 29.133 million).
Note 9: Current Receivables and Liabilities Group Companies
2008 2007Company Receivables Liabilities Receivables LiabilitiesTGS-NOPEC INVEST AS 246,563 - 28,170 - Datman AS - 31,877 - 21,322 Maglight AS - 5,895 - 2,170 Marine Exploration Partners AS 3,813 - 3,022 - Aceca Norge AS - 16,498 - 8,673 TGS-NOPEC Geophysical Company L.P. - 427,471 - 528,845 A2D Technologies Inc. - 4,473 - 5,940 TGS-NOPEC Geophysical Company (UK) Ltd. 13,175 - 20,042 - Aceca Ltd. - 6,022 - 10,851 TGS-NOPEC Geophysical Comp. PTY Ltd - 14,291 - 7,615 TGS-NOPEC Geophysical Company Moscow Ltd 1,029 1,685 -
MxP Marine Seismic Services Ltd 6,350 - 21,446 - Total 269,901 507,556 74,364 585,416
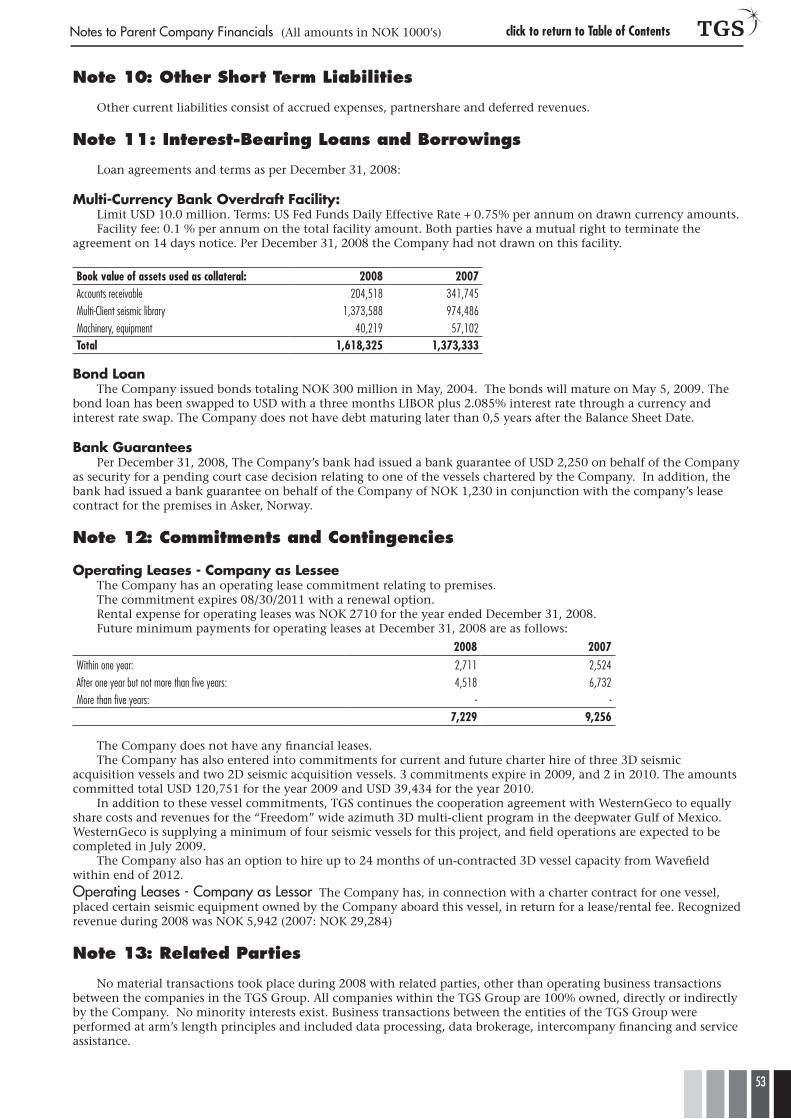
53
Notes to Parent Company Financials (All amounts in NOK 1000’s) click to return to Table of Contents
Note 10: Other Short Term Liabilities
Other current liabilities consist of accrued expenses, partnershare and deferred revenues.
Note 11: Interest-Bearing Loans and Borrowings
Loan agreements and terms as per December 31, 2008:
Multi-Currency bank Overdraft Facility: Limit USD 10.0 million. Terms: US Fed Funds Daily Effective Rate + 0.75% per annum on drawn currency amounts.Facility fee: 0.1 % per annum on the total facility amount. Both parties have a mutual right to terminate the
agreement on 14 days notice. Per December 31, 2008 the Company had not drawn on this facility.
Book value of assets used as collateral: 2008 2007Accounts receivable 204,518 341,745Multi-Client seismic library 1,373,588 974,486Machinery, equipment 40,219 57,102Total 1,618,325 1,373,333
bond Loan The Company issued bonds totaling NOK 300 million in May, 2004. The bonds will mature on May 5, 2009. The
bond loan has been swapped to USD with a three months LIBOR plus 2.085% interest rate through a currency and interest rate swap. The Company does not have debt maturing later than 0,5 years after the Balance Sheet Date.
bank Guarantees Per December 31, 2008, The Company’s bank had issued a bank guarantee of USD 2,250 on behalf of the Company
as security for a pending court case decision relating to one of the vessels chartered by the Company. In addition, the bank had issued a bank guarantee on behalf of the Company of NOK 1,230 in conjunction with the company’s lease contract for the premises in Asker, Norway.
Note 12: Commitments and Contingencies
Operating Leases - Company as Lessee The Company has an operating lease commitment relating to premises. The commitment expires 08/30/2011 with a renewal option.Rental expense for operating leases was NOK 2710 for the year ended December 31, 2008.Future minimum payments for operating leases at December 31, 2008 are as follows:
2008 2007Within one year: 2,711 2,524After one year but not more than five years: 4,518 6,732More than five years: - -
7,229 9,256
The Company does not have any financial leases.The Company has also entered into commitments for current and future charter hire of three 3D seismic
acquisition vessels and two 2D seismic acquisition vessels. 3 commitments expire in 2009, and 2 in 2010. The amounts committed total USD 120,751 for the year 2009 and USD 39,434 for the year 2010.
In addition to these vessel commitments, TGS continues the cooperation agreement with WesternGeco to equally share costs and revenues for the “Freedom” wide azimuth 3D multi-client program in the deepwater Gulf of Mexico. WesternGeco is supplying a minimum of four seismic vessels for this project, and field operations are expected to be completed in July 2009.
The Company also has an option to hire up to 24 months of un-contracted 3D vessel capacity from Wavefield within end of 2012.Operating Leases - Company as Lessor The Company has, in connection with a charter contract for one vessel, placed certain seismic equipment owned by the Company aboard this vessel, in return for a lease/rental fee. Recognized revenue during 2008 was NOK 5,942 (2007: NOK 29,284)
Note 13: Related Parties
No material transactions took place during 2008 with related parties, other than operating business transactions between the companies in the TGS Group. All companies within the TGS Group are 100% owned, directly or indirectly by the Company. No minority interests exist. Business transactions between the entities of the TGS Group were performed at arm’s length principles and included data processing, data brokerage, intercompany financing and service assistance.
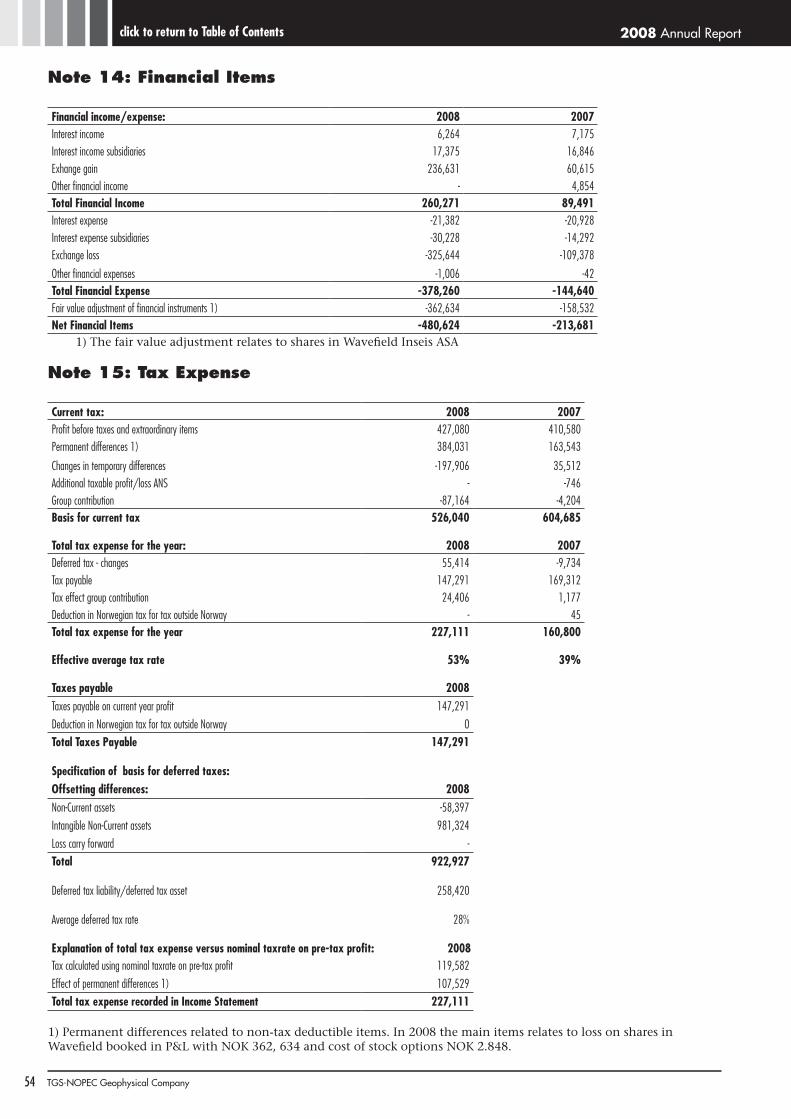
2008 Annual Report
54 TGS-NOPEC Geophysical Company
click to return to Table of Contents
Note 14: Financial Items
Financial income/expense: 2008 2007Interest income 6,264 7,175 Interest income subsidiaries 17,375 16,846 Exhange gain 236,631 60,615 Other financial income - 4,854 Total Financial Income 260,271 89,491 Interest expense -21,382 -20,928 Interest expense subsidiaries -30,228 -14,292 Exchange loss -325,644 -109,378
Other financial expenses -1,006 -42 Total Financial expense -378,260 -144,640 Fair value adjustment of financial instruments 1) -362,634 -158,532 Net Financial Items -480,624 -213,681
1) The fair value adjustment relates to shares in Wavefield Inseis ASA
Note 15: Tax Expense
Current tax: 2008 2007Profit before taxes and extraordinary items 427,080 410,580 Permanent differences 1) 384,031 163,543
Changes in temporary differences -197,906 35,512 Additional taxable profit/loss ANS - -746 Group contribution -87,164 -4,204 Basis for current tax 526,040 604,685
Total tax expense for the year: 2008 2007Deferred tax - changes 55,414 -9,734 Tax payable 147,291 169,312 Tax effect group contribution 24,406 1,177 Deduction in Norwegian tax for tax outside Norway - 45 Total tax expense for the year 227,111 160,800
effective average tax rate 53% 39%
Taxes payable 2008Taxes payable on current year profit 147,291Deduction in Norwegian tax for tax outside Norway 0Total Taxes Payable 147,291
specification of basis for deferred taxes:Offsetting differences: 2008Non-Current assets -58,397 Intangible Non-Current assets 981,324 Loss carry forward - Total 922,927
Deferred tax liability/deferred tax asset 258,420
Average deferred tax rate 28%
explanation of total tax expense versus nominal taxrate on pre-tax profit: 2008Tax calculated using nominal taxrate on pre-tax profit 119,582 Effect of permanent differences 1) 107,529 Total tax expense recorded in Income statement 227,111
1) Permanent differences related to non-tax deductible items. In 2008 the main items relates to loss on shares in Wavefield booked in P&L with NOK 362, 634 and cost of stock options NOK 2.848.
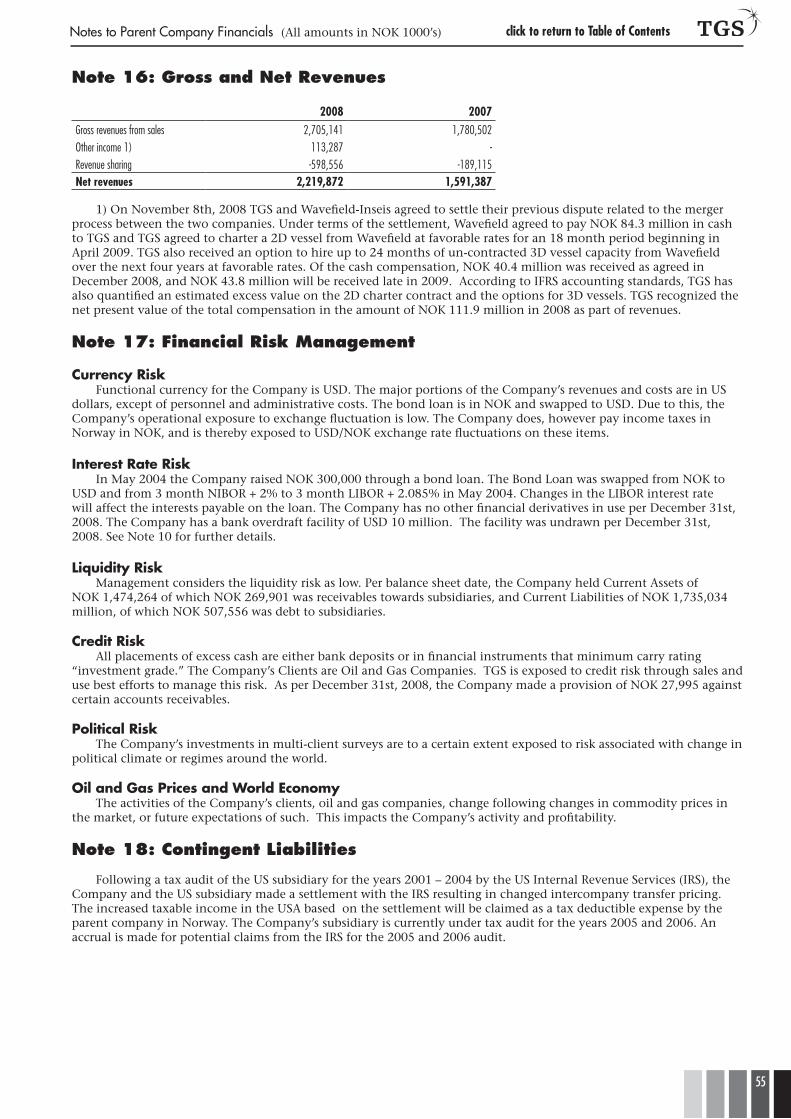
55
Notes to Parent Company Financials (All amounts in NOK 1000’s) click to return to Table of Contents
Note 16: Gross and Net Revenues
2008 2007Gross revenues from sales 2,705,141 1,780,502Other income 1) 113,287 -Revenue sharing -598,556 -189,115Net revenues 2,219,872 1,591,387
1) On November 8th, 2008 TGS and Wavefield-Inseis agreed to settle their previous dispute related to the merger process between the two companies. Under terms of the settlement, Wavefield agreed to pay NOK 84.3 million in cash to TGS and TGS agreed to charter a 2D vessel from Wavefield at favorable rates for an 18 month period beginning in April 2009. TGS also received an option to hire up to 24 months of un-contracted 3D vessel capacity from Wavefield over the next four years at favorable rates. Of the cash compensation, NOK 40.4 million was received as agreed in December 2008, and NOK 43.8 million will be received late in 2009. According to IFRS accounting standards, TGS has also quantified an estimated excess value on the 2D charter contract and the options for 3D vessels. TGS recognized the net present value of the total compensation in the amount of NOK 111.9 million in 2008 as part of revenues.
Note 17: Financial Risk Management
Currency Risk Functional currency for the Company is USD. The major portions of the Company’s revenues and costs are in US
dollars, except of personnel and administrative costs. The bond loan is in NOK and swapped to USD. Due to this, the Company’s operational exposure to exchange fluctuation is low. The Company does, however pay income taxes in Norway in NOK, and is thereby exposed to USD/NOK exchange rate fluctuations on these items.
interest Rate RiskIn May 2004 the Company raised NOK 300,000 through a bond loan. The Bond Loan was swapped from NOK to
USD and from 3 month NIBOR + 2% to 3 month LIBOR + 2.085% in May 2004. Changes in the LIBOR interest rate will affect the interests payable on the loan. The Company has no other financial derivatives in use per December 31st, 2008. The Company has a bank overdraft facility of USD 10 million. The facility was undrawn per December 31st, 2008. See Note 10 for further details.
Liquidity RiskManagement considers the liquidity risk as low. Per balance sheet date, the Company held Current Assets of
NOK 1,474,264 of which NOK 269,901 was receivables towards subsidiaries, and Current Liabilities of NOK 1,735,034 million, of which NOK 507,556 was debt to subsidiaries.
Credit RiskAll placements of excess cash are either bank deposits or in financial instruments that minimum carry rating
“investment grade.” The Company’s Clients are Oil and Gas Companies. TGS is exposed to credit risk through sales and use best efforts to manage this risk. As per December 31st, 2008, the Company made a provision of NOK 27,995 against certain accounts receivables.
Political RiskThe Company’s investments in multi-client surveys are to a certain extent exposed to risk associated with change in
political climate or regimes around the world.
Oil and Gas Prices and World EconomyThe activities of the Company’s clients, oil and gas companies, change following changes in commodity prices in
the market, or future expectations of such. This impacts the Company’s activity and profitability.
Note 18: Contingent Liabilities
Following a tax audit of the US subsidiary for the years 2001 – 2004 by the US Internal Revenue Services (IRS), the Company and the US subsidiary made a settlement with the IRS resulting in changed intercompany transfer pricing. The increased taxable income in the USA based on the settlement will be claimed as a tax deductible expense by the parent company in Norway. The Company’s subsidiary is currently under tax audit for the years 2005 and 2006. An accrual is made for potential claims from the IRS for the 2005 and 2006 audit.
2008 Annual Report
56 TGS-NOPEC Geophysical Company
click to return to Table of Contents
Note 19: Investment in Shares
Public shares listed on Oslo Stock Exchange
Company Currency Cost price Book value Market valueWavefield Inseis ASA NOK 717,988 196,683 196,683
The impairment loss in 2008 amounts to NOK 362.6 million. All these shares were sold in January 2009 at NOK 198.9 million.
Note 20: Environmental Conditions
The Company interacts with the external environment through the collection of seismic data and operation of vessels. The Company continues to work actively to minimize any impact on the environment. Regularly, monitoring and controls are carried out in order to limit the risk of pollutions. It is the Company’s policy to comply with national and international regulations.
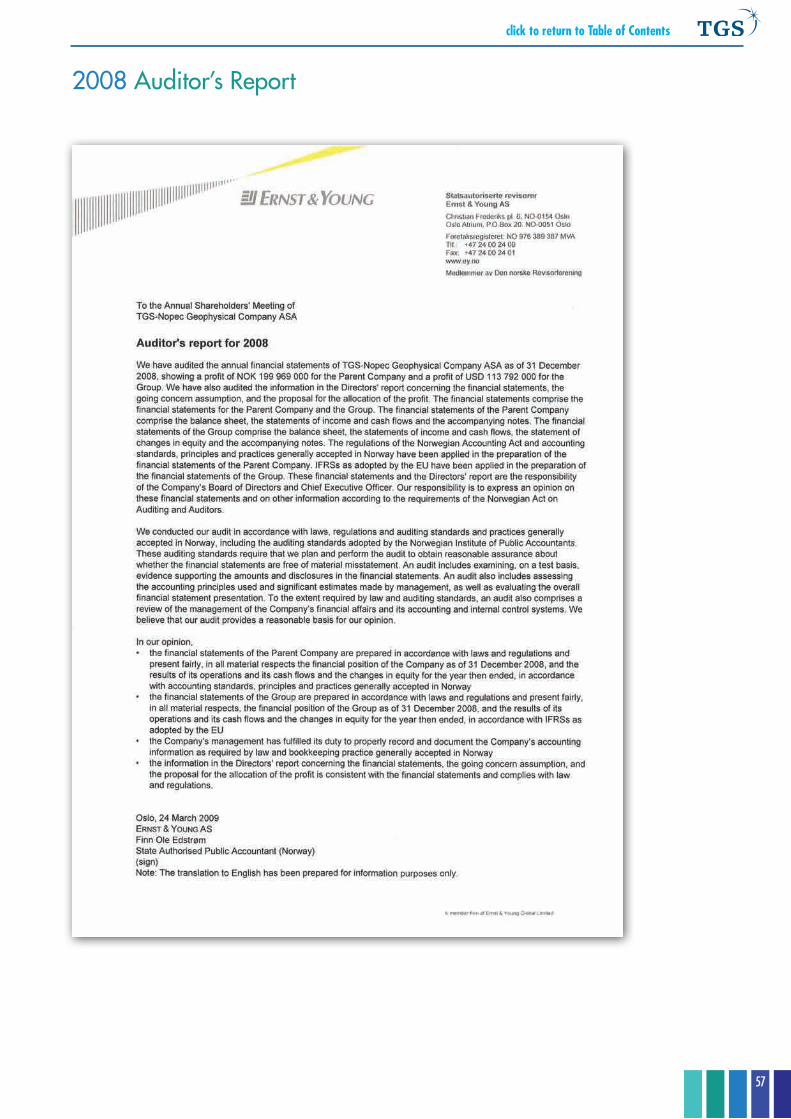
57
click to return to Table of Contents
2008 Auditor’s Report
2008 Annual Report
58 TGS-NOPEC Geophysical Company
click to return to Table of Contents
Corporate Governance and Articles of AssociationThis section is structured in accordance with the structure of the Norwegian Code of Practice for Corporate Governance.
1. IMPLEMENTATION AND REPORTING ON CORPORATE GOVERNANCE
“The Board of Directors must ensure that the company implements sound corporate governance. The Board of Directors must provide a report on the company’s corporate governance in the annual report. The report must cover every section of the Code of Practice. If the company does not fully comply with this Code of Practice, this must be explained in the report. The Board of Directors should define the company’s basic corporate values and formulate ethical guidelines in accordance with these values.”
It is the opinion of the Board of Directors that TGS in general complies with the Norwegian Code of Practice of Corporate Governance published 4. December, 2007. The Board fully endorses this section on Corporate Governance.
TGS actively promotes a culture designed to build confidence and trust among its stakeholders. Key elements of this culture include open and honest communication, a well-developed system of controls and policies, and a compliance program.
The Company emphasizes independence and integrity in all matters between its Board of Directors, management, and shareholders. These same principles of independence and integrity also apply in business relations with all interest groups, including customers, suppliers and other business partners. As guidelines for its board members and employees, TGS has developed a Statement of Values and a Code of Corporate Conduct, both available for viewing at: http://www.tgsnopec.com/investor-relations/about-TGS.aspx
TGS has developed and implemented a compliance program that is managed by a Board appointed compliance officer. The compliance officer provides a report annually to the Corporate Governance Committee of the Board.
2. BUSINESS
“The company’s business should be clearly defined in its articles of association. The company should have clear objectives and strategies for its business within the scope of the definition of its business in its articles of association. The annual report should include the business activities clause from the articles of association and describe the company’s objectives and principal strategies.”
Articles of AssociationAs of 5 September, 2008:
1. The company name is TGS-NOPEC Geophysical Company ASA. 2. The company is a public limited company registered in the Norwegian Securities Register. 3. The principal business area of the company is in the provision, procurement and sale of seismic and geophysical
data hereunder included associated products and services and technology to the oil and gas industry and to the production industry.
4. The company’s business office shall be in the municipality of Asker. The shareholders’ meetings can be held in the municipality of Oslo.
5. The company’s share capital is NOK 26,629,950 fully paid up and issued in 106,519,800 shares of NOK 0.25 each to named shareholders.
6. The company’s Board of Directors shall consist of from six to ten directors. The period of service is one year. The nomination of directors to the board, and the remuneration payable to the directors shall be prepared by a nomination committee consisting of one chairman and two members elected by and amongst the shareholders and who shall serve for a period of two years.
7. The ordinary shareholders’ meeting shall decide the following: Approval of the annual profit and loss account and the annual report, hereunder distribution of dividends.
Other matters that according to the laws or these articles of association shall be dealt with by the shareholders. 8. In addition the Public Limited Companies Act as amended from time to time shall apply.
3. EQUITY AND DIVIDENDS
“The company should have an equity capital at a level appropriate to its objectives, strategy and risk profile. The Board of Directors should establish a clear and predictable dividend policy as the basis for the proposals on dividend payments that it makes to the general meeting. The dividend policy should be disclosed. Mandates granted to the Board of Directors to increase the company’s share capital should be restricted to defined purposes and should be limited in time to no later than the date of the next annual general meeting. This should also apply to mandates granted to the board for the company to purchase its own shares.”
Equity financed 69% of total assets as of December 31st, 2008.
59
click to return to Table of ContentsCorporate Governance and Articles of Association
Dividend PolicyBecause of the extremely cyclical nature of the oil services industry, the Board of Directors remains convinced that the
Company’s unique business model, a strong balance sheet and a strong cash position, are essential to its financial health and future growth. The general policy of the Company at this time is to allocate profit to equity to allow for reinvestment into the growth of the Company. Thereafter, the Company considers allocation of profit to other alternatives such as stock buybacks or dividends.
The Company has not paid dividends during the last three years. As of March 24, 2009 the Board has the following shareholder authorizations:• To issue free-standing warrants securing stock options for key employees.• To buy back up to 10% of the Company’s outstanding shares (expires on June 5, 2009).For further information on these shareholder authorizations, please refer to Note 10 to the consolidated financial
statements.
4. EQUAL TREATMENT OF SHAREHOLDERS AND TRANSACTIONS WITH CLOSE ASSOCIATES
“The company should only have one class of shares. Any decision to waive the pre-emption rights of existing shareholders to subscribe for shares in the event of an increase in share capital must be justified. Any transactions the company carries out in its own shares should be carried out either through the stock exchange or at prevailing stock exchange prices if carried out in any other way. If there is limited liquidity in the company’s shares, the company should consider other ways to ensure equal treatment of all shareholders. In the event of any not immaterial transactions between the company and shareholders, members of the Board of Directors, members of the executive management or close associates of any such parties, the board should arrange for a valuation to be obtained from an independent third party. This will not apply if the transaction requires the approval of the general meeting pursuant to the requirements of the Public Companies Act. Independent valuations should also be arranged in respect of transactions between companies in the same group where any of the companies involved have minority shareholders. The company should operate guidelines to ensure that members of the Board of Directors and the executive management notify the board if they have any material direct or indirect interest in any transaction entered into by the company.”
Shareholders and Shareholders’ Rights• OneClassofShares. The Company has only one class of shares and each share gives the right to one vote at the
General Assembly. There are no voting restrictions. The Board puts emphasis on, to the extent possible, disclosing and describing the topics of the agenda and the proposed resolutions in the call for the assembly to allow the shareholders to prepare beforehand.
• TransactionswithCloseAssociates.No material transactions took place during 2008 with related parties.
5. FREELY NEGOTIABLE SHARES
“Shares in listed companies must, in principle, be freely negotiable. Therefore, no form of restriction on negotiability should be included in a company’s articles of association.”
Limitations on Trade The independent members of the Board have received restricted shares as a part of their compensation, which must be
held for at least one year before they can be traded. There are certain limitations to trading of shares for a small number of employees who are former owners of Parallel Data Systems Inc. and Centerline Data Corporation which expire in March 2010 and May 2011 respectively. There are no other limitations to trading of shares from the Company’s side, other than Insider Trading Rules for employees and the Board.
6. GENERAL MEETINGS
“The Board of Directors should take steps to ensure that as many shareholders as possible may exercise their rights by participating in general meetings of the company, and that general meetings are an effective forum for the views of shareholders and the board. Such steps should include:
• makingthenoticecallingthemeetingandthesupportinformationontheresolutionstobeconsideredat the general meeting, including the recommendations of the nomination committee, available on the company’s website no later than 21 days prior to the date of the general meeting, and sending this information to shareholders no later than two weeks prior to the date of the general meeting.
• ensuringthattheresolutionsandsupportinginformationdistributedaresufficientlydetailedandcomprehensive to allow shareholders to form a view on all matters to be considered at the meeting.
• settinganydeadlineforshareholderstogivenoticeoftheirintentiontoattendthemeetingasclosetothe date of the meeting as possible.
• ensuringthatshareholderswhocannotattendthemeetinginpersoncanvotebyproxy.• ensuringthatthemembersoftheBoardofDirectorsandthenominationcommitteeandtheauditor
are present at the general meeting.• makingarrangementstoensureanindependentchairmanforthegeneralmeeting.The notice calling the general meeting shall provide information on the procedures shareholders must
observe in order to participate in and vote at the general meeting. The notice should also set out:
2008 Annual Report
60 TGS-NOPEC Geophysical Company
click to return to Table of Contents
• theprocedureforrepresentationatthemeetingthroughaproxy,includingaformtoappointaproxy.• therightforshareholderstoproposeresolutionsinrespectofmatterstobedealtwithbythegeneral
meeting.• theWebpageswherethenoticecallingthemeetingandothersupportingdocumentswillbemade
available.The company should, at the earliest possible opportunity, make available on its website:• informationontherightofshareholderstoproposematterstobeconsideredbythegeneralmeeting.• proposalsforresolutionstobeconsideredbythegeneralmeeting,alternativelycommentsonmatters
where no resolution is proposed.• aformforappointingaproxy.The Board of Directors and the chairman of the general meeting should ensure that the general meeting is
given the opportunity to vote separately for each candidate nominated for election to the company’s corporate bodies.”
The Company’s General Assembly is open for all shareholders, and any shareholder not attending the General Assembly can give proxy to vote on his/her behalf. Forms of Proxy are sent to the shareholders together with the call for the assembly. The proceedings in the General Assembly follow the agenda outlined in the call. Shareholders who wish to raise a topic in the General Assembly have the possibility to do so, but must then notify the Board of Directors of this in writing and in reasonable time before the call for the assembly is dispatched. The General Assembly cannot decide for a higher dividend than the Board of Directors has proposed for that year. It is not at this point accepted that the shareholders can participate in the annual meeting or vote through the internet. Shareholders are given the opportunity to vote separately for each candidate nominated for election to the Company’s Board.
7. NOMINATION COMMITTEE
“The company should have a nomination committee, and the general meeting should elect the chairperson and members of the nomination committee and should determine the committee’s remuneration. The nomination committee should be laid down in the company’s articles of association. The members of the nomination committee should be selected to take into account the interests of shareholders in general. The majority of the committee should be independent of the Board of Directors and the executive management. At least one member of the nomination committee should not be a member of the corporate assembly, committee of representatives or the board. No more than one member of the nomination committee should be a member of the Board of Directors, and any such member should not offer himself for re-election. The nomination committee should not include the company’s chief executive or any other member of the company’s executive management. The nomination committee’s duties are to propose candidates for election to the corporate assembly and the Board of Directors and to propose the fees to be paid to members of these bodies. The nomination committee should justify its recommendations. The company should provide information on the membership of the committee and any deadlines for submitting proposals to the committee.”
As required in the Company’s Articles of Association, the Nomination Committee is responsible for the nomination of directors to the board and the remuneration payable to the directors.
The Committee consists of a chairman and two members elected by and amongst the shareholders who also determine the committee’s remuneration. These serve for a period of 2 years. The members of the Election Committee currently are Nils B. Gulnes (Chair), Jarl Ulvin, and Tor Himberg Larsen, all independent. The terms of the current members expire in 2009.
The Company posts an invitation to shareholders at www.tgsnopec.com every January to propose candidates as Directors and members of the Nomination Committee to the committee.
8. BOARD OF DIRECTORS: COMPOSITION AND INDEPENDENCE
“The composition of the Board of Directors should ensure that the board can attend to the common interests of all shareholders and meets the company’s need for expertise, capacity and diversity. Attention should be paid to ensuring that the board can function effectively as a collegiate body. The composition of the Board of Directors should ensure that it can operate independently of any special interests. The majority of the shareholder elected members of the board should be independent of the company’s executive management and material business contacts. At least two of the members of the board elected by shareholders should be independent of the company’s main shareholder(s). The Board of Directors should not include representatives of the company’s executive management. If the board does include members of the executive management, the company should provide an explanation for this and implement consequential adjustments to the organisation of the work of the board, including the use of board committees to help ensure more independent preparation of matters for discussion by the board, cf. Section 9.
The chairman of the Board of Directors should be elected by the general meeting. The term of office for members of the Board of Directors should not be longer than two years at a time. The annual report should provide information to illustrate the expertise and capacity of the members of the Board of Directors and identify which members are considered to be independent. Members of the Board of Directors should be encouraged to own shares in the company.”
61
click to return to Table of ContentsCorporate Governance and Articles of Association
The Board of Directors currently consists of 6 members elected by the shareholders. The constitution of the Board reflects a strong background that balances specific industry experience with broader
industrial, financial and organizational experience. The CEO, Henry H. Hamilton, is also a member of the Board. Mr Hamilton was a large shareholder in TGS prior to the merger between TGS and Nopec in 1998 that created TGS as a listed company. He is still the 11th largest shareholder, holding approximately 2% of the Company’s shares. Because he is a member of executive management, Mr. Hamilton accordingly does not serve on the Board’s Compensation, Audit, or Corporate Governance committees.
All but one of the Directors are shareholders of TGS. A brief background description for each board member is listed below:Claus Kampmann, Chairman (Independent) – Age 59. Past President Geco-Prakla, VP Personnel Schlumberger
Ltd. First elected in 2002, became Chairman in 2004.Henry H. Hamilton III, CEO/Director – Age 49. Shell Oil Company, Former VP & GM of North and South America
for Schlumberger’s Geco-Prakla. Joined TGS as CEO in 1995. First elected in 1998.Arne-Kristian Maeland, Director (Independent) – Age 55. Phillips Petroleum Company Norway, Geco
Geophysical, Inc, co-founder and CFO of VMETRO ASA. First elected in 2001.Dr. Colette Lewiner, Director (Independent) – Age 63. Assistant professor at Paris University, Executive Vice
President at Electicite de France, Chairperson and CEO of SGN-Eurisys. Presently Vice President and Global Leader of the Energy, Utilities and Chemical sector at Capgemini. Board member at La Poste and Nexans. First elected in 2006.
Kathleen Arthur, Director (Independent) – Age 55. Chevron Corporation, former vice President Exploration and Production Deep Water Gulf of Mexico. Board member in Norse Energy Corp. First elected in 2006.
Elisabeth Harstad, Director (Independent) – Age 51. Senior Vice President and Managing Director of Det Norske Veritas (DNV) Research and Innovation. Various positions in DNV since 1981 interrupted by one year as research and industry co-ordinator at Neste Petroleum AS in 1992. Board member in Yara ASA and KAPNORD Fond AS. First elected in 2007.
9. THE WORK OF THE BOARD OF DIRECTORS
“The Board of Directors should produce an annual plan for its work, with particular emphasis on objectives, strategy and implementation. The Board of Directors should issue instructions for its own work as well as for the executive management with particular emphasis on clear internal allocation of responsibilities and duties. A deputy chairman should be elected for the purpose of chairing the board in the event that the chairman cannot or should not lead the work of the board. The Board of Directors should consider appointing board committees in order to help ensure thorough and independent preparation of matters relating to financial reporting and compensation paid to the members of the executive management. Membership of such sub-committees should be restricted to members of the board who are independent of the company’s executive management. The Board of Directors should provide details in the annual report of any board committees appointed. The Board of Directors should evaluate its performance and expertise annually.”
The Board operates under specific rules of procedure.The Board normally meets six times each year, but may hold additional meetings if circumstances so dictate. Two of these
board meetings deal with special company issues and last for up to two days. The merger issue with Wavefield-Inseis ASA triggered increased Board activity during the latter half of 2007 and in 2008. On at least a monthly basis the CEO updates the entire Board on the financial progress of the Company as well as other significant matters.
The Board sets specific objectives for the CEO on an annual basis.The issue of an election of a Deputy Chairman, as required by the Norwegian Code of Practice of Corporate Governance,
was discussed during 2008, but was deferred.
Board CommitteesThe following committees, composed of the Company’s independent directors, are established by the Board to monitor
and guide certain activities:
Audit Committee: Compensation Committee: Corporate Governance Committee Arne-K. Maeland * Kathleen Arthur * Elisabeth Harstad * Kathleen Arthur Colette Lewiner Colette Lewiner Colette Lewiner Elisabeth Harstad Arne-K. Maeland* denotes committee chairmanEach committee operates under a defined charter that may be viewed at: www.tgsnopec.com/investor-relations/about-tgs/
corporate-governance.aspx The Board of Directors evaluates its performance annually.
2008 Annual Report
62 TGS-NOPEC Geophysical Company
click to return to Table of Contents
10. RISK MANAGEMENT AND INTERNAL CONTROL
“The Board of Directors must ensure that the company has sound internal control and systems for risk management that are appropriate in relation to the extent and nature of the company’s activities. Internal control and the systems should also encompass the company’s corporate values and ethical guidelines. The Board of Directors should carry out an annual review of the company’s most important areas of exposure to risk and its internal control arrangements. The Board of Directors should provide an account in the annual report of the main features of the company’s internal control and risk management systems as they relate to the company’s financial reporting.”
The Board monitors movements in the different kinds of risks that TGS is exposed to and TGS constantly strives to maintain and improve its internal control processes.
The Board reviews risk management and internal controls through:1. The annual presentation of audit issues presented to the Audit Committee and the Board by the Company’s Auditor2. An annual presentation on risk management and internal control by the Chief Financial Officer during the Board’s
two day spring session3. Ad hoc situations that present themselves.The Board reviews at least annually the Company’s policies on cash management and investment of excess cash. The Company also has a compliance program that provides procedures for reporting illegal or unethical conduct in the
company directly to the Corporate Governance Committee of the Board. The Board has endorsed and fully supports the continued implementation of the compliance program. The compliance program is administered by the compliance officer/Legal Affairs Director of the Company. All compliance reports are maintained as confidential to the extent possible and no retaliation is allowed against reporting persons. The compliance officer provides an annual report on March 1st to the Corporate Governance Committee.
All agents, officers and key employees working for the Company must sign an annual anti-corruption compliance certification. Each employee of the Company has read and acknowledged the Company’s Code of Conduct.
11. REMUNERATION OF THE BOARD OF DIRECTORS
“The remuneration of the Board of Directors should reflect the board’s responsibility, expertise, time commitment and the complexity of the company’s activities. The remuneration of the Board of Directors should not be linked to the company’s performance. The company should not grant share options to members of its board. Members of the Board of Directors and/or companies with which they are associated should not take on specific assignments for the company in addition to their appointment as a member of the board. If they do nonetheless take on such assignments this should be disclosed to the full board. The remuneration for such additional duties should be approved by the board. The annual report should provide information on all remuneration paid to each member of the Board of Directors. Any remuneration in addition to normal directors’ fees should be specifically identified.”
TGS believes that remuneration to the Board of Directors should be designed to attract and retain an optimal Board structure in a competitive environment. Procedurally, the Directors’ fee is recommended by the Nomination Committee and determined by the shareholders at the annual general meeting each year. During the past recent years, the Directors’ compensation has been composed of both a fixed fee and a number of restricted TGS shares. Note 4 to the Financial Statements of the Parent Company details the remuneration for the past year.
12. REMUNERATION OF THE EXECUTIVE MANAGEMENT
“The Board of Directors is required by law to establish guidelines for the remuneration of the members of the executive management. These guidelines are communicated to the annual general meeting. The guidelines for the remuneration of the executive management should set out the main principles applied in determining the salary and other remuneration of the executive management. The guidelines should help to ensure convergence of the financial interests of the executive management and the shareholders. Performance-related remuneration of the executive management in the form of share options, bonus programs or the like should be linked to value creation for shareholders or the company’s earnings performance over time. Such arrangements, including share option arrangements, should incentivize performance and be based on quantifiable factors over which the employee in question can have influence.”
Salary and Other CompensationIt is critical to the continued success of TGS that we attract and retain highly engaged executives with great vision,
global experience and a strong drive for results. A robust, competitive compensation package is a primary tool to attract and retain the highly qualified individuals needed for TGS to succeed in today’s competitive world economy. Our compensation programs are designed to motivate and retain executive officers by rewarding individuals for advancing business strategies, the difficulty of achieving set objectives and the value of those objectives to the company and the shareholders. The cash and incentive compensation elements of the packages for the executive officers are determined based on the recommendation of the Compensation Committee, composed entirely of independent directors, to the Board of Directors. The Compensation Committee seeks ratification by the other independent directors of all compensation items for executive officers. The
63
click to return to Table of ContentsCorporate Governance and Articles of Association
compensation program for executive officers consists of cash in the form of base salary, annual performance bonus linked to the TGS Group’s operating profit, and to lesser degree long-term, stock options incentives.
We balance the various compensation elements in a way that recognizes the individual’s responsibilities and his or her abilities to influence the short- and long-term growth of the company. As executives rise in the company an increasing percentage of their cash compensation is contingent on the achievement of company targets thereby returning value to the shareholders and ensuring executives have a personal stake in TGS’ performance. Through the bonus program individual bonus targets are determined based on individual contribution and achievement of the bonus is dependent on the company’s overall performance rather than focusing narrowly on individual business units or functions. TGS’ compensation philosophy for executive officers acts as a strategic lever to encourage the over-achievement of targets and penalize under-achievement while remaining responsive to our unique business strategy and talent needs. We will continually look for ways to encourage executives to provide the best results for the shareholders.
The Board of Directors believes that the issuance of stock options is a valuable tool to aid in the retention of key employees and serves to reinforce the importance of maintaining a longer-term focus towards company value creation. A limited amount of share options are usually issued each year upon the approval of the Board of Directors. The Compensation Committee makes a recommendation to the Board of Directors for the amount of share options to be issued to the executives. The number of options offered in the grant is directly linked to company and individual performance. As a general policy, stock options are issued at market price when granted, vest over a four-year period starting on the first anniversary of the grant and expire five years after the approval by shareholders at the Annual Meeting of the warrants that secure the rights to option shares. Thus, earning options requires performance over an extended period of time. In general, employees are not eligible to receive option grants in consecutive years.
The Compensation Committee believes executive compensation should be reasonable and fair according to prevailing industry standards in the geographical markets where the TGS Group operates, and understandable relative to scale, complexity and performance. The Compensation Committee ensures that executive compensation is administered consistently according to the compensation philosophy and regularly reports its actions to the full Board of Directors. Company results are reviewed by external auditors to ensure appropriate controls are in place related to company results. In accordance with the Norwegian Public Limited Liabilities Act the executive officers to § S6-16a, the Committee will present a statement regarding the Company’s policies for management compensation to the Annual Meeting on June 4th, 2009.
13. INFORMATION AND COMMUNICATIONS
“The Board of Directors should establish guidelines for the company’s reporting of financial and other information based on openness and taking into account the requirement for equal treatment of all participants in the securities market. The company should publish an overview each year of the dates for major events such as its annual general meeting, publication of interim reports, public presentations, dividend payment date if appropriate etc.
All information distributed to the company’s shareholders should be published on the company’s web site at the same time as it is sent to shareholders.
The Board of Directors should establish guidelines for the company’s contact with shareholders other than through general meetings.”
TGS’s investor relations policy is designed to inform the stock market and all shareholders of the Company’s activities and status in a timely and accurate manner. The Company submits quarterly and annual financial reports to the OSE as well as any interim information of significance for assessing the Company’s value. This information is also available via the Company’s web site.
The Company places great emphasis on providing the same information to all investors; national and international, and all press releases and news are published in English only. To this end, the Company’s quarterly earnings presentations are recorded and made available as webcasts or slide presentations in real time. The Company also makes national and international presentations and conducts road shows throughout the year to inform existing and potential investors about TGS.
The financial calendar displaying the dates for the coming years’ interim reports and General Meetings for shareholders is posted at: www.tgsnopec.com
14. TAKE-OVERS
“The Board of Directors should establish guiding principles for how it will act in the event of a take-over bid. During the course of a take-over process, the Board of Directors and management of both the party making the offer and the target company have an independent responsibility to help ensure that shareholders in the target company are treated equally, and that the target company’s business activities are not disrupted unnecessarily. The board of the target company has a particular responsibility to ensure that shareholders are given sufficient information and time to form a view of the offer. The Board of Directors should not seek to hinder or obstruct take-over bids for the company’s activities or shares unless there are particular reasons for this.
In the event of a take-over bid for the company’s shares, the company’s Board of Directors should not exercise mandates or pass any resolutions with the intention of obstructing the take-over bid unless this is
2008 Annual Report
64 TGS-NOPEC Geophysical Company
click to return to Table of Contents
approved by the general meeting following announcement of the bid. If an offer is made for a company’s shares, the company’s Board of Directors should issue a statement evaluating the offer and making a recommendation as to whether shareholders should or should not accept the offer. If the board finds itself unable to give a recommendation to shareholders on whether or not to accept the offer, it should explain the background for not making such a recommendation. The board’s statement on a bid should make it clear whether the views expressed are unanimous, and if this is not the case it should explain the basis on which specific members of the board have excluded themselves from the board’s statement. The board should consider whether to arrange a valuation from an independent expert. If any member of the board or executive management, or close associates of such individuals, or anyone who has recently held such a position, is either the bidder or has a particular personal interest in the bid, the board should arrange an independent valuation in any case. This shall also apply if the bidder is a major shareholder. Any such valuation should be either appended to the board’s statement, be reproduced in the statement or be referred to in the statement. Any transaction that is in effect a disposal of the company’s activities should be decided by a general meeting, except in cases where such decisions are required by law to be decided by the corporate assembly.”
The Board of Directors has established guiding principles for how it will act in the event of a take-over bid received.During the course of a take-over process, the Board of Directors and management of both the party making the offer and
the target company have an independent responsibility to help ensure that shareholders in the target company are treated equally, and that the target company’s business activities are not disrupted unnecessarily.
The Board of the target company has a particular responsibility to ensure that shareholders are given sufficient information and time to form a view of the offer.
The Board of Directors will not seek to hinder or obstruct take-over bids for the Company’s activities or shares unless there are particular reasons for this.
In the event of a take-over bid for the company’s shares, the company’s Board of Directors will not exercise mandates or pass any resolutions with the intention of obstructing the take-over bid unless this is approved by the general meeting following announcement of the bid.
If an offer is made for TGS’s shares, the Board of Directors will issue a statement evaluating the offer and making a recommendation as to whether shareholders should or should not accept the offer. If the Board finds itself unable to give a recommendation to shareholders on whether or not to accept the offer, it will explain the background for not making such a recommendation. The Board’s statement on a bid will make it clear whether the views expressed are unanimous, and if this is not the case, the Board will explain the basis on which specific members of the board have excluded themselves from the Board’s statement. The Board will consider whether to arrange for a valuation of TGS from an independent expert. If any member of the Board or executive management, or close associates of such individuals, or anyone who has recently held such a position, is either the bidder or has a particular personal interest in the bid, the Board will arrange an independent valuation in any case. This will also apply if the bidder is a major shareholder. Any such valuation should be either appended to the Board’s statement, be reproduced in the statement or be referred to in the statement.
Any transaction that is in effect a disposal of the Company’s total activities shall be decided by a general meeting.
15. AUDITOR
“The auditor should submit the main features of the plan for the audit of the company to the Board of Directors annually. The auditor should participate in meetings of the Board of Directors that deal with the annual accounts. At these meetings the auditor should review any material changes in the company’s accounting principles, comment on any material estimated accounting figures and report all material matters on which there has been disagreement between the auditor and the executive management of the company.
The auditor should at least once a year present to the Board of Directors a review of the company’s internal control procedures, including identified weaknesses and proposals for improvement. The Board of Directors should hold a meeting with the auditor at least once a year at which neither the chief executive nor any other member of the executive management is present.
The Board of Directors should establish guidelines in respect of the use of the auditor by the company’s executive management for services other than the audit. The board should receive annual written confirmation from the auditor that the auditor continues to satisfy the requirements for independence. In addition, the auditor should provide the board with a summary of all services in addition to audit work that have been undertaken for the company.
The Board of Directors must report the remuneration paid to the auditor at the annual general meeting, including details of the fee paid for audit work and any fees paid for other specific assignments.”
The external auditor reports to the Board of Directors at the board meeting that deals with the annual accounts. Independent of the Company’s management, the Audit Committee meets annually with the partner of the Company’s external audit firm. The auditor makes and presents to the Board annually a review of the Company’s internal control procedures, including identified weaknesses and proposals for improvement.
The auditor’s fee is determined at the annual general meeting (see Note 7 to the Financial Statements for Auditor’s compensation for 2008).
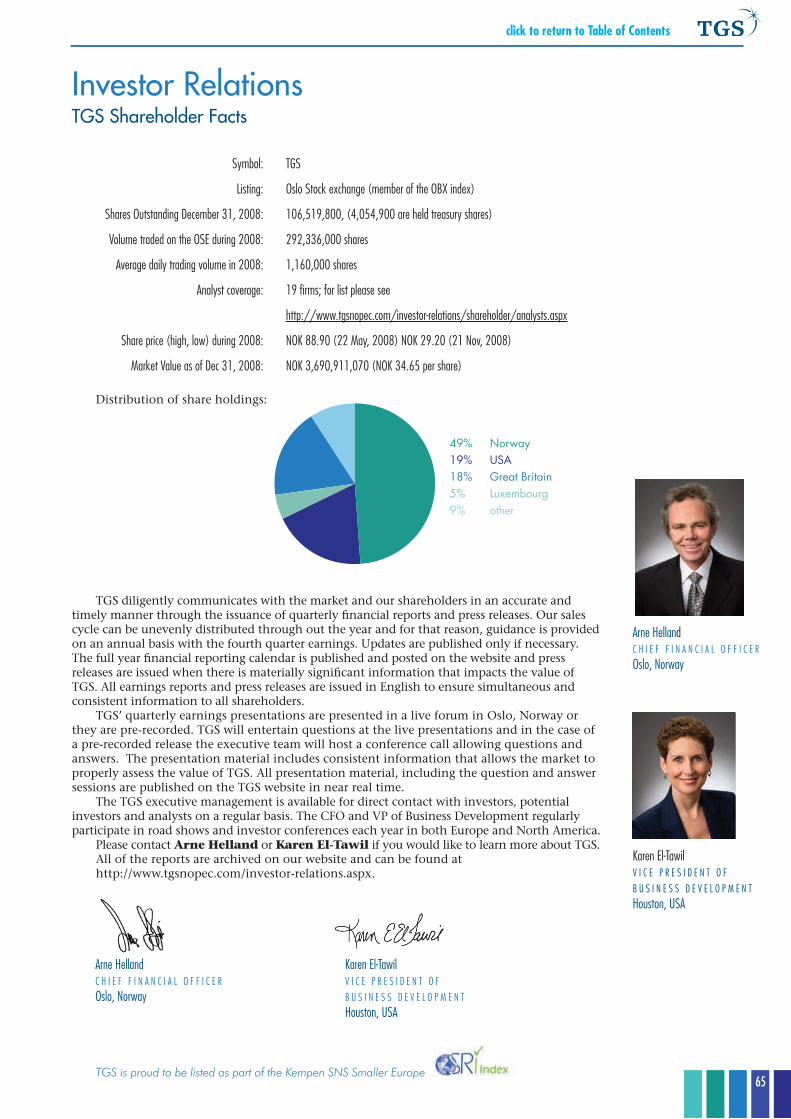
65
click to return to Table of Contents
Investor RelationsTGS Shareholder Facts
Symbol: TGS
Listing: Oslo Stock exchange (member of the OBX index)
Shares Outstanding December 31, 2008: 106,519,800, (4,054,900 are held treasury shares)
Volume traded on the OSE during 2008: 292,336,000 shares
Average daily trading volume in 2008: 1,160,000 shares
Analyst coverage: 19 firms; for list please see
http://www.tgsnopec.com/investor-relations/shareholder/analysts.aspx
Share price (high, low) during 2008: NOK 88.90 (22 May, 2008) NOK 29.20 (21 Nov, 2008)
Market Value as of Dec 31, 2008: NOK 3,690,911,070 (NOK 34.65 per share)
Distribution of share holdings:
TGS diligently communicates with the market and our shareholders in an accurate and timely manner through the issuance of quarterly financial reports and press releases. Our sales cycle can be unevenly distributed through out the year and for that reason, guidance is provided on an annual basis with the fourth quarter earnings. Updates are published only if necessary. The full year financial reporting calendar is published and posted on the website and press releases are issued when there is materially significant information that impacts the value of TGS. All earnings reports and press releases are issued in English to ensure simultaneous and consistent information to all shareholders.
TGS’ quarterly earnings presentations are presented in a live forum in Oslo, Norway or they are pre-recorded. TGS will entertain questions at the live presentations and in the case of a pre-recorded release the executive team will host a conference call allowing questions and answers. The presentation material includes consistent information that allows the market to properly assess the value of TGS. All presentation material, including the question and answer sessions are published on the TGS website in near real time.
The TGS executive management is available for direct contact with investors, potential investors and analysts on a regular basis. The CFO and VP of Business Development regularly participate in road shows and investor conferences each year in both Europe and North America.
Please contact Arne Helland or Karen El-Tawil if you would like to learn more about TGS.All of the reports are archived on our website and can be found at http://www.tgsnopec.com/investor-relations.aspx.
Arne helland C h I E F F I N A N C I A L O F F I C E R Oslo, Norway
Karen El-TawilV I C E P R E S I D E N T O FB U S I N E S S D E V E L O P M E N Thouston, USA
NET REVENUES 2008
25% Pre-funding58% Late sales 14% Contract 3% Other
NET REVENUES 2008
48% Western Hemisphere
52% Eastern Hemisphere
NET MULTI-CLIENT REVENUES 2008
50% 3D
38% 2D 12% Geological Products
NET BOOK VALUE OF SEISMIC LIBRARY BY YEAR
% Year 42% WIP 37% 2008 7% 2007 14% 2006 1% 2005
NET BOOK VALUE OFLIBRARY BY DATA TYPE
49% 3D
39% 2D
12% Well Logs & Integrated Products
0 100 200 300 400 500 600
2004
2005
2006
2007
2008
Net operating revenues Operating profit
0.0 0.2 0.4 0.6 0.8 1.0 1.2 1.4
2004
2005
2006
2007
2008
Earnings per share Earnings per share fully diluted
0100200300400500600700800900
1000
2004 2005 2006 2007Total assets Shareholders equity
NET REVENUES 2008
48% Western Hemisphere
52% Eastern Hemisphere
FIGURE 3
NET MULTI-CLIENT REVENUES 2008
50% 3D
38% 2D 12% Geological Products
FIGURE 4
NET BOOK VALUE OF SEISMIC LIBRARY BY YEAR
% Year 42% WIP 37% 2008 7% 2007 14% 2006 1% 2005
FIGURE 5
NET BOOK VALUE OFLIBRARY BY DATA TYPE
49% 3D
39 2D
12% Well Logs & Integrated Products
0
50
100
150
200
250
300
Investments in new projects Multi-client data purchased from third parties Prefunding
2004 2005 2006 2007 2008
61%
8%4%10%
2%
14%
42%37%
7%14%
1%0%0%10%20%30%40%50%60%70%
Pre-2005 2005 2006 2007 2008 WIP/MISC
050.0
100.0150.0200.0250.0300.0
2004 2005 2006 2007 2008 WIPTotal Project Investments Net Book Value
67%45%
31%22%
10%0%
Net Revenues in % of total Net Book Value in % of total
NET REVENUES 2008
25% Pre-funding58% Late sales 14% Contract 3% Other
2008
49% Norway 19% USA 18% Great Britain5% Luxembourg9% other
Arne helland C h I E F F I N A N C I A L O F F I C E R Oslo, Norway
Karen El-TawilV I C E P R E S I D E N T O FB U S I N E S S D E V E L O P M E N Thouston, USA
TGS is proud to be listed as part of the Kempen SNS Smaller Europe
2008 Annual Report
66 TGS-NOPEC Geophysical Company
click to return to Table of Contents
Contact Us
NORWAY
TGS-NOPEC Geophysical Company ASAHagaloekkveien 13N-1383 ASKER Norwaytel: + 47 66 76 99 00fax: + 47 66 76 99 10email: [email protected]
TGS Geological Products and ServicesRogaland Science ParkProfessor Olav Hanssensvei 13N-4068 Stavanger, Norwaytel: +47 51 87 58 00fax: +47 51 87 58 01email: [email protected]
AUSTRALIA
TGS-NOPEC Geophysical CompanyLevel 5, MLC House1100 Hay StreetWest Perth, WA 6005 Australiatel: + 61 8 9480 0000fax: + 61 8 9321 5312email: [email protected]
RUSSIA
TGS-NOPEC Geophysical Company Moscow Ltd.Donskaya St., 4, Building 3, Office 301117049 Moscow, Russian Federation.tel: +7 495 229 1324fax: +7 495 959 81 18email: [email protected]
U K
TGS-NOPEC Geophysical Company(UK) LimitedGraylaw House21/21A Goldington RoadBedford MK40 3JY, UKtel: + 44 (0) 1234 272122fax: + 44 (0) 1234 325956email: [email protected]
TGS Geological Products and ServicesMillbank House171-185 Ewell RoadSurbiton, SurreyKT6 6AP, UKtel: +44 (0) 208 339 4200fax: +44 (0) 208 339 4249email: [email protected]
U S A
TGS-NOPEC Geophysical Company2500 CityWest Boulevard Suite 2000Houston, TX 77042 USAtel: +1 713 860 2100fax: +1 713 334 3308email: [email protected]
TGS Geological Products and Services2345 Atascocita RoadHumble, TX 77396 USAtel: +1 281 319 4944fax: +1 281 319 4945email: [email protected]
TGS Geological Products and Services1010 Common Street Suite 2040New Orleans, LA 70112 USAtel: +1 504 524 3450fax: +1 504 524 3454email: [email protected]
TGS Geological Products and Services230 West Wilshire Boulevard, Suite G5Oklahoma City, OK 73113-2460 USAtel: +1 405 848 4407fax: +1 405 848 4036email: [email protected]
TGS Geological Products and Services5511 West 56th AvenueSuite 220Arvada, Colorado 80002 USAtel: +1 303 235 0033fax: +1 303 235 0040email: [email protected]
click to return to Table of Contents
click to return to Table of Contents
©2009
GeologicalProducts
GeophysicalProducts
ImagingServices
w w w. t g s n o p e c . c o m