Embed Size (px)
Citation preview

1 1 1
KBank Capital Markets Perspectives 29 February 2016
Thailand’s economy steadied in February, though domestic demand decelerated
slightly from January after government’s stimulus measure concluded.
Foreigners’ demand to visit Thailand improved more broadly.
The increase in public servant salary and investment by state-enterprises helped
sustain the economic momentum.
The BoT revised down most of the economic indicators, as risks to growth remain
tilted towards the downside.
The economy is expected to be supported by public spending and the tourism
sector.
Domestic demand is expected to slow down to 1.8% against an earlier forecast of
2.8%.
Exports are expected to contract by 2%, as opposed to earlier forecast of 0%
growth.
Large current account surplus and weak domestic demand will keep Thailand’s
current account surplus afloat, hence, supporting for THB rise.
In the press conference, the BoT spokesperson said the MPC could lower rates
further if warranted.
As such, we expect the BoT to cut policy rate by 25bps in Q2/15 to 1.25%.
Disclaimer: For private circulation only. The foregoing is for informational purposes only and not to be considered as an offer to buy or sell, or a solicitation of an offer to buy or sell any security. Although the information herein was obtained from sources we believe to be reliable, we do not guarantee its accuracy nor do we assume responsibility for any error or mistake contained herein. Further information on the securities referred to herein may be obtained upon request.
Thailand Economic Monitor and BoT Forecast : March 2016
Nattariya Wittayatanaseth [email protected]
Anchali Singh [email protected]
2.8 2.9 3.0 3.2 3.4 3.53.2
-0.50.00.51.01.52.02.53.03.54.04.5
1Q14 3Q14 1Q15 3Q15 1Q16* 3Q16* 1Q17*
Real GDP (%YoY) Sep- 15 projection Dec- 15 projection Mar- 16 projection
% YoY
The BoT revised down GDP forecast
2
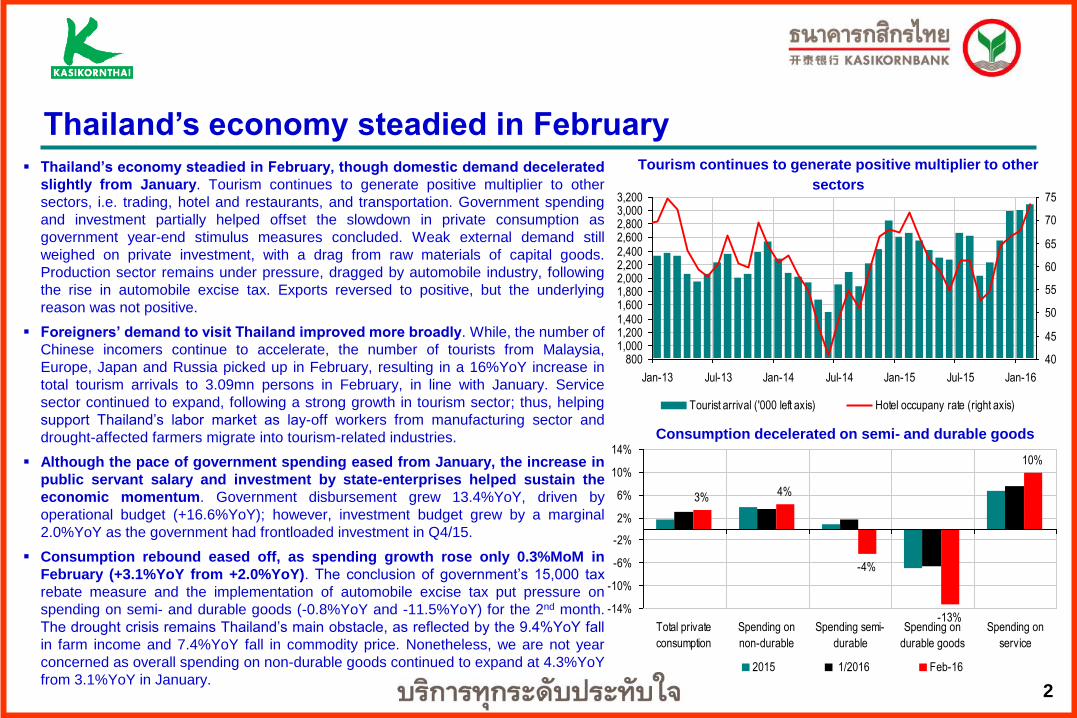
Thailand’s economy steadied in February, though domestic demand decelerated
slightly from January. Tourism continues to generate positive multiplier to other
sectors, i.e. trading, hotel and restaurants, and transportation. Government spending
and investment partially helped offset the slowdown in private consumption as
government year-end stimulus measures concluded. Weak external demand still
weighed on private investment, with a drag from raw materials of capital goods.
Production sector remains under pressure, dragged by automobile industry, following
the rise in automobile excise tax. Exports reversed to positive, but the underlying
reason was not positive.
Foreigners’ demand to visit Thailand improved more broadly. While, the number of
Chinese incomers continue to accelerate, the number of tourists from Malaysia,
Europe, Japan and Russia picked up in February, resulting in a 16%YoY increase in
total tourism arrivals to 3.09mn persons in February, in line with January. Service
sector continued to expand, following a strong growth in tourism sector; thus, helping
support Thailand’s labor market as lay-off workers from manufacturing sector and
drought-affected farmers migrate into tourism-related industries.
Although the pace of government spending eased from January, the increase in
public servant salary and investment by state-enterprises helped sustain the
economic momentum. Government disbursement grew 13.4%YoY, driven by
operational budget (+16.6%YoY); however, investment budget grew by a marginal
2.0%YoY as the government had frontloaded investment in Q4/15.
Consumption rebound eased off, as spending growth rose only 0.3%MoM in
February (+3.1%YoY from +2.0%YoY). The conclusion of government’s 15,000 tax
rebate measure and the implementation of automobile excise tax put pressure on
spending on semi- and durable goods (-0.8%YoY and -11.5%YoY) for the 2nd month.
The drought crisis remains Thailand’s main obstacle, as reflected by the 9.4%YoY fall
in farm income and 7.4%YoY fall in commodity price. Nonetheless, we are not year
concerned as overall spending on non-durable goods continued to expand at 4.3%YoY
from 3.1%YoY in January.
Thailand’s economy steadied in February
Consumption decelerated on semi- and durable goods
Tourism continues to generate positive multiplier to other
sectors
8001,0001,2001,4001,6001,8002,0002,2002,4002,6002,8003,0003,200
Jan-13 Jul-13 Jan-14 Jul-14 Jan-15 Jul-15 Jan-16
40
45
50
55
60
65
70
75
Tourist arrival ('000 left axis) Hotel occupany rate (right axis)
3% 4%
-4%
-13%
10%
-14%
-10%
-6%
-2%
2%
6%
10%
14%
Total private
consumption
Spending on
non-durable
Spending semi-
durable
Spending on
durable goods
Spending on
service
2015 1/2016 Feb-16

3
Private investment decelerated to 2.0%YoY in February from 3.1%YoY, as car sales
declined 5.1%YoY. Nonetheless, the drag was completely offset by 4G infrastructure
investment in telecommunication sector. Government investment projects also
benefitted construction material which managed to grow 1.7%YoY for the first time since
2015. However, we have not seen clear sign of private investment recovery due to weak
domestic demand and low business confidence. Moreover, credit standards have
become tightened over recent periods, both for corporate and SMEs.
Weak demand and a slowdown in automobile production pushed production back
into negative territory. The MPI index declined 1.6%YoY following a 3.5%YoY fall in
January. Apart from waning automobile production, production of textile and garments,
and hard-disk drivers remained negative due to a shift in consumer demand towards
solid-state drive. The bright star for production was probably rubber as sellers
frontloaded exports before the agreement between Thailand, Malaysia, and Indonesia,
to limit rubber exports comes into effect in August.
The 6.2% rise in February exports was boosted by gold and jewelry in response to
Hong Kong International Jewellery Show and the sharp rise in gold price. However,
stripping off the impact of gold export which totaled to as much as USD 1.89bn, overall
exports contracted 4.0%YoY. Most products witnessed slower demand, especially
petroleum-related items, i.e. petrochemical and chemicals. The only products that saw
material improvement was sugar. Sugar demand surged as ASEAN countries who
expect the drought crisis will shore up sugar price.
Imports continued to post a double-digit drop, falling 16.3%YoY from a 17.8%YoY
fall with across the board weakness observed. The most concerning point was imports
of raw materials and intermediate goods fell sharply, suggesting that recovery in exports
remains dampened.
Current account surplus rose to a record high at USD 7.4bn, driven by trade
surplus, totaling USD 6.0bn in February. This resulted in net positive balance of
payment which partially explained THB strength in February; USD/THB averaged 35.16
in February from 36.15 in January.
Current account surplus rose to a record high Current account surged to record high due to trade surplus
Thailand’s February economic momentum steadied
-3.5
2.0 3.1
-9.3
-17.8
-1.6
3.1 2.0
6.2
-16.3
-24
-20
-16
-12
-8
-4
0
4
8
Manufacturing Consumption Investment Exports (USD) Imports (USD)
Nov-15 Dec-15 Jan-16 Feb-16
% YoY
1.8
-0.7
1.6
-0.6
0.40.9
1.5
-0.6
0.9
2.6
-0.5
2.3
0.3
1.5
0.4
2.6
1.91.4
2.3
0.4
3.3
-2.0
-1.0
0.0
1.0
2.0
3.0
4.0
5.0
Jun-14 Sep-14 Dec-14 Mar-15 Jun-15 Sep-15 Dec-15
Trade balance Trade balance, excluding gold
USD, bn
4
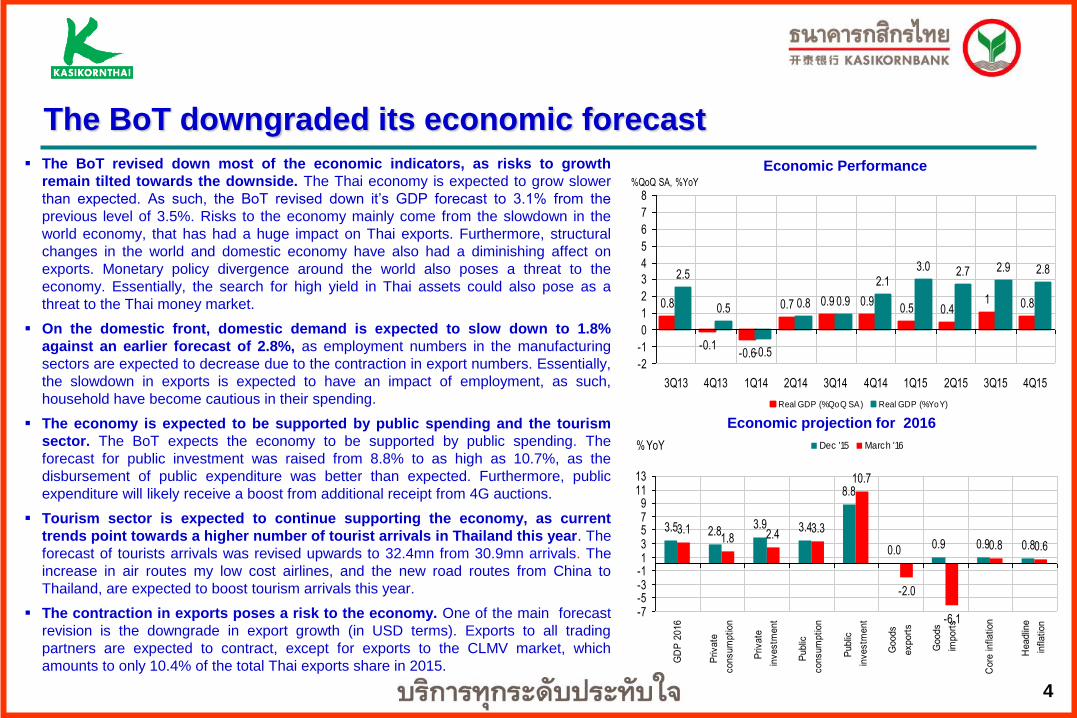
The BoT revised down most of the economic indicators, as risks to growth
remain tilted towards the downside. The Thai economy is expected to grow slower
than expected. As such, the BoT revised down it’s GDP forecast to 3.1% from the
previous level of 3.5%. Risks to the economy mainly come from the slowdown in the
world economy, that has had a huge impact on Thai exports. Furthermore, structural
changes in the world and domestic economy have also had a diminishing affect on
exports. Monetary policy divergence around the world also poses a threat to the
economy. Essentially, the search for high yield in Thai assets could also pose as a
threat to the Thai money market.
On the domestic front, domestic demand is expected to slow down to 1.8%
against an earlier forecast of 2.8%, as employment numbers in the manufacturing
sectors are expected to decrease due to the contraction in export numbers. Essentially,
the slowdown in exports is expected to have an impact of employment, as such,
household have become cautious in their spending.
The economy is expected to be supported by public spending and the tourism
sector. The BoT expects the economy to be supported by public spending. The
forecast for public investment was raised from 8.8% to as high as 10.7%, as the
disbursement of public expenditure was better than expected. Furthermore, public
expenditure will likely receive a boost from additional receipt from 4G auctions.
Tourism sector is expected to continue supporting the economy, as current
trends point towards a higher number of tourist arrivals in Thailand this year. The
forecast of tourists arrivals was revised upwards to 32.4mn from 30.9mn arrivals. The
increase in air routes my low cost airlines, and the new road routes from China to
Thailand, are expected to boost tourism arrivals this year.
The contraction in exports poses a risk to the economy. One of the main forecast
revision is the downgrade in export growth (in USD terms). Exports to all trading
partners are expected to contract, except for exports to the CLMV market, which
amounts to only 10.4% of the total Thai exports share in 2015.
The BoT downgraded its economic forecast
Economic projection for 2016
3.5 2.83.9 3.4
8.8
0.0 0.9 0.9 0.8
3.11.8 2.4 3.3
10.7
-2.0
-6.1
0.8 0.6
-7-5-3-113579
1113
GD
P 2
016
Priva
te
co
nsu
mp
tio
n
Priva
te
inve
stm
en
t
Pub
lic
co
nsu
mp
tio
n
Pub
lic
inve
stm
en
t
Goo
ds
exp
ort
s
Goo
ds
imp
ort
s
Co
re in
fla
tio
n
He
adlin
e
infla
tio
n
Dec '15 March '16% YoY
0.8
-0.1-0.6
0.7 0.9 0.90.5 0.4
1 0.8
2.5
0.5
-0.5
0.8 0.9
2.13.0 2.7 2.9 2.8
-2
-1
0
1
2
3
4
5
6
7
8
3Q13 4Q13 1Q14 2Q14 3Q14 4Q14 1Q15 2Q15 3Q15 4Q15
Real GDP (%QoQ SA) Real GDP (%YoY)
%QoQ SA, %YoY
Economic Performance
5
Risk to growth is tilted to the downside
Policy Rate Forecast by KBank model
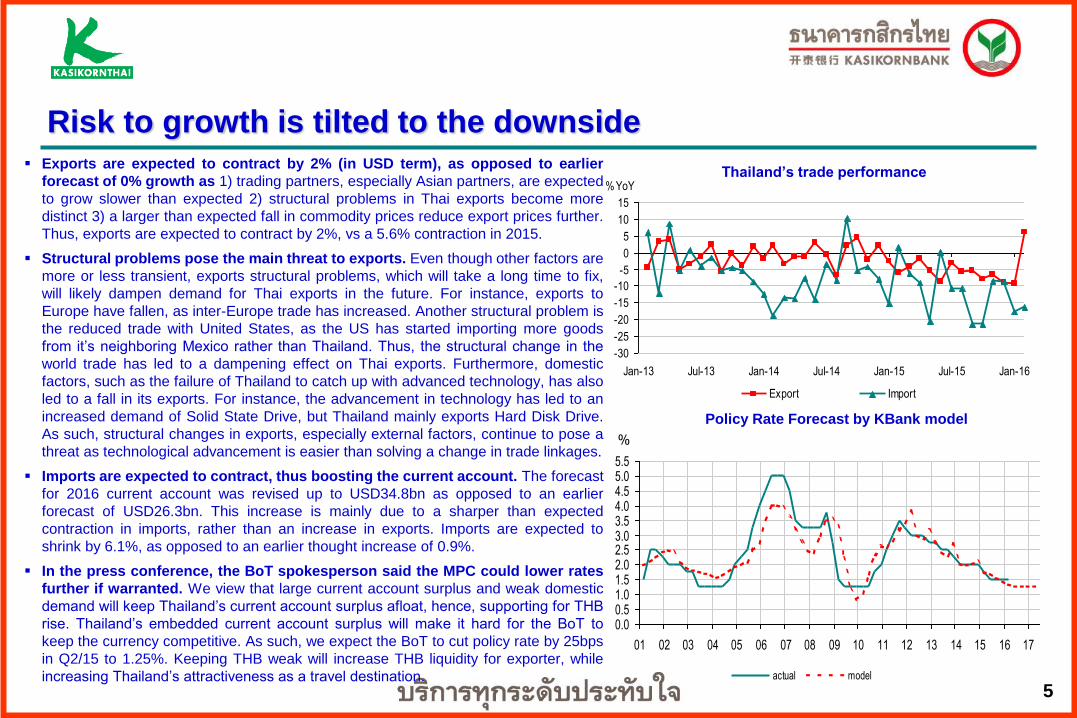
Thailand’s trade performance Exports are expected to contract by 2% (in USD term), as opposed to earlier
forecast of 0% growth as 1) trading partners, especially Asian partners, are expected
to grow slower than expected 2) structural problems in Thai exports become more
distinct 3) a larger than expected fall in commodity prices reduce export prices further.
Thus, exports are expected to contract by 2%, vs a 5.6% contraction in 2015.
Structural problems pose the main threat to exports. Even though other factors are
more or less transient, exports structural problems, which will take a long time to fix,
will likely dampen demand for Thai exports in the future. For instance, exports to
Europe have fallen, as inter-Europe trade has increased. Another structural problem is
the reduced trade with United States, as the US has started importing more goods
from it’s neighboring Mexico rather than Thailand. Thus, the structural change in the
world trade has led to a dampening effect on Thai exports. Furthermore, domestic
factors, such as the failure of Thailand to catch up with advanced technology, has also
led to a fall in its exports. For instance, the advancement in technology has led to an
increased demand of Solid State Drive, but Thailand mainly exports Hard Disk Drive.
As such, structural changes in exports, especially external factors, continue to pose a
threat as technological advancement is easier than solving a change in trade linkages.
Imports are expected to contract, thus boosting the current account. The forecast
for 2016 current account was revised up to USD34.8bn as opposed to an earlier
forecast of USD26.3bn. This increase is mainly due to a sharper than expected
contraction in imports, rather than an increase in exports. Imports are expected to
shrink by 6.1%, as opposed to an earlier thought increase of 0.9%.
In the press conference, the BoT spokesperson said the MPC could lower rates
further if warranted. We view that large current account surplus and weak domestic
demand will keep Thailand’s current account surplus afloat, hence, supporting for THB
rise. Thailand’s embedded current account surplus will make it hard for the BoT to
keep the currency competitive. As such, we expect the BoT to cut policy rate by 25bps
in Q2/15 to 1.25%. Keeping THB weak will increase THB liquidity for exporter, while
increasing Thailand’s attractiveness as a travel destination.
0.00.51.01.52.02.53.03.54.04.55.05.5
01 02 03 04 05 06 07 08 09 10 11 12 13 14 15 16 17
actual model
%
-30
-25
-20
-15
-10
-5
0
5
10
15
Jan-13 Jul-13 Jan-14 Jul-14 Jan-15 Jul-15 Jan-16
%YoY
Export Import

6
-5
0
5
10
15
20
12 13 14 15 16
60
65
70
75
80
85
90
Consumer Confidence (right) Private Consumption (PII)
%YoY Diffusion (Neutral =100)
Thailand’s economic momentum in picture
Consumer confidence dampened in line with spending Trade performance received temporary support
Chinese tourists buoyed tourism sector, while arrivals from
other countries grew more broad-based
0%
5%
10%
15%
20%
25%
30%
China Europe U.S. Japan ASEAN (ex
CLMV)
CLMV
Revenue share in 2015 Arrivals share in 2015
53.2
49.2 48.4 48.046.1
43.5
53.351.2
45.4 45.3 46.244.6
35
40
45
50
55
60
Investment Employment Production
Cost
Production Domestic
Order Books
Foreign Order
Books
Dec-15 Jan-16 Feb-16
Diffusion Index (50 = no change from previous month)
Business confidence remained mix in February
4.4
19.0
-6.2 -4.0 -1.9
0.3
-19.7 -19.9
-9.4
-35
-25
-15
-5
5
15
25
35
Rubber
(2%)
Jewellery
(3%)
Computer
(7%)
IC
(4%)
Auto
(21%)
Rice
(2%)
Rubber
(2%)
Tapioca
(1%)
Petroleum
&
Chemical
(10%)
Jan-16 Feb-16%YoY

7
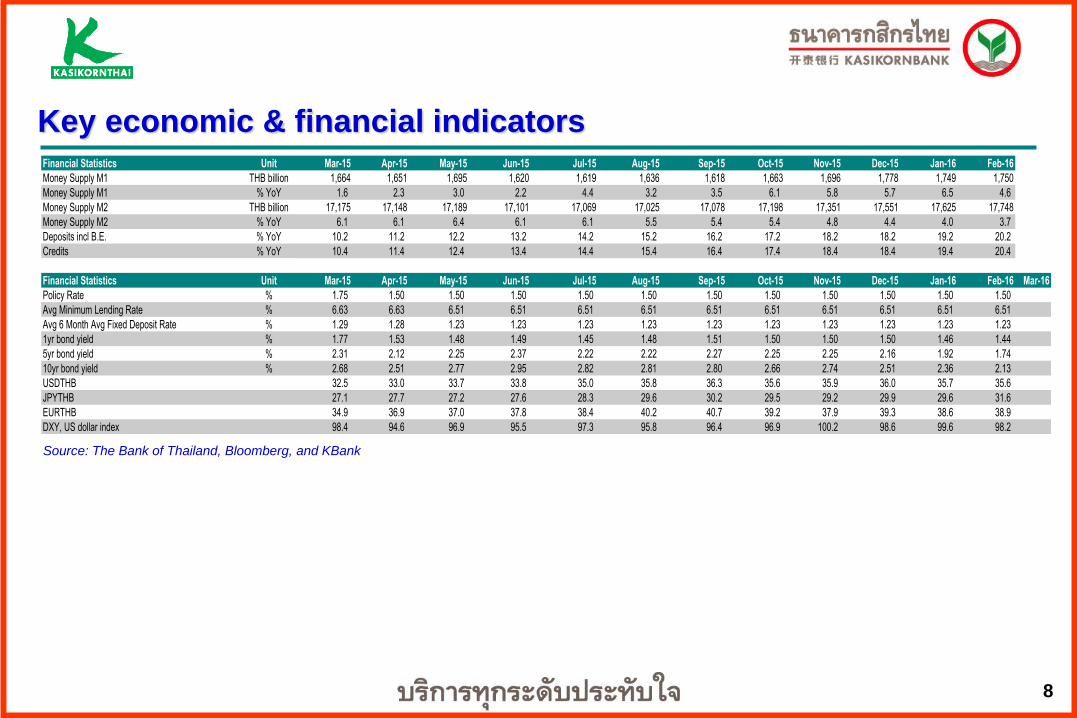
Key economic & financial indicators
Source: The Bank of Thailand, Bloomberg, and KBank
Real Sector Unit Mar-15 Apr-15 May-15 Jun-15 Jul-15 Aug-15 Sep-15 Oct-15 Nov-15 Dec-15 Jan-16 Feb-16
Manufacturing Production Index, % YoY % YoY -1.0 -0.1 -0.1 -0.6 2.6 0.5 -0.3 -0.8 0.3 1.4 -3.5 -1.6
Capacity Utilization Index, non-seasonally adjusted level 70.8 57.9 64.0 64.8 65.3 62.7 64.9 63.8 63.6 62.9 63.8 65.7
Retail Sales % YoY -4.6 -3.3 -6.0 -0.8 -1.8 -0.3 -3.9 -0.2 2.9 6.0 #N/A N/A #N/A N/A
Car Sales Units 74,117 54,058 56,942 60,322 60,863 61,991 61,869 67,910 76,426 101,426 51,821 57,093
Net Capital Goods Imports USD million 127,071 148,077 133,487 159,072 143,540 160,350 148,688 187,912 166,442 147,136 N/A N/A
CPI All Items % YoY -0.57 -1.04 -1.27 -1.07 -1.05 -1.19 -1.07 -0.77 -0.97 -0.85 -0.53 -0.50
CPI Food % YoY 1.3 0.6 0.1 0.5 1.1 1.3 1.3 1.8 0.9 0.8 0.8 1.3
CPI Non Food % YoY (1.5) (1.9) (2.0) (1.9) (2.2) (2.5) (2.4) (2.1) (2.0) (1.8) (1.3) (1.5)
Core Price % YoY 1.31 1.02 0.94 0.94 0.94 0.89 0.96 0.95 0.9 0.68 0.59 0.68
Producer Prices % YoY (5.0) (5.4) (4.8) (3.7) (3.8) (3.8) (3.6) (3.1) (3.1) (2.7) (2.4) (3.0)
External Sector Unit Mar-15 Apr-15 May-15 Jun-15 Jul-15 Aug-15 Sep-15 Oct-15 Nov-15 Dec-15 Jan-16 Feb-16
Foreign Trade Merchandise Exports USD million 18,758 16,744 18,226 17,679 18,113 17,587 18,524 18,288 17,006 16,958 15,560 18,120
Foreign Trade Merchandise Exports % YoY -4.3 -1.8 -5.5 -8.9 -3.1 -5.6 -5.4 -8.0 -6.6 -9.1 -9.3 6.2
Foreign Trade Merchandise Imports USD million 15,277 15,041 14,066 15,682 15,405 14,680 14,523 13,957 14,920 13,739 12,924 12,142
Foreign Trade Merchandise Imports % YoY -6.4 -9.1 -20.4 0.3 -10.6 -10.8 -21.3 -21.3 -8.5 -8.7 -17.8 -16.3
BOP Current Account Balance USD million 2,292 1,768 2,796 1,555 2,326 2,817 1,723 4,220 2,038 3,924 4,066 7,401
TotalTourist Arrivals persons 2,533,000 2,290,000 2,309,000 2,283,000 2,643,000 2,600,000 2,031,000 2,229,000 2,549,000 2,987,000 3,001,000 3,001,001
Overall Balance of Payments (BOP) USD million 1,096 1,808 116 1,402 -1,746 -1,187 550 2,441 -849 -661 4,544 6,071
Total International Foreign Reserves USD billion 157.4 160.1 158.5 160.3 156.9 155.8 155.7 158.3 155.7 157.4 160.1 167.7
International Reserves, Net Forward Position USD billion 19.6 17.9 19.1 18.2 17.6 14.8 13.2 12.1 11.9 11.4 9.2 10.2
8
Key economic & financial indicators
Source: The Bank of Thailand, Bloomberg, and KBank
Financial Statistics Unit Mar-15 Apr-15 May-15 Jun-15 Jul-15 Aug-15 Sep-15 Oct-15 Nov-15 Dec-15 Jan-16 Feb-16
Money Supply M1 THB billion 1,664 1,651 1,695 1,620 1,619 1,636 1,618 1,663 1,696 1,778 1,749 1,750
Money Supply M1 % YoY 1.6 2.3 3.0 2.2 4.4 3.2 3.5 6.1 5.8 5.7 6.5 4.6
Money Supply M2 THB billion 17,175 17,148 17,189 17,101 17,069 17,025 17,078 17,198 17,351 17,551 17,625 17,748
Money Supply M2 % YoY 6.1 6.1 6.4 6.1 6.1 5.5 5.4 5.4 4.8 4.4 4.0 3.7
Deposits incl B.E. % YoY 10.2 11.2 12.2 13.2 14.2 15.2 16.2 17.2 18.2 18.2 19.2 20.2
Credits % YoY 10.4 11.4 12.4 13.4 14.4 15.4 16.4 17.4 18.4 18.4 19.4 20.4
Financial Statistics Unit Mar-15 Apr-15 May-15 Jun-15 Jul-15 Aug-15 Sep-15 Oct-15 Nov-15 Dec-15 Jan-16 Feb-16 Mar-16
Policy Rate % 1.75 1.50 1.50 1.50 1.50 1.50 1.50 1.50 1.50 1.50 1.50 1.50
Avg Minimum Lending Rate % 6.63 6.63 6.51 6.51 6.51 6.51 6.51 6.51 6.51 6.51 6.51 6.51
Avg 6 Month Avg Fixed Deposit Rate % 1.29 1.28 1.23 1.23 1.23 1.23 1.23 1.23 1.23 1.23 1.23 1.23
1yr bond yield % 1.77 1.53 1.48 1.49 1.45 1.48 1.51 1.50 1.50 1.50 1.46 1.44
5yr bond yield % 2.31 2.12 2.25 2.37 2.22 2.22 2.27 2.25 2.25 2.16 1.92 1.74
10yr bond yield % 2.68 2.51 2.77 2.95 2.82 2.81 2.80 2.66 2.74 2.51 2.36 2.13
USDTHB 32.5 33.0 33.7 33.8 35.0 35.8 36.3 35.6 35.9 36.0 35.7 35.6
JPYTHB 27.1 27.7 27.2 27.6 28.3 29.6 30.2 29.5 29.2 29.9 29.6 31.6
EURTHB 34.9 36.9 37.0 37.8 38.4 40.2 40.7 39.2 37.9 39.3 38.6 38.9
DXY, US dollar index 98.4 94.6 96.9 95.5 97.3 95.8 96.4 96.9 100.2 98.6 99.6 98.2

9
The Bank of Thailand’s new economic forecasts
(unit : % YoY or otherwise indicated)
Forecast as of June 2015 2015 2016 (F) 2017 (F) Actual Dec '15 March '16 March'16
GDP 2.8 3.5 3.1 3.3 Core inflation 1.1 0.9 0.8 1.1 Headline inflation -0.9 0.8 0.6 2.2 Domestic demand 2.8 3.5 2.8 2.9 - Private consumption 2.1 2.8 1.8 2.4 - Private investment -2.0 3.9 2.4 4.0 - Public consumption 2.2 3.4 3.3 2.8 - Public investment 29.8 8.8 10.7 4.5 Current account ($ bn)* 34.8 26.3 34.8 32.7 - Exports of goods (f.o.b) -5.6 0.0 -2.0 0.1 - Imports of goods (f.o.b.)* -11.3 0.9 -6.1 3.6 Source: Bank of Thailand, * changes according to IMF’s BPM6 effective from August 2011 Full Report (Thai) can be found at https://www.bot.or.th/Thai/MonetaryPolicy/MonetPolicyComittee/MPR/DocLib/MPR_March2559_BVS59.pdf

10