Embed Size (px)
Citation preview
Version:May 30, 2006– after referee’s comments 05/24/06
The 1966–1967 Outburst of V1647 Orionis and the Appearance of
McNeil’s Nebula
Colin Aspin1, Cesare Barbieri2, Federico Boschi3, Francesco diMille2, Francesca Rampazzi2,
Bo Reipurth4, & Milcho Tsvetkov5
1: Gemini Observatory, 670 N. Aohoku Place,
Hilo, HI 96720
2: Department of Astronomy, University of Padova, Italy
[email protected], [email protected], [email protected]
3: INAF, Astronomical Observatory of Padova, Italy
4: Institute for Astronomy, University of Hawaii,
640 N. Aohoku Place, Hilo, HI 96720
5: Institute of Astronomy,
Bulgarian Academy of Sciences,
72 Tsarigradsko Shosse Blvd.,
BG-1784 Sofia, Bulgaria
ABSTRACT
We present the results of an investigation aimed at characterizing previous
eruptions of V1647 Orionis, the illuminating star of McNeil’s Nebula. Photo-
graphic plates and films from the Asiago Observatory (1960–1998) and Harvard
Observatory (1898–1974) collections were inspected for the nebula. We have de-
termined that, to the plate limits, the known eruption of 1966–1967 is the only
one detected during the 38 year period covered by the Asiago archive. In the
Harvard collection, we did not find any additional occurrences in approximately
400 plates of the region taken over the last 100 years. Based on the Asiago
material we here present a study of the 1966–1967 event. McNeil’s Nebula and
– 2 –
V1647 Ori are clearly visible on 19 plates obtained with the Asiago 67/92 cm
Schmidt telescope from October 22, 1966 to March 4, 1967. The object is not seen
on plates taken in March 1966 nor in November 1967, thus setting a minimum
duration time for the eruptive event of 5 months, and a maximum of 20 months.
The 19 plates showing McNeil’s Nebula were digitized and a morphological and
photometric analysis of the object was undertaken. These data show temporal
photometric variability as well as structural differences between different color
bands. We finally compare the 1966–1967 event to the recent 2003–2006 eruption
and consider the nature of V1647 Ori within the framework of EXor and FUor
eruptions.
Subject headings: stars: formation – stars: pre-main sequence
1. INTRODUCTION
T Tauri stars accrete matter from their circumstellar disks at typical rates of 10−8 M�yr−1 (e.g. Hartmann et al. 1998). Long periods of more or less steady accretion are, at least
in some stars, interspersed with sudden surges in accretion rate, which rises to as much as
10−4 M� yr−1 for periods of several to many decades. These are the FU Orionis type (FUor)
outbursts first discussed by Herbig (1966, 1977). Shorter-lived eruptive events are EXor
outbursts (Herbig 1977, 1989). For an overview of these types of eruptions, see Hartmann
& Kenyon (1996).
The last major outburst of a classical FUor occurred in 1970, when V1057 Cyg went into
eruption (Herbig 1977, Herbig et al. 2003). It was therefore of considerable interest when
McNeil (2003) announced that a faint star in L1630 in Orion had gone into outburst, illumi-
nating what is now known as McNeil’s Nebula. The faint star is now designated V1647 Ori
and has been studied in great detail by numerous authors. The optical/infrared photome-
try and spectroscopy analyzed by Reipurth & Aspin (2004) suggested that V1647 Ori is an
EXor, whereas Briceno et al. (2004) favored a FUor nature. Given our limited understand-
ing of either group of stars, it is still unclear whether this is a semantic distinction, i.e. that
FUors and EXors are merely different shades of the same phenomenon and form a single
group whose properties span a continuum, or whether FUors and EXors are in some aspects
fundamentally physically different. Further observations at a wide range of wavelengths have
recently been presented by Abraham et al. (2004), Andrews, Rothberg, & Simon (2004),
Briceno et al. (2004), Grosso et al. (2005), Kastner et al. (2004), McGehee et al. (2004),
Muzerolle et al. (2005), Ojha et al. (2005), Rettig et al. (2005), Tsukagoshi et al. (2005),
Vacca, Cushing, & Simon (2004), and Walter et al. (2004).
– 3 –
Observations show that EXors have recurrent eruptions. The best studied case is EX
Lupi (Herbig 1977; Lehmann, Reipurth, Brandner 1995; Herbig et al. 2001). FUors have not
been seen to erupt more than once, but this is probably due to the much longer duration of
their eruptions. Indeed, on statistical grounds FUors are also expected to exhibit multiple
outbursts (Herbig 1977; Hartmann & Kenyon 1996).
V1647 Ori is known to have erupted once before. Mallas & Kreimer (1970) include
a photograph taken on 1966 October 22, which shows McNeil’s Nebula at about the same
brightness as during its current eruption. To further clarify the historical events associated
with this object, we have examined the plate archives of both the Asiago Observatory and the
Harvard College Observatory (HCO) which together span the last century, and we discuss
below the historical outburst of V1647 Ori and McNeil’s Nebula.
2. ARCHIVE SEARCH AND RESULTS
2.1. Asiago Plates Search
Searches for previous eruptions of V1647 Ori, the illuminating source of McNeil’s Nebula,
utilized the Sofia Wide-Field Plate Database1 which included information on plates in the
Asiago Plate Archive. Efforts are being made, under an Italian and Vatican Observatory
program, to digitize the Asiago plate archive (Barbieri et al., 2003a, 2003b)2. We utilized this
program to obtain digital images of sections of plates containing the V1647 Ori field to look
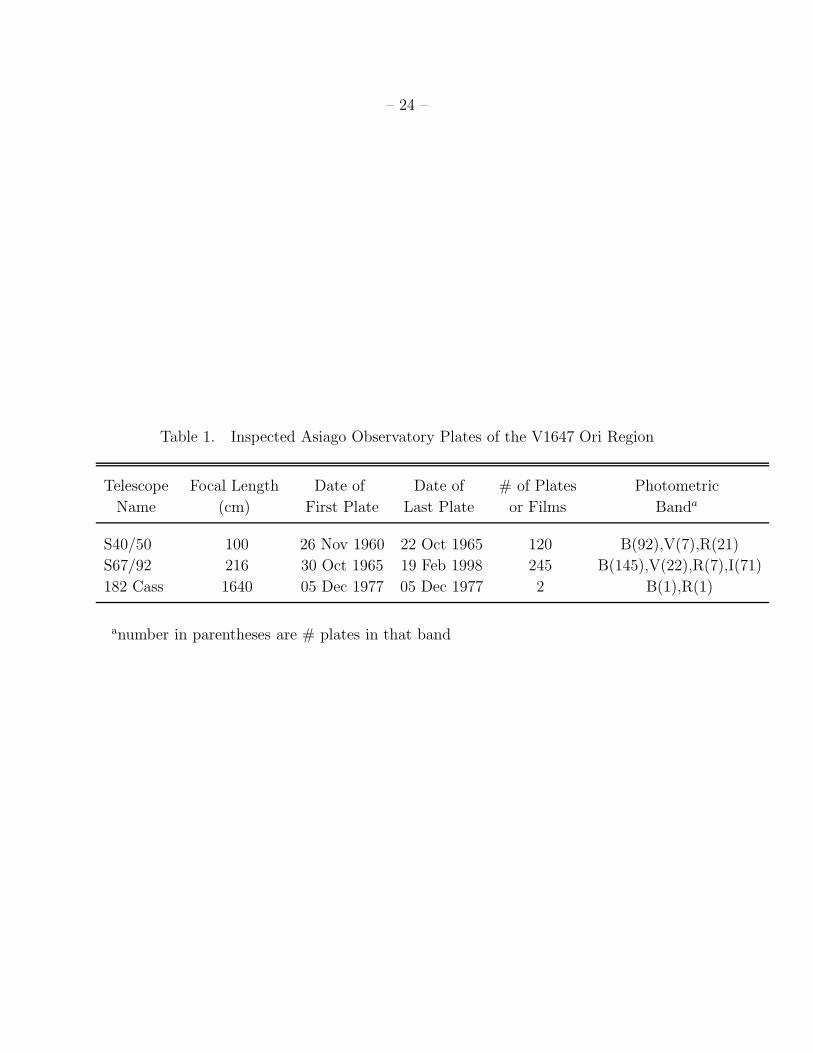
for past episodes when McNeil’s Nebula was visible. Three telescopes have contributed to
the large Asiago collection: the 40/50 cm and 67/92 cm Schmidt telescopes, and the 182 cm
reflector. Table 2 gives more information on the available plates of the V1647 Ori region.
We have inspected a total of 367 Asiago plates for McNeil’s Nebula. The breakdown of these
plates into telescope and filter is also shown in Table 2. Fig. 1 shows the temporal distribution
of the plates that include the region of V1647 Ori. The majority of the plates inspected are
blue sensitive, specifically, E-K 103a-O emulsions with no filter, thus they contain only a
small UV light contribution. Given the low elevation of the object from Asiago and the
intrinsic reddening of the nebular region, we consider any UV correction to be negligible,
and henceforth we refer to these plates as Johnson B-band plates. Some equivalent Johnson
R- and I-band plates of the McNeil region were also present in the archive. More information
on the correspondence of the plates/filter combinations used and the Johnson filter system
1http://www.skyarchive.org
2http://www.pd.astro.it/asiago/7000/7000.html
– 4 –
can be found on the Asiago Observatory web site3. All the plates have been visually inspected
with a binocular microscope in order to ascertain their usefulness for our present purpose.
Some of the plates (a total of 46) were originally taken under the Asiago flare stars project
(Rosino 1969) whereby on each plate short multiple (four or five) exposures with spatial
offsets between them were taken. These plates do not allow a clear inspection of the region
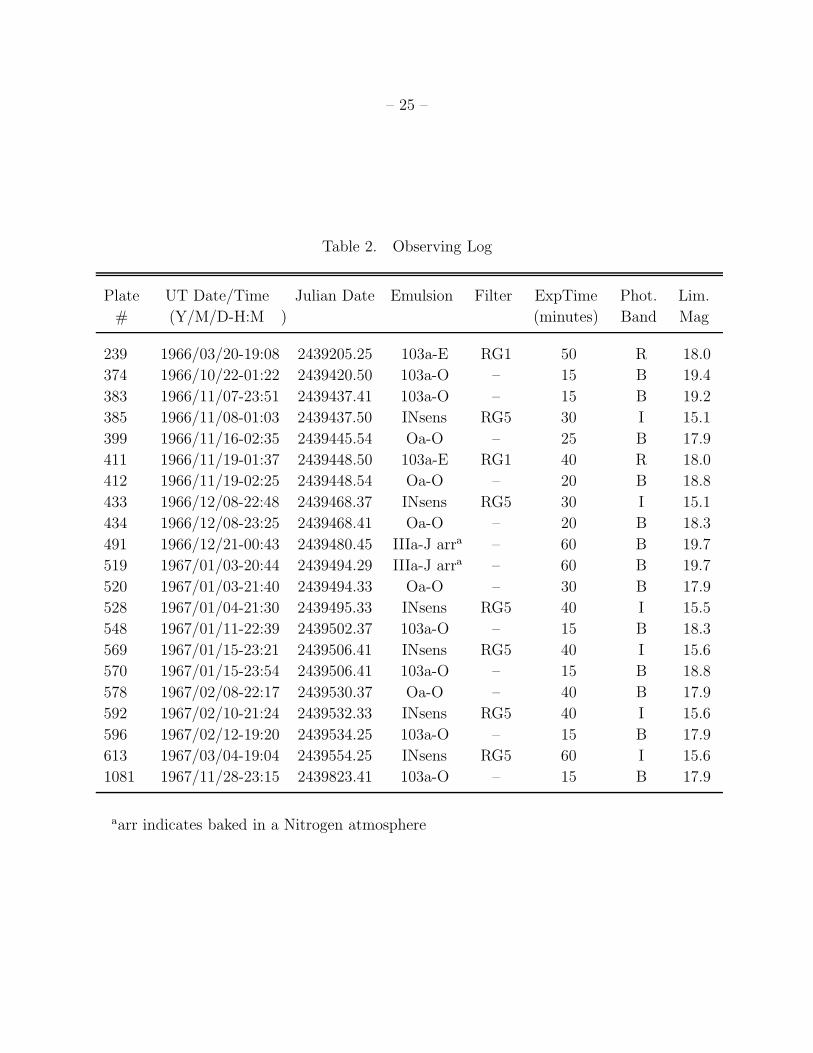
of interest and have not been considered further. Of the 321 plates inspected, 19 showed
McNeil’s Nebula. These are listed in Table 1. Twelve of these plates are in the B-band, 1
in the R-band and 6 in the I-band. The first plate showing McNeil’s Nebula is dated UT
1966 October 22 01:22 and was likely taken only a few hours earlier than the one obtained
by E. Kreimer (Mallas & Kreimer 1970). No evidence for McNeil’s Nebula was found on
plates prior to October 1966 nor after February 1967. The limiting magnitude of the plates is
given in Table 1 and calculated using a CCD comparison sequence kindly provided by Arne
Henden (priv. comm; McGehee et al. 2004). This also served to characterize the linearity
of the scanner response in digitizing the plates. A total of 26 stars within ∼4 arcmin of
V1647 Ori and with magnitudes in the range 15.5≤m(B)≤21 were used.
Fig. 2 shows the plates containing McNeil’s Nebula in the B-band at 12 different epochs.
These digital images cover the time 1966 October 22 to 1967 February 12. Also shown are the
two plates taken immediately before (1966 March 02) and after the first and last appearance
of McNeil’s Nebula, respectively. Fig. 3 shows I-band digital images of the same region from
1966 November 07 to 1967 March 04. The two plates before and after the appearance of the
nebula are again shown for comparison. Since we have three-color digitized imaging of the
object, (although only one R-band image), Fig. 4 shows the closest (in time) digital images
taken in B, R, and I.
In the B-band (Fig. 2), the passband in which we have the best temporal coverage,
McNeil’s Nebula is well detected even on the first plate taken on 21 October 1966. This
suggests that we have not observed the rise of the object from quiescence to its elevated
state. This must have occurred during the prior 7 month between 2 March 1966 and this
date. The sequence of B plates show some morphological and photometric changes in the
object. For example, the brightest parts of the object are two nebulous regions herein
referred to as the northern and southern knots. The relative brightness of the two knots is
observed to vary with time and wavelength. In B, the object is dominated by the northern
knot. This is not surprising since the nebula is seen in reflected light and V1647 Ori itself
is extincted by circumstellar material. The northern knot also includes HH 22A (Eisloffel
& Mundt 1997). The southern knot includes the exciting/illuminating source of McNeil’s
3http://www.pd.astro.it/asiago/7000/7020.html
– 5 –
Nebula, V1647 Ori, which is more heavily extincted due to circumstellar material. The plate
taken on 12 February 1967 is a little perplexing because at first glance it seems to imply
that the object has faded significantly in only 4 days (since the previous plate). Since the
12 February 1967 plate has an exposure time of 40 minutes and the 08 February 1967 plate
15 min, this is difficult to explain. We note that the northern knot is not detected in the
12 February plate suggesting that there is something peculiar about this observation (cloud,
bad plate, etc).
In the I-band (Fig. 3), McNeil’s Nebula is dominated by the southern knot and perhaps
therefore by V1647 Ori itself. Its more point-like nature supports this hypothesis. The
decline in brightness perhaps seen in B between 08 and 12 February 1967 is not evident at
I. On 10 February and 4 March 1967, the southern knot/V1647 Ori is still well detected.
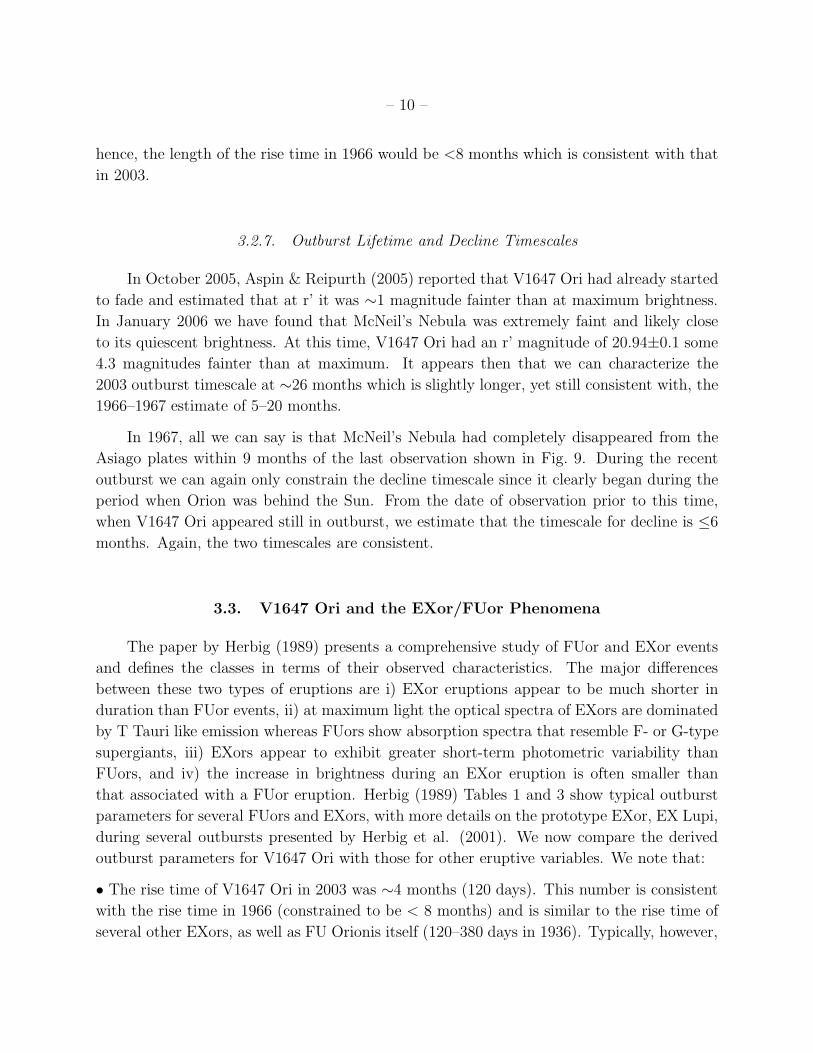
Comparing the objects appearance in different passbands at similar times (Fig. 4), we
note that the northern knot (including HH 22A) dominates in the blue while the southern
knot (including V1647 Ori) dominates in the far-red. The sole R-band image of the region,
taken on 18 November 1966, shows an intermediate status with both knots appearing similar
in brightness.
2.2. Harvard College Observatory Plate Search
The Harvard College Observatory (HCO) plate collection was inspected by Milcho
Tsvetkov. Over 400 plates of the appropriate region in Orion were found in the HCO
collection and visually inspected for the presence of McNeil’s Nebula. These plates cover the
period 1898–1974 and were from the A, AC, AM, AX, D, MC, and MF series. The plates are
mostly blue-sensitive with an average limiting-magnitude of the best plates of m(pg)∼14.
This is somewhat brighter than the integrated magnitude of V1647 Ori/McNeil’s Nebula
during the current (2003–2006) outburst and of the plate limit of the Asiago blue plates. We
have found that McNeil’s Nebula was not detected on any plate inspected from the HCO
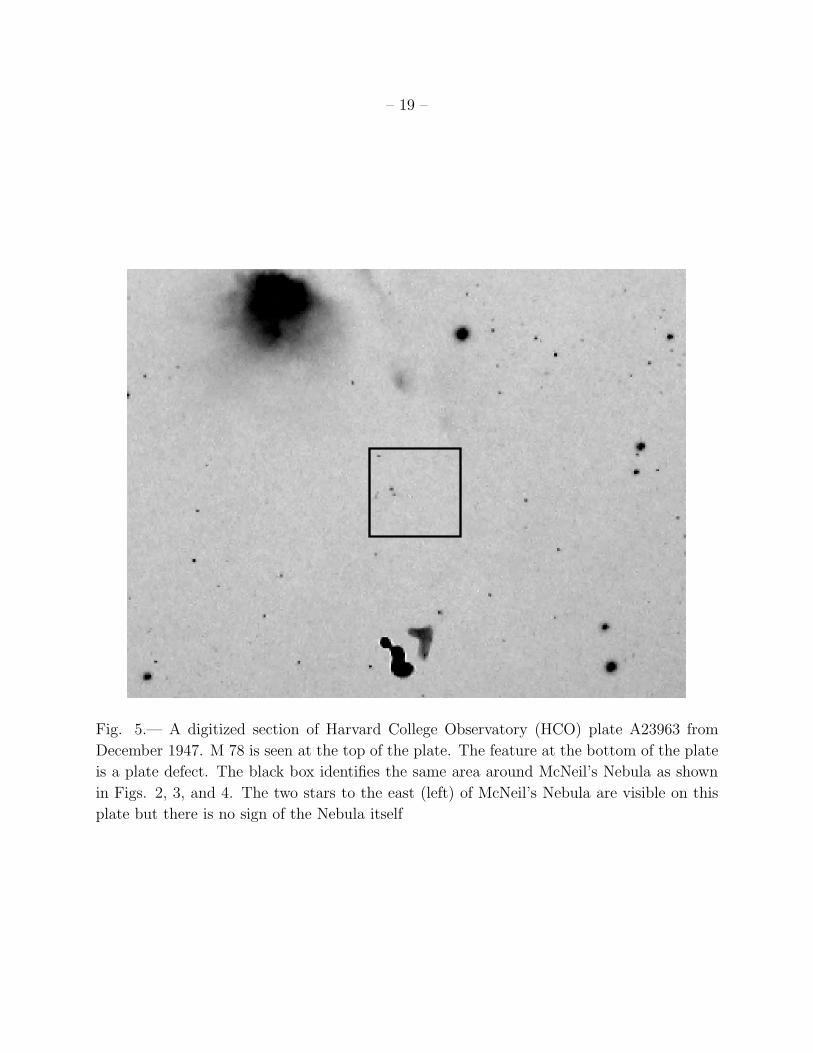
collection. Fifteen plates (of 400+) had reasonable to good image quality and were of good
sensitivity. The two stars to the east of McNeil’s Nebula (see 02MAR66 panel in Fig. 2) were
visible on only eight plates and a representative digitized image of the appropriate region of
one of these plates is shown in Fig. 5.
– 6 –
3. DISCUSSION
Our aims in this project are to i) determine if any other outbursts of McNeil’s Nebula
have been detected over the last century, and ii) characterize the 1966–1967 outburst of the
object and compare it to the current event that began in November 2003 (see Briceno et al.
2004).
3.1. Previous Outbursts of McNeil’s Nebula
Our Asiago and HCO plate searches did not detect additional appearances of McNeil’s
Nebula, resulting from outbursts of V1647 Ori, beyond the previously known 1966–1967
and recent (2003–2006) events. Given the limiting magnitudes of the HCO plates (≤14th)
and their blue sensitivity, we cannot rule out that an event similar to the 1966–1967 or
current outbursts occurred prior to 1966 but only of a ’super-outburst’ that would have
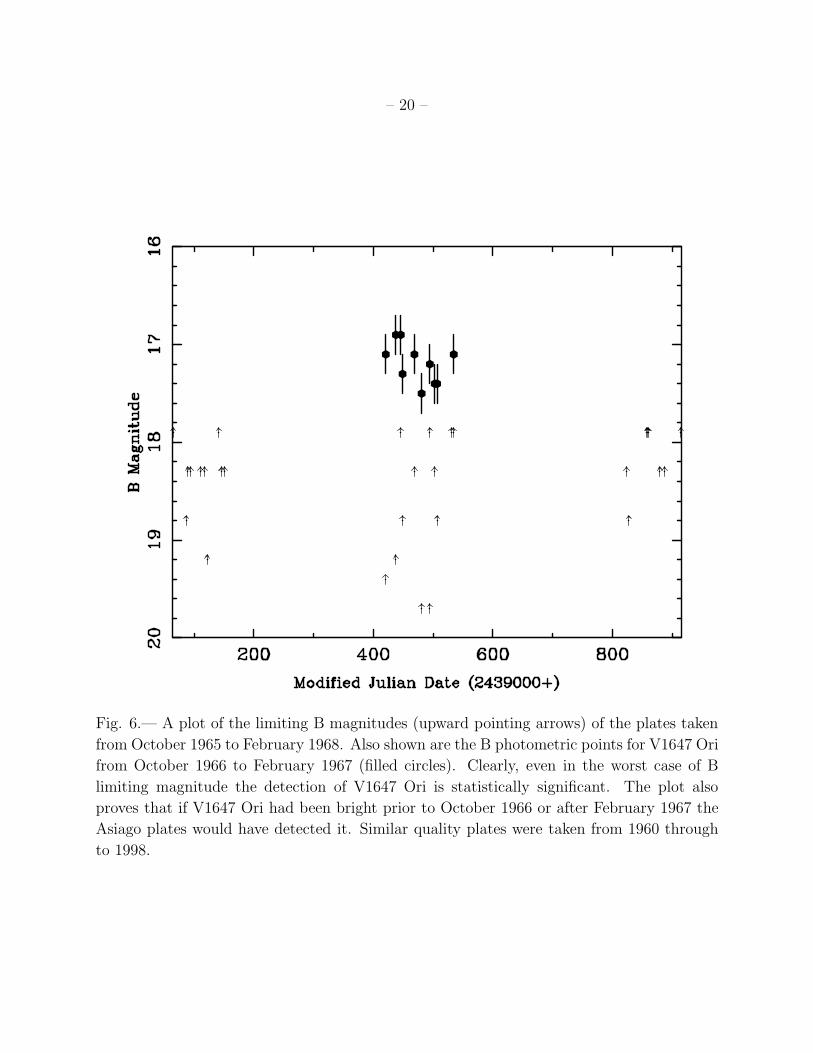
been 3–4 magnitudes brighter. Fig. 6 illustrates this by showing the B-band photometry of
the southern knot of McNeil’s Nebula during the 1966–1967 event. The number of plates
studied (∼400) and their temporal coverage (1898–1974) are such that we consider that we
should have detected a super-outburst if one had occurred assuming the length of the event
was similar to that in 1966–1967. The Asiago plates from 1960–1998 are considerably more
sensitive and the 1966–1967 outburst is well documented but again, no additional outbursts
are seen. If we were to assume that the time between the current and previous outburst is
characteristic for eruptions in V1647 Ori then we would maybe have expected an outburst
∼38 years earlier, i.e. in approximately 1928. 4
3.2. Comparison of the 1966–1967 and Current Outbursts
3.2.1. Overall Morphology
Above, we have described the numerous plates that show McNeil’s Nebula during the
1966–1967 outburst. All these plates were found in the Asiago Observatory collection and
contain McNeil’s Nebula photographed in B (Fig. 2), R (Fig. 4), and I (Fig. 3) passbands.
We can directly compare the morphology of the nebula in 1966, using the digitized plate
4We have additionally found 18 plates from the Bamberg Observatory collection taken between 1932–1939. These are blue sensitive and have a limiting magnitude of 12–13. As might be expected, no appearanceof McNeil’s Nebula was detected.
– 7 –
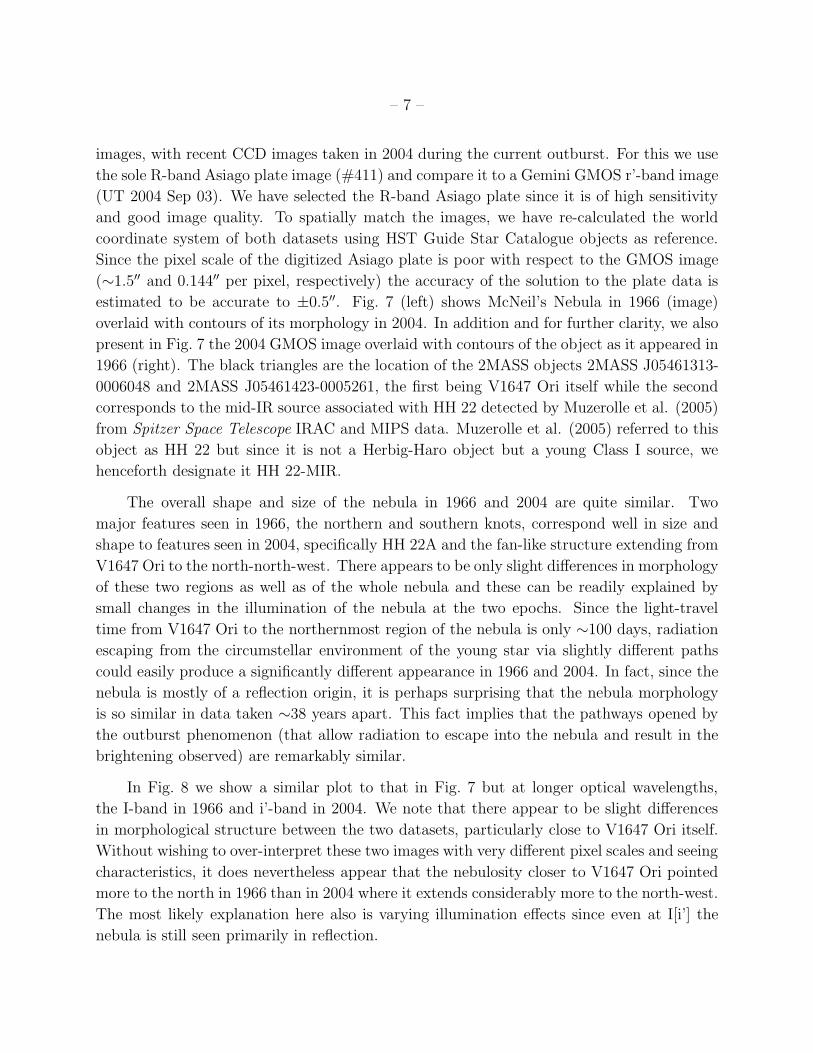
images, with recent CCD images taken in 2004 during the current outburst. For this we use
the sole R-band Asiago plate image (#411) and compare it to a Gemini GMOS r’-band image
(UT 2004 Sep 03). We have selected the R-band Asiago plate since it is of high sensitivity
and good image quality. To spatially match the images, we have re-calculated the world
coordinate system of both datasets using HST Guide Star Catalogue objects as reference.
Since the pixel scale of the digitized Asiago plate is poor with respect to the GMOS image
(∼1.5′′ and 0.144′′ per pixel, respectively) the accuracy of the solution to the plate data is
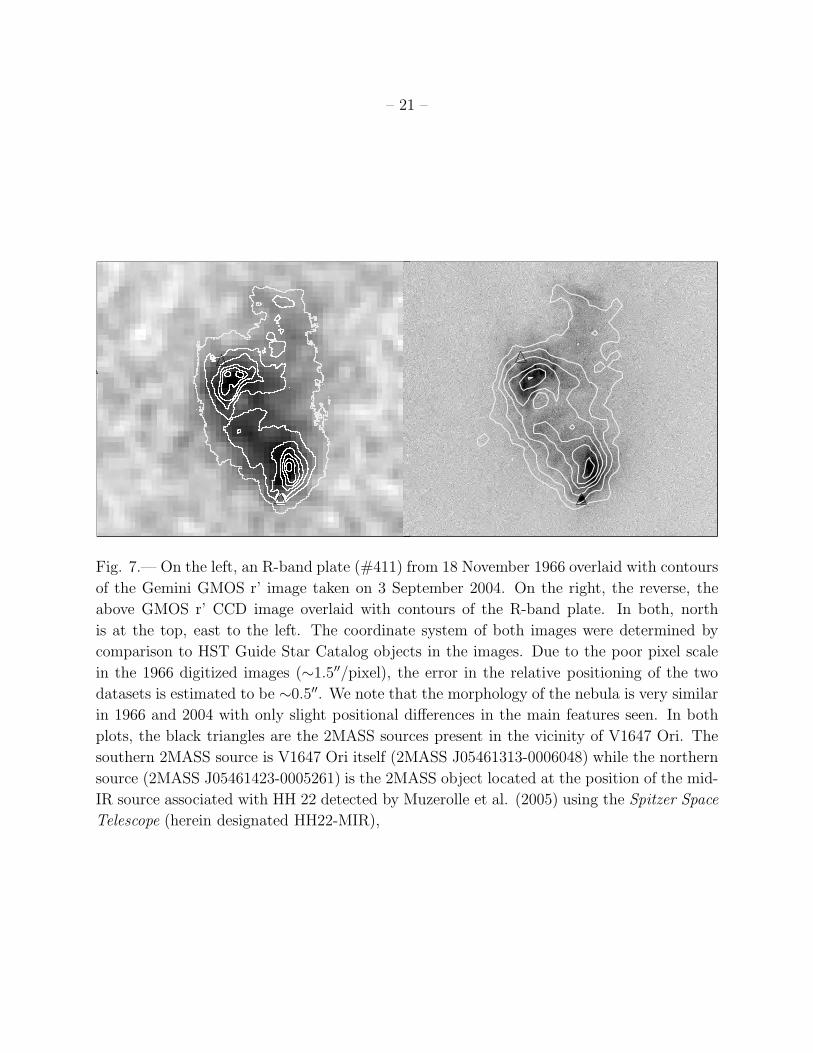
estimated to be accurate to ±0.5′′. Fig. 7 (left) shows McNeil’s Nebula in 1966 (image)
overlaid with contours of its morphology in 2004. In addition and for further clarity, we also
present in Fig. 7 the 2004 GMOS image overlaid with contours of the object as it appeared in
1966 (right). The black triangles are the location of the 2MASS objects 2MASS J05461313-
0006048 and 2MASS J05461423-0005261, the first being V1647 Ori itself while the second
corresponds to the mid-IR source associated with HH 22 detected by Muzerolle et al. (2005)
from Spitzer Space Telescope IRAC and MIPS data. Muzerolle et al. (2005) referred to this
object as HH 22 but since it is not a Herbig-Haro object but a young Class I source, we
henceforth designate it HH 22-MIR.
The overall shape and size of the nebula in 1966 and 2004 are quite similar. Two
major features seen in 1966, the northern and southern knots, correspond well in size and
shape to features seen in 2004, specifically HH 22A and the fan-like structure extending from
V1647 Ori to the north-north-west. There appears to be only slight differences in morphology
of these two regions as well as of the whole nebula and these can be readily explained by
small changes in the illumination of the nebula at the two epochs. Since the light-travel
time from V1647 Ori to the northernmost region of the nebula is only ∼100 days, radiation
escaping from the circumstellar environment of the young star via slightly different paths
could easily produce a significantly different appearance in 1966 and 2004. In fact, since the
nebula is mostly of a reflection origin, it is perhaps surprising that the nebula morphology
is so similar in data taken ∼38 years apart. This fact implies that the pathways opened by
the outburst phenomenon (that allow radiation to escape into the nebula and result in the
brightening observed) are remarkably similar.
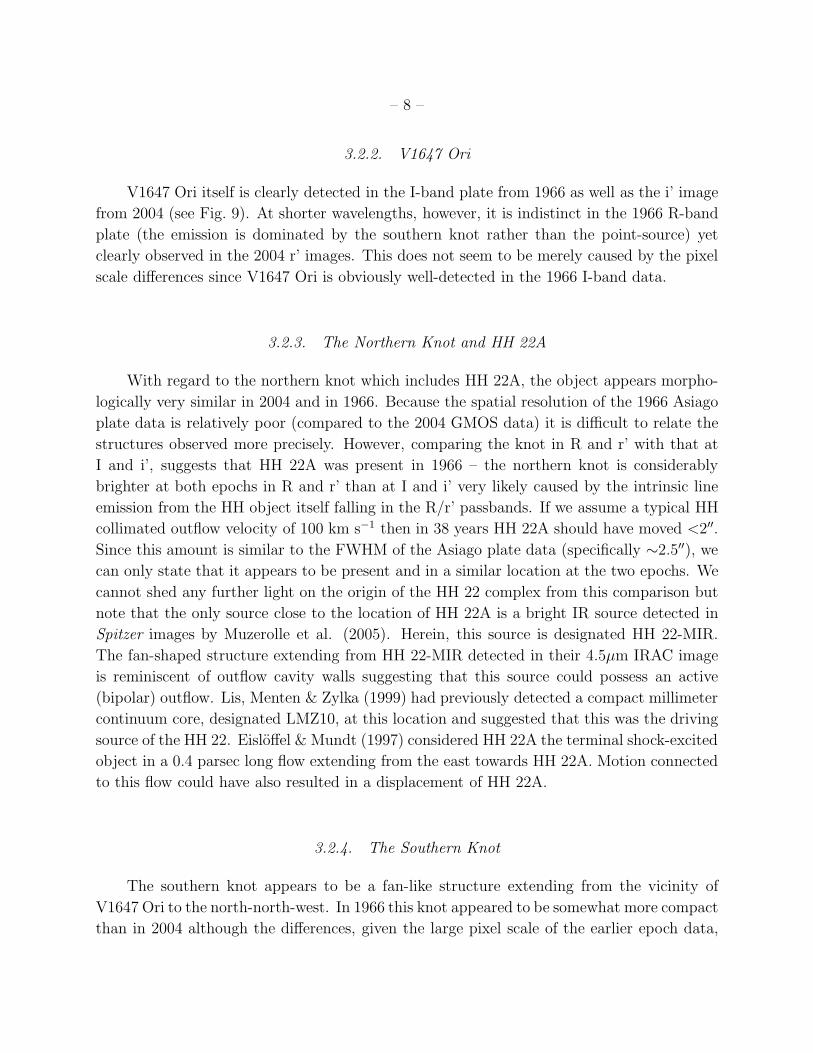
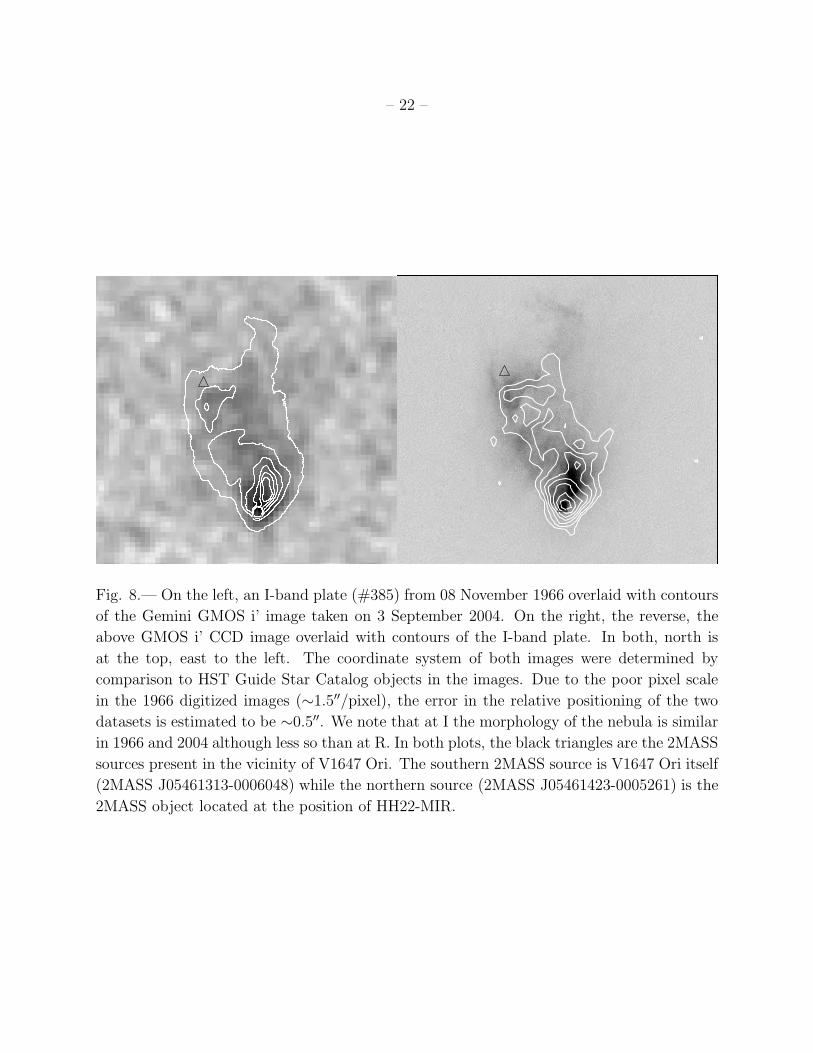
In Fig. 8 we show a similar plot to that in Fig. 7 but at longer optical wavelengths,
the I-band in 1966 and i’-band in 2004. We note that there appear to be slight differences
in morphological structure between the two datasets, particularly close to V1647 Ori itself.
Without wishing to over-interpret these two images with very different pixel scales and seeing
characteristics, it does nevertheless appear that the nebulosity closer to V1647 Ori pointed
more to the north in 1966 than in 2004 where it extends considerably more to the north-west.
The most likely explanation here also is varying illumination effects since even at I[i’] the
nebula is still seen primarily in reflection.
– 8 –
3.2.2. V1647 Ori
V1647 Ori itself is clearly detected in the I-band plate from 1966 as well as the i’ image
from 2004 (see Fig. 9). At shorter wavelengths, however, it is indistinct in the 1966 R-band
plate (the emission is dominated by the southern knot rather than the point-source) yet
clearly observed in the 2004 r’ images. This does not seem to be merely caused by the pixel
scale differences since V1647 Ori is obviously well-detected in the 1966 I-band data.
3.2.3. The Northern Knot and HH 22A
With regard to the northern knot which includes HH 22A, the object appears morpho-
logically very similar in 2004 and in 1966. Because the spatial resolution of the 1966 Asiago
plate data is relatively poor (compared to the 2004 GMOS data) it is difficult to relate the
structures observed more precisely. However, comparing the knot in R and r’ with that at
I and i’, suggests that HH 22A was present in 1966 – the northern knot is considerably
brighter at both epochs in R and r’ than at I and i’ very likely caused by the intrinsic line
emission from the HH object itself falling in the R/r’ passbands. If we assume a typical HH
collimated outflow velocity of 100 km s−1 then in 38 years HH 22A should have moved <2′′.Since this amount is similar to the FWHM of the Asiago plate data (specifically ∼2.5′′), we
can only state that it appears to be present and in a similar location at the two epochs. We
cannot shed any further light on the origin of the HH 22 complex from this comparison but
note that the only source close to the location of HH 22A is a bright IR source detected in
Spitzer images by Muzerolle et al. (2005). Herein, this source is designated HH 22-MIR.
The fan-shaped structure extending from HH 22-MIR detected in their 4.5µm IRAC image
is reminiscent of outflow cavity walls suggesting that this source could possess an active
(bipolar) outflow. Lis, Menten & Zylka (1999) had previously detected a compact millimeter
continuum core, designated LMZ10, at this location and suggested that this was the driving
source of the HH 22. Eisloffel & Mundt (1997) considered HH 22A the terminal shock-excited
object in a 0.4 parsec long flow extending from the east towards HH 22A. Motion connected
to this flow could have also resulted in a displacement of HH 22A.
3.2.4. The Southern Knot
The southern knot appears to be a fan-like structure extending from the vicinity of
V1647 Ori to the north-north-west. In 1966 this knot appeared to be somewhat more compact
than in 2004 although the differences, given the large pixel scale of the earlier epoch data,
– 9 –
are relatively small. The region does appear brighter in the i’ band image from 2004 than
on an I band plate from 1966 where V1647 Ori is clearly dominant.
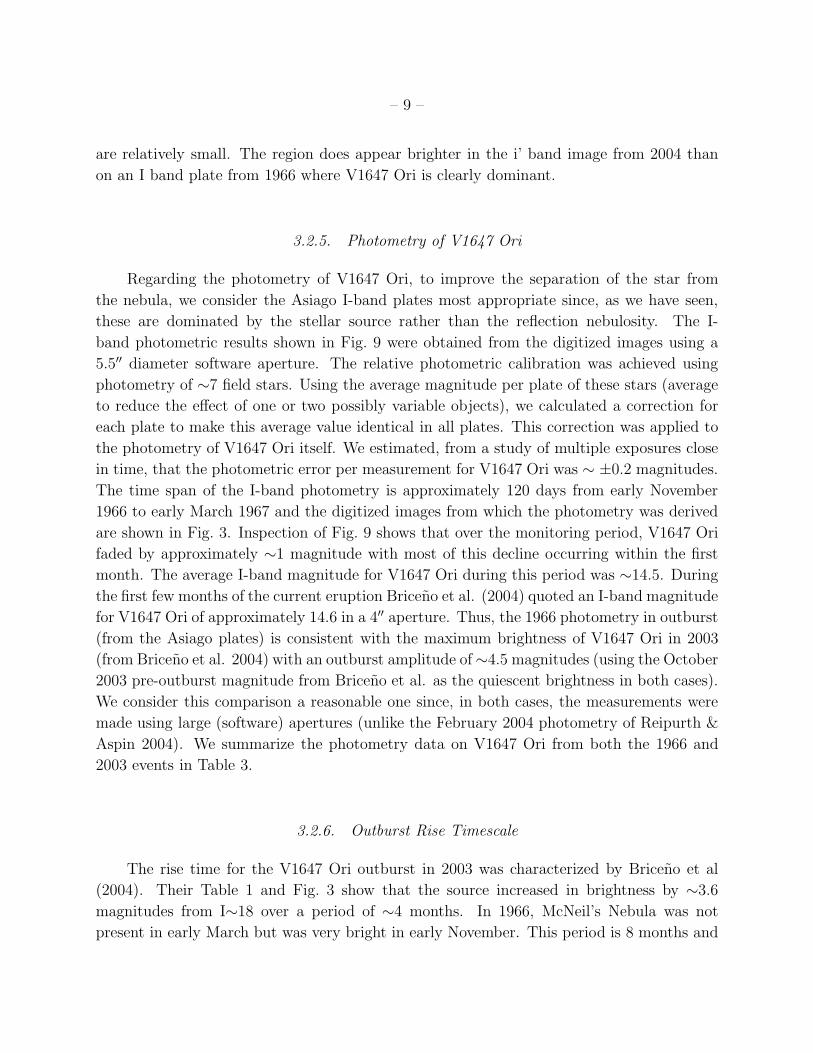
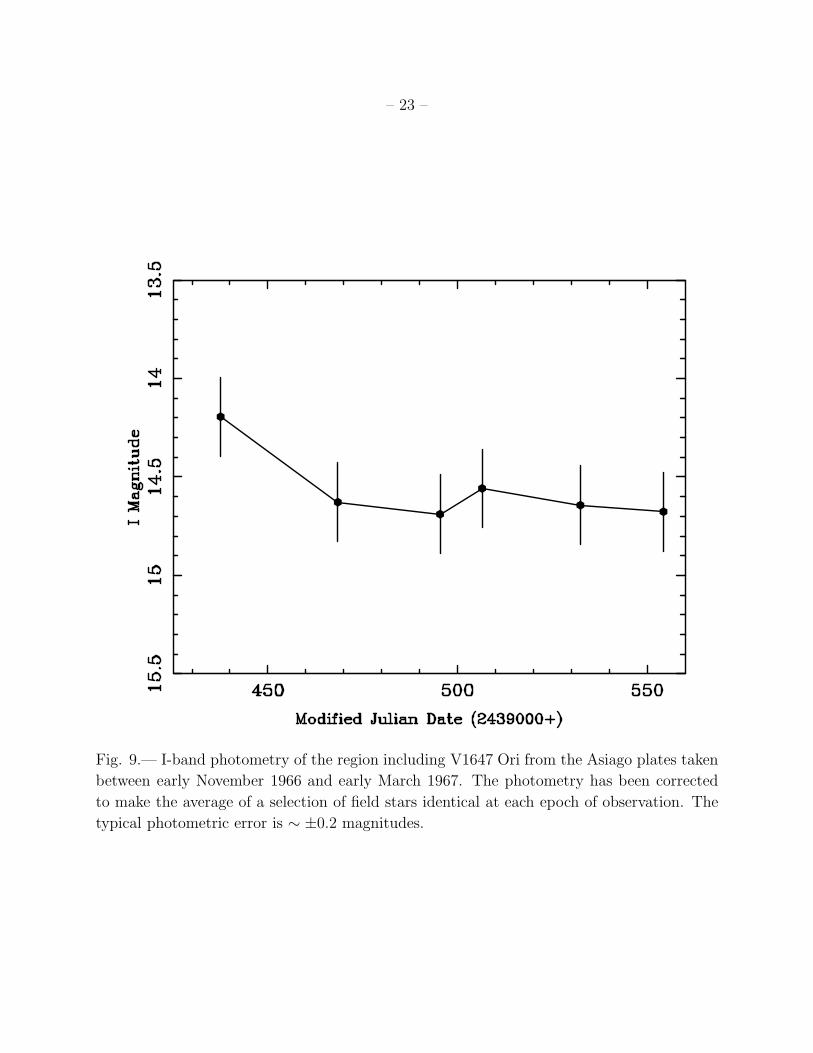
3.2.5. Photometry of V1647 Ori
Regarding the photometry of V1647 Ori, to improve the separation of the star from
the nebula, we consider the Asiago I-band plates most appropriate since, as we have seen,
these are dominated by the stellar source rather than the reflection nebulosity. The I-
band photometric results shown in Fig. 9 were obtained from the digitized images using a
5.5′′ diameter software aperture. The relative photometric calibration was achieved using
photometry of ∼7 field stars. Using the average magnitude per plate of these stars (average
to reduce the effect of one or two possibly variable objects), we calculated a correction for
each plate to make this average value identical in all plates. This correction was applied to
the photometry of V1647 Ori itself. We estimated, from a study of multiple exposures close
in time, that the photometric error per measurement for V1647 Ori was ∼ ±0.2 magnitudes.
The time span of the I-band photometry is approximately 120 days from early November
1966 to early March 1967 and the digitized images from which the photometry was derived
are shown in Fig. 3. Inspection of Fig. 9 shows that over the monitoring period, V1647 Ori
faded by approximately ∼1 magnitude with most of this decline occurring within the first
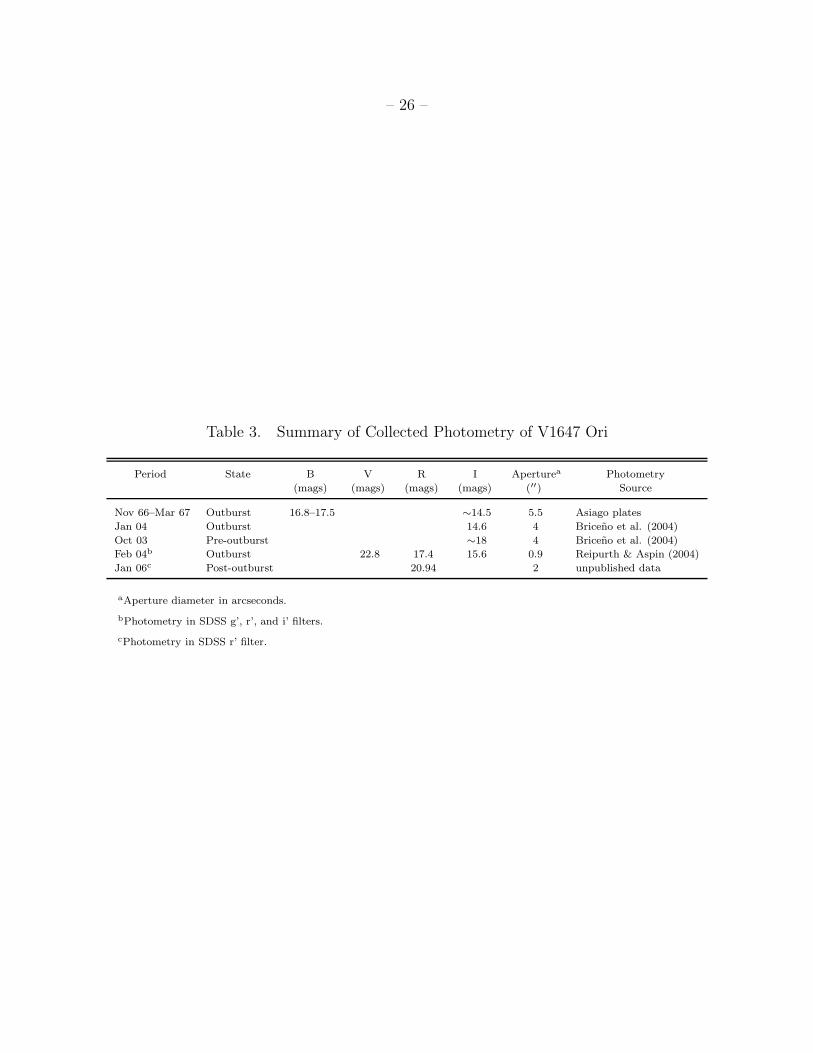
month. The average I-band magnitude for V1647 Ori during this period was ∼14.5. During
the first few months of the current eruption Briceno et al. (2004) quoted an I-band magnitude
for V1647 Ori of approximately 14.6 in a 4′′ aperture. Thus, the 1966 photometry in outburst
(from the Asiago plates) is consistent with the maximum brightness of V1647 Ori in 2003
(from Briceno et al. 2004) with an outburst amplitude of ∼4.5 magnitudes (using the October
2003 pre-outburst magnitude from Briceno et al. as the quiescent brightness in both cases).
We consider this comparison a reasonable one since, in both cases, the measurements were
made using large (software) apertures (unlike the February 2004 photometry of Reipurth &
Aspin 2004). We summarize the photometry data on V1647 Ori from both the 1966 and
2003 events in Table 3.
3.2.6. Outburst Rise Timescale
The rise time for the V1647 Ori outburst in 2003 was characterized by Briceno et al
(2004). Their Table 1 and Fig. 3 show that the source increased in brightness by ∼3.6
magnitudes from I∼18 over a period of ∼4 months. In 1966, McNeil’s Nebula was not
present in early March but was very bright in early November. This period is 8 months and
– 10 –
hence, the length of the rise time in 1966 would be <8 months which is consistent with that
in 2003.
3.2.7. Outburst Lifetime and Decline Timescales
In October 2005, Aspin & Reipurth (2005) reported that V1647 Ori had already started
to fade and estimated that at r’ it was ∼1 magnitude fainter than at maximum brightness.
In January 2006 we have found that McNeil’s Nebula was extremely faint and likely close
to its quiescent brightness. At this time, V1647 Ori had an r’ magnitude of 20.94±0.1 some
4.3 magnitudes fainter than at maximum. It appears then that we can characterize the
2003 outburst timescale at ∼26 months which is slightly longer, yet still consistent with, the
1966–1967 estimate of 5–20 months.
In 1967, all we can say is that McNeil’s Nebula had completely disappeared from the
Asiago plates within 9 months of the last observation shown in Fig. 9. During the recent
outburst we can again only constrain the decline timescale since it clearly began during the
period when Orion was behind the Sun. From the date of observation prior to this time,
when V1647 Ori appeared still in outburst, we estimate that the timescale for decline is ≤6
months. Again, the two timescales are consistent.
3.3. V1647 Ori and the EXor/FUor Phenomena
The paper by Herbig (1989) presents a comprehensive study of FUor and EXor events
and defines the classes in terms of their observed characteristics. The major differences
between these two types of eruptions are i) EXor eruptions appear to be much shorter in
duration than FUor events, ii) at maximum light the optical spectra of EXors are dominated
by T Tauri like emission whereas FUors show absorption spectra that resemble F- or G-type
supergiants, iii) EXors appear to exhibit greater short-term photometric variability than
FUors, and iv) the increase in brightness during an EXor eruption is often smaller than
that associated with a FUor eruption. Herbig (1989) Tables 1 and 3 show typical outburst
parameters for several FUors and EXors, with more details on the prototype EXor, EX Lupi,
during several outbursts presented by Herbig et al. (2001). We now compare the derived
outburst parameters for V1647 Ori with those for other eruptive variables. We note that:
• The rise time of V1647 Ori in 2003 was ∼4 months (120 days). This number is consistent
with the rise time in 1966 (constrained to be < 8 months) and is similar to the rise time of
several other EXors, as well as FU Orionis itself (120–380 days in 1936). Typically, however,
– 11 –
a FUor outburst rise time is longer than that of an EXor. Examples of the latter were quoted
by Herbig (1989) as being from one to several years.
• The duration of the V1647 Ori outburst in 1966–1967 was between 5 and 20 months while
for the 2003 outburst it is ∼26 months. This duration is more typical of EXor outburst
periods although a wide range of values have been found, from about 6 months to over a
year, with some examples (e.g. V1143 Ori) being over 4 years (Herbig 1989). FUor outbursts
are considerably longer and in the case of FU Ori is still ongoing after 70 years.
• The decline time for V1647 Ori in 1967 is not well constrained but was definitely < 9
months. Recent observations support a decline timescale of the 2003 event of ≤6 months.
Since there is no typical decline time for FUors, except that they are all very long, what
we know about the V1647 Ori outburst decline again seems more consistent with that of an
EXor.
• EXors are characterized by multiple outbursts (e.g. EX Lupi) whereas FUors have to date
only been observed to brighten once. Since we have evidence for two outbursts of V1647 Ori,
this seems more consistent with an EXor interpretation.
• At maximum light during the Spring of 2004, V1647 Ori showed an optical spectrum
dominated by Hα emission with a strong and highly blue-shifted absorption component. The
optical spectra of FUors at maximum light, soon after outburst, are generally characterized
by G-type giant photospheric features. Herbig (1989) states that EXors tend to show optical
features more similar to classical T Tauri stars than FUors. Since it is likely that heavy
veiling is present in the spectrum of V1647 Ori (Reipurth & Aspin 2004) we cannot draw
any conclusions on whether the underlying spectrum of the source appears at all FUor-like.
• The near-IR spectrum of V1647 Ori is dominated by 2.3µm CO emission with Brγ also
in emission. Similar observations of EX Lupi (Herbig et al. 2001) showed a dwarf-like near-
IR spectrum with CO in absorption and weak Brγ emission. A generally accepted near-IR
characteristic of FUors is deep CO absorption with little else present (cf. Reipurth & Aspin
1997). The near-IR spectrum of V1647 Ori resembles more that of SSV 13 in NGC 1333
(Aspin & Sandell 1994) which is considered to be an EXor based on its photometric behavior.
CO emission is seen in other young stars and is generally interpreted as coming from dense,
high temperature regions of accreting material.
– 12 –
4. CONCLUSIONS
We have searched for past eruptions of the pre-main sequence variable V1647 Ori, which
illuminates McNeil’s Nebula, using the plate archives of the Asiago Observatory and the
Harvard College Observatory and have obtained the following results:
1. During the period from 1960 to 1998, a total of 367 plates were obtained at the Asiago
Observatory which included the region of V1647 Ori. In this time interval, V1647 Ori was
visible on 19 plates taken between Oct 22, 1966 and Mar 4, 1967, corresponding to one full
winter observing season at Asiago. The last measurement of the previous winter season was
taken on March 20, 1966, and the first measurement of the following season was taken on
Nov 28, 1967. V1647 Ori and McNeil’s Nebula were not visible on either of these plates.
The 1966–1967 eruption was thus at least 134 days (4.4 months) but did not exceed 618 days
(1.7 years).
2. The plate collection of Harvard College Observatory contains about 400 blue-sensitive
plates taken between 1889 and 1974 which include the region of V1647 Ori. The limiting
magnitude of the best HCO plates is mph ∼14 mag, and on none of the plates is V1647 Ori
visible. All we can conclude from these plates is that no major eruption (>3 magnitudes
larger than the two known) took place during this period.
3. The appearance of McNeil’s Nebula in the 1966–1967 period was very similar to that
observed in the 2003 eruption although some minor differences exist likely due to changes in
nebula illumination.
4. V1647 Ori itself appears to be of similar maximum optical brightness during the two
outbursts.
5. The duration of the 1966 outburst is consistent with that of the current outburst.
Acknowledgments We are indebted to Arne Henden for providing a photometric cal-
ibration sequence for the V1647 Ori field. We thank the Asiago Observatory, the Harvard
College Observatory, and the Bamberg Observatory for allowing access to their precious
plate archive. Based partly on observations (under program identification GN-2004B-Q-28)
obtained at the Gemini Observatory, which is operated by the Association of Universities
for Research in Astronomy, Inc., under a cooperative agreement with the NSF on behalf
of the Gemini partnership: the National Science Foundation (United States), the Particle
Physics and Astronomy Research Council (United Kingdom), the National Research Council
(Canada), CONICYT (Chile), the Australian Research Council (Australia), CNPq (Brazil)
and CONICET (Argentina).
– 13 –
REFERENCES
Abraham, P., Kospal, A., Csizmadia, S., Moor, A., Kun, M., & Stringfellow, G. 2004, A&A,
419, L39
Andrews, S.M., Rothberg, B., & Simon, T. 2004, ApJ, 610, L45
Aspin, C., & Reipurth, B. 2005, IAU Circ. 8600
Aspin, C., & Sandell, G. 1994, A&A, 288, 803
Barbieri C., Blanco C., Bucciarelli B., Coluzzi R., Di Paola A., Lanteri L., Li Causi Gl,
Marilli E., Magrin S., Nesci R., Omizzolo A., Rampazzi F. Rossi, C., Stagni, R., &
Viotti, R., 2003a, Mem. S.A.It., 74, Suppl. 3, 351
Barbieri, C., Blanco, C., Bucciarelli, B., Coluzzi, R., Di Paola, A., Lanteri, L., Li Causi,
G.L., Marilli, E., Massimino, P., Mezzalira, V., Mottola, S., Nesci, R., Omizzolo, A.,
Pedichini, F., Rampazzi, F., Rossi, C., Stagni, M., Tsvetkov, M., & Viotti, R. 2003b,
Exp. Astronomy 15, 29
Briceno, C., Vivas, A.K., Hernandez, J., Calvet, N., Hartmann, L., Megeath, T., Berlind,
P., Calkins, M., & Hoyer, S. 2004, ApJ, 606, L123
Eisloffel, J., & Mundt, R. 1997, AJ, 114, 280
Grosso, N., Kastner, J.H., Ozawa, H., Richmond, M., Simon, T., Weintraub, D.A., Ham-
aguchi, K., & Frank, A. 2005, A&A, 438, 159
Hartmann, L., Calvet, N., Gullbring, E., & D’Alessio, P. 1998, ApJ, 495, 385
Hartmann, L., & Kenyon, S.J. 1996, ARA&A, 34, 207
Herbig, G.H. 1966, Vistas in Astronomy, 8, 109
Herbig, G.H. 1977, ApJ, 217, 693
Herbig, G.H. 1989, in ESO Workshop on Low Mass Star Formation and Pre-Main Sequence
Objects, ed. B. Reipurth, p. 233
Herbig, G.H., Aspin, C., Gilmore, A.C., Imhoff, C.L., & Jones, A.F. 2001, PASP, 113, 1547
Herbig, G.H., Petrov, P.P., & Duemmler, R. 2003, ApJ, 595, 384
Kastner, J.H., Richmond, M., Grosso, N., Weintraub, D.A., Simon, T., Frank, A., Ham-
aguchi, K., Ozawa, H., & Henden, A. 2004, Nature, 430, 429
– 14 –
Lehmann, T., Reipurth, B., & Brandner, W. 1995, A&A, 300, L9
Mallas, J.H., & Kreimer, E. 1970, The Messier Album (Cambridge: Sky Publ. Corp.)
McGehee, P.M., Smith, J.A., Henden, A.A., Richmond, M.W., Knapp, G.R., Finkbeiner,
D.P., Ivezic, Z., & Brinkmann, J. 2004, ApJ, 616, 1058
McNeil, J.W., 2003, IAU Circ. 8284
Muzerolle, J., Megeath, S.T., Flaherty, K.M., Gordon, K.D., Rieke, G.H., Young, E.T., &
Lada, C.J. 2005, ApJ, 620, L107
Ojha, D.K., Ghosh, S.K., Tej, A., Verma, R.P., Vig, S., Anupama, G.C., Bhatt, B.C.,
Parihar, P., Prabhu, T.P., Kamath, U.S., & Anandarao, B.G., 2005, Bull. Astron.
Soc. India, 33, 370
Reipurth, B., & Aspin, C. 1997, AJ, 114, 2700
Reipurth, B., & Aspin, C. 2004, ApJ, 606, L119
Rettig, T.W., Brittain, S.D., Gibb, E.L., Simon, T., & Kulesa, C., 2005, ApJ, 626, 245
Rosino, L. 1969, Proceedings of the Symposium held at University of Virginia, 1968. Ed.
Shiv S. Kumar. New York: Gordon and Breach, Science Publishers, 1969, p.181
Tsukagoshi, T., Kitamura, Y., Kawabe, R., Saito, M., Yokogawa, S., & Kurono, Y. 2005,
PASJ, 57, L21.
Vacca, W.D., Cushing, M.C., & Simon, T. 2004, ApJ, 609, L29
Walter, F.M., Stringfellow, G.S., Sherry, W.H., & Field-Pollatou, A. 2004, AJ, 128, 1872
This preprint was prepared with the AAS LATEX macros v5.2.
– 15 –
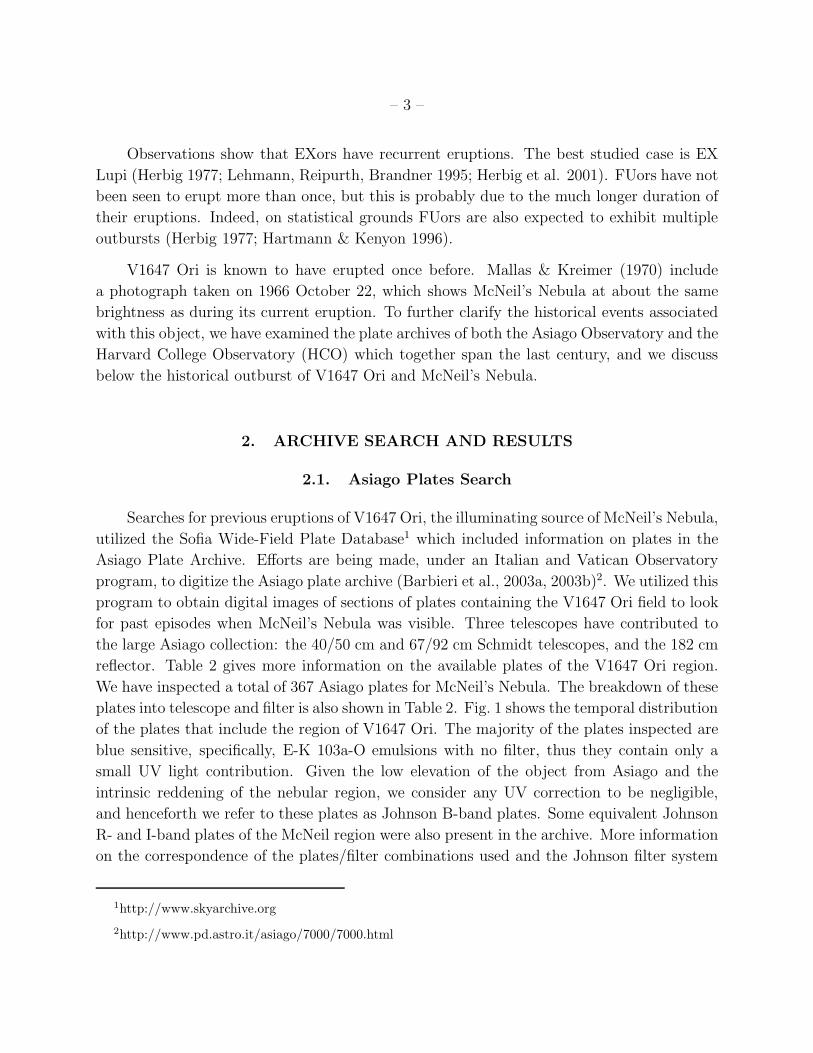
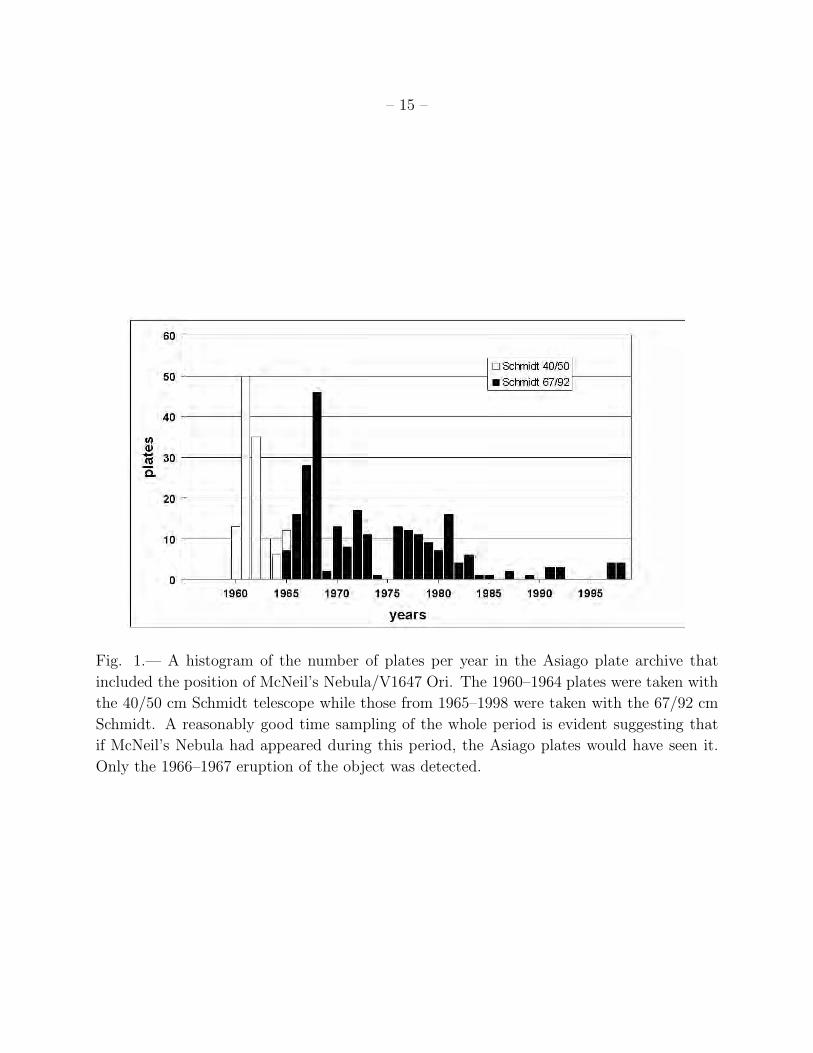
Fig. 1.— A histogram of the number of plates per year in the Asiago plate archive that
included the position of McNeil’s Nebula/V1647 Ori. The 1960–1964 plates were taken with
the 40/50 cm Schmidt telescope while those from 1965–1998 were taken with the 67/92 cm
Schmidt. A reasonably good time sampling of the whole period is evident suggesting that
if McNeil’s Nebula had appeared during this period, the Asiago plates would have seen it.
Only the 1966–1967 eruption of the object was detected.
– 16 –
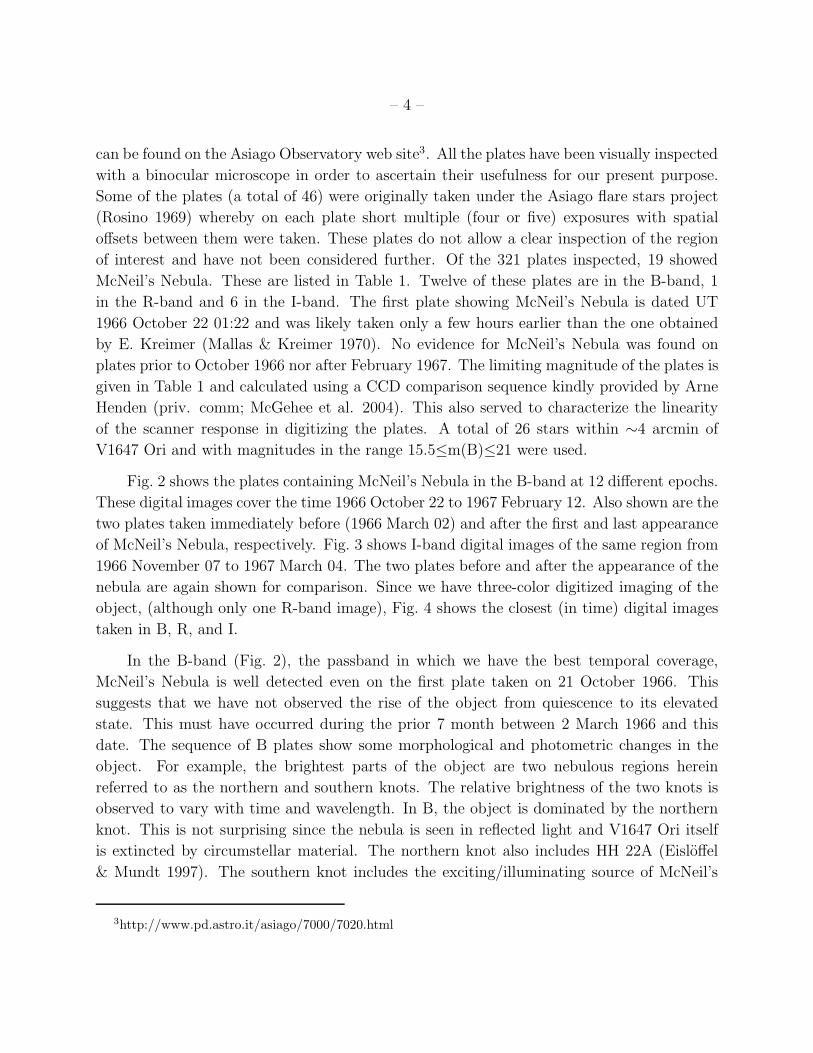
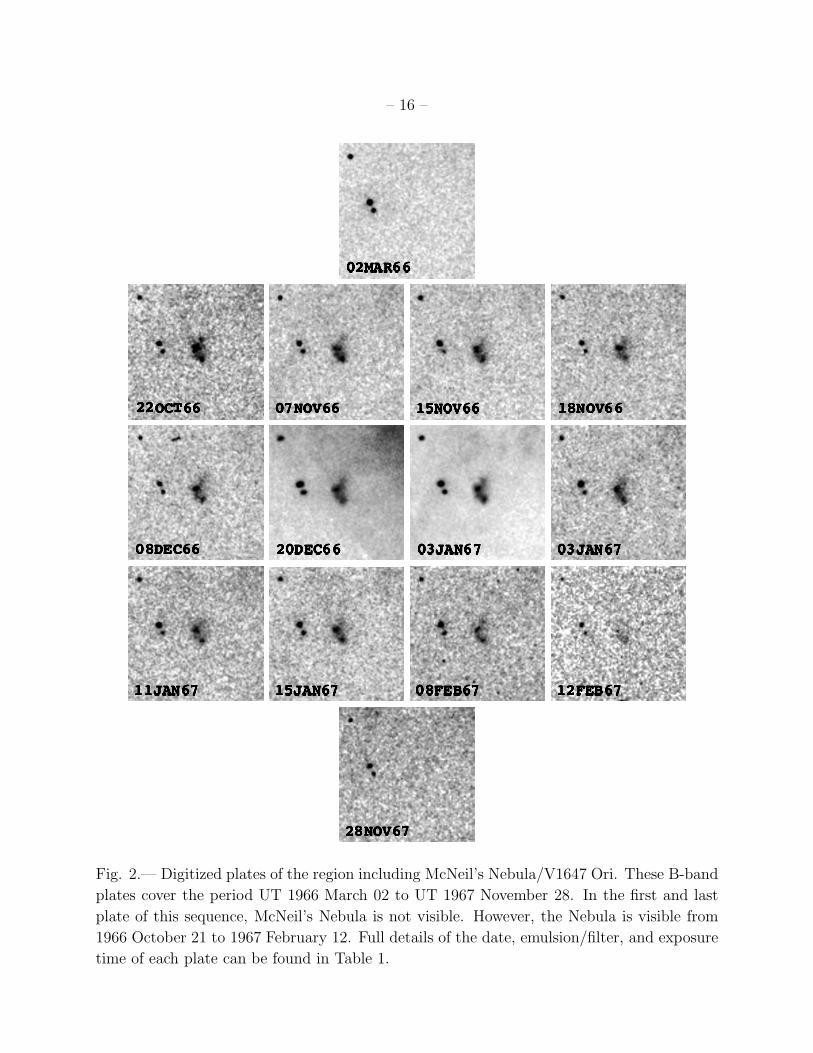
Fig. 2.— Digitized plates of the region including McNeil’s Nebula/V1647 Ori. These B-band
plates cover the period UT 1966 March 02 to UT 1967 November 28. In the first and last
plate of this sequence, McNeil’s Nebula is not visible. However, the Nebula is visible from
1966 October 21 to 1967 February 12. Full details of the date, emulsion/filter, and exposure
time of each plate can be found in Table 1.
– 17 –
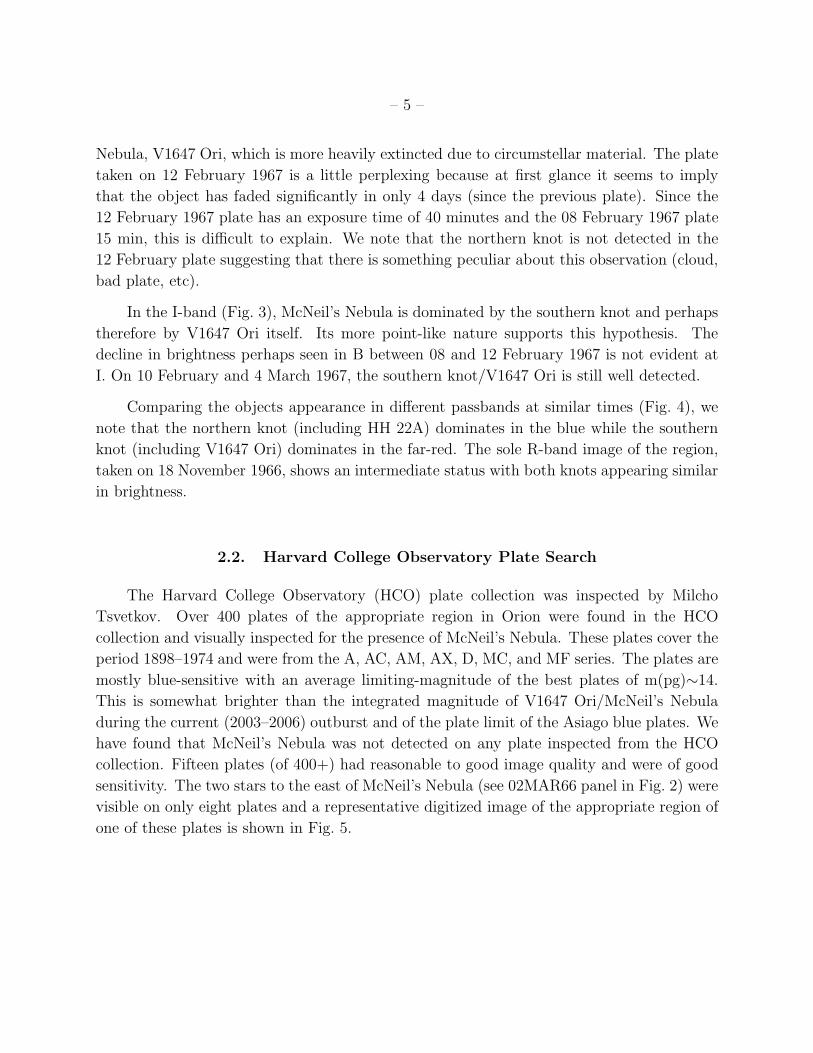
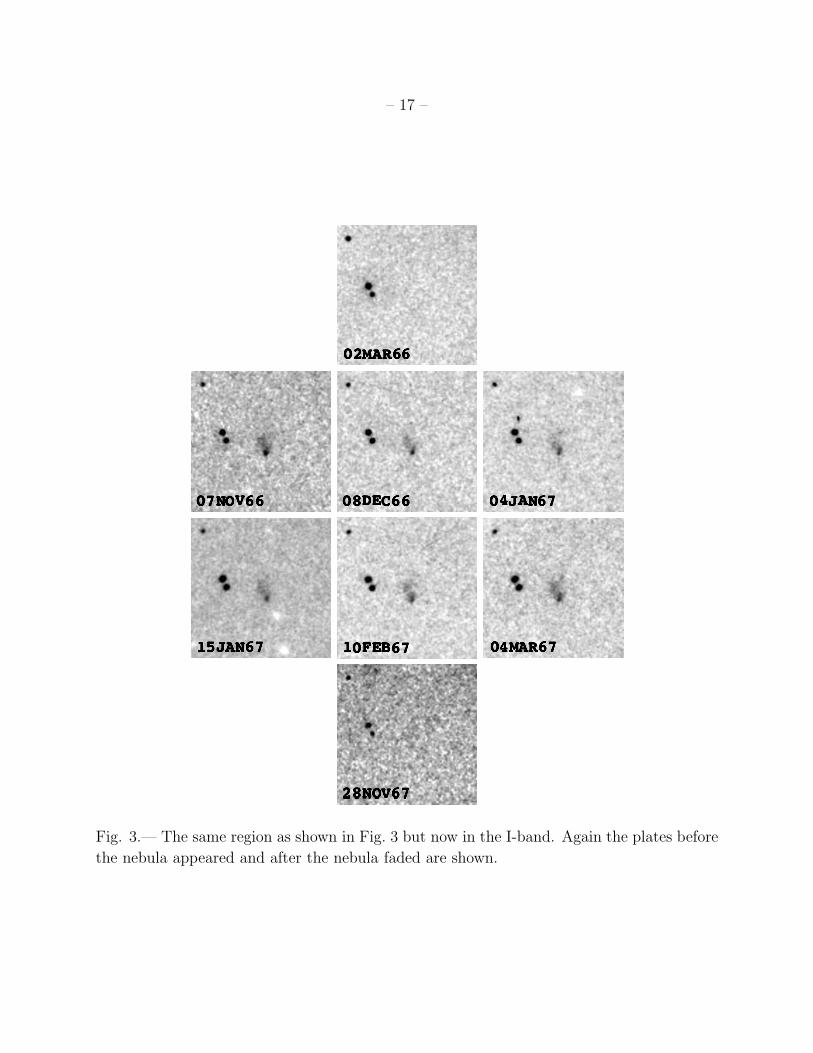
Fig. 3.— The same region as shown in Fig. 3 but now in the I-band. Again the plates before
the nebula appeared and after the nebula faded are shown.
– 18 –
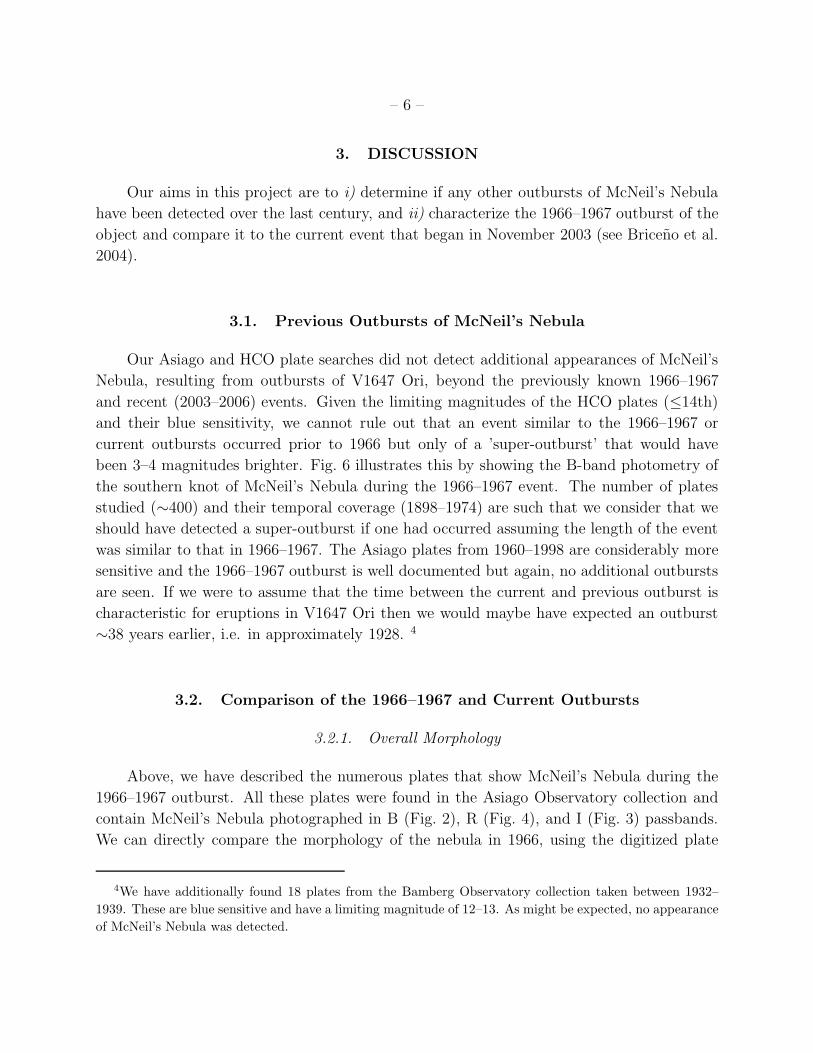
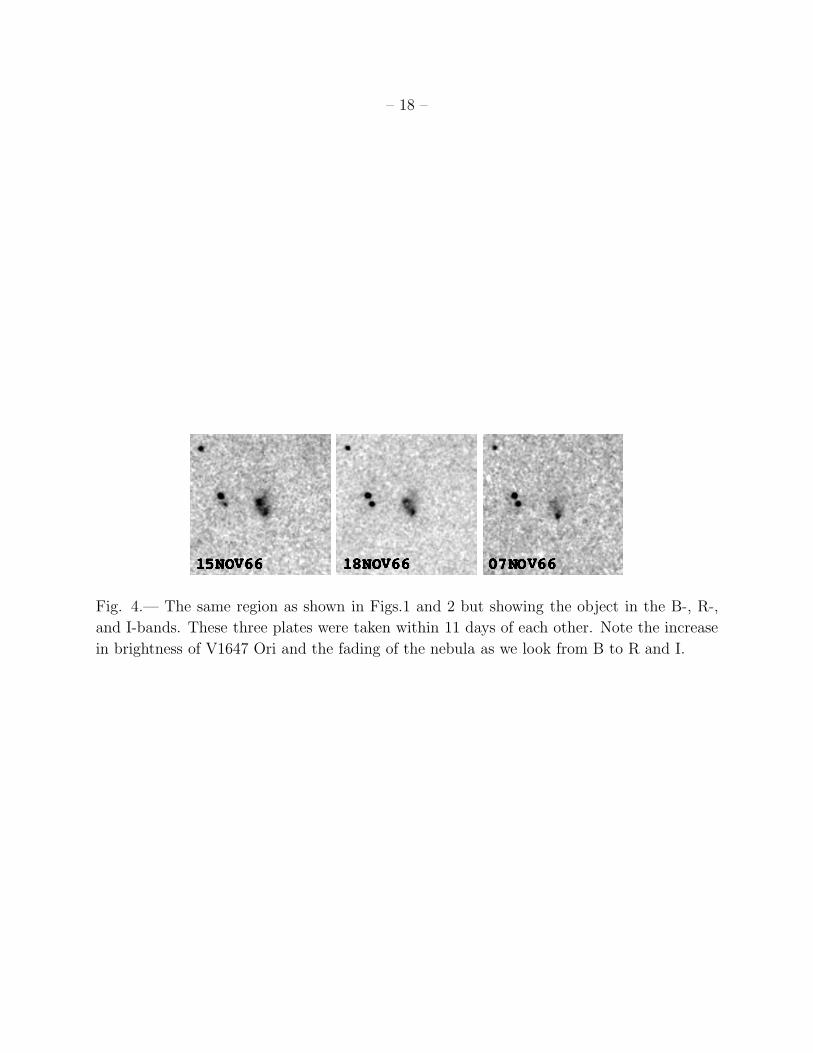
Fig. 4.— The same region as shown in Figs.1 and 2 but showing the object in the B-, R-,
and I-bands. These three plates were taken within 11 days of each other. Note the increase
in brightness of V1647 Ori and the fading of the nebula as we look from B to R and I.
– 19 –
Fig. 5.— A digitized section of Harvard College Observatory (HCO) plate A23963 from
December 1947. M 78 is seen at the top of the plate. The feature at the bottom of the plate
is a plate defect. The black box identifies the same area around McNeil’s Nebula as shown
in Figs. 2, 3, and 4. The two stars to the east (left) of McNeil’s Nebula are visible on this
plate but there is no sign of the Nebula itself
– 20 –
Fig. 6.— A plot of the limiting B magnitudes (upward pointing arrows) of the plates taken
from October 1965 to February 1968. Also shown are the B photometric points for V1647 Ori
from October 1966 to February 1967 (filled circles). Clearly, even in the worst case of B
limiting magnitude the detection of V1647 Ori is statistically significant. The plot also
proves that if V1647 Ori had been bright prior to October 1966 or after February 1967 the
Asiago plates would have detected it. Similar quality plates were taken from 1960 through
to 1998.
– 21 –
Fig. 7.— On the left, an R-band plate (#411) from 18 November 1966 overlaid with contours
of the Gemini GMOS r’ image taken on 3 September 2004. On the right, the reverse, the
above GMOS r’ CCD image overlaid with contours of the R-band plate. In both, north
is at the top, east to the left. The coordinate system of both images were determined by
comparison to HST Guide Star Catalog objects in the images. Due to the poor pixel scale
in the 1966 digitized images (∼1.5′′/pixel), the error in the relative positioning of the two
datasets is estimated to be ∼0.5′′. We note that the morphology of the nebula is very similar
in 1966 and 2004 with only slight positional differences in the main features seen. In both
plots, the black triangles are the 2MASS sources present in the vicinity of V1647 Ori. The
southern 2MASS source is V1647 Ori itself (2MASS J05461313-0006048) while the northern
source (2MASS J05461423-0005261) is the 2MASS object located at the position of the mid-
IR source associated with HH 22 detected by Muzerolle et al. (2005) using the Spitzer Space
Telescope (herein designated HH22-MIR),
– 22 –
Fig. 8.— On the left, an I-band plate (#385) from 08 November 1966 overlaid with contours
of the Gemini GMOS i’ image taken on 3 September 2004. On the right, the reverse, the
above GMOS i’ CCD image overlaid with contours of the I-band plate. In both, north is
at the top, east to the left. The coordinate system of both images were determined by
comparison to HST Guide Star Catalog objects in the images. Due to the poor pixel scale
in the 1966 digitized images (∼1.5′′/pixel), the error in the relative positioning of the two
datasets is estimated to be ∼0.5′′. We note that at I the morphology of the nebula is similar
in 1966 and 2004 although less so than at R. In both plots, the black triangles are the 2MASS
sources present in the vicinity of V1647 Ori. The southern 2MASS source is V1647 Ori itself
(2MASS J05461313-0006048) while the northern source (2MASS J05461423-0005261) is the
2MASS object located at the position of HH22-MIR.
– 23 –
Fig. 9.— I-band photometry of the region including V1647 Ori from the Asiago plates taken
between early November 1966 and early March 1967. The photometry has been corrected
to make the average of a selection of field stars identical at each epoch of observation. The
typical photometric error is ∼ ±0.2 magnitudes.
– 24 –
Table 1. Inspected Asiago Observatory Plates of the V1647 Ori Region
Telescope Focal Length Date of Date of # of Plates Photometric
Name (cm) First Plate Last Plate or Films Banda
S40/50 100 26 Nov 1960 22 Oct 1965 120 B(92),V(7),R(21)
S67/92 216 30 Oct 1965 19 Feb 1998 245 B(145),V(22),R(7),I(71)
182 Cass 1640 05 Dec 1977 05 Dec 1977 2 B(1),R(1)
anumber in parentheses are # plates in that band
– 25 –
Table 2. Observing Log
Plate UT Date/Time Julian Date Emulsion Filter ExpTime Phot. Lim.
# (Y/M/D-H:M ) (minutes) Band Mag
239 1966/03/20-19:08 2439205.25 103a-E RG1 50 R 18.0
374 1966/10/22-01:22 2439420.50 103a-O – 15 B 19.4
383 1966/11/07-23:51 2439437.41 103a-O – 15 B 19.2
385 1966/11/08-01:03 2439437.50 INsens RG5 30 I 15.1
399 1966/11/16-02:35 2439445.54 Oa-O – 25 B 17.9
411 1966/11/19-01:37 2439448.50 103a-E RG1 40 R 18.0
412 1966/11/19-02:25 2439448.54 Oa-O – 20 B 18.8
433 1966/12/08-22:48 2439468.37 INsens RG5 30 I 15.1
434 1966/12/08-23:25 2439468.41 Oa-O – 20 B 18.3
491 1966/12/21-00:43 2439480.45 IIIa-J arra – 60 B 19.7
519 1967/01/03-20:44 2439494.29 IIIa-J arra – 60 B 19.7
520 1967/01/03-21:40 2439494.33 Oa-O – 30 B 17.9
528 1967/01/04-21:30 2439495.33 INsens RG5 40 I 15.5
548 1967/01/11-22:39 2439502.37 103a-O – 15 B 18.3
569 1967/01/15-23:21 2439506.41 INsens RG5 40 I 15.6
570 1967/01/15-23:54 2439506.41 103a-O – 15 B 18.8
578 1967/02/08-22:17 2439530.37 Oa-O – 40 B 17.9
592 1967/02/10-21:24 2439532.33 INsens RG5 40 I 15.6
596 1967/02/12-19:20 2439534.25 103a-O – 15 B 17.9
613 1967/03/04-19:04 2439554.25 INsens RG5 60 I 15.6
1081 1967/11/28-23:15 2439823.41 103a-O – 15 B 17.9
aarr indicates baked in a Nitrogen atmosphere
– 26 –
Table 3. Summary of Collected Photometry of V1647 Ori
Period State B V R I Aperturea Photometry
(mags) (mags) (mags) (mags) (′′) Source
Nov 66–Mar 67 Outburst 16.8–17.5 ∼14.5 5.5 Asiago plates
Jan 04 Outburst 14.6 4 Briceno et al. (2004)
Oct 03 Pre-outburst ∼18 4 Briceno et al. (2004)
Feb 04b Outburst 22.8 17.4 15.6 0.9 Reipurth & Aspin (2004)
Jan 06c Post-outburst 20.94 2 unpublished data
aAperture diameter in arcseconds.
bPhotometry in SDSS g’, r’, and i’ filters.
cPhotometry in SDSS r’ filter.