Embed Size (px)
Citation preview
THE 2000-2001 FINANCIAL CRISIS IN TURKEY
Fatih Özatay and Güven Sak
Central Bank of Turkey and Ankara University
August 2002 (revised)
Executive Summary
In the last decade the Turkish economy was hit by two crises. The first one occurred at
the beginning of 1994 when there was a managed float. The second crisis preceded by a
financial turmoil that burst in the second half of November 2000 just at the midst of an
exchange rate based stabilization program. As of the end of December 2000, the average
interest rates were almost four times higher than their levels at the beginning of November
and more than five times higher than the pre-announced year-end depreciation rate of the lira.
This unsustainable situation ended on the February 19, 2001, when the prime minister
announced that there was a severe political crisis. Three days later, the exchange rate system
collapsed and Turkey declared that it was going to implement a floating exchange rate system.
In this paper we analyzed the reasons behind the latest crisis. Our main conclusion is
that the root cause of the crisis was the combination of a fragile banking sector and a set of
triggering factors. The fragility of the banking sector is noted in other studies on the recent
Turkish crises. Unlike other studies, we analyze the structural characteristics of the Turkish
banking system and provide a precise definition for banking sector fragility in the context of
Turkey right before the crisis. Having done that we then present the mechanics of the crisis
process.
We provide plenty of evidence regarding the risk accumulation in the banking system
in the period preceding the crisis: increase in currency and maturity mismatches and a rise in
non-performing loans. Hence, the banking system was highly vulnerable to capital reversals.
However, risk accumulation was not homogenous throughout the system. There were two
different types of dichotomization: Private versus state banks and within the private banks.
The root cause of the fragility of the banking system was high public sector borrowing
requirement and the way it was financed. The sustainability of this financing mechanism was
conditional on the continuation of demand for government securities. In the absence of a
program that reduces borrowing requirement, the upward trend in government debt
instruments portfolios of the banks and their mode of financing in bank balance sheets
increased the vulnerability of the banking system.
THE 2000-2001 FINANCIAL CRISIS IN TURKEY1
Fatih Özatay and Güven SakCentral Bank of Turkey and Ankara University
August 2002 (revised)
I. INTRODUCTION
In the last decade the Turkish economy was hit by two crises. The first one that
surprisingly attracted very limited international interest occurred at the beginning of 1994
when there was a managed float.2 The second crisis preceded by a financial turmoil that burst
in the second half of November 2000 just at the midst of an exchange rate based stabilization
program. The pressure in the market calmed down soon after a new letter of intent was
presented to the International Monetary Fund (IMF). However, as of the end of December, the
average interest rates, both the overnight rate and secondary market bond rate, were almost
four times higher than their levels at the beginning of November and more than five times
higher than the pre-announced year-end depreciation rate of the lira. This unsustainable
situation ended on the February 19, 2001, when the prime minister announced that there was a
severe political crisis that ignited a crisis in the highly alerted markets due to what had
happened at the end of the preceding year. On that day the overnight rates jumped to
unprecedented levels of 6200 percent in uncompounded terms. Three days later, the exchange
rate system collapsed and Turkey declared that it was going to implement a floating exchange
rate system from that time onwards.
The effects of the 2000-2001 crisis were more severe than that of the first one. What
were the reasons behind the 2000-2001 crisis? Why did the crisis burst in the midst of the
IMF-supported stabilization program? What are the lessons that can be drawn? In this paper
we aim at answering these questions. Our principal conclusion is that the root cause of the
crisis was the combination of a fragile banking sector and a set of triggering factors that made
this fragility crystal-clear. The fragility of the banking sector is noted in other studies of the
recent Turkish crises. Akyüz and Boratav point to shortcomings in the design of the 2000
program and the inadequacy of crisis management policies.3 They emphasize the dependence
of the earnings of the banking sector on high yielding Treasury bills associated with rapid
inflation, which renders this sector highly vulnerable to disinflation. They further argue that
since much of the fiscal adjustment was predicated on declines in nominal and real interest
rates, the program was not compatible with this feature of the banking system. Alper mainly
focuses on the events occurred at the end of 2000.4 He argues that three factors were
responsible: in ability of the Turkish government in maintaining the stream of good news and
sustaining capital inflows, not enough backing of the program by the IMF, and the “no
sterilization” rule of the program which led to interest rate undershooting in the first phase of
the 2000 program. The fragility of the banking sector is a major theme of the analysis
presented. Unlike these two studies, we analyze the structural characteristics of the Turkish
banking sytem and provide a precise definition for banking sector fragility in the context of
Turkey right before the crisis. Having done that we then present the mechanics of the crisis
process.
In the following section, we demonstrate that the pressure in the markets indeed
heavily increased at the end of 2000. The third section focuses on the role of fundamentals
and self-fulfilling prophecies. We first show that, though the macroeconomic fundamentals
were rather weak in 2000, the prerequisites of the first generation crisis models were absent.
We then discuss the role of self-fulfilling prophecies. By analyzing the performance of the
economy in the aftermath of the crisis, we argue that the Turkish crisis is hardly a second-
generation type. The natural questions then arise are the following: Was the principal cause of
the Turkish crisis a prospective deficit associated with implicit bailout guarantees to a failing
banking system? Or, was the root cause of the problem financial fragility in the banking
sector in the sense of a third-generation model? We answer these questions by analyzing the
banking sector structure in the period preceding the crisis in the fourth section. We provide
strong evidence that point to the weakness of the banking sector. Furthermore, we point to
two types of dichotomy in the banking sector: between private and state banks and within the
private banks.
The fifth section presents the anatomy of the crisis. Major differences between 1999
and 2000 are the following: First, as opposed to the managed floating exchange rate system of
1999, there was a pre-announced crawling peg system in 2000. Second, current account
registered a record high level of deficit in 2000. Third, given a weak banking system and
promises to strengthen the system, delays in reforming the banking sector increased tensions
in the markets in the second half of 2000. Fourth, taking over of some of the private banks
starting from September and simultaneous sensational criminal investigations for some of the
bankers, made it crystal clear that the banking system was not homogenous rather
dichotomized as 'good' and 'bad' banks. This intensified rumors about which banker and
which bank was in the line. As a result, in the second half of November 2000, 'good' banks
closed their credit lines to 'bad' banks. In the paper, it is argued that the first two differences
were not sufficient to trigger a crisis. Main igniting factors were the delays in reforming the
banking sector and the actions that caused the dichotomy in the banking sector to come to the
surface. The last section concludes.
II. IDENTIFYING THE CRISIS
In February 1990, Turkey applied to the IMF for the full convertibility of the lira. Up
to January 2000, managed floating exchange rate system was operative. At the end of 1999,
Turkey signed a stand-by agreement with the IMF and started to implement a stabilization
program one of the pillars of which was a pre-announced crawling peg exchange rate regime.
The novelty of this exchange rate regime was that both the exit strategy and the date of exit
were publicly known at the very beginning of the program: It was announced that, after
eighteen months, exchange rate would be allowed to fluctuate in a continuously widening
band. However, after a sky-high overnight rate as much as 6200 percent in uncompounded
terms and a huge decline in foreign exchange reserves of the Central Bank, on February 23,
2001, just four months before the exit day, the exchange rate system collapsed and the Central
Bank declared that it would allow the lira to float freely. By this announcement, the dollar rate
jumped from a level of 685 thousand liras to 958 thousand liras in a day.
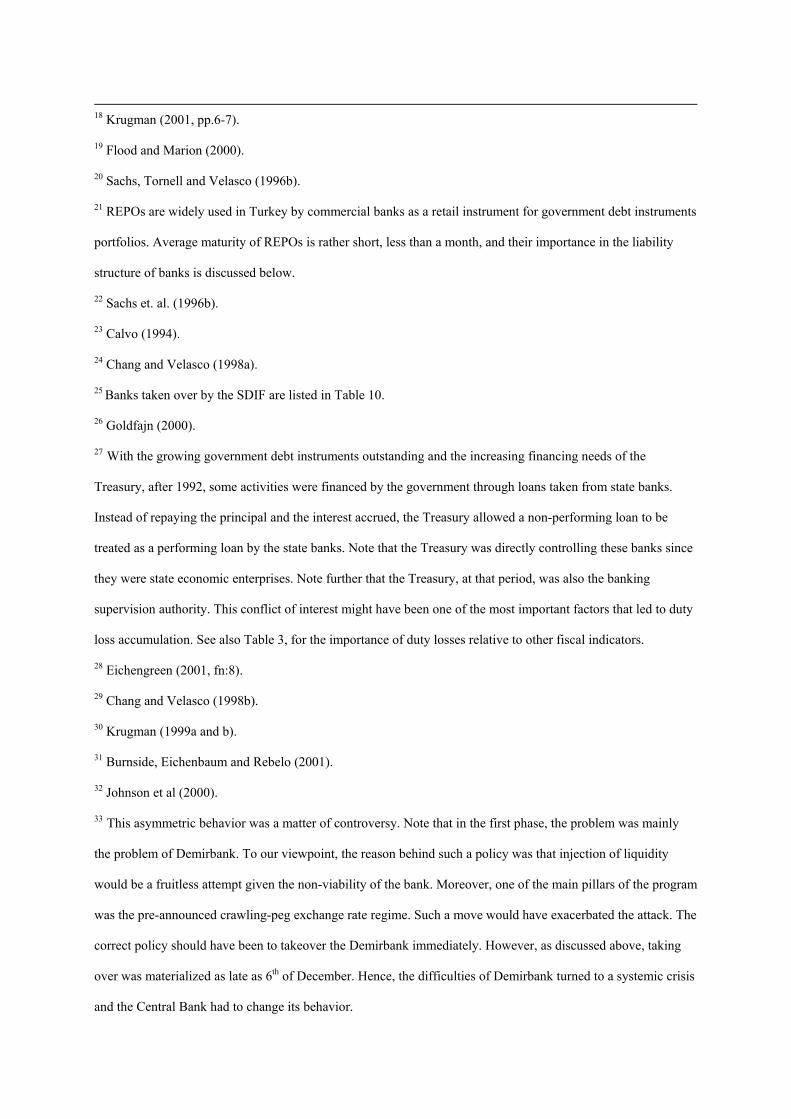
Figure 1 shows the pressure in the markets based on an ad-hoc exchange market
pressure index along with its mean and mean plus two standard deviations, which are
indicated by horizontal lines. As advocated by Eichengreen, Rose and Wyplozs and Sachs,
Tornell, and Velasco, this pressure index is a weighted average of monthly rates of changes of
exchange rate, (the negative of) official reserves and overnight rates, for the 1990.01-2001.12
period.5 Monthly percentage change of each variable is weighted by the inverse of its
variance. There are two instances at which the index exceeds its mean plus two standard
deviations: The first one is the 1994.02-1994.04 period and the second one is the 2001:02-
2001:04 period. This result is robust to the types of weight used. Note that this index does not
indicate the first attack to the lira that occurred at the end of November 2000, since the
Central Bank defense of the lira was successful at that time. However, as a result of this
attack, the Central Bank lost almost 20 percent of its foreign exchange reserves while the
average overnight rate jumped to 873 percent again in uncompounded terms. To highlight the
severity of this attack, we provide the evolution of the individual items of the market pressure
index in Figures 2-4. Figure 2 presents the dollar-lira rate from the first working day of 1999
to the last working day of 2001. Figure 3 shows the evolution of the weighted average
overnight rates in the same period. Finally, time path for the weekly foreign exchange
reserves of the Central Bank is graphed in Figure 4. In what follows we analyze the reasons
behind the 2000-2001 crisis.
[Figures 1, 2, 3 and 4 about here]
III. THE ROLE OF FUNDAMENTALS AND SELF-FULFILLING
PROPHECIES
In this section we argue that the first and second-generation models of currency crises
may shed some light on the 2000-2001 crises but cannot fully explain what had happened. For
example, on the one hand in the period preceding the crisis the public sector borrowing
requirement was very high bringing to mind a first-generation type crisis, on the other hand, it
had been mainly financed by issuing domestic debt rather than by inflation tax which is at the
core of such models. Moreover, corrective fiscal measures were already on play. On the one
hand, high and short-term public debt and a weak banking sector might have set the stage for
a self-fulfilling attack inducing speculators to anticipate that the government would not dare
to increase interest rates to defend the currency. On the other hand, despite corrective
measures the fundamentals were weak as well as output contracted sharply and the fiscal
policy was not expansionary in the aftermath of the crisis contrary to what the second-
generation models envisage.
III.1 A first generation type crisis?
We first begin with the first generation models. Early models of balance of payment
crises, following Krugman and Flood and Garber emphasize continuous deterioration of
macroeconomic fundamentals which deplete international reserves of central banks as the
main cause of currency collapses.6 This generally materializes through reliance upon
seigniorage revenues to finance public sector deficits. A moment comes and rational
economic agents knowing this gradual depletion of international reserves correctly anticipate
that prevailing exchange rate regime will not survive. This anticipation triggers a sudden
speculative attack on the currency to prevent excessive capital losses. According to this line of
research, collapse of the exchange rate system is inevitable due to the incompatibility of loose
monetary policy with this system. Table 1 provides information on how consolidated budget
deficits were financed in the 1996-2000 period.7 It is evident that the central bank lending was
nil since 1997. Moreover, in the same period, base money creation was entirely through
foreign exchange reserve build-up, except during the 1998 Russian crisis. Table 2 documents
the evolution of the three main items of the Central Bank balance sheet, namely net domestic
assets, net foreign assets and base money, along with its reserves. Hence, the budget deficits
were not financed by the central bank resources in the period preceding the crisis. That is, the
central element of the first generation models was not on the stage. One should note two
further points. First, during the period analyzed, only in the last two years net foreign
borrowing was positive. Second, domestic debt maturity was considerably increased again in
the last two years (Table 3). These two phenomena do not fit in a scenario where economic
conditions are continuously deteriorating and risk is continuously rising.
[Tables 1 and 2 about here]
It is evident from Figures 3 and 4 that neither the increases in interest rate nor the
reserve fall were gradual rather sudden. The overnight rate was highly volatile throughout the
first eleven months of 2000 in sharp contrast to what had happened in year before and no
upward trend was observed. At best, it can be said that overnight rates fluctuated around a
constant mean of 40 percent. It reached 82 percent on the 15th of November and 873 percent
on the 1st of December. The evolution of the price of the Turkish Treasury 30-year Eurobond,
which was issued on the January 11, 2000 with an initial price of 98.45, is also illuminating in
this respect. The downward trend in price began as late as 6th of September after reaching a
maximum level of 108.7 (Figure 5).
[Figure 5 about here]
A similar sudden movement was also observed for the reserves. The record high level
for foreign exchange reserves was 26.7 billion dollars and registered at the end of June 1998.
With the impact of the Russian crisis, reserves fell to 19.7 billion dollars at the end of the
same year. Since then, the reserves followed an upward trend up to the end of 1999 and
reached a level of 24.8 billion dollars. This trend replaced by a fluctuation around a level of
24 billion dollars in the second half of 2000, which was halted by the burst of the financial
turmoil. Note that just two days before the burst of the turmoil that is on the 17th of November
2000, the reserve level was 24.4 billion dollars, which was almost equal to the maximum level
that was observed since the Russian crisis.8 Hence, in the periods preceding the crisis,
prerequisites of the first generation models were absent. Namely, public sector borrowing
requirement was never met through the central bank resources and there is no evidence that
the crisis had been expected long-before its occurrence.
This does not change the fact that the fiscal fundamentals in 2000 in isolation were
indeed weak. However, one should note that the IMF supported program aimed at and indeed
succeeded to some extent, giving an end to the then unsustainable fiscal policy by mainly
reversing the upward trends in real interest rate on government securities, public sector
borrowing requirement and domestic debt stock. Moreover, an important amount of primary
surplus was registered in 2000 (Table 3). As evident, in almost all dimensions, fiscal
performance of 1999 is the worst in the 1995-2000 period. Then, why did the crisis burst at
the end of 2000 not in 1999?
[Table 3 about here]
It is clear that the evolution of fiscal indicators is not illuminating for the timing of the
crisis. This is hardly surprising since a fiscal laxity does not necessarily end-up with a
currency crisis. Eichgreen, Rose, and Wyplozs, using the data of the OECD countries for the
post-war period, state that they do not detect any link between lack of fiscal discipline and
exchange market turbulence.9 Frankel and Rose, by using annual observations for the 1971 -
1992 period for 105 countries, analyze 117 different crashes.10 They report “neither current
account nor government budget deficits appear to play an important role in a typical crash.”
Sachs, Tornell and Velasco examine financial events following the devaluation of the
Mexican peso for a set of twenty emerging markets.11 They state, “As important as a country’s
fiscal stance may be in theory, however, it is important to notice that irresponsible fiscal
behavior was not among the central causes of recent troubles.” Do these observations mean
that there is not any correlation between wrong fiscal fundamentals and a currency crisis?
Sachs et. al. emphasize that countries with better fiscal performance had the chance to escape
from any crisis.12 Eichengreen et. al. state that only money-financed deficits may matter, as
one of the plausible interpretations of their results.13 This is the crucial point and as
demonstrated above, since 1997, deficits were not financed by the Central Bank resources in
Turkey.
Looking at Table 4, it is evident that the lira was in an overvaluation trend against a
basket of currencies since 1995. As of the end of September 2000 the real appreciation
relative to 1995 was 14 percent whereas for year-end-2000 the same figure was 18 percent.
Sachs, Tornell and Velasco and Frankel and Rose demonstrate that one of the predictors of
currency crises is real appreciation of domestic currency.14 Note first however that just at the
start of the program it was publicly announced that the crawling peg system would be
replaced by a relatively flexible exchange rate system in July 2001 with an increasing
flexibility as time goes by.15 Second, the growth rate of the Turkish economy was on average
very high in the 1995-1997 period, i.e. 7.8 percent, when the half of the real appreciation was
realized, whereas the average growth rate of the 1995-2000 period was 4.6 percent. Hence,
the standard Balassa-Samuelson effect might be one of the reasons of real appreciation.
[Table 4 about here]
Was a major reason behind the crisis the record high level of current account deficit?
Sustainability of current account literature stresses that, in steady state, current account deficit
should be less than average growth rate of economy times its net international debt as a share
of GDP. Calvo and Végh take maximum level of indebtedness as 80 percent of GDP, above
which capital markets are reluctant to further extend credit to developing countries.16
Multiplying 80 percent by the average growth rate of the Turkish economy in the 1969-2000
period, which is 4.4 percent, gives 3.5 percent which is lower than the current account deficit
to GDP ratio registered in 2000. Hence, based on this measure the current account deficit was
high. However, note that the deficit was a one-shot type; in the preceding two years the
current account was almost balanced. Note further four points. First, the government, long
before the end of 2000, had announced that it was going to tighten its 2001 budget to reduce
the current account deficit. Second, one of the underlying reasons of the high deficit was real
appreciation of the lira and as discussed above Turkey was planning to pass to a more flexible
exchange rate regime in July 2001. Third, an important part of the deficit was due to the rise
in crude petroleum prices. Fourth, among others, Sachs, Tornell and Velasco and Frankel and
Rose find that the current account is a poor predictor of currency crises.17
To summarize, in the five-year period preceding the crisis, the macroeconomic
fundamentals of the last two years were the worst. However, despite a record high level of
current account deficit of 2000 and real appreciation of the lira, almost all of the indicators
displayed a positive stance in 2000 compared to 1999. This positive stance may be attributed
to the IMF supported stabilization program. Then, why did the crisis burst at the end of 2000,
not in 1999? The absence of the leading indicators of a first-type crisis but the vulnerability of
the economy despite an improving stance in macroeconomic fundamentals brings to mind a
possibility of a self-fulfilling crisis. In the next section we turn to this issue.
III.2 A second-generation type crisis?
One of the main reasons that make the Turkish 2000-2001 crisis an interesting case is
that the high public sector borrowing requirement was mainly financed by issuing domestic
debt in the period preceding the crisis. This financing mechanism by limiting excess money
supply prevented both inflation levels to be at higher than the realized and already high levels
and a continuous depletion in international reserves leading to a first generation type crisis. As
well documented elsewhere, domestic borrowing masks foreign exchange losses. The
important point, however, is that if real interest is positive and there is not an offsetting
primary surplus, domestic debt financing is not stable. This process will sooner or later come
to an end, but the timing depends on actions of main actors of debt market rendering the
economy open to self-fulfilling attacks.
One can imagine a situation where government aims at implementing a stabilization
plan, but due to for example a forthcoming election postpones the plan and continues
domestic debt financing. Or, the country may already be implementing a stabilization plan
that addresses fiscal imbalances. However, the initial level of the deficit can be at such a high
level that it may only be feasible to realize the fiscal discipline gradually which means that
debt financing should continue. Based on fundamentals there is no natural collapse and hence
such an economy does not deserve a first-type crisis; in the absence of speculative attacks, the
prevailing exchange rate system can survive. Despite this fact, second-generation models
argue that exchange rate system can collapse, because of the attack of speculators who
anticipate that the government would abstain from taking necessary measures against an
attack. A high public debt or a fragile banking sector may lead to such anticipations. Does this
scenario fit the Turkish case?
Although it is difficult to answer this question, based on what had happened in the
post-crisis period, one can still be provided. Note that there should not be an output decline in
the aftermath of a crisis. In words of Krugman, “If a speculative attack drives a currency off
its peg, this does not imply a negative shock to employment and output. Indeed, in this case
the contrary should be true: because the policy constraint of a peg is removed, the result is
actually positive for short-run macroeconomics.”18 Evidently this did not happen in Turkey.
The economy contracted sharply, by 8.5 percent in 2001, after a 6 percent growth attained in
2000. In the similar vein, Flood and Marion note that second-generation type crisis models
require that in the post-crisis period there should be expansionary policies that validate
anticipations of speculators.19 However, post-crisis policies in Turkey were not expansionary.
On the contrary, in May 2001 the Turkish authorities signed a new stand-by agreement with
the IMF, and the primary budget registered a record high level of surplus (Table 3).
The discussion so far reduces the possibility of a second-generation type currency
crisis. This necessitates a discussion of other explanations. Was the principal cause of the
Turkish crisis a prospective deficit –in this case an additional deficit on top of the existing
one- associated with implicit bail-out guarantees to a failing banking system? Or, was the root
cause of the problem financial fragility in the banking sector in the sense of a third-generation
model? Note that third-generation models give a special importance to self-fulfilling
prophecies as in the second-generation models. Due to some reason capital flies and either the
banking or the corporate sector or both of them collapse pushing economy into a deep
recession. Below we argue that the root cause of the crisis was the combination of a fragile
banking sector and triggering factors that made this fragility crystal-clear.
IV. BANKING SECTOR
In this section, we first show the indicators for the vulnerability of the domestic
commercial banks. There is a plenty of evidence regarding risk accumulation in the
commercial bank balance sheets. Second, it is shown that, in the period preceding the crisis,
the nature of risk accumulation was not homogeneous throughout the system. Two different
types of dichotomy were observed: There was, first, the dichotomy between private and state
banks. The second dichotomy was within the private banking industry.
IV.1 Vulnerability of the banking sector
We first discuss the issue of international liquidity on the road to the crisis. Since
during a crisis period, a central bank will find itself as a lender of last resort for banks, its
foreign exchange reserves should be compared with liquid liabilities of the banking sector.
This is especially important during an exchange rate based stability program. Sachs, Tornell
and Velasco emphasize that even if fundamentals are wrong, a speculative crisis is less likely
to occur when there is no problem with international liquidity.20 We use two alternative
definitions of total liquid liabilities of the banking sector. The first one is M2YR, which is the
sum of currency in circulation, domestic currency denominated deposits, foreign currency
denominated deposits, and repurchase agreements of commercial banks (REPOs).21 In the
second definition, instead of including all deposits regardless of their maturity, we only
consider deposits with maturity less than or equal to one month and name it M1YRS. Two
alternative reserve definitions are used. The first one is the official reserves whereas the
second one is the sum of the official reserves and the reserves of the commercial banks.
[Table 5 about here]
The first four rows of Table 5 provide data for alternative definitions of total liquid
liabilities of the banking sector to the foreign exchange reserves ratio. No matter which
definition is used, the conclusion remains the same. Liquidity ratios were stable up to
November 2000 and only a slight deterioration was materialized before February 2001.
Moreover, the magnitudes of alternative ratios are small compared to those of crisis countries.
For example, Sachs et. al. report that a similar ratio took a value of 7 in Mexico in mid-1994
and 10 just before the crisis.22 Calvo notes that the ratio was in the range of 2-3 for non-crisis
countries such as Argentina, Chile, Colombia, and Uruguay.23 Chang and Velasco (1998a)
argue that the Asian-5 countries -Indonesia, Korea, Malaysia, Philippines, and Thailand- had
a problem of international illiquidity when the crisis started.24 The M2/reserves ratio was
stable at high levels or increasing in each of these countries, except in Thailand, which was a
special case as shown by Chang and Velasco. According to their calculations, the M2/reserves
ratio was 6.5 in Korea as well as Indonesia, and 4.5 in Philippines. They also note that the
same ratio was about 3.4 in the then non-crisis countries -Argentina and Brazil.
Table 5 provides data also for total loans of the banking sector to GNP ratio and real
growth rate of the loan portfolio. These indicators are sometimes used as proxies for the credit
quality of the banking sector. It is argued that a rapid credit growth is a signal for an
increasing credit risk for the banks. It is clear from these data that the credit growth in Turkey
in 2000 was rather high. However, note that a similar phenomenon was also observed in the
non-crisis years, especially in the 1995-1997 period. Neither the liquidity ratios nor the credit
growth figures justify a crisis. The values they attain are not significantly different than the
non-crisis periods. This necessitates a closer look at the banking sector and the Turkish policy
experience after 1999.
We now turn to the evolution of more direct measures regarding the risk exposure of
domestic commercial banks. Table 6 presents various indicators of the risk exposure of the
banking sector in the 1995 – September 2001 period. The figures are reported in three groups
as indicators for the credit risk, foreign exchange risk and the interest rate risk. All of these
indicators clearly show that the vulnerability of the banking sector to capital reversals
increased throughout 2000.
The ratio of non-performing loans to total loans started to increase in 1998. Table 6
gives figures for the whole banking system taking public, private, Saving Deposits Insurance
Fund (SDIF) controlled and foreign banks together. Due to the growing number of banks
taken under the control of the SDIF, this ratio reached 10.7 percent in December 1999.25 Note
that this ratio was only 1.3 percent for private banks. This rather abrupt increase in non-
performing loans of the banks taken under the SDIF control raised doubts about the quality of
both information disclosure and rule enforcement. Combined with the delays in banking
reform, this discrepancy in figures blurred the picture regarding the health of the private
commercial banks immensely. It was understood that non-performing loan ratio increases
radically whenever a bank is taken under the control of the SDIF. This point is seen more
clearly when the non-performing loans of the SDIF controlled banks are analyzed (Table 6).
[Tables 6 and 7 about here]
In the period preceding the crisis, open foreign exchange position was a structural
feature of the Turkish banking system. This phenomenon is related with a long history of high
inflation and the inability of domestic banks to borrow long term in their own currency as
discussed for developing countries in general in Goldfajn.26 Three different measures of
currency risk are presented in Table 6, namely foreign currency denominated assets to foreign
currency denominated liabilities ratio, open foreign exchange position of both the balance
sheet and the aggregated balance sheet including off the balance sheet items. They all point to
a significant increase in the foreign exchange risk. While the total open foreign exchange
position of the banking system was following an upward trend on the road to the crisis, the
ratio of liquid foreign exchange denominated assets to total foreign exchange denominated
liabilities was following an opposite trend. The latter made the system more vulnerable to
sudden reversals.
Maturity mismatch is another structural feature of the banking system in Turkey due to
the inability of domestic banks to borrow long term in the domestic currency. The ratios of
assets to liabilities with matching maturities are reported in Table 6. The figures show that
the liabilities are more of a short-term nature while the maturities of assets are longer. For
example, for one unit a 3-month liability, there is a 0,5 unit of 3- month asset at the end of
1999. The picture even becomes worse when REPOs are taken into account. Note also the
declining trend in the average maturity of total deposits especially in 2000.
The evidence presented up to now clearly points to a significant deterioration in the
banking system in the period preceding the crisis. However, this trend was not symmetric
throughout the sector. We now turn to the first dichotomy that is the dichotomy between the
private and state banks.
IV.2 The dichotomy in the banking sector: private versus state
Despite the fact that both the private and state banks had accumulated risks on the road
to the crisis, the nature of the problem was different. On the asset side, the increasing size of
“duty loss” accumulation of the state banks and the need to finance it by short-term domestic
bank liabilities were the source of the problem.27 On the liability side, the ratio of lira to
foreign exchange liabilities shows one major difference between the two groups. The ratio
was much lower and moreover was decreasing for private banks. While the state banks were
more open to interest rate risk, private ones were more prone to exchange rate risk. This is
why the November 2000 crisis had hit the state banks hardest and the effect of the currency
collapse in February 2001 was just the reverse.
Table 8 gives a comparison of the balance sheet structures of private and state banks.
In the case of the former, those that were taken under the SDIF control in any of the periods
reported are not taken into account. The figures are adjusted to include REPOs in the balance
sheets. There are two major interest-earning assets in the Turkish banking system -
commercial loans and government debt instruments. At the end of 1999, for example, when
Turkey embarked on its exchange rate based stabilization package, the share of the
government debt instruments portfolio in private commercial bank balance sheets was even
greater than the loan portfolio. Note that the quality of the government debt instruments
portfolio is directly related with the expectations regarding debt sustainability. This feature
was increasing the vulnerability of the system to concerns about the rollover of the
outstanding government debt instruments. Notice that the situation in Turkey is not directly
comparable with the “bad” private loan problems of East Asian commercial banks. In the case
of the health of the Turkish private banking industry, smooth debt rollover is much more
important. This is an issue that needs to be understood to follow the factors triggering the
crisis in November 2000. It is also important in discussing the balance sheet effects after the
currency collapse.
[Table 8 about here]
The loan to government debt instruments portfolio ratio is systematically lower in the
case of state banks noting the smaller size of their commercial loan portfolio. Moreover, from
1997 to 2000, this ratio continued to decline. The interest-earning assets to total assets ratio
shows that the size of the commercial loan portfolios of state banks was rather small. Notice
that the ratio for state banks is about half of the ratio for private banks. The reason for this
discrepancy lies in the share of loans granted to the Treasury by state banks and later treated
as a duty loss by the Treasury. The share of duty loss accumulated reached more than 30
percent of total assets.
A liability side feature of private commercial bank balance sheets is that it reflects
their inability to borrow long term in domestic currency. The high ratio of REPOs to Turkish
lira deposits is an indication of this. Banks used REPOs as a retail instrument to carry
government debt instruments portfolios indirectly. However, all of the interest rate risk stay
in the bank selling the REPO contracts. The maturity of REPOs was much shorter than the
maturity of lira deposits which was around 3 months in 1999. While the ratio was on a
declining trend for private banks after the November crisis, a reverse trend is observed for
state banks. This amount to saying that, before the November 2000 crisis, state banks could
borrow at relatively longer maturities. With the interest rate hike after November, the growing
REPOs to lira deposits ratio raised the cost of funds to state banks enormously requiring
immediate action starting from May 2001.
Another distinguishing feature of the private banks was their heavy reliance on the
foreign exchange denominated deposits of residents. The ratio of foreign exchange to lira
deposits captures this feature. However, the maturity of foreign exchange deposits was also
short as in the case of lira deposits. Heavy reliance of private banks on foreign exchange
deposits made them more vulnerable to problems of international illiquidity crisis. In the
period preceding the crisis, private banks relied more on foreign exchange loans from
international banks. This was an additional factor that rendered them more vulnerable to
capital reversals.
IV.3 The dichotomy in the private banking sector
We now turn to the heterogeneity of the private domestic commercial banking system.
Regarding the banking crisis in Turkey, Eichengreen argues that the problem lied with “a
number of mid-sized banks … taken highly leveraged positions in anticipation of continued
declines in interest rates”.28 It is true that the events leading to the actual crisis in November
started with a mid-sized bank, which had taken a highly leveraged position, namely
Demirbank. The problem was the very risky mode of carrying government debt instruments
portfolio. It goes back to 1995 and became more acute by time. This risky mode of financing
could also be found in the balance sheets of all private banks as noted in the previous
subsection. However, in the case of Demirbank this type of behavior pushed to its limit. In
this sense, Demirbank could be taken as a prime example of commercial banks carrying large
government debt instruments portfolios. Demirbank was heavily concentrated in government
debt instruments business and acting as a market maker to defend its position.
The sharp differences between Demirbank and private banks are reported in Table 8.
Firstly, for Demirbank, the ratio of government debt instruments portfolio to total assets was
about twice the size of other private banks. Unlike other private banks, this bank was not
active in traditional banking business of collecting deposits and distributing loans. Secondly,
Demirbank was carrying its government debt instruments portfolio mainly through short-term
REPOs. The ratio of REPOs to total government debt instruments portfolio was around 70
percent both in year-ends of 1999 and 2000. While financing the government debt instruments
portfolio mainly by very short-term REPOs, the share of long-term government debt
instruments in total portfolio was also very high. Note further that this share jumped rather
sharply right just before the November 2000 crisis increasing the vulnerability of the bank to
an upward movement in interest rates.
[Table 9 about here]
Thirdly, Demirbank was carrying a large long term government debt instruments
portfolio by financing its activities through mostly over the night borrowing from other banks,
as indicated in Table 9 by the ratio of bank REPOs to total REPOs. Put it differently, the fact
that banks are more informed investors had made Demirbank more vulnerable. A potential cut
of credit lines would have jeopardized the viability of Demirbank. Indeed this was what
happened in November 2000.
Fourthly, the ratio of foreign exchange to lira liabilities was lower in the case of
Demirbank as most of its activities were financed by lira REPOs. However, the sharp increase
in this ratio at the beginning of 2000 and its sharp decline in the fourth quarter require further
elaboration. The rise in the long-term government debt instruments to total government debt
instruments ratio juxtaposed this development. This fact seems to be related to structured
financing products started to be used by the domestic banking system in general and by
Demirbank in particular. In the case of structured loans, government debt instruments were
used as collateral against foreign borrowing, which were accounted as long-term government
debt instruments in the balance sheets. With increasing financing difficulties, Demirbank
seems to resort to foreign exchange borrowing by using domestic currency denominated
government debt instruments as collateral. In the case of structured loan agreements, there is a
pre-specified stop-loss level of government debt instruments interest rates to start the
automatic sale of the collateral portfolio. This feature of structured loans was instrumental in
the massive sale wave in the debt market accompanied by a massive demand for foreign
exchange in November 2000 right after the financing difficulties of Demirbank. The latter
feature gave the crisis a systemic character. In the end, difficulties of a single mid-sized bank
turned into the crisis of the whole debt market and then the crisis of the whole domestic
banking system as government debt instruments portfolios were an important interest earning
asset in domestic bank balance sheets.
IV.4 Summing up: A third-generation crisis?
Based on the above discussion, we can conclude that the Turkish financial system,
which was dominated by banks, was vulnerable to a jump in both the exchange rate and
interest rate that a sudden capital reversal could cause. Moreover, this weakness sharply
increased in 2000.
The banking sector problem in Turkey was basically a result of the mechanism chosen
to finance very high public sector borrowing requirement. Firstly, this led to an increase in
government debt instruments especially in balance sheets of private banks. Secondly, it
caused a significant deterioration in state owned banks by accumulating duty losses. Risk
accumulation in bank balance sheets in order to carry the domestic debt stock is an important
element to understand crisis dynamics. When due to excessive risks accumulated in the
balance sheets, credit lines to some banks that were acting as market makers in the
government debt instruments market were cut off, the banking sector problem turned into a
debt rollover problem increasing interest rates. The rise in interest rates turned the problem
into a debt sustainability issue directly making rollover impossible. This happened despite the
continuing fiscal discipline policy under an IMF supported program.
Note that at the core of some variants of the third-generation crisis models there is the
vulnerability of financial system, for example Chang and Velasco.29 Despite similarities, the
Turkish crisis has some features that do not fit in the third-generation models. Most notable of
them is the high budget deficit, which is mainly financed by domestic debt. This feature
renders one of the prescriptions of the one variant of a third-generation model introduced by
Krugman useless.30 Krugman stresses the corporate sector balance-sheet implications of a
currency crisis and the model he presents suggests fiscal expansion as one of the remedies to
overcome high exchange rate-low output equilibrium of the post-crisis period. This is hardly a
solution in an economy where the main concern of the economic agents was the sustainability
of domestic public debt, as at least in the first ten months of 2001 in Turkey.
Burnside, Eichenbaum and Rebelo argue that a principal cause of the 1997 Asian
crisis was large prospective deficits associated with implicit bailout guarantees to failing
banking systems.31 Economic agents expect that these future deficits are going to be financed
by money creation, which leads to a collapse of the fixed exchange rate regimes. The Turkish
case has also some similarities with prospective deficits models.
Given the fragility in the banking sector in the period immediately preceding the
crisis, it is no surprise that the crisis triggering factors were closely related to the banking
sector and its mode of carrying government debt instruments portfolios. We now turn to this
issue.
V. TRIGGERING FACTORS AND THE CRISIS
In this section we look at the crisis igniting factors and the responses of commercial
banks to these factors. Most notably, we emphasize the role of these triggering factors in the
severe dichotomizations of the banking sector leading to credit line cuts. We stress that this
dichotomy was not materialized over the night; rather as shown above, there was already
enough risk accumulated in bank balance sheets. The igniting factors worked as a catalyst role
in bringing this dichotomy to a severe conclusion with credit line cuts as banks stop trading
with each other. Delays in structural reforms, especially the inability to design a transparent
and viable banking reform strategy at the outset and the unsystematic as well as the piecemeal
nature of the SDIF intervention to the “bad” bank problem exacerbated the problem.
V.1 Delay in structural reforms
Structural reforms constituted an important part of the stand-by agreement signed with
the IMF. These reforms were collected under six headings in the Letter of Intent: “pension
reform”, “reform in agriculture sector”, “tax policy and administration”, “fiscal management
and transparency”, “privatization and the capital market”, “strengthening the banking sector
and banking regulation”. Hence, the issue of banking reform was already considered in
principle right at the outset.
Main problems were in the last three areas. Under the “fiscal management and
transparency” heading, the government promised to close 61 budgetary funds to broaden the
effective coverage of the budget in 2000 whereas only 27 of these funds were closed. The
markets paid a special attention to the privatization of the telecom sector. The discussions on
this privatization began as early as 1990, several laws passed from the parliament since then
and rejected by the Supreme Court. The IMF insisted on passing a new law to enable Turk
Telecom to act as a private entity by making it subject to the Turkish commercial code and
establish a regulatory body for this sector. There were sharp differences of view between the
members of the government on this issue and as a result, the law was not drafted. Finally, the
Board of the Banking Regulation and Supervision Agency should be named by end-March
2000 in order to render it in full operation by the end of August. This task was accomplished
on the 31st of August, by a five-month delay increasing concerns on government intentions in
manipulating the board and causing a credibility loss.
In addition to delays in implementation, the lack of a political and administrative
leadership of the program also contributed to uncertainty. The details of the program could
not become public knowledge in a systematic manner. Regarding banking reform especially,
this lack of public knowledge had a detrimental impact contributing to severe dichotomy in
the banking system leading to credit line cuts. The announcement that there was a problem to
solve in the banking system, without any detailed and systematic program to show how the
authorities were thinking to deal with the problem and long periods of inaction exacerbated
the problem of heterogeneity in the banking sector leading to a halt.
V.2 Piecemeal program of the SDIF takeovers and a series of unending criminal
court cases
Just before the 2000-2003 program was put into action, six banks were taken over by
the SDIF, on November 30, 1999. This did not suffice to clear the banking system; two more
banks were taken over by the SDIF on September 30, 2000. Note that these last two takeovers
materialized only a month after the board of the Banking Regulation and Supervision Agency
was named. The last four months of 2000 was especially hard times for some of the bankers.
Since September 2000, police initiated a criminal investigation under a code name of
“thunder-storm” and started to arrest the owners and executives of five of these eight banks
(Table 10). News about the arrested bankers along with their video-films and photographs
were mushroomed in media. Such news appeared not only in the economy pages or programs
of the media but more so on the first pages and primetimes. The medias’ heavy concentration
on this operation intensified rumors about who was going to be the next. “Tunnelers” became
the nickname of the bankers. The idea behind the notion of “tunnelers” was the same as the
“tunneling” concept used by Johnson et al regarding newly privatized enterprises in post-
communist countries.32
All of these developments strengthened the idea that there was an immense problem in
the private banking industry and the program to tackle the issue was not completed yet. The
environment itself contributed to the uncertainty as to the future of the banking industry. It
also raised doubts about the possible costs that were going to be incurred very shortly.
Considering the cost of banking reform on the public purse and the use of government debt
instruments to recapitalize banks, concerns about future debt sustainability started to intensify
on the road to the crisis. Lastly, the environment also contributed severe polarization in the
banking system between allegedly “good” and allegedly “bad” banks.
[Table 10 about here]
V.3 Turbulence in November 2000
Given the fragility of the banking sector, this environment made life very difficult for
those banks that had desperately chosen to borrow in short-term maturity and lend to the
government in relatively longer terms along with state banks suffering from duty losses.
These banks that had been heavily dependent to over-night funds found themselves in a
position not to be able to do the “usual business”. Demirbank could not borrow in the over-
night market on the 20th of October. Not to exceed the IMF ceilings on net domestic assets,
the Central Bank did not lend to Demirbank. This forced Demirbank to sell part of its
government securities portfolio and stop acting as a market maker in the government debt
instrument market on the buying side causing an increase in secondary market interest rates.
This marked the beginning date of the first period in the crisis. The rise in interest rates to the
“stop-loss” levels in structured foreign exchange denominated loans started a new government
debt instrument sale wave. Consequently, demand for foreign currency increased sharply as
lira denominated government debt instruments was used as collateral for foreign exchange
borrowing. Due to this sale wave, secondary market interest rates increased further raising
doubts about debt sustainability and the stability of the exchange rate based stabilization
program.
We divide the first attack period into three phases: November 20-21, November 22-29,
and November 30-December 6. Note that the timing depends on the behavior of the Central
Bank. In the first phase the Central Bank did not lend to problematic banks, while in the
second one it did the opposite.33 Note the sharp difference in the evolution of net domestic
assets given in Table 11. Though the domestic credit expansion helped to prevent a skyrocket
movement in interest rates, at the same time, it increased the drain on international reserves.
Note further that the magnitude of depletion of official reserves was greater than the
magnitude of expansion in domestic credit creation, creating a reduction in base money.
Hence, the second phase witnessed a further rise in interest rates.
[Table 11 about here]
Mainly based on the drain in its international reserves and the reluctance of the
regulation and supervision agency to address the root of the problem, that is to takeover “bad”
banks from the system, on the 30th of November, the Central Bank announced that it was
going to keep its net domestic assets level constant. This marked the beginning of the third
phase of the first attack period. Consequently, on that day over-night rate jumped to 316
percent making the life harder for state-owned banks where, as discussed above, there was a
huge accumulated interest rate risk potential. The headline news of the next day was the
negotiation done with the IMF at the mid-night and the increased possibility of a new credit
line. This news withstanding the over-night rate jumped to 873 percent. Despite its
announcement, the Central Bank had to lend to a problematic bank to prevent its default on
the 4th of December. Two days later the problematic bank –Demirbank- was takenover and
the IMF made it clear that it was going to support the program by opening a new credit line.
The new Letter of Intent was made public on the 18th of December, and four days later the
Central Bank announced its new monetary program. Despite the former limits put on the
balance sheet of the Bank by the IMF was changed, the path of the rate of depreciation of
Turkish lira was not. Thanks to the agreement with the IMF, the reserve decline came to an
end, moreover, with the IMF's support facility, official reserves jumped to a level of 26 billion
dollars from a low of 18 billion dollars.34 These helped to calm down the markets.
V.4 Final burst: February 19, 2001
A new problem emerged in the aftermath of the November crisis: the inconsistency
between the level of interest rates and the pre-announced rate of depreciation of the Turkish
lira. This was related with questions regarding debt rollover capability of the Treasury, as the
major market maker of the government debt instruments was no more at the stage. While the
upper limit of the annual rate of depreciation of the lira against a basket of Euro and dollar
was announced to be 12 percent in 2001, throughout the auctions in January 2001, the
Treasury was not able to borrow below 57 percent in annual compounded terms. In the first
auction of February the interest rate increased to 70 percent. That was clearly an unsustainable
situation. Either the interest rate should have declined to a level compatible with the rate of
depreciation or the exchange rate regime should have collapsed.
[Table 12 about here]
On the 19th of February, after the National Security Council meeting, the prime
minister declared that there was a deep difference of opinion between him and the President.
He added that, that amounted to a very important political crisis. This announcement
skyrocketed the over-night rate to 2058 percent on the 20th of February, followed by 4019
percent on the next day (Table 12). On the date announcement was made, the banking sector
rushed to foreign currency. Since the US markets were closed at that specific date, the
banking sector foreign currency demand was not fully met by the Central Bank preventing it
from a loss of 7.5 billion dollars of reserves. However, the depletion of reserves in the next
two days and the levels of interest rates forced the Central Bank to accept the collapse of the
crawling peg system on the 23rd of January. By the announcement that the lira would be
going to freely float, the dollar exchange rate jumped to 958 thousand liras from a level of
685 thousand liras. The undersecretary of the Treasury and the governor of the Central Bank
resigned which followed by the replacement of the economy minister.
CONCLUSIONS
The last decade of 20th century witnessed two Turkish crises: 1994 and 2000-2001.
The effects of the second crisis were more severe than that of the first one. In this paper we
analyzed the reasons behind the latest crisis. Our main conclusion is that the root cause of the
crisis was the combination of a fragile banking sector and a set of triggering factors that made
this fragility crystal-clear.
Analyzing the data for 2000 in isolation, one would immediately observe the poor
macroeconomic performance. Public sector borrowing requirement, public debt to GNP ratio,
current account deficit, inflation level and liabilities of financial sector to official reserves
ratio were all high. Moreover the lira was appreciated in real terms. However, this would be a
mis-leading picture of the Turkish economy. Turkey started to implement an IMF supported
program just at the beginning of 2000. This program addressed to macroeconomic imbalances
and indeed succeeded to some extent in reversing this negative trend. Relative to 1999, there
was a sharp decline both in the inflation and real interest rates and a significant increase in
primary surplus. Consequently, debt to GNP ratio and public sector borrowing requirement
decreased.
It is true that rising current account deficit and real appreciation of lira was a source of
increasing concerns. However, an important part of the current account deficit was due to an
external shock -rising oil prices, and there was a built-in exit strategy from the crawling-peg
system, which was the main factor behind appreciation. Moreover, the program envisaged a
further fiscal tightening for 2001 that would have been one of the remedies to current account
problem.
We argue that without a fragile banking system and triggering factors, high current
account deficit and real appreciation of the lira would not be enough to precipitate the 2000-
2001 crisis. We provide a plenty of evidence regarding the risk accumulation in the banking
system in the period preceding the crisis: increase in currency and maturity mis-matches and a
rise in non-performing loans. Hence, the banking system was highly vulnerable to capital
reversals. However, risk accumulation was not homogenous throughout the system. There
were two different types of dichotomization: Private versus state banks and within the private
banks. While the state banks were more open to interest rate risk, private ones were more
prone to exchange rate risk. Within the private banking system there were some mid-sized
banks that were heavily concentrated in government debt instruments business. Moreover,
they were carrying these instruments by borrowing extremely short-term.
Given the weakness in the banking system, it is no surprise that the crisis triggering
factors were closely related to the banking sector and its mode of carrying government debt
instruments portfolios. Main igniting factors were the delays in reforming the banking sector
and the actions that caused the dichotomy in the banking sector to come to the surface. This
environment made life extremely difficult for those banks that had desperately chosen to
borrow in short-term maturity and lend to the government in relatively longer terms along
with state banks suffering from duty losses. These banks that had been heavily dependent to
over-night funds found themselves in a position not to be able to do the “usual business”.
Finally, we should note that the root cause of the fragility of the banking system was
high public sector borrowing requirement and the way it was financed. Note that especially
starting from early the 1990s, there was no close link between rising deficits and inflation.
The main reason was that budget deficits were mainly financed through government
securities. However, the sustainability of this financing mechanism was conditional on the
continuation of demand for government securities. In the absence of a program that reduces
borrowing requirement, a halt in demand would force authorities to monetize and hence cause
a jump both in the exchange rate and inflation rate. This led economic policy makers to do
their best to prevent a decline in demand for government securities. Both the upward trend in
government debt instruments portfolios of the banks and such policies increased the
vulnerability of the banking system. In future work we intend to study the role of monetary
policy in risk accumulation in the period preceding the crisis.
APPENDIX: THE POST-CRISIS PERIOD
The 2000-2001 crisis severely hit both the banking system and the corporate sector.
The immediate re-capitalization needs of the state-owned banks and the banks taken-over by
the SDIF has led to a jump in the domestic debt stock which was already too high.
Meanwhile, rapid depreciation of the exchange rate had the potential of starting a new
inflationary process. In addition to these, policy makers lost their credibility. The
undersecretary of the Treasury and the Central Bank governor resigned. To overcome these
problems, Turkey announced a new IMF supported program on May 2001. The new program
had three pillars: Fiscal and monetary discipline, structural reforms, and an important amount
of external financial support.
Based on the measures taken, economic fundamentals have continuously improved.
However, up to October 2001, reaction of the markets was not in line with fundamentals. The
situation was reversed in the October 2001 – May 2002 period. The nominal exchange rate,
the inflation rate, the interest rate and the spreads of the Turkish Eurobonds all followed a
significant downward trend. With the surge in political uncertainty which was perceived by
market participants as policy uncertainty at the beginning of May 2002, this positive stance
began to change (Table A1).
The key to understand these contrasting phenomena is the high domestic public debt
to GDP ratio and the issue of its sustainability. The imposed fiscal and monetary discipline of
the program and the accompanying structural reforms notwithstanding, reducing the debt to
GDP ratio to manageable levels requires considerable time period. In the interim period, such
an economy is vulnerable to changes in the market sentiment that increases concerns about
the debt sustainability. Such a high level of debt raises the possibility of multiple equilibria.
Given the macroeconomic fundamentals, the type of equilibrium in which the economy is in
or approaching to is mainly determined by expectations.35 Negative expectations can yield an
economy to a “bad” equilibrium, at which the inflation, interest, and exchange rates are all
high, whereas positive expectations will yield to a “good” one. Based on this possibility, one
should look at both fundamentals and expectations.
Decoupling of Fundamentals and Expectations: May 2001 – October 2001
Right after the twin crises, Turkey had taken key structural reform measures, a few of
which were as follows: “Bad” banks were taken over by the SDIF and left out of the banking
ssytem. The overnight borrowing of these banks was significantly reduced and they were re-
capitalized and merged. Some had actually been sold. There was a dramatic change in the
governance structure of state owned banks. Accumulated debts of the Treasury to these banks
were paid and they were recapitalized. A politically independent board of directors was
appointed and their mandate was specified as protecting the interests of depositors. A new
management for these banks was appointed. The number of branches and employees were
significantly being reduced according to an operational restructuring plan. On May 2001, the
Central Bank law was changed and the Bank gained “tool independence”. The law explicitly
stated that the main goal of the Bank is price stability. In addition to structural reforms both
the fiscal and monetary policies remained on track.
However, excluding a few weeks before the tragic 11th of September up to mid
October, expectations were not in line with the improvement in fundamentals. The interest
rate stayed at a high level. The exchange rate followed an upward movement. The spread of
the Turkish Treasury bond stayed at high levels (Table A1). That is, the Turkish economy was
at the “bad” equilibrium. Why?
There were at least four reasons hampering gains in policy credibility: First, some
political developments, i.e., disputes among the coalition parties regarding some of the
structural reforms increased doubts about the continuation of the program and raised the
tensions in the market. Second, as documented in the text, the financial sector had an
important amount of open foreign exchange position before the crisis, i.e, the adverse impact
of the crisis on the balance sheets of “sound” banks was actually felt. Third, there were
external shocks, namely the potential of negative developments in Argentina was thought to
have a contagion effect for Turkey. Fourth, the exchange rate regime was radically altered and
economic agents were not familiar with a floating exchange rate regime environment.
These developments led to negative expectations as the sustainability of public debt
was continuously questioned. There was a vicious circle: Despite strong macroeconomic
fundamentals, negative expectations were pushing the economy to a bad equilibrium, and that
bad equilibrium, in turn, was validating negative expectations. In early August, the exchange
rate volatility has started to decline as a positive sign for gains in policy credibility. However,
the tragic September 11 event has reversed the market sentiment. In just a few days time, the
interest rates increased by some 15 percentage points and the Turkish Lira depreciated by an
important amount. Once again, the sustainability of the program began to be questioned.
Changing Market Sentiment: October 2001 – May 2002
This worsening trend came to a halt as it became evident that Turkey was going to
further strengthen the ongoing program by additional structural-fiscal measures and a banking
sector recapitalization program aiming quick recovery of “sound” banks. In addition to these,
there was the additional credit line from the IMF. The government announced its primary
surplus target for 2002 as 6.5 percent of GDP. This announcement was found credible, since it
became evident that the ambitious primary budget surplus target of 6.5 percent of GNP for
2001 was going to be met. In addition, the developments in the balance sheet of the Central
Bank were in line with the constraints agreed by the IMF. One should also add to these
positive developments the fact that the political disputes among the coalition parties were
finally out of the stage. The other contributing factors were as follows: First, the fundamental
differences such as the exchange rate regimes and the fiscal policies between the Argentine
and Turkish economies became more apparent. Second, it was understood that the Turkish
economy was going to register an important amount of current account surplus. Third, banks
started to partially rollover their foreign credits. Fourth, the economic agents began to get
used to the mechanics of the floating exchange rate regime and, since the beginning of
August, the Central Bank intervention to foreign exchange market had been almost nil. Fifth,
the structural reforms in the public sector were continued. Sixth, to finalize the restructuring
of the financial sector, on February 2002 a re-capitalization law passed and on May 2002, all
capital deficient private banks presented their detailed capital strengthening plans to the
Banking Regulation and Supervision Agency. Seventh, at the beginning of 2002, a debt
management law that was designed like a fiscal responsibility act was enacted by the
Parliament. All these measures made the markets understand that disinflation objective was
maintained by the authorities.
Consequently, the nominal exchange rate had almost followed a continuously
declining trend from mid-October up to the beginning of May 2002. A similar phenomenon
was also observed in the interest rates. Nominal appreciation of the Turkish Lira and the
declining trend of interest rates were both results of policy credibility achieved at the end. On
March 2002, for the first time since the burst of the crisis, the industrial production index
showed a positive development. This positive growth stance continued on April and May
indicating that significant output recovery process was underway. Inflation that was 68
percent at the end of 2001 started to decline and reached a level of 43 percent in annualized
terms in June. Moreover, the gap between the inflationary expectations and the year-end
target for 2002 continuously narrowed also indicating a build-up of confidence and policy
credibility. A similar phenomenon was also observed in the Turkish Treasury Eurobond
spreads (Table A1).
Political uncertainty-Policy uncertainty
Starting from the beginning of May, two negative developments occurred in the
political arena. First, the prime minister was hospitalized and there were widespread rumors
about his health. This was considered as lethal to political stability as it led to the possibility
of a probable meltdown in his party – the greatest party of the three-party coalition
government. Second, discussions about the necessary steps that should be taken to meet the
Copenhagen criteria that would start the negotiation process for the possible European Union
accession process started to undermine the unity of the coalition government. The resulting
political uncertainty led to an environment of policy uncertainty. Although there was no
change in the fiscal and monetary policy stance, as of the beginning of May 2002, interest
rate, exchange rate, and Treasury spreads once again started to deteriorate showing the
importance and the fragility of market expectations once again.
REFERENCES
Akyüz, Y. and K. Boratav (2001), “The Making of the Turkish Financial Crisis”, paperprepared for a conference on “Financialization of the Golabal Economy”, PERI,University of Massachusetts, December 7-9, 2001, Amherst, Mass.
Alper, C. E. (2001), “The Turkish Liquidity Crisis of 2000: What Went Wrong?”, Russianand East European Finance and Trade, 37(6), 51-71.
Burnside, C., Eichenbaum, M. and S. Rebelo (2001), “Prospective Deficits and the AsianCurrency Crisis”, Journal of Political Economy, 109(6), 1155-1197.
Calvo, G. A. (1988), “Servicing the Public Debt: The Role of Expectations”, The AmericanEconomic Review, 78(4), 647-661.
Calvo, G. A. (1994), “Comments on Dornbusch and Werner”, Brookings Papers on EconomicActivity, 1, 298-300.
Calvo, G. A. and C. A. Végh (1999), “Inflation Stabilization and BOP Crises in DevelopingCountries”, in Handbook of Macroeconomics, Vol. 1C, J. B. Taylor and M. Woodford(eds), North-Holland.
Chang, R. and A. Velasco (1998a), “The Asian Liquidity Crisis”, Federal Reserve Bank ofAtlanta Working Paper No. 98-11.
Chang, R. and A. Velasco (1998b), “Financial Crisis in Emerging Markets: A CanonicalModel”, Federal Reserve Bank of Atlanta Working Paper No. 98-10.
Eichengreen, B. (2001), “Crisis Prevention and Management: Any New Lessons fromArgentina and Turkey?”, Background Paper for the World Bank’s GlobalDevelopment Finance 2002.
Eichengreen, B., Rose, A. K. and C. Wyplosz (1995), “Exchange Market Mayhem: TheAntecedents and Aftermath of Speculative Attacks”, Economic Policy, 21, 251-312.
Flood, R. P. and P. M. Garber (1984), “Collapsing Exchange Rate Regimes: Some LinearExamples”, Journal of International Economics, 17, 1-13.
Flood, R. P. and N. P. Marion (2000), “Self-fulfilling Risk Predictions: An application toSpeculative Attacks”, Journal of International Economics, 50, 245-268.
Frankel, J. A. and A. K. Rose (1996), “Currency Crashes in Emerging Markets: An EmpiricalTreatment”, Journal of International Economics, 41, 351-366.
Goldfajn, I. and R. Rigobon (2000), “Hard Currency and Financial Development”, WorkingPaper No. 438, PUC-Rio.
Johnson, S., Porta, L. P., Lopez-De-Silanes, F. and A. Shleifer (2000) “Tunneling” AmericanEconomic Review, Papers and Proceedings, 90, 22-27.
Krugman, P. (1979), “A Model of Balance-of-Payments Crises”, Journal of Money, Credit,and Banking, 11, 311-325.
Krugman, P. (1999a), “Balance Sheets, the Transfer Problem, and Financial Crises”, in P.Isard, A. Razin, and A. Rose, eds., International Finance and Financial Crisis,Kluwer.
Krugman, P. (1999b), “Analytical Afterthoughts on the Asian Crisis”, mimeo.
Özatay, F. (2000), “The 1994 Currency Crisis in Turkey”, Journal of Policy Reform, 3(4),327-352.
Sachs, J., Tornell, A. and A. Velasco (1996a), “Financial Crisis in Emerging Markets: TheLessons from 1995”, Brookings Papers on Economic Activity, 147-215.
Sachs, J., Tornell, A. and A. Velasco (1996b), “The Collapse of the Mexican Peso: WhatHave We Learned?”, Economic Policy, 22, 15-63.
Sachs, J., Tornell, A. and A. Velasco (1996c), “The Mexican Peso Crisis: Sudden Death orDeath Foretold?”, Journal of International Economics, 41, 265-283.
ENDNOTES
1 The views expressed in this paper are the authors’ and do not necessarily represent those of the Central Bank of
the Republic of Turkey. We are grateful to Erdal Özmen, and Peter Garber and Atish Ghosh, the paper’s
discussants, participants of the Brookings Trade Forum 2002, and an anonymous referee for helpful comments
for an earlier version of this paper. The usual disclaimer applies. The paper focuses on the 1995 – February 2001
period. In an appendix we also briefly discuss the developments in the post-crisis period, that is March 2001 -
July 2002 period.
2 Özatay (2000) analyzes the 1994 crisis. He argues that despite weak fundamentals of the period preceding the
crisis, in the absence of policy 'mistakes' that played a role of series of shocks in the second half of 1993, the
financial crisis could have been avoided.
3 Akyüz and Boratav (2001).
4 Alper (2001).
5 Eichengreen, Rose and Wyplozs (1995) and Sachs, Tornell, and Velasco (1996a).
6 Krugman (1979) and Flood and Garber (1984).
7 Consolidated budget is a part of the public sector. In addition to the consolidated budget public sector covers
state economic enterprises, special funds and municipalities. Note that consolidated budget deficits accounted for
an important part of the public sector deficits since the early 1980s.
8 For the evolution of daily international reserves see also Table 9.
9 Eichgreen, Rose, and Wyplozs (1995).
10 Frankel and Rose (1996).
11 Sachs, Tornell and Velasco (1996b).
12 Sachs et. al. (1996a).
13 Eichengreen et. al. (1995).
14 Sachs, Tornell and Velasco (1996c) and Frankel and Rose (1996).
15 Note however that there are some skeptical views on this exit strategy. For a discussion of the role of the exit
strategy in the crisis, see the summary of the comments and the discussion in the meeting on “NBER Program on
Exchange Rate Crises in Emerging Markets: Turkey” that was held on July 18, 2001. It can be downloaded from
(www.nber.org/crisis/turkey_report.html).
16 Calvo and Végh (1999).
17 Sachs, Tornell and Velasco (1996a) and Frankel and Rose (1996).
18 Krugman (2001, pp.6-7).
19 Flood and Marion (2000).
20 Sachs, Tornell and Velasco (1996b).
21 REPOs are widely used in Turkey by commercial banks as a retail instrument for government debt instruments
portfolios. Average maturity of REPOs is rather short, less than a month, and their importance in the liability
structure of banks is discussed below.
22 Sachs et. al. (1996b).
23 Calvo (1994).
24 Chang and Velasco (1998a).
25 Banks taken over by the SDIF are listed in Table 10.
26 Goldfajn (2000).
27 With the growing government debt instruments outstanding and the increasing financing needs of the
Treasury, after 1992, some activities were financed by the government through loans taken from state banks.
Instead of repaying the principal and the interest accrued, the Treasury allowed a non-performing loan to be
treated as a performing loan by the state banks. Note that the Treasury was directly controlling these banks since
they were state economic enterprises. Note further that the Treasury, at that period, was also the banking
supervision authority. This conflict of interest might have been one of the most important factors that led to duty
loss accumulation. See also Table 3, for the importance of duty losses relative to other fiscal indicators.
28 Eichengreen (2001, fn:8).
29 Chang and Velasco (1998b).
30 Krugman (1999a and b).
31 Burnside, Eichenbaum and Rebelo (2001).
32 Johnson et al (2000).
33 This asymmetric behavior was a matter of controversy. Note that in the first phase, the problem was mainly
the problem of Demirbank. To our viewpoint, the reason behind such a policy was that injection of liquidity
would be a fruitless attempt given the non-viability of the bank. Moreover, one of the main pillars of the program
was the pre-announced crawling-peg exchange rate regime. Such a move would have exacerbated the attack. The
correct policy should have been to takeover the Demirbank immediately. However, as discussed above, taking
over was materialized as late as 6th of December. Hence, the difficulties of Demirbank turned to a systemic crisis
and the Central Bank had to change its behavior.

34 See Figure 4.
35 See, for example Calvo (1988).
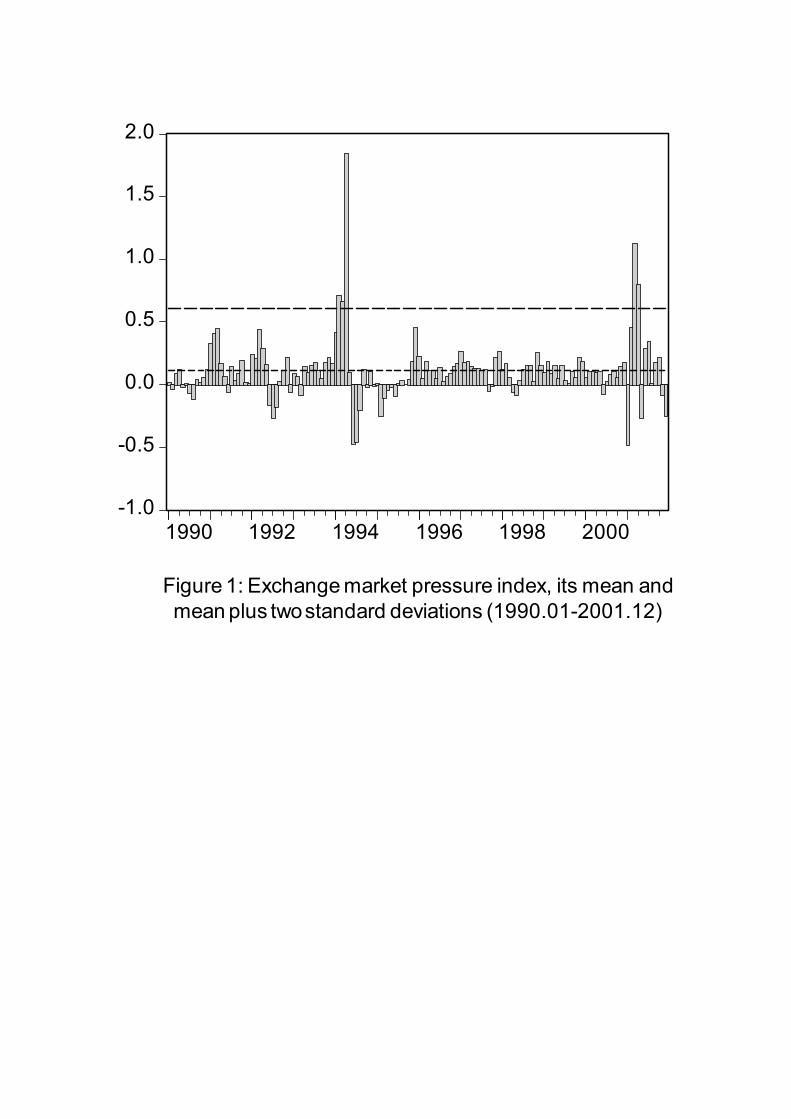
-1.0
-0.5
0.0
0.5
1.0
1.5
2.0
1990 1992 1994 1996 1998 2000
Figure 1: Exchange market pressure index, its mean andmean plus two standard deviations (1990.01-2001.12)
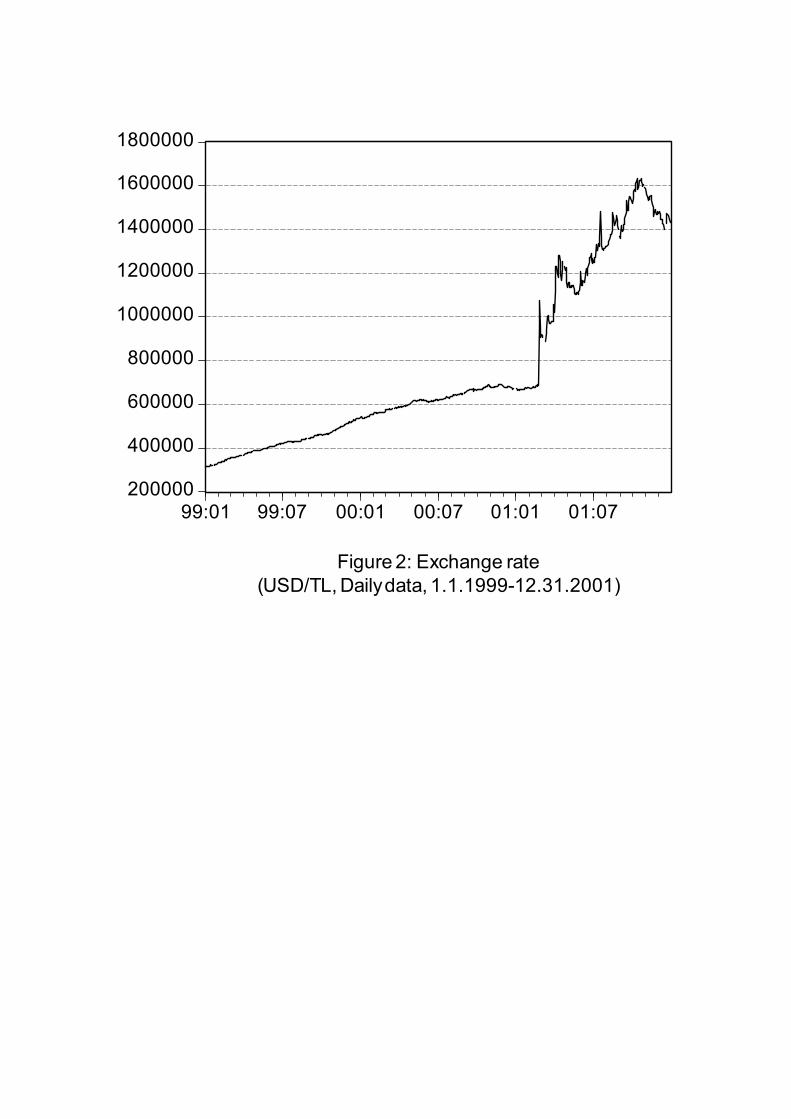
200000
400000
600000
800000
1000000
1200000
1400000
1600000
1800000
99:01 99:07 00:01 00:07 01:01 01:07
Figure 2: Exchange rate(USD/TL, Daily data, 1.1.1999-12.31.2001)
10
100
1000
10000
99:01 99:07 00:01 00:07 01:01 01:07
Figure 3: Over-night rate(Logarithmic scale, uncompounded %, daily data, 1.1.1991-12.31.2001)
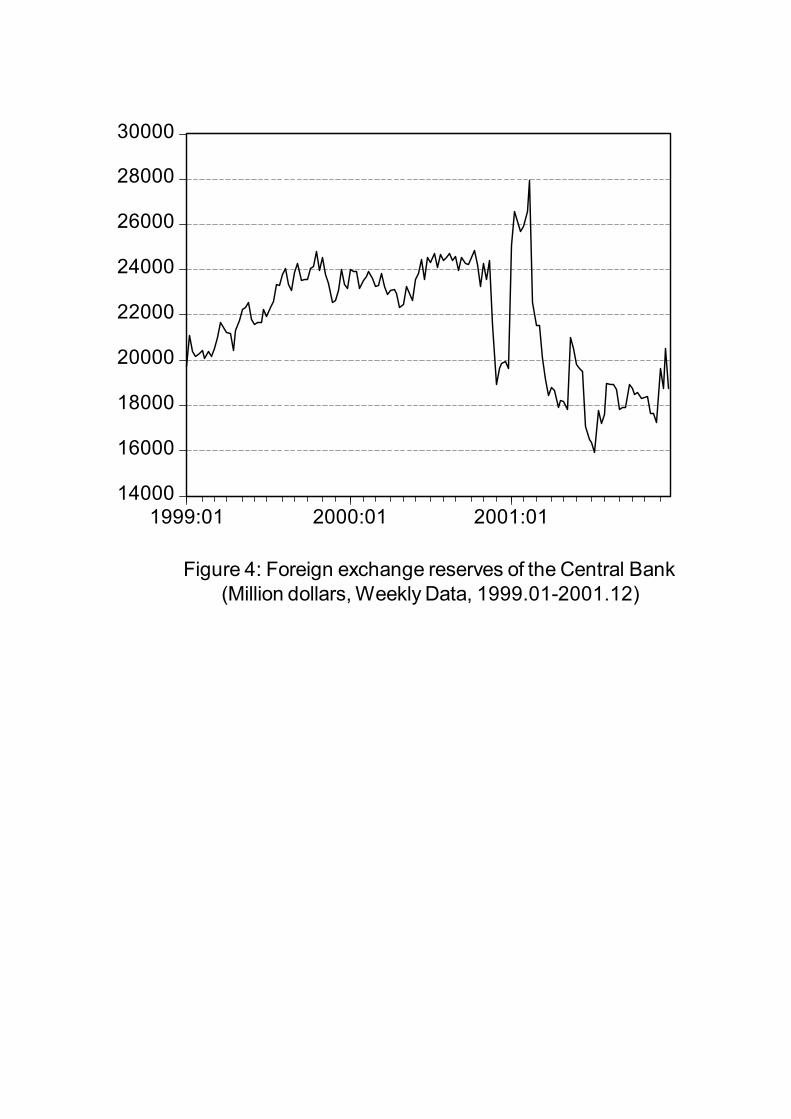
14000
16000
18000
20000
22000
24000
26000
28000
30000
1999:01 2000:01 2001:01
Figure 4: Foreign exchange reserves of the Central Bank (Million dollars, Weekly Data, 1999.01-2001.12)
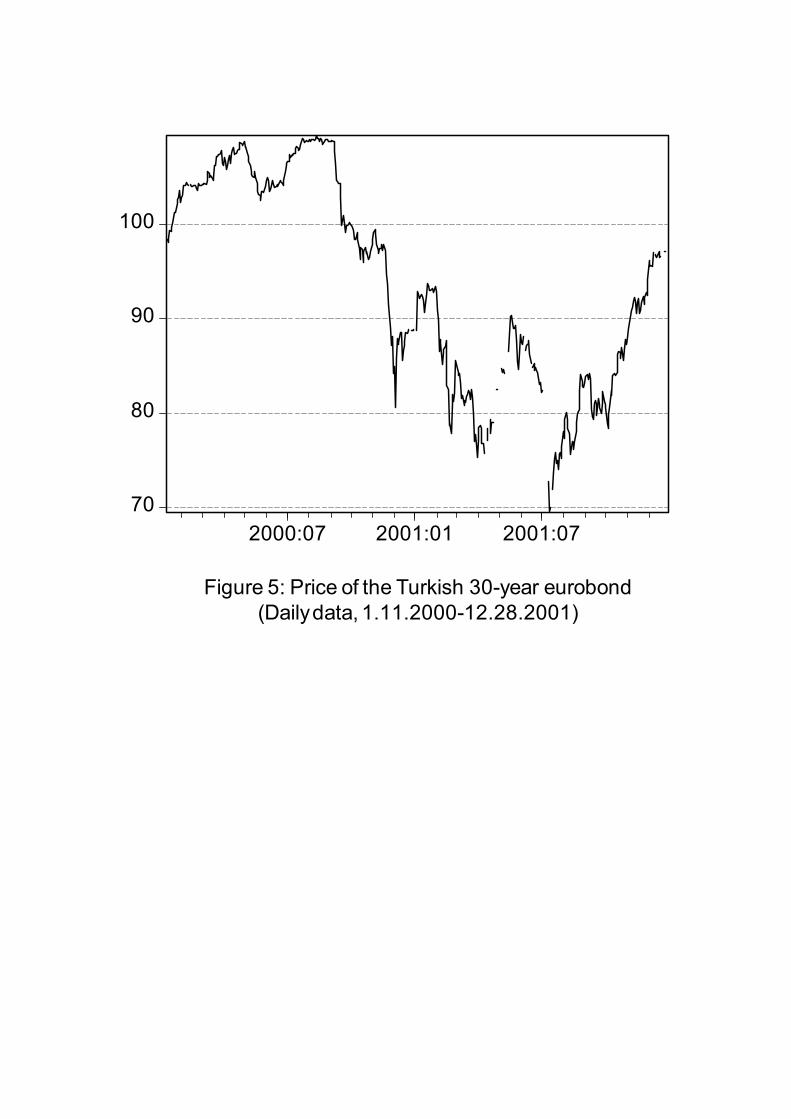
70
80
90
100
2000:07 2001:01 2001:07
Figure 5: Price of the Turkish 30-year eurobond(Daily data, 1.11.2000-12.28.2001)
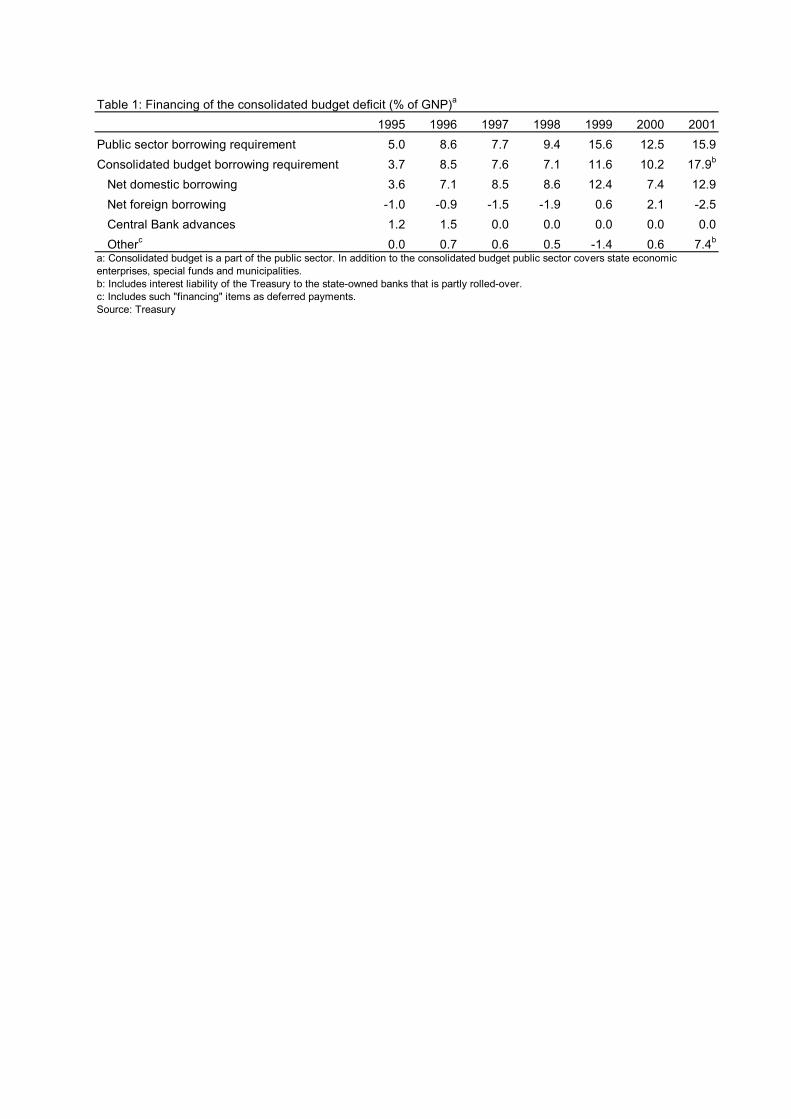
Table 1: Financing of the consolidated budget deficit (% of GNP)a
1995 1996 1997 1998 1999 2000 2001Public sector borrowing requirement 5.0 8.6 7.7 9.4 15.6 12.5 15.9Consolidated budget borrowing requirement 3.7 8.5 7.6 7.1 11.6 10.2 17.9b
Net domestic borrowing 3.6 7.1 8.5 8.6 12.4 7.4 12.9 Net foreign borrowing -1.0 -0.9 -1.5 -1.9 0.6 2.1 -2.5 Central Bank advances 1.2 1.5 0.0 0.0 0.0 0.0 0.0 Otherc 0.0 0.7 0.6 0.5 -1.4 0.6 7.4b
a: Consolidated budget is a part of the public sector. In addition to the consolidated budget public sector covers state economic enterprises, special funds and municipalities.b: Includes interest liability of the Treasury to the state-owned banks that is partly rolled-over. c: Includes such "financing" items as deferred payments.Source: Treasury
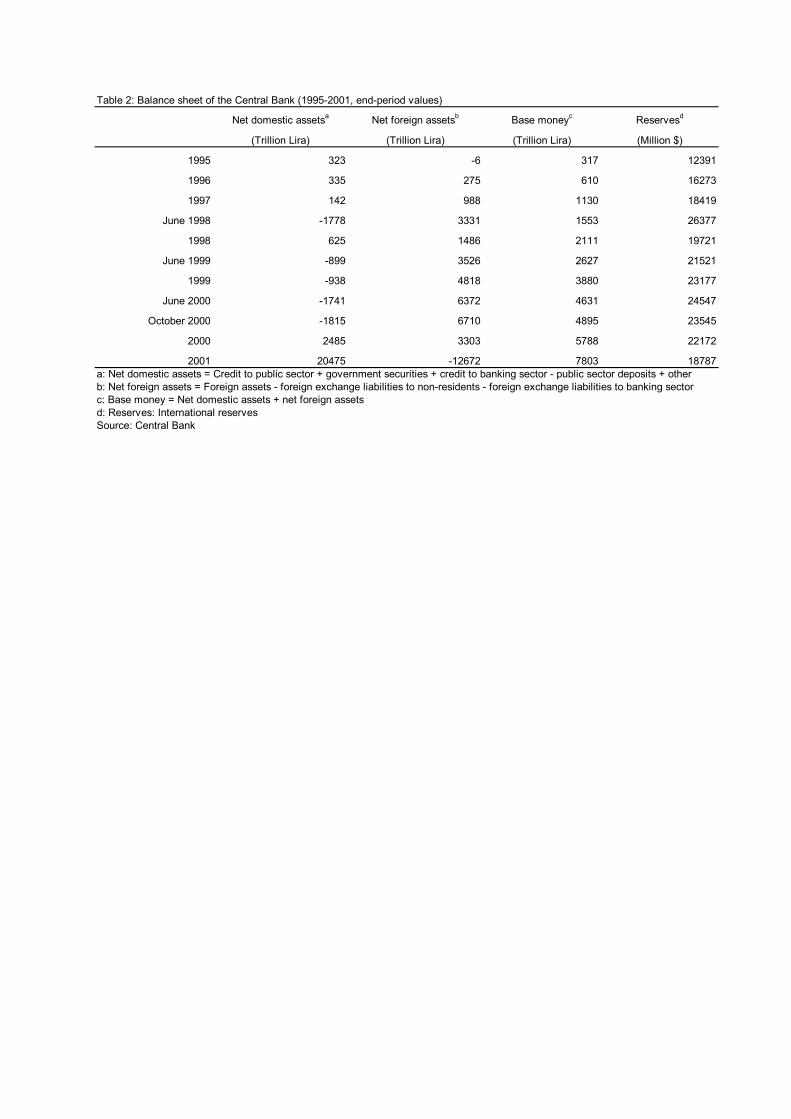
Table 2: Balance sheet of the Central Bank (1995-2001, end-period values)
Net domestic assetsa Net foreign assetsb Base moneyc Reservesd
(Trillion Lira) (Trillion Lira) (Trillion Lira) (Million $)
1995 323 -6 317 12391
1996 335 275 610 16273
1997 142 988 1130 18419
June 1998 -1778 3331 1553 26377
1998 625 1486 2111 19721
June 1999 -899 3526 2627 21521
1999 -938 4818 3880 23177
June 2000 -1741 6372 4631 24547
October 2000 -1815 6710 4895 23545
2000 2485 3303 5788 22172
2001 20475 -12672 7803 18787a: Net domestic assets = Credit to public sector + government securities + credit to banking sector - public sector deposits + otherb: Net foreign assets = Foreign assets - foreign exchange liabilities to non-residents - foreign exchange liabilities to banking sectorc: Base money = Net domestic assets + net foreign assetsd: Reserves: International reservesSource: Central Bank
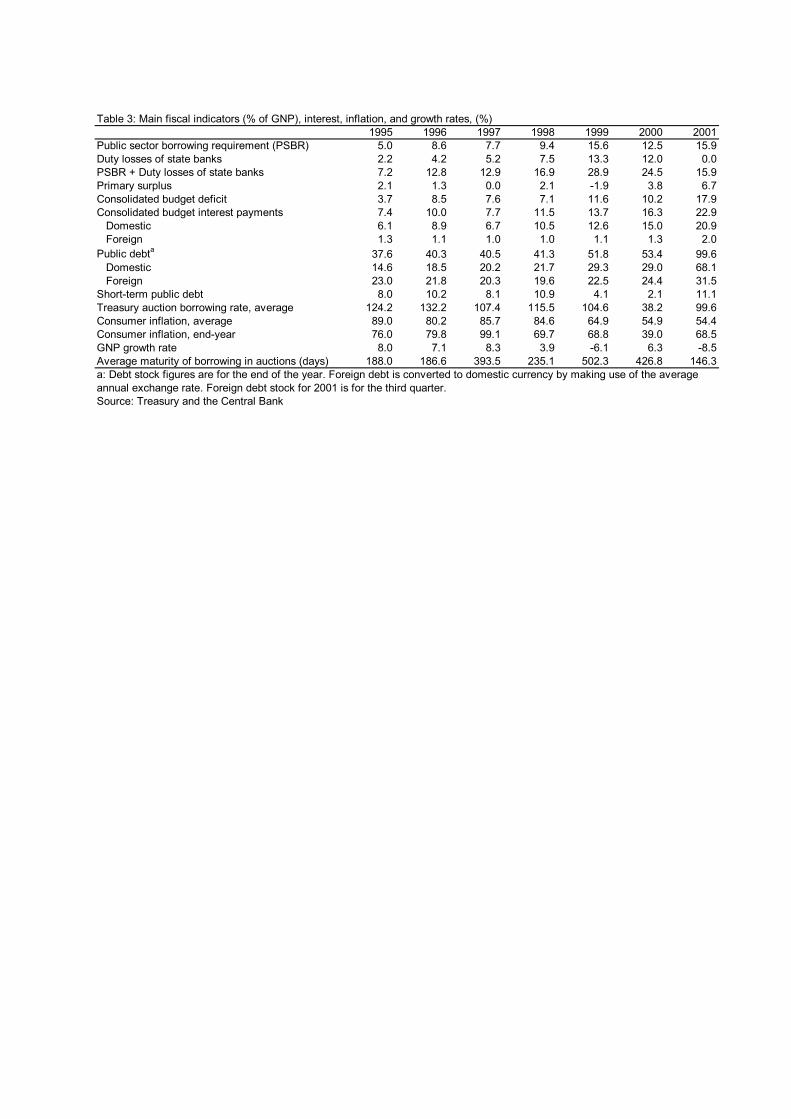
Table 3: Main fiscal indicators (% of GNP), interest, inflation, and growth rates, (%)1995 1996 1997 1998 1999 2000 2001
Public sector borrowing requirement (PSBR) 5.0 8.6 7.7 9.4 15.6 12.5 15.9Duty losses of state banks 2.2 4.2 5.2 7.5 13.3 12.0 0.0PSBR + Duty losses of state banks 7.2 12.8 12.9 16.9 28.9 24.5 15.9Primary surplus 2.1 1.3 0.0 2.1 -1.9 3.8 6.7Consolidated budget deficit 3.7 8.5 7.6 7.1 11.6 10.2 17.9Consolidated budget interest payments 7.4 10.0 7.7 11.5 13.7 16.3 22.9 Domestic 6.1 8.9 6.7 10.5 12.6 15.0 20.9 Foreign 1.3 1.1 1.0 1.0 1.1 1.3 2.0Public debta 37.6 40.3 40.5 41.3 51.8 53.4 99.6 Domestic 14.6 18.5 20.2 21.7 29.3 29.0 68.1 Foreign 23.0 21.8 20.3 19.6 22.5 24.4 31.5Short-term public debt 8.0 10.2 8.1 10.9 4.1 2.1 11.1Treasury auction borrowing rate, average 124.2 132.2 107.4 115.5 104.6 38.2 99.6Consumer inflation, average 89.0 80.2 85.7 84.6 64.9 54.9 54.4Consumer inflation, end-year 76.0 79.8 99.1 69.7 68.8 39.0 68.5GNP growth rate 8.0 7.1 8.3 3.9 -6.1 6.3 -8.5Average maturity of borrowing in auctions (days) 188.0 186.6 393.5 235.1 502.3 426.8 146.3a: Debt stock figures are for the end of the year. Foreign debt is converted to domestic currency by making use of the average annual exchange rate. Foreign debt stock for 2001 is for the third quarter.Source: Treasury and the Central Bank
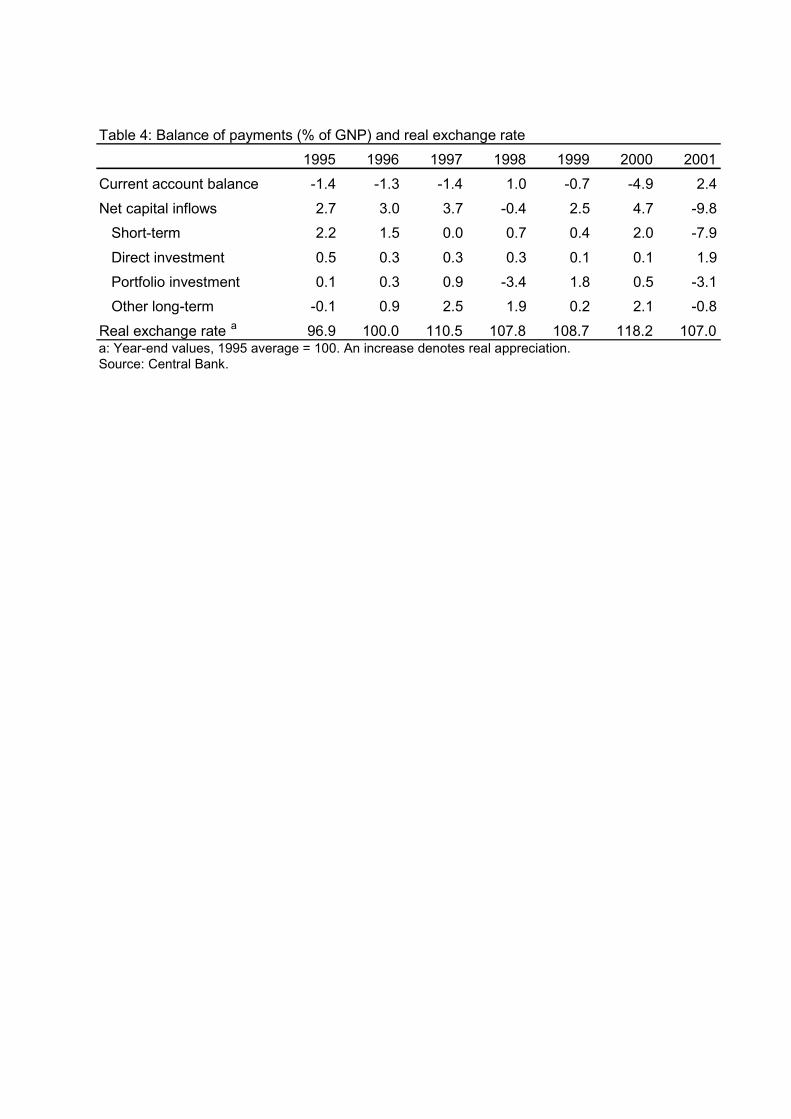
Table 4: Balance of payments (% of GNP) and real exchange rate1995 1996 1997 1998 1999 2000 2001
Current account balance -1.4 -1.3 -1.4 1.0 -0.7 -4.9 2.4Net capital inflows 2.7 3.0 3.7 -0.4 2.5 4.7 -9.8 Short-term 2.2 1.5 0.0 0.7 0.4 2.0 -7.9 Direct investment 0.5 0.3 0.3 0.3 0.1 0.1 1.9 Portfolio investment 0.1 0.3 0.9 -3.4 1.8 0.5 -3.1 Other long-term -0.1 0.9 2.5 1.9 0.2 2.1 -0.8Real exchange rate a 96.9 100.0 110.5 107.8 108.7 118.2 107.0a: Year-end values, 1995 average = 100. An increase denotes real appreciation.Source: Central Bank.
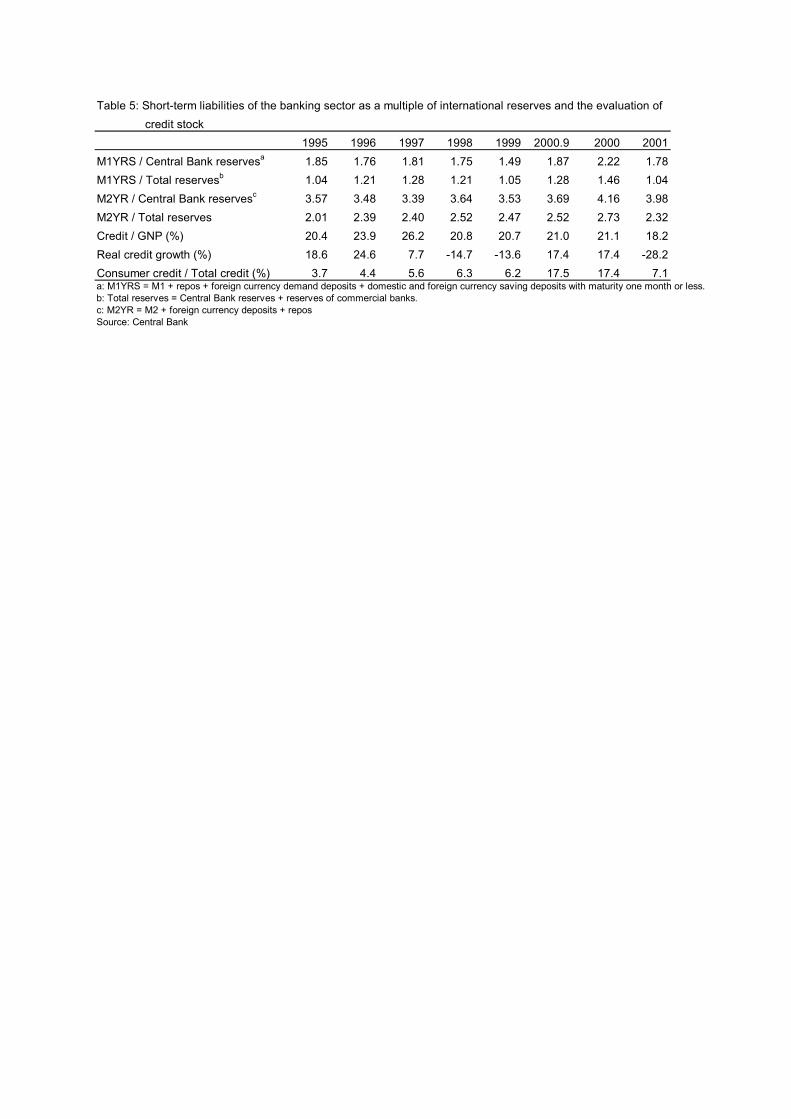
Table 5: Short-term liabilities of the banking sector as a multiple of international reserves and the evaluation of credit stock
1995 1996 1997 1998 1999 2000.9 2000 2001M1YRS / Central Bank reservesa 1.85 1.76 1.81 1.75 1.49 1.87 2.22 1.78M1YRS / Total reservesb 1.04 1.21 1.28 1.21 1.05 1.28 1.46 1.04M2YR / Central Bank reservesc 3.57 3.48 3.39 3.64 3.53 3.69 4.16 3.98M2YR / Total reserves 2.01 2.39 2.40 2.52 2.47 2.52 2.73 2.32Credit / GNP (%) 20.4 23.9 26.2 20.8 20.7 21.0 21.1 18.2Real credit growth (%) 18.6 24.6 7.7 -14.7 -13.6 17.4 17.4 -28.2Consumer credit / Total credit (%) 3.7 4.4 5.6 6.3 6.2 17.5 17.4 7.1a: M1YRS = M1 + repos + foreign currency demand deposits + domestic and foreign currency saving deposits with maturity one month or less.b: Total reserves = Central Bank reserves + reserves of commercial banks.c: M2YR = M2 + foreign currency deposits + reposSource: Central Bank
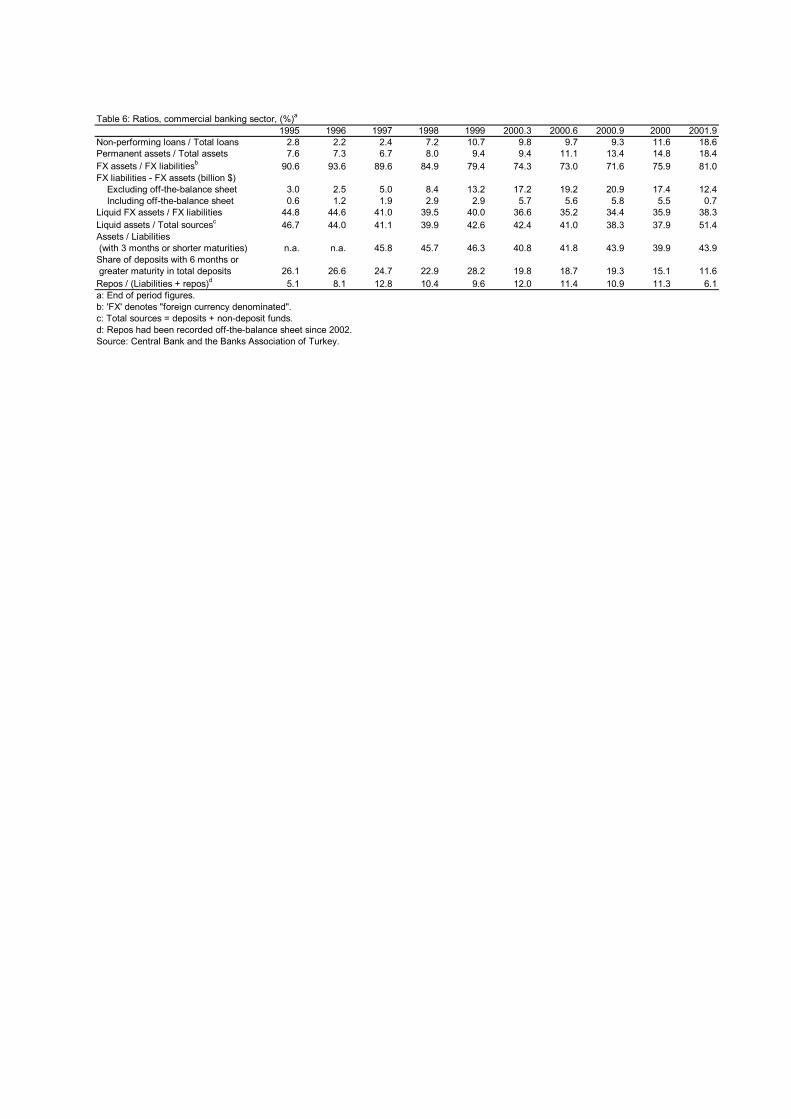
Table 6: Ratios, commercial banking sector, (%)a
1995 1996 1997 1998 1999 2000.3 2000.6 2000.9 2000 2001.9Non-performing loans / Total loans 2.8 2.2 2.4 7.2 10.7 9.8 9.7 9.3 11.6 18.6Permanent assets / Total assets 7.6 7.3 6.7 8.0 9.4 9.4 11.1 13.4 14.8 18.4FX assets / FX liabilitiesb 90.6 93.6 89.6 84.9 79.4 74.3 73.0 71.6 75.9 81.0FX liabilities - FX assets (billion $) Excluding off-the-balance sheet 3.0 2.5 5.0 8.4 13.2 17.2 19.2 20.9 17.4 12.4 Including off-the-balance sheet 0.6 1.2 1.9 2.9 2.9 5.7 5.6 5.8 5.5 0.7Liquid FX assets / FX liabilities 44.8 44.6 41.0 39.5 40.0 36.6 35.2 34.4 35.9 38.3Liquid assets / Total sourcesc 46.7 44.0 41.1 39.9 42.6 42.4 41.0 38.3 37.9 51.4Assets / Liabilities (with 3 months or shorter maturities) n.a. n.a. 45.8 45.7 46.3 40.8 41.8 43.9 39.9 43.9Share of deposits with 6 months or greater maturity in total deposits 26.1 26.6 24.7 22.9 28.2 19.8 18.7 19.3 15.1 11.6Repos / (Liabilities + repos)d 5.1 8.1 12.8 10.4 9.6 12.0 11.4 10.9 11.3 6.1a: End of period figures.b: 'FX' denotes "foreign currency denominated". c: Total sources = deposits + non-deposit funds.d: Repos had been recorded off-the-balance sheet since 2002.Source: Central Bank and the Banks Association of Turkey.
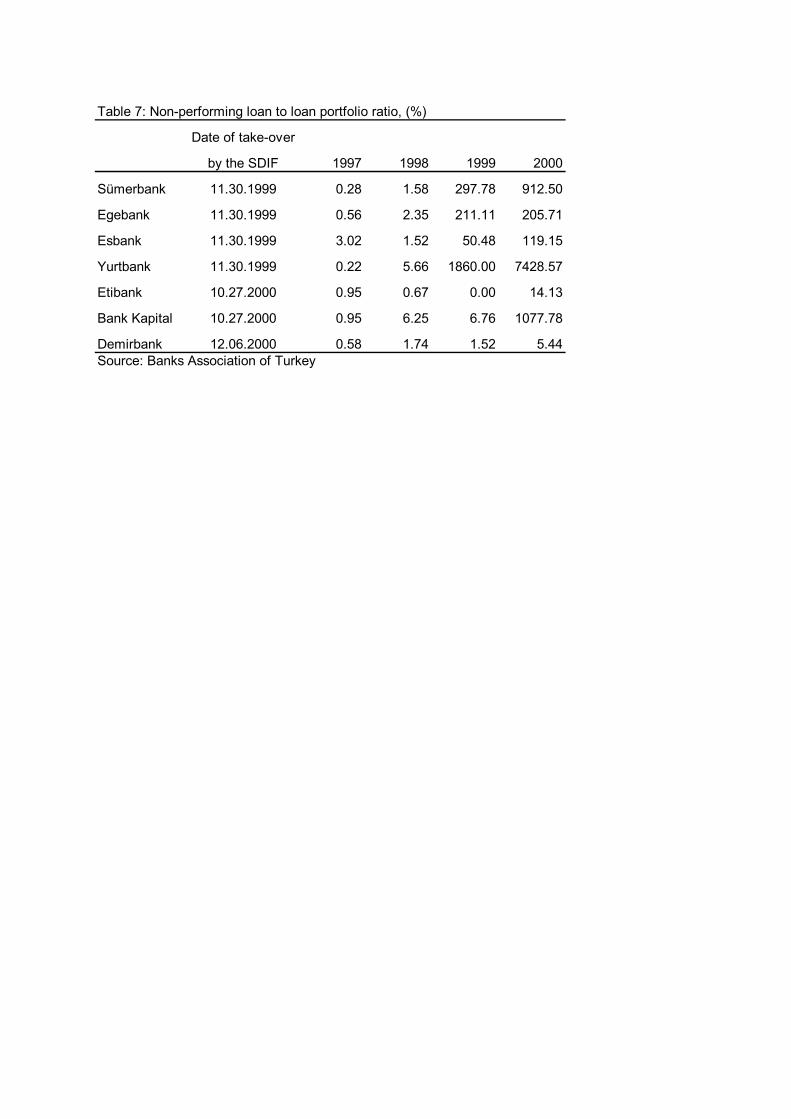
Table 7: Non-performing loan to loan portfolio ratio, (%)
Date of take-over
by the SDIF 1997 1998 1999 2000
Sümerbank 11.30.1999 0.28 1.58 297.78 912.50
Egebank 11.30.1999 0.56 2.35 211.11 205.71
Esbank 11.30.1999 3.02 1.52 50.48 119.15
Yurtbank 11.30.1999 0.22 5.66 1860.00 7428.57
Etibank 10.27.2000 0.95 0.67 0.00 14.13
Bank Kapital 10.27.2000 0.95 6.25 6.76 1077.78
Demirbank 12.06.2000 0.58 1.74 1.52 5.44Source: Banks Association of Turkey
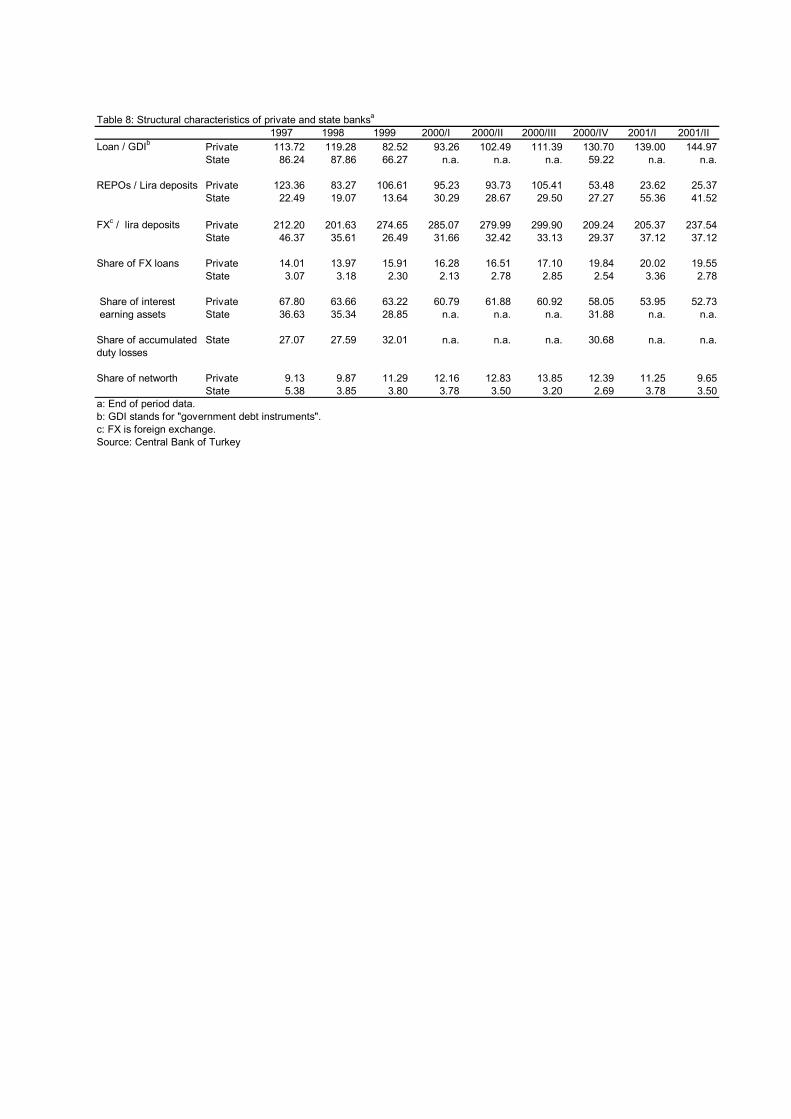
Table 8: Structural characteristics of private and state banksa
1997 1998 1999 2000/I 2000/II 2000/III 2000/IV 2001/I 2001/IILoan / GDIb Private 113.72 119.28 82.52 93.26 102.49 111.39 130.70 139.00 144.97
State 86.24 87.86 66.27 n.a. n.a. n.a. 59.22 n.a. n.a.
REPOs / Lira deposits Private 123.36 83.27 106.61 95.23 93.73 105.41 53.48 23.62 25.37State 22.49 19.07 13.64 30.29 28.67 29.50 27.27 55.36 41.52
FXc / lira deposits Private 212.20 201.63 274.65 285.07 279.99 299.90 209.24 205.37 237.54State 46.37 35.61 26.49 31.66 32.42 33.13 29.37 37.12 37.12
Share of FX loans Private 14.01 13.97 15.91 16.28 16.51 17.10 19.84 20.02 19.55State 3.07 3.18 2.30 2.13 2.78 2.85 2.54 3.36 2.78
Share of interest Private 67.80 63.66 63.22 60.79 61.88 60.92 58.05 53.95 52.73 earning assets State 36.63 35.34 28.85 n.a. n.a. n.a. 31.88 n.a. n.a.
Share of accumulated State 27.07 27.59 32.01 n.a. n.a. n.a. 30.68 n.a. n.a.duty losses
Share of networth Private 9.13 9.87 11.29 12.16 12.83 13.85 12.39 11.25 9.65State 5.38 3.85 3.80 3.78 3.50 3.20 2.69 3.78 3.50
a: End of period data.b: GDI stands for "government debt instruments".c: FX is foreign exchange.Source: Central Bank of Turkey
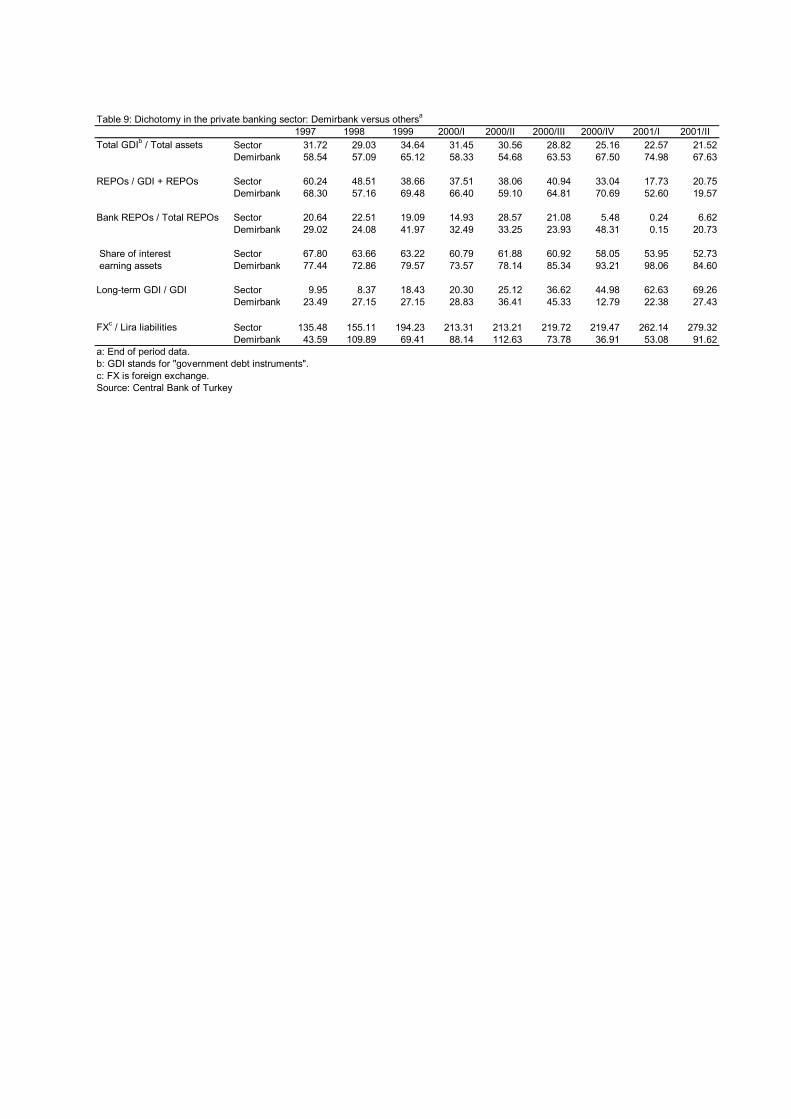
Table 9: Dichotomy in the private banking sector: Demirbank versus othersa
1997 1998 1999 2000/I 2000/II 2000/III 2000/IV 2001/I 2001/IITotal GDIb / Total assets Sector 31.72 29.03 34.64 31.45 30.56 28.82 25.16 22.57 21.52
Demirbank 58.54 57.09 65.12 58.33 54.68 63.53 67.50 74.98 67.63
REPOs / GDI + REPOs Sector 60.24 48.51 38.66 37.51 38.06 40.94 33.04 17.73 20.75Demirbank 68.30 57.16 69.48 66.40 59.10 64.81 70.69 52.60 19.57
Bank REPOs / Total REPOs Sector 20.64 22.51 19.09 14.93 28.57 21.08 5.48 0.24 6.62Demirbank 29.02 24.08 41.97 32.49 33.25 23.93 48.31 0.15 20.73
Share of interest Sector 67.80 63.66 63.22 60.79 61.88 60.92 58.05 53.95 52.73 earning assets Demirbank 77.44 72.86 79.57 73.57 78.14 85.34 93.21 98.06 84.60
Long-term GDI / GDI Sector 9.95 8.37 18.43 20.30 25.12 36.62 44.98 62.63 69.26Demirbank 23.49 27.15 27.15 28.83 36.41 45.33 12.79 22.38 27.43
FXc / Lira liabilities Sector 135.48 155.11 194.23 213.31 213.21 219.72 219.47 262.14 279.32Demirbank 43.59 109.89 69.41 88.14 112.63 73.78 36.91 53.08 91.62
a: End of period data.b: GDI stands for "government debt instruments".c: FX is foreign exchange.Source: Central Bank of Turkey
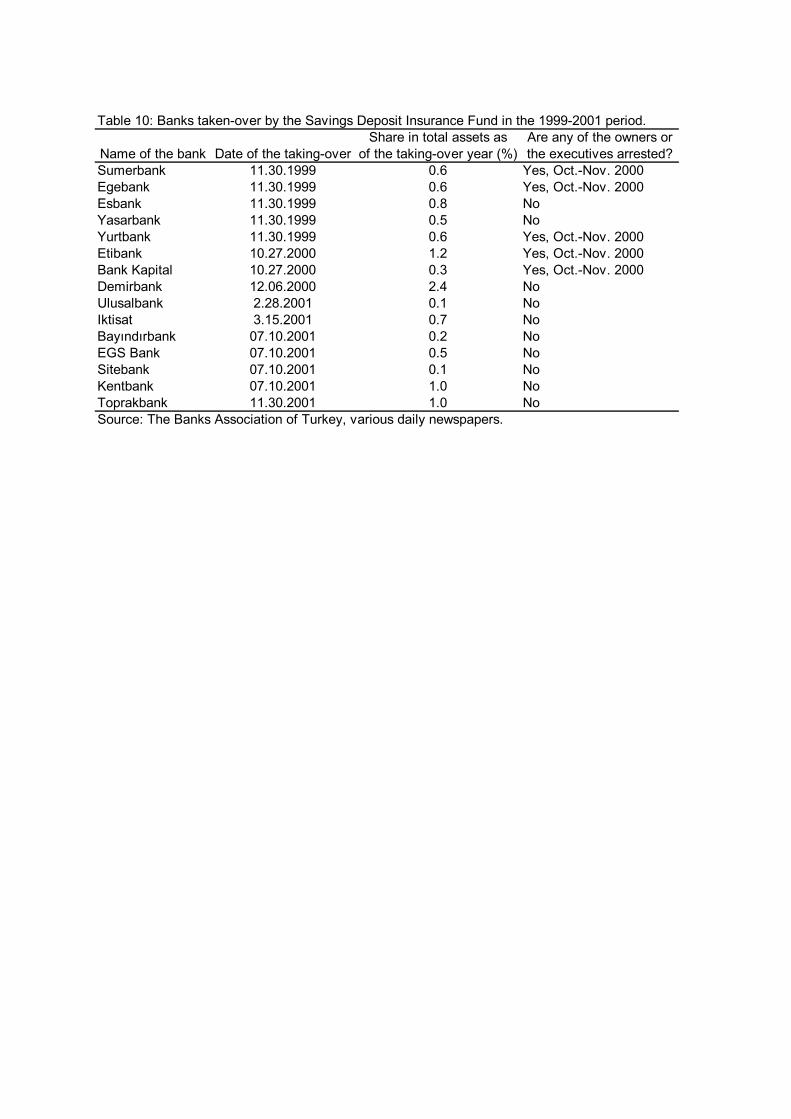
Table 10: Banks taken-over by the Savings Deposit Insurance Fund in the 1999-2001 period.Share in total assets as Are any of the owners or
Name of the bank Date of the taking-over of the taking-over year (%) the executives arrested?Sumerbank 11.30.1999 0.6 Yes, Oct.-Nov. 2000Egebank 11.30.1999 0.6 Yes, Oct.-Nov. 2000Esbank 11.30.1999 0.8 NoYasarbank 11.30.1999 0.5 NoYurtbank 11.30.1999 0.6 Yes, Oct.-Nov. 2000Etibank 10.27.2000 1.2 Yes, Oct.-Nov. 2000Bank Kapital 10.27.2000 0.3 Yes, Oct.-Nov. 2000Demirbank 12.06.2000 2.4 NoUlusalbank 2.28.2001 0.1 NoIktisat 3.15.2001 0.7 NoBayındırbank 07.10.2001 0.2 NoEGS Bank 07.10.2001 0.5 NoSitebank 07.10.2001 0.1 NoKentbank 07.10.2001 1.0 NoToprakbank 11.30.2001 1.0 NoSource: The Banks Association of Turkey, various daily newspapers.
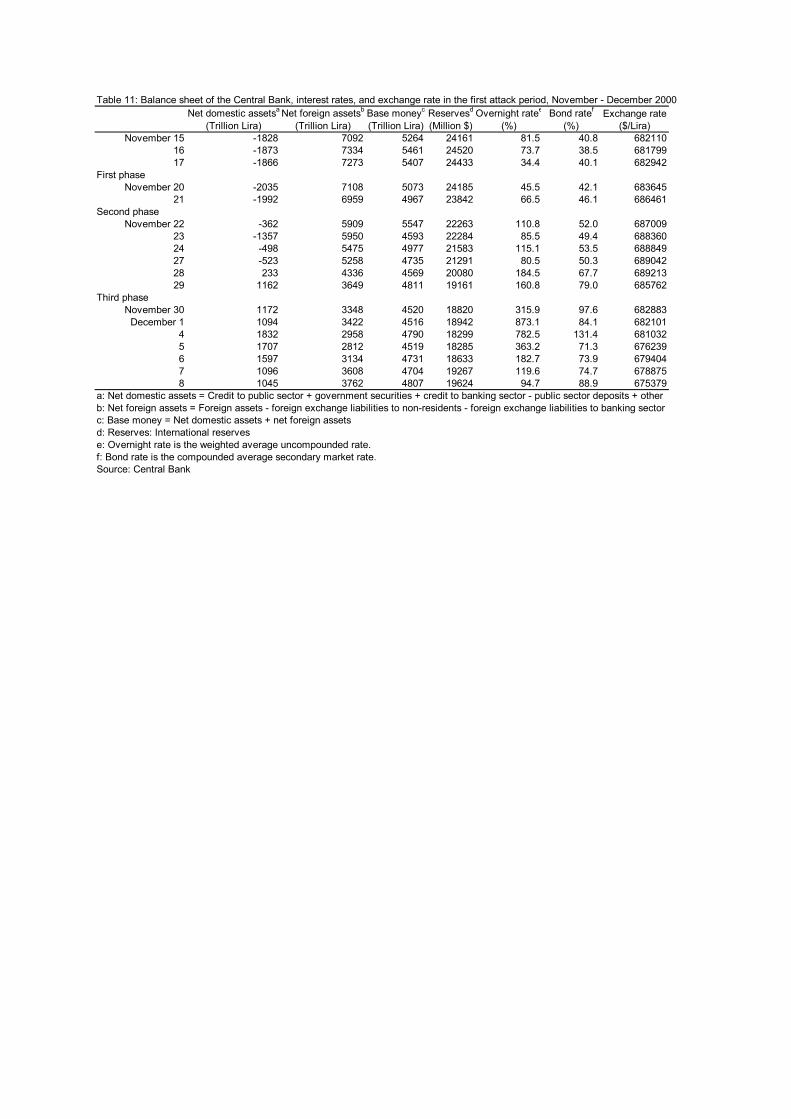
Table 11: Balance sheet of the Central Bank, interest rates, and exchange rate in the first attack period, November - December 2000Net domestic assetsa Net foreign assetsb Base moneyc Reservesd Overnight ratee Bond ratef Exchange rate
(Trillion Lira) (Trillion Lira) (Trillion Lira) (Million $) (%) (%) ($/Lira)November 15 -1828 7092 5264 24161 81.5 40.8 682110
16 -1873 7334 5461 24520 73.7 38.5 68179917 -1866 7273 5407 24433 34.4 40.1 682942
First phaseNovember 20 -2035 7108 5073 24185 45.5 42.1 683645
21 -1992 6959 4967 23842 66.5 46.1 686461Second phase
November 22 -362 5909 5547 22263 110.8 52.0 68700923 -1357 5950 4593 22284 85.5 49.4 68836024 -498 5475 4977 21583 115.1 53.5 68884927 -523 5258 4735 21291 80.5 50.3 68904228 233 4336 4569 20080 184.5 67.7 68921329 1162 3649 4811 19161 160.8 79.0 685762
Third phaseNovember 30 1172 3348 4520 18820 315.9 97.6 682883
December 1 1094 3422 4516 18942 873.1 84.1 6821014 1832 2958 4790 18299 782.5 131.4 6810325 1707 2812 4519 18285 363.2 71.3 6762396 1597 3134 4731 18633 182.7 73.9 6794047 1096 3608 4704 19267 119.6 74.7 6788758 1045 3762 4807 19624 94.7 88.9 675379
a: Net domestic assets = Credit to public sector + government securities + credit to banking sector - public sector deposits + otherb: Net foreign assets = Foreign assets - foreign exchange liabilities to non-residents - foreign exchange liabilities to banking sectorc: Base money = Net domestic assets + net foreign assetsd: Reserves: International reservese: Overnight rate is the weighted average uncompounded rate.f: Bond rate is the compounded average secondary market rate.Source: Central Bank
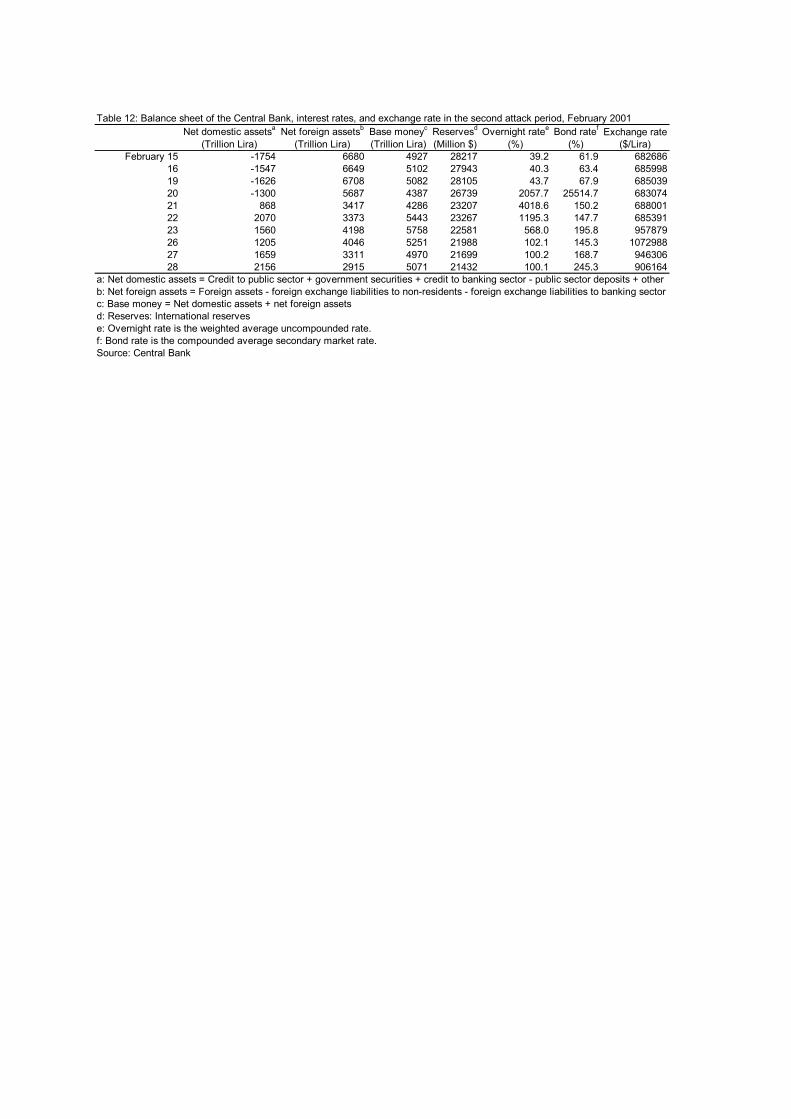
Table 12: Balance sheet of the Central Bank, interest rates, and exchange rate in the second attack period, February 2001Net domestic assetsa Net foreign assetsb Base moneyc Reservesd Overnight ratee Bond ratef Exchange rate
(Trillion Lira) (Trillion Lira) (Trillion Lira) (Million $) (%) (%) ($/Lira)February 15 -1754 6680 4927 28217 39.2 61.9 682686
16 -1547 6649 5102 27943 40.3 63.4 68599819 -1626 6708 5082 28105 43.7 67.9 68503920 -1300 5687 4387 26739 2057.7 25514.7 68307421 868 3417 4286 23207 4018.6 150.2 68800122 2070 3373 5443 23267 1195.3 147.7 68539123 1560 4198 5758 22581 568.0 195.8 95787926 1205 4046 5251 21988 102.1 145.3 107298827 1659 3311 4970 21699 100.2 168.7 94630628 2156 2915 5071 21432 100.1 245.3 906164
a: Net domestic assets = Credit to public sector + government securities + credit to banking sector - public sector deposits + otherb: Net foreign assets = Foreign assets - foreign exchange liabilities to non-residents - foreign exchange liabilities to banking sectorc: Base money = Net domestic assets + net foreign assetsd: Reserves: International reservese: Overnight rate is the weighted average uncompounded rate.f: Bond rate is the compounded average secondary market rate.Source: Central Bank
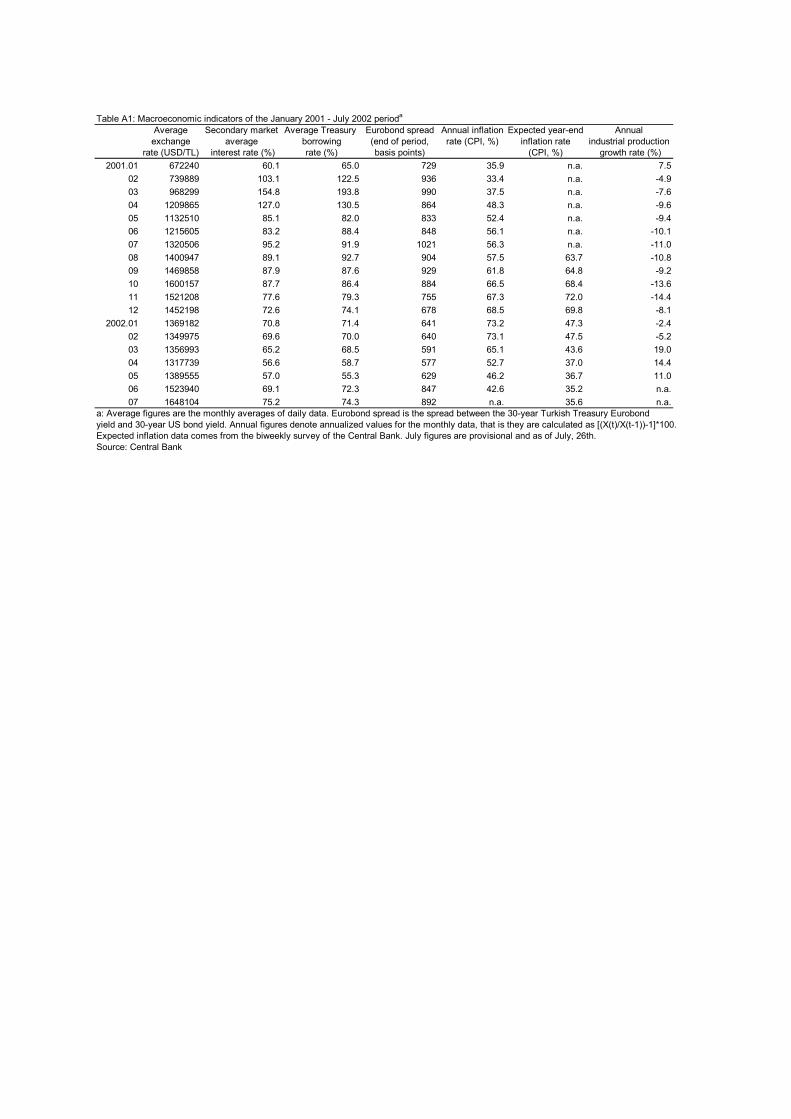
Table A1: Macroeconomic indicators of the January 2001 - July 2002 perioda
Average Secondary market Average Treasury Eurobond spread Annual inflation Expected year-end Annualexchange average borrowing (end of period, rate (CPI, %) inflation rate industrial production
rate (USD/TL) interest rate (%) rate (%) basis points) (CPI, %) growth rate (%)2001.01 672240 60.1 65.0 729 35.9 n.a. 7.5
02 739889 103.1 122.5 936 33.4 n.a. -4.903 968299 154.8 193.8 990 37.5 n.a. -7.604 1209865 127.0 130.5 864 48.3 n.a. -9.605 1132510 85.1 82.0 833 52.4 n.a. -9.406 1215605 83.2 88.4 848 56.1 n.a. -10.107 1320506 95.2 91.9 1021 56.3 n.a. -11.008 1400947 89.1 92.7 904 57.5 63.7 -10.809 1469858 87.9 87.6 929 61.8 64.8 -9.210 1600157 87.7 86.4 884 66.5 68.4 -13.611 1521208 77.6 79.3 755 67.3 72.0 -14.412 1452198 72.6 74.1 678 68.5 69.8 -8.1
2002.01 1369182 70.8 71.4 641 73.2 47.3 -2.402 1349975 69.6 70.0 640 73.1 47.5 -5.203 1356993 65.2 68.5 591 65.1 43.6 19.004 1317739 56.6 58.7 577 52.7 37.0 14.405 1389555 57.0 55.3 629 46.2 36.7 11.006 1523940 69.1 72.3 847 42.6 35.2 n.a.07 1648104 75.2 74.3 892 n.a. 35.6 n.a.
a: Average figures are the monthly averages of daily data. Eurobond spread is the spread between the 30-year Turkish Treasury Eurobondyield and 30-year US bond yield. Annual figures denote annualized values for the monthly data, that is they are calculated as [(X(t)/X(t-1))-1]*100. Expected inflation data comes from the biweekly survey of the Central Bank. July figures are provisional and as of July, 26th. Source: Central Bank


![Minorities in Turkey - Nigar Karimova and Edward Deverell [2001]](https://img.pdfslide.net/doc/110x75/577cdc9e1a28ab9e78aaf207/minorities-in-turkey-nigar-karimova-and-edward-deverell-2001.jpg)