Embed Size (px)
Citation preview

1 1 ATDI 2015 Adventure Tourism Development Index Report © 2015
A D V E N T U R E T O U R I S M D E V E L O P M E N T I N D E X
THE2015
REPORT
PUBL ISHEDMARCH 2015
F IF TH ED IT ION
Snowmass, Colorado, USA
2 2 ATDI 2015 Adventure Tourism Development Index Report © 2015
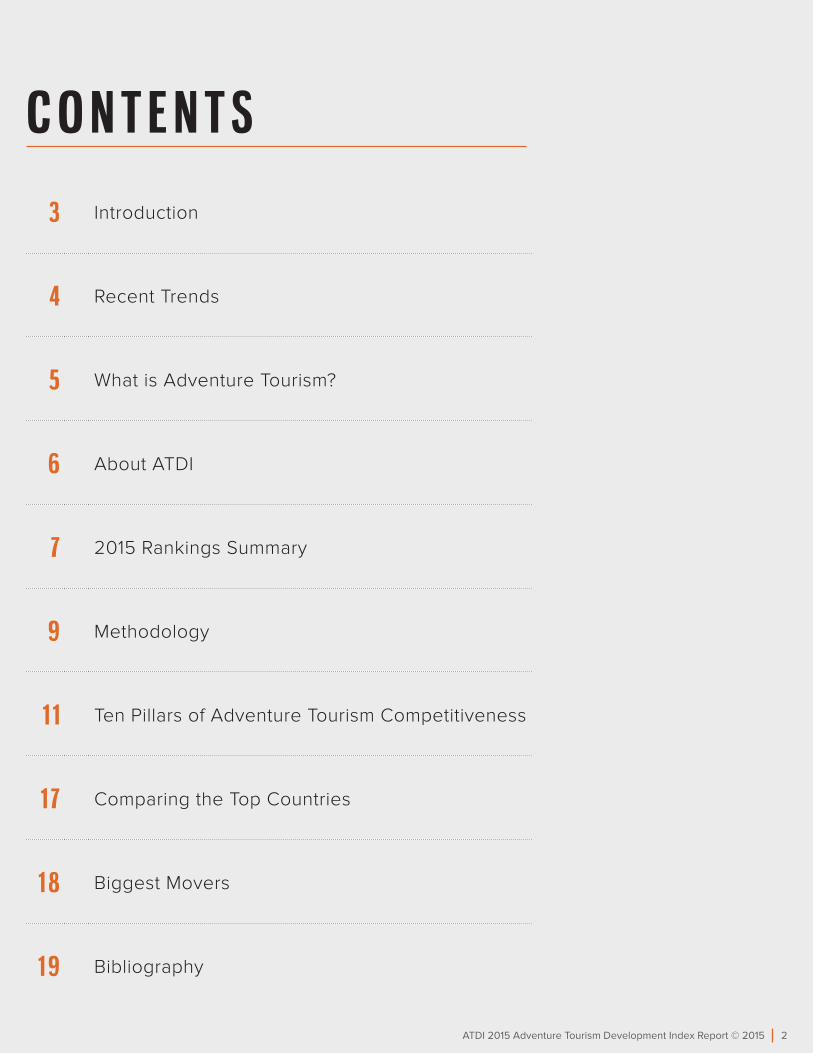
C O N T E N T S
3 Introduction
4 Recent Trends
5 What is Adventure Tourism?
6 About ATDI
7 2015 Rankings Summary
9 Methodology
1 1 Ten Pillars of Adventure Tourism Competitiveness
1 7 Comparing the Top Countries
1 8 Biggest Movers
1 9 Bibliography
3 3 ATDI 2015 Adventure Tourism Development Index Report © 2015
Now in its fifth edition, the 2015 Adventure
Tourism Development Index (ATDI)
assesses adventure tourism potential
for countries around the world. The ATDI
seeks to facilitate adventure tourism
policy and planning to drive economic
growth that is environmentally and cultur-
ally sustainable. It uses 10 pillars, drawing
data from a range of sources, to gauge
a country’s readiness
to compete in the
adventure tourism
sector. Scores do not
reflect a country’s
current popularity or
market presence in
adventure tourism,
although in some
cases a country’s current appeal may
correspond with its ATDI score.
The ATDI can be helpful to governments
considering an adventure tourism devel-
opment strategy or strengthening an
existing one. Tracking performance in
the ten pillar areas provides a guideline
for responsible development, helping
identify areas in need of more focus and
attention. It is also becoming evident that
a country’s attractiveness to travelers
can be estimated using its Adventure
Tourism Development Index score. For
example, preliminary research shows
that, controlling for other factors such
as language difference, distance, price
parity and more, a country’s ATDI can help
predict its international tourism arrival
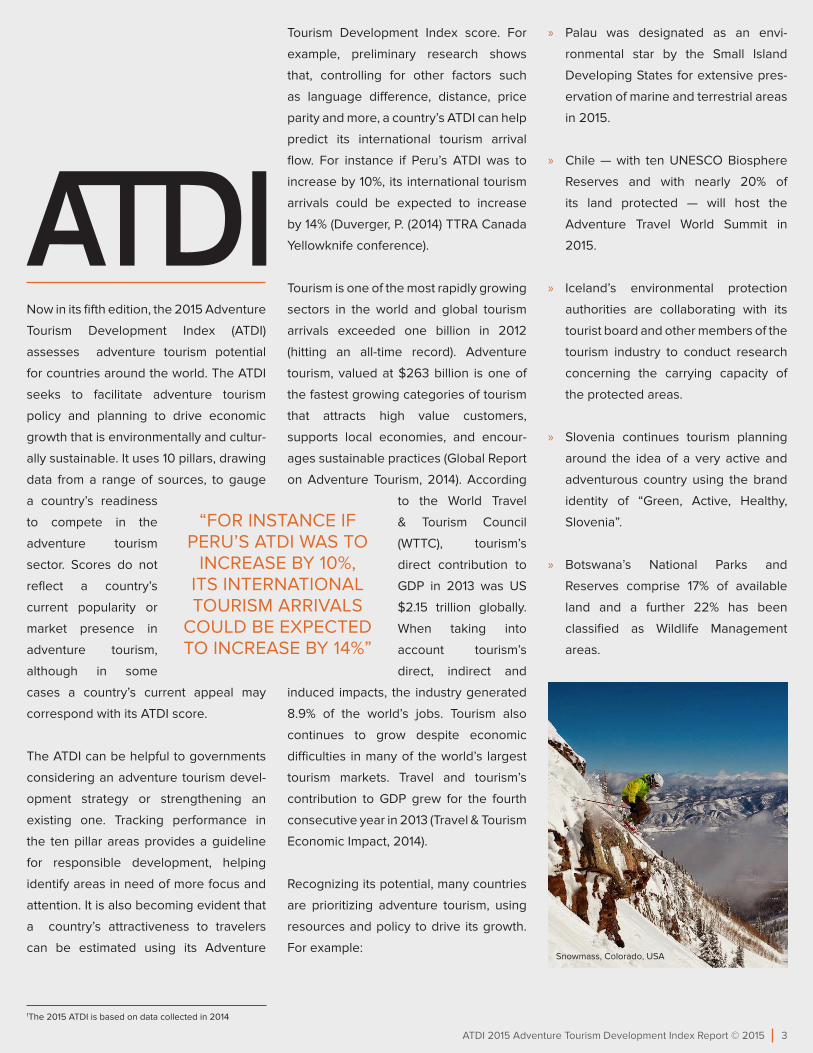
flow. For instance if Peru’s ATDI was to
increase by 10%, its international tourism
arrivals could be expected to increase
by 14% (Duverger, P. (2014) TTRA Canada
Yellowknife conference).
Tourism is one of the most rapidly growing
sectors in the world and global tourism
arrivals exceeded one billion in 2012
(hitting an all-time record). Adventure
tourism, valued at $263 billion is one of
the fastest growing categories of tourism
that attracts high value customers,
supports local economies, and encour-
ages sustainable practices (Global Report
on Adventure Tourism, 2014). According
to the World Travel
& Tourism Council
(WTTC), tourism’s
direct contribution to
GDP in 2013 was US
$2.15 trillion globally.
When taking into
account tourism’s
direct, indirect and
induced impacts, the industry generated
8.9% of the world’s jobs. Tourism also
continues to grow despite economic
difficulties in many of the world’s largest
tourism markets. Travel and tourism’s
contribution to GDP grew for the fourth
consecutive year in 2013 (Travel & Tourism
Economic Impact, 2014).
Recognizing its potential, many countries
are prioritizing adventure tourism, using
resources and policy to drive its growth.
For example:
» Palau was designated as an envi-
ronmental star by the Small Island
Developing States for extensive pres-
ervation of marine and terrestrial areas
in 2015.
» Chile — with ten UNESCO Biosphere
Reserves and with nearly 20% of
its land protected — will host the
Adventure Travel World Summit in
2015.
» Iceland’s environmental protection
authorities are collaborating with its
tourist board and other members of the
tourism industry to conduct research
concerning the carrying capacity of
the protected areas.
» Slovenia continues tourism planning
around the idea of a very active and
adventurous country using the brand
identity of “Green, Active, Healthy,
Slovenia”.
» Botswana’s National Parks and
Reserves comprise 17% of available
land and a further 22% has been
classified as Wildlife Management
areas.
1The 2015 ATDI is based on data collected in 2014
“FOR INSTANCE IF PERU’S ATDI WAS TO
INCREASE BY 10%, ITS INTERNATIONAL TOURISM ARRIVALS
COULD BE EXPECTED TO INCREASE BY 14%”
Snowmass, Colorado, USA

4 4 ATDI 2015 Adventure Tourism Development Index Report © 2015
R E C E N TT R E N D S
According to the 2013 Adventure Tourism
Market Study:
» The adventure travel market in North
America, South America and Europe
has experienced an average yearly
size increase of 65% from 2009 to
2012. A part of this growth is explained
by the increase in percentage of
adventure travelers in this market
(rising from 26.3% in 2009 to 41.9% in
2012).
» The average spending on adventure
trips (excluding airfare and gear) also
increased by nearly 20% between
2009 and 2012.
» The first three factors affecting
adventure travelers in choosing their
destination are areas of natural beauty,
available activities, and destination
climate.
» 69% of adventure travelers reported
online research as their preparation
method.
» The percentage of adventure travelers
using Facebook has more than
doubled between 2010 and 2013.
The tourism sector has been highly
impacted by information and communica-
tion technology in various ways. Travelers
tend to increasingly consume and
produce online information before during
and after their trips. As the demand for
adventure tourism increases and spreads
across a greater number of destinations,
internet marketing is also growing in
importance.
Switzerland, © Christian Perret

5 5 ATDI 2015 Adventure Tourism Development Index Report © 2015
W H AT I S A DV E N T U R E TO U R I S M ?The Adventure Travel Trade Association
defines adventure tourism as a trip (trav-
elling outside a person’s normal environ-
ment for more than 24 hours and not more
than one consecutive year) that includes at
least two of the following three elements:
physical activity, natural environment,
and cultural immersion. There are 34
types of activities considered as different
forms of adventure tourism: archeological
expedition, attending local festival/fairs,
backpacking, birdwatching, camping,
caving, climbing, cruise, cultural activi-
ties, eco-tourism, educational programs,
environmentally sustainable activities,
fishing/fly-fishing, getting to know the
locals, hiking, horseback riding, hunting,
kayaking/sea/whitewater, learning new
language, orienteering, rafting, research
expeditions, safaris, sailing, scuba
diving, snorkeling, skiing/snowboarding,
surfing, trekking, walking tours, visiting
friends/family, visiting historical sites, and
volunteer tourism. UNWTO published
the Global Report on Adventure Tourism
( jointly with the Adventure Travel Trade
Association) in November 2014 as its first
inclusive research on adventure travel
sector. As entrepreneurs, tour operators
and destinations create new, innovative
product offerings, adventure tourism will
continue to encompass more types of
activities and trips. Furthermore, tradi-
tional leisure trips are increasingly adding
elements of adventure tourism to their
itineraries, perpetuating its influence on
the world of travel.
As adventure tourism evolves, the
ATDI hopes to continue promoting the
important political, environmental, social,
and economic elements driving successful
adventure tourism development.
Mexico Macedonia
6 6 ATDI 2015 Adventure Tourism Development Index Report © 2015
The Adventure Tourism Development
Index (ATDI) is a joint initiative of The
George Washington University (GW),
and the the Adventure Travel Trade
Association (ATTA). The ATDI offers a
ranking of countries around the world
based on principles of sustainable
adventure tourism and is calculated
through a combination of expert survey
data and quantitative data gathered from
international indices.
With the goal of promoting and informing
sustainable development of adventure
tourism, the ATDI was created to support
entrepreneurs and governments who
want to create and market sustainable
adventure tourism products and services
while benefiting communities and the
environment.
ATTA promotes the ATDI program to
industry and governments and supports
its expansion while George Washington
University continues to refine the
technical methodology, calculate the
scores each year, and provide analysis as
well as report-writing.
The ATDI is overseen by an advisory
board made up of government, academic,
and private sector representatives from
the global adventure travel industry. The
2015 ATDI Board members are:
Christina Beckmann
Adventure Travel Trade Association
Zita Cobb
Shorefast Foundation
Pati Ruiz Corso
Sierra Gorda Reserve
Urs Eberhard
Switzerland Tourism
Kristin Lamoureux
The George Washington University International Institute for Tourism Studies
Hannah Messerli
World Bank, Private Sector Development/Tourism
Wallace J. Nichols
Biologist and Author
Jefe Parrish
World Wildlife Fund
Norie Quintos
National Geographic Society
A B O U TAT D I
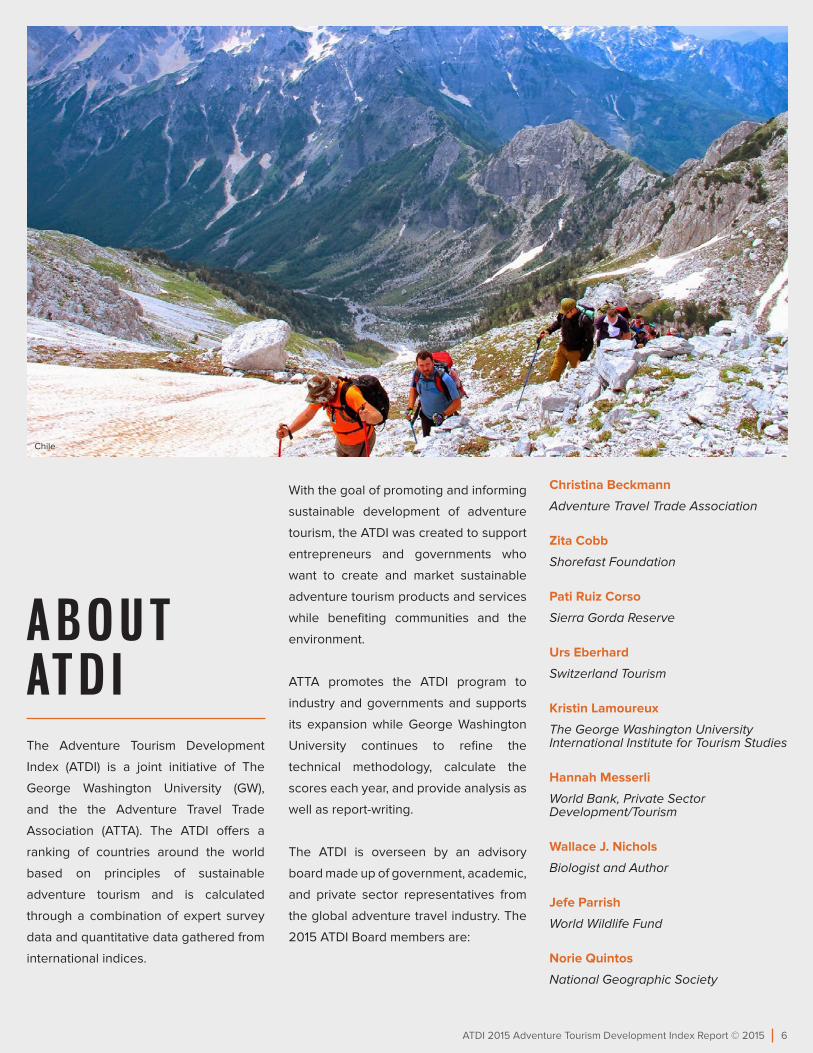
Chile
7 7 ATDI 2015 Adventure Tourism Development Index Report © 2015
2 0 1 5 R A N K I N G S S U M M A R Y
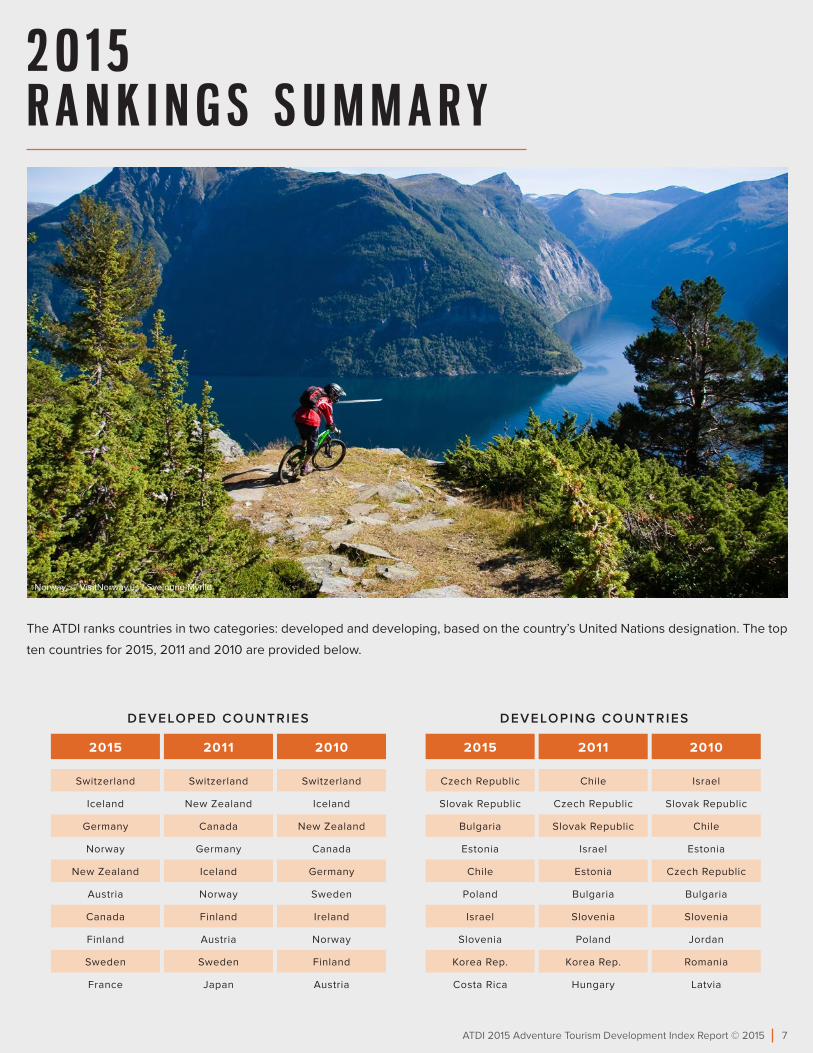
The ATDI ranks countries in two categories: developed and developing, based on the country’s United Nations designation. The top
ten countries for 2015, 2011 and 2010 are provided below.
2015 2011 2010
Switzerland Switzerland Switzerland
Iceland New Zealand Iceland
Germany Canada New Zealand
Norway Germany Canada
New Zealand Iceland Germany
Austria Norway Sweden
Canada Finland Ireland
Finland Austria Norway
Sweden Sweden Finland
France Japan Austria
2015 2011 2010
Czech Republic Chile Israel
Slovak Republic Czech Republic Slovak Republic
Bulgaria Slovak Republic Chile
Estonia Israel Estonia
Chile Estonia Czech Republic
Poland Bulgaria Bulgaria
Israel Slovenia Slovenia
Slovenia Poland Jordan
Korea Rep. Korea Rep. Romania
Costa Rica Hungary Latvia
DEVELOPED COUNTRIES DEVELOPING COUNTRIES
Norway, © VisitNorway.us / Sveinung Myrild
8 8 ATDI 2015 Adventure Tourism Development Index Report © 2015
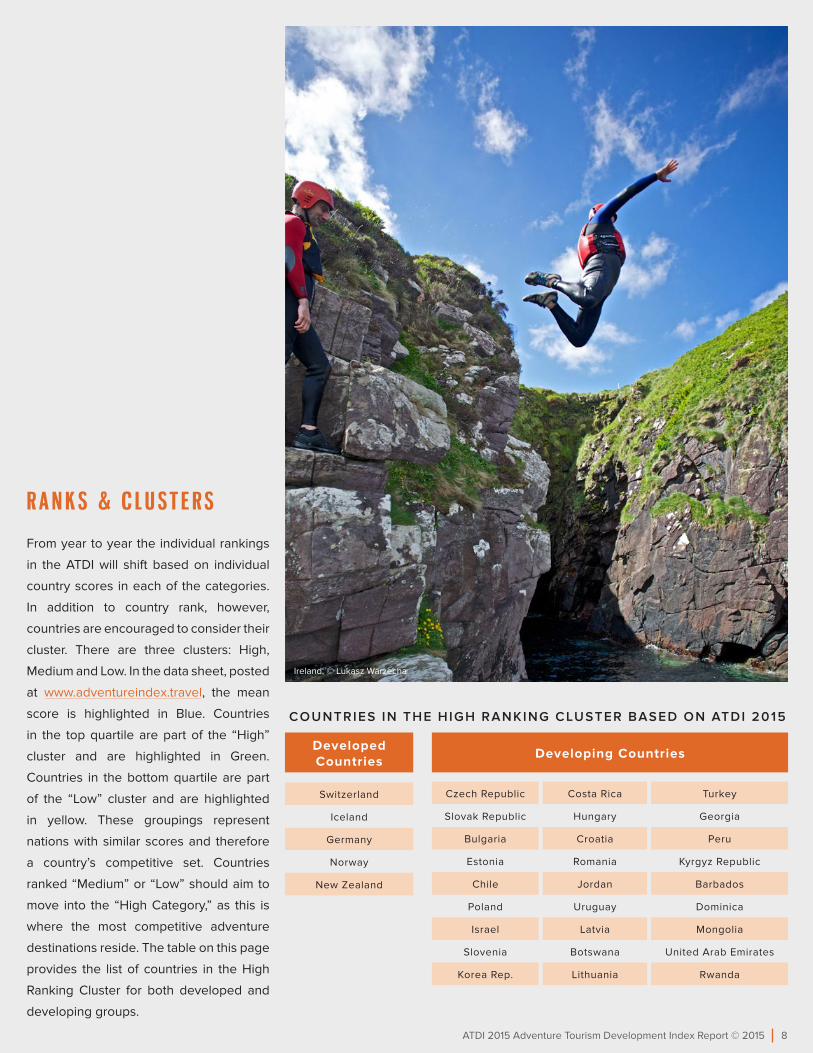
R A N K S & C L U ST E R S
From year to year the individual rankings
in the ATDI will shift based on individual
country scores in each of the categories.
In addition to country rank, however,
countries are encouraged to consider their
cluster. There are three clusters: High,
Medium and Low. In the data sheet, posted
at www.adventureindex.travel, the mean
score is highlighted in Blue. Countries
in the top quartile are part of the “High”
cluster and are highlighted in Green.
Countries in the bottom quartile are part
of the “Low” cluster and are highlighted
in yellow. These groupings represent
nations with similar scores and therefore
a country’s competitive set. Countries
ranked “Medium” or “Low” should aim to
move into the “High Category,” as this is
where the most competitive adventure
destinations reside. The table on this page
provides the list of countries in the High
Ranking Cluster for both developed and
developing groups.
Developed Countries
Switzerland
Iceland
Germany
Norway
New Zealand
Developing Countries
Czech Republic Costa Rica Turkey
Slovak Republic Hungary Georgia
Bulgaria Croatia Peru
Estonia Romania Kyrgyz Republic
Chile Jordan Barbados
Poland Uruguay Dominica
Israel Latvia Mongolia
Slovenia Botswana United Arab Emirates
Korea Rep. Lithuania Rwanda
COUNTRIES IN THE HIGH RANKING CLUSTER BASED ON ATDI 2015
Ireland, © Lukasz Warzecha

9 9 ATDI 2015 Adventure Tourism Development Index Report © 2015
M E T H O D O LO G YCountries recognized by the United Nations are benchmarked in the ATDI and are repre-
sented in two groups: Developed Countries and Developing/Emerging Economies.
The ATDI 2015 contains 28 Developed countries and 163 Developing/Emerging
countries.
M I S S I N G DATA
Countries with missing data points were
given a score of one, with the exception
of the Environmental Performance Index
(EPI) where the average regional score
was substituted. However, if more than
five data points were missing the country
was dropped from the ATDI calculations.
Twenty-two countries (11.5% of the total)
had at least one missing data point, but
only four had more than five missing data
points, and, therefore, were dropped from
the ATDI. All of the 18 countries remaining
with partial missing data were ranked
below average in group B or C.
Overall, 191 countries are ranked in the
ADTI.
The following countries were not ranked
in 2015: Niue, Nauru, Tuvalu and the Holy
See (Vatican).
The ATDI uses a combination of third-
party data and expert opinions. The
composition of each pillar is provided in
the Excel Workbook (available on www.
adventureindex.travel).
Mexico, © Aleph Alighieri
Snowmass, Colorado, USA
10 10 ATDI 2015 Adventure Tourism Development Index Report © 2015
E X P E R T PA N E LATDI uses a panel of industry experts
to help determine select pillar scores.
Experts are people with more than five
years of experience in the adventure
travel industry. They are able to comment
on any countries that they have visited
in the past five years. One expert may
comment on several countries. The ATDI
uses a five-year moving average of expert
survey results. If a country does not have
five years of expert survey results, the
ATDI uses an average of the available
data (for example, if Switzerland only has
expert survey results for 2011 and 2009,
the ATDI takes an average of those two
years).
In 2015, the ATDI had a panel of 463
experts. The 2015 experts were 42.4%
female. The experts had on average 14
years of experience in the travel and
tourism sector and 11 years of experience in
the adventure tourism sector. 51.4% were
tour operators, 7.3% were travel writers,
and 10.4% were travel developers. The
remaining 30.9% worked in hospitality,
consulting, destination management
organizations, or other tourism industry
positions. For more information about
how to join the 2016 ATDI expert panel,
please contact us at [email protected].
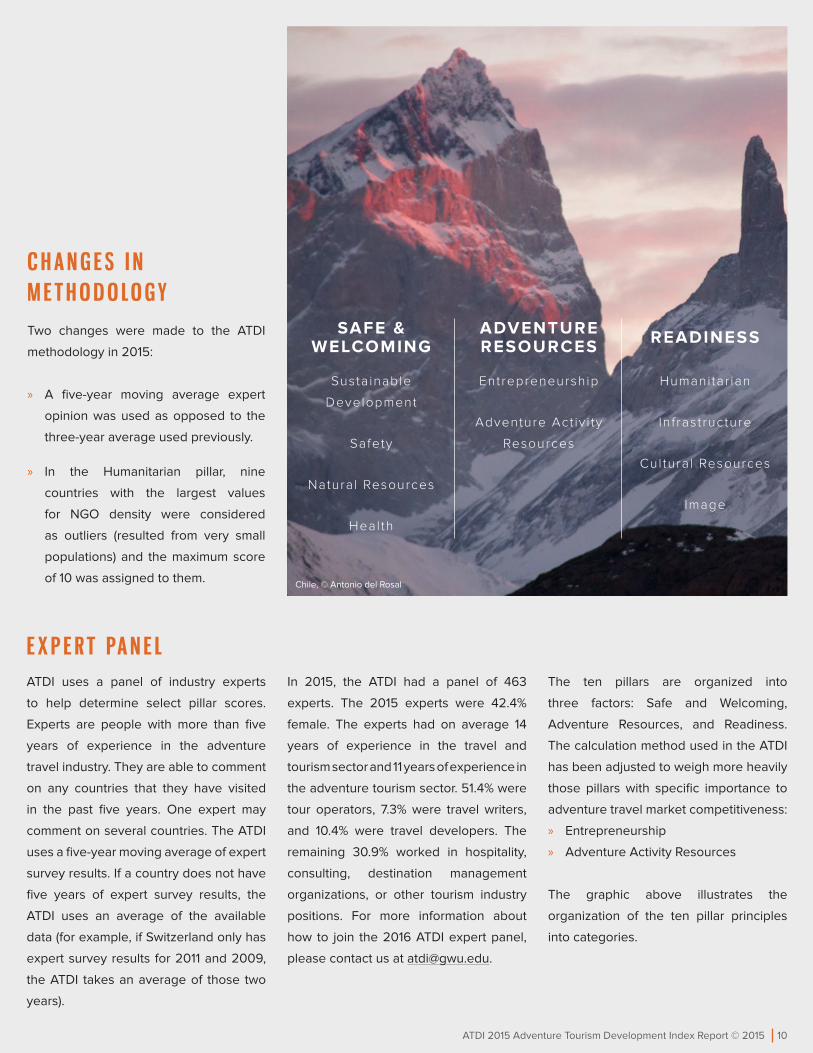
The ten pillars are organized into
three factors: Safe and Welcoming,
Adventure Resources, and Readiness.
The calculation method used in the ATDI
has been adjusted to weigh more heavily
those pillars with specific importance to
adventure travel market competitiveness:
» Entrepreneurship
» Adventure Activity Resources
The graphic above illustrates the
organization of the ten pillar principles
into categories.
C H A N G E S I N M E T H O D O LO G YTwo changes were made to the ATDI
methodology in 2015:
» A five-year moving average expert
opinion was used as opposed to the
three-year average used previously.
» In the Humanitarian pillar, nine
countries with the largest values
for NGO density were considered
as outliers (resulted from very small
populations) and the maximum score
of 10 was assigned to them.
SAFE & WELCOMING
Sustainable
Development
Safety
Natural Resources
Heal th
Entrepreneurship
Adventure Act iv i ty
Resources
Humanitar ian
Infrastructure
Cul tura l Resources
Image
ADVENTURE RESOURCES READINESS
Chile, © Antonio del Rosal
11 11 ATDI 2015 Adventure Tourism Development Index Report © 2015
1 . S U STA I N A B L E D E V E LO P M E N T P O L I CYGovernment policies that support and
foster sustainable and rural tourism
development are crucial to adventure
tourism market competitiveness because
they safeguard the destination’s natural,
heritage and cultural resources and
provide a positive investment climate
for the private sector. When public and
private sector actions are coordinated,
the private sector flourishes, attracting
investment and development to a region.
To assign a quantitative value to govern-
ment policies supportive of sustainable
tourism, the team used the following two
indicators:
1. The Environmental Protection Index
2. Unemployment per country (as
percentage of total labor force)
Rationale: High environmental perfor-
mance and low unemployment create a
favorable climate for sustainable devel-
opment, and government policies are an
important factor in driving country perfor-
mance in these areas.
2 . SA F E T Y A N D S E C U R I T YWith respect to safety, the ATDI numerical
benchmarks gauge how safe it is to travel
in a country. The Safety Pillar is made up
of two indicators and an expert opinion
question:
1. The Corruption Perceptions Index
2. Foreign and Commonwealth Travel
Warnings
3. Expert Opinions
Rationale: Countries with high levels
of transparency and low or no travel
warnings issued are safer for travelers.
Lower levels of corruption are also a sign
of a more secure country.
When the ten pillar framework is used
diagnostically for adventure destination
development, the Safety and Security
pillar assesses the degree to which
adventure operators provide for the
safety of travelers, and also whether
facilities exist to cope with travel-related
injuries. For example, in destinations
where scuba diving is a popular draw,
do hyperbaric chamber facilities for
decompression exist? In destinations
where mountaineering is popular, are
rescue operations available? Do guides
have first aid training? Generally, does the
level of client safety offered meet interna-
tionally accepted standards?
In 2009, the ATDI methodology added a
survey question that was put to the expert
panel. The question asked panelists to
rate “Your perception of this destination
as safe and secure for travel” on a Likert
scale of -3 (very poor) to +3 (very good).
This allows country experts to assess real
risk to travelers from firsthand knowledge.
T E N P I L L A R S O F A DV E N T U R E TO U R I S M C O M P E T I T I V E N E S SThis section describes the ten pillars and provides information about how the
quantitative scores for countries were derived for each pillar.
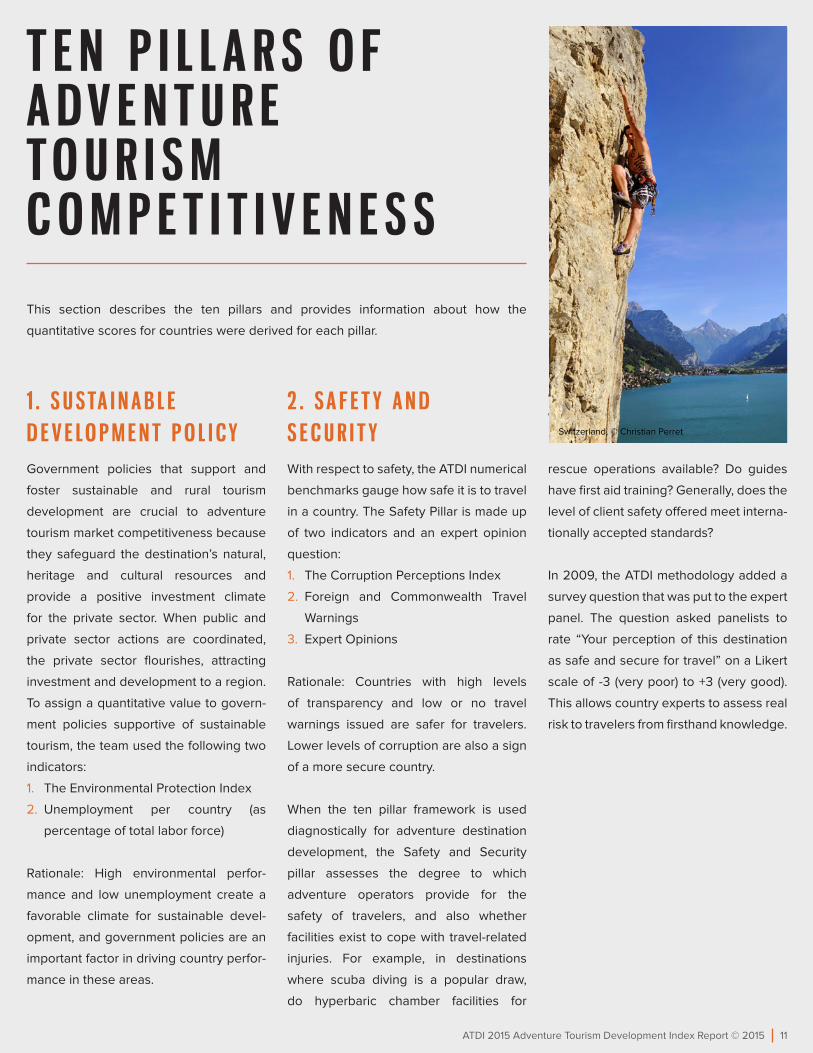
Switzerland, © Christian Perret
12 12 ATDI 2015 Adventure Tourism Development Index Report © 2015
3 . H E A LT HThe Health Pillar attempts to gauge the
level of healthcare available in a country.
This is important for two reasons:
1. A healthy local population is more able
to foster and nurture new businesses,
and to care for its resources
responsibly.
2. Countries where healthcare is readily
available are better able to support
adventure travelers.
The Health Pillar is made up of two indica-
tors from the World Health Organization:
1. Hospital beds (per 1000 people)
2. Physicians (per 1000 people)
Rationale: A high proportion of beds
and physicians suggests higher levels of
healthcare.
4 . N AT U R A L R E S O U R C E SAdventure travelers want untrammeled
and well-managed natural resources.
Destinations with unusual or rare natural
resources, which are well-managed and
not exploited, will earn high praise from
adventure travelers and sustained market
competitiveness. The Natural Resources
Pillar is made up of four indicators and an
expert opinion question:
From the World Resources Institute:
1. Urban Concentration
2. Population Density
From CIA World Factbook:
1. Kilometers of coastline
2. Ratio of coast to total area
Additionally, in 2009 the ATDI added
a survey question that asked panelists
to rate their perception “regarding the
variety of natural resources at the desti-
nation” on a Likert scale of -3 (very poor)
to +3 (very good).
Rationale: Places with more unpopu-
lated space are likely to have greater
natural resources for adventure tourism.
When the ATDI is applied diagnostically,
emphasis is placed on discovering and
valuing natural resources with fresh eyes
that local populations may have over-
looked as having a market value in the
adventure tourism context.
One provision was made to accommodate
the vast amount of coastline that Canada
has, and it was rated at 5,500 instead of
its actual score, in order to have scores
comparable with the rest of the world.
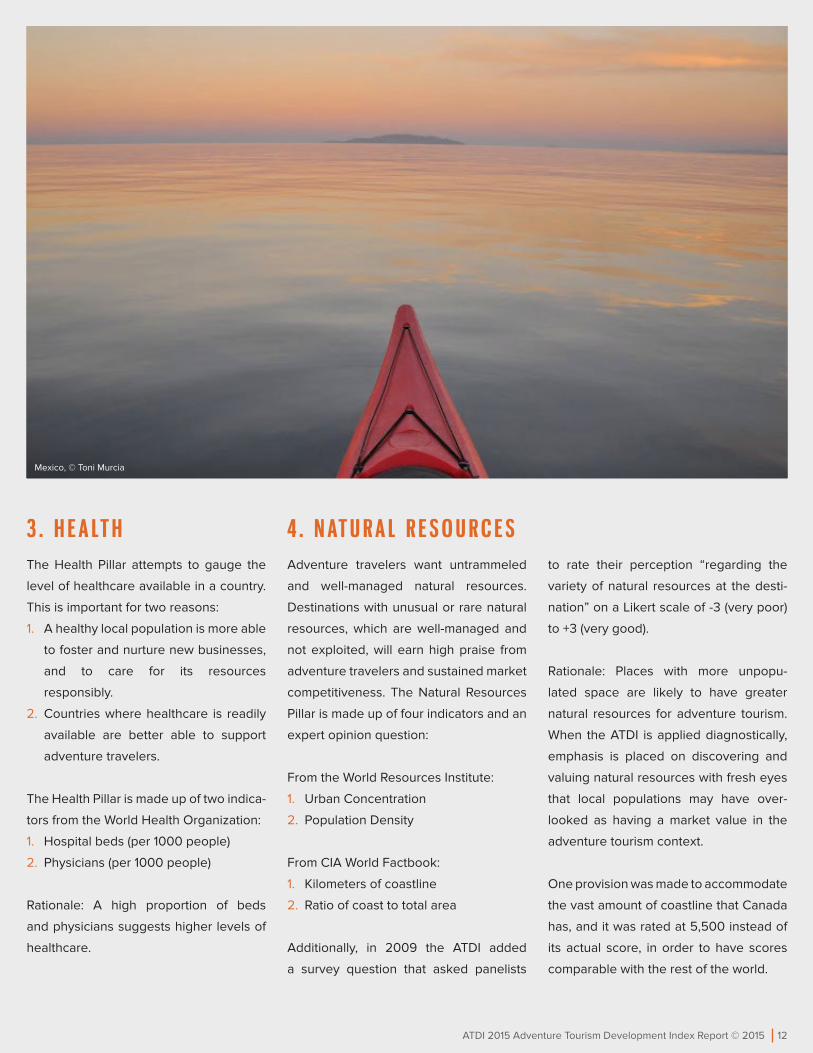
Mexico, © Toni Murcia
13 13 ATDI 2015 Adventure Tourism Development Index Report © 2015
5 . C U LT U R A L R E S O U R C E SAdventure travelers are as keen to learn
about new cultures as they are to explore
nature. For the adventure traveler, being
able to experience local culture in an
authentic way is a sought-after outcome
of the travel investment. Destinations
which encourage local people to
preserve their culture — even as modern
influences continue to shape and evolve
local customs — fare well with adventure
travelers. In valuing cultural resources the
ATDI seeks not to encourage local people
to become living museums to the past or
actors staging outdated customs, but to
acknowledge and honor their customs,
recognizing their unique contribution to
the world stage. The Cultural Resources
Pillar is made up of two indicators and an
expert opinion question:
1. UNESCO World Heritage Sites
2. Protected Area as a % of Total Land
Rationale: A high number of World
Heritage sites and a high number of
protected areas indicate a high number
of cultural resources.
Additionally, in 2009 the ATDI added
a survey question which asked expert
panelists to rate their perception of the
destination as “culturally rich,” on a Likert
scale of -3 (very poor) to +3 (very good).
6 . A DV E N T U R E ACT I V I T Y R E S O U R C E S (CYCL ING , C L IMB ING , H IK ING , RAF T ING)In this category the ATDI recognizes a
destination’s competitiveness relative to
its ability to support adventure sports,
which span a range of outdoor, nature-
based activities — from bird watching
to mountaineering; whitewater rafting
to rock climbing; caving to paragliding.
Destinations with resources lending them-
selves to the development of a particular
sport, for example cliffs excellent for ice
climbing or forests with a wealth of bird
species, may find themselves with an
opportunity for sustained competitive
advantage. The Adventure Activities
Resources Pillar is made up of two
indicators:
1. Threatened Species
2. Forests, Grasslands, Drylands
Rationale: A low number of threatened
species and the presence and growth of
forests, grasslands and drylands indicate
resources for adventure activities.
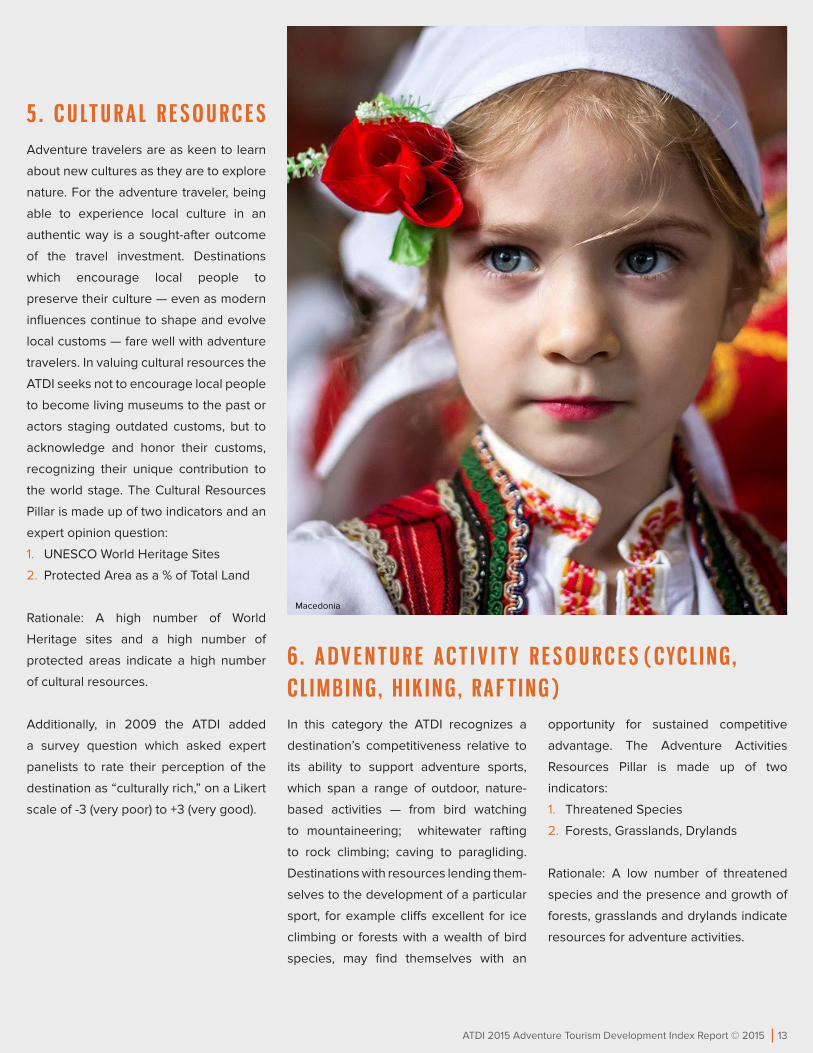
Macedonia

14 14 ATDI 2015 Adventure Tourism Development Index Report © 2015
7. E N T R E P R E N E U R S H I PWhile adventure travel is becoming more
established as an industry, its vitality and
strength originate from the so-called
“fringe” or cutting edge of businesses
that will try new activities, take people to
new places, and are often first in trying
new technologies as they have no status
quo to protect.
Given this reality, the ATDI looks for and
acknowledges destinations in which
entrepreneurship in the business sector
is thriving. Any destination in which young
businesses can start up and gain traction
is likely to be a fertile ground for adventure
tourism entrepreneurs with innovative
ideas, and therefore, more likely to
become competitive in the adventure
travel market. The Entrepreneurship Pillar
is made up of one component containing
ten different factors:
1. 2010 Index of Economic Freedom
Rationale: This indicator assesses 10
economic freedoms: Business Freedom,
Trade Freedom, Fiscal Freedom,
Government size, Monetary Freedom,
Investment Freedom, Financial Freedom,
Property Rights, Freedom from Corruption,
and Labor Freedom — which combined
indicate the level of the barriers to entry
for new entrepreneurs.
8 . H U M A N I TA R I A NThe Humanitarian Pillar is concerned with
human development in a country and its
link to the desire for adventure travelers
to enjoy authentic, unscripted experi-
ences. Adventure travelers frequently
seek out opportunities to volunteer in
the destinations they visit. Tour operators
find themselves looking for non-govern-
mental organization (NGO) and aid orga-
nization partners through which they can
offer their visitors a short-term opportu-
nity to contribute to relevant causes and
also have the chance to see real people
in unmanufactured situations.
As the trend toward volunteer tourism
and its appeal to adventure travelers
continues to build, the ATDI acknowl-
edges that destinations with volunteering
opportunities available to adventure
travelers are competitive in the larger
market for adventure tourism.
The Humanitarian Pillar is made up of
three indicators:
1. Happy Planet Index (HPI)
2. NGO Density
3. NGO Presence
Rationale: The factors measured by
the HPI (life expectancy, life expecta-
tion and ecological footprint), combined
with the density of NGOs and NGO
presence, combine to indicate organiza-
tions working in humanitarian develop-
ment and the level of a country’s human
development.
Namibia, © Cameron L. Martindell
15 15 ATDI 2015 Adventure Tourism Development Index Report © 2015
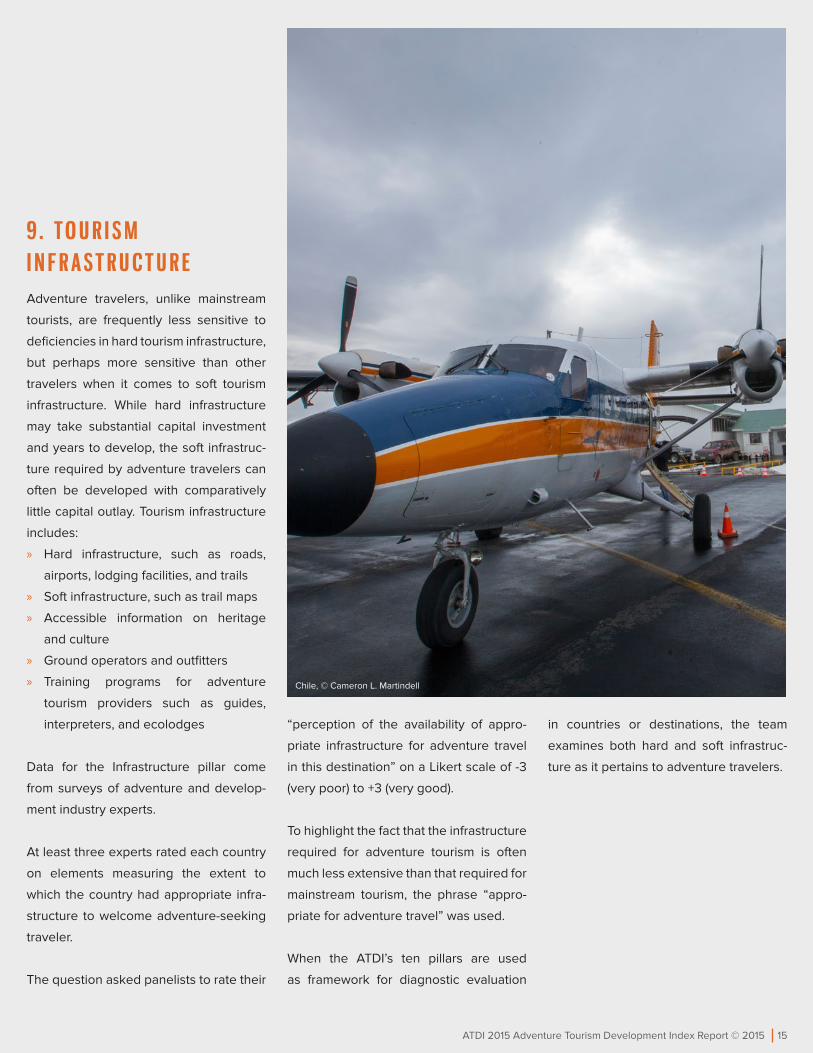
9 . TO U R I S M I N F R A ST R U CT U R EAdventure travelers, unlike mainstream
tourists, are frequently less sensitive to
deficiencies in hard tourism infrastructure,
but perhaps more sensitive than other
travelers when it comes to soft tourism
infrastructure. While hard infrastructure
may take substantial capital investment
and years to develop, the soft infrastruc-
ture required by adventure travelers can
often be developed with comparatively
little capital outlay. Tourism infrastructure
includes:
» Hard infrastructure, such as roads,
airports, lodging facilities, and trails
» Soft infrastructure, such as trail maps
» Accessible information on heritage
and culture
» Ground operators and outfitters
» Training programs for adventure
tourism providers such as guides,
interpreters, and ecolodges
Data for the Infrastructure pillar come
from surveys of adventure and develop-
ment industry experts.
At least three experts rated each country
on elements measuring the extent to
which the country had appropriate infra-
structure to welcome adventure-seeking
traveler.
The question asked panelists to rate their
“perception of the availability of appro-
priate infrastructure for adventure travel
in this destination” on a Likert scale of -3
(very poor) to +3 (very good).
To highlight the fact that the infrastructure
required for adventure tourism is often
much less extensive than that required for
mainstream tourism, the phrase “appro-
priate for adventure travel” was used.
When the ATDI’s ten pillars are used
as framework for diagnostic evaluation
in countries or destinations, the team
examines both hard and soft infrastruc-
ture as it pertains to adventure travelers.
Chile, © Cameron L. Martindell

16 16 ATDI 2015 Adventure Tourism Development Index Report © 2015
1 0 . I M AG EA country’s image can be one of the most
malleable aspects of market competitive-
ness, but it is also frequently misman-
aged as a way of guiding sustainable
market development. A country’s image
for sustainability and adventure opportu-
nity will attract travelers who value these
aspects. Through their visitation and
expenditures, these people will support
the country’s ongoing sustainable devel-
opment strategies. The ATDI examines a
destination’s adventure travel image.
Data for the Adventure Image Pillar come
from surveys of adventure and devel-
opment industry experts. At least three
experts rated each country on elements
measuring the extent to which the country
has the perception of an adventure
destination.
The question asked panelists to rate
their “perception of this destination as an
adventure tourism destination” on a Likert
scale of -3 (very poor) to +3 (very good).
The average score of countries in
different pillars were compared to see
how they changed between 2011 and
2015. According to the following table,
the most significant change of average
score has occurred in the Health and
Humanitarian pillars in both developed
and developing countries.
Countries YearSustainable
DevelopmentSafety Health
Natural Resources
Adventure Activity
ResourcesEntrepreneurship Humanitarian
Cultural Resources
Infrastructure Image
All
2015 6.93 5.20 2.94 5.94 8.39 6.32 3.60 4.70 5.63 6.13
2015 6.93 5.22 2.16 6.04 8.36 6.65 3.01 4.79 5.89 6.37
Change 0.01 (0.02) 0.77 (0.11) 0.03 (0.32) 0.59 (0.09) (0.26) (0.24)
Developed
2015 7.60 7.55 4.57 6.60 8.45 7.52 5.63 5.92 6.91 6.61
2011 7.63 7.78 2.96 6.63 8.48 7.70 4.33 5.93 7.19 6.88
Change (0.03) (0.23) 1.60 (0.02) (0.04) (0.18) 1.29 (0.00) (0.29) (0.27)
Developing
2015 6.82 4.81 2.66 5.82 8.38 6.12 3.25 4.49 5.42 6.05
2011 6.80 4.78 2.03 5.94 8.33 6.47 2.79 4.59 5.66 6.28
Change 0.02 0.03 0.64 (0.12) 0.05 (0.34) 0.46 (0.10) (0.24) (0.23)
COUNTRIES ’ AVERAGE SCORE BY P ILLAR (2011 -2015)
Switzerland, © Thomas Andemathen

17 17 ATDI 2015 Adventure Tourism Development Index Report © 2015
In both developing and developed
countries, the top nine countries
remained unchanged between 2011 and
2015 although in different positions.
Costa Rica and Hungary switched places
and Costa Rica joined the top 10 devel-
oping countries in 2015. Japan (ranked
10th in 2011) exited the list of top ten to
make room for France in the 2015 list.
Czech Republic and Switzerland ranked
first in their respective groups. Czech
Republic scored higher than Switzerland
in two pillars: Health and Cultural
Resources. Switzerland scored consider-
ably higher than Czech Republic in Safety,
Humanitarian, and Infrastructure pillars
and only slightly higher in Adventure
Activity Resources.
C O M PA R I N G T H E TO P C O U N T R I E S I N B OT H G R O U P S
Pillars of Adventure Tourism Competitiveness
Switzerland Czech Republic
Sustainable Development Policy 8.54 7.74
Safety 8.34 6.26
Health 4.98 5.42
Natural Resources 6.6 6.27
Adventure Resources 8.87 8.79
Entrepreneurship 9.27 8.22
Humanitarian 6.15 4.75
Cultural Resources 5.83 6.05
Infrastructure 7.82 6.52
Image 7.52 6.59
EVALUATION OF THE TOP COUNTRIES FROM ATDI 2015
Switzerland, © Christian Perret
18 18 ATDI 2015 Adventure Tourism Development Index Report © 2015
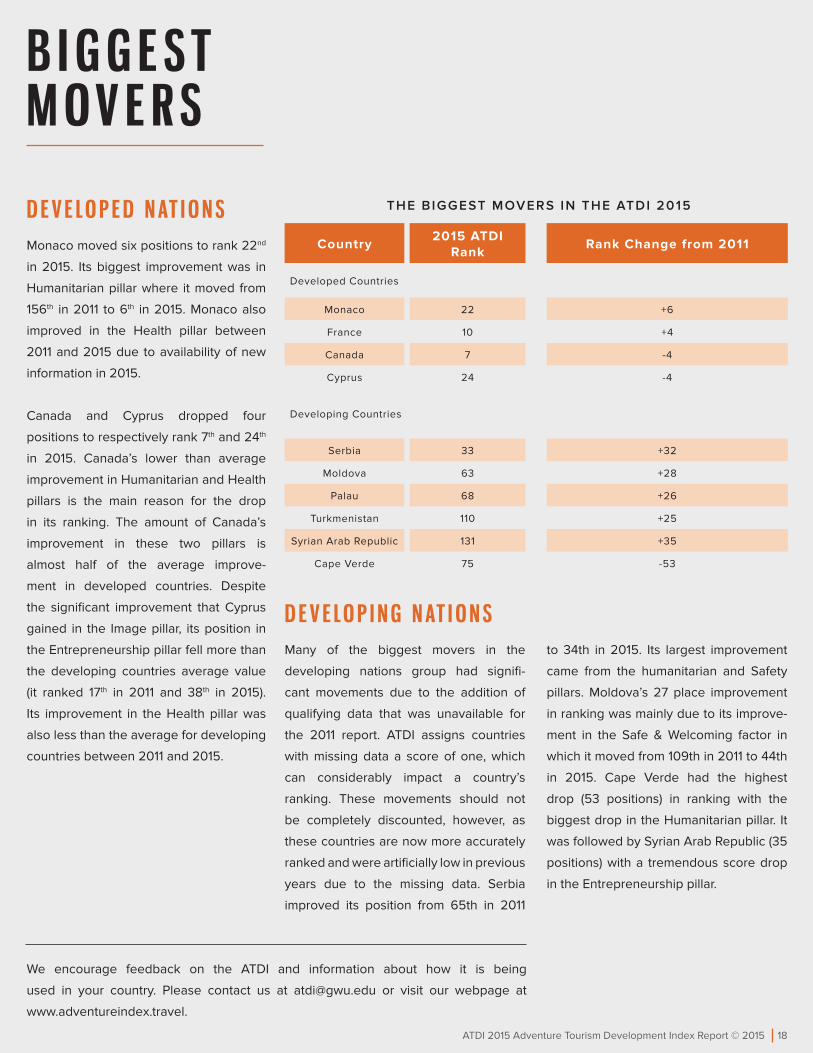
D E V E LO P E D N AT I O N SMonaco moved six positions to rank 22nd
in 2015. Its biggest improvement was in
Humanitarian pillar where it moved from
156th in 2011 to 6th in 2015. Monaco also
improved in the Health pillar between
2011 and 2015 due to availability of new
information in 2015.
Canada and Cyprus dropped four
positions to respectively rank 7th and 24th
in 2015. Canada’s lower than average
improvement in Humanitarian and Health
pillars is the main reason for the drop
in its ranking. The amount of Canada’s
improvement in these two pillars is
almost half of the average improve-
ment in developed countries. Despite
the significant improvement that Cyprus
gained in the Image pillar, its position in
the Entrepreneurship pillar fell more than
the developing countries average value
(it ranked 17th in 2011 and 38th in 2015).
Its improvement in the Health pillar was
also less than the average for developing
countries between 2011 and 2015.
D E V E LO P I N G N AT I O N SMany of the biggest movers in the
developing nations group had signifi-
cant movements due to the addition of
qualifying data that was unavailable for
the 2011 report. ATDI assigns countries
with missing data a score of one, which
can considerably impact a country’s
ranking. These movements should not
be completely discounted, however, as
these countries are now more accurately
ranked and were artificially low in previous
years due to the missing data. Serbia
improved its position from 65th in 2011
to 34th in 2015. Its largest improvement
came from the humanitarian and Safety
pillars. Moldova’s 27 place improvement
in ranking was mainly due to its improve-
ment in the Safe & Welcoming factor in
which it moved from 109th in 2011 to 44th
in 2015. Cape Verde had the highest
drop (53 positions) in ranking with the
biggest drop in the Humanitarian pillar. It
was followed by Syrian Arab Republic (35
positions) with a tremendous score drop
in the Entrepreneurship pillar.
Country2015 ATDI
RankRank Change from 2011
Developed Countries
Monaco 22 +6
France 10 +4
Canada 7 -4
Cyprus 24 -4
Developing Countries
Serbia 33 +32
Moldova 63 +28
Palau 68 +26
Turkmenistan 110 +25
Syrian Arab Republic 131 +35
Cape Verde 75 -53
B I G G E ST M OV E R S
We encourage feedback on the ATDI and information about how it is being
used in your country. Please contact us at [email protected] or visit our webpage at
www.adventureindex.travel.
THE BIGGEST MOVERS IN THE ATDI 2015

19 19 ATDI 2015 Adventure Tourism Development Index Report © 2015
B I B L I O G R A P H YUNWTO (2014). Global Report on Adventure Tourism. Madrid, Spain. Retrieved from: http://www.e-unwto.org
World Travel & Tourism Council (2014). Travel and Tourism Economic Impact- World. London, UK.
Adventure Travel Trade Association (2013), Adventure Tourism Market Study 2013(online), Retrieved from http://files.adventuretravel.
biz/docs/research/adventure-tourism-market-study-2013-web.pdf