Embed Size (px)
Citation preview

36 W
ORKIN
GMOTHER.C
OM O
CTOBER/N
OVEMBER 20
16
H Hall of Fame (at least 15 years on the list) ✦ Quarter Century Club — Not answered * Total global workforce
REPRESENTATION PARENTAL LEAVE FAMILY SUPPORT ADVANCEMENT FLEXIBILITY
A.T. Kearney TOP 10 4 956 39% 27% 38% 10 2 2 4 4 4 4 4 4 90% 90% 4
Abbott H 16 16,206 46% 46% 45% 6 0 2 4 4 4 4 97% 70% 4
AbbVie 3 12,541 52% 50% 53% 8 2 4 4 4 4 4 4 4 98% 80% 4
Accenture TOP 10 14 47,556 36% 31% — 16 2 8 4 4 4 4 4 4 75% 85% 4
ADP 6 30,643 58% 47% 56% 6 1 4 4 4 4 85% 95% 4
The Advisory Board Company 3 3,286 55% 48% 57% 4 2 4 4 4 4 4 95% 80% 4
Allianz Life Insurance Company of North America 3 2,127 48% 36% 50% 6 2 4 4 4 4 4 79% 42% 4
Arnold & Porter H 17 1,288 52% 40% 57% 18 6 18 4 4 4 99% 3%
Astellas 2 3,078 53% 50% 64% 6 2 2 4 4 4 4 85% 88% 4
Avon Products 13 3,335 69% 74% 73% 10 2 8 4 4 4 4 4 4 70% 80% 4
Bain & Co. 9 2,481 47% 41% 48% 12 4 4 4 4 4 4 4 100% 86% 4
Bank of America H✦ 28 181,475 55% 47% 52% 12 12 12 4 4 4 4 4 4 78% 39% 4
Baptist Health South Florida H 24 15,167 73% 69% 73% 1 1 1 4 4 4 4 4 4 4 90% 27% 4
Barclays 3 10,340 39% 26% 43% 16 1 16 4 4 4 4 4 64% 64% 4
BDO USA 6 5,623 47% 41% 50% 9 2 9 4 4 4 4 4 99% 85% 4
Blue Cross and Blue Shield of North Carolina 10 4,716 76% 63% 72% 8 2 4 4 4 4 4 4 99% 12% 4
Boehringer Ingelheim USA 5 8,134 51% 48% 52% 4 0 0 4 4 4 4 4 4 90% 100% 4
Bon Secours Virginia Health System H 18 15,605 82% 75% 82% 1 1 1 4 4 4 4 4 80% 3% 4
Booz Allen Hamilton H 18 22,246 37% 34% 32% 8 2 2 4 4 4 4 80% 80% 4
The Boston Consulting Group 10 3,283 46% 40% 42% 16 2 8 4 4 4 4 4 4 — — 4
Bristol-Myers Squibb H 19 11,420 51% 46% 52% 6 1 5 4 4 4 75% 75% 4
CA Technologies 9 5,769 31% 28% 27% 12 6 6 4 4 4 98% 60% 4
Capital One 11 51,132 56% 41% 51% 11 2 6 4 4 4 4 4 70% 60% 4
Cardinal Health 5 25,931 44% 38% 44% 1 1 1 4 4 4 4 4 50% 25% 4
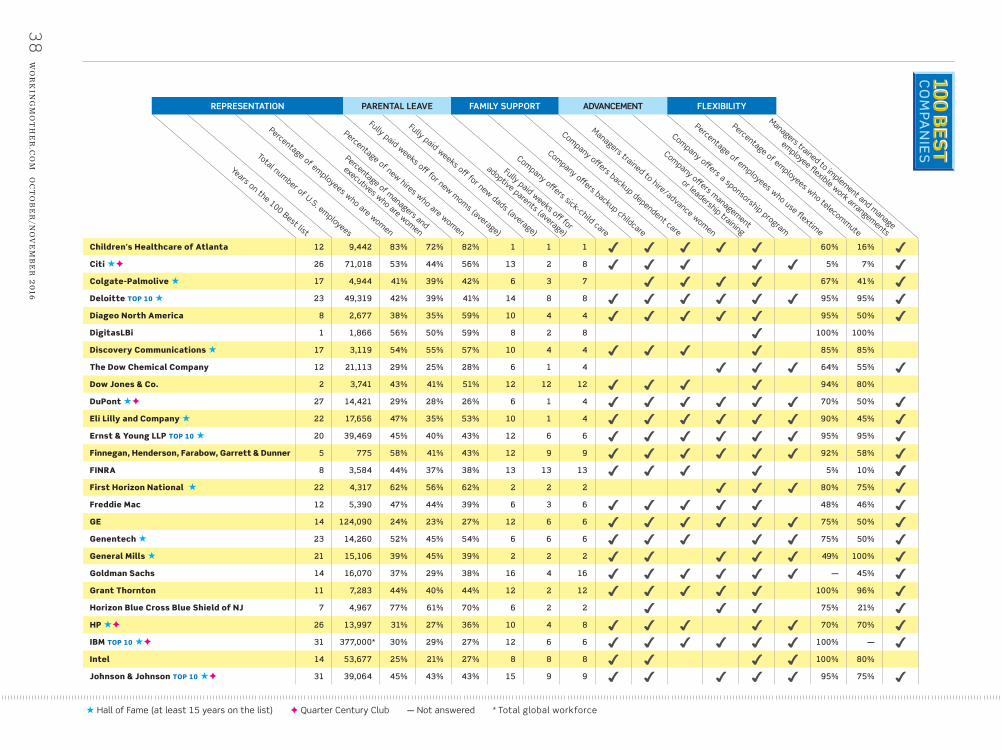
THE LIST Considering a job change in the near future? Check out just a few of the family-friendly programs and policies at the 2016 Working Mother 100 Best Companies.
Years on the 100 Best list
Total number of U.S. employees
Percentage of employees who are women
Percentage of managers and
executives who are women
Percentage of new hires who are women
Fully paid weeks off for new moms (average)
Company offers sick-child care
Fully paid weeks off for
adoptive parents (average)
Company offers backup childcare
Company offers backup dependent care
Managers trained to hire/advance women
Company offers management
or leadership training
Percentage of employees who telecommute
Percentage of employees who use flextime
Company offers a sponsorship program
Managers trained to implement and manage
employee flexible work arrangements
Fully paid weeks off for new dads (average)
WM
M11
16_100B
est C
hart.in
dd 3
68/2
4/1
6 1
1:2
3 A
M
38 W
ORKIN
GMOTHER.C
OM O
CTOBER/N
OVEMBER 20
16
Years on the 100 Best list
Total number of U.S. employees
Percentage of employees who are women
Percentage of managers and
executives who are women
Percentage of new hires who are women
Fully paid weeks off for new moms (average)
Company offers sick-child care
Fully paid weeks off for
adoptive parents (average)
Company offers backup childcare
Company offers backup dependent care
Managers trained to hire/advance women
Company offers management
or leadership training
Percentage of employees who telecommute
Percentage of employees who use flextime
Company offers a sponsorship program
Managers trained to implement and manage
employee flexible work arrangements
Fully paid weeks off for new dads (average)
REPRESENTATION PARENTAL LEAVE FAMILY SUPPORT ADVANCEMENT FLEXIBILITY
Children's Healthcare of Atlanta 12 9,442 83% 72% 82% 1 1 1 4 4 4 4 4 60% 16% 4
Citi H✦ 26 71,018 53% 44% 56% 13 2 8 4 4 4 4 4 5% 7% 4
Colgate-Palmolive H 17 4,944 41% 39% 42% 6 3 7 4 4 4 4 67% 41% 4
Deloitte TOP 10 H 23 49,319 42% 39% 41% 14 8 8 4 4 4 4 4 4 95% 95% 4
Diageo North America 8 2,677 38% 35% 59% 10 4 4 4 4 4 4 4 95% 50% 4
DigitasLBi 1 1,866 56% 50% 59% 8 2 8 4 100% 100%
Discovery Communications H 17 3,119 54% 55% 57% 10 4 4 4 4 4 4 85% 85%
The Dow Chemical Company 12 21,113 29% 25% 28% 6 1 4 4 4 4 64% 55% 4
Dow Jones & Co. 2 3,741 43% 41% 51% 12 12 12 4 4 4 4 94% 80%
DuPont H✦ 27 14,421 29% 28% 26% 6 1 4 4 4 4 4 4 4 70% 50% 4
Eli Lilly and Company H 22 17,656 47% 35% 53% 10 1 4 4 4 4 4 4 4 90% 45% 4
Ernst & Young LLP TOP 10 H 20 39,469 45% 40% 43% 12 6 6 4 4 4 4 4 4 95% 95% 4
Finnegan, Henderson, Farabow, Garrett & Dunner 5 775 58% 41% 43% 12 9 9 4 4 4 4 4 4 92% 58% 4
FINRA 8 3,584 44% 37% 38% 13 13 13 4 4 4 4 5% 10% 4 4
First Horizon National H 22 4,317 62% 56% 62% 2 2 2 4 4 4 80% 75% 4
Freddie Mac 12 5,390 47% 44% 39% 6 3 6 4 4 4 4 4 48% 46% 4
GE 14 124,090 24% 23% 27% 12 6 6 4 4 4 4 4 4 75% 50% 4
Genentech H 23 14,260 52% 45% 54% 6 6 6 4 4 4 4 4 75% 50% 4
General Mills H 21 15,106 39% 45% 39% 2 2 2 4 4 4 4 4 49% 100% 4
Goldman Sachs 14 16,070 37% 29% 38% 16 4 16 4 4 4 4 4 4 — 45% 4
Grant Thornton 11 7,283 44% 40% 44% 12 2 12 4 4 4 4 4 100% 96% 4
Horizon Blue Cross Blue Shield of NJ 7 4,967 77% 61% 70% 6 2 2 4 4 4 75% 21% 4
HP H✦ 26 13,997 31% 27% 36% 10 4 8 4 4 4 4 4 70% 70% 4
IBM TOP 10 H✦ 31 377,000* 30% 29% 27% 12 6 6 4 4 4 4 4 4 100% — 4
Intel 14 53,677 25% 21% 27% 8 8 8 4 4 4 4 100% 80%
Johnson & Johnson TOP 10 H✦ 31 39,064 45% 43% 43% 15 9 9 4 4 4 4 4 95% 75% 4
H Hall of Fame (at least 15 years on the list) ✦ Quarter Century Club — Not answered * Total global workforce
WM
M11
16_100B
est C
hart.in
dd 3
88/2
4/1
6 1
1:2
3 A
M

40 W
ORKIN
GMOTHER.C
OM O
CTOBER/N
OVEMBER 20
16
Years on the 100 Best list
Total number of U.S. employees
Percentage of employees who are women
Percentage of managers and
executives who are women
Percentage of new hires who are women
Fully paid weeks off for new moms (average)
Company offers sick-child care
Company offers backup childcare
Company offers backup dependent care
Managers trained to hire/advance women
Company offers management
or leadership training
Percentage of employees who telecommute
Percentage of employees who use flextime
Company offers a sponsorship program
Managers trained to implement and manage
employee flexible work arrangements
Fully paid weeks off for new dads (average)
REPRESENTATION PARENTAL LEAVE FAMILY SUPPORT ADVANCEMENT FLEXIBILITY
H Hall of Fame (at least 15 years on the list) ✦ Quarter Century Club — Not answered * Total global workforce
Fully paid weeks off for
adoptive parents (average)
JPMorgan Chase & Co. H 20 159,629 54% 46% 52% 12 1 12 4 4 4 4 4 75% 27% 4
Katten Muchin Rosenman 10 1,405 52% 30% 53% 6 0 6 4 4 4 4 4 100% 63% 4
KPMG H 20 28,892 44% 37% 43% 16 6 6 4 4 4 4 4 4 100% — 4
LEGO Systems 13 2,527 46% 48% 44% 13 2 6 4 4 4 90% 75% 4
Leo Burnett 11 1,485 56% 52% 59% 8 2 4 4 100% 60% 4
Lexmark International 1 4,373 25% 24% 31% 12 6 6 4 4 4 4 95% 90% 4
L'Oréal USA 2 9,222 66% 59% 74% 13 2 2 4 4 4 4 4 4 18% 14% 4
March of Dimes Foundation 7 1,075 87% 83% 87% 6 4 4 4 4 — 20%
MassMutual Financial Group H 16 7,192 55% 43% 50% 2 3 3 4 4 4 100% 6% 4
McKinsey & Co. TOP 10 10 6,042 44% 36% 43% 14 4 6 4 4 4 4 4 4 100% 100% 4
Merck H✦ 30 23,073 49% 39% 53% 6 1 1 4 4 4 4 4 4 4 83% 40% 4
MetLife H 18 27,847 53% 44% 49% 14 2 2 4 4 96% 90% 4
Moffitt Cancer Center 8 5,924 74% 63% 75% 4 1 4 4 4 4 4 4 4 27% — 4
Monsanto 4 10,776 32% 29% 31% 10 4 4 4 4 4 4 100% 80% 4
Moody's 1 3,345 40% 33% 41% 10 4 4 4 4 4 4 4 4 100% 91% 4
Morgan Stanley H 15 40,754 39% 22% 40% 16 1 16 4 4 4 4 4 42% 92% 4
Moss Adams 6 2,359 52% 45% 50% 9 2 2 4 4 4 4 4 4 90% 20%
New York Life Insurance 13 8,234 54% 43% 50% 8 1 4 4 4 4 4 100% 85% 4
Northwestern Memorial HealthCare H 17 10,142 79% 66% 79% 1 0 0 4 4 4 4 4 100% 27% 4
Novartis Pharmaceuticals Corp. H 16 7,103 57% 48% 60% 10 1 1 4 4 4 4 97% 98% 4
Novo Nordisk 2 5,156 56% 48% 61% 6 1 1 4 4 4 4 4 90% 17%
Ogilvy & Mather 3 3,420 60% 56% 62% 3 2 2 4 4 4 4 4 25% 50% 4
Oliver Wyman 2 1,821 42% 30% 41% 12 6 6 4 4 4 4 4 4 100% 65%
Pillsbury Winthrop Shaw Pittman 11 1,357 51% 48% 45% 12 2 2 4 4 4 4 80% 75% 4
The PNC Financial Services Group H 15 52,647 61% 49% 61% 7 1 2 4 4 4 4 4 4 77% 49% 4
PricewaterhouseCoopers TOP 10 H 22 41,795 44% 41% 42% 15 3 12 4 4 4 4 4 4 80% 70% 4
WM
M11
16_100B
est C
hart.in
dd 4
08/2
4/1
6 1
1:2
3 A
M
42 W
ORKIN
GMOTHER.C
OM O
CTOBER/N
OVEMBER 20
16
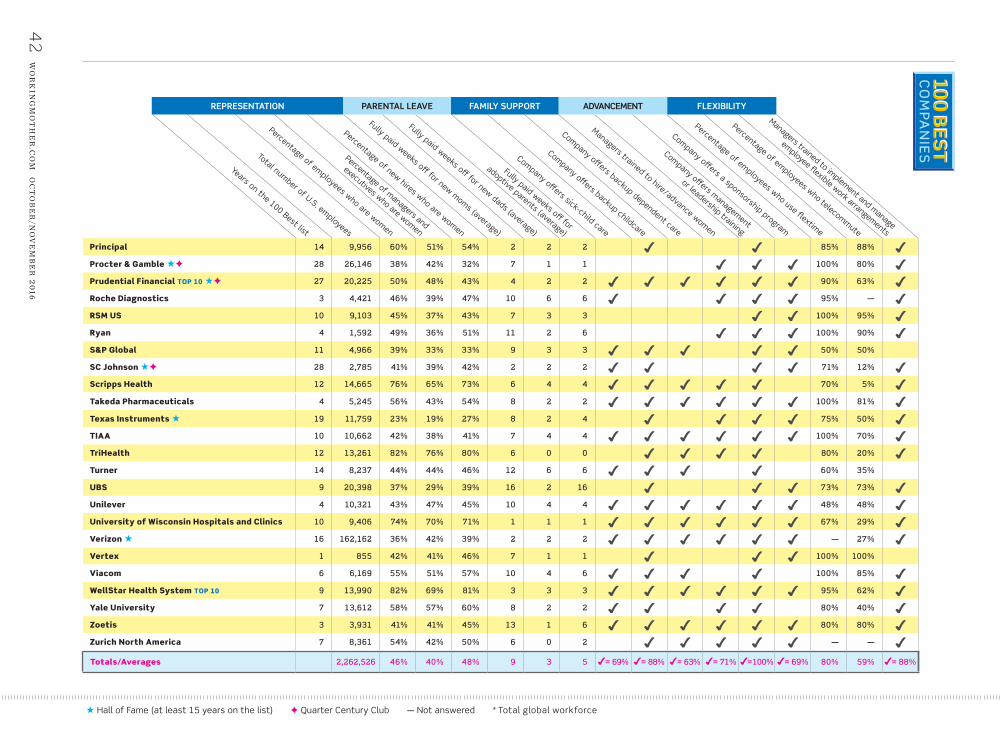
Years on the 100 Best list
Total number of U.S. employees
Percentage of employees who are women
Percentage of managers and
executives who are women
Percentage of new hires who are women
Fully paid weeks off for new moms (average)
Company offers sick-child care
Fully paid weeks off for
adoptive parents (average)
Company offers backup childcare
Company offers backup dependent care
Managers trained to hire/advance women
Company offers management
or leadership training
Percentage of employees who telecommute
Percentage of employees who use flextime
Company offers a sponsorship program
Managers trained to implement and manage
employee flexible work arrangements
Fully paid weeks off for new dads (average)
REPRESENTATION PARENTAL LEAVE FAMILY SUPPORT ADVANCEMENT FLEXIBILITY
Principal 14 9,956 60% 51% 54% 2 2 2 4 4 85% 88% 4
Procter & Gamble H✦ 28 26,146 38% 42% 32% 7 1 1 4 4 4 100% 80% 4
Prudential Financial TOP 10 H✦ 27 20,225 50% 48% 43% 4 2 2 4 4 4 4 4 4 90% 63% 4
Roche Diagnostics 3 4,421 46% 39% 47% 10 6 6 4 4 4 4 95% — 4
RSM US 10 9,103 45% 37% 43% 7 3 3 4 4 100% 95% 4
Ryan 4 1,592 49% 36% 51% 11 2 6 4 4 4 100% 90% 4
S&P Global 11 4,966 39% 33% 33% 9 3 3 4 4 4 4 4 50% 50%
SC Johnson H✦ 28 2,785 41% 39% 42% 2 2 2 4 4 4 4 71% 12% 4
Scripps Health 12 14,665 76% 65% 73% 6 4 4 4 4 4 4 4 70% 5% 4
Takeda Pharmaceuticals 4 5,245 56% 43% 54% 8 2 2 4 4 4 4 4 4 100% 81% 4
Texas Instruments H 19 11,759 23% 19% 27% 8 2 4 4 4 4 4 75% 50% 4
TIAA 10 10,662 42% 38% 41% 7 4 4 4 4 4 4 4 4 100% 70% 4
TriHealth 12 13,261 82% 76% 80% 6 0 0 4 4 4 4 80% 20% 4
Turner 14 8,237 44% 44% 46% 12 6 6 4 4 4 4 60% 35%
UBS 9 20,398 37% 29% 39% 16 2 16 4 4 4 73% 73% 4
Unilever 4 10,321 43% 47% 45% 10 4 4 4 4 4 4 4 4 48% 48% 4
University of Wisconsin Hospitals and Clinics 10 9,406 74% 70% 71% 1 1 1 4 4 4 4 4 4 67% 29% 4
Verizon H 16 162,162 36% 42% 39% 2 2 2 4 4 4 4 4 4 — 27% 4
Vertex 1 855 42% 41% 46% 7 1 1 4 4 4 100% 100%
Viacom 6 6,169 55% 51% 57% 10 4 6 4 4 4 4 100% 85% 4
WellStar Health System TOP 10 9 13,990 82% 69% 81% 3 3 3 4 4 4 4 4 4 95% 62% 4
Yale University 7 13,612 58% 57% 60% 8 2 2 4 4 4 4 80% 40% 4
Zoetis 3 3,931 41% 41% 45% 13 1 6 4 4 4 4 4 4 80% 80% 4
Zurich North America 7 8,361 54% 42% 50% 6 0 2 4 4 4 4 4 — — 4
Totals/Averages 2,262,526 46% 40% 48% 9 3 5 4= 69% 4= 88% 4= 63% 4= 71% 4=100% 4= 69% 80% 59% 4= 88%
H Hall of Fame (at least 15 years on the list) ✦ Quarter Century Club — Not answered * Total global workforce
WM
M11
16_100B
est C
hart.in
dd 4
28/2
4/1
6 1
1:2
3 A
M