Embed Size (px)
Citation preview

The 2016 Receiver Wrap-Up
ByEricHardter

2
TableofContents
Introduction.........................................................................................................................3
AggregateTeamPassingProductionandTop-50PPRReceiverStatistics............................4
2015SeasonalandAverageAIRScores................................................................................8
2015WeeklyAIRTierPercentages.......................................................................................15
TheFirstDownRatio(FDR)..................................................................................................24
TheNewDealandReconcilingRealFootballwithFantasy..................................................27
ScoringOriginsandTouchdownDependence.....................................................................36
RelativeRatiosandPotentialRepeatability.........................................................................45
WeeklyFantasyReliability....................................................................................................62
DecipheringtheFantasyReceiverHierarchy.......................................................................72
Conclusion............................................................................................................................81

3
INTRODUCTION
Quitepossiblythemostconsequentialparadigmshiftoverthepastfiveyearsasitrelatestodynastyfantasyfootballistheemergenceofthewidereceiverposition.Sensiblyenough,thereareamultitudeofreasonsforthis,includingbutnotlimitedtothefollowing:
• Theytendtolastlonger,andassuchtheytendtoputupnumbersforlonger–IfyousearchthroughtheearlyportionsofthemonthlyDLFADP,youwon’tfind(m)any27+runningbacksamongsttheranks.Thefactis,ballcarrierssimplyaren’texpectedtoplayintotheirlate20sorearly30s,andiftheydo,theexamplesarefewandfarbetweenforthosewhocontinuetopostelitenumbers.Transcendentreceivers,however,areadifferentbreed–justthispastyearalone,the30+trioofBrandonMarshall,CalvinJohnsonandLarryFitzgeraldallfinishedasPPRWR1performers.Giventherespectiveperiodsofexpectedlongevitybetweenthetwopositions,it’snotsurprisingpasscatchersareviewedasdynastyfoundationpieces.
• There’snosuchthingas“receiverbycommittee”–Only15runningbacksexceeded200carrieslastyear,andnotsurprisingly,onlysevenballcarrierswereabletosurpassthe1,000-yardbarrier.Thisisdownfrom13in2013/2014,16in2012,and15in2011.Astheleaguegraduallydevaluesthebellcowback,thefantasypointsaresoontofollow.Speakingof…
• Thepointdisparitybetweenreceiversandrunningbacksisnowachasm–In2015,26receiversscoredatleast200PPRpoints,withsixofthosesurpassingthetriplecenturymark.TheaveragepointtotalforthePPRTop-12receiverslastseasonwas306.7PPG.Asfortherunningbacks?Thosenumbersstoodat12,one,and232.9,respectively.Beitduetorelativeskilllevels,orperhapsmoreimportantlytheprevalenceofthePPRscoringsystem,receiversarebringinghomethebacon.
• Value,value,value–IfyoulookatjustaboutanymonthlyADPlistthere’sagoodchanceit’llbedominatedbyreceivers.Inanaveragestartupdraftit’snotunexpectedtosee10ofthefirst12picksusedonwide-outs,and75-80%ofthefirsttwostanzasslantedtowardsreceivers.Circlingbacktothebulletpointsabove,itmakessense–theyplaylonger,theyscoremorepoints,andtheydon’ttypicallyhavetoworryaboutpositionalcompetition.Forthesereasons,thereceiverpositionisnowviewedasthemostvaluableofall.
Giventhat,it’sprudenttodivemoredeeplyintowhatmakestheseguystick.Assuch,Ichosetodigintothe2015PPRTop-50receiverswiththevigorofasandcrabtryingtoescapeashovel-wieldingchildatthebeach.Includedwithinisametricallookatjustabouteveryaspectofeachreceiver’sfantasyscoring,hisefficiency,hisweeklyreliability,andevenaforayintohisreal-lifeNFLvalue.Someofthesemethodologiesmayappealtoyou,andothersmaynot,butattheendofthedayIwantedtocraftascompletealookateachplayerasIpossiblycould.Sowithoutfurtheradieu,I’llwrapthisupandgettoThe2016ReceiverWrap-Up!

4
AGGREGATETEAMPASSINGPRODUCTION
Asanyonewho’severreadmypreviousworkknows,I’mafirmbelieverthatrawstatssimplydon’ttellthewholestory.Thewayaplayerperformswithinthescopeofhisoffensenotonlyprovidesafullerglimpseintohisnumbers,butcanhelppredicthowthingsmightchangemovingforward.Whenitcomestothereceiverposition,thefirststepinattainingthisknowledgeislookingathowwellthepassingoffenseasawholeperformed.Shownbelowistheaggregatefantasyoutputprovidedbyeachofthe32NFLteams,brokendownintothefollowingscoringsystem:
• 0.1pointsperpassingyard• 1.0pointsperreception• 6.0pointsperpassingtouchdown
Inessence,whatI’vedoneismergeteampassingtotalswithreceiverscoring,givingamechanismtoprovidetotalreceivingoutputacrossallthepass-catchingpositions(receiver,runningback,tightend,andeventrickplays).Theshortofitisthateverypassingcompletioncontributedtotheaggregatetotals.SummarizedindescendingorderbyTotalPoints,thedataisshownbelow:
Team Attempts Completions TDs Yards TotalPoints FirstDownsNewOrleans 667 460 32 5205 1172.5 247SanDiego 667 442 30 4855 1107.5 230
NewEngland 629 404 36 4812 1101.2 229Detroit 632 420 33 4463 1064.3 236
NYGiants 623 392 36 4504 1058.4 208Arizona 562 353 35 4775 1040.5 237
Pittsburgh 590 391 26 4822 1029.2 207Jacksonville 607 355 35 4428 1007.8 215Baltimore 676 426 21 4449 996.9 211Atlanta 621 410 21 4602 996.2 230
Washington 555 386 30 4294 995.4 208Oakland 605 373 34 4129 989.9 193
Philadelphia 623 405 23 4341 977.1 193NYJets 604 362 33 4170 977.0 210Seattle 489 333 34 4061 943.1 190Houston 619 358 29 4079 939.9 210Miami 588 365 24 4231 932.1 194
Cincinnati 505 334 31 4104 930.4 191GreenBay 573 348 31 3825 916.5 173

5
Team Attempts Completions TDs Yards TotalPoints FirstDownsCleveland 609 371 20 4156 906.6 192Indianapolis 619 355 26 3928 903.8 195Denver 606 368 19 4216 903.6 201Carolina 501 300 35 3873 897.3 197Tennessee 551 342 25 3893 881.3 195TampaBay 535 312 22 4042 848.2 201Chicago 523 334 21 3843 844.3 177Dallas 528 334 16 3677 797.7 175Buffalo 465 295 23 3600 793.0 155
SanFrancisco 526 322 16 3646 782.6 154KansasCity 473 310 20 3493 779.3 155Minnesota 454 294 14 3246 702.6 153St.Louis 473 273 11 2931 632.1 126Sums 18298 11527 842 132693 29848.3 6288
Aswillbethecasewitheachsection,I’llsavethemajorityofmythoughtsfortheconcludingchapter.Butgiventhescopeoftheabove,thereareafewnuggetsI’llsharenow:
• 31of32teamshadatleastoneTop-50PPRreceiver.TheonlyteamnottoproduceaTop-50guywastheTennesseeTitans.
• Threeofthe32teamshadthreeTop-50PPRreceivers–Arizona,Pittsburgh,andSeattle.• Acrossall32teams,thetotalpercentagesofpointscameasfollows:
o 44.5%ofpointscamefromreceivingyardso 38.6%ofpointscamefromreceptionso 16.9%ofpointscamefromreceivingtouchdowns
Withthesenumbersinhand,it’snowtimetoconsidertherawnumbersforeachofthe2015PPRTop-50receivers.Pleasenotethatthisonlytakesreceivingstatisticsintoaccount,anddoesn’tdelveintorushingnumbersforeachplayer.Thevastmajorityoftimesthisdidn’tchangethenumberoffantasypointsaplayerscored,butinsomeinstances(JarvisLandry,MartavisBryant)thedifferencewasnon-negligible,andinothers(I’mlookingatyou,TavonAustin),itwasdramatic.Nevertheless,thisisanexerciseingaugingeachplayer’sreceivingability,andassuchI’llstaywithintheintendedscope.Thesenumbersareshownbelow:

6
Name Team Games Targets Receptions Yards Touchdowns PPRPoints FirstDownsAntonioBrown PIT 16 193 136 1,834 10 379.4 84JulioJones ATL 16 203 136 1,871 8 371.1 93
BrandonMarshall NYJ 16 173 109 1,502 14 343.2 76DeAndreHopkins HOU 16 192 111 1,521 11 329.1 83OdellBeckhamJr NYG 15 158 96 1,450 13 319.0 67AllenRobinson JAC 16 151 80 1,400 14 304.0 61LarryFitzgerald ARI 16 146 109 1,215 9 284.5 65
AJGreen CIN 16 132 86 1,297 10 275.7 63DemaryiusThomas DEN 16 177 105 1,304 6 271.4 63
DougBaldwin SEA 16 103 78 1,069 14 268.9 47CalvinJohnson DET 16 149 88 1,214 9 263.4 65EricDecker NYJ 15 132 80 1,027 12 254.7 60
BrandinCooks NO 16 129 84 1,140 9 252.0 45JarvisLandry MIA 16 167 111 1,159 4 250.9 60JeremyMaclin KC 15 124 87 1,088 8 243.8 49
JordanMatthews PHI 16 128 85 997 8 232.7 44MichaelCrabtree OAK 16 146 85 922 9 231.2 45
AllenHurns JAC 15 105 64 1,030 10 227.0 48EmmanuelSanders DEN 15 137 76 1,135 6 225.5 51SammyWatkins BUF 12 93 60 1,047 9 218.7 41AmariCooper OAK 16 130 72 1,070 6 215.0 45MikeEvans TB 14 145 74 1,208 3 212.8 63TYHilton IND 16 134 69 1,124 5 211.4 49
GoldenTate DET 16 129 90 813 6 207.3 50JohnBrown ARI 15 101 65 1,003 7 207.3 49KamarAiken BAL 15 126 75 944 5 199.4 53RandallCobb GB 16 129 79 829 6 197.9 42
TravisBenjamin CLE 16 125 68 966 5 194.6 39JamesJones GB 16 99 50 890 8 187.0 39WillieSnead NO 15 102 70 990 3 187.0 44PierreGarcon WAS 16 111 72 777 6 185.7 43RuebenRandle NYG 16 90 57 797 8 184.7 35TedGinnJr CAR 14 97 44 739 10 177.9 36
DonteMoncrief IND 16 105 64 733 6 173.3 40MichaelFloyd ARI 14 88 52 849 6 172.9 40JulianEdelman NE 9 88 61 692 7 172.2 37AnquanBoldin SF 14 111 69 789 4 171.9 35MarvinJones CIN 16 103 65 816 4 170.6 33
7
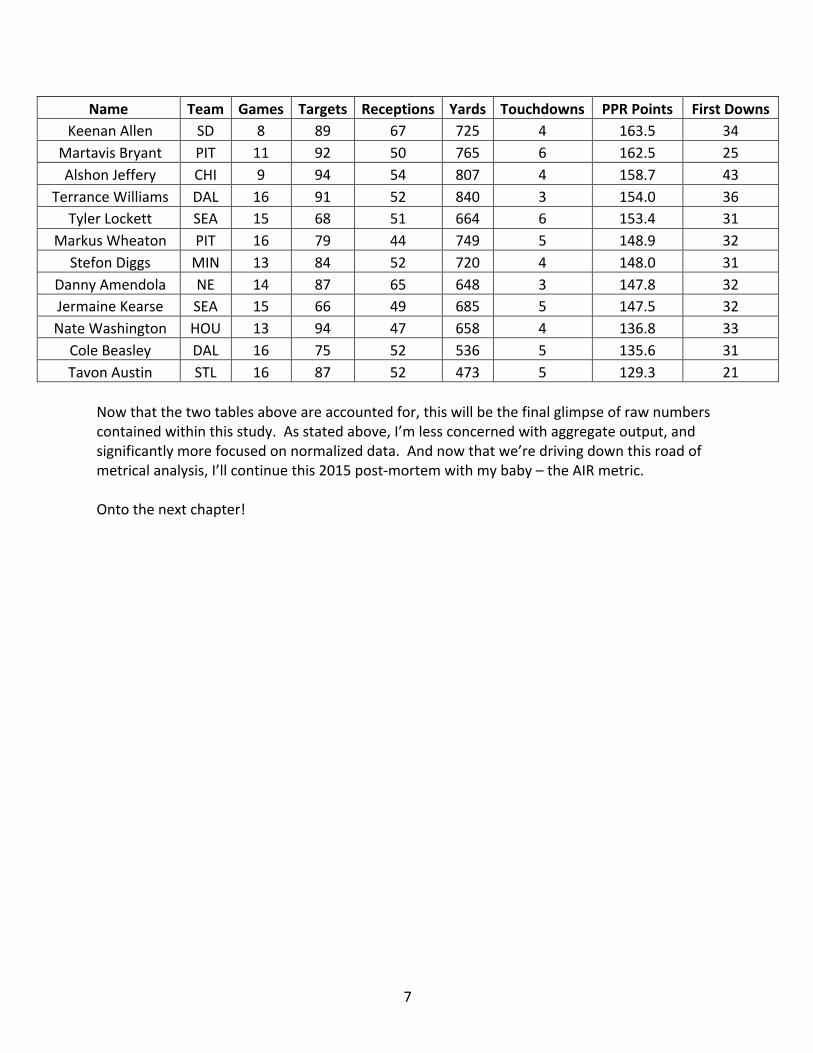
Name Team Games Targets Receptions Yards Touchdowns PPRPoints FirstDownsKeenanAllen SD 8 89 67 725 4 163.5 34
MartavisBryant PIT 11 92 50 765 6 162.5 25AlshonJeffery CHI 9 94 54 807 4 158.7 43
TerranceWilliams DAL 16 91 52 840 3 154.0 36TylerLockett SEA 15 68 51 664 6 153.4 31
MarkusWheaton PIT 16 79 44 749 5 148.9 32StefonDiggs MIN 13 84 52 720 4 148.0 31
DannyAmendola NE 14 87 65 648 3 147.8 32JermaineKearse SEA 15 66 49 685 5 147.5 32NateWashington HOU 13 94 47 658 4 136.8 33ColeBeasley DAL 16 75 52 536 5 135.6 31TavonAustin STL 16 87 52 473 5 129.3 21
Nowthatthetwotablesaboveareaccountedfor,thiswillbethefinalglimpseofrawnumberscontainedwithinthisstudy.Asstatedabove,I’mlessconcernedwithaggregateoutput,andsignificantlymorefocusedonnormalizeddata.Andnowthatwe’redrivingdownthisroadofmetricalanalysis,I’llcontinuethis2015post-mortemwithmybaby–theAIRmetric.Ontothenextchapter!

8
2015SEASONALANDAVERAGEAIRSCORES
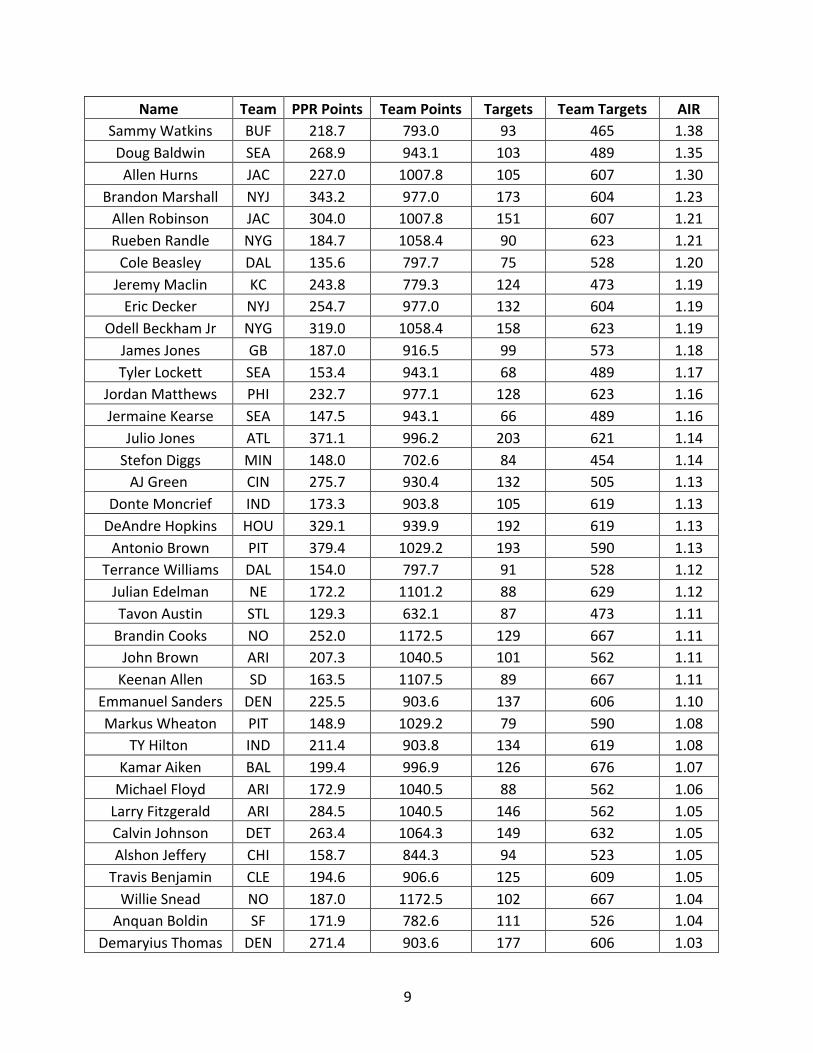
Intheearlyportionof2014,Iwastakingabreakfromactualscientificworkinordertodelvemoredeeplyintomymetaphoricalfantasylaboratory.Mygoalatthetimewassimple–findabetterwayofquantifyingexactlyhowefficientareceiverwasinafantasysetting.Thisneededtoeclipseamoretraditionalandstraightforwardanalysisof“pointspertarget”oreven“yardspertarget,”athoughtthatshouldbereinforcedbythefirsttableinChapterOne.Putsuccinctly,alloffenses,andmoreimportantlyallquarterbacks,arenotcreatedequal.Isitfairtopunishareceiver’soutputifhe’scatchingpassesfromabottom-tiersignalcaller?Conversely,couldaprolificoffensemakeareceiverseembetterthanhereallywas,therebymaskinganysortofunderlyingdeficiency?MyendresultforansweringthesequestionswastheAdjustedImprovementRatio,orAIRmetricforshort.Theformulaisrelativelysimple,andisshownbelow:AIR=(PlayerPPRPoints÷TeamPPRPoints)/(PlayerTargets÷TeamTargets)Byassessingaplayer’smarketshareofhisteam’sfantasypointsasafunctionofhisproportionoftheteam’stargets,thescopeoftheoffenseiseffectivelystabilized.Inotherwords,ifhereceived“bad”targets,that’sokay,becausesodidtherestoftheteam,andviceversawith“good”targets.Ifsaidtargetsledtomoreorlessfantasypoints,that’sregulatedaswell.Withoutsoundingoverlyarrogant,Ithinkit’sthebestwaytojudgeareceiver’strueefficiencybothwithinhisownoffense,andasacomparativemeasureforplayersindifferentoffenses.FormorebackgroundontheAIRmetric,theinitialworkcanbefoundhere.Ialsopreviouslyusedthismetrictochroniclethe2014rookiereceivers,assesstheTop-25PPRreceiversin2014(athreepartseriesfoundhere,hereandhere),andprovideacomprehensivelookattheTop-50PPRreceiversin2014.TheAIRmetricalsoplayedaconsequentialroleinmybreakdownsofOdellBeckham,AllenRobinsonandDemaryiusThomas.FellowDLFSeniorWriterGeorgeKritikoshasevenusedtheAIRmetrictomeasurethepasttworookiereceiverclasses,usingtheircollegenumbers(2015and2016classes).BeforeIgettothenumbersbelow,onelastbitonwhatthescoresmean.Ifaplayerbasicallyhittheaverageexpectancyforhisteam,andhisproportionsofhisteampointsandteamtargetswerethesame,hisAIRscorewouldbe1.00.Ifhewasbetterorworsethanexpected,hisAIRscorewouldeitherexceedorfallbelowtheaverage.Withthatexplanationinhand,let’stakealookattheAIRvaluesforthe2015PPRTop-50receivers,sortedinadescendingmanner:
9
Name Team PPRPoints TeamPoints Targets TeamTargets AIRSammyWatkins BUF 218.7 793.0 93 465 1.38DougBaldwin SEA 268.9 943.1 103 489 1.35AllenHurns JAC 227.0 1007.8 105 607 1.30
BrandonMarshall NYJ 343.2 977.0 173 604 1.23AllenRobinson JAC 304.0 1007.8 151 607 1.21RuebenRandle NYG 184.7 1058.4 90 623 1.21ColeBeasley DAL 135.6 797.7 75 528 1.20JeremyMaclin KC 243.8 779.3 124 473 1.19EricDecker NYJ 254.7 977.0 132 604 1.19
OdellBeckhamJr NYG 319.0 1058.4 158 623 1.19JamesJones GB 187.0 916.5 99 573 1.18TylerLockett SEA 153.4 943.1 68 489 1.17
JordanMatthews PHI 232.7 977.1 128 623 1.16JermaineKearse SEA 147.5 943.1 66 489 1.16
JulioJones ATL 371.1 996.2 203 621 1.14StefonDiggs MIN 148.0 702.6 84 454 1.14AJGreen CIN 275.7 930.4 132 505 1.13
DonteMoncrief IND 173.3 903.8 105 619 1.13DeAndreHopkins HOU 329.1 939.9 192 619 1.13AntonioBrown PIT 379.4 1029.2 193 590 1.13
TerranceWilliams DAL 154.0 797.7 91 528 1.12JulianEdelman NE 172.2 1101.2 88 629 1.12TavonAustin STL 129.3 632.1 87 473 1.11BrandinCooks NO 252.0 1172.5 129 667 1.11JohnBrown ARI 207.3 1040.5 101 562 1.11KeenanAllen SD 163.5 1107.5 89 667 1.11
EmmanuelSanders DEN 225.5 903.6 137 606 1.10MarkusWheaton PIT 148.9 1029.2 79 590 1.08
TYHilton IND 211.4 903.8 134 619 1.08KamarAiken BAL 199.4 996.9 126 676 1.07MichaelFloyd ARI 172.9 1040.5 88 562 1.06LarryFitzgerald ARI 284.5 1040.5 146 562 1.05CalvinJohnson DET 263.4 1064.3 149 632 1.05AlshonJeffery CHI 158.7 844.3 94 523 1.05TravisBenjamin CLE 194.6 906.6 125 609 1.05WillieSnead NO 187.0 1172.5 102 667 1.04AnquanBoldin SF 171.9 782.6 111 526 1.04
DemaryiusThomas DEN 271.4 903.6 177 606 1.03

10
Name Team PPRPoints TeamPoints Targets TeamTargets AIRTedGinnJr CAR 177.9 897.3 97 501 1.02
MartavisBryant PIT 162.5 1029.2 92 590 1.01AmariCooper OAK 215.0 989.9 130 605 1.01
DannyAmendola NE 147.8 1101.2 87 629 0.97MichaelCrabtree OAK 231.2 989.9 146 605 0.97RandallCobb GB 197.9 916.5 129 573 0.96
NateWashington HOU 136.8 939.9 94 619 0.96GoldenTate DET 207.3 1064.3 129 632 0.95JarvisLandry MIA 250.9 932.1 167 588 0.95PierreGarcon WAS 185.7 995.4 111 555 0.93MikeEvans TB 212.8 848.2 145 535 0.93MarvinJones CIN 170.6 930.4 103 505 0.90
Notshockingly,themajorityoftheplayerslistedcheckedinabovetheaverageAIRexpectancyof1.00.AstheseweretheTop-50fantasyreceiversof2015,theexpectationisthatnotonlywouldtheyscoreadecentchunkofpoints,buttheywoulddosoinalargelyefficientmanner.I’llgetintotheminutiaeofhowexactlytheyscoredthesepointsabitlater,helpingtoclarifyandexplainwhatwentrightorwrong,andhowthenumbersmightserveaspredictorsmovingforward.Beforethat,however,Iwantedtodrilldownfromtheseasonalsamplesizeandfocusoneachweeklyoutputasasingulardatapoint,inanefforttoeffectivelylookateachplayer’syearthatwasasmulti-chapteredstoryversusauniformcollectionofinformation.Asittookmenearly15minutestofigureouthowtowordthatsentencealone,I’mnotsurprisediftheconceptseemsconfusingatfirst.Letmetrytoexplain.WhenIcalculateAIRmetricsforeachreceiveroverthecourseoftheyear,Ipaynoattentiontoanythingotherthantheaggregatenumbers.Ifaplayerhad150targets,Idon’thonestlycareifhehadtwogameswith16+targetsandfourgameswithfourorfewertargets.Thesamecanbeappliedtoreceptions,yards,andscores–overthecourseofhowevermanygamesaplayercontributedin,heestablishedanadditivebottomlineofpertinentstatistics.Thesamecanbesaidforthepassingoffenseasawhole,withregardstototalpassingattemptsandtotalPPRpointsprovidedtothepasscatchers.Asanexample,AntonioBrownhadanAIRscoreof1.13becauseoverthecourseoftheseasonhehad379.4oftheteam’s1029.2PPRpoints,and193ofthe590targets.WhatwealsoknowaboutMr.Brownisthatwhilehehadnumerousweeksofhighendscoring,healsohadafewdownweekswhilequarterbackBenRoethlisbergerwasinjured.Thesumofitallstillyieldedarobustfantasyoutputandaboveaverageefficiency,butthedetailsofhowitwentdownonaweeklybasisgotlost.Giventhat,Ideemeditprudenttolookintoeverygametogleanabettersenseofconsistency–assuch,AverageAIRwasborn.

11
Theconcepthereissimple.SinceAIRscoresultimatelyboildowntofantasypointsandpassingattempts,thesamplesizeiswhateverthecreatormakesit.Mystandardmethodology,shownearlierinthischapter,istoviewitbyyear,butasdescribedinthepreviousparagraphsitalsomakessensetochartAIRscoresonaweeklybasis.Oncetheseweeklyvaluesarecalculated,however,thebiggestleapoffaithinvolvesthrowingouttheweeklyworkload.Yes,agamewhereareceiverhas15targetsisgoingtobemoreimpactfultohisoffense(andthefantasybottomline)thanagamewherehehasthreetargets,there’snowayaroundthat.It’salsogoingtoaccountforalargerproportionofthereceiver’sseasonalAIRmetric,sincethestatisticisvolume-based.Thisiscertainlyimportant,butit’salreadyaccountedforintheAIRscoresshownabove.Iwanttodigdeeper.Ifvolumeisignored,andeachweeklyscoreisaveraged(seetheAddendumforalistingoftheseweeklyvalues),wecangainaclearerpicture.Forexample,areceivercouldhavebeenbelowaveragemostweeks,butifhewasefficientinhishigh-targetgames,hisseasonalAIRscorewilllikelyremainrelativelyhigh.Conversely,ifaplayerwasaboveaveragemostweeksbutsufferedinhishigh-volumeaffairs,hisseasonalAIRscorewoulddiminish.WhenIputtogetherlastyear’sAIRAffair,IwrotethefollowingabouttheAverageAIRcalculation:“Thethoughtprocesshereistodeterminetheeffectheavy-volumegameshadonareceiver’sseasonalAIRvalue(eachplayer’svolumeisreflectedinthedenominatoroftheAIRcalculation).Inotherwords,didcertainplayerseitherbenefit(theirhighestvolumegameshadlargeweeklyAIRvalues)orsuffer(theirhighestvolumegameshadsmallweeklyAIRvalues)fromsingledatapoints?IftheWeeklyAIRvalue(volumeneglected)islargerthantheSeasonalAIRvalue,itstandstoreasontheplayersufferedfromhighvolumegamesasdescribedabove.Conversely,iftheWeeklyAIRvalueislowerthantheSeasonalAIRvalue,itstandstoreasontheplayerbenefitedfromhighvolumegamesasdescribedabove.Ideally,theplayer’sWeeklyAIRvaluewillbehigherthanhisSeasonalAIRvalue.”
Tothatlastsentence,I’mnothonestlysureifthat’strue.Yes,I’dliketohaveaplayerthat“winsweeks”withefficiency,butI’dalsoliketoseehimdoitwithaheavyworkload.Ofcourse,regardlessoftheworkload,I’dliketoseehim“winweeks”…period.SowhileI’dstillleantowardsmy2015words,especiallyasitmightrelatetoapredictionofthefuture,ultimatelythenumbersarewhattheyare,you’refreetodrawyourownconclusions.ThetablebelowshowstheAverageAIRvalues,sortedinadescendingmanner:

12
Name Team Games AverageAIRAllenHurns JAX 15 1.35DougBaldwin SEA 16 1.29EricDecker NYJ 15 1.27
SammyWatkins BUF 13 1.24BrandonMarshall NYJ 16 1.22RuebenRandle NYG 16 1.22OdellBeckham NYG 15 1.20DonteMoncrief IND 16 1.19AllenRobinson JAX 16 1.18JeremyMaclin KC 15 1.18
TerranceWilliams DAL 16 1.18JohnBrown AZ 15 1.16TedGinn CAR 14 1.15
JamesJones GB 16 1.14StefonDiggs MIN 13 1.14AJGreen CIN 16 1.14JulioJones ATL 16 1.12
TravisBenjamin CLE 16 1.12BrandinCooks NO 16 1.11
JordanMatthews PHI 16 1.11DeAndreHopkins HOU 16 1.10JulianEdelman NE 9 1.08LarryFitzgerald AZ 16 1.07MarkusWheaton PIT 16 1.07AntonioBrown PIT 16 1.06
DemaryiusThomas DEN 16 1.06WillieSnead NO 15 1.06AnquanBoldin SF 14 1.05
TYHilton IND 16 1.05PierreGarcon WSH 16 1.04ColeBeasley DAL 16 1.03
EmmanuelSanders DEN 15 1.03JermaineKearse SEA 16 1.03AlshonJeffery CHI 9 1.02CalvinJohnson DET 16 1.02GoldenTate DET 16 1.00KamarAiken BAL 16 1.00KeenanAllen SD 8 0.99

13
Name Team Games AverageAIRTavonAustin STL 16 0.99
MichaelCrabtree OAK 16 0.98TylerLockett SEA 16 0.97AmariCooper OAK 16 0.96MichaelFloyd AZ 15 0.96
NateWashington HOU 13 0.95DannyAmendola NE 14 0.94RandallCobb GB 16 0.94JarvisLandry MIA 16 0.93
MartavisBryant PIT 11 0.93MikeEvans TB 15 0.88MarvinJones CIN 16 0.85
Withbothsetsofdatainhand,wecannowviewthedifferencebetweenthetwo.SincethefocusisnowonAverageAIR,we’lltakethatvalueandsubtracttheseasonalAIRvaluefromit,illustratingthedifferences.Theyaresortedbelowinadescendingmanner:
Name Team Games AverageAIR AIR DifferenceTedGinn CAR 14 1.15 1.02 0.13
PierreGarcon WSH 16 1.04 0.93 0.11EricDecker NYJ 15 1.27 1.19 0.08
TravisBenjamin CLE 16 1.12 1.05 0.07TerranceWilliams DAL 16 1.18 1.12 0.06DonteMoncrief IND 16 1.19 1.13 0.06JohnBrown AZ 15 1.16 1.11 0.05AllenHurns JAX 15 1.35 1.30 0.05GoldenTate DET 16 1.00 0.95 0.05
DemaryiusThomas DEN 16 1.06 1.03 0.03LarryFitzgerald AZ 16 1.07 1.05 0.02WillieSnead NO 15 1.06 1.04 0.02
MichaelCrabtree OAK 16 0.98 0.97 0.01RuebenRandle NYG 16 1.22 1.21 0.01OdellBeckham NYG 15 1.20 1.19 0.01AnquanBoldin SF 14 1.05 1.04 0.01
AJGreen CIN 16 1.14 1.13 0.01StefonDiggs MIN 13 1.14 1.14 0.00BrandinCooks NO 16 1.11 1.11 0.00
BrandonMarshall NYJ 16 1.22 1.23 -0.01

14
Name Team Games AverageAIR AIR DifferenceNateWashington HOU 13 0.95 0.96 -0.01MarkusWheaton PIT 16 1.07 1.08 -0.01JeremyMaclin KC 15 1.18 1.19 -0.01JarvisLandry MIA 16 0.93 0.95 -0.02RandallCobb GB 16 0.94 0.96 -0.02JulioJones ATL 16 1.12 1.14 -0.02
AlshonJeffery CHI 9 1.02 1.05 -0.03DeAndreHopkins HOU 16 1.10 1.13 -0.03CalvinJohnson DET 16 1.02 1.05 -0.03DannyAmendola NE 14 0.94 0.97 -0.03
TYHilton IND 16 1.05 1.08 -0.03AllenRobinson JAX 16 1.18 1.21 -0.03JulianEdelman NE 9 1.08 1.12 -0.04JamesJones GB 16 1.14 1.18 -0.04MikeEvans TB 15 0.88 0.93 -0.05MarvinJones CIN 16 0.85 0.90 -0.05
JordanMatthews PHI 16 1.11 1.16 -0.05AmariCooper OAK 16 0.96 1.01 -0.05DougBaldwin SEA 16 1.29 1.35 -0.06AntonioBrown PIT 16 1.06 1.13 -0.07KamarAiken BAL 16 1.00 1.07 -0.07
EmmanuelSanders DEN 15 1.03 1.10 -0.07MartavisBryant PIT 11 0.93 1.01 -0.08MichaelFloyd AZ 15 0.96 1.06 -0.10KeenanAllen SD 8 0.99 1.11 -0.12TavonAustin STL 16 0.99 1.11 -0.12
JermaineKearse SEA 16 1.03 1.16 -0.13SammyWatkins BUF 13 1.24 1.38 -0.14ColeBeasley DAL 16 1.03 1.20 -0.17TylerLockett SEA 16 0.97 1.17 -0.20
Onceagain,youcandrawyourownconclusionsfromtheabove.Personally,I’dprefertheplayersatthetopportionofthelist,astheyappeartoshowmoreconsistencyonaweeklybasis,regardlessofvolume.Butrationalmindsmaydiffer.Speakingtothatconsistency–ontothenextchapter!
15
2015WEEKLYAIRTIERPERCENTAGES
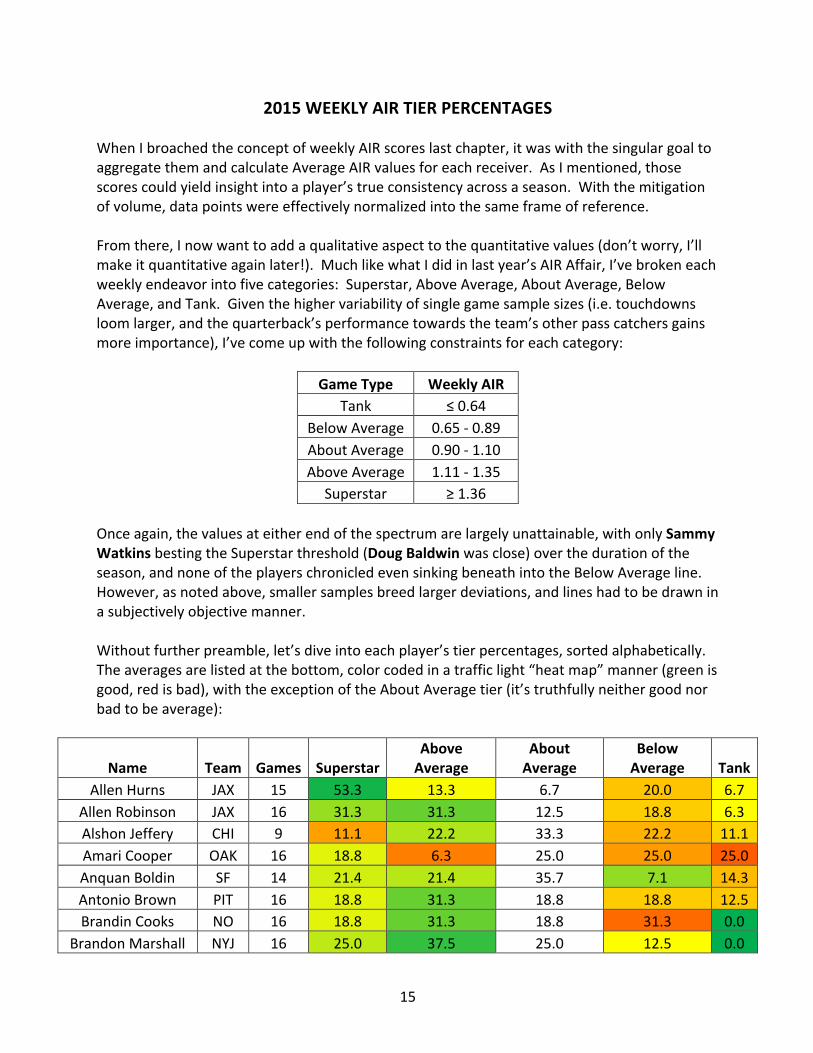
WhenIbroachedtheconceptofweeklyAIRscoreslastchapter,itwaswiththesingulargoaltoaggregatethemandcalculateAverageAIRvaluesforeachreceiver.AsImentioned,thosescorescouldyieldinsightintoaplayer’strueconsistencyacrossaseason.Withthemitigationofvolume,datapointswereeffectivelynormalizedintothesameframeofreference.Fromthere,Inowwanttoaddaqualitativeaspecttothequantitativevalues(don’tworry,I’llmakeitquantitativeagainlater!).MuchlikewhatIdidinlastyear’sAIRAffair,I’vebrokeneachweeklyendeavorintofivecategories:Superstar,AboveAverage,AboutAverage,BelowAverage,andTank.Giventhehighervariabilityofsinglegamesamplesizes(i.e.touchdownsloomlarger,andthequarterback’sperformancetowardstheteam’sotherpasscatchersgainsmoreimportance),I’vecomeupwiththefollowingconstraintsforeachcategory:
GameType WeeklyAIRTank ≤0.64
BelowAverage 0.65-0.89AboutAverage 0.90-1.10AboveAverage 1.11-1.35
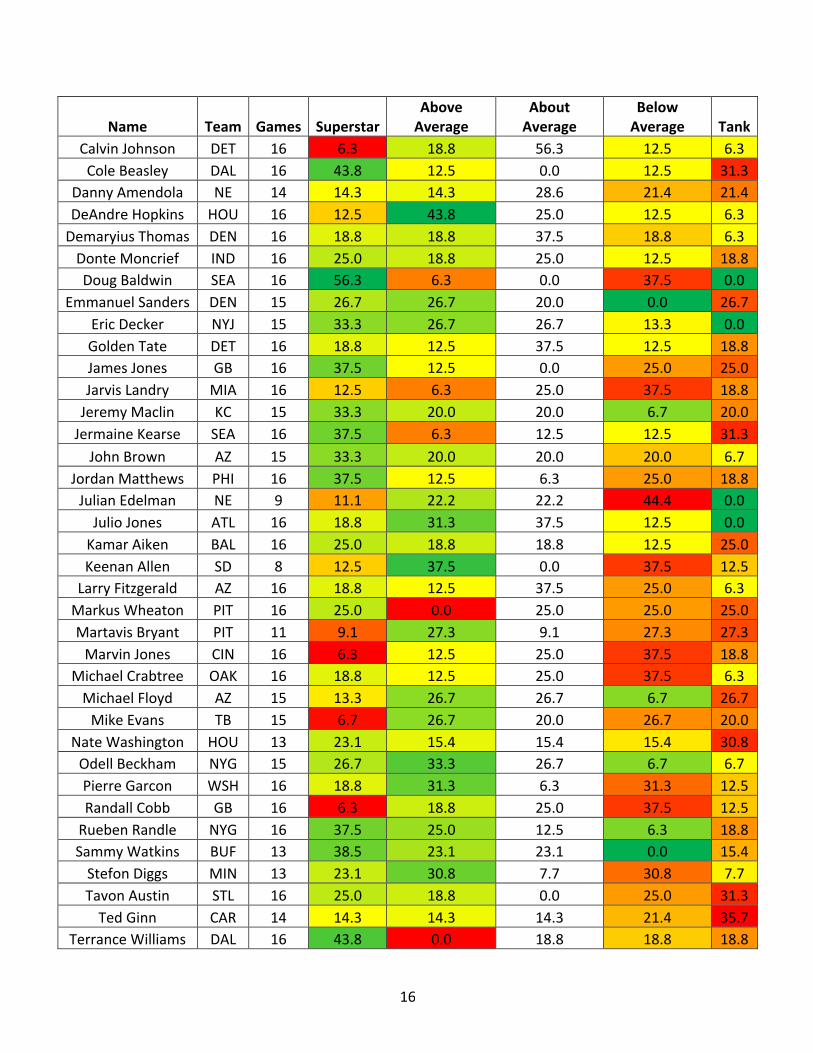
Superstar ≥1.36Onceagain,thevaluesateitherendofthespectrumarelargelyunattainable,withonlySammyWatkinsbestingtheSuperstarthreshold(DougBaldwinwasclose)overthedurationoftheseason,andnoneoftheplayerschronicledevensinkingbeneathintotheBelowAverageline.However,asnotedabove,smallersamplesbreedlargerdeviations,andlineshadtobedrawninasubjectivelyobjectivemanner.Withoutfurtherpreamble,let’sdiveintoeachplayer’stierpercentages,sortedalphabetically.Theaveragesarelistedatthebottom,colorcodedinatrafficlight“heatmap”manner(greenisgood,redisbad),withtheexceptionoftheAboutAveragetier(it’struthfullyneithergoodnorbadtobeaverage):
Name Team Games SuperstarAboveAverage
AboutAverage
BelowAverage Tank
AllenHurns JAX 15 53.3 13.3 6.7 20.0 6.7AllenRobinson JAX 16 31.3 31.3 12.5 18.8 6.3AlshonJeffery CHI 9 11.1 22.2 33.3 22.2 11.1AmariCooper OAK 16 18.8 6.3 25.0 25.0 25.0AnquanBoldin SF 14 21.4 21.4 35.7 7.1 14.3AntonioBrown PIT 16 18.8 31.3 18.8 18.8 12.5BrandinCooks NO 16 18.8 31.3 18.8 31.3 0.0
BrandonMarshall NYJ 16 25.0 37.5 25.0 12.5 0.0
16
Name Team Games SuperstarAboveAverage
AboutAverage
BelowAverage Tank
CalvinJohnson DET 16 6.3 18.8 56.3 12.5 6.3ColeBeasley DAL 16 43.8 12.5 0.0 12.5 31.3
DannyAmendola NE 14 14.3 14.3 28.6 21.4 21.4DeAndreHopkins HOU 16 12.5 43.8 25.0 12.5 6.3DemaryiusThomas DEN 16 18.8 18.8 37.5 18.8 6.3DonteMoncrief IND 16 25.0 18.8 25.0 12.5 18.8DougBaldwin SEA 16 56.3 6.3 0.0 37.5 0.0
EmmanuelSanders DEN 15 26.7 26.7 20.0 0.0 26.7EricDecker NYJ 15 33.3 26.7 26.7 13.3 0.0GoldenTate DET 16 18.8 12.5 37.5 12.5 18.8JamesJones GB 16 37.5 12.5 0.0 25.0 25.0JarvisLandry MIA 16 12.5 6.3 25.0 37.5 18.8JeremyMaclin KC 15 33.3 20.0 20.0 6.7 20.0JermaineKearse SEA 16 37.5 6.3 12.5 12.5 31.3JohnBrown AZ 15 33.3 20.0 20.0 20.0 6.7
JordanMatthews PHI 16 37.5 12.5 6.3 25.0 18.8JulianEdelman NE 9 11.1 22.2 22.2 44.4 0.0JulioJones ATL 16 18.8 31.3 37.5 12.5 0.0KamarAiken BAL 16 25.0 18.8 18.8 12.5 25.0KeenanAllen SD 8 12.5 37.5 0.0 37.5 12.5LarryFitzgerald AZ 16 18.8 12.5 37.5 25.0 6.3MarkusWheaton PIT 16 25.0 0.0 25.0 25.0 25.0MartavisBryant PIT 11 9.1 27.3 9.1 27.3 27.3MarvinJones CIN 16 6.3 12.5 25.0 37.5 18.8
MichaelCrabtree OAK 16 18.8 12.5 25.0 37.5 6.3MichaelFloyd AZ 15 13.3 26.7 26.7 6.7 26.7MikeEvans TB 15 6.7 26.7 20.0 26.7 20.0
NateWashington HOU 13 23.1 15.4 15.4 15.4 30.8OdellBeckham NYG 15 26.7 33.3 26.7 6.7 6.7PierreGarcon WSH 16 18.8 31.3 6.3 31.3 12.5RandallCobb GB 16 6.3 18.8 25.0 37.5 12.5RuebenRandle NYG 16 37.5 25.0 12.5 6.3 18.8SammyWatkins BUF 13 38.5 23.1 23.1 0.0 15.4StefonDiggs MIN 13 23.1 30.8 7.7 30.8 7.7TavonAustin STL 16 25.0 18.8 0.0 25.0 31.3TedGinn CAR 14 14.3 14.3 14.3 21.4 35.7
TerranceWilliams DAL 16 43.8 0.0 18.8 18.8 18.8
17
Name Team Games SuperstarAboveAverage
AboutAverage
BelowAverage Tank
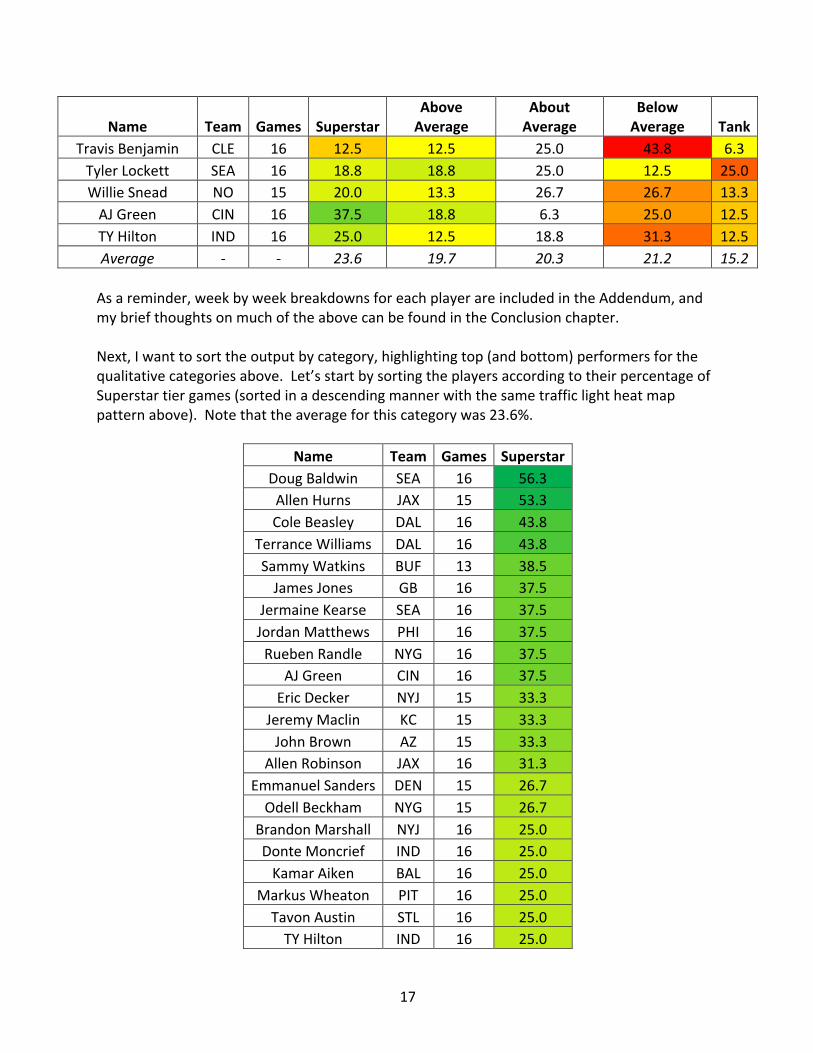
TravisBenjamin CLE 16 12.5 12.5 25.0 43.8 6.3TylerLockett SEA 16 18.8 18.8 25.0 12.5 25.0WillieSnead NO 15 20.0 13.3 26.7 26.7 13.3AJGreen CIN 16 37.5 18.8 6.3 25.0 12.5TYHilton IND 16 25.0 12.5 18.8 31.3 12.5Average - - 23.6 19.7 20.3 21.2 15.2Asareminder,weekbyweekbreakdownsforeachplayerareincludedintheAddendum,andmybriefthoughtsonmuchoftheabovecanbefoundintheConclusionchapter.Next,Iwanttosorttheoutputbycategory,highlightingtop(andbottom)performersforthequalitativecategoriesabove.Let’sstartbysortingtheplayersaccordingtotheirpercentageofSuperstartiergames(sortedinadescendingmannerwiththesametrafficlightheatmappatternabove).Notethattheaverageforthiscategorywas23.6%.
Name Team Games SuperstarDougBaldwin SEA 16 56.3AllenHurns JAX 15 53.3ColeBeasley DAL 16 43.8
TerranceWilliams DAL 16 43.8SammyWatkins BUF 13 38.5JamesJones GB 16 37.5
JermaineKearse SEA 16 37.5JordanMatthews PHI 16 37.5RuebenRandle NYG 16 37.5
AJGreen CIN 16 37.5EricDecker NYJ 15 33.3
JeremyMaclin KC 15 33.3JohnBrown AZ 15 33.3
AllenRobinson JAX 16 31.3EmmanuelSanders DEN 15 26.7OdellBeckham NYG 15 26.7
BrandonMarshall NYJ 16 25.0DonteMoncrief IND 16 25.0KamarAiken BAL 16 25.0
MarkusWheaton PIT 16 25.0TavonAustin STL 16 25.0TYHilton IND 16 25.0
18
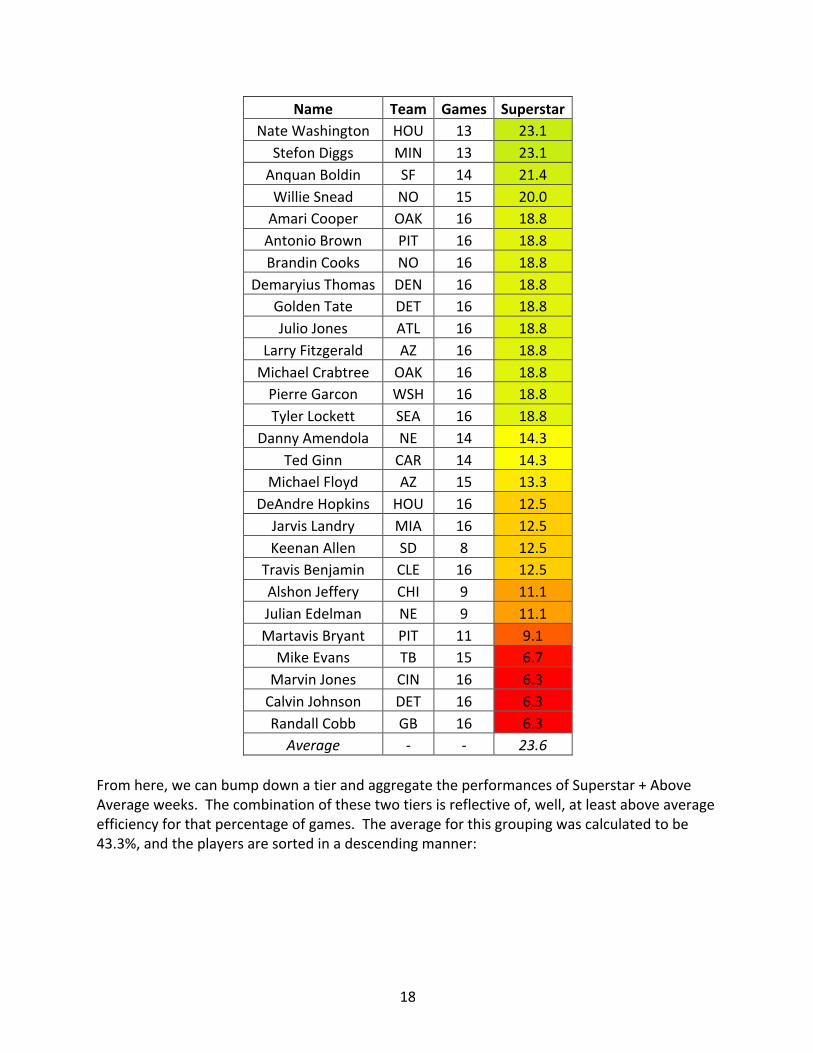
Name Team Games SuperstarNateWashington HOU 13 23.1
StefonDiggs MIN 13 23.1AnquanBoldin SF 14 21.4WillieSnead NO 15 20.0AmariCooper OAK 16 18.8AntonioBrown PIT 16 18.8BrandinCooks NO 16 18.8
DemaryiusThomas DEN 16 18.8GoldenTate DET 16 18.8JulioJones ATL 16 18.8
LarryFitzgerald AZ 16 18.8MichaelCrabtree OAK 16 18.8PierreGarcon WSH 16 18.8TylerLockett SEA 16 18.8
DannyAmendola NE 14 14.3TedGinn CAR 14 14.3
MichaelFloyd AZ 15 13.3DeAndreHopkins HOU 16 12.5JarvisLandry MIA 16 12.5KeenanAllen SD 8 12.5
TravisBenjamin CLE 16 12.5AlshonJeffery CHI 9 11.1JulianEdelman NE 9 11.1MartavisBryant PIT 11 9.1MikeEvans TB 15 6.7MarvinJones CIN 16 6.3CalvinJohnson DET 16 6.3RandallCobb GB 16 6.3Average - - 23.6
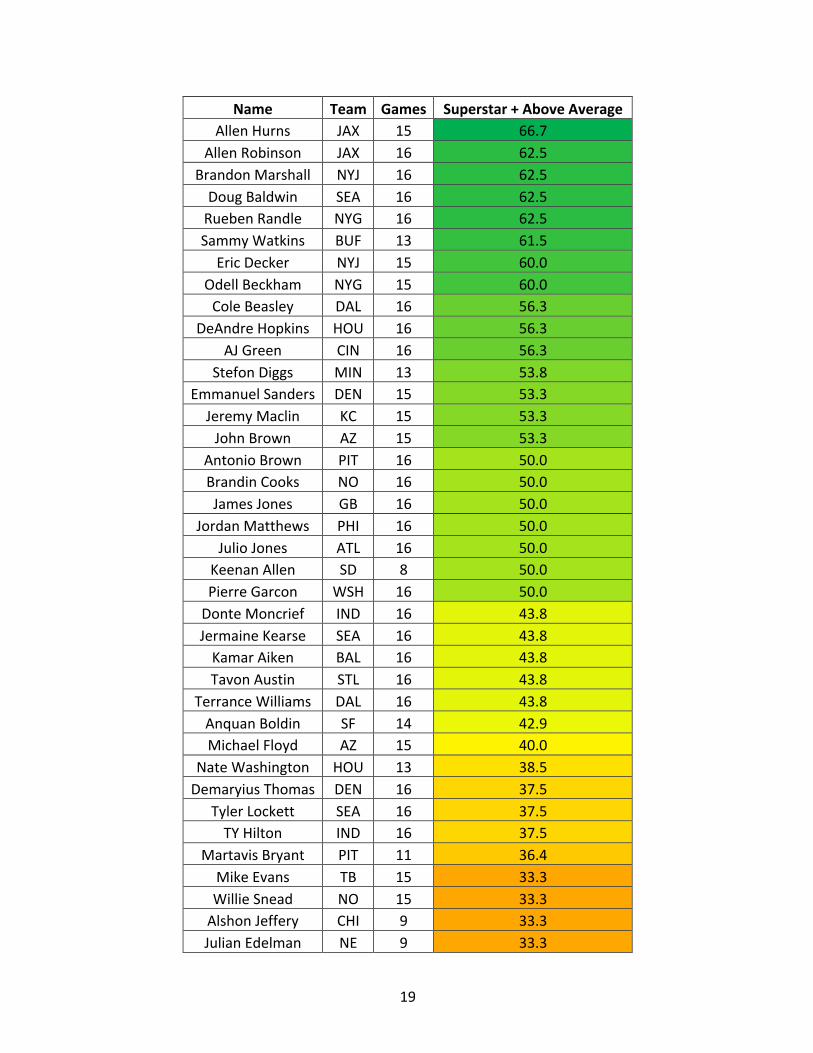
Fromhere,wecanbumpdownatierandaggregatetheperformancesofSuperstar+AboveAverageweeks.Thecombinationofthesetwotiersisreflectiveof,well,atleastaboveaverageefficiencyforthatpercentageofgames.Theaverageforthisgroupingwascalculatedtobe43.3%,andtheplayersaresortedinadescendingmanner:
19
Name Team Games Superstar+AboveAverageAllenHurns JAX 15 66.7
AllenRobinson JAX 16 62.5BrandonMarshall NYJ 16 62.5DougBaldwin SEA 16 62.5RuebenRandle NYG 16 62.5SammyWatkins BUF 13 61.5EricDecker NYJ 15 60.0
OdellBeckham NYG 15 60.0ColeBeasley DAL 16 56.3
DeAndreHopkins HOU 16 56.3AJGreen CIN 16 56.3
StefonDiggs MIN 13 53.8EmmanuelSanders DEN 15 53.3JeremyMaclin KC 15 53.3JohnBrown AZ 15 53.3
AntonioBrown PIT 16 50.0BrandinCooks NO 16 50.0JamesJones GB 16 50.0
JordanMatthews PHI 16 50.0JulioJones ATL 16 50.0
KeenanAllen SD 8 50.0PierreGarcon WSH 16 50.0DonteMoncrief IND 16 43.8JermaineKearse SEA 16 43.8KamarAiken BAL 16 43.8TavonAustin STL 16 43.8
TerranceWilliams DAL 16 43.8AnquanBoldin SF 14 42.9MichaelFloyd AZ 15 40.0
NateWashington HOU 13 38.5DemaryiusThomas DEN 16 37.5
TylerLockett SEA 16 37.5TYHilton IND 16 37.5
MartavisBryant PIT 11 36.4MikeEvans TB 15 33.3WillieSnead NO 15 33.3AlshonJeffery CHI 9 33.3JulianEdelman NE 9 33.3

20
Name Team Games Superstar+AboveAverageGoldenTate DET 16 31.3
LarryFitzgerald AZ 16 31.3MichaelCrabtree OAK 16 31.3DannyAmendola NE 14 28.6
TedGinn CAR 14 28.6AmariCooper OAK 16 25.0CalvinJohnson DET 16 25.0
MarkusWheaton PIT 16 25.0RandallCobb GB 16 25.0
TravisBenjamin CLE 16 25.0MarvinJones CIN 16 18.8JarvisLandry MIA 16 18.8Average - - 43.3
Takingitonestepfurther,I’llnowdropdownonemoretierlevel,summingupthepercentagesofSuperstar+AboveAverage+AboutAverageperformances.Inotherwords,thetablebelow(heatmap,trafficlight,descendingmanner,etc.)showsthepercentageofgameseachplayereffectivelydidthebareminimumthatwasexpectedofhim.Theaverageforthisgroupingwastabulatedtobe63.6%,avaluethatshouldn’tcomeasmuchofasurprise–remember,thisisthecreamofthecropwe’retalkingabouthere,sotheyshouldbeaverageorbetterforthemajorityofthetime:
Name Team Games Superstar+Above/AboutAverageBrandonMarshall NYJ 16 87.5
JulioJones ATL 16 87.5EricDecker NYJ 15 86.7
OdellBeckham NYG 15 86.7SammyWatkins BUF 13 84.6CalvinJohnson DET 16 81.3
DeAndreHopkins HOU 16 81.3AnquanBoldin SF 14 78.6AllenRobinson JAX 16 75.0
DemaryiusThomas DEN 16 75.0RuebenRandle NYG 16 75.0AllenHurns JAX 15 73.3
EmmanuelSanders DEN 15 73.3JeremyMaclin KC 15 73.3JohnBrown AZ 15 73.3
AntonioBrown PIT 16 68.8

21
Name Team Games Superstar+Above/AboutAverageBrandinCooks NO 16 68.8DonteMoncrief IND 16 68.8GoldenTate DET 16 68.8
LarryFitzgerald AZ 16 68.8MichaelFloyd AZ 15 66.7AlshonJeffery CHI 9 66.7DougBaldwin SEA 16 62.5KamarAiken BAL 16 62.5
TerranceWilliams DAL 16 62.5TylerLockett SEA 16 62.5AJGreen CIN 16 62.5
StefonDiggs MIN 13 61.5WillieSnead NO 15 60.0
DannyAmendola NE 14 57.1ColeBeasley DAL 16 56.3
JermaineKearse SEA 16 56.3JordanMatthews PHI 16 56.3MichaelCrabtree OAK 16 56.3PierreGarcon WSH 16 56.3TYHilton IND 16 56.3
JulianEdelman NE 9 55.6NateWashington HOU 13 53.8
MikeEvans TB 15 53.3AmariCooper OAK 16 50.0JamesJones GB 16 50.0KeenanAllen SD 8 50.0
MarkusWheaton PIT 16 50.0RandallCobb GB 16 50.0
TravisBenjamin CLE 16 50.0MartavisBryant PIT 11 45.5MarvinJones CIN 16 43.8JarvisLandry MIA 16 43.8TavonAustin STL 16 43.8TedGinn CAR 14 42.9Average - - 63.6
Fromthispointonwecansegueintotheunderwhelmingweeks.There’struthfullynopointinsumminguptheBelowAverage+Tankgames,asit’smerelythetableabove,withthevalues

22
reading“100–[Rightmostcolumnvalue],”andtheorderunchanging.InsteadI’llcapthissectionoffbyaggregatingthepercentagesofTankperformancesforeachplayer.AsthemirrorimageoftheSuperstartier,thismeansthatforthepercentagesofgamesbelow,theplayerwaseffectivelytankinghisteam’sfantasyeffortswithbottombarrelefficiency.Putanotherway,inorderfortheplayertobesuccessfulduringthoseweeks,hewould’veneededaboatloadofvolumetomitigatehisper-targetwoes.Theaverageforthisgroupwasfoundtobe15.2%,andthevaluesaresortedinanascendingmannerasshownbelow:
Name Team Games TankBrandinCooks NO 16 0.0
BrandonMarshall NYJ 16 0.0DougBaldwin SEA 16 0.0EricDecker NYJ 15 0.0
JulianEdelman NE 9 0.0JulioJones ATL 16 0.0
AllenRobinson JAX 16 6.3CalvinJohnson DET 16 6.3
DeAndreHopkins HOU 16 6.3DemaryiusThomas DEN 16 6.3LarryFitzgerald AZ 16 6.3MichaelCrabtree OAK 16 6.3TravisBenjamin CLE 16 6.3AllenHurns JAX 15 6.7JohnBrown AZ 15 6.7
OdellBeckham NYG 15 6.7StefonDiggs MIN 13 7.7AlshonJeffery CHI 9 11.1AntonioBrown PIT 16 12.5KeenanAllen SD 8 12.5PierreGarcon WSH 16 12.5RandallCobb GB 16 12.5AJGreen CIN 16 12.5TYHilton IND 16 12.5
WillieSnead NO 15 13.3AnquanBoldin SF 14 14.3SammyWatkins BUF 13 15.4DonteMoncrief IND 16 18.8GoldenTate DET 16 18.8JarvisLandry MIA 16 18.8
JordanMatthews PHI 16 18.8

23
Name Team Games TankMarvinJones CIN 16 18.8RuebenRandle NYG 16 18.8
TerranceWilliams DAL 16 18.8JeremyMaclin KC 15 20.0MikeEvans TB 15 20.0
DannyAmendola NE 14 21.4AmariCooper OAK 16 25.0JamesJones GB 16 25.0KamarAiken BAL 16 25.0
MarkusWheaton PIT 16 25.0TylerLockett SEA 16 25.0
EmmanuelSanders DEN 15 26.7MichaelFloyd AZ 15 26.7MartavisBryant PIT 11 27.3NateWashington HOU 13 30.8ColeBeasley DAL 16 31.3
JermaineKearse SEA 16 31.3TavonAustin STL 16 31.3TedGinn CAR 14 35.7Average - - 15.2
Withthattableinhand,thischapterisnowinthe(figurativeandliteral)books.Fearnot,theAIRmetricwillreturnlater,butInowwanttotransitionintoatopicthatoftengetslostwhenwetalkaboutfantasyproficiency–howgoodisaplayerinreallife?Ontothenextchapter!
24
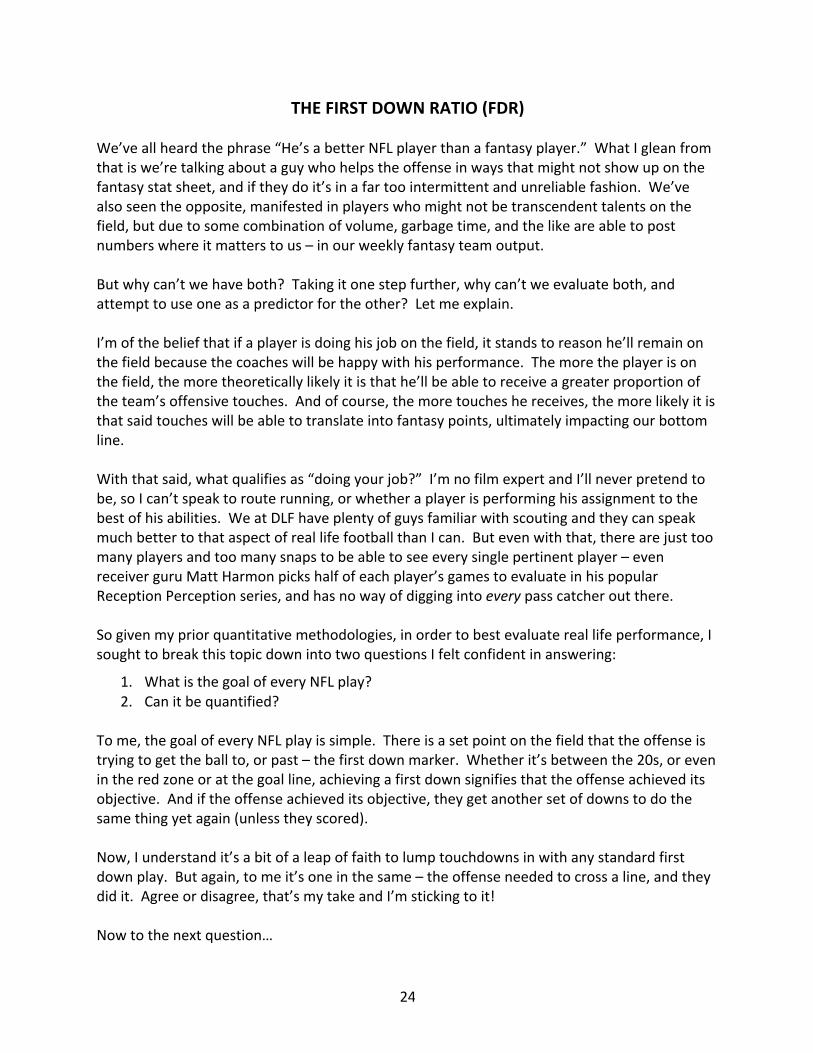
THEFIRSTDOWNRATIO(FDR)
We’veallheardthephrase“He’sabetterNFLplayerthanafantasyplayer.”WhatIgleanfromthatiswe’retalkingaboutaguywhohelpstheoffenseinwaysthatmightnotshowuponthefantasystatsheet,andiftheydoit’sinafartoointermittentandunreliablefashion.We’vealsoseentheopposite,manifestedinplayerswhomightnotbetranscendenttalentsonthefield,butduetosomecombinationofvolume,garbagetime,andthelikeareabletopostnumberswhereitmatterstous–inourweeklyfantasyteamoutput.Butwhycan’twehaveboth?Takingitonestepfurther,whycan’tweevaluateboth,andattempttouseoneasapredictorfortheother?Letmeexplain.I’mofthebeliefthatifaplayerisdoinghisjobonthefield,itstandstoreasonhe’llremainonthefieldbecausethecoacheswillbehappywithhisperformance.Themoretheplayerisonthefield,themoretheoreticallylikelyitisthathe’llbeabletoreceiveagreaterproportionoftheteam’soffensivetouches.Andofcourse,themoretoucheshereceives,themorelikelyitisthatsaidtoucheswillbeabletotranslateintofantasypoints,ultimatelyimpactingourbottomline.Withthatsaid,whatqualifiesas“doingyourjob?”I’mnofilmexpertandI’llneverpretendtobe,soIcan’tspeaktorouterunning,orwhetheraplayerisperforminghisassignmenttothebestofhisabilities.WeatDLFhaveplentyofguysfamiliarwithscoutingandtheycanspeakmuchbettertothataspectofreallifefootballthanIcan.Butevenwiththat,therearejusttoomanyplayersandtoomanysnapstobeabletoseeeverysinglepertinentplayer–evenreceiverguruMattHarmonpickshalfofeachplayer’sgamestoevaluateinhispopularReceptionPerceptionseries,andhasnowayofdiggingintoeverypasscatcheroutthere.Sogivenmypriorquantitativemethodologies,inordertobestevaluatereallifeperformance,IsoughttobreakthistopicdownintotwoquestionsIfeltconfidentinanswering:
1. WhatisthegoalofeveryNFLplay?2. Canitbequantified?
Tome,thegoalofeveryNFLplayissimple.Thereisasetpointonthefieldthattheoffenseistryingtogettheballto,orpast–thefirstdownmarker.Whetherit’sbetweenthe20s,orevenintheredzoneoratthegoalline,achievingafirstdownsignifiesthattheoffenseachieveditsobjective.Andiftheoffenseachieveditsobjective,theygetanothersetofdownstodothesamethingyetagain(unlesstheyscored).Now,Iunderstandit’sabitofaleapoffaithtolumptouchdownsinwithanystandardfirstdownplay.Butagain,tomeit’soneinthesame–theoffenseneededtocrossaline,andtheydidit.Agreeordisagree,that’smytakeandI’mstickingtoit!Nowtothenextquestion…
25
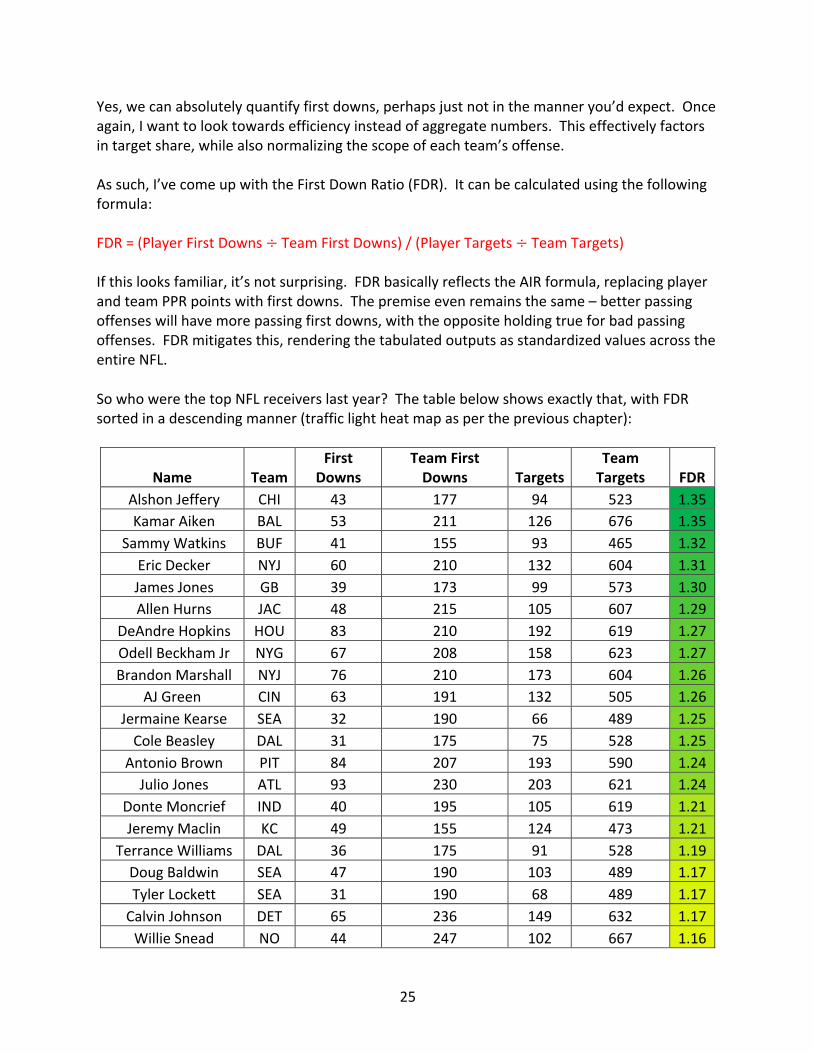
Yes,wecanabsolutelyquantifyfirstdowns,perhapsjustnotinthemanneryou’dexpect.Onceagain,Iwanttolooktowardsefficiencyinsteadofaggregatenumbers.Thiseffectivelyfactorsintargetshare,whilealsonormalizingthescopeofeachteam’soffense.Assuch,I’vecomeupwiththeFirstDownRatio(FDR).Itcanbecalculatedusingthefollowingformula:FDR=(PlayerFirstDowns÷TeamFirstDowns)/(PlayerTargets÷TeamTargets)Ifthislooksfamiliar,it’snotsurprising.FDRbasicallyreflectstheAIRformula,replacingplayerandteamPPRpointswithfirstdowns.Thepremiseevenremainsthesame–betterpassingoffenseswillhavemorepassingfirstdowns,withtheoppositeholdingtrueforbadpassingoffenses.FDRmitigatesthis,renderingthetabulatedoutputsasstandardizedvaluesacrosstheentireNFL.SowhowerethetopNFLreceiverslastyear?Thetablebelowshowsexactlythat,withFDRsortedinadescendingmanner(trafficlightheatmapasperthepreviouschapter):
Name TeamFirst
DownsTeamFirstDowns Targets
TeamTargets FDR
AlshonJeffery CHI 43 177 94 523 1.35KamarAiken BAL 53 211 126 676 1.35
SammyWatkins BUF 41 155 93 465 1.32EricDecker NYJ 60 210 132 604 1.31JamesJones GB 39 173 99 573 1.30AllenHurns JAC 48 215 105 607 1.29
DeAndreHopkins HOU 83 210 192 619 1.27OdellBeckhamJr NYG 67 208 158 623 1.27BrandonMarshall NYJ 76 210 173 604 1.26
AJGreen CIN 63 191 132 505 1.26JermaineKearse SEA 32 190 66 489 1.25ColeBeasley DAL 31 175 75 528 1.25
AntonioBrown PIT 84 207 193 590 1.24JulioJones ATL 93 230 203 621 1.24
DonteMoncrief IND 40 195 105 619 1.21JeremyMaclin KC 49 155 124 473 1.21
TerranceWilliams DAL 36 175 91 528 1.19DougBaldwin SEA 47 190 103 489 1.17TylerLockett SEA 31 190 68 489 1.17CalvinJohnson DET 65 236 149 632 1.17WillieSnead NO 44 247 102 667 1.16
26
Name TeamFirst
DownsTeamFirstDowns Targets
TeamTargets FDR
RuebenRandle NYG 35 208 90 623 1.16TYHilton IND 49 195 134 619 1.16
MikeEvans TB 63 201 145 535 1.16JulianEdelman NE 37 229 88 629 1.15MarkusWheaton PIT 32 207 79 590 1.15
JohnBrown ARI 49 237 101 562 1.15AllenRobinson JAC 61 215 151 607 1.14
EmmanuelSanders DEN 51 201 137 606 1.12JordanMatthews PHI 44 193 128 623 1.11KeenanAllen SD 34 230 89 667 1.11StefonDiggs MIN 31 153 84 454 1.10JarvisLandry MIA 60 194 167 588 1.09AmariCooper OAK 45 193 130 605 1.09RandallCobb GB 42 173 129 573 1.08MichaelFloyd ARI 40 237 88 562 1.08AnquanBoldin SF 35 154 111 526 1.08
DemaryiusThomas DEN 63 201 177 606 1.07LarryFitzgerald ARI 65 237 146 562 1.06GoldenTate DET 50 236 129 632 1.04
NateWashington HOU 33 210 94 619 1.03PierreGarcon WAS 43 208 111 555 1.03
DannyAmendola NE 32 229 87 629 1.01TravisBenjamin CLE 39 192 125 609 0.99MichaelCrabtree OAK 45 193 146 605 0.97
TedGinnJr CAR 36 197 97 501 0.94BrandinCooks NO 45 247 129 667 0.94TavonAustin STL 21 126 87 473 0.91MarvinJones CIN 33 191 103 505 0.85
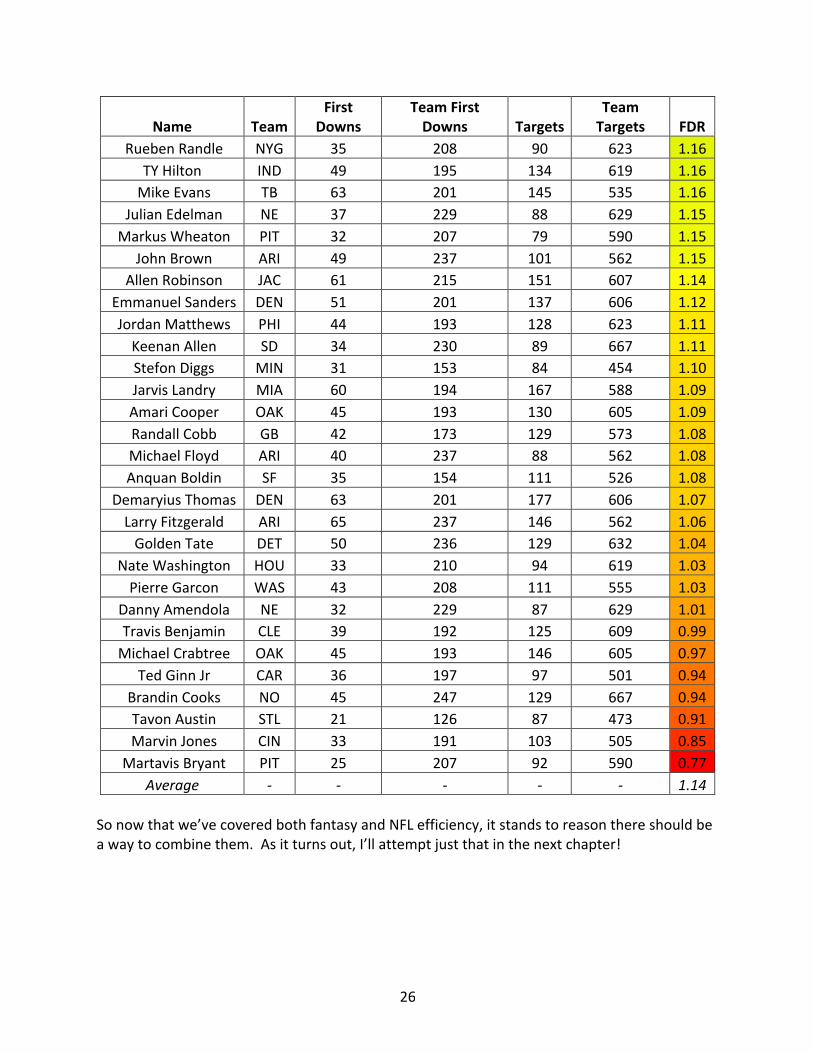
MartavisBryant PIT 25 207 92 590 0.77Average - - - - - 1.14
Sonowthatwe’vecoveredbothfantasyandNFLefficiency,itstandstoreasonthereshouldbeawaytocombinethem.Asitturnsout,I’llattemptjustthatinthenextchapter!

27
THENEWDEALANDRECONCILINGREALFOOTBALLWITHFANTASY
I’mabigParksandRecreationfan.AndmuchlikeBenWyatt’ssequeltoConesofDunshire,TheWindsofTremorrah,myanalysescanoftenlikelybedescribedas“punishinglyintricate.”Muchofthatisinsearchofwhatliesfarbeneaththesurface,andIobviouslybelievethatcanbeafruitfulendeavor–butwhenweblurthelinesofrealandfake,thingscangethazy.Regardless,Ibelieveit’sprudentto,attheveryleast,attempttoreconcilewhathappensbetweenthewhitelinesofanNFLfieldwiththeproductionwefindinourfantasyboxscoreseachandeverySunday.AsI’vealreadypresentedtwometricsinFDRandAIRthatdobothofthosethings,respectively,it’stimetocombinetheminafewdifferentwaysinordertosqueezebloodfromastoneandgleaneverycomparativeandcombinatorypieceofempiricalevidencethatwecan.AndsincetheFDRmetricisjustsodarnpresidential,I’llstartwithmyfirstoffshoot–theNewDeal.(BecausethatwasabigprogrambyFDR–getit???)AsIstatedinthelastchapter,Ibelieveaplayerwhohasaboveaverageorbetterreallifevalueisonewho’slikelytogetmorefantasyopportunities.IusedfirstdownsasmybasisforNFLvalue,blissfullyawarethatthismitigatedtheimportanceofthekingofallfirstdowns–thetouchdown.Myrationaleissimple–eventhoughtheendresultissixpoints,atouchdownremainsthe“linetoget,”justlikeanyother“linetoget.”Obviouslytouchdownsareimportant,buttheywouldn’thappeniftheteamdidn’tachieveenoughfirstdownstogettheminapositiontoscoreinthefirstplace(barringtheoccasionallongplayscoreorshortyardagedrive).Ultimately,thereinliesthejuxtaposition.Ifyoubreakitdownnumerically,theminimumvalueofatouchdowninafantasyPPRsettingis7.1PPRpoints(1PPR+6TD+0.1yards),assumingaone-yardscoringplay.Thissameresultinthemiddleofthefieldwouldonlyyield1.1points,andassuchit’seasytoseehowtheAIRmetricisinfluencedbypassingscores.FDR,ontheotherhand,doesn’tdiscriminate–onceagain,afirstdownisafirstdown.Sogiventhatunderstanding,andonceagaintakingtheleapthatallfirstdownsarecreatedequal,wehaveadirectmeansofcomparison.BothAIRandFDRareunit-lessratios,meaningallsortsofmathematicalfunctionsareavailable.Circlingbacktoafewparagraphsago,wecannowletthefantasyandrealworldvaluescollide.TheNewDealmetricisrelativelystraightforward,andcanbecalculatedusingthefollowingformula:NewDeal=FDR/AIRThepurposeoftheNewDealhasalreadybeenalludedtoabove.We’retakingtheFDRnumerator,whichsolelyevaluatesaplayer’sefficiencyofproducingfirstdownsandprovides

28
noadditionalweightingfactortotouchdowns,anddividingitbytheAIRdenominator,whichisheavilyinfluencedbyscoringplays.Idon’twanttocallitsubstanceoverstyle,becausetouchdownsareincrediblyimportanttothefantasybottomline,buttheNewDealmetriccaneffectivelyfilteroutthe“wowfactor”andhighlightplayerswhomightseemotherwiseundervaluediffantasyimpactistheonlyconsideration.SobeforeIdroneonanylonger,let’sgettothenumbers!TheNewDealcalculationsareshownbelow,sortedinadescendingmanner(trafficlightheatmapshownagainforaestheticgoodness):
Name Team FDR AIR NewDealAlshonJeffery CHI 1.35 1.05 1.29KamarAiken BAL 1.35 1.07 1.26MikeEvans TB 1.16 0.93 1.25JarvisLandry MIA 1.09 0.95 1.15
DeAndreHopkins HOU 1.27 1.13 1.13RandallCobb GB 1.08 0.96 1.12WillieSnead NO 1.16 1.04 1.12AJGreen CIN 1.26 1.13 1.11
CalvinJohnson DET 1.17 1.05 1.11PierreGarcon WAS 1.03 0.93 1.11JamesJones GB 1.30 1.18 1.10
AntonioBrown PIT 1.24 1.13 1.10EricDecker NYJ 1.31 1.19 1.10GoldenTate DET 1.04 0.95 1.09JulioJones ATL 1.24 1.14 1.09
NateWashington HOU 1.03 0.96 1.08JermaineKearse SEA 1.25 1.16 1.08
TYHilton IND 1.16 1.08 1.07AmariCooper OAK 1.09 1.01 1.07DonteMoncrief IND 1.21 1.13 1.07OdellBeckhamJr NYG 1.27 1.19 1.07MarkusWheaton PIT 1.15 1.08 1.07TerranceWilliams DAL 1.19 1.12 1.07DemaryiusThomas DEN 1.07 1.03 1.04
ColeBeasley DAL 1.25 1.20 1.04DannyAmendola NE 1.01 0.97 1.04
JohnBrown ARI 1.15 1.11 1.04AnquanBoldin SF 1.08 1.04 1.03JulianEdelman NE 1.15 1.12 1.03

29
Name Team FDR AIR NewDealBrandonMarshall NYJ 1.26 1.23 1.03EmmanuelSanders DEN 1.12 1.10 1.02
MichaelFloyd ARI 1.08 1.06 1.02JeremyMaclin KC 1.21 1.19 1.01TylerLockett SEA 1.17 1.17 1.00LarryFitzgerald ARI 1.06 1.05 1.00KeenanAllen SD 1.11 1.11 1.00
MichaelCrabtree OAK 0.97 0.97 1.00AllenHurns JAC 1.29 1.30 0.99
RuebenRandle NYG 1.16 1.21 0.96StefonDiggs MIN 1.10 1.14 0.96
SammyWatkins BUF 1.32 1.38 0.96JordanMatthews PHI 1.11 1.16 0.96TravisBenjamin CLE 0.99 1.05 0.95MarvinJones CIN 0.85 0.90 0.94AllenRobinson JAC 1.14 1.21 0.94TedGinnJr CAR 0.94 1.02 0.92
DougBaldwin SEA 1.17 1.35 0.87BrandinCooks NO 0.94 1.11 0.85TavonAustin STL 0.91 1.11 0.81
MartavisBryant PIT 0.77 1.01 0.76Average - - - 1.04
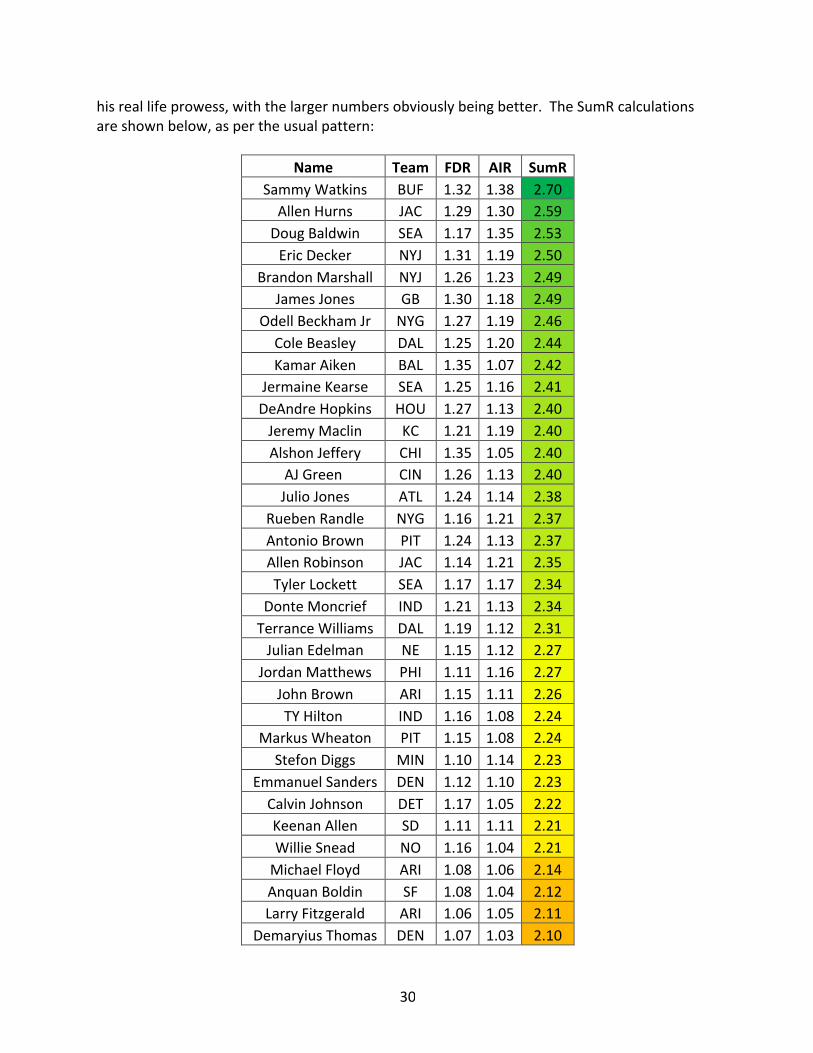
Whilethenumbersabovearecertainlyuseful,theydon’ttellthefullstory.Toillustratethispointlet’scherrypicktwoexample:SammyWatkinsandRandallCobb.WatkinswastranscendentinboththeFDR(1.32)andAIR(1.38)metrics,butbecausetheformerissmallerthanthelatterhefindshimselfwelldownthelistonthenegativesideoftheledger.Conversely,CobbproducedamediocreFDRvalue,butwhencomparedtohisbelowaverageAIRmetric,theresultantNewDealscorelefthimsmellinglikeroses.Regardless,theexerciseherewastotryandgaugewhichplayersofferedmoreinreallifethantheydidinfantasy.Thisfundamentallyrendersthemagnitudeofthecomponentnumbersasunimportant,sincetherelativeratioiswhatwe’reseeking.Onceagainthough,thisremainsjustapieceofthepuzzle,andit’simperativetovieweachplayerasbothanindividualaswellasamemberofthegroupingabove.Inotherwords,makesureyou’reviewingboththeforestandthetrees!Mynextmetricdoesn’tapplyanyadditionalweightingtoeitherFDRorAIR,andissimplyanadditivemeasure,titledSumR(SumofRatios).Itmergeseachplayer’sfantasyefficiencywith
30
hisreallifeprowess,withthelargernumbersobviouslybeingbetter.TheSumRcalculationsareshownbelow,aspertheusualpattern:
Name Team FDR AIR SumRSammyWatkins BUF 1.32 1.38 2.70AllenHurns JAC 1.29 1.30 2.59DougBaldwin SEA 1.17 1.35 2.53EricDecker NYJ 1.31 1.19 2.50
BrandonMarshall NYJ 1.26 1.23 2.49JamesJones GB 1.30 1.18 2.49
OdellBeckhamJr NYG 1.27 1.19 2.46ColeBeasley DAL 1.25 1.20 2.44KamarAiken BAL 1.35 1.07 2.42
JermaineKearse SEA 1.25 1.16 2.41DeAndreHopkins HOU 1.27 1.13 2.40JeremyMaclin KC 1.21 1.19 2.40AlshonJeffery CHI 1.35 1.05 2.40
AJGreen CIN 1.26 1.13 2.40JulioJones ATL 1.24 1.14 2.38
RuebenRandle NYG 1.16 1.21 2.37AntonioBrown PIT 1.24 1.13 2.37AllenRobinson JAC 1.14 1.21 2.35TylerLockett SEA 1.17 1.17 2.34
DonteMoncrief IND 1.21 1.13 2.34TerranceWilliams DAL 1.19 1.12 2.31JulianEdelman NE 1.15 1.12 2.27JordanMatthews PHI 1.11 1.16 2.27
JohnBrown ARI 1.15 1.11 2.26TYHilton IND 1.16 1.08 2.24
MarkusWheaton PIT 1.15 1.08 2.24StefonDiggs MIN 1.10 1.14 2.23
EmmanuelSanders DEN 1.12 1.10 2.23CalvinJohnson DET 1.17 1.05 2.22KeenanAllen SD 1.11 1.11 2.21WillieSnead NO 1.16 1.04 2.21MichaelFloyd ARI 1.08 1.06 2.14AnquanBoldin SF 1.08 1.04 2.12LarryFitzgerald ARI 1.06 1.05 2.11
DemaryiusThomas DEN 1.07 1.03 2.10

31
Name Team FDR AIR SumRAmariCooper OAK 1.09 1.01 2.10MikeEvans TB 1.16 0.93 2.08
BrandinCooks NO 0.94 1.11 2.05RandallCobb GB 1.08 0.96 2.04JarvisLandry MIA 1.09 0.95 2.04
TravisBenjamin CLE 0.99 1.05 2.04TavonAustin STL 0.91 1.11 2.02
NateWashington HOU 1.03 0.96 1.99GoldenTate DET 1.04 0.95 1.99
DannyAmendola NE 1.01 0.97 1.98TedGinnJr CAR 0.94 1.02 1.97
PierreGarcon WAS 1.03 0.93 1.97MichaelCrabtree OAK 0.97 0.97 1.93MartavisBryant PIT 0.77 1.01 1.79MarvinJones CIN 0.85 0.90 1.75
Average - - - 2.23Thelastpairofmetricsinthischapteraccomplishmoreofthesame,butthistimeusingwhateffectivelyamounttoweightedscores.I’vetakentheSumRscoresshownabove,andaddedtheadditionalmultiplicativefactorofeitherAIRorFDR,providinganextraglimpseintowhobenefitsmostfromfantasyandreallifefootball,respectively.I’vedubbedthislatestmetricasOptimizedReceivingExcellence,orOREforshort.ORE-AdenotesthatAIRistheweightingfactor,andORE-FusesFDRasthemultiplicativeentity.Theformulasareshownbelow:ORE-A=AIRxSumRORE-F=FDRxSumRWe’llstartwiththeresultsfromtheORE-Acalculations.Again,thesenumberswillslanttowardstheplayerswiththegreaterfantasyefficiency(AIR).Theycanbeseenbelow,sortedasperpreviousmetrics:
Name Team AIR SumR ORE-ASammyWatkins BUF 1.38 2.70 3.73DougBaldwin SEA 1.35 2.53 3.42AllenHurns JAC 1.30 2.59 3.38
BrandonMarshall NYJ 1.23 2.49 3.05EricDecker NYJ 1.19 2.50 2.98JamesJones GB 1.18 2.49 2.94ColeBeasley DAL 1.20 2.44 2.92

32
Name Team AIR SumR ORE-AOdellBeckhamJr NYG 1.19 2.46 2.92RuebenRandle NYG 1.21 2.37 2.87JeremyMaclin KC 1.19 2.40 2.86AllenRobinson JAC 1.21 2.35 2.85JermaineKearse SEA 1.16 2.41 2.79TylerLockett SEA 1.17 2.34 2.74AJGreen CIN 1.13 2.40 2.72
DeAndreHopkins HOU 1.13 2.40 2.71JulioJones ATL 1.14 2.38 2.71
AntonioBrown PIT 1.13 2.37 2.67DonteMoncrief IND 1.13 2.34 2.64JordanMatthews PHI 1.16 2.27 2.63KamarAiken BAL 1.07 2.42 2.60
TerranceWilliams DAL 1.12 2.31 2.59StefonDiggs MIN 1.14 2.23 2.54
JulianEdelman NE 1.12 2.27 2.54AlshonJeffery CHI 1.05 2.40 2.51JohnBrown ARI 1.11 2.26 2.50
EmmanuelSanders DEN 1.10 2.23 2.46KeenanAllen SD 1.11 2.21 2.45TYHilton IND 1.08 2.24 2.42
MarkusWheaton PIT 1.08 2.24 2.41CalvinJohnson DET 1.05 2.22 2.33WillieSnead NO 1.04 2.21 2.30BrandinCooks NO 1.11 2.05 2.28MichaelFloyd ARI 1.06 2.14 2.27TavonAustin STL 1.11 2.02 2.24LarryFitzgerald ARI 1.05 2.11 2.22AnquanBoldin SF 1.04 2.12 2.20
DemaryiusThomas DEN 1.03 2.10 2.16TravisBenjamin CLE 1.05 2.04 2.13AmariCooper OAK 1.01 2.10 2.12TedGinnJr CAR 1.02 1.97 2.02RandallCobb GB 0.96 2.04 1.95JarvisLandry MIA 0.95 2.04 1.93MikeEvans TB 0.93 2.08 1.93
DannyAmendola NE 0.97 1.98 1.92NateWashington HOU 0.96 1.99 1.91
33
Name Team AIR SumR ORE-AGoldenTate DET 0.95 1.99 1.90
MichaelCrabtree OAK 0.97 1.93 1.87PierreGarcon WAS 0.93 1.97 1.83MartavisBryant PIT 1.01 1.79 1.81MarvinJones CIN 0.90 1.75 1.57
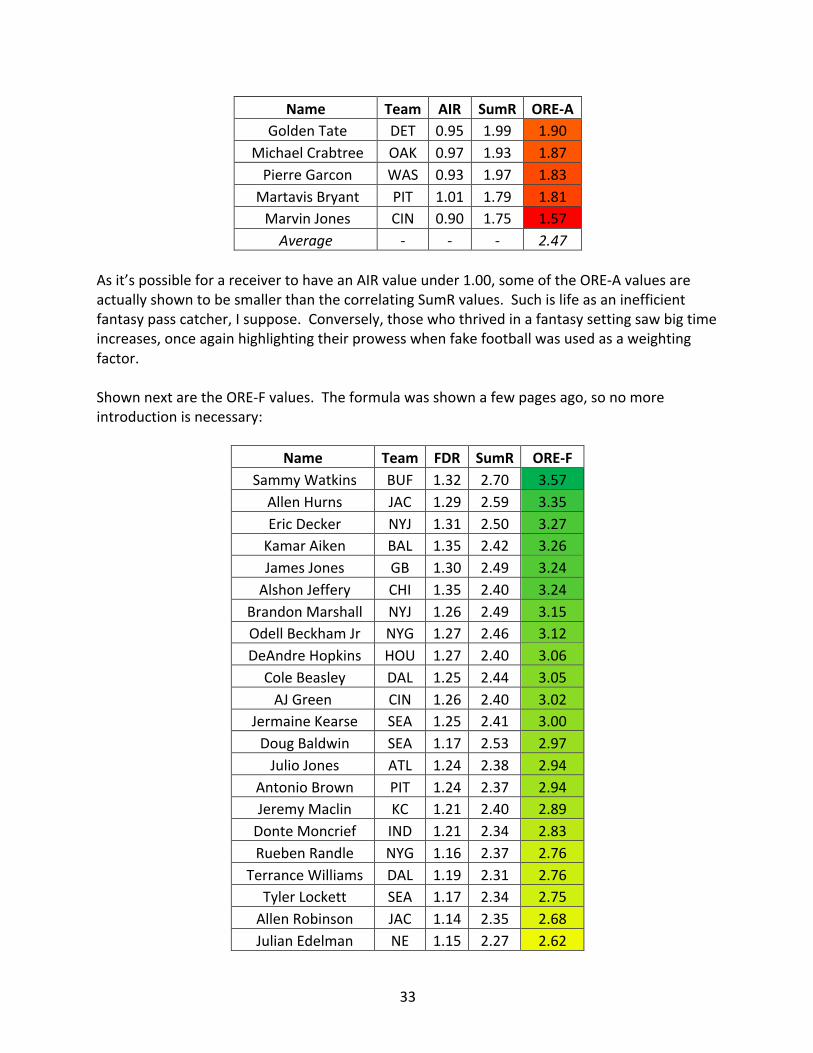
Average - - - 2.47Asit’spossibleforareceivertohaveanAIRvalueunder1.00,someoftheORE-AvaluesareactuallyshowntobesmallerthanthecorrelatingSumRvalues.Suchislifeasaninefficientfantasypasscatcher,Isuppose.Conversely,thosewhothrivedinafantasysettingsawbigtimeincreases,onceagainhighlightingtheirprowesswhenfakefootballwasusedasaweightingfactor.ShownnextaretheORE-Fvalues.Theformulawasshownafewpagesago,sonomoreintroductionisnecessary:
Name Team FDR SumR ORE-FSammyWatkins BUF 1.32 2.70 3.57AllenHurns JAC 1.29 2.59 3.35EricDecker NYJ 1.31 2.50 3.27KamarAiken BAL 1.35 2.42 3.26JamesJones GB 1.30 2.49 3.24AlshonJeffery CHI 1.35 2.40 3.24
BrandonMarshall NYJ 1.26 2.49 3.15OdellBeckhamJr NYG 1.27 2.46 3.12DeAndreHopkins HOU 1.27 2.40 3.06ColeBeasley DAL 1.25 2.44 3.05AJGreen CIN 1.26 2.40 3.02
JermaineKearse SEA 1.25 2.41 3.00DougBaldwin SEA 1.17 2.53 2.97JulioJones ATL 1.24 2.38 2.94
AntonioBrown PIT 1.24 2.37 2.94JeremyMaclin KC 1.21 2.40 2.89DonteMoncrief IND 1.21 2.34 2.83RuebenRandle NYG 1.16 2.37 2.76
TerranceWilliams DAL 1.19 2.31 2.76TylerLockett SEA 1.17 2.34 2.75AllenRobinson JAC 1.14 2.35 2.68JulianEdelman NE 1.15 2.27 2.62

34
Name Team FDR SumR ORE-FTYHilton IND 1.16 2.24 2.60
JohnBrown ARI 1.15 2.26 2.60CalvinJohnson DET 1.17 2.22 2.59
MarkusWheaton PIT 1.15 2.24 2.58WillieSnead NO 1.16 2.21 2.57
JordanMatthews PHI 1.11 2.27 2.52EmmanuelSanders DEN 1.12 2.23 2.50
KeenanAllen SD 1.11 2.21 2.45StefonDiggs MIN 1.10 2.23 2.45MikeEvans TB 1.16 2.08 2.41
MichaelFloyd ARI 1.08 2.14 2.31AnquanBoldin SF 1.08 2.12 2.28AmariCooper OAK 1.09 2.10 2.27
DemaryiusThomas DEN 1.07 2.10 2.26LarryFitzgerald ARI 1.06 2.11 2.23JarvisLandry MIA 1.09 2.04 2.22RandallCobb GB 1.08 2.04 2.20GoldenTate DET 1.04 1.99 2.07
NateWashington HOU 1.03 1.99 2.06PierreGarcon WAS 1.03 1.97 2.03TravisBenjamin CLE 0.99 2.04 2.01DannyAmendola NE 1.01 1.98 2.00BrandinCooks NO 0.94 2.05 1.93
MichaelCrabtree OAK 0.97 1.93 1.87TedGinnJr CAR 0.94 1.97 1.86TavonAustin STL 0.91 2.02 1.83MarvinJones CIN 0.85 1.75 1.48
MartavisBryant PIT 0.77 1.79 1.38Average - - - 2.56
ThoughcalculatedinananalogousmannertoORE-A,ORE-Fplacesanemphasisonreallifefootball.ObviouslythemagnitudeoftheSum-Rwillstilllargelycarrythedayonceagain,buttheaddedfocusshowsapositivetrendasitrelatestoon-fieldskill.Asmentionedadnauseumatthispoint,thatmeanssomething–nomatterwhatwethinkaboutaplayer,whetherhe’sbigorsmall,youngorold,orfastorslow,ifheproduceswhenitcountshe’slikelytocontinuegainingmorechancestokeepproducing.

35
Withourbriefforayintoreallifefootballconcluded,Iwanttogetbacktothelandofmakebelieve.Thusfaryou’veseenplentyofefficiencynumbers,butwhat’sbeenlurkingintheshadowsbehindthe“what”ofthecompiledmetricsisthe“how?”Movingon…

36
SCORINGORIGINSANDTOUCHDOWNDEPENDENCE
AsweallknowtherearethreecomponentstoPPRscoring–receptions,yardsandreceivingtouchdowns.Thelatter,whencomparedtotheformertwo,canoftensparkasortof“ceilingversusfloor”debate.AsImentionedearlier,thesixpointsperscoremassivelyinfluencethefantasybottomline,asthelowestpossiblefantasyscoreforareceivingtouchdowninaPPRsettingis7.1points.Clearlywewouldallloveplayerswithaninnateabilitytocrossthegoallineatanaboveaveragefrequency,asthiswouldeffectivelyraisetheirrespectiveceilings.However,mosttimestouchdownssimplyaren’tpredictable,andinthiswriter’sopinionaremoreinfluencedbytheconstraintsofateam’spassingoffensethananyotherreceivingstatistic(I’mlookingatyou,2015DenverBroncos).Ifthescoringplaysfailtocome,wherecanweturnto?Theansweristolookdownatthemetaphoricalfantasyfloor,whichiscomprisedofreceptionsandreceivingyards.Atonly1and0.1pointsperreceptionandyard,respectively,you’renotgoingtogettheimmediatefantasybangofascore.Butifyouhaveaplayerwhocanconsistentlymovethechainsbetweenthe20s,you’remorethanlikelygoingtohaveareliablefantasycontributor.Onceagain,asastaunchfantasyconservativeIpreferaplayerwithahigherfloor–ifhescorestouchdownsthat’sallthebetter,butIviewitasthecherryontopofmystatisticalsundae.Therearemanywhowoulddisagree,andIdon’tbegrudgethemthat.Intelligentargumentscanbemadeforeitherside.However,attheendofthedaythepointofthesenumbersisn’tformetostatemyopinions,it’stopunchbuttonsonthecalculator(okay,MicrosoftExcelformulas)andgetthehelloutoftheway!Assuch,here’sthebreakdownofthenextseriesofmetrics,whichgaugeeachplayer’srelianceonthevariouscomponentsoffantasyscoring(notethatonceagain,onlyreceivingpointsaretakenintoaccounthere–sorry,Tavon!):TD%= (PPRPointsfromTouchdowns/TotalPPRPoints)x100Reception%= (PPRPointsfromReceptions/TotalPPRPoints)x100Yards%= (PPRPointsfromYards/TotalPPRPoints)x100Asthesearetheonlythreepiecesofthepie,thenumbersforeachplayershouldaddupto100%.Let’sstartwitheachplayer’stouchdownpercentages,whichhavebeensortedinthesamepatternasperpreviousmetrics:

37
Name Team PointsfromTDs PPRPoints %PointsfromTDsTedGinnJr CAR 60 177.9 33.7
DougBaldwin SEA 84 268.9 31.2EricDecker NYJ 72 254.7 28.3
AllenRobinson JAC 84 304.0 27.6AllenHurns JAC 60 227.0 26.4
RuebenRandle NYG 48 184.7 26.0JamesJones GB 48 187.0 25.7
SammyWatkins BUF 54 218.7 24.7BrandonMarshall NYJ 84 343.2 24.5OdellBeckhamJr NYG 78 319.0 24.5JulianEdelman NE 42 172.2 24.4TylerLockett SEA 36 153.4 23.5
MichaelCrabtree OAK 54 231.2 23.4TavonAustin STL 30 129.3 23.2
MartavisBryant PIT 36 162.5 22.2ColeBeasley DAL 30 135.6 22.1AJGreen CIN 60 275.7 21.8
BrandinCooks NO 54 252.0 21.4MichaelFloyd ARI 36 172.9 20.8DonteMoncrief IND 36 173.3 20.8JordanMatthews PHI 48 232.7 20.6CalvinJohnson DET 54 263.4 20.5JermaineKearse SEA 30 147.5 20.3JohnBrown ARI 42 207.3 20.3
MarkusWheaton PIT 30 148.9 20.1DeAndreHopkins HOU 66 329.1 20.1JeremyMaclin KC 48 243.8 19.7PierreGarcon WAS 36 185.7 19.4LarryFitzgerald ARI 54 284.5 19.0RandallCobb GB 36 197.9 18.2
NateWashington HOU 24 136.8 17.5GoldenTate DET 36 207.3 17.4AmariCooper OAK 36 215.0 16.7StefonDiggs MIN 24 148.0 16.2
EmmanuelSanders DEN 36 225.5 16.0AntonioBrown PIT 60 379.4 15.8TravisBenjamin CLE 30 194.6 15.4AlshonJeffery CHI 24 158.7 15.1

38
Name Team PointsfromTDs PPRPoints %PointsfromTDsKamarAiken BAL 30 199.4 15.0KeenanAllen SD 24 163.5 14.7TYHilton IND 30 211.4 14.2
MarvinJones CIN 24 170.6 14.1AnquanBoldin SF 24 171.9 14.0
DemaryiusThomas DEN 36 271.4 13.3JulioJones ATL 48 371.1 12.9
DannyAmendola NE 18 147.8 12.2TerranceWilliams DAL 18 154.0 11.7
WillieSnead NO 18 187.0 9.6JarvisLandry MIA 24 250.9 9.6MikeEvans TB 18 212.8 8.5Average - - - 16.9
AsI’vementionedpreviously,touchdownsfunctionasahugedrivingforcebehindaplayer’soverallAIRmetric.Andsince(onceagain,inmyopinion)theyrepresentthemostnon-repeatableofthethreecomponentsofreceiverscoring,itbecomesprudenttofigureoutexactlyhowmuchtheyswayedeachplayer’sefficiency.Thetablebelowseekstoaccomplishexactlythat.SinceeachplayernowhasbothanestablishedAIRscoreandatouchdownpercentage,wecanrankeachandcomparetheiroverallstandingsinboth,showingusasortof“touchdowndependence.”Inotherwords,ifthedifferencebetweenranks(TD%ranklessAIRRank)isalargepositivevalue,itstandstoreasontheplayerwashighlyefficientdespitealackofscoringplays–inmyestimation,thisshouldbeviewedasagoodthing,astheplayerwasalreadyanassetdespitehavingroomtogrowinthescoringdepartment.Ontheotherendofthespectrum,alargenegativevaluemeansthattouchdownswereamassiveinfluenceroffantasyefficiency,andsomesortofregressionislikelytobeexpected.Onceagain,I’mnotsayingtheseplayersshouldbeavoided,butmorethattheyhavegroundtomakeupintheothercategoriesshouldtheirtripstotheendzonetailoff.Thevaluesareshowninadescendingmanneraccordingtorankdifference.Forcontinuitywiththepreviousmetricstables,I’veleftthetrafficlightheatmappatterncolorationsinthecolumnsforAIRandtouchdownpercentage:

39
Name Team AIR %PointsfromTDs AIRRank TD%Rank DifferenceJulioJones ATL 1.14 12.9 15 45 30
TerranceWilliams DAL 1.12 11.7 21 47 26JeremyMaclin KC 1.19 19.7 8 27 19JermaineKearse SEA 1.16 20.3 4 23 19StefonDiggs MIN 1.14 16.2 16 34 18
AntonioBrown PIT 1.13 15.8 20 36 16KeenanAllen SD 1.11 14.7 26 40 14WillieSnead NO 1.04 9.6 36 48 12TYHilton IND 1.08 14.2 29 41 12
ColeBeasley DAL 1.20 22.1 7 16 9KamarAiken BAL 1.07 15.0 30 39 9
EmmanuelSanders DEN 1.10 16.0 27 35 8JordanMatthews PHI 1.16 20.6 13 21 8DeAndreHopkins HOU 1.13 20.1 19 26 7SammyWatkins BUF 1.38 24.7 1 8 7AnquanBoldin SF 1.04 14.0 37 43 6
DemaryiusThomas DEN 1.03 13.3 38 44 6BrandonMarshall NYJ 1.23 24.5 4 9 5AlshonJeffery CHI 1.05 15.1 34 38 4
DannyAmendola NE 0.97 12.2 42 46 4AllenHurns JAC 1.30 26.4 3 5 2
DonteMoncrief IND 1.13 20.8 18 20 2JarvisLandry MIA 0.95 9.6 47 49 2
TravisBenjamin CLE 1.05 15.4 35 37 2MikeEvans TB 0.93 8.5 49 50 1
DougBaldwin SEA 1.35 31.2 2 2 0OdellBeckhamJr NYG 1.19 24.5 10 10 0RuebenRandle NYG 1.21 26.0 6 6 0TylerLockett SEA 1.17 23.5 12 12 0AJGreen CIN 1.13 21.8 17 17 0
AllenRobinson JAC 1.21 27.6 5 4 -1JohnBrown ARI 1.11 20.3 25 24 -1
LarryFitzgerald ARI 1.05 19.0 32 29 -3MarkusWheaton PIT 1.08 20.1 28 25 -3
JamesJones GB 1.18 25.7 11 7 -4BrandinCooks NO 1.11 21.4 24 18 -6EricDecker NYJ 1.19 28.3 9 3 -6
AmariCooper OAK 1.01 16.7 41 33 -8

40
Name Team AIR %PointsfromTDs AIRRank TD%Rank DifferenceMarvinJones CIN 0.90 14.1 50 42 -8CalvinJohnson DET 1.05 20.5 33 22 -11JulianEdelman NE 1.12 24.4 22 11 -11MichaelFloyd ARI 1.06 20.8 31 19 -12GoldenTate DET 0.95 17.4 46 32 -14
NateWashington HOU 0.96 17.5 45 31 -14RandallCobb GB 0.96 18.2 44 30 -14TavonAustin STL 1.11 23.2 23 4 -19PierreGarcon WAS 0.93 19.4 48 28 -20MartavisBryant PIT 1.01 22.2 40 15 -25MichaelCrabtree OAK 0.97 23.4 43 13 -30
TedGinnJr CAR 1.02 33.7 39 1 -38Next,we’llfocusourgazetothesecondofthreemodesofscoring–receptions.Thefollowingtablemimicsthetouchdownpercentagetableabove,butthistimechartsthefractionsofpointsthatcamefromsimplycatchingtheball:
Name TeamPointsfromReceptions
PPRPoints
%PointsfromReceptions
JarvisLandry MIA 111 250.9 44.2DannyAmendola NE 65 147.8 44.0GoldenTate DET 90 207.3 43.4KeenanAllen SD 67 163.5 41.0TavonAustin STL 52 129.3 40.2AnquanBoldin SF 69 171.9 40.1RandallCobb GB 79 197.9 39.9PierreGarcon WAS 72 185.7 38.8
DemaryiusThomas DEN 105 271.4 38.7ColeBeasley DAL 52 135.6 38.3
LarryFitzgerald ARI 109 284.5 38.3MarvinJones CIN 65 170.6 38.1KamarAiken BAL 75 199.4 37.6WillieSnead NO 70 187.0 37.4
DonteMoncrief IND 64 173.3 36.9MichaelCrabtree OAK 85 231.2 36.8
JulioJones ATL 136 371.1 36.6JordanMatthews PHI 85 232.7 36.5AntonioBrown PIT 136 379.4 35.8

41
Name TeamPointsfromReceptions
PPRPoints
%PointsfromReceptions
JeremyMaclin KC 87 243.8 35.7JulianEdelman NE 61 172.2 35.4StefonDiggs MIN 52 148.0 35.1
TravisBenjamin CLE 68 194.6 34.9MikeEvans TB 74 212.8 34.8
NateWashington HOU 47 136.8 34.4AlshonJeffery CHI 54 158.7 34.0
TerranceWilliams DAL 52 154.0 33.8DeAndreHopkins HOU 111 329.1 33.7EmmanuelSanders DEN 76 225.5 33.7
AmariCooper OAK 72 215.0 33.5CalvinJohnson DET 88 263.4 33.4BrandinCooks NO 84 252.0 33.3TylerLockett SEA 51 153.4 33.2
JermaineKearse SEA 49 147.5 33.2TYHilton IND 69 211.4 32.6
BrandonMarshall NYJ 109 343.2 31.8EricDecker NYJ 80 254.7 31.4JohnBrown ARI 65 207.3 31.4AJGreen CIN 86 275.7 31.2
RuebenRandle NYG 57 184.7 30.9MartavisBryant PIT 50 162.5 30.8OdellBeckhamJr NYG 96 319.0 30.1MichaelFloyd ARI 52 172.9 30.1
MarkusWheaton PIT 44 148.9 29.6DougBaldwin SEA 78 268.9 29.0AllenHurns JAC 64 227.0 28.2
SammyWatkins BUF 60 218.7 27.4JamesJones GB 50 187.0 26.7
AllenRobinson JAC 80 304.0 26.3TedGinnJr CAR 44 177.9 24.7Average - - - 38.6
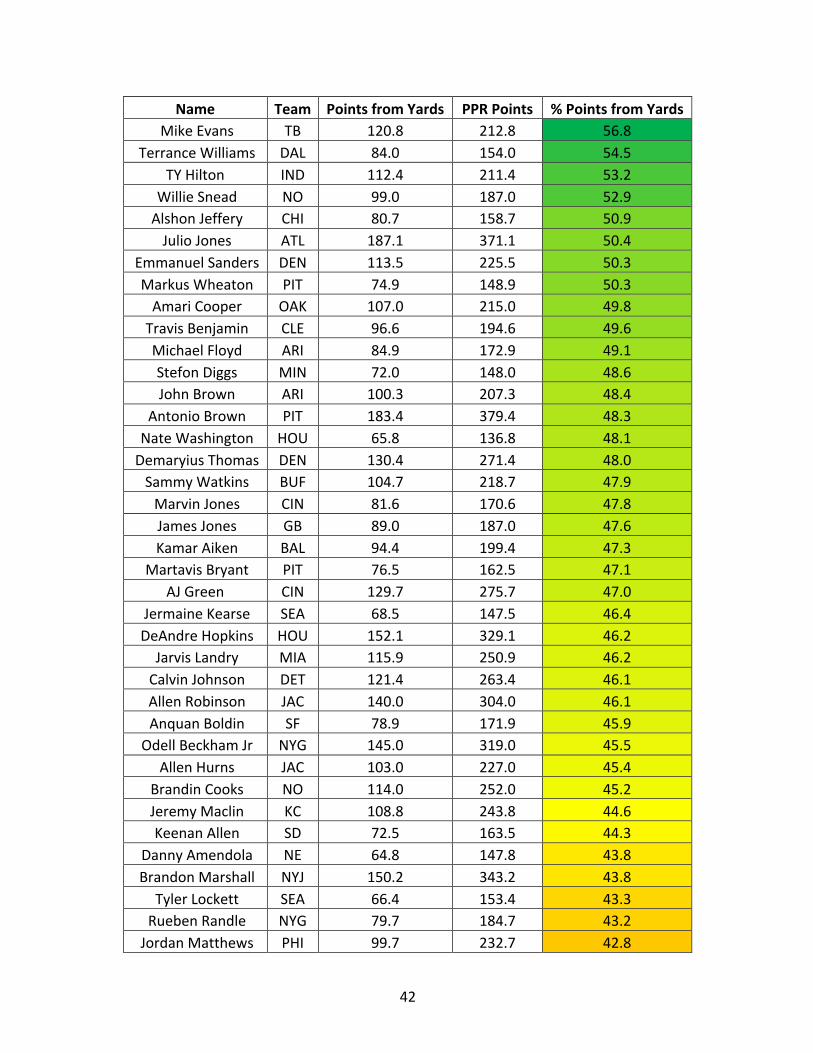
Finally,let’sconcludewiththeyardpercentages,asshowninthetableonthenextpage:
42
Name Team PointsfromYards PPRPoints %PointsfromYardsMikeEvans TB 120.8 212.8 56.8
TerranceWilliams DAL 84.0 154.0 54.5TYHilton IND 112.4 211.4 53.2
WillieSnead NO 99.0 187.0 52.9AlshonJeffery CHI 80.7 158.7 50.9JulioJones ATL 187.1 371.1 50.4
EmmanuelSanders DEN 113.5 225.5 50.3MarkusWheaton PIT 74.9 148.9 50.3AmariCooper OAK 107.0 215.0 49.8TravisBenjamin CLE 96.6 194.6 49.6MichaelFloyd ARI 84.9 172.9 49.1StefonDiggs MIN 72.0 148.0 48.6JohnBrown ARI 100.3 207.3 48.4
AntonioBrown PIT 183.4 379.4 48.3NateWashington HOU 65.8 136.8 48.1DemaryiusThomas DEN 130.4 271.4 48.0SammyWatkins BUF 104.7 218.7 47.9MarvinJones CIN 81.6 170.6 47.8JamesJones GB 89.0 187.0 47.6KamarAiken BAL 94.4 199.4 47.3
MartavisBryant PIT 76.5 162.5 47.1AJGreen CIN 129.7 275.7 47.0
JermaineKearse SEA 68.5 147.5 46.4DeAndreHopkins HOU 152.1 329.1 46.2JarvisLandry MIA 115.9 250.9 46.2CalvinJohnson DET 121.4 263.4 46.1AllenRobinson JAC 140.0 304.0 46.1AnquanBoldin SF 78.9 171.9 45.9
OdellBeckhamJr NYG 145.0 319.0 45.5AllenHurns JAC 103.0 227.0 45.4
BrandinCooks NO 114.0 252.0 45.2JeremyMaclin KC 108.8 243.8 44.6KeenanAllen SD 72.5 163.5 44.3
DannyAmendola NE 64.8 147.8 43.8BrandonMarshall NYJ 150.2 343.2 43.8TylerLockett SEA 66.4 153.4 43.3RuebenRandle NYG 79.7 184.7 43.2JordanMatthews PHI 99.7 232.7 42.8
43
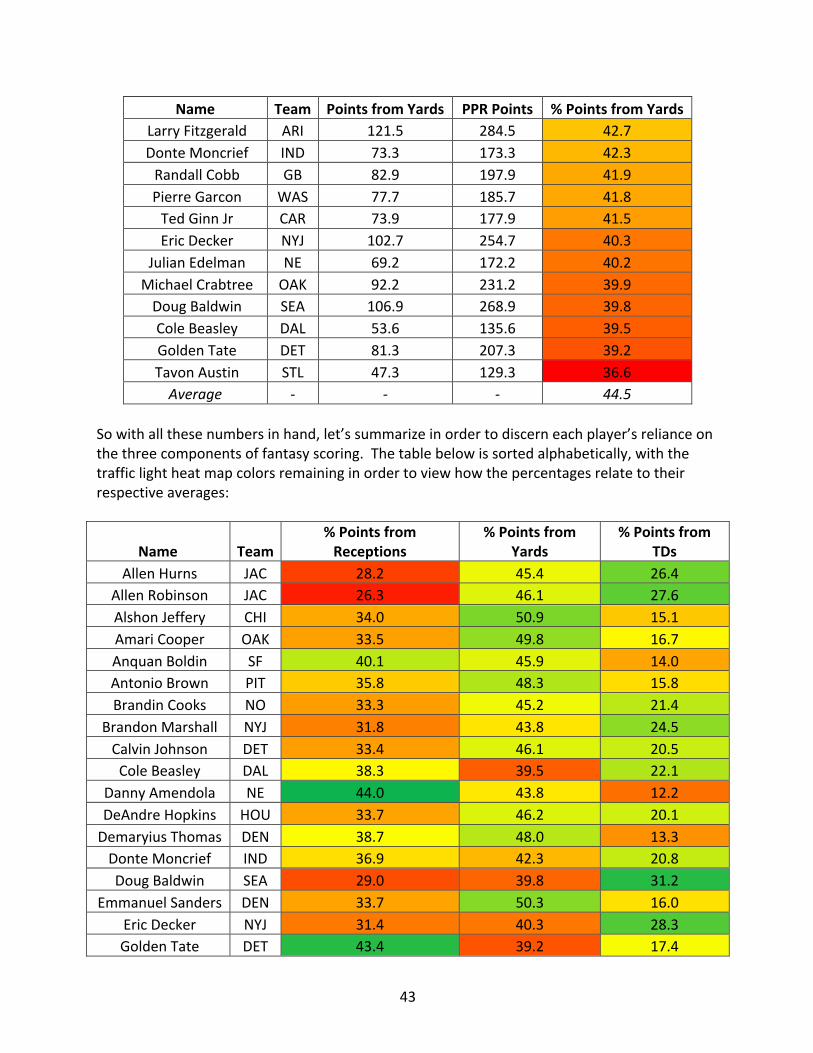
Name Team PointsfromYards PPRPoints %PointsfromYardsLarryFitzgerald ARI 121.5 284.5 42.7DonteMoncrief IND 73.3 173.3 42.3RandallCobb GB 82.9 197.9 41.9PierreGarcon WAS 77.7 185.7 41.8TedGinnJr CAR 73.9 177.9 41.5EricDecker NYJ 102.7 254.7 40.3
JulianEdelman NE 69.2 172.2 40.2MichaelCrabtree OAK 92.2 231.2 39.9DougBaldwin SEA 106.9 268.9 39.8ColeBeasley DAL 53.6 135.6 39.5GoldenTate DET 81.3 207.3 39.2TavonAustin STL 47.3 129.3 36.6
Average - - - 44.5Sowithallthesenumbersinhand,let’ssummarizeinordertodiscerneachplayer’srelianceonthethreecomponentsoffantasyscoring.Thetablebelowissortedalphabetically,withthetrafficlightheatmapcolorsremaininginordertoviewhowthepercentagesrelatetotheirrespectiveaverages:
Name Team%PointsfromReceptions
%PointsfromYards
%PointsfromTDs
AllenHurns JAC 28.2 45.4 26.4AllenRobinson JAC 26.3 46.1 27.6AlshonJeffery CHI 34.0 50.9 15.1AmariCooper OAK 33.5 49.8 16.7AnquanBoldin SF 40.1 45.9 14.0AntonioBrown PIT 35.8 48.3 15.8BrandinCooks NO 33.3 45.2 21.4
BrandonMarshall NYJ 31.8 43.8 24.5CalvinJohnson DET 33.4 46.1 20.5ColeBeasley DAL 38.3 39.5 22.1
DannyAmendola NE 44.0 43.8 12.2DeAndreHopkins HOU 33.7 46.2 20.1DemaryiusThomas DEN 38.7 48.0 13.3DonteMoncrief IND 36.9 42.3 20.8DougBaldwin SEA 29.0 39.8 31.2
EmmanuelSanders DEN 33.7 50.3 16.0EricDecker NYJ 31.4 40.3 28.3GoldenTate DET 43.4 39.2 17.4

44
Name Team%PointsfromReceptions
%PointsfromYards
%PointsfromTDs
JamesJones GB 26.7 47.6 25.7JarvisLandry MIA 44.2 46.2 9.6JeremyMaclin KC 35.7 44.6 19.7JermaineKearse SEA 33.2 46.4 20.3JohnBrown ARI 31.4 48.4 20.3
JordanMatthews PHI 36.5 42.8 20.6JulianEdelman NE 35.4 40.2 24.4JulioJones ATL 36.6 50.4 12.9KamarAiken BAL 37.6 47.3 15.0KeenanAllen SD 41.0 44.3 14.7LarryFitzgerald ARI 38.3 42.7 19.0MarkusWheaton PIT 29.6 50.3 20.1MartavisBryant PIT 30.8 47.1 22.2MarvinJones CIN 38.1 47.8 14.1
MichaelCrabtree OAK 36.8 39.9 23.4MichaelFloyd ARI 30.1 49.1 20.8MikeEvans TB 34.8 56.8 8.5
NateWashington HOU 34.4 48.1 17.5OdellBeckhamJr NYG 30.1 45.5 24.5PierreGarcon WAS 38.8 41.8 19.4RandallCobb GB 39.9 41.9 18.2RuebenRandle NYG 30.9 43.2 26.0SammyWatkins BUF 27.4 47.9 24.7StefonDiggs MIN 35.1 48.6 16.2TavonAustin STL 40.2 36.6 23.2TedGinnJr CAR 24.7 41.5 33.7
TerranceWilliams DAL 33.8 54.5 11.7TravisBenjamin CLE 34.9 49.6 15.4TylerLockett SEA 33.2 43.3 23.5WillieSnead NO 37.4 52.9 9.6AJGreen CIN 31.2 47.0 21.8TYHilton IND 32.6 53.2 14.2Average - 38.6 44.5 16.9
Thoughtheabovecalculationsarecertainlyuseful,you’recrazyifyouthinkI’mdonescouringthecomponentsofscoring.Ontothenextchapter!

45
RELATIVERATIOSANDPOTENTIALREPEATABILITY
Braceyourselffolks,it’sabouttogetweirdupinhere…IknowitmightseemlikeI’mcomingupwithnewmetricsbecauseIhavesomesortofmathematicalADHDornervoustick,butasI’vementionedbefore,it’sallbecauseI’mattemptingtonotonlysummarizetheyearthatwas,buttryandpredictwhat’stocome.Afterall,thisisdynastyleaguefootball–winningyearlytitleswillalwaysreignsupreme,butpickingtheguyswhowillhelpuswinyearinandyearoutisthefigurative“1b”here.Thischapterisgoingtotryandhelpyoudojustthat.Thepreviouschapterdidquiteabitinhelpingusdiscernthe“how”behindeachplayer’sseasonalscoringoutput,butasalwayswecanexcavatefurtheruntilwe’vereachedthestatisticalcore.Insteadofexplainingthisnextmethodology,I’lluseaplayerasanexample.SeattlereceiverDougBaldwin,atleastintheeyesofmany,seeminglycameoutofnowheretofinishthe2015seasonasthePPRWR10,largelyonthebackofhisleague-leading(tiedwithBrandonMarshallandAllenRobinson)14receivingscores.Thisnumberisreflectedinthepreviouschapter,asBaldwin’stouchdownpercentageof31.2%wassecondonlytothePanthers’TedGinn.ItalsohelpedpropelhimtoanotherworldlyAIRscoreof1.35,whichwassecondagainonlytoBuffalo’sSammyWatkins.Ofcourse,byvirtueofderivingoverathirdofhisfantasypointsfromtouchdowns,Baldwin’sreceptionandyardspercentagessufferedrelativetohispeers–hefinished45thand47thinthosemetrics,respectively.Onceagain,we’redealingwithaseriesofthreenumbersthatmustaddupto100,andthisisazero-sumgame.Ifonepercentageincreases,oneorbothoftheothersmustdiminish.ButdoesthatmeanBaldwinwasbelowaveragewithregardstocatchingtheballandgainingyards?InthewordsofLeeCorso,notsofastmyfriend…Remember–offensiveconstraintmatters!TheSeahawkswereoneofthemostefficientpassingoffensesintheleague,largelybecausequarterbackRussellWilsonthrewforthesixthmosttouchdowns(34–onlytwobehindleagueleaderTomBrady)onthe17thmostattempts,15thmostcompletions,and12thmostyards.Inotherwords,theopportunityforcollectingtouchdownswasthere,butreceptionsandyardswerehardertocomeby.SothatfactthatBaldwindidmorethanhewasexpectedtodowithregardstoscoringtheballshouldstillbecelebrated,butbecausetheopportunityforreceptionsandyardswasn’tthere,atleastrelativelyspeaking,meansheshouldn’tbepunished.Andyes,ofcourseIhavethenumbersshowingexactlythat.I’llstartwithaseriesofwhatI’vetermedRelativeRatios.Iftheylookfamiliar,theyshould–whenIbelieveinametricI’lldowhateverIcantoreproduceitandpopulatetheworldwithas

46
manystatisticaloffspringashumanlypossible(see,Itoldyouitwasabouttogetweird)!Assuch,I’veonceagaineffectivelyborrowedfromtheAIRblueprinttocomeupwiththreenewratios:theRelativeReceptionRatio(RRR),RelativeYardsRatio(RYR)andRelativeTouchdownRatio(RTR).Theycanbecalculatedinthefollowingmanner:RRR=(PlayerReceptions÷TeamReceptions)/(PlayerTargets÷TeamTargets)RYR=(PlayerYards÷TeamYards)/(PlayerTargets÷TeamTargets)RTR=(PlayerTouchdowns÷TeamTouchdowns)/(PlayerTargets÷TeamTargets)Whatwe’reeffectivelyquantifyinghereistherateatwhichaplayerwasabletogainreceptions,yardsandtouchdownsgivenhismarketshareofhisoffense.Soforplayerswhosepercentagesmightleadyoutobelievetheywerepoor,thatcould’veactuallybeenmoreduetoaggregateteamoutputthananything.CirclingbacktoBaldwin,hewasactuallywellaboveaveragewithregardstoallthreecomponents,despitewhatthelastchaptermighthaveledyoutobelieve.Let’sjumprightintoit.MuchlikewithAIRandFDR,arelativeratioof1.00principallystatesthattheplayerdidhisjobandmetexpectations–nothingmore,nothingless.Aratioabove1.00meanstheplayerwasmoreefficientthantheaggregateoftherestofhisoffense,andaratiolessthan1.00meanstheoppose.Let’sstartwithRRR.Thevaluescanbeshownbelowwiththetrafficlightheatmapcoloration,andtheaverageofthe50receiverswasfoundtobe0.99.
Name Team ReceptionsTeam
Receptions TargetsTeamTargets
RelativeReceptionRatio
LarryFitzgerald ARI 109 353 146 562 1.19DannyAmendola NE 65 404 87 629 1.16KeenanAllen SD 67 442 89 667 1.14DougBaldwin SEA 78 333 103 489 1.11TylerLockett SEA 51 333 68 489 1.10ColeBeasley DAL 52 334 75 528 1.10
JermaineKearse SEA 49 333 66 489 1.09JulianEdelman NE 61 404 88 629 1.08JarvisLandry MIA 111 365 167 588 1.07JeremyMaclin KC 87 310 124 473 1.07AntonioBrown PIT 136 391 193 590 1.06DonteMoncrief IND 64 355 105 619 1.06BrandonMarshall NYJ 109 362 173 604 1.05
GoldenTate DET 90 420 129 632 1.05AllenHurns JAC 64 355 105 607 1.04TavonAustin STL 52 273 87 473 1.04

47
Name Team ReceptionsTeam
Receptions TargetsTeamTargets
RelativeReceptionRatio
JohnBrown ARI 65 353 101 562 1.02JordanMatthews PHI 85 405 128 623 1.02SammyWatkins BUF 60 295 93 465 1.02AnquanBoldin SF 69 322 111 526 1.02JulioJones ATL 136 410 203 621 1.01EricDecker NYJ 80 362 132 604 1.01RandallCobb GB 79 348 129 573 1.01RuebenRandle NYG 57 392 90 623 1.01DeAndreHopkins HOU 111 358 192 619 1.00
WillieSnead NO 70 460 102 667 1.00AJGreen CIN 86 334 132 505 0.99
DemaryiusThomas DEN 105 368 177 606 0.98OdellBeckhamJr NYG 96 392 158 623 0.97StefonDiggs MIN 52 294 84 454 0.96MarvinJones CIN 65 334 103 505 0.95KamarAiken BAL 75 426 126 676 0.94
MichaelCrabtree OAK 85 373 146 605 0.94BrandinCooks NO 84 460 129 667 0.94MichaelFloyd ARI 52 353 88 562 0.94PierreGarcon WAS 72 386 111 555 0.93
EmmanuelSanders DEN 76 368 137 606 0.91AllenRobinson JAC 80 355 151 607 0.91
TerranceWilliams DAL 52 334 91 528 0.90AlshonJeffery CHI 54 334 94 523 0.90AmariCooper OAK 72 373 130 605 0.90
TYHilton IND 69 355 134 619 0.90TravisBenjamin CLE 68 371 125 609 0.89CalvinJohnson DET 88 420 149 632 0.89MikeEvans TB 74 312 145 535 0.88
NateWashington HOU 47 358 94 619 0.86MarkusWheaton PIT 44 391 79 590 0.84
JamesJones GB 50 348 99 573 0.83MartavisBryant PIT 50 391 92 590 0.82TedGinnJr CAR 44 300 97 501 0.76Average - - - - - 0.99
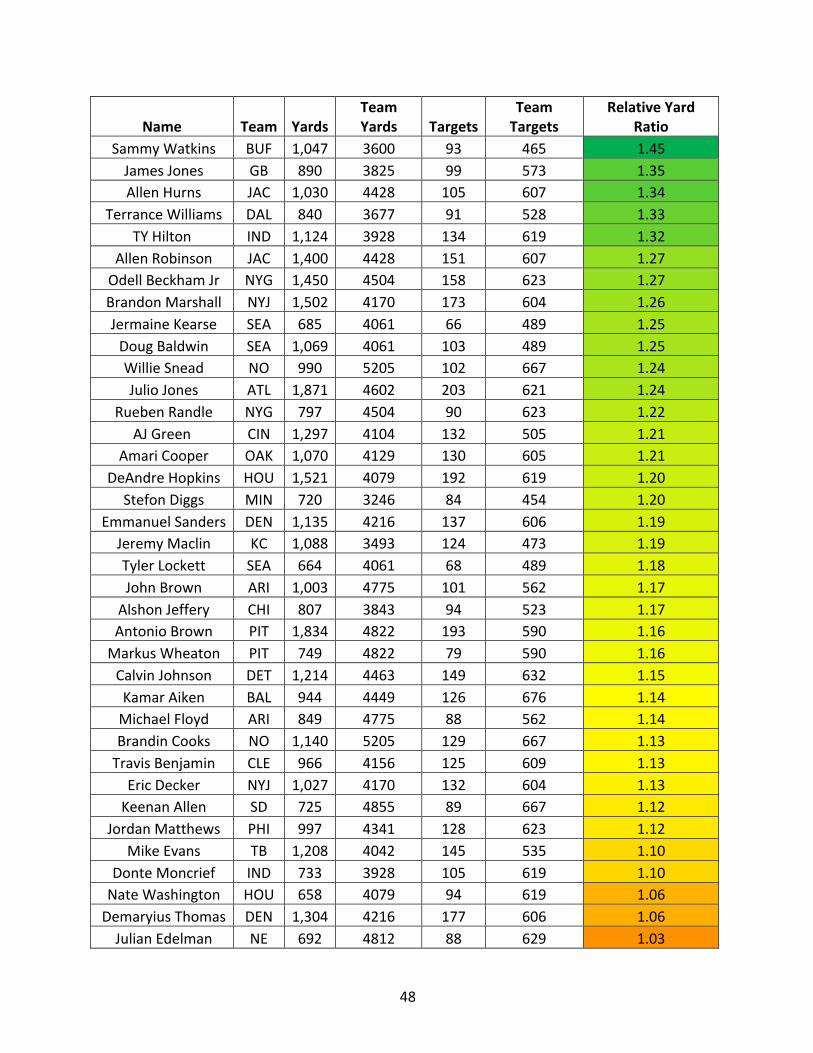
Next,let’slooktoRYR,whichisshownonthenextpage,sortedsimilarlytotheabove:
48
Name Team YardsTeamYards Targets
TeamTargets
RelativeYardRatio
SammyWatkins BUF 1,047 3600 93 465 1.45JamesJones GB 890 3825 99 573 1.35AllenHurns JAC 1,030 4428 105 607 1.34
TerranceWilliams DAL 840 3677 91 528 1.33TYHilton IND 1,124 3928 134 619 1.32
AllenRobinson JAC 1,400 4428 151 607 1.27OdellBeckhamJr NYG 1,450 4504 158 623 1.27BrandonMarshall NYJ 1,502 4170 173 604 1.26JermaineKearse SEA 685 4061 66 489 1.25DougBaldwin SEA 1,069 4061 103 489 1.25WillieSnead NO 990 5205 102 667 1.24JulioJones ATL 1,871 4602 203 621 1.24
RuebenRandle NYG 797 4504 90 623 1.22AJGreen CIN 1,297 4104 132 505 1.21
AmariCooper OAK 1,070 4129 130 605 1.21DeAndreHopkins HOU 1,521 4079 192 619 1.20
StefonDiggs MIN 720 3246 84 454 1.20EmmanuelSanders DEN 1,135 4216 137 606 1.19JeremyMaclin KC 1,088 3493 124 473 1.19TylerLockett SEA 664 4061 68 489 1.18JohnBrown ARI 1,003 4775 101 562 1.17AlshonJeffery CHI 807 3843 94 523 1.17AntonioBrown PIT 1,834 4822 193 590 1.16MarkusWheaton PIT 749 4822 79 590 1.16CalvinJohnson DET 1,214 4463 149 632 1.15KamarAiken BAL 944 4449 126 676 1.14MichaelFloyd ARI 849 4775 88 562 1.14BrandinCooks NO 1,140 5205 129 667 1.13TravisBenjamin CLE 966 4156 125 609 1.13EricDecker NYJ 1,027 4170 132 604 1.13KeenanAllen SD 725 4855 89 667 1.12
JordanMatthews PHI 997 4341 128 623 1.12MikeEvans TB 1,208 4042 145 535 1.10
DonteMoncrief IND 733 3928 105 619 1.10NateWashington HOU 658 4079 94 619 1.06DemaryiusThomas DEN 1,304 4216 177 606 1.06JulianEdelman NE 692 4812 88 629 1.03

49
Name Team YardsTeamYards Targets
TeamTargets
RelativeYardRatio
ColeBeasley DAL 536 3677 75 528 1.03AnquanBoldin SF 789 3646 111 526 1.03MartavisBryant PIT 765 4822 92 590 1.02TedGinnJr CAR 739 3873 97 501 0.99
LarryFitzgerald ARI 1,215 4775 146 562 0.98MarvinJones CIN 816 4104 103 505 0.97
DannyAmendola NE 648 4812 87 629 0.97JarvisLandry MIA 1,159 4231 167 588 0.96RandallCobb GB 829 3825 129 573 0.96
MichaelCrabtree OAK 922 4129 146 605 0.93PierreGarcon WAS 777 4294 111 555 0.90GoldenTate DET 813 4463 129 632 0.89TavonAustin STL 473 2931 87 473 0.88
Average - - - - - 1.14Finally,let’slookattheRTRforeachplayer:
Name Team TDs TeamTDs Targets TeamTargets RelativeTDRatioTavonAustin STL 5 11 87 473 2.47ColeBeasley DAL 5 16 75 528 2.20
SammyWatkins BUF 9 23 93 465 1.96DougBaldwin SEA 14 34 103 489 1.95
JordanMatthews PHI 8 23 128 623 1.69EricDecker NYJ 12 33 132 604 1.66AllenHurns JAC 10 35 105 607 1.65
AllenRobinson JAC 14 35 151 607 1.61StefonDiggs MIN 4 14 84 454 1.54
RuebenRandle NYG 8 36 90 623 1.54JeremyMaclin KC 8 20 124 473 1.53JamesJones GB 8 31 99 573 1.49
BrandonMarshall NYJ 14 33 173 604 1.48MartavisBryant PIT 6 26 92 590 1.48TedGinnJr CAR 10 35 97 501 1.48
BrandinCooks NO 9 32 129 667 1.45MarkusWheaton PIT 5 26 79 590 1.44OdellBeckhamJr NYG 13 36 158 623 1.42EmmanuelSanders DEN 6 19 137 606 1.40

50
Name Team TDs TeamTDs Targets TeamTargets RelativeTDRatioJulianEdelman NE 7 36 88 629 1.39DonteMoncrief IND 6 26 105 619 1.36KamarAiken BAL 5 21 126 676 1.28TylerLockett SEA 6 34 68 489 1.27AJGreen CIN 10 31 132 505 1.23
DeAndreHopkins HOU 11 29 192 619 1.22TravisBenjamin CLE 5 20 125 609 1.22AnquanBoldin SF 4 16 111 526 1.18AntonioBrown PIT 10 26 193 590 1.18JulioJones ATL 8 21 203 621 1.17
CalvinJohnson DET 9 33 149 632 1.16JohnBrown ARI 7 35 101 562 1.11
MichaelCrabtree OAK 9 34 146 605 1.10MichaelFloyd ARI 6 35 88 562 1.09JermaineKearse SEA 5 34 66 489 1.09TerranceWilliams DAL 3 16 91 528 1.09DemaryiusThomas DEN 6 19 177 606 1.08
AlshonJeffery CHI 4 21 94 523 1.06PierreGarcon WAS 6 30 111 555 1.00KeenanAllen SD 4 30 89 667 1.00LarryFitzgerald ARI 9 35 146 562 0.99NateWashington HOU 4 29 94 619 0.91
GoldenTate DET 6 33 129 632 0.89TYHilton IND 5 26 134 619 0.89
RandallCobb GB 6 31 129 573 0.86AmariCooper OAK 6 34 130 605 0.82MarvinJones CIN 4 31 103 505 0.63WillieSnead NO 3 32 102 667 0.61
DannyAmendola NE 3 36 87 629 0.60JarvisLandry MIA 4 24 167 588 0.59MikeEvans TB 3 22 145 535 0.50Average - - - - - 1.26
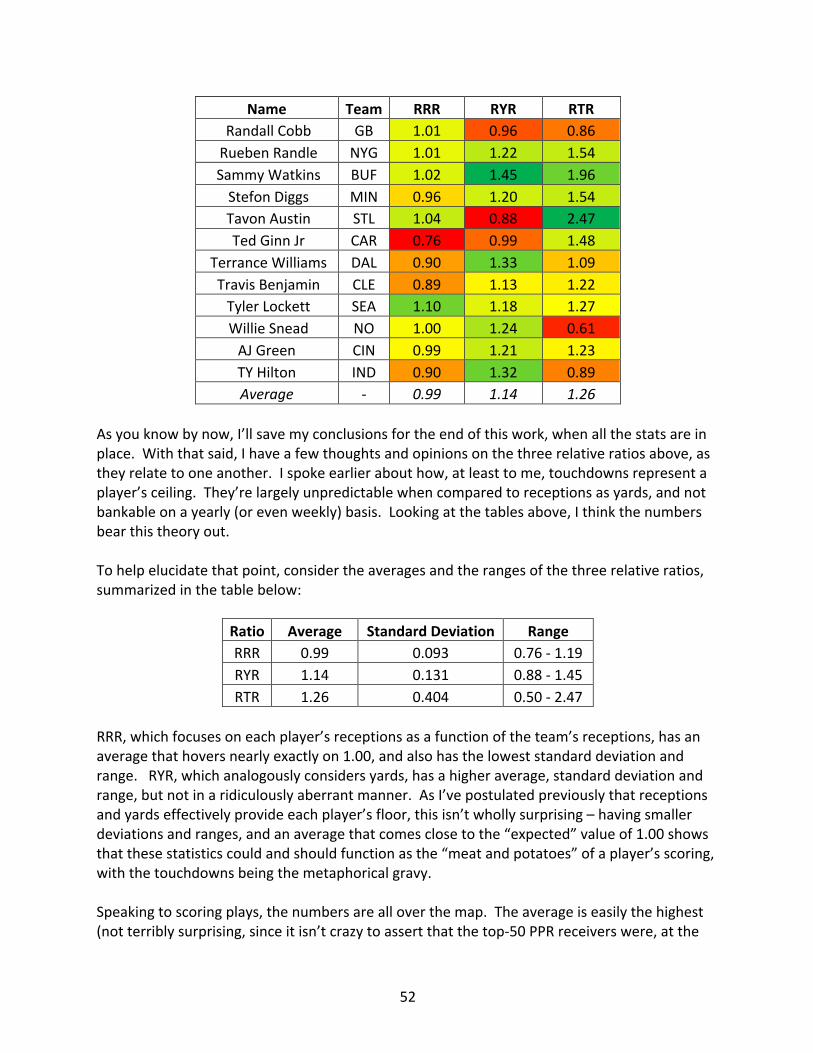
Finally,thetableonthenextpagesumsupallthreeratiosforeachreceiver,sortedbyname,withtheaveragesshownatthebottom.

51
Name Team RRR RYR RTRAllenHurns JAC 1.04 1.34 1.65
AllenRobinson JAC 0.91 1.27 1.61AlshonJeffery CHI 0.90 1.17 1.06AmariCooper OAK 0.90 1.21 0.82AnquanBoldin SF 1.02 1.03 1.18AntonioBrown PIT 1.06 1.16 1.18BrandinCooks NO 0.94 1.13 1.45
BrandonMarshall NYJ 1.05 1.26 1.48CalvinJohnson DET 0.89 1.15 1.16ColeBeasley DAL 1.10 1.03 2.20
DannyAmendola NE 1.16 0.97 0.60DeAndreHopkins HOU 1.00 1.20 1.22DemaryiusThomas DEN 0.98 1.06 1.08DonteMoncrief IND 1.06 1.10 1.36DougBaldwin SEA 1.11 1.25 1.95
EmmanuelSanders DEN 0.91 1.19 1.40EricDecker NYJ 1.01 1.13 1.66GoldenTate DET 1.05 0.89 0.89JamesJones GB 0.83 1.35 1.49JarvisLandry MIA 1.07 0.96 0.59JeremyMaclin KC 1.07 1.19 1.53JermaineKearse SEA 1.09 1.25 1.09JohnBrown ARI 1.02 1.17 1.11
JordanMatthews PHI 1.02 1.12 1.69JulianEdelman NE 1.08 1.03 1.39JulioJones ATL 1.01 1.24 1.17KamarAiken BAL 0.94 1.14 1.28KeenanAllen SD 1.14 1.12 1.00LarryFitzgerald ARI 1.19 0.98 0.99MarkusWheaton PIT 0.84 1.16 1.44MartavisBryant PIT 0.82 1.02 1.48MarvinJones CIN 0.95 0.97 0.63
MichaelCrabtree OAK 0.94 0.93 1.10MichaelFloyd ARI 0.94 1.14 1.09MikeEvans TB 0.88 1.10 0.50
NateWashington HOU 0.86 1.06 0.91OdellBeckhamJr NYG 0.97 1.27 1.42PierreGarcon WAS 0.93 0.90 1.00
52
Name Team RRR RYR RTRRandallCobb GB 1.01 0.96 0.86RuebenRandle NYG 1.01 1.22 1.54SammyWatkins BUF 1.02 1.45 1.96StefonDiggs MIN 0.96 1.20 1.54TavonAustin STL 1.04 0.88 2.47TedGinnJr CAR 0.76 0.99 1.48
TerranceWilliams DAL 0.90 1.33 1.09TravisBenjamin CLE 0.89 1.13 1.22TylerLockett SEA 1.10 1.18 1.27WillieSnead NO 1.00 1.24 0.61AJGreen CIN 0.99 1.21 1.23TYHilton IND 0.90 1.32 0.89Average - 0.99 1.14 1.26
Asyouknowbynow,I’llsavemyconclusionsfortheendofthiswork,whenallthestatsareinplace.Withthatsaid,Ihaveafewthoughtsandopinionsonthethreerelativeratiosabove,astheyrelatetooneanother.Ispokeearlierabouthow,atleasttome,touchdownsrepresentaplayer’sceiling.They’relargelyunpredictablewhencomparedtoreceptionsasyards,andnotbankableonayearly(orevenweekly)basis.Lookingatthetablesabove,Ithinkthenumbersbearthistheoryout.Tohelpelucidatethatpoint,considertheaveragesandtherangesofthethreerelativeratios,summarizedinthetablebelow:
Ratio Average StandardDeviation RangeRRR 0.99 0.093 0.76-1.19RYR 1.14 0.131 0.88-1.45RTR 1.26 0.404 0.50-2.47
RRR,whichfocusesoneachplayer’sreceptionsasafunctionoftheteam’sreceptions,hasanaveragethathoversnearlyexactlyon1.00,andalsohastheloweststandarddeviationandrange.RYR,whichanalogouslyconsidersyards,hasahigheraverage,standarddeviationandrange,butnotinaridiculouslyaberrantmanner.AsI’vepostulatedpreviouslythatreceptionsandyardseffectivelyprovideeachplayer’sfloor,thisisn’twhollysurprising–havingsmallerdeviationsandranges,andanaveragethatcomesclosetothe“expected”valueof1.00showsthatthesestatisticscouldandshouldfunctionasthe“meatandpotatoes”ofaplayer’sscoring,withthetouchdownsbeingthemetaphoricalgravy.Speakingtoscoringplays,thenumbersarealloverthemap.Theaverageiseasilythehighest(notterriblysurprising,sinceitisn’tcrazytoassertthatthetop-50PPRreceiverswere,atthe

53
least,betterthanaverageatscoringtheball),andthestandarddeviationisoverthreetimesthatofRYR,andoverfourtimesthatofRRR.It’stherange,however,thatjumpsoutthemost.Thelowendofthespectrumiswellbelowaverage,andnearlytwofullunitsawayfromthehighend.ThetopendoftheRTRrangeisafullunitabovethoseofRRRandRYR,withthelowendsignificantlyloweraswell.ThisisexactlywhyIdon’twanttorelyontouchdownsasthebackboneofmyreceivers’fantasyscoring–they’resimplytoounpredictable,andthevarianceisfartoohigh.TherewillalwaysbeconsistentperformerslikeEricDeckerwhofunctionastheexceptionthatprovestherule,butbyandlargeIwanttheguyswhoperformbetterthanaveragewithreceptionsandyards.Anythingabove5-8yearlytouchdownswillalwaysbeabonusasfarasI’mconcerned.Gettingbacktothemetricalanalyses,thusfarbetweenthischapterandthelast,I’veshownabreakdownofeachofthethreescoringcomponentsforthePPRTop-50receivers,aswellashowtheyperformedineachaspectrelativetotheirrespectiveteams.Theperfectendgameofthesestatisticalsummationswouldnowbetocombinethetwo,whilealsothrowingleague-widetrendsintothemix.Assuch,I’dnowliketointroduceanotherseriesofmetrics:AggregateReceivingComputation,orARCforshort.Takingastepbackforamoment,youmayrecallearlierwhenIdiscussedthebreakdownofPPRfantasyscoringacrosstheentireNFL,inclusiveofeveryfantasypoint.Thatbreakdownisshownagainbelow:
ScoringComponent %ofLeague-WidePointsReceptions 38.6
Yards 44.5TDs 16.9
ThereasonI’mre-introducingthesenumbersisbecausetheycannowfunctionasdirectcomparativevaluestothenumbersinthepreviouschapter,whenIcalculatedthepercentagesofPPRpointsassignedtoeachcomponentforeachoftheTop-50PPRreceivers.Asanexample,ifIfocusedagainonMr.Baldwin,Iknowthat29.0%ofhis2015PPRpointscamefromreceptions.Comparedtotheleagueaverageof38.6%,thatpercentageisexactly0.75timesasmuchas(29.0%÷38.6%).Thiscalculationisimportant,becauseitwillutilizedtocomprisethevaluesinthe“%Points/Average”columnfortheARCtables.Movingon,inthischapterIpresentedthreerelativeratios:RRR,RYRandRTR.Asareminder,theseratiosservedtonormalizehowwellaplayergainedreceptions,yardsandtouchdownswithinthescopeofhisoffense.I’mbringingthisupagainbecauseittoowillbeusedasacomponentoftheARCmetric.CirclingbacktomyfavoriteSeahawkasmyexample,DougBaldwinfinished2015withaRRRvalueof1.11,essentiallystatingthathewasmuchbetterthanaverageatcollectingcatcheswithintheSeattlepassingoffense.

54
It’satthispointIcannowreconcilethetwovaluesfromtheprevioustwoparagraphs,asbothrepresentunit-lessratiosthatcanhaveanyofthefourmathematicalfunctionsappliedtothem.Solet’sdojustthat,andassuchI’llpresenttheformulasfortheARCratios:ARC-R=[RRR-(Player%Receptions÷Average)]/(Player%Receptions÷Average)ARC-Y=[RYR-(Player%Yards÷Average)]/(Player%Yards÷Average)ARC-T=[RTR-(Player%TDs÷Average)]/(Player%TDs÷Average)Onthesurfaces,theformulaslookdaunting,buttruthbetoldthey’renothingmorethananoffshootofthestandard“percenterror”calculationswealllearnedinfreshmanchemistry.Wecantreatthe“PlayerReceptions/Yards/TDs÷Average”asthestandardtheoreticalcomponent,asittakesintoaccounttheaverageacrosstheleague.WecanthentreattherelativeratioRRR/RYR/RTRasthevariablecomponent,asit’sessentiallytheexperimentalcalculationbasedonaperplayer/perteamsystem.Lookingatitfromthatviewpoint,whatwebasicallyhaveisourstandard“(Experimental–Actual)/Actual”formula.Solet’soncemoreturntoMr.Baldwin,andcalculatehisARC-R(aka,ARCforreceptions)score:BaldwinARC-R=[1.11–(29.0%÷38.6%)]/(29.0%÷38,6%)=0.480 BaldwinARC-R=(1.11–0.75)/0.75 BaldwinARC-R=0.36/0.75 BaldwinARC-R=0.480Sofinally,whatdoesthisnumberreallymean?Thenumerator,whichwindsupasarelativelylarge,positivefractionalnumber,essentiallystatesthatsinceBaldwinoutperformedtheaggregateofhisteamintermsofreceptionspermarketshare,it’sgoingtodwarfthefactthathispercentageofpointsscoredfromreceptionswereonly75%oftheleague’saverage.Dividingafractionbyafractionwillthenalwaysleadtoalargernumber,andassuchBaldwinfinisheswithanARC-Rvalueof0.480,whichwasenoughtoleadallofthe2015PPRTop-50receivers.Ofcourse,thisbegsthequestion–whydoesthismatter?AsImentionedearlierinthechapter,playersshouldn’tbe“punished”becauseonecomponentpercentageofPPRpointsdirectlyinfluencestheothertwo,giventhesetadditivevalueof100%.Thecalculationsoftherelativeratios(RRR,RYRandRTR)helpmitigatetheconfinesofthecomponentpercentages,andhelptellthestoryingreaterdetail.However,byrelatingbothtotheleagueaverageastheARCmetricsdo,wecaneffectuallygainaninsightastowhatmighthappenaplayer’soffensechanges.IftheSeahawkshavemorecompletionsin2016,Baldwin’s2015ARC-Rvaluetellsusthatheisextremelylikelytogainalargesliceofthatpie.Iftheoffensegotworse,he’dstillberelativelyinsulated.Conversely,ifaplayerhadapoorARC-Rvalue,suchasRedskinsreceiverPierre

55
Garcon,itwouldbeworrisomeifthepassingoffensedeteriorated,asheonlymettheleagueaveragewhilefallingbelowhisownteam’sstructure.Sowiththat(incrediblylengthy)introductioninhand,let’sgettothevalues!ShownfirstistheoutputfromtheARC-R(receptions)calculations,sortedinadescendingmannerwiththetrafficlightheatmapcolorationpattern.Theaverageisalsoshownatthebottomofthetable:
Name Team%PointsfromReceptions
%Points/Average(38.6%) RRR ARC-R
DougBaldwin SEA 29.0 0.75 1.11 0.480SammyWatkins BUF 27.4 0.71 1.02 0.431AllenHurns JAC 28.2 0.73 1.04 0.427
AllenRobinson JAC 26.3 0.68 0.91 0.329TylerLockett SEA 33.2 0.86 1.10 0.279
BrandonMarshall NYJ 31.8 0.82 1.05 0.278JermaineKearse SEA 33.2 0.86 1.09 0.267JohnBrown ARI 31.4 0.81 1.02 0.261
RuebenRandle NYG 30.9 0.80 1.01 0.259EricDecker NYJ 31.4 0.81 1.01 0.243
OdellBeckhamJr NYG 30.1 0.78 0.97 0.239AJGreen CIN 31.2 0.81 0.99 0.219
MichaelFloyd ARI 30.1 0.78 0.94 0.207JamesJones GB 26.7 0.69 0.83 0.201
LarryFitzgerald ARI 38.3 0.99 1.19 0.198TedGinnJr CAR 24.7 0.64 0.76 0.182
JulianEdelman NE 35.4 0.92 1.08 0.176JeremyMaclin KC 35.7 0.92 1.07 0.158AntonioBrown PIT 35.8 0.93 1.06 0.145DeAndreHopkins HOU 33.7 0.87 1.00 0.144DonteMoncrief IND 36.9 0.96 1.06 0.111ColeBeasley DAL 38.3 0.99 1.10 0.103
MarkusWheaton PIT 29.6 0.77 0.84 0.098BrandinCooks NO 33.3 0.86 0.94 0.093
JordanMatthews PHI 36.5 0.95 1.02 0.079KeenanAllen SD 41.0 1.06 1.14 0.070JulioJones ATL 36.6 0.95 1.01 0.069TYHilton IND 32.6 0.85 0.90 0.062
StefonDiggs MIN 35.1 0.91 0.96 0.050EmmanuelSanders DEN 33.7 0.87 0.91 0.046
AmariCooper OAK 33.5 0.87 0.90 0.035
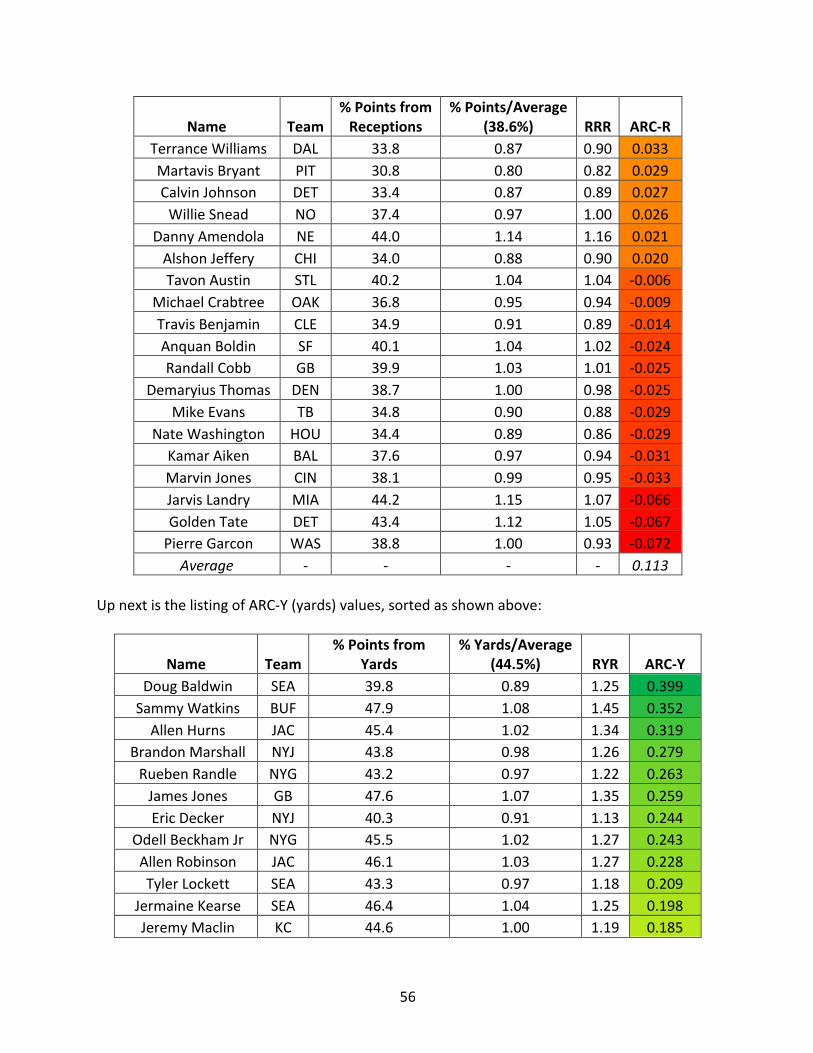
56
Name Team%PointsfromReceptions
%Points/Average(38.6%) RRR ARC-R
TerranceWilliams DAL 33.8 0.87 0.90 0.033MartavisBryant PIT 30.8 0.80 0.82 0.029CalvinJohnson DET 33.4 0.87 0.89 0.027WillieSnead NO 37.4 0.97 1.00 0.026
DannyAmendola NE 44.0 1.14 1.16 0.021AlshonJeffery CHI 34.0 0.88 0.90 0.020TavonAustin STL 40.2 1.04 1.04 -0.006
MichaelCrabtree OAK 36.8 0.95 0.94 -0.009TravisBenjamin CLE 34.9 0.91 0.89 -0.014AnquanBoldin SF 40.1 1.04 1.02 -0.024RandallCobb GB 39.9 1.03 1.01 -0.025
DemaryiusThomas DEN 38.7 1.00 0.98 -0.025MikeEvans TB 34.8 0.90 0.88 -0.029
NateWashington HOU 34.4 0.89 0.86 -0.029KamarAiken BAL 37.6 0.97 0.94 -0.031MarvinJones CIN 38.1 0.99 0.95 -0.033JarvisLandry MIA 44.2 1.15 1.07 -0.066GoldenTate DET 43.4 1.12 1.05 -0.067PierreGarcon WAS 38.8 1.00 0.93 -0.072
Average - - - - 0.113UpnextisthelistingofARC-Y(yards)values,sortedasshownabove:
Name Team%Pointsfrom
Yards%Yards/Average
(44.5%) RYR ARC-YDougBaldwin SEA 39.8 0.89 1.25 0.399SammyWatkins BUF 47.9 1.08 1.45 0.352AllenHurns JAC 45.4 1.02 1.34 0.319
BrandonMarshall NYJ 43.8 0.98 1.26 0.279RuebenRandle NYG 43.2 0.97 1.22 0.263JamesJones GB 47.6 1.07 1.35 0.259EricDecker NYJ 40.3 0.91 1.13 0.244
OdellBeckhamJr NYG 45.5 1.02 1.27 0.243AllenRobinson JAC 46.1 1.03 1.27 0.228TylerLockett SEA 43.3 0.97 1.18 0.209
JermaineKearse SEA 46.4 1.04 1.25 0.198JeremyMaclin KC 44.6 1.00 1.19 0.185
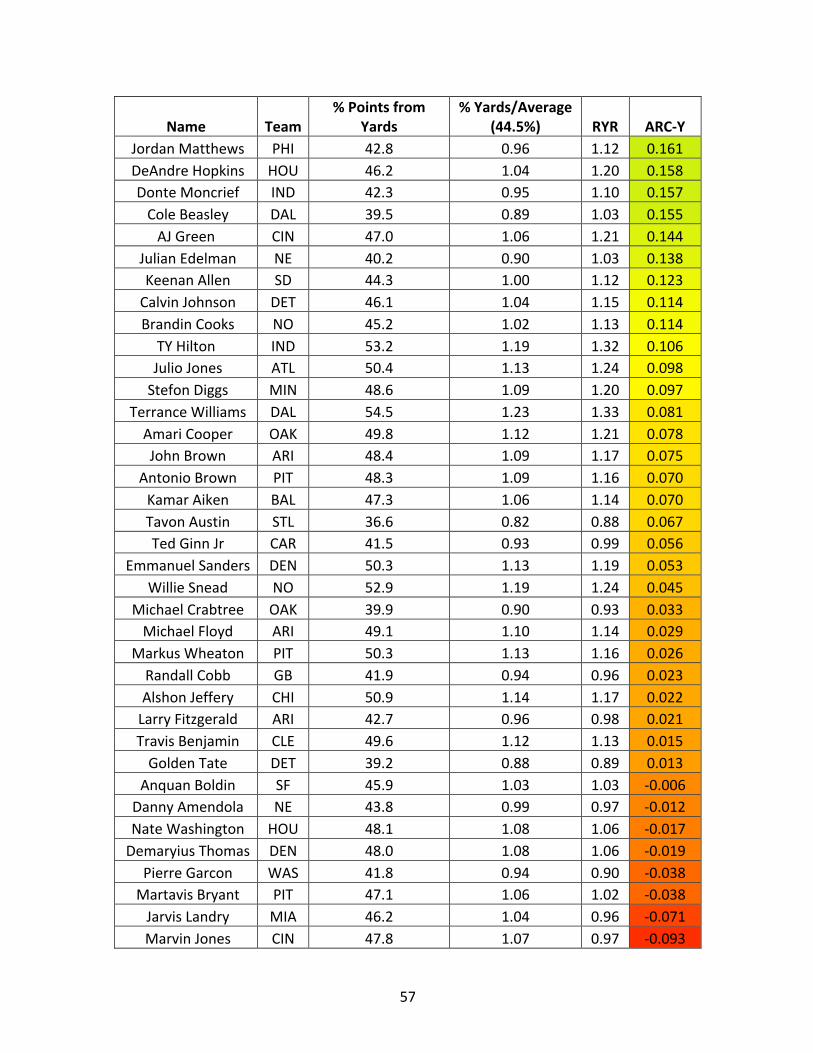
57
Name Team%Pointsfrom
Yards%Yards/Average
(44.5%) RYR ARC-YJordanMatthews PHI 42.8 0.96 1.12 0.161DeAndreHopkins HOU 46.2 1.04 1.20 0.158DonteMoncrief IND 42.3 0.95 1.10 0.157ColeBeasley DAL 39.5 0.89 1.03 0.155AJGreen CIN 47.0 1.06 1.21 0.144
JulianEdelman NE 40.2 0.90 1.03 0.138KeenanAllen SD 44.3 1.00 1.12 0.123CalvinJohnson DET 46.1 1.04 1.15 0.114BrandinCooks NO 45.2 1.02 1.13 0.114
TYHilton IND 53.2 1.19 1.32 0.106JulioJones ATL 50.4 1.13 1.24 0.098StefonDiggs MIN 48.6 1.09 1.20 0.097
TerranceWilliams DAL 54.5 1.23 1.33 0.081AmariCooper OAK 49.8 1.12 1.21 0.078JohnBrown ARI 48.4 1.09 1.17 0.075
AntonioBrown PIT 48.3 1.09 1.16 0.070KamarAiken BAL 47.3 1.06 1.14 0.070TavonAustin STL 36.6 0.82 0.88 0.067TedGinnJr CAR 41.5 0.93 0.99 0.056
EmmanuelSanders DEN 50.3 1.13 1.19 0.053WillieSnead NO 52.9 1.19 1.24 0.045
MichaelCrabtree OAK 39.9 0.90 0.93 0.033MichaelFloyd ARI 49.1 1.10 1.14 0.029
MarkusWheaton PIT 50.3 1.13 1.16 0.026RandallCobb GB 41.9 0.94 0.96 0.023AlshonJeffery CHI 50.9 1.14 1.17 0.022LarryFitzgerald ARI 42.7 0.96 0.98 0.021TravisBenjamin CLE 49.6 1.12 1.13 0.015GoldenTate DET 39.2 0.88 0.89 0.013AnquanBoldin SF 45.9 1.03 1.03 -0.006
DannyAmendola NE 43.8 0.99 0.97 -0.012NateWashington HOU 48.1 1.08 1.06 -0.017DemaryiusThomas DEN 48.0 1.08 1.06 -0.019
PierreGarcon WAS 41.8 0.94 0.90 -0.038MartavisBryant PIT 47.1 1.06 1.02 -0.038JarvisLandry MIA 46.2 1.04 0.96 -0.071MarvinJones CIN 47.8 1.07 0.97 -0.093

58
Name Team%Pointsfrom
Yards%Yards/Average
(44.5%) RYR ARC-YMikeEvans TB 56.8 1.28 1.10 -0.136Average - - - - 0.102
Finally,shownbelowaretheARC-T(touchdowns)values,sortedasshownabove:
Name Team%Pointsfrom
TDs%TDs/Average
(16.9%) RTR ARC-TTavonAustin STL 23.2 1.37 2.47 0.800ColeBeasley DAL 22.1 1.31 2.20 0.681StefonDiggs MIN 16.2 0.96 1.54 0.609
TerranceWilliams DAL 11.7 0.69 1.09 0.573JulioJones ATL 12.9 0.77 1.17 0.523
EmmanuelSanders DEN 16.0 0.94 1.40 0.479KamarAiken BAL 15.0 0.89 1.28 0.435AnquanBoldin SF 14.0 0.83 1.18 0.434
JordanMatthews PHI 20.6 1.22 1.69 0.387DemaryiusThomas DEN 13.3 0.78 1.08 0.377SammyWatkins BUF 24.7 1.46 1.96 0.339TravisBenjamin CLE 15.4 0.91 1.22 0.335JeremyMaclin KC 19.7 1.16 1.53 0.310AntonioBrown PIT 15.8 0.94 1.18 0.256MarkusWheaton PIT 20.1 1.19 1.44 0.205AlshonJeffery CHI 15.1 0.89 1.06 0.184KeenanAllen SD 14.7 0.87 1.00 0.150BrandinCooks NO 21.4 1.27 1.45 0.147MartavisBryant PIT 22.2 1.31 1.48 0.129DonteMoncrief IND 20.8 1.23 1.36 0.107WillieSnead NO 9.6 0.57 0.61 0.076TYHilton IND 14.2 0.84 0.89 0.058
DougBaldwin SEA 31.2 1.85 1.95 0.058AllenHurns JAC 26.4 1.56 1.65 0.056JarvisLandry MIA 9.6 0.57 0.59 0.037
DeAndreHopkins HOU 20.1 1.19 1.22 0.031BrandonMarshall NYJ 24.5 1.45 1.48 0.023
MikeEvans TB 8.5 0.50 0.50 0.005RuebenRandle NYG 26.0 1.54 1.54 0.000EricDecker NYJ 28.3 1.67 1.66 -0.005

59
Name Team%Pointsfrom
TDs%TDs/Average
(16.9%) RTR ARC-TOdellBeckhamJr NYG 24.5 1.45 1.42 -0.016AllenRobinson JAC 27.6 1.64 1.61 -0.017JamesJones GB 25.7 1.52 1.49 -0.017
JulianEdelman NE 24.4 1.44 1.39 -0.037AJGreen CIN 21.8 1.29 1.23 -0.042
CalvinJohnson DET 20.5 1.21 1.16 -0.046JohnBrown ARI 20.3 1.20 1.11 -0.072TylerLockett SEA 23.5 1.39 1.27 -0.086
JermaineKearse SEA 20.3 1.20 1.09 -0.095MichaelFloyd ARI 20.8 1.23 1.09 -0.111LarryFitzgerald ARI 19.0 1.12 0.99 -0.119NateWashington HOU 17.5 1.04 0.91 -0.125PierreGarcon WAS 19.4 1.15 1.00 -0.128GoldenTate DET 17.4 1.03 0.89 -0.133
DannyAmendola NE 12.2 0.72 0.60 -0.164AmariCooper OAK 16.7 0.99 0.82 -0.171RandallCobb GB 18.2 1.08 0.86 -0.201
MichaelCrabtree OAK 23.4 1.38 1.10 -0.206MarvinJones CIN 14.1 0.83 0.63 -0.240TedGinnJr CAR 33.7 2.00 1.48 -0.261Average - - - - 0.110
Asalways,we’llsumuptheseriesofARCmetricsinasingletable,sortedbyplayername:
Name Team ARC-R ARC-Y ARC-TAllenHurns JAC 0.427 0.319 0.056
AllenRobinson JAC 0.329 0.228 -0.017AlshonJeffery CHI 0.020 0.022 0.184AmariCooper OAK 0.035 0.078 -0.171AnquanBoldin SF -0.024 -0.006 0.434AntonioBrown PIT 0.145 0.070 0.256BrandinCooks NO 0.093 0.114 0.147
BrandonMarshall NYJ 0.278 0.279 0.023CalvinJohnson DET 0.027 0.114 -0.046ColeBeasley DAL 0.103 0.155 0.681
DannyAmendola NE 0.021 -0.012 -0.164DeAndreHopkins HOU 0.144 0.158 0.031DemaryiusThomas DEN -0.025 -0.019 0.377

60
Name Team ARC-R ARC-Y ARC-TDonteMoncrief IND 0.111 0.157 0.107DougBaldwin SEA 0.480 0.399 0.058
EmmanuelSanders DEN 0.046 0.053 0.479EricDecker NYJ 0.243 0.244 -0.005GoldenTate DET -0.067 0.013 -0.133JamesJones GB 0.201 0.259 -0.017JarvisLandry MIA -0.066 -0.071 0.037JeremyMaclin KC 0.158 0.185 0.310JermaineKearse SEA 0.267 0.198 -0.095JohnBrown ARI 0.261 0.075 -0.072
JordanMatthews PHI 0.079 0.161 0.387JulianEdelman NE 0.176 0.138 -0.037JulioJones ATL 0.069 0.098 0.523KamarAiken BAL -0.031 0.070 0.435KeenanAllen SD 0.070 0.123 0.150LarryFitzgerald ARI 0.198 0.021 -0.119MarkusWheaton PIT 0.098 0.026 0.205MartavisBryant PIT 0.029 -0.038 0.129MarvinJones CIN -0.033 -0.093 -0.240
MichaelCrabtree OAK -0.009 0.033 -0.206MichaelFloyd ARI 0.207 0.029 -0.111MikeEvans TB -0.029 -0.136 0.005
NateWashington HOU -0.029 -0.017 -0.125OdellBeckhamJr NYG 0.239 0.243 -0.016PierreGarcon WAS -0.072 -0.038 -0.128RandallCobb GB -0.025 0.023 -0.201RuebenRandle NYG 0.259 0.263 0.000SammyWatkins BUF 0.431 0.352 0.339StefonDiggs MIN 0.050 0.097 0.609TavonAustin STL -0.006 0.067 0.800TedGinnJr CAR 0.182 0.056 -0.261
TerranceWilliams DAL 0.033 0.081 0.573TravisBenjamin CLE -0.014 0.015 0.335TylerLockett SEA 0.279 0.209 -0.086WillieSnead NO 0.026 0.045 0.076AJGreen CIN 0.219 0.144 -0.042TYHilton IND 0.062 0.106 0.058Average - 0.113 0.102 0.110

61
BynowIbelieveI’vedonejustabouteverythingIpossiblycanasitrelatestodecipheringwhyeachofthePPRTop-50receiversfinishedwheretheydidinthepass-catchinghierarchy,andalsohowtheygotthere.Assuchit’stimetotakeseveralstepsbackandstartlookingintowhatmatters–thepointstheseguysareputtingupforourfantasyteams.Movingforwardinthecomingchapters,thatwilltakemoreprecedence,butdon’tworry–spoileralert!–themetricswillmakeonefinalappearance.
62
WEEKLYFANTASYRELIABILITY
IntheimmortalwordsofHermEdwards,“Youplay…towin…thegame!”BasicallyeverymetricI’vepresentedthusfar,whetheritberelatedtofantasyorreallifefootball,isnothingmorethananexplanationofcompiledstatisticsoranattemptatapredictivequantity.ObviouslyIbelievethisisincrediblyimportantorIwouldn’thavespentmonthsthinkingthemup,runningthenumbers,andjottingdownmythoughts.Butattheendoftheday,ourplayersneedtoposttheirnumberswhereitmatters–inthefantasyboxscores.Continuing,I’mofthelineofreasoningthattherearethreemajortypesoffantasyscorers:
1. Theconsistentfantasycontributors2. Theboom/bustguys3. Theaggregators
Thefirstgroupingisobviouslycomprisedofthetypeofplayerswestrivetoown–guyswhoareprovidingyouwithstart-ableproductionmoreoftenthannot,andwhoalsopossessahigh-endceiling.Thesecondsetofplayersalsohavetheabilityforarobustfantasyceiling,butgoodluckpickingandchoosingthecorrectweeksforstartingthemasthey’rejustaslikelytodeliveryouabigfatzeroastheyareweeklyWR1production.Thelastgroupisperhapsthesneakiest–theaggregatorsarethosewhodon’tmisstimeandcollectenoughtargetstoremainfantasyviable,buttruthfullydon’teverblowyouaway.Yetattheendoftheyear,theretheyare,somehowamongstthepositionalupperechelon.Duetoinjuriesthisistypicallysomethingweseemorewithrunningbacks,butitcanhappenwithreceiversaswell.Inordertodiscernwhatclassofplayerareceiverbelongsto,weneedtodigdeeperthantheyear-endstats.Todoso,itbecomesprudenttotreateachweekasaseriesof“one-gameseasons.”Inotherwords,atyear’sendweclassifythePPRWR1throughWR12asthePPRWR1class(obviouslyassuminga12-teamleague),andsoondownthelist.Wecanalsodothatforeveryweekoftheseason,andthenaggregatetheincidencesofeachtypeoffinish(WR1,WR2,WR3,etc.)togainasenseofeachplayer’sfantasyreliability.Indoingthis,weneedameansofqualifyingeveryweek.I’vechosentousea12-teamleagueasmyblueprint,meaningthateachweektherecanonlybe12playersintheWR1class,12intheWR2class,andsoon.Assuch,thefantasyfinishescanbebrokendownasfollows:

63
Rank WeeklyFinishWR1 1-12WR2 13-24WR3 25-36WR4 37-48WR5+ >48
IunderstandthatanotherschoolofthoughtsuggestsIcould’veusedaweeklyPPRpointsscoredaverageasacut-off,asopposedtoweeklyrank.WhileI’mnotcompletelyopposedtothatlogic,Ialsobelievethateveryweekisdifferent–playersgetnickedupduringtheyear,includingbothtotheplayerhimselfandtohissupportingcast.Theseasonisamarathon,notasprint.Assuch,Idon’twanttoplaceanartificialnumericalguidelineoneachweek,giventhat,quitefrankly,everyweekintheseasonisdifferent.Also,it’ssimplymorestraightforwardtouseweeklyranks,astheyarewhattheyare–there’snomassagingthenumbers,andallthe“Yeah,but…”qualifiersareeliminated.AsIbelievethisisafairlystraightforwardprocess,let’sstartwiththepercentincidencesthateachplayerfinishedasaweeklyPPRWR1.Thenumbersareshowninadescendingmannerasperthepercentages,withthetrafficlightheatmapincludedasavisualaid.Notethattheaverageisincludedatthebottomofthetable,andalsothatthenumberofgameseachplayerplayedhasitsowncolumn.Thisisobviouslyimportant,asaseriesofeliteperformancesoverthecourseofanentireseasonismoreimpressivethanwhenaplayermissestime,butwealsocan’tdiscounttheguyswhogotinjured.Ifwelookedatthisasthenumberofincidencesinsteadofapercentage,theplayerswhomissedtimewouldgetburiedduetoasimplelackofdata.Withthepercentages,wecanstillseeexactlyhowgoodtheywere,evenifwasalimitedsamplesize.TheWR1numbersareshownbelow:
Name Team Games WR1%JulioJones ATL 16 62.5
BrandonMarshall NYJ 16 56.3AntonioBrown PIT 16 50.0OdellBeckham NYG 15 46.7AlshonJeffery CHI 9 44.4JulianEdelman NE 9 44.4DeAndreHopkins HOU 16 43.8AllenRobinson JAX 16 37.5BrandinCooks NO 16 37.5CalvinJohnson DET 16 37.5KeenanAllen SD 8 37.5
EmmanuelSanders DEN 15 33.3MikeEvans TB 15 33.3

64
Name Team Games WR1%DemaryiusThomas DEN 16 31.3
DougBaldwin SEA 16 31.3JarvisLandry MIA 16 31.3
JordanMatthews PHI 16 31.3LarryFitzgerald AZ 16 31.3
AJGreen CIN 16 31.3SammyWatkins BUF 13 30.8MartavisBryant PIT 11 27.3AllenHurns JAX 15 26.7
JeremyMaclin KC 15 26.7DannyAmendola NE 14 21.4
TedGinn CAR 14 21.4AmariCooper OAK 16 18.8JamesJones GB 16 18.8EricDecker NYJ 15 13.3
MichaelFloyd AZ 15 13.3WillieSnead NO 15 13.3ColeBeasley DAL 16 12.5KamarAiken BAL 16 12.5
MichaelCrabtree OAK 16 12.5PierreGarcon WSH 16 12.5TavonAustin STL 16 12.5
TerranceWilliams DAL 16 12.5TravisBenjamin CLE 16 12.5TylerLockett SEA 16 12.5TYHilton IND 16 12.5
NateWashington HOU 13 7.7StefonDiggs MIN 13 7.7AnquanBoldin SF 14 7.1JohnBrown AZ 15 6.7
DonteMoncrief IND 16 6.3GoldenTate DET 16 6.3
MarkusWheaton PIT 16 6.3MarvinJones CIN 16 6.3RandallCobb GB 16 6.3RuebenRandle NYG 16 6.3JermaineKearse SEA 16 0.0
Average - - 23.3

65
Next,I’vesummeduptheincidencesofPPRWR1+WR2finishes,andthenconvertedthemtopercentages.Whilethislowersthebaralittlebit,thefactisaTop-24finishisgoingtobeastart-ableinvirtuallyeveryleagueformat.Inotherwords,thisremainshighpraise:
Name Team Games WR1+WR2%JulianEdelman NE 9 77.8
BrandonMarshall NYJ 16 75.0JulioJones ATL 16 75.0
OdellBeckham NYG 15 73.3AntonioBrown PIT 16 68.8DeAndreHopkins HOU 16 68.8DemaryiusThomas DEN 16 68.8AllenRobinson JAX 16 62.5KeenanAllen SD 8 62.5LarryFitzgerald AZ 16 62.5SammyWatkins BUF 13 61.5
EmmanuelSanders DEN 15 60.0EricDecker NYJ 15 60.0
CalvinJohnson DET 16 56.3MartavisBryant PIT 11 54.5JeremyMaclin KC 15 53.3JohnBrown AZ 15 53.3JarvisLandry MIA 16 50.0MikeEvans TB 15 46.7
AlshonJeffery CHI 9 44.4AmariCooper OAK 16 43.8BrandinCooks NO 16 43.8DougBaldwin SEA 16 43.8AJGreen CIN 16 43.8
AnquanBoldin SF 14 42.9TedGinn CAR 14 42.9
AllenHurns JAX 15 40.0MichaelFloyd AZ 15 40.0WillieSnead NO 15 40.0JamesJones GB 16 37.5
JordanMatthews PHI 16 37.5KamarAiken BAL 16 37.5
TravisBenjamin CLE 16 37.5DannyAmendola NE 14 35.7
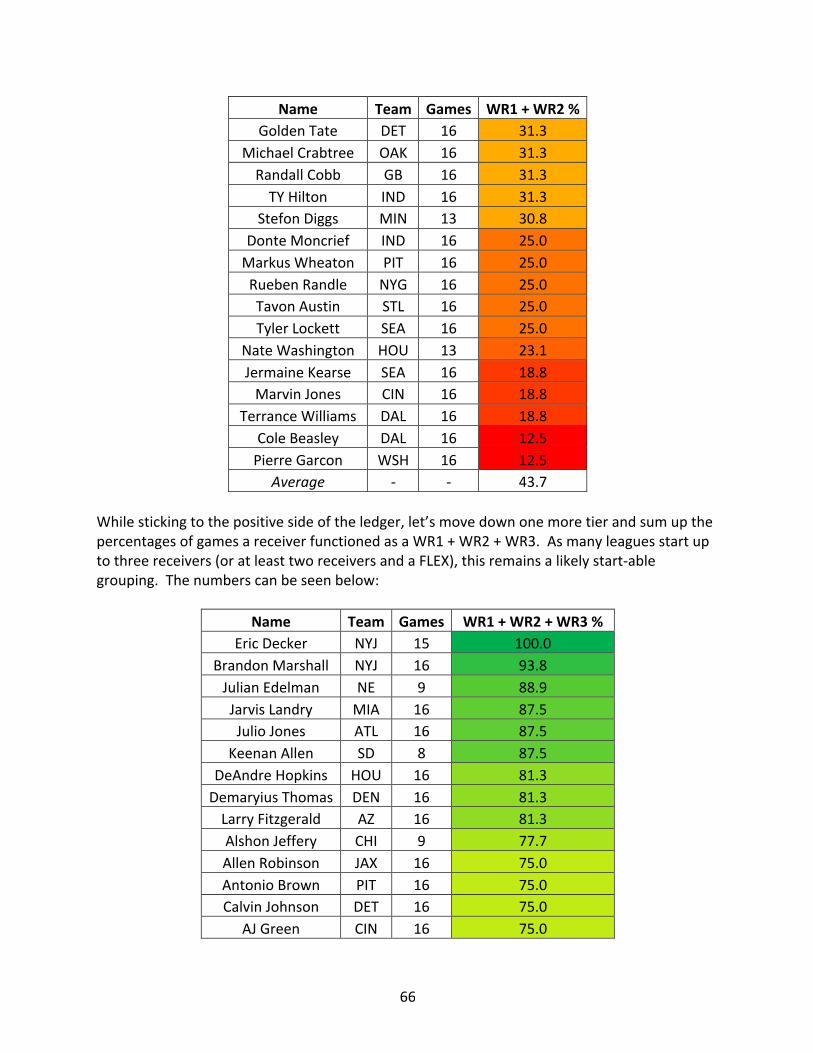
66
Name Team Games WR1+WR2%GoldenTate DET 16 31.3
MichaelCrabtree OAK 16 31.3RandallCobb GB 16 31.3TYHilton IND 16 31.3
StefonDiggs MIN 13 30.8DonteMoncrief IND 16 25.0MarkusWheaton PIT 16 25.0RuebenRandle NYG 16 25.0TavonAustin STL 16 25.0TylerLockett SEA 16 25.0
NateWashington HOU 13 23.1JermaineKearse SEA 16 18.8MarvinJones CIN 16 18.8
TerranceWilliams DAL 16 18.8ColeBeasley DAL 16 12.5PierreGarcon WSH 16 12.5
Average - - 43.7Whilestickingtothepositivesideoftheledger,let’smovedownonemoretierandsumupthepercentagesofgamesareceiverfunctionedasaWR1+WR2+WR3.Asmanyleaguesstartuptothreereceivers(oratleasttworeceiversandaFLEX),thisremainsalikelystart-ablegrouping.Thenumberscanbeseenbelow:
Name Team Games WR1+WR2+WR3%EricDecker NYJ 15 100.0
BrandonMarshall NYJ 16 93.8JulianEdelman NE 9 88.9JarvisLandry MIA 16 87.5JulioJones ATL 16 87.5
KeenanAllen SD 8 87.5DeAndreHopkins HOU 16 81.3DemaryiusThomas DEN 16 81.3LarryFitzgerald AZ 16 81.3AlshonJeffery CHI 9 77.7AllenRobinson JAX 16 75.0AntonioBrown PIT 16 75.0CalvinJohnson DET 16 75.0
AJGreen CIN 16 75.0

67
Name Team Games WR1+WR2+WR3%OdellBeckham NYG 15 73.3MartavisBryant PIT 11 72.7SammyWatkins BUF 13 69.2MichaelCrabtree OAK 16 68.8EmmanuelSanders DEN 15 66.7JeremyMaclin KC 15 66.7JohnBrown AZ 15 66.7GoldenTate DET 16 62.5KamarAiken BAL 16 62.5AllenHurns JAX 15 60.0TedGinn CAR 14 57.1
BrandinCooks NO 16 56.3DougBaldwin SEA 16 56.3TYHilton IND 16 56.3
WillieSnead NO 15 53.3MikeEvans TB 15 53.3
AmariCooper OAK 16 50.0AnquanBoldin SF 14 50.0DonteMoncrief IND 16 50.0JermaineKearse SEA 16 50.0JordanMatthews PHI 16 50.0TravisBenjamin CLE 16 50.0DannyAmendola NE 14 50.0MichaelFloyd AZ 15 46.7StefonDiggs MIN 13 46.2JamesJones GB 16 43.8PierreGarcon WSH 16 43.8RandallCobb GB 16 43.8RuebenRandle NYG 16 43.8MarvinJones CIN 16 37.5TavonAustin STL 16 37.5
TerranceWilliams DAL 16 37.5MarkusWheaton PIT 16 31.3TylerLockett SEA 16 31.3
NateWashington HOU 13 30.8ColeBeasley DAL 16 18.8Average - - 60.7

68
Movingtotheotherendofthespectrum,weneedtolookintothepercentagesoftimeseachreceivercould’velaidwastetoyourstartinglineup.TraditionallyI’dsumthisupasWR4+WR5finishes,buttruthbetoldyoucanjustsubtractthenumbersinthetableabovefrom100andgetthosevalues.Also,there’samodicumofachancethataWR4couldbeastart-ableentity,dependingonyourleaguesettings.I’mnotsayingit’ssomethingyoushouldstrivefor,butinadeeperformatyoucouldprobablydoworse.Assuch,I’vechosentostickwiththepercentageofWR5orworse(i.e.weeklyrankingsofWR49+)asthebarometerhere.Barringsomekindofcrazyleaguesetting,there’snowayyouwantthesetypesofperformancesanywherenearyourstartinglineup.Giventhat,thenumbersarenowsortedinanascendingmanner,withthelowerpercentagesobviouslybetter.Theycanbeseenbelow:
Name Team Games WR5+%BrandonMarshall NYJ 16 0.0
EricDecker NYJ 15 0.0JulianEdelman NE 9 0.0
DemaryiusThomas DEN 16 6.3JarvisLandry MIA 16 6.3JulioJones ATL 16 6.3
AllenRobinson JAX 16 12.5DeAndreHopkins HOU 16 12.5KeenanAllen SD 8 12.5LarryFitzgerald AZ 16 12.5
AJGreen CIN 16 12.5OdellBeckham NYG 15 13.3MartavisBryant PIT 11 18.2AntonioBrown PIT 16 18.8CalvinJohnson DET 16 18.8KamarAiken BAL 16 18.8
MichaelCrabtree OAK 16 18.8PierreGarcon WSH 16 18.8AlshonJeffery CHI 9 22.2AmariCooper OAK 16 25.0GoldenTate DET 16 25.0
RuebenRandle NYG 16 25.0AllenHurns JAX 15 26.7
JeremyMaclin KC 15 26.7JohnBrown AZ 15 26.7MikeEvans TB 15 26.7

69
Name Team Games WR5+%TedGinn CAR 14 28.6
SammyWatkins BUF 13 30.8BrandinCooks NO 16 31.3DougBaldwin SEA 16 31.3
JordanMatthews PHI 16 31.3RandallCobb GB 16 31.3
EmmanuelSanders DEN 15 33.3WillieSnead NO 15 33.3MarvinJones CIN 16 37.5
TravisBenjamin CLE 16 37.5TYHilton IND 16 37.5
MichaelFloyd AZ 15 40.0DonteMoncrief IND 16 43.8JamesJones GB 16 43.8
JermaineKearse SEA 16 43.8TavonAustin STL 16 43.8StefonDiggs MIN 13 46.2AnquanBoldin SF 14 50.0
DannyAmendola NE 14 50.0TerranceWilliams DAL 16 56.3NateWashington HOU 13 61.5MarkusWheaton PIT 16 62.5ColeBeasley DAL 16 68.8TylerLockett SEA 16 68.8Average - - 28.7
Tosumitallup,thebelowtableshowseachtypeofpercentincidenceforall50receivers,sortedalphabetically:
Name Team Games WR1% WR2% WR3% WR4% WR5+%AllenHurns JAX 15 26.7 13.3 20.0 13.3 26.7
AllenRobinson JAX 16 37.5 25.0 12.5 12.5 12.5AlshonJeffery CHI 9 44.4 0.0 33.3 0.0 22.2AmariCooper OAK 16 18.8 25.0 6.3 25.0 25.0AnquanBoldin SF 14 7.1 35.7 7.1 0.0 50.0AntonioBrown PIT 16 50.0 18.8 6.3 6.3 18.8BrandinCooks NO 16 37.5 6.3 12.5 12.5 31.3
BrandonMarshall NYJ 16 56.3 18.8 18.8 6.3 0.0

70
Name Team Games WR1% WR2% WR3% WR4% WR5+%CalvinJohnson DET 16 37.5 18.8 18.8 6.3 18.8ColeBeasley DAL 16 12.5 0.0 6.3 12.5 68.8
DannyAmendola NE 14 21.4 14.3 14.3 0.0 50.0DeAndreHopkins HOU 16 43.8 25.0 12.5 6.3 12.5DemaryiusThomas DEN 16 31.3 37.5 12.5 12.5 6.3DonteMoncrief IND 16 6.3 18.8 25.0 6.3 43.8DougBaldwin SEA 16 31.3 12.5 12.5 12.5 31.3
EmmanuelSanders DEN 15 33.3 26.7 6.7 0.0 33.3EricDecker NYJ 15 13.3 46.7 40.0 0.0 0.0GoldenTate DET 16 6.3 25.0 31.3 12.5 25.0JamesJones GB 16 18.8 18.8 6.3 12.5 43.8JarvisLandry MIA 16 31.3 18.8 37.5 6.3 6.3JeremyMaclin KC 15 26.7 26.7 13.3 6.7 26.7JermaineKearse SEA 16 0.0 18.8 31.3 6.3 43.8JohnBrown AZ 15 6.7 46.7 13.3 6.7 26.7
JordanMatthews PHI 16 31.3 6.3 12.5 18.8 31.3JulianEdelman NE 9 44.4 33.3 11.1 11.1 0.0JulioJones ATL 16 62.5 12.5 12.5 6.3 6.3KamarAiken BAL 16 12.5 25.0 25.0 18.8 18.8KeenanAllen SD 8 37.5 25.0 25.0 0.0 12.5LarryFitzgerald AZ 16 31.3 31.3 18.8 6.3 12.5MarkusWheaton PIT 16 6.3 18.8 6.3 6.3 62.5MartavisBryant PIT 11 27.3 27.3 18.2 9.1 18.2MarvinJones CIN 16 6.3 12.5 18.8 25.0 37.5
MichaelCrabtree OAK 16 12.5 18.8 37.5 12.5 18.8MichaelFloyd AZ 15 13.3 26.7 6.7 13.3 40.0MikeEvans TB 15 33.3 13.3 6.7 20.0 26.7
NateWashington HOU 13 7.7 15.4 7.7 7.7 61.5OdellBeckham NYG 15 46.7 26.7 0.0 13.3 13.3PierreGarcon WSH 16 12.5 0.0 31.3 37.5 18.8RandallCobb GB 16 6.3 25.0 12.5 25.0 31.3RuebenRandle NYG 16 6.3 18.8 18.8 31.3 25.0SammyWatkins BUF 13 30.8 30.8 7.7 0.0 30.8StefonDiggs MIN 13 7.7 23.1 15.4 7.7 46.2TavonAustin STL 16 12.5 12.5 12.5 18.8 43.8TedGinn CAR 14 21.4 21.4 14.3 14.3 28.6
TerranceWilliams DAL 16 12.5 6.3 18.8 6.3 56.3TravisBenjamin CLE 16 12.5 25.0 12.5 12.5 37.5

71
Name Team Games WR1% WR2% WR3% WR4% WR5+%TylerLockett SEA 16 12.5 12.5 6.3 0.0 68.8WillieSnead NO 15 13.3 26.7 13.3 13.3 33.3AJGreen CIN 16 31.3 12.5 31.3 12.5 12.5TYHilton IND 16 12.5 18.8 25.0 6.3 37.5Average - - 23.3 20.5 16.9 10.6 28.7
Withthosenumbersinhand,it’stimetocombinethemwithmyweeklyAIRcalculationsinordertodeciphertheultimatefantasyhierarchy–whowasdoingitthebest,andthemostefficiently?Readonforthegrandfinale…

72
DECIPHERINGTHEFANTASYRECEIVERHIERARCHY
Obviouslyscoringfantasypointsremainsthebottomline.However,theHolyGrailofreceiverboxscorescoutingshouldbefindingplayerswhoareabletonotonlyscoreabunchofpoints,butdosoinanefficientmanner.Thereasonsremainrelativelystraightforward:
1. Iftheoffenseasawholefalters,thereceivershouldstillbeabletotranscendhissituation.
2. Ifthereceivercollectsfewertargets,he’llstillbeabletodothemostdamagewiththemandremainrelativelyinsulated.
3. Iftheoffensegetsbetter,oriftheplayeraccruesmorelooks,hecouldwindupasanelitefantasyasset.
Inotherwords,ifweconsiderthetwoasacombinedfunction,fantasyscoringistheconstant,andefficiencyisthevariable.Ifyoumultiplythetwotogether,thefinalresultisgoingtodependonthevariable,andthuswewanttoseeahigherefficiencymetric.Again,asmentionedinthefirstparagraph,inmyestimationthebestplayersshouldbeeliteinboth.Giventhat,whycan’twecombinethetwoinordertogiveusthebestapproximationofatruefantasyreceiverhierarchy?I’vealreadyshownthataplayer’sweeklyoutputcanbequantifiedfrombothperspectives,andassuchitseemssensibletopooltheseresultsintoafinalfantasydeterminant.Continuing,giventheabilitytotabulateweeklyresults,there’snoreasonwecan’ttakethecumulativeproductionandlookattheseason’sworthofdata.Naturally,I’llattempttodojustthat…Startingwithefficiency,I’mobviouslygoingtousetheAIRmetric–thefirstbornisalwaysgoingtobethefavorite,right?Specifically,I’llusetheAIRscoresforeachweek,asclassifiedusingthetableIshowedpreviously:
GameType WeeklyAIRTank ≤0.64
BelowAverage 0.65-0.89AboutAverage 0.90-1.10AboveAverage 1.11-1.35
Superstar ≥1.36Therearefiveseparatetiersforweeklyoutput,andassuchit’seasytocreateaslidingscale.Moreonthatinjustabit.Movingontothefantasypointsportion,Ijustshowedinthelastchapterthatit’srelativelystraightforwardtoquantifyhowwellaplayerperforms,byvirtueoftheirweeklyfinish.Asareminder,thattablecanbeseenbelow:

73
Rank WeeklyFinishWR1 1-12WR2 13-24WR3 25-36WR4 37-48WR5+ >48
Onceagainwehavefivedistinctcategories,meaningwecanagainutilizeaslidingscale.Butwhat’sthebestwaytodoit?WhileI’mnotsureifit’sthemostmathematicallyprecise(spoileralert:it’snot,butwe’vehadenoughofthatalready,right?),IthinkthemostdirectmethodologyforgradingthefivecategoriesforbothweeklyAIRandweeklyfantasyfinishisonascalefromonetofive.Intermsofrelativesubjectivity,Ithinkit’safairlyobjectiveprocess.Italsomeanswehavethemakingsofacross-multiplicationscheme,whichcanbeseenbelow: Superstar(5) AboveAverage(4) AboutAverage(3) BelowAverage(2) Tank(1)
WR1(5) 25 20 15 10 5WR2(4) 20 16 12 8 4WR3(3) 15 12 9 6 3WR4(2) 10 8 6 4 2WR5+(1) 5 4 3 2 1Intheleft-mostcolumnarethefivepotentialweeklytiers,withtheirassociatedscoresinparentheses.Notethatthehighestscore(5)correlatestothebesttierfinish(WR1),andsoondownthelist.InthetoprowarethefiveAIRscoretiers,withthesameslidingscaleofscores(shownagaininparentheses)asitrelatesfromthebestcategorytotheworst.Giventhetwosetsofqualifiersandtheirrespectiveslidingscalesofscores,wehave25possibleuniqueweeklycombinations.Iftheindividualscoresofeachqualifieraremultipliedtogether,wealsohave25associatedscores.Forexample,ifaplayerwasaweeklyWR1andfunctionedwithSuperstarAIRefficiency,wecansimplyfindthecellinthetableabovewheretheyintersect(topleft)andfindthemultiplicativescore(5x5=25).IfaplayerwasaweeklyWR3withBelowAverageefficiency,hisscorewouldthenbe3x2=6.Andsoonandsoon…Wecantabulatethesecombinedscoresforeveryplayer,foreveryweektheywereactive.Again,wehavethenecessarydata–weknowwheretheyfinishedeachweekwithregardstotheirpositionalpeers(IusedFFTodayasmysource),andthesubsequentAIRscoresarecalculatedbyyourstruly.Alltold,wecanproduceaseasonalplayertableliketheoneshownonthenextpage,containingallthepertinentpieces(I’lluseAllenHurnsasmyexample).PleasenotethattablesforEVERYplayercanbefoundintheAddendumtothisstudy,completewithbyeweeksandgamesmissedduetoinjury(denotedas“N/A”)included:
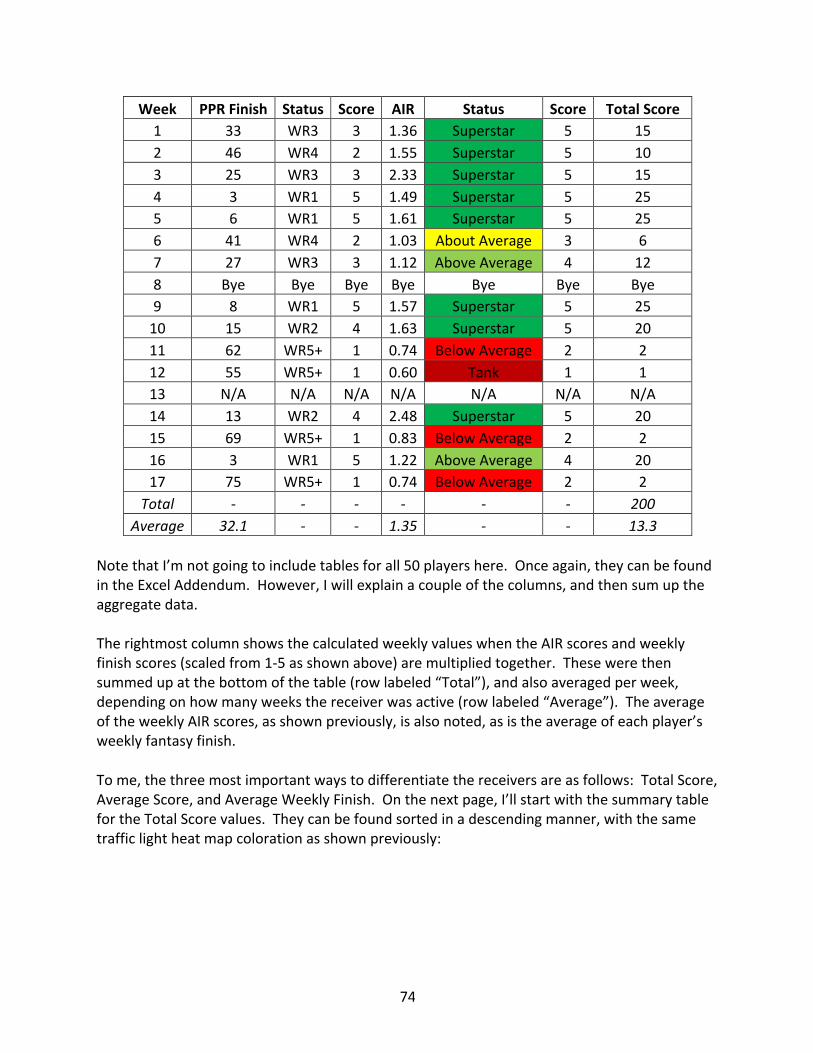
74
Week PPRFinish Status Score AIR Status Score TotalScore1 33 WR3 3 1.36 Superstar 5 152 46 WR4 2 1.55 Superstar 5 103 25 WR3 3 2.33 Superstar 5 154 3 WR1 5 1.49 Superstar 5 255 6 WR1 5 1.61 Superstar 5 256 41 WR4 2 1.03 AboutAverage 3 67 27 WR3 3 1.12 AboveAverage 4 128 Bye Bye Bye Bye Bye Bye Bye9 8 WR1 5 1.57 Superstar 5 2510 15 WR2 4 1.63 Superstar 5 2011 62 WR5+ 1 0.74 BelowAverage 2 212 55 WR5+ 1 0.60 Tank 1 113 N/A N/A N/A N/A N/A N/A N/A14 13 WR2 4 2.48 Superstar 5 2015 69 WR5+ 1 0.83 BelowAverage 2 216 3 WR1 5 1.22 AboveAverage 4 2017 75 WR5+ 1 0.74 BelowAverage 2 2
Total - - - - - - 200Average 32.1 - - 1.35 - - 13.3
NotethatI’mnotgoingtoincludetablesforall50playershere.Onceagain,theycanbefoundintheExcelAddendum.However,Iwillexplainacoupleofthecolumns,andthensumuptheaggregatedata.TherightmostcolumnshowsthecalculatedweeklyvalueswhentheAIRscoresandweeklyfinishscores(scaledfrom1-5asshownabove)aremultipliedtogether.Thesewerethensummedupatthebottomofthetable(rowlabeled“Total”),andalsoaveragedperweek,dependingonhowmanyweeksthereceiverwasactive(rowlabeled“Average”).TheaverageoftheweeklyAIRscores,asshownpreviously,isalsonoted,asistheaverageofeachplayer’sweeklyfantasyfinish.Tome,thethreemostimportantwaystodifferentiatethereceiversareasfollows:TotalScore,AverageScore,andAverageWeeklyFinish.Onthenextpage,I’llstartwiththesummarytablefortheTotalScorevalues.Theycanbefoundsortedinadescendingmanner,withthesametrafficlightheatmapcolorationasshownpreviously:

75
Name Team Games TotalScoreBrandonMarshall NYJ 16 265
JulioJones ATL 16 250AllenRobinson JAC 16 231OdellBeckhamJr NYG 15 226AntonioBrown PIT 16 223DeAndreHopkins HOU 16 221
EricDecker NYJ 15 215DougBaldwin SEA 16 209
DemaryiusThomas DEN 16 208AJGreen CIN 16 204
AllenHurns JAC 15 200EmmanuelSanders DEN 15 194BrandinCooks NO 16 191LarryFitzgerald ARI 16 189JeremyMaclin KC 15 187
JordanMatthews PHI 16 185SammyWatkins BUF 12 182CalvinJohnson DET 16 178JohnBrown ARI 15 178KamarAiken BAL 15 167JarvisLandry MIA 16 163JamesJones GB 16 161
RuebenRandle NYG 16 157MichaelCrabtree OAK 16 154
TYHilton IND 16 149GoldenTate DET 16 147AmariCooper OAK 16 146MikeEvans TB 14 143
TravisBenjamin CLE 16 139DonteMoncrief IND 16 136MichaelFloyd ARI 14 136PierreGarcon WAS 16 134WillieSnead NO 15 132
JermaineKearse SEA 15 130TavonAustin STL 16 128AnquanBoldin SF 14 126TedGinnJr CAR 14 126
TerranceWilliams DAL 16 125

76
Name Team Games TotalScoreDannyAmendola NE 14 119TylerLockett SEA 15 119RandallCobb GB 16 119StefonDiggs MIN 13 116
JulianEdelman NE 9 114MartavisBryant PIT 11 114MarkusWheaton PIT 16 112ColeBeasley DAL 16 108AlshonJeffery CHI 9 103MarvinJones CIN 16 102KeenanAllen SD 8 96
NateWashington HOU 13 92Average - - 159.0
ShownnextaretheAverageScores.Theseperhapstakeevenmoreimportancethanthetotalscores,astheyfactoroutanymissedtime.Onceagain,we’dobviouslypreferourplayersbeonthefieldforthewholeseason,butthatjustdoesn’talwayshappen.Theaveragescorescanthereforehighlightplayerswhowould’veotherwisebeenburiedintheprevioustable:
Name Team Games AverageScoreBrandonMarshall NYJ 16 16.6
JulioJones ATL 16 15.6OdellBeckhamJr NYG 15 15.1AllenRobinson JAC 16 14.4EricDecker NYJ 15 14.3
SammyWatkins BUF 12 14.0AntonioBrown PIT 16 13.9DeAndreHopkins HOU 16 13.8
AllenHurns JAC 15 13.3DougBaldwin SEA 16 13.1
DemaryiusThomas DEN 16 13.0EmmanuelSanders DEN 15 12.9
AJGreen CIN 16 12.8JulianEdelman NE 9 12.7JeremyMaclin KC 15 12.5KeenanAllen SD 8 12.0BrandinCooks NO 16 11.9JohnBrown ARI 15 11.9

77
Name Team Games AverageScoreLarryFitzgerald ARI 16 11.8JordanMatthews PHI 16 11.6AlshonJeffery CHI 9 11.4CalvinJohnson DET 16 11.1KamarAiken BAL 15 10.4
MartavisBryant PIT 11 10.4JarvisLandry MIA 16 10.2JamesJones GB 16 10.1
RuebenRandle NYG 16 9.8MichaelCrabtree OAK 16 9.6
MikeEvans TB 14 9.5TYHilton IND 16 9.3
GoldenTate DET 16 9.2AmariCooper OAK 16 9.1MichaelFloyd ARI 14 9.1AnquanBoldin SF 14 9.0TedGinnJr CAR 14 9.0StefonDiggs MIN 13 8.9WillieSnead NO 15 8.8
TravisBenjamin CLE 16 8.7DannyAmendola NE 14 8.5DonteMoncrief IND 16 8.5PierreGarcon WAS 16 8.4
JermaineKearse SEA 15 8.1TavonAustin STL 16 8.0
TerranceWilliams DAL 16 7.8TylerLockett SEA 15 7.4RandallCobb GB 16 7.4
NateWashington HOU 13 7.1MarkusWheaton PIT 16 7.0ColeBeasley DAL 16 6.8MarvinJones CIN 16 6.4
Average - - 10.6Lastly,asshownonthenextpage,aretheaverageweeklyfinishesforeachreceiver.Thiscanbeviewedfromapurelyfantasyperspective,andhelpssupplementthetablesabove:

78
Name Team Games AverageWeeklyFinishBrandonMarshall NYJ 16 15.0
JulioJones ATL 16 15.9JulianEdelman NE 9 17.3DeAndreHopkins HOU 16 18.8OdellBeckhamJr NYG 15 20.3
EricDecker NYJ 15 20.6AntonioBrown PIT 16 21.1KeenanAllen SD 8 22.9LarryFitzgerald ARI 16 23.0
DemaryiusThomas DEN 16 23.3AllenRobinson JAC 16 24.3AlshonJeffery CHI 9 25.2JarvisLandry MIA 16 26.0AJGreen CIN 16 27.3
JeremyMaclin KC 15 28.5CalvinJohnson DET 16 30.8DougBaldwin SEA 16 31.4BrandinCooks NO 16 31.8AllenHurns JAC 15 32.1
MichaelCrabtree OAK 16 32.3JohnBrown ARI 15 33.1
SammyWatkins BUF 12 33.5EmmanuelSanders DEN 15 34.2JordanMatthews PHI 16 34.8MartavisBryant PIT 11 35.3MikeEvans TB 14 35.8GoldenTate DET 16 36.4TYHilton IND 16 38.3
TedGinnJr CAR 14 38.4PierreGarcon WAS 16 38.5RandallCobb GB 16 39.5WillieSnead NO 15 39.5KamarAiken BAL 15 40.1AmariCooper OAK 16 41.4TravisBenjamin CLE 16 41.4RuebenRandle NYG 16 41.8AnquanBoldin SF 14 41.9TavonAustin STL 16 42.8
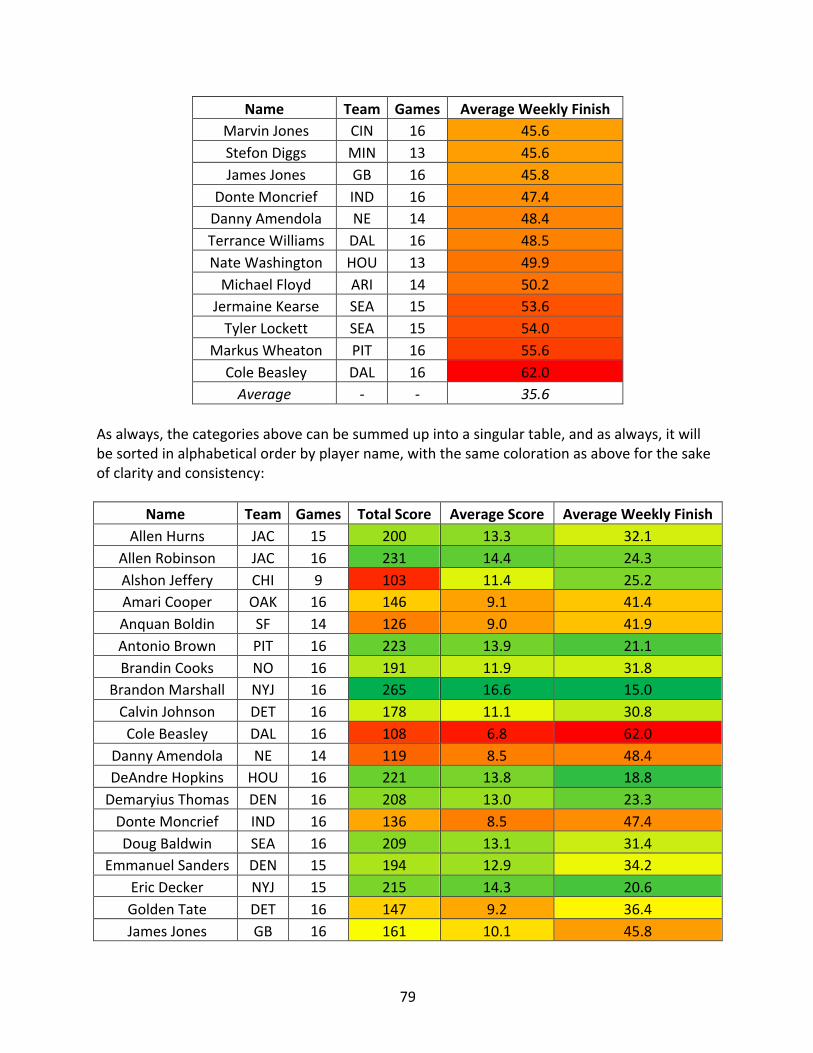
79
Name Team Games AverageWeeklyFinishMarvinJones CIN 16 45.6StefonDiggs MIN 13 45.6JamesJones GB 16 45.8
DonteMoncrief IND 16 47.4DannyAmendola NE 14 48.4TerranceWilliams DAL 16 48.5NateWashington HOU 13 49.9MichaelFloyd ARI 14 50.2JermaineKearse SEA 15 53.6TylerLockett SEA 15 54.0
MarkusWheaton PIT 16 55.6ColeBeasley DAL 16 62.0Average - - 35.6
Asalways,thecategoriesabovecanbesummedupintoasingulartable,andasalways,itwillbesortedinalphabeticalorderbyplayername,withthesamecolorationasaboveforthesakeofclarityandconsistency:
Name Team Games TotalScore AverageScore AverageWeeklyFinishAllenHurns JAC 15 200 13.3 32.1
AllenRobinson JAC 16 231 14.4 24.3AlshonJeffery CHI 9 103 11.4 25.2AmariCooper OAK 16 146 9.1 41.4AnquanBoldin SF 14 126 9.0 41.9AntonioBrown PIT 16 223 13.9 21.1BrandinCooks NO 16 191 11.9 31.8
BrandonMarshall NYJ 16 265 16.6 15.0CalvinJohnson DET 16 178 11.1 30.8ColeBeasley DAL 16 108 6.8 62.0
DannyAmendola NE 14 119 8.5 48.4DeAndreHopkins HOU 16 221 13.8 18.8DemaryiusThomas DEN 16 208 13.0 23.3DonteMoncrief IND 16 136 8.5 47.4DougBaldwin SEA 16 209 13.1 31.4
EmmanuelSanders DEN 15 194 12.9 34.2EricDecker NYJ 15 215 14.3 20.6GoldenTate DET 16 147 9.2 36.4JamesJones GB 16 161 10.1 45.8

80
Name Team Games TotalScore AverageScore AverageWeeklyFinishJarvisLandry MIA 16 163 10.2 26.0JeremyMaclin KC 15 187 12.5 28.5JermaineKearse SEA 15 130 8.1 53.6JohnBrown ARI 15 178 11.9 33.1
JordanMatthews PHI 16 185 11.6 34.8JulianEdelman NE 9 114 12.7 17.3JulioJones ATL 16 250 15.6 15.9KamarAiken BAL 15 167 10.4 40.1KeenanAllen SD 8 96 12.0 22.9LarryFitzgerald ARI 16 189 11.8 23.0MarkusWheaton PIT 16 112 7.0 55.6MartavisBryant PIT 11 114 10.4 35.3MarvinJones CIN 16 102 6.4 45.6
MichaelCrabtree OAK 16 154 9.6 32.3MichaelFloyd ARI 14 136 9.1 50.2MikeEvans TB 14 143 9.5 35.8
NateWashington HOU 13 92 7.1 49.9OdellBeckhamJr NYG 15 226 15.1 20.3PierreGarcon WAS 16 134 8.4 38.5RandallCobb GB 16 119 7.4 39.5RuebenRandle NYG 16 157 9.8 41.8SammyWatkins BUF 12 182 14.0 33.5StefonDiggs MIN 13 116 8.9 45.6TavonAustin STL 16 128 8.0 42.8TedGinnJr CAR 14 126 9.0 38.4
TerranceWilliams DAL 16 125 7.8 48.5TravisBenjamin CLE 16 139 8.7 41.4TylerLockett SEA 15 119 7.4 54.0WillieSnead NO 15 132 8.8 39.5AJGreen CIN 16 204 12.8 27.3TYHilton IND 16 149 9.3 38.3Average - - 159.0 10.6 35.6
Sonowthatallthedataisfinallyinhand,it’stimetodrawafewquickconclusionsaboutplayerswhocannowbeviewedmorefavorably,orunfavorably,whenallthenumbersareviewedtogether.Ontothelastchapter!

81
CONCLUSION
Nomoretables,Ipromise!Fromthispointon,I’mgoingtoprovidethedistilledessenceofmythoughtsasitrelatestoownershiprecommendations.It’snotgoingtobeaninclusivelist–weshouldalwaysdrawourownconclusions,afterall–butattheleastthereareahandfulofplayersIwanttohighlight.AsitrelatestowhatIbelieveyoushouldbedoing,I’llsummarizethereceiversintofourcategories:ScreamingBuys,Buys,Holds,andSells.Let’sstartwiththeScreamingBuys.SCREAMINGBUYSBrandonMarshall,WRNYJ–Quitesimplyhewasthebestcombinationofreallifeandfantasyfootballin2015.Hewasattheheadofeverytableinthelastchapter,whichmeshedfantasyfinishesandfantasyefficiency.Healsohadatop-10FDRmetric,andhisARCscoreswereallaveragetoaboveaverage.Ageisjustanumber,andwithMarshallit’sfarfromthemostimportant.WhileIcan’teverguaranteeanything,thisisaguywhoshouldprovideatleasttwomoreyearsofeliteNFLandfantasyproduction,whocanbehadonthecheap.AllenHurns,WRJAC–Yes,he’sthelesserofthetwoJacksonvilleAllens,buthe’salsodecidedlycheaper.I’mnotcertainifownersremainreticentabouthisformerundraftedstatus,buttheguyhasbeenonfirethroughtwoyearsintheleague.HisAIRscorewastop-three,andhisFDRwastop-six,notsurprisinglyleadingtoatop-tierSumR,ORE-AandORE-F.HisARC-Twasabitbelowaverage,lendingsomecredencetothosewhoarenervousaboutatouchdownregression,butHurnsoffersWR2upsideforafractionoftheprice.DougBaldwin,WRSEA–Yes,hescoredtheballaton,butitwasmorethanjustthat.Hisrelativeratiosforreceptions,yardsandtouchdownswereallwellaboveaverage,helpingtoexplainwhyhehadatop-twoAIRscorefortheyear.Hewasalsotop-tenintermsofanaveragescoreforfantasyfinish/weeklyAIR,whichisn’tterriblysurprisinggivenhisinsaneclosetotheseason.FollowingtheSeahawksbye,Baldwinhadfiveperfectscores(25points)outofeightgames,withonemorejustmissing(20points).Seattlepaidthemanforareason,andit’stimehestartedgettingtheattentionhedeserved.EricDecker,WRNYJ–DeckerwastheonlyplayerchronicledtofinishasaweeklyWR3orbettereverygamethisseason.Hewasalsolargelyefficient,helpingexplainhowheneverhadacombinedweeklyscoreundereightpoints.MuchlikewithHurns,hisARC-Tshowssomereasonforpause,giventheheavyrelianceontouchdowns(thirdhighestamongstallplayers),buthistop-shelfFDRshowsthatheknowshowtogettheballtowhereitneedstobe.Asisthecasewithalloftheseplayers,Deckercomesrelativelycheap(he’smystifyinglyaWR4instartupADP),andyoushouldtrytoacquirehimassuch.KamarAiken,WRBAL–Ifthere’saRavensreceiverIwanttoown,it’sthisguy.HisAIRof1.07wasonlymiddling,buthisFDRof1.35(tiedfortopsintheleague)showsthattheNFLprowess

82
shouldsoontranslateovertothefantasybottomline.Hewasalsoassteadyastheycame,withhisallthreeofhisscoringcomponentpercentageshittingtheaveragemark.Hewon’tofferatonofroomforimprovement,butatthepriceofafirmhandshakeyoucanowntheguywhowasaweeklyWR3orbetterinsevenofhislasteightgamesin2015.BUYSJulioJones,WRATL–HeledtheleagueinWR1games,andnevertankedaweekwithregardstoAIRefficiency.HewasjustbehindMarshallintermsofallthreecategoriesintheoverallreceiverhierarchy,andwasatop-15guyintermsofFDR.Allthemoreamazing,Jonesactuallyscoredbelowaverageintermsoftouchdowns,withamassivechanceforimprovementasbasedonhisARC-Tscore.Honestly,he’smytopoveralldynastyasset,andtheonlyreasonIdidn’tplacehiminthecategoryaboveisbecausehe’salreadyvaluedasaneliteguy.AllenRobinson,WRJAC–IcanverynearlycopyandpastewhatIwroteforHurnsabove,exceptA-Robgenerallydiditwithagreatermagnitude,helpingexplainhisheftycurrentpricetag.Alltoldthough,thenumbersdon’tlie–Robinsonwasjustbehindfellowthird-yearplayerOdellBeckhamasitrelatestoaveragescoreinthereceiverhierarchy,andheevenbestedhiminAIR.Hisrelianceontouchdownsisscary,butifBlakeBortlescanimprovehisaccuracy,Robinson’sreceptionsandyardsshouldseeanuptick,asevidencedbyhisARC-RandARC-Yscores.Thoughitseemscrazytobelieve,hemightultimatelygodownasthebestreceiverfromthemuchballyhooed2014draftclass.SammyWatkins,WRBUF–WatkinsledtheleagueinAIR,whilealsopostingatop-threeFDRscore.AssuchheeasilylappedthefieldinallofSumR,ORE-AandORE-F,provingtobeabeastinbothfantasyandreallifefootball.ThescarythingaboutWatkinsis,withaboveaveragescoresinalloftheARCmetrics,it’sreasonabletoassertheactuallyhasroomtogrowwithcollectingallofreceptions,yardsandscores.Givenhissublimeefficiencyin2015,that’ssayingsomething.ConsideringsevenoutofhisfinalninegameswereWR2performancesorbetter,Ithinkit’sfairtoassertthat,quiteliterally,theonlythingholdinghimbackisinjury.Onceagain,ifnotforrelativeprice,he’dfindhimselfinthecategoryabove.AlshonJeffery,WRCHI–ThemajorityofJeffery’sfantasyefficiencymetricshoveredaroundaverage,buthehadaleague-leadingFDRscore.AsImentionedearlier,IwanttheguyswhocanperformontheNFLlevel,asIbelieveitwilltranslatetothefantasyboxscores.Jeffery’sARC-Tscorealsosuggestsheshouldreturntohispreviouslevelsofscoring,andifhedoesheshouldimproveuponhissevenofninegamesfinishingasaWR3orbetter.Alsobuy:KeenanAllen,JeremyMaclin,EmmanuelSanders,JohnBrownandMikeEvansHOLDSAJGreen,WRCIN–Forgettheanecdotalevidencesuggestinghe’llbethemaintargetontheCincyoffense(eventhoughit’sprobablytrue).Lookinsteadtothefactthat,ifandwhenthat

83
comestofruition,Greenwilllargelyfunctionasanefficientreceiver.HisAIRscorewasaboveaverage,aswerehisSumRandOREscores.Potentialtouchdownregressioncouldoccur(ARC-T),buthehastheabilitytodoevenmoreasitrelatestoreceptionsandyards(ARC-RandARC-Y).Hisplaceinthefantasyhierarchyappearssecure.DemaryiusThomas,WRDEN–I’vewrittenbeforethatIviewDTasasublimefantasyasset,andIstandbythat.Hewasatier-oneguyasitrelatestotheoverallfantasyhierarchy,andbothhispercentagesofWR2orbetterandWR3orbettergamesweretop-fiveandtop-sevenquantities,respectively.Thebiggestthingmissingfromhisrepertoirewastouchdownscoring,buthistop-tenARC-Tsuggestshe’scapableofmore.2015wasn’thisfinestmoment,butitcertainlywasn’thisnadireither.WillieSnead,WRNO–Withregardstonearlyeveryadvancedfantasymetric,Sneadwasroughlybelowaverage.Sowhyisheabuy?Simple–heonlyscoredtheballthreetimes,meaningthatevenhittingaveragewasquitetheachievement.HisaboveaverageFDRalsosuggeststhathe’sdoingwhatheshouldbedoingbetweenthewhitelines,andthatscoringplaysshouldsooncome.Ifnot,hisrelativeratiosforreceptionsandyardswereaboveaverage,meaningthatthefloorshouldremain.DonteMoncrief,WRIND–Moncriefhasanargumenttomovetothetierabove,butthemainthingholdinghimbackishesimplydidn’tproduce.HewasonlyaWR3orbetterhalfofthetime,andaWR2orbetter25%ofthetime.MuchofthatcanbeexplainedbytheIndyoffense(TYHiltonexperiencedsimilarwoes),asMoncrief’sAIRscoresweredecidedlyaboveaverage,bothfortheseasonandonaweeklybasis.WithrelativeratiosandARCscoresaverageorbetter,togowithanaboveaverageFDR,Moncriefappearstobeaplayerontherise.Ifhewasmorecosteffective,I’dbealotmorebullishonacquiringhisservices.JulianEdelman,WRNE–ImentionedabovethatEricDeckerwastheonlyreceivertofunctionasaWR3orbettereachandeveryweekheplayed.Edelmanmissedthatmarkbyexactlyoneweekandonespot,whenhefinishedastheWR37afterplayingaquarterandahalfinhisfinalgameoftheregularseason.Histop-14finishintheaveragescorehierarchyshowsthathewasagreatasset,anddespitebeingaslotreceiverheactuallyhasroomforimprovementinbothreceptionsandyards(ARC-RandARC-Y).Touchdownregressioncouldhurt,butallthenegativesarealreadybuiltintohisprice.Ifyouownhim,keephim.SELLSBrandinCooks,WRNO–DidBrandinCooksreallytakeahugeleapforwardin2015?HewasbelowaverageintermsofWR3orbetterfinishes,hadarelativelymiddlingAIRscore,andhadoneoftheworstFDRscoresoutofallthereceiversstudied.ThisledtoawfulSumRandOREscores,whichistroublingforaplayerwhowastooreliantontouchdowns.Ifhecanimprovehiscatchingefficiency,itwouldgoalongwaytowardssolidifyingCooks’value.

84
AmariCooper,WROAK–No,I’mnotjusttryingtoplaythecontrarianhere.Ifwewereonlytolookattherawnumbers,it’seasytocomeawaywiththebeliefthatCooperhadagreatrookieseason.AndwhileI’mtryingtomitigatethat,asit’snoteasytoputupthosetypesofnumbersinyearone,thelackofefficiencywasstartling.Cooper’sAIRscorebarelysurpassed1.00,andhisFDRwassub-averagerelativetohispeers.Notsurprisingly,hethenfoundhimselfatthebottomoftheSumRandOREratingsaswell.Hewasabitbetterthanexpectedintermsofgainingyardsrelativetohisoffense,butwhenleague-widepercentagesweretakenintoaccounthesufferedacrosstheboardintheARCmetric.Ifhewasconsistentlyscoringpoints,Ithinkwecouldalllivewithit–but50%ofhis2015contestsendedwithafinishasaPPRWR4orworse.Again,he’sarookie,butIjustdon’tthinkhedidenoughtobeconsideredatophalfofthefirstroundstartupguy.IfyoucansellhimforaguylikeJefferyandchange,I’ddosowithoutquestion.MichaelCrabtree,WROAK–SeeCooperabove,butfortunatelyhe’sahellofalotcheaper.Withthatsaid,hehonestlywasn’tverygoodlastyear,andthere’slittletonoquantitativereasontobelievehe’llimprovein2016.Don’tgetmewrong,Crabtreewasaguywhocould’vehelpedyouwinyourleagueatabottombasementpricelastseason,butit’sfairtoasserthe’sabitoverratedwherehestandsnow.MartavisBryant,WRPITT–Let’sthrowthesuspensionasideforamoment,shallwe?Isupposethisiswherethegreat“FilmversusMetrics”debatecomesintoplay,becausethefactisBryantwasn’tactuallygoodlastyear.HisAIRscorebarelymetexpectations,andhehad(byfar)theworstFDRoutofallthereceiversIlookedat,withSumRandOREmetricstomatch.Withtheexceptionofhisabilitytoscoretouchdowns,there’slittlestatisticalreasontobelievehe’llimprovemovingforward.WithAntonioBrownhoggingtargets,andMarkusWheatonactuallyexceedinghisproductioninthesecondhalfoflastseason,IseenoreasontoassumeBryantisgoingtoreturnassomesortoffantasyforce.TedGinn,WRCAR–No,Idoubtyou’llgetmuchofanythinginreturn,butIthinkwejustsawtheCarolinareceiver’smomentinthesun.GinnhadthehighesttouchdownpercentageoutofanyofthePPRTop-50receivers,butcouldstillbarelyscrapebywithanexpectedAIRscore.HisFDRwasalsobottombasement,whichisn’tterriblysurprisinggiventhathecaughtfewerthan50%ofhispasses.Evenwiththescoringplays,hisARC-Tsuggestshe’sinforamassiveregression,anditdoesn’tappearlikelyhe’llmakeupforitwithreceptionsoryards.Quitehonestly,IthinkI’dtakeafuturethirdroundpickfortheguy.TylerLockett,WRSEA–Iwon’tpretendtoknowreceiversbetterthanMattHarmon,becauseIdon’t.ButIjustcan’tgetonboardwiththeendorsementofthesoon-to-besecondyearreceiver.Yes,heclosedouttheyearwell,buthe’sdueforatouchdownregressionevenifhisreceptionsandyardsstandtoimprove.HisFDRshowsthathewasatleastaveragelastyear,whichactuallysaysquiteabitforarookie.ButIjustcan’tgetpastthefactthathisWR5+percentageof68.8%wastheworstamongstall50passcatchers.Addintherecent“HarmonBump”tohiscost,andI’mcashingout.

85
MarvinJones,WRDET–Jonesmight’vebeentheworstreceiveroutofthegroupingIstudied.HehadthelowestAIRscore,thesecondlowestFDR,andhisARCscoressuggestimprovementisfictioninitsfinest.IsupposegoingfromtheWR2inCincytotheWR1binDetroitcouldbeviewedassomesortofpositive,butthisisaguywhowasonlyaPPRWR2orbetterthreetimeslastyear.Idon’tgetthelove,Idon’tgetthecontract,andI’dbegettinghimthehelloffmyrosterifothersarebuyingin.Alsosell:DannyAmendola,GoldenTateandLarryFitzgeraldSothat’sthat!Don’tforgetthatalltheplayertablescanbefoundintheAddendumtothiswork,sothatyoucanusethemsidebysidewiththeanalysesabove.Iknowthiswasakintoafantasydissertation,andcouldcomeacrossasabittediousattimes,butattheveryleastIhopeithelpedyouthinkoutsidetheboxanddigalittledeeperthanyouwouldhaveotherwise.Thankyouforreading!FollowmeonTwitter@EDH_27