Embed Size (px)
Citation preview

The 59th Business YearBusiness Performance Data Analysis
Fiscal Year Ending December 2021First Quarter
Total number of attendees and viewers: 556
Attendees at venue: 324
Viewers online: 232
▲ Meeting on the screen
The 58th Annual Shareholders’
Meeting held on March 18, 2021
▲ Tokyo venue (with attendees capped at 300)
Announced April 30, 2021
Atsushi Shimozu, General Manager of the
Corporate Planning Div. and Manager of the
Corporate Planning & IR Section
Minori Hirano, Corporate Planning & IR Section
Mika Takahashi, Corporate Planning & IR
Section
Trusco Fiorito Bldg. 10th floor, 4-28-1
Shinbashi, Minato-ku, Tokyo 105-0004, Japan
Phone: +81-3-3433-9840
Fax: +81-3-3433-9881
E-mail: [email protected]
Trusco Nakayama Corporation

Previous forecast announced
on Feb. 12, 2021
Forecast after revision
announced on Mar. 15, 2021
Change from
previous forecastYoY change
Net sales ¥220,520 million ¥227,520 million +3.2% +6.6%
Operating income ¥12,470 million ¥13,170 million +5.6% +19.5%
Ordinary income ¥12,880 million ¥13,820 million +7.3% +19.6%
Profit attributable
to owners of parent¥8,870 million ¥9,520 million +7.3% +18.9%
Net income per share ¥134.51 ¥144.37 +¥9.86 +¥22.94
©2021 TRUSCO NAKAYAMA CORPORATION All Rights Reserved TRUSCO NAKAYAMA Investor Relations
Upward Revision to Business Performance Forecast
(announced on March 15, 2021)
The Company announced its budget for the 59th business year (FY ending December 2021)
concurrently with its business performance on Friday, February 12. Judging that the overall
economy is trending towards recovery in view of a gradual turnaround in corporate capital
expenditures, the Company has revised the budget upwards.
▮ Revision to Budget for 59th Business Year (Ending December 2021)
2

1,950 2,142 2,206 2,134
2,275
145146 141
115
138
27 36 4865 70
2017 2018 2019 2020 2021forecast
[Consolidated] Company overviewFounding May 15, 1959
Representative
Tetsuya Nakayama, PresidentChairman, Nakayama Visually Impaired Welfare Foundation
Vice president, Japan Federation of Machine Tool Distributors Associations
President, Osaka Machine Appliance Wholesaler Cooperative
Head officesTokyo Head Office (Minato-ku, Tokyo, registered as official headquarters)
Osaka Head Office (Nishi-ku, Osaka City)
Number of offices
92 in total:
89 domestic bases: 2 head offices, 61 sales branches, 26 distribution
centers
3 overseas bases: Local subsidiaries: Thailand and Indonesia
Representative office: Germany (Dusseldorf)
Capital stock 5,022,370,000 yen
Listed stock exchange First section of the Tokyo Stock Exchange (Code number: 9830)
Number of employees2,797 (11 executives, 1,656 full-time employees, 1,130 part-time
employees)
Credit rating A (Rating and Investment Information, Inc.)
Line of business
Wholesaler of industrial equipment such as machine tools, distribution
equipment and environmental safety equipment (and consumables used in
factories) and planning and development of products under the company’s
own brand, TRUSCO
Business flow ( ) YoY change
Manufacturers
2,790(up 138
companies)Of these, 247 are
overseas
manufacturers
(up 35 companies)
Suppliers
As of the end of March 2021
©2021 TRUSCO NAKAYAMA CORPORATION All Rights Reserved
* Depreciation increased with aggressive
investment in logistics and digital technologies.
Change in Net Sales, Ordinary Income and
Depreciation
[Non-consolidated] [Consolidated]
Net sales
Ordinary income
Depreciation
e-business route
Factory route
Home center route
Overseas route
Trusco Nakayama (wholesaler)
Mainly internet order companies
Machine tool dealers, dealers of welding materials,
dealers of pipe materials, conductor dealers, dealers
of electric materials, dealers of packaging materials
Mainly general hardware mass discounters, pro-tool
shops, home appliance mass discounters
Mainly overseas dealers
Main sales agents, 5,500 companies
(See p. 19)
Manufacturers, general consumers
Manufacturers, construction
companies
Businesses conducting outdoor
work, general consumers
Overseas manufacturers
Target markets (main users)
(Unit: 100 million yen)
Net sales
Ordinary
income
Depreciation
TRUSCO NAKAYAMA Investor Relations 3

1Q of FY ended Dec. 2020 1Q of FY ending Dec. 2021
Actual results Share Actual results YoY change Share Budget Share Change from budgetChange from
budget (%)
Net sales ¥57,493 million - ¥58,246 million +1.3% - ¥58,121 million - +¥125 million +0.2%
Gross profit ¥12,556 million 21.8% ¥12,543 million -0.1% 21.5% ¥12,516 million 21.5% +¥27 million +0.2%
Selling, general and
administrative
expenses (SGA)
¥9,218 million 16.0% ¥8,752 million -5.1% 15.0% ¥8,811 million 15.2% -¥58 million -0.7%
(depreciation
included in SGA)¥1,425 million 2.5% ¥1,704 million +19.6% 2.9% ¥1,685 million 2.9% +¥19 million +1.2%
Operating income ¥3,337 million 5.8% ¥3,790 million +13.6% 6.5% ¥3,705 million 6.4% +¥85 million +2.3%
Ordinary income ¥3,384 million 5.9% ¥3,995 million +18.0% 6.9% ¥3,943 million 6.8% +¥52 million +1.3%
Profit attributable to
owners of parent¥2,321 million 4.0% ¥2,712 million +16.9% 4.7% ¥2,725 million 4.7% -¥12 million -0.4%
Net income per share ¥35.20 - ¥41.14 +¥5.94 - ¥41.32 - -¥0.18 -
A-(1) [Consolidated] Business performance for the first quarter of the FY ending December 2021
©2021 TRUSCO NAKAYAMA CORPORATION All Rights Reserved
- The business performance forecast for the 59th business year was revised upwards on March 15, 2021.
- Consolidated net sales: Up 1.3% YoY, Up 0.2% from budget The number of business days was larger by one than in the same period a year earlier.
(Number of business days – last year: 58, this year: 59)
* The number of business days is the non-consolidated number.
- Consolidated gross profit margin: 21.5%, down 0.3 percentage points for reasons of factor mentioned below
=> Extraordinarily high sales of face masks and other protective equipment due to the COVID-19 pandemic came to an end. (Down 10.0% year on year)
- SGA: Down 5.1% year on year following commission fees for the revamp of the Paradise core system posted for the previous year and a decrease in
advertising expenses due to the discontinuation of the shareholder benefit program (for details about SGA, see pp. 21-22.)
TRUSCO NAKAYAMA Investor Relations 4

1Q of FY ended Dec. 2020 1Q of FY ending Dec. 2021
Actual results Share Actual results Share YoY change Budget ShareChange from
budget
Change
from
budget
(%)
Net sales ¥57,533 million - ¥58,159 million - +1.1% ¥57,990 million - +¥168 million +0.3%
Gross profit ¥12,511 million 21.7% ¥12,461 million 21.4% -0.4% ¥12,464 million 21.5% -¥2 million -0.0%
Selling, general and
administrative
expenses (SGA)
¥9,153 million 15.9% ¥8,682 million 14.9% -5.1% ¥8,739 million 15.1% -¥56 million -0.7%
(depreciation
included in SGA)¥1,408 million 2.4% ¥1,687 million 2.9% +19.7% ¥1,685 million 2.9% +¥1 million +0.1%
Operating income ¥3,358 million 5.8% ¥3,779 million 6.5% +12.6% ¥3,725 million 6.4% +¥54 million +1.5%
Ordinary income ¥3,363 million 5.8% ¥3,988 million 6.9% +18.6% ¥3,961million 6.8% +¥27 million +0.7%
Net income ¥2,303 million 4.0% ¥2,711million 4.7% +17.7% ¥2,735 million 4.7% -¥23 million -0.9%
Sales of PB goods ¥11,472 million 19.9% ¥11,289 million 19.4% -1.6% ¥11,299 million 19.5% -¥9 million -0.1%
Net income per share ¥34.94 - ¥41.12 - +¥6.18 ¥41.47 - -¥0.35 -
A-(2) [Non-consolidated] Business performance for the first quarter of the FY ending December 2021
©2021 TRUSCO NAKAYAMA CORPORATION All Rights Reserved TRUSCO NAKAYAMA Investor Relations 5

911
1,004
1,029
935 899
909
911
923
953
894
988
989
0.6 -1.1
-2.0
9.1
10.6 10.0
8.9 9.0 9.0 8.9
5.4 5.9
Jan. Feb. Mar. Apr. May Jun. Jul. Aug. Sep. Oct. Nov. Dec.
(906)
(1,050)
(1,015) (826)
(813)(858)
(821)
(874)
(847)
(837) (938)
(934)
16,438
18,118
19,673
16,226
20,050
18,283
17,580
19,118
18,823
19,814
19,832
-4.5 -0.4
7.6 9.1
10.7
10.0
4.0
15.1
9.3
4.1
11.1
5.9
0
2,000
4,000
6,000
8,000
10,000
12,000
14,000
16,000
18,000
20,000
22,000
Jan. Feb. Mar. Apr. May Jun. Jul. Aug. Sep. Oct. Nov. Dec.
(17,206)
(18,274)
(22,011)
(17,494)
(15,268)
(18,033)
(14,664)
(18,222)
(17,577) (18,735)
(17,842)
(18,073)
23,689
Number of
business
days
A-(3) Company-wide monthly sales and sales per day in the first quarter of the FY ending December 2021
©2021 TRUSCO NAKAYAMA CORPORATION All Rights Reserved
Year-on-year
change (%) Year-on-year
change (%)
▮ [Consolidated] Total
Sales for the fiscal year under review (million yen)
( ) Sales in the same month previous year (million yen)
* Following revision to the business performance forecast, figures
for Jan. to Mar. represent actual values while those for Apr. and
later months are budget values.
▮ [Non-consolidated] Change in average daily
sales (all business offices)
Orders are constantly placed for consumables used in
factories. We carry out a year-on-year comparison of
sales per day.
Our sales increase during the peak periods of March
when many companies close their accounts.
Sales for the fiscal year under review (million yen)
( ) Sales in the same month previous year (million yen)
* Following revision to the business performance forecast, figures
for Jan. to Mar. represent actual values while those for Apr. and
later months are budget values.
18 18 23 21 18 22 20 19 20 21 20 20
(-1) (±0) (+2) (±0) (±0) (±0) (-1) (+1) (±0) (-1) (+1) (±0)
TRUSCO NAKAYAMA Investor Relations 6

1Q of FY ended Dec. 2020 1Q of FY ending Dec. 2021
Net salesGross profit
margin
Ordinary
incomeNet sales Gross profit margin Ordinary income
Sales route Actual results Share Actual results Actual results Actual results Share YoY changeYoY
changeBudget
Change from
budget
Change
from
budget
(%)
Actual
results
YoY
changeActual results
YoY
change
Factory route ¥43,350 million 75.4% 21.3% ¥2,498 million ¥42,243 million 72.5% -¥1,107 million -2.6% ¥42,463 million -¥220 million -0.5% 21.0% -0.3pt ¥2,703 million +8.2%
e-business
route¥10,116 million 17.6% 25.2% ¥908 million ¥11,270 million 19.4% +¥1,153 million +11.4% ¥11,030 million +¥239 million +2.2% 24.2% -1.0pt ¥984 million +8.3%
Home center
route¥3,682 million 6.4% 17.9% -¥33 million ¥4,330 million 7.4% +¥648 million +17.6% ¥4,209 million +¥120 million +2.9% 17.8% -0.1pt ¥102 million
Profitability
restored
Overseas
route¥344 million 0.6% 34.4% -¥24 million ¥402 million 0.7% +¥58 million +16.9% ¥416 million -¥14 million -3.4% 37.9% +3.5pt ¥14 million
Profitability
restored
Total ¥57,493 million 100% 21.8% ¥3,384 million ¥58,246 million 100% +¥752 million +1.3% ¥58,121 million +¥125 million +0.2% 21.5% -0.3pt ¥3,995 million +18.0%
▮ Net sales by sales route
B-(1) [Consolidated] Net sales, gross profit margin and ordinary income by sales route
©2021 TRUSCO NAKAYAMA CORPORATION All Rights Reserved
▮ Factory route: Down 2.6% year on year
Factory operations are turning around. Air conditioned goods earned brisk sales, and sales of distribution and storage equipment are
gradually rallying. However, sales of face masks and protective equipment necessary for protection against COVID-19 were below the
results of the same period a year earlier. (See p. 10)
▮ e-business route: Up 11.4% year on year
Sales to mail order companies surged 12.0% year on year and those to companies participating in Orange Commerce increased 9.4%. The
sales growth resulted from the expansion of products handled and demand from people remaining at home due to the pandemic. (See p. 11)
▮ Home center route: Up 17.6% year on year
New store launches including clients' pro-tool shops and an increase in visitors to stores based on demand from people staying at home and
DIY demand led to a growth in orders for chemical products and tools for manual work and to sales growth. (See p. 12)
▮ Overseas route: Up 16.9% year on year
While Thailand and Indonesia toughened restrictions on social activities due to the impact of the COVID-19 pandemic, an increase in stock
according to market needs and growth in transactions with new clients resulted in a sales hike. (See p. 13)
TRUSCO NAKAYAMA Investor Relations 7

1,305 1,348
1,676 1,563
1,463 1,550
1,406 1,487 1,538 1,466 1,524 1,493
12.1
21.2 19.3
4.8
2.1 -0.7
-4.5
8.8
-2.2
-0.3
5.3 0.0
Jan. Feb. Mar. Apr. May Jun. Jul. Aug. Sep. Oct. Nov. Dec.
(1,405)
(1,164)(1,112)
(1,561)(1,433)
(1,491) (1,572)(1,367)(1,473)
(1,470) (1,447) (1,493)
3,250 3,484
3,594
3,200
3,788 3,573
3,426
3,772 3,796 3,797 3,767
+7.4
+7.7
+17.7
+10.8
+16.7
+14.2
+12.6
+22.7
+17.1
+14.3
+20.7
+12.9
Jan. Feb. Mar. Apr. May Jun. Jul. Aug. Sep. Oct. Nov. Dec.
(3,853)
(3,026)(3,236)
(3,318)
(2,743)
(3,245)(3,221)
(2,792)(3,174)
(3,320) (3,338)(3,146)
11,760
13,156
17,326
14,388
11,441
14,565
13,165
12,523
13,651
13,416
14,327
14,415
-8.9 -4.6
4.1 9.1 10.2
10.0
2.4
13.5
8.2 1.8
9.1 4.7
Jan. Feb. Mar. Apr. May Jun. Jul. Aug. Sep. Oct. Nov. Dec.
(12,906)
(16,647)
(13,796)
(10,381)
(13,193) (13,242)
(12,62
(11,029)
(12,854)
(13,181
)
(13,138
(13,771)
B-(2) [Consolidated] Change in monthly sales by sales segment
▮ Change in monthly sales earned via home centers
Number of
business
days
Number of
business
days
Number of
business
days
©2021 TRUSCO NAKAYAMA CORPORATION All Rights Reserved
Year-on-year
change (%)
Year-on-year
change (%)
Year-on-year
change (%)
Sales for the fiscal year under review
(million yen)
( ) Sales in the same month previous
year (million yen)
▮ Change in monthly sales earned via factory route
Sales for the fiscal year under review (million yen)
( ) Sales in the same month previous year (million yen)
* Following revision to the business performance forecast, figures for Jan. to Mar.
represent actual values while those for Apr. and later months are budget values.
▮ Change in monthly sales earned via e-business routeSales for the fiscal year under review
(million yen)
( ) Sales in the same month previous
year (million yen)
* Following revision to the business performance forecast, figures
for Jan. to Mar. represent actual values while those for Apr. and
later months are budget values.
* Following revision to the business performance forecast, figures
for Jan. to Mar. represent actual values while those for Apr. and
later months are budget values.
18 18 23 21 18 22 20 19 20 21 20 20
(-1) (±0) (+2) (±0) (±0) (±0) (-1) (+1) (±0) (-1) (+1) (±0)
18 18 23 21 18 22 20 19 20 21 20 20(-1) (±0) (+2) (±0) (±0) (±0) (-1) (+1) (±0) (-1) (+1) (±0)
18 18 23 21 18 22 20 19 20 21 20 20(-1) (±0) (+2) (±0) (±0) (±0) (-1) (+1) (±0) (-1) (+1) (±0)
4,535
TRUSCO NAKAYAMA Investor Relations 8

Machine tool dealers50%
Dealers in welding materials
14%
Hardware retailers6%
Conductor dealers…
Dealers in piping materials
4%
Dealers in electrical materials
3%
Dealers in packaging materials
2%
Automotive dealers2%
Civil engineering and building machinery lease
operators…
Others13%
1Q of FY ended Dec. 2020 1Q of FY ending Dec. 2021
Sales route
Net sales
Gross
profit
margin
Net sales Gross profit margin
Actual results ShareActual
resultsActual results Share YoY change Budget
Change
from budget
Actual
results
YoY
change
Machine tool dealers ¥21,917 million 50.6% 21.1% ¥21,063 million 49.9% -3.9% ¥21,213 million -0.7% 20.9% -0.2pt
Dealers in welding materials ¥6,173 million 14.2% 21.7% ¥5,898 million 13.9% -4.5% ¥6,001 million -1.7% 21.4% -0.3pt
Other manufacturing related
(incl. physical and chemical material,
conductors, packaging material dealers)
¥7,156 million 16.5% 20.9% ¥7,140 million 16.9% -0.2% ¥7,128 million +0.2% 20.7% -0.2pt
Construction related ¥8,103 million 18.7% 21.7% ¥8,140 million 19.3% +0.5% ¥8,119 million +0.3% 21.4% -0.3pt
Total net sales via factory route ¥43,350 million 100.0% 21.3% ¥42,243 million 100% -2.6% ¥42,463 million -0.5% 21.0% -0.3pt
B-(3) [Consolidated] Factory route: Business performance by region, industry and sales route
▮ Factory route sales by industry
©2021 TRUSCO NAKAYAMA CORPORATION All Rights Reserved
▮ Factory route: Sales constituent ratio
by industry1Q of FY ending Dec. 2021
▮ Factory route: Sales by region
4,455 3,852
10,654
1,671
6,196
7,848
4,688 3,982
4,501 3,880
(+0.7%)
10,089
1,606
5,789 (-6.6%)
7,647 (-2.6%)
4,555 4,173
Hokkaido andTohoku
Kita-Kantoand Shinshu
TokyoMetropolitan
Hokuriku Tokai Kinki Chugoku andShikoku
Kyushu
R2 Factory route net sales for 1Q of FY ended Dec. 2020 (million yen)
R3 Factory route net sales for 1Q of FY ending Dec. 2021 (million yen)
(+1.0%)
(-5.3%)
(-3.9%)
(-2.8%)(+4.8%)
( ) YoY change (%)
TRUSCO NAKAYAMA Investor Relations 9

18.1 23.4
26.4 29.8
8.6
2017 2018 2019 2020 2021 1Q
992 1,057
1235
1414
1,530factories
0
200
400
600
800
1000
1200
1400
1600
MRO mail order
companies45%
General mail order companies
16%
Stationery mail order companies
13%
Retail of home electrical appliances
8%
Other mail order companies
5%
Machine tool dealers4%
Hardware retailers…
Dealers of physical chemical and medical …
Dealers in piping materials
2%
Others3%
1Q of FY ended Dec. 2020 1Q of FY ending Dec. 2021
Sales route
Net salesGross profit
marginNet sales
Gross profit
margin
Actual results ShareActual
resultsActual results Share
YoY
change
Actual
results
YoY
change
Mail order companies ¥7,717 million 76.3% 24.5% ¥8,646 million 76.7% +12.0% 23.3% -1.2ptCompanies participating in
Orange Commerce (Trusco's
electronic central purchasing
system)
¥2,398 million 23.7% 27.5% ¥2,624 million 23.3% +9.4% 27.3% -0.2pt
Total net sales via e-
business route¥10,116 million 100.0% 25.2% ¥11,270 million 100.0% +11.4% 24.2% -1.0pt
B-(4) [Consolidated] Sales via the e-business route and the number of companies participating in Orange
Commerce
▮Change in the number of companies participating in Orange
Commerce (Trusco’s electronic central purchasing system)
▮Sales via e-business route▮Sales to mail order companies: Sales ratio
by industry
▮Sales to mail order companies (billion yen)
( ) YoY change
▮ Trusco’s electronic central purchasing system:
Conducting business among customers, distributors and Trusco
Nakayama by connecting customer’s purchasing system with Trusco’s
central purchasing system
This purchasing system, mainly adopted by large-lot users
(manufacturers), is designed to curtail their material and equipment
procurement costs and increase their business operational efficiency
through the Internet-based management of material and equipment
purchases.
Orange
Commerce
Trusco
NakayamaDealers
Delivery
of goods
Customers
Delivery
of goods
Receipt of order data
Search Trusco Orange Book for
desired products and place orders on
the internal system.
Askul, Otsuka
Corporation, etc.
MonotaRO, Misumi,
etc.
Amazon, etc.
Yodobashi Camera,
Bic Camera, etc.
1Q of FY ending Dec. 2021
(+15.8%)
(+32.6%)
(+13.0%)
(+12.7%)(+29.1%)
(+12.0%)
©2021 TRUSCO NAKAYAMA CORPORATION All Rights Reserved
( ) YoY change
471
companies
No. of companies participating in Orange Commerce (companies)
Sales to companies participating in Orange Commerce (billion yen)
No. of factories participating in Orange Commerce (factories)
Full year budget ¥34.5 billion
302 312
351
390
2017 2018 2019 2020 2021 1Q
(+19.8%)
(+9.4%)
(+6.2%)(+10.5%)
(+17.5%)
Full year budget
¥9.1 billion
(+7.3%)
6.17.2
8.0 8.5
2.6
TRUSCO NAKAYAMA Investor Relations 10

■ Sales to pro-tool shops
Total: ¥741 million (up 30.4% year on year)
Pro-tool shops refer to dealers specializing in tools for
professional craftspeople and factory workers.
They are so compatible with our products that sales to
them are rising.
■ Sales to DCM Holdings
Total: ¥1,526 million (up 19.4% year on year)
DCM Hodaka, DCM Kahma, DCM Homac, DCM Daiki,
DCM Sanwa, DCM Kuroganeya, Keiyo, DCM ONLINE
Ranking Name of client1Q of FY ended
Dec. 2020
1Q of FY ending
Dec. 2021YoY change
1 DCM Hodaka (Pro-tool Shop) 503 663 +31.8
2 Nufco 384 525 +36.9
3 Kohnan Shoji 349 501 +43.3
4 Royal Home Center 335 328 -2.1
5 DCM Kahma 282 326 +15.7
6 Cainz 319 325 +2.2
7 DCM Homac 237 259 +9.5
8 Shimachu 233 207 -11.2
9 Komeri 147 197 +34.2
10 Home Center Valor 97 151 +54.9
Combined sales
to top 10 companies2,889 3,487 +20.7
Combined sales via
home center route3,682 4,330 +17.6
Percentage share of sales
to top 10 companies78.5 80.5
As a professional-tool wholesaler, Trusco Nakayama has focused on dealing in pro tools and actively proposed to general hardware mass discounters that
allot part of their floor spaces to pro-tool shops.
Trusco Nakayama will work on enhancing its comprehensive marketing power by stepping up sales of its products via the home center route where pro-tool
shops and material shops are housed.
Brisk sales were achieved after an increase
in product items procured from the
Company. General hardware mass
discounters combines their online stores
with physical stores to improve services for
visiting customers. They used the
Company's stock for convenience. Sales to
pro-tool shops also increased.
Unit: million yen, %▮ Ranking of sales to general hardware mass discounters
B-(5) [Consolidated] Sales to top 10 clients in the home center route
Company names are presented in abbreviated forms.
©2021 TRUSCO NAKAYAMA CORPORATION All Rights Reserved TRUSCO NAKAYAMA Investor Relations 11

Net sales Gross profit
Selling, general
and administrative
expenses (SGA)
Operating income Ordinary income Net income
TRUSCO NAKAYAMA
CORPORATION (THAILAND)
LIMITED
1 baht = 3.54 yen
(3.34 yen a year earlier)
Actual results 190 44 36 7 7 7Share against
net sales - 23.1% 19.3% 3.8% 3.8% 3.8%
YoY change +17.5% +5.8% +2.3% +28.3% +26.6% +26.6%
PT.TRUSCO NAKAYAMA
INDONESIA
1 rupiah = 0.0077 yen
(0.0067 yen a year earlier)
Actual results 63 15 31 -15 -13 -13Share against
net sales - 24.8% 49.6% - - -
YoY change +18.0% +34.7% +12.5% - - -
B-(6) Business performance of overseas subsidiaries
©2021 TRUSCO NAKAYAMA CORPORATION All Rights Reserved
▮ Non-consolidated business performance of overseas subsidiaries
[Reference] Non-consolidated business performance in other overseas regions
1Q of FY ending Dec. 2021
1Q of FY ending Dec. 2021
[Overall conditions for the 59th Business Year]
Under the COVID-19 pandemic, Thailand re-extended its declaration of a state of emergency and Indonesia once
again tightened restrictions on social activities. Overseas subsidiaries worked to increase stock according to market
needs and transactions with new clients to step up their sales activities.
* The consolidated gross profit margin via
overseas routes is higher than the non-
consolidated gross profit margin because of
consolidated accounting, such as offsetting of
internal transactions.
Net sales Gross profit
Business performance in other
overseas regions
(including the Philippines,
China and South Korea)
Actual results 147 39
Share against net
sales - 26.5%
YoY change +15.6% +13.4%
Million yen
Million yen
TRUSCO NAKAYAMA Investor Relations 12

©2021 TRUSCO NAKAYAMA CORPORATION All Rights Reserved
B-(7) [Non-consolidated] Analysis of sales for first quarter of FY ending December 2021
▮ Major changes in net sales for 1Q of FY ending December 2021 (Million yen)
58,159
(+1.1%)57,533
Rise in demand for
seasonal products and
droplet protection itemsRise in demand due
to recovery of factory
operation and others
Decrease in demand
for protective
equipment from
special demand
related to COVID-19
in the previous year
1Q of FY ended
Dec. 2020
1Q of FY ending
Dec. 2021
Net Sales Up 626 million yen
[Rise in demand due to recovery of factory operation and others] +1,444 million yen
- Work supply (e.g. adhesives and tapes): +423 million yen
- Hand tools (e.g. tools for manual work and electric power tools: +410 million yen
- Construction goods (e.g. components, hardware and materials): +337 million yen
[Rise in demand for seasonal products and droplet protection items] +528 million yen
- Air conditioning goods (e.g. heaters and factory fans): +319 million yen
- Safety goods (e.g. partitions): +121 million yen
and more ...
[Decrease in demand for protective equipment from special demand due to COVID-19
in the previous year] -657 million yen
- Protective equipment (e.g. face masks and protective clothing): -657 million yen
Details
+1,444
+528
-689
-657 Decrease in others
TRUSCO NAKAYAMA Investor Relations 13

1,723 1,845 1,708 1,549
398
2017 2018 2019 2020 2021
1,829
4,663
6,638
10,027
9,471
9,954
6,661
2,621
5,455
210
1,765(-3.5%)
4,480(-3.9%)
6,793(+2.3%)
10,355 (+3.3%)
9,837 (+3.9%)
9,877 (-0.8%)
6,639 (-0.3%)
2,691 (+2.7%)
5,589 (+2.5%)
129 (-38.6%)
1. Cutting tool 2. Productionprocessing goods
3. Constructiongoods
4. Work supply 5. Hand tool 6. Environmentalsafety equipment
7. Distribution andstorage
equipment
8. Researchmanagement
equipment
9.Office andhousing facility
equipment
10. Others(including catalog)
Sales for the first quarter of the FY ended December 2020 (million yen)
Sales for the first quarter of the FY ending December 2021 (million yen)
Category of goods
(large category)Medium category Trusco’s sales
Constituent
ratioYoY change
Gross profit
margin
Category of goods
(large category)Medium category Trusco’s sales
Constituent
ratioYoY change
Gross profit
margin
1. Cutting tool (1) Cutting tools 796 1.4 -5.3 11.26. Environmental safety
equipment(25) Protective equipment 5,292 9.1 -10.0 24.5
(2)Drilling and thread cutting
tools968 1.7 -2.0 21.7 (26) Safety goods 2,506 4.3 +5.1 25.5
2. Production processing
goods(3) Measurement equipment 2,398 4.1 -0.4 15.9 (27)
Environment improvement
goods451 0.8 +10.3 20.2
(4) Mechatronics 875 1.5 -9.4 15.6 (28) Air conditioning goods 841 1.4 +61.2 15.1
(5) Tools for machine tools 551 0.9 -7.7 23.5 (29) Disaster and crime prevention
goods311 0.5 +16.6 19.1
(6) Electronic machinery 655 1.1 -5.2 11.6 (30) Closets and exterior goods 474 0.8 -3.6 16.4
3. Construction goods (7) Hydraulic tools 513 0.9 -5.2 11.37. Distribution and storage
equipment(31) Loading goods 1,908 3.3 -1.5 17.3
(8) Pumps 803 1.4 -12.0 16.8 (32) Conveyors 273 0.5 -8.6 16.5
(9) Welding equipment 564 1.0 +8.9 17.5 (33) Transportation goods 2,492 4.3 +0.6 22.6
(10) Painting and interior goods 561 1.0 +3.3 25.8 (34) Containers and vessels 950 1.6 +0.1 30.7
(11) Civil engineering and
building goods757 1.3 +15.6 11.6 (35) Steel shelves 1,014 1.7 +1.7 27.2
(12) Ladders and stepladders 796 1.4 -6.9 22.48. Research management
equipment(36) Tool wagons 267 0.5 -2.6 28.8
(13) Piping and materials of
electronic equipment949 1.6 +4.7 23.2 (37) Storage and management goods 351 0.6 -4.2 31.8
(14)Component, hardware, and
building materials1,847 3.2 +8.4 27.2 (38) Work benches 427 0.7 +5.4 28.7
4. Work supply (15) Cutting goods 330 0.6 -3.6 11.9 (39) Stainless goods 497 0.9 +0.2 18.6
(16) Grinding and polishing
goods1,942 3.3 +9.3 31.8 (40)
Research and development-related
goods1,147 2.0 +6.5 18.9
(17) Chemical products 4,734 8.1 -2.9 14.89. Office and housing facility
equipment(41) Cleaning utensils 1,577 2.7 +2.4 21.8
(18) Factory miscellaneous goods 1,155 2.0 +11.8 27.9 (42) Stationery 594 1.0 +6.9 19.6
(19) Packing and binding goods 1,366 2.3 +6.2 29.7 (43) Office miscellaneous goods 829 1.4 +15.6 26.2
(20) Casters 825 1.4 +16.0 30.0 (44) Electric appliances 912 1.6 +0.1 22.3
5. Hand tool (21) Electric power tools and
accessories2,906 5.0 +14.6 21.4 (45) OA business machinery 484 0.8 +3.4 28.3
(22) Pneumatic tools and
accessories1,786 3.1 +12.9 29.6 (46) Office furniture 1,113 1.9 -6.5 24.9
(23) Tools for manual work 4,638 8.0 -4.2 13.9 (47) Interior goods 77 0.1 +8.9 19.4
(24) Tool boxes 506 0.9 -0.7 27.3 10.Others (48) Entire company 129 0.2 -38.6 14.8
(Unit: million yen, %) Total 58,159 100.0 +1.1 21.4
( ) YoY change (%)
B-(8) [Non-consolidated] Sales by category for the first quarter of the FY ending December 2021
▮Sales graph by large category and details of medium category
Constituent ratio
▮Sales of goods used for repair (million yen)
Repair service, Naojiro Repair Workshops
17.0
11.4
4.6
9.6
0.2
3.1
7.7
11.7
17.8
16.9
©2021 TRUSCO NAKAYAMA CORPORATION All Rights Reserved
1,700
(forecast)
TRUSCO NAKAYAMA Investor Relations 14
-5E+08
-4.5E+08
-4E+08
-3.5E+08
-3E+08
-2.5E+08
-2E+08
-1.5E+08
-1E+08
-50000000
0
B-(9) [Non-consolidated] Analysis of sales for first quarter of FY ending December 2021 (by product
category)▮Demand changes by product for 1Q of FY ending December 2021
Million yen
©2021 TRUSCO NAKAYAMA CORPORATION All Rights Reserved
0
:Coronavirus outbreak-related demand+ million yen
- million yen
S
teriliz
atio
n a
nd
hyg
ien
e
go
od
s
Sp
ot a
ir co
nd
ition
ers
an
d c
oo
ling
fan
s
Co
mp
resso
rs
To
rqu
e m
an
ag
em
en
t too
ls
Drill d
rive
rs
Work
ing
lam
ps
Dis
aste
r reco
ve
ry
go
od
s Work
be
nch
es
Sca
ffold
wo
rkin
g
pla
tform
s
Hold
ers
Wais
t be
lt-typ
e p
ers
on
al
fall a
rrest s
yste
ms
Hea
ters
Ca
bin
ets
an
d lo
cke
rs
G
en
era
l-pu
rpo
se
face
ma
sks
M
asks fo
r wo
rkin
g w
ith
exch
an
ge
ab
le filte
rs
Sa
fety
sh
oe
s
(JP
SA
)
T
oile
t pa
pe
r
Fa
cto
ry fa
ns
Ta
pe
H
ea
t an
d te
mp
era
ture
me
asu
ring
instru
me
nts
H
an
dw
ash
an
d d
isin
fectio
n g
oo
ds
Ad
he
siv
es
A
nti-d
rop
let p
artitio
ns
P
rote
ctiv
e g
lasse
s
Po
we
r
ge
ne
rato
rs
-47.9% -41.0% -34.1% -25.9% -16.6% -21.0% -14.0% -31.5% -56.2% -14.4% -12.6% -11.6% -26.8% -18.5% -22.8%
+39.6%
+127.9%
+17.1%+130.0%
+14.5%+43.2% +88.3%
+108.9%+160.9% +45.7%+34.3% +13.4%
Pa
rts c
lea
ne
rs
H
um
idifie
rs
Fu
ll ha
rne
ss-ty
pe
pe
rso
na
l fall a
rrest
syste
ms
+182
+164
+103
+76
+54+48 +48
+36 +32 +29 +29 +28
+69
-408 -239 -134 -127 -69 -55 -43 -40 -39 -38 -36 -33 -29 -20 -18
+103.0%
+77.6%
+26.0%+137
+110
P
rote
ctiv
e
eq
uip
me
nt
W
ork
ing
glo
ve
s
TRUSCO NAKAYAMA Investor Relations 15

▮ Tools that increase customers’ convenience
Number of items listed: Approx. 471,000
(2021 edition)
Number of manufacturers: 1,851
Total number of pages: 17,136
Annual circulation: 190,000 copies
Size: A4
Number of items featured: Approx. 2.39 million
Share of orders received via computer systems:
84.2%
Safety data sheets, drawings and contained
chemical substances investigation sheets are
downloadable.
Available 24 hours per day
AI Kokomite-kun (chatbot)
Responds in natural language.
Voice input supported
Available on smartphones
This is an interactive goods search service based on
AI learning functions. The service can respond to
queries instantly. It supports natural language,
synonyms and technical terms in specific industries.
This is a one-stop website on which it is possible to
search for and purchase professional tools. It also
supports quotation, order, return and real-time stock
status view functions. Revamped last year, its search
features and user-friendliness have improved.
This is a set of catalogs featuring a wide range of
professional tools required in manufacturing. The
TRUSCO Digital Orange Book is also available,
integrating the user-friendliness of hard-copy catalogs
with the portability and search features of online
content.
B-(10) [Non-consolidated] Sales by category of goods featured in the TRUSCO Orange Book for first
quarter of FY ending December 2021
©2021 TRUSCO NAKAYAMA CORPORATION All Rights Reserved
▮ Sales by category of goods listed in the TRUSCO Orange Book and constituent ratiosSales by product category are classified and displayed according to the categories listed in the TRUSCO Orange Book.
Category Net sales YoY change Category Net sales YoY change Category Net sales YoY change
1. Cutting tool ¥1,896 million -3.1 9. Tools for manual work ¥4,707 million +6.5 17. Loading equipment ¥2,444 million -0.92. Tools for machine
tools¥646 million -8.1
10. Electric, hydraulic &
pneumatic tools¥5,539 million +0.1
18. Cleaning & janitorial
supplies¥3,383 million +6.8
3. Measuring & testing
instruments¥2,683 million +3.2 11. Protective equipment ¥5,531 million -13.5
19. Environment
improvement goods¥1,965 million +40.2
4. Mechatronics parts ¥760 million -5.4 12. Safety goods ¥1,381 million +4.0 20. Garden supplies ¥476 million +21.95. Hardware & building
materials¥2,072 million +5.5 13. Packaging supplies ¥3,646 million +9.2
21. Office and housing
facility equipment¥2,845 million -4.1
6. Pneumatic supplies ¥1,122 million -3.814. Construction & lighting
supplies¥5,556 million -1.3 22. Laboratory supplies ¥1,427 million +4.8
7. Electronics ¥1,081 million +6.2 15. Loading goods ¥2,150 million -2.3
8. Chemical products ¥3,330 million +4.016. Logistics & storage
supplies¥3,521 million -0.1
TRUSCO NAKAYAMA Investor Relations 16

40,144 43,596 43,890
41,302 11,289
2017 2018 2019 2020 1Q of FY endingDec. 2021
20.6% 20.3% 19.9% 19.4% 19.4%
35.9% 35.7% 35.8% 36.4% 36.4%
Entire company Factory route e-business route Home center route
Constituent
ratio19.4%
Constituent
ratio19.5%
Constituent
ratio24.3%
Constituent
ratio5.8%
Gross profit
margin36.4%
Gross profit
margin36.6%
Gross profit
margin36.6%
Gross profit
margin30.9%
Net sales YoY change Net sales YoY change Net sales YoY change Net sales YoY change
Total 11,289 -1.6% 8,224 -4.2% 2,735 +7.2% 250 +0.5%
Cutting tools 186 -1.2% 131 -4.0% 33 -0.9% 18 +13.9%
Production processing
goods405 +1.5% 292 -1.8% 100 +13.2% 5 +0.5%
Construction goods 950 +1.0% 684 -2.6% 243 +11.5% 16 +9.1%
Work supply 1,929 +0.0% 1,518 -2.3% 377 +10.7% 20 +1.0%
Hand tool 1,195 +3.1% 830 -1.0% 307 +12.2% 34 +5.3%
Environmental safety
equipment1,764 -14.4% 1,338 -14.2% 390 -11.2% 28 -40.8%
Distribution and
storage equipment2,751 +1.7% 1,941 -1.2% 682 +9.9% 117 +10.6%
Research
management
equipment
945 +0.1% 703 -3.1% 238 +13.1% 0 -48.8%
Office and housing
facility equipment1,158 +1.6% 783 -2.8% 360 +11.5% 8 +139.8%
Other 0 -0.2% 0 - - - 0 -0.3%
B-(11) [Non-consolidated] Sales of private brand (PB) goods for first quarter of FY ending December 2021
▮ Change in sales of PB goods
▮ PB sales ratio by category of goods
▮ Sales of PB goods by category of goods Unit: million yen* Excluding the overseas route ▮ Private Brand (PB) goodsProducts designed and developed
by Trusco.
Approximately 5,000 new products
are launched a year. Their profit margin is greater
than that of national brand goods. PB goods account
for 19.4% of Trusco’s sales.
©2021 TRUSCO NAKAYAMA CORPORATION All Rights Reserved
(YoY change)
In the category of private brand goods, demand for environmental safety equipment related to the prevention of COVID-19 infections came to an
end. After the resumption of factory operations, sales of other products either increased or decreased slightly year on year.
Share
Gross profit
margin
1Q of FY ending Dec. 2021Full year budget
¥44.0 billion yen
(-1.6%)(+8.3%)
(+8.6%) (+0.7%) (-5.9%)
Cutting tools1.6%
Production processing
goods3.6%
Construction goods8.4%
Work supply17.1%
Hand tool10.6%
Environmental safety equipment
15.6%
Distribution and storage
equipment24.4%
Research management
equipment8.4%
Office and housing facility
equipment10.3%
(Unit: million yen, %)
TRUSCO NAKAYAMA Investor Relations 17

1,688 1,854
2,040 2,120 2,048
82 96
102 84 83
2,222 2,339
2,477 2,5372,652
0
500
1,000
1,500
2,000
2,500
3,000
2016 2017 2018 2019 2020
Sales of newly listed goods (unit: 100 million yen)
Sales of previously listed goods (unit: 100 million yen)
Number of suppliers
336,800
374,600 392,100
455,941 464,834
89.5 89.9 90.5 91.0 90.9
0
100,000
200,000
300,000
400,000
500,000
2017 2018 2019 2020 End ofMarch 2021
Number of inventory items (piece)
Inventory hit rate (%)
C-(1) Number of suppliers, sales of newly listed goods, number of items in inventory, hit rate, number of
sales accounts and number of companies
2. [Non-consolidated] Change in the number of inventory items
and the inventory hit rate
1. [Non-consolidated] Changes in the number of suppliers and sales of
goods newly listed in the TRUSCO Orange Book
3. [Consolidated] Change in number of sales accounts and companies
Approx.
5%
*1
©2021 TRUSCO NAKAYAMA CORPORATION All Rights Reserved
(Companies, 100 million yen)
(Piece, %)
%
*2
2. Inventory hit rate: Number of rows used for products shipped from
inventory divided by the total number of rows used for orders.
*1 The reduction in the number of accounts in 2018 is mainly attributable
to deregistration of accounts due to the termination of transactions
with customers using the home center route.
*2 The numbers of companies and accounts including overseas
subsidiaries are presented from 2019 onwards.
1. Products newly listed in our product catalogue, TRUSCO Orange Book,
for the relevant year account for approximately 4% of total sales.
3. The number of accounts is experiencing an upward trend amid growth
of transactions with corporate customers with multiple stores.
21,243 22,375
23,683 25,466
26,327 27,140 26,168 26,881 27,55028,056
5,367 5,415 5,447 5,415 5,348 5,333 5,323
5,592 5,515 5,500
4,000
5,000
6,000
7,000
8,000
9,000
10,000
10,000
12,000
14,000
16,000
18,000
20,000
22,000
24,000
26,000
28,000
30,000
2013 FYE March31, 2014
FYEDecember31, 2014
2015 2016 2017 2018 2019Consolidated
2020Consolidated
2021 1QConsolidated
Number of sales accounts
Number of companies
Approx.
4%
Approx.
5%
Approx.
5%
Approx.
4%
2,132
1,7691,950
2,2032,142
TRUSCO NAKAYAMA Investor Relations 18

D-(1) [Consolidated] Major changes in selling, general and administrative expenses (SGA) for the first quarter of the FY ending December 2021
©2021 TRUSCO NAKAYAMA CORPORATION All Rights Reserved
Unit: million yen, ( ) YoY change
For details on the factors of the changes, please see the next page.
+279
-115
-136
-146
-358
-85
Depreciation
Commission fee
(maintenance and
inspection)
Other
Salary and
bonus
Taxes and
dues
SGA down 465 million yen
9,218 8,752
(-5.1%)
Advertising
expenses
(+19.6%)
(-42.2%)
(-48.4%)
(-24.5%)
(-3.6%)(-6.2%)
Major factors of changes in commission fee- Initial response after revamp of the Paradise core system: -289 million yen
Main factors of changes in depreciation
- Buildings and distribution equipment at distribution centers
Reconstructed building, material handling equipment and others at Planet South Kanto:
+187 million yen
Extended building, material handling equipment and others at Planet Tohoku: +166 million yen
SGA for
2020 1Q
SGA for
2021 1Q
+98
Freight and
packing
expenses
(+6.2%)
Major factors of changes in advertising expenses
- Expenses related to the shareholder benefit program:
-76 million yen
TRUSCO NAKAYAMA Investor Relations 19

D-(2) Selling, general and administrative expenses (SGA) for the first quarter of the FY ending December 2021
▮Details of selling, general and administrative expenses (SGA) Unit: million yen, %
©2021 TRUSCO NAKAYAMA CORPORATION All Rights Reserved
[Non-consolidated] Key Items
( ) YoY changeJan. to Mar. 2020 Jan. to Mar. 2021
YoY change
(amount)YoY change
No. AmountShare in net
salesAmount
Share in net
sales
1 Salary and bonus 2,401 4.2 2,315 4.0 -85 -3.6
2 Depreciation 1,425 2.5 1,704 2.9 +279 +19.6
3Freight and packing
expenses1,573 2.7 1,672 2.9 +98 +6.2
4 Provision for bonuses 661 1.2 668 1.1 +7 +1.2
5 Welfare expenses 524 0.9 516 0.9 -8 -1.6
6 Commission fee 851 1.5 492 0.8 -358 -42.2
7 Taxes and dues 472 0.8 357 0.6 -115 -24.5
8 Advertising expenses 302 0.5 156 0.3 -146 -48.4
9 Promotion expenses 164 0.3 123 0.2 -41 -24.9
10Traveling expenses and
transportation expenses120 0.2 119 0.2 -1 -1.1
11 Supplies expenses 101 0.2 115 0.2 +13 +13.3
12Remuneration paid to
directors113 0.2 105 0.2 -8 -7.3
13 Communication expenses 93 0.2 96 0.2 +3 +3.2
14 Other 102 0.2 86 0.1 -15 -15.5
15Leasehold and office
rents150 0.3 82 0.1 -67 -45.1
16 Utilities expenses 93 0.2 72 0.1 -20 -22.6
17 Vehicle expenses 55 0.1 61 0.1 +6 +11.5
18 Entertainment expenses 9 0.0 5 0.0 -3 -39.2
Total 9,218 16.0 8,752 15.0 -465 -5.1
- Full-time employees 1,656, part-time
employees 1,130
- Overtime pay for employees (-101 million yen)
- Increase in wages and bonuses for part-time
employees (+18 million yen)
- Buildings and distribution equipment at
distribution centers
Reconstructed building, material handling
equipment and others at Planet South Kanto:
+187 million yen
Extended building, material handling
equipment and others at Planet Tohoku: +166
million yen
- Impact of growth in shipping volume (approx.
+71 million yen)
Increase in direct shipments to users (+29
million yen)
=> 620,000 shipments (+70,000)
[Reference] Number of chartered vehicles: 161
(+1 from the end of previous fiscal year)
112 vehicles (+2 from the end of previous
fiscal year) for delivery by the Company's
employees
- Estimated real estate acquisition taxes related
to rebuilding at Planet South Kanto
(-121 million yen)
- Revamp of the Paradise core system
Expenses for initial response (-289 million yen)
- Expenses related to the shareholder benefit
program: -76 million yen
- Expenses for issuance of the 60th anniversary
publication (-24 million yen)
TRUSCO NAKAYAMA Investor Relations 20

107.4 96.7
123.1
15.930.5
17.5 35.0
39.1
5.3
19.0
19.1
39.7
35.4
59.4 7.4
2017 2018 2019 2020 2021forecast
Details of major capital expenditures
FY ended Dec.
2020FY ending Dec. 2021
Actual
expenditures for
1Q to 4Q
Actual
expenditures for
1Q
Expected
expenditures for
2Q to 4Q
Buildings
Planet Osaka warehouse construction - 4.0
Planet East Kanto extension - 2.7
Repairs - 0.7
Others 5.2 -
Buildings subtotal 10.5 5.2 7.4
Facilities
Planet Saitama (logistical functions increased by
introducing I-Pack, the Auto Store picking robot and
others)- 5.6
Introduction of new handheld terminals - 0.3
Takamatsu Stock Center (additional installation of pallet
racks)- 0.3
Planet Tokai (additional installation of racks and others) 0.1 0.1
Toyohashi Stock Center (operation) 0.1 -
Others 0.5 0.4
Facilities subtotal 59.4 0.7 6.7
IT systems
Project for unifying supply chains to customers 0.1 3.0
Replacement with Sterra (new product data management
system)- 3.0
Revision to networks security 0.1 4.0
Shift of existing systems to cloud 0.1 1.8
Replacement of equipment - 1.4
Others 0.3 5.2
IT systems subtotal 5.3 0.6 18.4
Land
Planet Aichi construction plan - 14.1
HC East Japan relocation plan - 3.8
Land subtotal 5.4 0.0 17.9
Total 6.5 50.4
Annual capital expenditures 80.6 56.9
D-(4) [Consolidated] Capital expenditures
▮ Change in capital expendituresUnit: 100 million yen
171
56
144
Capital expenditures
- The investment amount may fluctuate because
the scheduled amount of capital expenditures
includes expenses for projects at the planning
stage.
- The figures for the 59th business year represent
values on a cash-out basis.
©2021 TRUSCO NAKAYAMA CORPORATION All Rights Reserved
For FYE December 31, 2021, depreciation of
7,000 million yen (up 500 million yen year on
year) is planned.
Non-consolidated
▮ Major past and future capital expendituresUnit: 100 million yen
Consolidated
80
197
Land and
buildings
Facilities
Digitalization
TRUSCO NAKAYAMA Investor Relations 21

6967
58th business year FYE December 31, 2020 59th business year FYE December 31, 2021
(Consolidated) (Non-consolidated) (Consolidated) (Non-consolidated)
Actual resultsYoY change in
value YoY % Actual results
YoY change in
valueYoY % Plan
YoY change in
value YoY % Plan
YoY change in
valueYoY %
(¥ million) (%) (%) (¥ million) (¥ million) (%) (¥ million) (¥ million) (%) (¥ million) (¥ million) (%)
Net sales 213,404 -7,270 96.7 213,205 -7,151 96.8 227,520 +14,115 106.6 227,000 +13,795 106.5
Factory route 156,765 -13,276 92.2 156,765 -13,259 92.2 164,355 +7,589 104.8 164,355 +7,589 104.8
e-business route 38,417 +3,925 111.4 38,417 +3,925 111.4 43,744 +5,327 113.9 43,744 +5,327 113.9
Home center route 16,992 +2,289 115.6 16,992 +2,289 115.6 17,700 +707 104.2 17,700 +707 104.2
Overseas route 1,228 -208 85.5 1,030 -107 90.6 1,720 +491 140.0 1,200 +169 116.5
Net sales per day - - - 892 -45 95.1 - - - 945 +53 106.0
Sales of PB goods - - - 41,302 -2,588 94.1 - - - 44,000 +2,698 106.5
Number of business days - - - 239 +4 - - - - 240 +1 -
Gross profit 45,909 -1,124 97.6 45,733 -1,123 97.6 48,960 +3,050 106.6 48,700 +2,967 106.5
Gross profit margin (%) 21.5% +0.2pt - 21.5% +0.2pt - 21.5% ±0.0pt - 21.5% ±0.0pt -
Selling, general and administrative
expenses (SGA)34,891 +1,654 105.0 34,630 +1,695 105.1 35,790 +898 102.6 35,500 +870 102.5
Operating income 11,017 -2,779 79.9 11,102 -2,818 79.8 13,170 +2,152 119.5 13,200 +2,098 118.9
Ordinary income 11,559 -2,638 81.4 11,635 -2,667 81.3 13,820 +2,260 119.6 13,840 +2,205 118.9
Net income 8,007 -1,606 83.3 8,085 -1,629 83.2 9,520 +1,512 118.9 9,550 +1,465 118.1
Net income per share ¥121.43 -¥24.35 - ¥122.62 -¥24.70 - ¥144.37 +¥22.94 - ¥144.82 +¥22.20 +¥22.20
Dividend per share ¥30.50 -¥6.00 - - - - ¥36.50 +¥6.00 - - - -
Inventory value 41,542 -2,110 95.2 40,611 -2,170 94.9 45,810 +4,267 110.3 45,000 +4,388 110.8
Depreciation 6,565 +1,689 134.6 6,495 +1,693 135.3 7,035 469 107.2 6,967 471 107.3
©2021 TRUSCO NAKAYAMA CORPORATION All Rights Reserved
E-(1) Management plan
Budgeting policy
The forecast is used as the entire company’s budget, which is the total of the “annual budget of each branch prepared by the branch manager throughout Japan.” The
branch managers, who are familiar with their market, formulate their respective branch’s budget as they are in charge of deve loping their branch strategy including staffing
and are ultimately accountable for their branch. The full year budget was revised upwards on March 15, 2021.
This management plan represents the estimation the Company made when this material was prepared. The Company does not guarantee the accuracy of information contained herein.
Actual business performance and results may differ from the forecast due to various factors.
TRUSCO NAKAYAMA Investor Relations 22
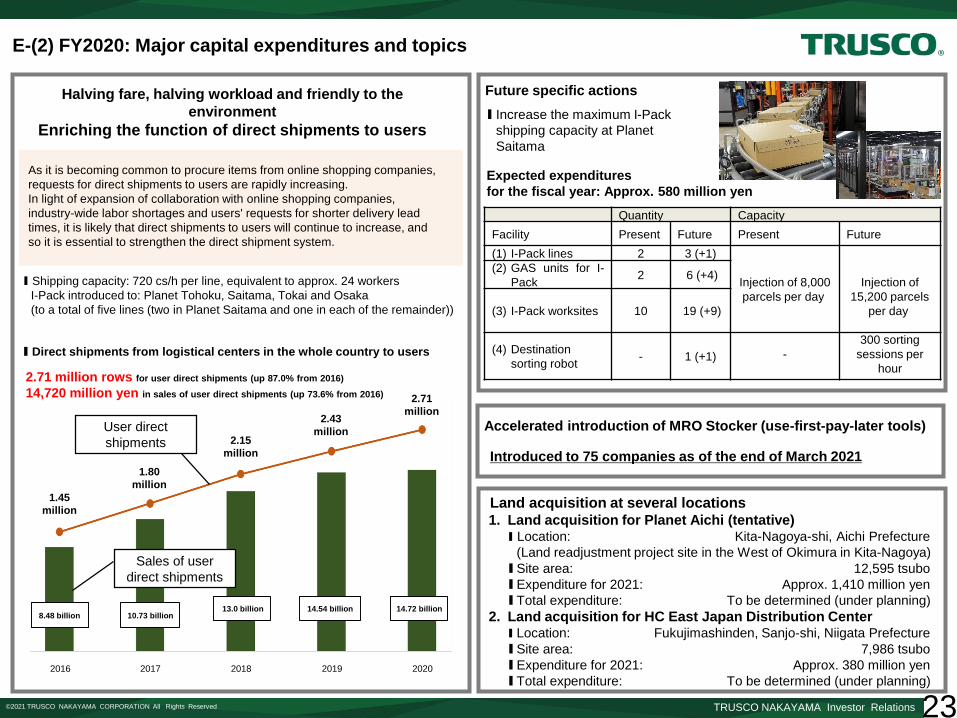
E-(2) FY2020: Major capital expenditures and topics
©2021 TRUSCO NAKAYAMA CORPORATION All Rights Reserved
Land acquisition at several locations1. Land acquisition for Planet Aichi (tentative)
▮ Location: Kita-Nagoya-shi, Aichi Prefecture
(Land readjustment project site in the West of Okimura in Kita-Nagoya)
▮Site area: 12,595 tsubo
▮Expenditure for 2021: Approx. 1,410 million yen
▮Total expenditure: To be determined (under planning)
2. Land acquisition for HC East Japan Distribution Center▮ Location: Fukujimashinden, Sanjo-shi, Niigata Prefecture
▮Site area: 7,986 tsubo
▮Expenditure for 2021: Approx. 380 million yen
▮Total expenditure: To be determined (under planning)
Future specific actions
▮ Increase the maximum I-Pack
shipping capacity at Planet
Saitama
Quantity Capacity
Facility Present Future Present Future
(1) I-Pack lines 2 3 (+1)
Injection of 8,000
parcels per day
Injection of
15,200 parcels
per day
(2) GAS units for I-
Pack2 6 (+4)
(3) I-Pack worksites 10 19 (+9)
(4) Destination
sorting robot- 1 (+1) -
300 sorting
sessions per
hour
Expected expenditures
for the fiscal year: Approx. 580 million yen
Accelerated introduction of MRO Stocker (use-first-pay-later tools)
Introduced to 75 companies as of the end of March 2021
1.45
million
1.80
million
2.15
million
2.43
million
2.71
million
Halving fare, halving workload and friendly to the
environment
Enriching the function of direct shipments to users
As it is becoming common to procure items from online shopping companies,
requests for direct shipments to users are rapidly increasing.
In light of expansion of collaboration with online shopping companies,
industry-wide labor shortages and users' requests for shorter delivery lead
times, it is likely that direct shipments to users will continue to increase, and
so it is essential to strengthen the direct shipment system.
▮ Direct shipments from logistical centers in the whole country to users
2.71 million rows for user direct shipments (up 87.0% from 2016)
14,720 million yen in sales of user direct shipments (up 73.6% from 2016)
Sales of user
direct shipments
User direct
shipments
▮ Shipping capacity: 720 cs/h per line, equivalent to approx. 24 workers
I-Pack introduced to: Planet Tohoku, Saitama, Tokai and Osaka
(to a total of five lines (two in Planet Saitama and one in each of the remainder))
8.48 billion 10.73 billion13.0 billion 14.54 billion 14.72 billion
2016 2017 2018 2019 2020
TRUSCO NAKAYAMA Investor Relations 23

Reference 3: [Consolidated] Quarterly business performance for the FY ending December 2021
▮ First quarter of FY ending December 2021 [Quarterly]Unit: million yen, %
©2021 TRUSCO NAKAYAMA CORPORATION All Rights Reserved
1st Quarter (+1 day) 2nd Quarter (±0 day) 3rd Quarter (±0 day) 4th Quarter (±0 day)
Budget
Share
against
net sales
YoY change Budget
Share
against
net sales
YoY change Budget
Share
against
net sales
YoY change Budget
Share
against
net sales
YoY change
Net sales
Budget 58,121 100.0 +1.1 55,949 100.0 +9.9 54,981 100.0 +9.2 58,469 100.0 +7.0
Actual
results 58,246 100.0 +1.3
Gross profit
Budget 12,516 21.5 -0.3 12,474 22.3 +10.0 11,664 21.2 +10.1 12,306 21.0 +7.8
Actual
results 12,543 21.5 -0.1
Selling, general and
administrative expenses
(SGA)
Budget 8,811 15.2 -4.4 8,899 15.9 +4.5 8,790 16.0 +2.0 9,290 15.9 +8.8
Actual
results 8,752 15.0 -5.1
Operating income
Budget 3,705 6.4 +11.0 3,575 6.4 +26.6 2,874 5.2 +45.4 3,016 5.2 +4.7
Actual
results 3,790 6.5 +13.6
Ordinary income
Budget 3,943 6.8 +16.5 3,807 6.8 +26.3 2,958 5.4 +43.7 3,112 5.3 +0.4
Actual
results 3,995 6.9 +18.0
Quarterly profit
attributable to owners of
parent
Budget 2,725 4.7 +17.4 2,615 4.7 +29.9 2,034 3.7 +47.3 2,146 3.7 -6.4
Actual
results 2,712 4.7 +16.9
TRUSCO NAKAYAMA Investor Relations 24

Reference 4: [Consolidated] Quarterly business performance for the FY ending December 2021
▮ Fiscal year ending December 31, 2021 [Cumulative] Unit: million yen, %
©2021 TRUSCO NAKAYAMA CORPORATION All Rights Reserved
1st Quarter (+1 day) 2nd Quarter (±0 day) 3rd Quarter (±0 day) 4th Quarter (±0 day)
Budget
Share
against
net sales
YoY change Budget
Share
against
net sales
YoY change Budget
Share
against
net sales
YoY change Budget
Share
against
net sales
YoY
change
Net sales
Budget 58,121 100.0 +1.1 114,070 100.0 +5.2 169,051 100.0 +6.5 227,520 100.0 +6.6
Actual
results 58,246 100.0 +1.3
Gross profit
Budget 12,516 21.5 -0.3 24,990 21.9 +4.6 36,654 21.7 +6.3 48,960 21.5 +6.6
Actual
results 12,543 21.5 -0.1
Selling, general and
administrative expenses
(SGA)
Budget 8,811 15.2 -4.4 17,710 15.5 -0.1 26,500 15.7 +0.6 35,790 15.7 +2.6
Actual
results 8,752 15.0 -5.1
Operating income
Budget 3,705 6.4 +11.0 7,280 6.4 +18.2 10,154 6.0 +24.8 13,170 5.8 +19.5
Actual
results 3,790 6.5 +13.6
Ordinary income
Budget 3,943 6.8 +16.5 7,750 6.8 +21.1 10,708 6.3 +26.6 13,820 6.1 +19.6
Actual
results 3,995 6.9 +18.0
Quarterly profit
attributable to owners of
parent
Budget 2,725 4.7 +17.4 5,340 4.7 +23.2 7,374 4.4 +29.0 9,520 4.2 +18.9
Actual
results 2,712 4.7 +16.9
TRUSCO NAKAYAMA Investor Relations 25

Reference (5): Company data
▮ Number of employees [Consolidated] as of the end of March 2021
▮ Numbers of incoming and outgoing employees
▮ Average age and annual income
Share of female employees: 35.1%, Number of female sales staff members: 65,
Females in career-track positions account for 28.7% of all female employees (whereas such males account for 39.3%
of all males).
* The number of part-time employees represents the actual number of such workers under employment.
* Excluding part-time employees
▮ Amount irrecoverable due to bankruptcy ▮ Changes in inventory disposal and inventories
▮ Number of bases [Consolidated] as of the end of March 2021
* The total average annual income includes executive officers and excludes financial
bonds provided as retirement benefits.
* The payment of performance-based bonuses commenced in FY2014. In 2019, they
were discontinued, and bonuses decreased.
* Consolidated accounting has been applied to the fiscal year ended Dec. 2019 and later
fiscal years. From the fiscal year ended Dec. 2019 onwards, the average age figure is
on a consolidated basis, whereas all the average annual income figures are on a non-
consolidated basis.
©2021 TRUSCO NAKAYAMA CORPORATION All Rights Reserved
Females Males Total YoY Change
Executives 1 10 11 -1Executive officers 0 2 2 +0
Career 167 423 590 -22Area 278 305 583 +10
Support 24 2 26 -2Specialist 16 13 29 +0Logistics 76 266 342 -5
Contract employees 1 39 40 +3Overseas subsidiaries 18 24 42 -2
Seconded to health insurance association 1 1 2 +0Seconded to Nakayama Visually Impaired
Welfare Foundation0 0 0 +0
Total number of employees
(excluding executives)581 1,075 1,656 -18
Part-time employees 845 285 1,130 +30Total 1,427 1,370 2,797 +11
Average age (years) Average annual income (million yen)
Females MalesEntire
companyCareer Area Logistics
Entire
company
2020 32.1 41.9 38.4 721 601 461 619
2019 31.3 42.0 38.2 758 642 492 655
2018 30.9 42.1 38.2 804 680 520 701
2017 30.7 42.7 38.6 805 696 541 715
2016 30.6 43.5 39.3 757 651 519 674
2017
[Non-consolidated]
2018
[Non-consolidated]
2019
[Consolidated]
2020
[Consolidated]
End of Mar. 2021
[Consolidated]
Females Males Females Males Females Males Females Males Females Males
No. of employees510 1004 557 1,051 585 1,071 589 1085 581 1075
1,514 1,608 1,656 1,674 1,656
No. of incoming
employees
63 72 52 57 41 46 37 42 0 0
135 109 87 79 0
No. of outgoing
employees
18 18 20 26 42 44 37 33 8 9
36 46 86 70 17
Turnover ratio3.4 1.8 3.5 2.4 6.7 3.9 5.9 3.0 1.4 0.8
2.3 2.8 4.9 4.0 1.0
Head offices 2
Branches 61
Distribution centers 17
Overseas bases 3
Stock centers 9
Total 92
2016 2017 2018 2019 2020
Amount
irrecoverable35 0 4 0 0
2016 2017 2018 2019 2020
Inventory disposal (million yen) 32 41 39 42 50
Inventories (100 million yen) 290 318 370 427 406
Disposal rate (%) 0.11 0.13 0.11 0.10 0.12
Unit: 10 thousand yen
TRUSCO NAKAYAMA Investor Relations 26