Embed Size (px)
DESCRIPTION
This study followed cohorts of English learner students in Arizona over six school years to assess their progress in English proficiency. The study also tracked their academic progress in English language arts and math content knowledge. It analyzed three cohorts—which started at kindergarten, grade 3, and grade 6—from 2006/07 through 2011/12 by their level of English proficiency at the start of the study, eligibility for special education services, eligibility for a school lunch program (a proxy for poverty), gender, and grade level.
Citation preview
7/17/2019 The Achievement Progress of English-learner Students in Arizona
http://slidepdf.com/reader/full/the-achievement-progress-of-english-learner-students-in-arizona 1/53
U . S . D e p a r t m e n t o f E d u c a t i o n
September2015
What’s Happening
Theachievementprogress ofEnglishlearner
studentsinArizona
Eric HaasLoan TranMin Huang Airong YuWestEd
Keyfindings
More than 90 percent of Arizona’s English learner
students scored at or above the required level for
reclassificationasfluentEnglishproficientstudentsoveraperiodofsixschoolyears.Theircumulativepassing
ratewashighestfortheEnglishlanguageproficiency
test, followedbyacademictests inEnglish language
arts and math. English learner students who were
eligibleforspecialeducationserviceshadthelowest
passingratesonall three tests. Ingeneral,English
learnerstudentsinhighergradeshadlowercumulative
passingratesonallthreeteststhanstudentsinlower
grades.
At WestEd
7/17/2019 The Achievement Progress of English-learner Students in Arizona
http://slidepdf.com/reader/full/the-achievement-progress-of-english-learner-students-in-arizona 2/53
U.S. Department of Education
ArneDuncan, Secretary
Institute of Education Sciences
RuthNeild, Deputy Director for Policy and Research
Delegated Duties of the Director
National Center for Education Evaluation and Regional Assistance JoyLesnick, Acting Commissioner
AmyJohnson, Action Editor
OKChoonPark, Project Officer
REL2015–098
TheNationalCenterforEducationEvaluationandRegionalAssistance(NCEE)conducts
unbiasedlargescaleevaluationsofeducationprogramsandpracticessupportedbyfederal
funds; provides researchbased technical assistance to educators and policymakers; and
supports the synthesisand thewidespreaddissemination of the resultsofresearchand
evaluationthroughouttheUnitedStates.
September2015
This report wasprepared for the Institute ofEducation Sciences (IES) under Contract
EDIES12C0002 by Regional Educational Laboratory West administeredby WestEd.
ThecontentofthepublicationdoesnotnecessarilyreflecttheviewsorpoliciesofIESor
theU.S.DepartmentofEducationnordoesmentionoftradenames,commercialproducts,
ororganizationsimplyendorsementbytheU.S.Government.
ThisRELreportisinthepublicdomain.Whilepermissiontoreprintthispublicationis
notnecessary,itshouldbecitedas:
Haas,E.,Tran,L.,Huang,M.,&Yu,A.(2015). The achievement progress of English learner
students in Arizona (REL 2015–098). Washington,DC:U.S.DepartmentofEducation,
InstituteofEducationSciences,NationalCenterforEducationEvaluationandRegional
Assistance,RegionalEducationalLaboratoryWest.Retrievedfrom:http://ies.ed.gov/ncee/
edlabs.
ThisreportisavailableontheRegionalEducationalLaboratorywebsiteat http://ies.ed.gov/
ncee/edlabs.
7/17/2019 The Achievement Progress of English-learner Students in Arizona
http://slidepdf.com/reader/full/the-achievement-progress-of-english-learner-students-in-arizona 3/53
Summary
ToaddressthequestionofhowtosuccessfullyeducategrowingnumbersofEnglishlearner
students, especially those who struggle to pass state English language arts and math
contenttests,thisstudyfollowedcohortsofEnglishlearnerstudentsinArizonaoversix
schoolyearstoassesstheirprogressinEnglishproficiency.Thestudyalsotrackedtheir
academicprogressinEnglishlanguageartsandmathcontentknowledge.Itanalyzedthreecohorts—which started atkindergarten, grade 3, and grade 6—from 2006/07 through
2011/12bytheirlevelofEnglishproficiencyatthestartofthestudy,eligibilityforspecial
educationservices,eligibilityforaschoollunchprogram(aproxyforpoverty),gender,and
gradelevel.
Totrackthestudents’progress,thestudyusedArizona’sEnglishlanguageproficiencytest
andthestates’knowledgecontenttestsinEnglishlanguageartsandmath.Thisreport
describes thecumulative percentageofArizona’s English learner studentswho reached
eachofthreespecificmilestonesduringthestudyperiod:meetingthecriteriaforreclas-
sificationas fluentEnglishproficientstudents,passingtheEnglishlanguageartscontent
testforthefirsttime,andpassingthemathcontenttestforthefirsttime.ThestudyalsocomparedthecumulativepassingratesofEnglishlearnerstudentstakingthethreetests.
Finallyitcomparedthestudents’progressinEnglishproficiencywithArizona’sexpecta-
tionthatEnglishlearnerstudentsadvanceatleastoneproficiencyleveleachyear.
Duringthestudyperiodmorethan90 percentoftheEnglishlearnerstudentswerereclas-
sifiedasfluentEnglishproficientstudents.
Ineachofthethreegradelevelcohorts,theoverallcumulativepassingratewashighestfor
theEnglishlanguageproficiencytest,followedbytheEnglishlanguageartscontenttest,
andthenthemathcontenttest.
• Within thekindergartencohort,91 percentofstudentspassed theEnglishlan-guageproficiencytest,80 percentpassedtheEnglishlanguageartscontenttest,
and70 percentpassedthemathcontenttest.
• Withinthegrade3cohort,97 percentofstudentspassedtheEnglishlanguage
proficiency test, 73 percent passed the English language arts content test, and
68 percentpassedthemathcontenttest.
• Withinthegrade6cohort,94 percentofstudentspassedtheEnglishlanguage
proficiency test, 51 percent passed the English language arts content test, and
43 percentpassedthemathcontenttest.
Thelargestdifferencesincumulativepassingratesforallthreetestswereassociatedwith
studenteligibilityfor specialeducationservicesandwithinitial Englishlanguageprofi-ciencylevel(onascaleof1to5).Smallerdifferencesincumulativepassingrateswere
associatedwithstudenteligibilityforschoollunchprogramsandwithstudentgender.
Forthekindergartenandgrade3cohorts,Englishlearnerstudentswhostartedthestudy
at thehighestEnglish language proficiency level belowthatneeded for reclassification
asfluentEnglishproficient studentshadhighercumulativepassingrateson theEnglish
languageartsandmathcontentteststhanEnglishlearnerstudentswhostartedatlower
Englishlanguageproficiencylevels.However,forthegrade6cohort,Englishlearnerstu-
dentswhostartedthestudyatthelowestproficiencylevelhadhighercumulativepassing
i
7/17/2019 The Achievement Progress of English-learner Students in Arizona
http://slidepdf.com/reader/full/the-achievement-progress-of-english-learner-students-in-arizona 4/53
ratesthan Englishlearnerstudentswhostartedatthehighestlevel.Englishlearnerstu-
dentsinhighergradeshadlowercumulativepassingratesontheEnglishlanguageartsand
mathcontentteststhanEnglishlearnerstudentsinlowergrades.
StudentsdidnotprogressinEnglishfluencyattheexpectedannualmeasurableachieve-
mentobjectiverateofonelevelperyear.ThepercentageofEnglishlearnerstudentswho
metthisprogressexpectationvariedfrom27 percentto89 percentforgroupswithdiffer-entcombinationsofgradelevelcohortandinitialEnglishlanguageproficiencylevel.
ii
7/17/2019 The Achievement Progress of English-learner Students in Arizona
http://slidepdf.com/reader/full/the-achievement-progress-of-english-learner-students-in-arizona 5/53
Contents
Summary i
Why this study? 1
What the study examined 3
What the study found 5
HowquicklyEnglishlearnerstudentsbecameproficientinEnglish 7
HowwellEnglishlearnerstudentsdidacademicallyinreadingandmath 9
Comparisonofcumulativepassingratesacrosstestsandcohorts 15
ComparisonofcumulativepassingrateswithArizona’sprogressexpectations 15
Implications of the study findings 16
Studyimplications 16
Threefindingsexpandthecurrentresearchliteratureandpointtoareasforfurtherresearch 17
Threefindingswerenotconsistentwiththeresearchliteratureandpointtoareasfor additional research 19
Limitations of the study 21
Appendix A. Arizona programs that provide context for the study A-1
Appendix B. Data and methodology B-1
Appendix C. Additional findings C-1
Note Notes-1
References Ref-1
Boxes
1 PreviousstudiesshowEnglishlearnerstudentstendtolagbehindnativeEnglishspeakers
on academicachievementtests 1
2 Keyterms 2
3 Dataandmethods 5
B1 Timingofproficiency,languagearts,andmathtests B-1
Figures1 ProgressinachievingreclassificationasfluentEnglishproficientstudentsslowedatthe
endofthestudyperiodforallcohorts,2006/07–2011/12 7
2 Forthegrade3andgrade6cohorts,Englishlearnerstudentsatthetwolowestinitial
Englishlanguageproficiencylevels(pre-emergentandemergent)outperformedstudents with
aninitialEnglishlanguageproficiencylevelofbasicinachievingreclassificationasflue nt
English proficient,2006/07–2011/12 8
iii
7/17/2019 The Achievement Progress of English-learner Students in Arizona
http://slidepdf.com/reader/full/the-achievement-progress-of-english-learner-students-in-arizona 6/53
3 Thegrade6cohorthadthelargestdifferenceinthecumulativepercentageofstudents
achievingreclassificationasfluentEnglishproficientstudentsbetweenEnglishlearner
studentswhowereeligibleforspecialeducationservicesandthosewhowerenoteligible,
2006/07–2011/12 9
4 ProgressinpassingEnglishlanguageartscontenttestswassteadyfromthebeginningto
the endofthestudyforthegrade3andgrade6cohorts,2006/07–2011/12 10
5 OntheEnglishlanguageartscontenttest,Englishlearnerstudentsinitiallyassessedatthe intermediateEnglishlanguageproficiencylevelhadhighercumulativepassingrates
than Englishlearnerstudentsatlowerproficiencylevelsforthekindergartenandgrade3
cohortsbutnotforthegrade6cohort,2006/07–2011/12 11
6 Englishlearnerstudentswhowereeligibleforspecialeducationservicesstartedwithlower
passingratesontheEnglishlanguageartscontenttest,andthesedifferenceswereconstant
forthekindergartencohortandincreasedforthegrade3and6cohorts,2006/07–2011/12 12
7 Progressinpassingthemathcontenttestslowedtowardtheendofthestudyforthe
grade 3 andgrade6cohorts,2006/07–2011/12 13
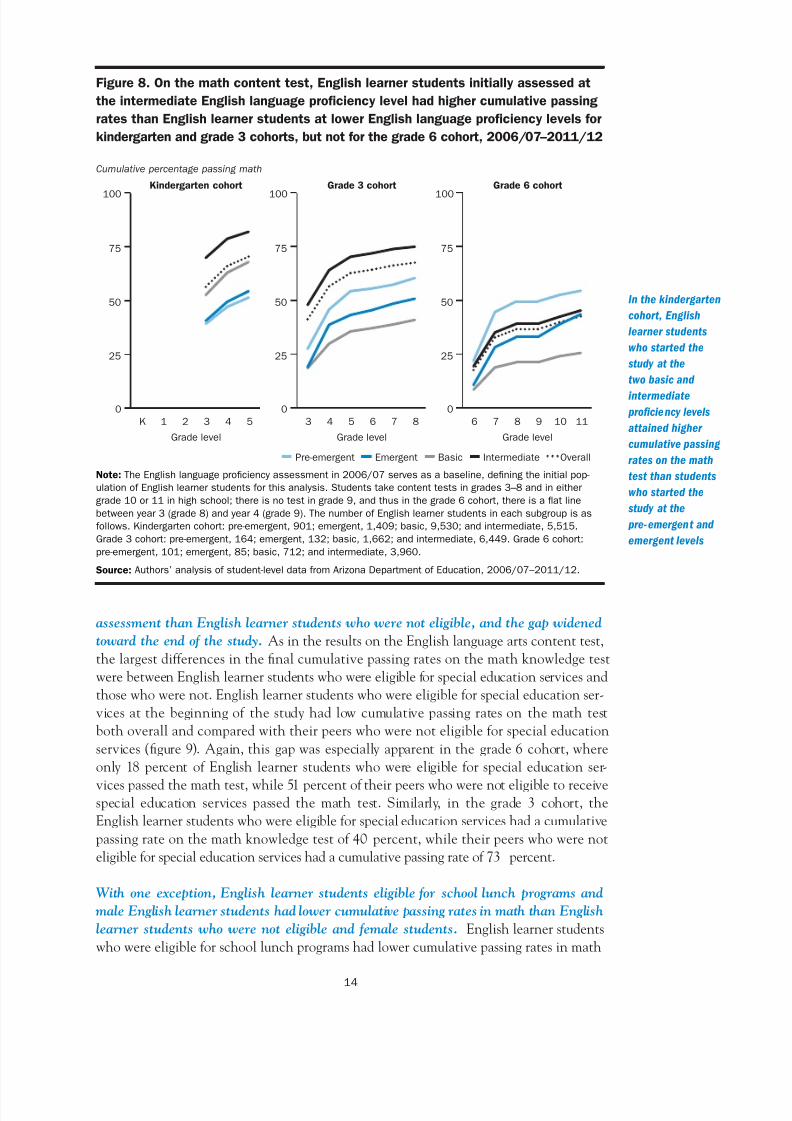
8 Onthemathcontenttest,Englishlearnerstudentsinitiallyassessedattheintermediate
EnglishlanguageproficiencylevelhadhighercumulativepassingratesthanEnglishlearner
studentsatlowerEnglishlanguageproficiencylevelsforkindergartenandgrade3cohorts,but notforthegrade6cohort,2006/07–2011/12 14
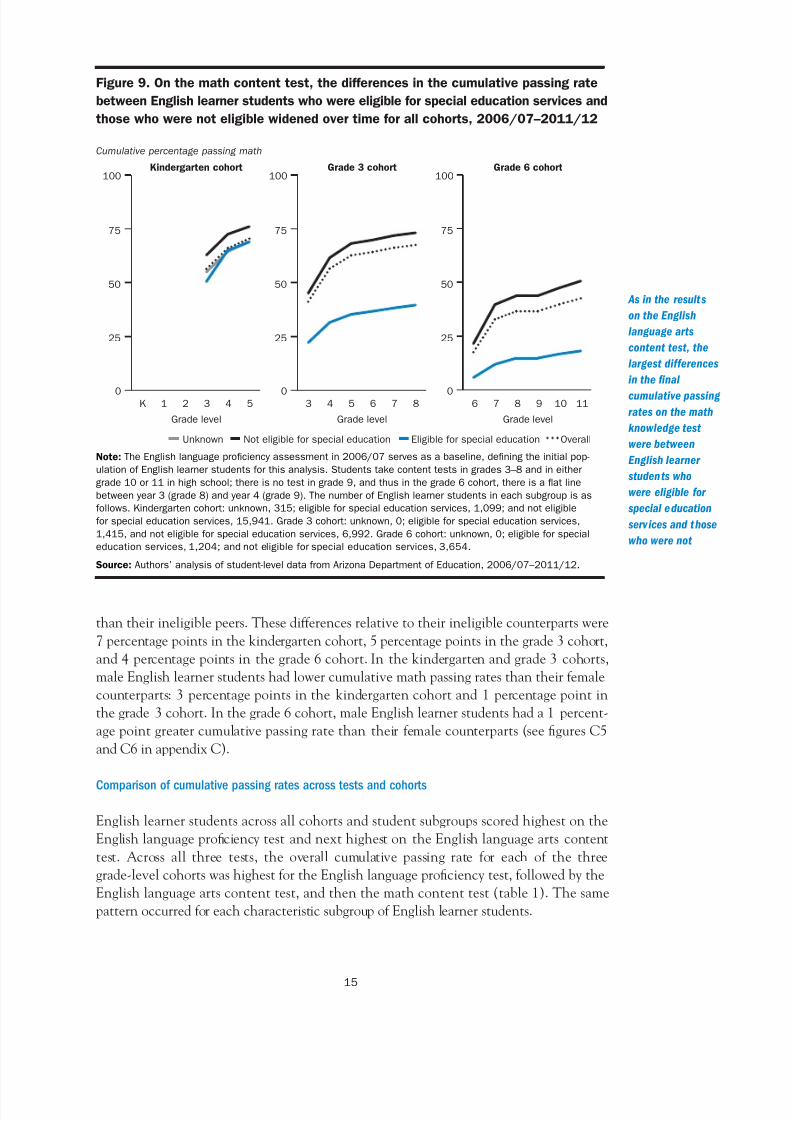
9 Onthemathcontenttest,thedifferencesinthecumulativepassingratebetweenEnglish
learnerstudentswhowereeligibleforspecialeducationservicesandthosewhowerenot
eligiblewidenedovertimeforallcohorts,2006/07–2011/12 15
C1 Forallthreecohorts,thedifferencesinratesofreclassificationasfluentEnglishproficient
narrowedoverthecourseofthestudybetweenEnglishlearnerstudentswhowereeligible
for schoollunchprogramsandthosewhowerenoteligible,2006/07–2011/12 C1
C2 Forthekindergartencohort,thedifferenceinratesofreclassificationasfluentEnglish
proficientbetweenfemaleandmalestudentswaslargerthaninthegrade3and6
cohorts, 2006/07–2011/12 C2
C3 ThedifferenceinpassingratesonArizona’sEnglishlanguageartscontenttestbetweenEnglishlearnerstudentswhowereeligibleforschoollunchprogramsandthosewhowere
not eligibleremainedfairlyconstantoverthecourseofthestudy,2006/07–2011/12 C3
C4 FemaleEnglishlearnerstudentshadconsistentlyhigherEnglishlanguageartspassing
rates thanmaleEnglishlearnerstudents,butthedifferencesinpassingrateswerelarger
in thekindergartencohort,2006/07–2011/12 C4
C5 ThedifferenceinpassingratesinmathwasconstantovertimebetweenEnglishlearner
studentswhowereeligibleforschoollunchprogramsandthosewhowerenoteligiblefor
the kindergartenandgrade3cohortsbutnotforthegrade6cohort,2006/07–2011/12 C5
C6 Acrossallthreecohortsthecumulativepassingratesinmathforfemaleandmale
English learnerstudentswereverycloseoverthecourseofthestudy,2006/07–2011/12 C6
Tables
1 Cumulativepassingratesforeachcohortforeachtypeofassessment,2006/07–2011/12
(percentofstudentspassingthetest) 16
A1 ProgressofEnglishlearnerstudentsinmeetingArizona’sannualmeasurableachievement
objective1,byinitialEnglishlanguageproficiencylevelandcohort,2006/07–2011/12 A3
B1 Stepstogettingananalyticsampleforeachtest B3
B2 CharacteristicsofstudentsintheanalyticsamplesandtheentireinitialEnglishlearner
studentpopulation B4
iv
7/17/2019 The Achievement Progress of English-learner Students in Arizona
http://slidepdf.com/reader/full/the-achievement-progress-of-english-learner-students-in-arizona 7/53
B3 CharacteristicsofstudentsintheanalyticsamplesbyinitialEnglishlanguageproficiency
levelinkindergartencohort B6
B4 CharacteristicsofstudentsintheanalyticsamplesbyinitialEnglishlanguageproficiency
levelingrade3cohort B7
B5 CharacteristicsofstudentsintheanalyticsamplesbyinitialEnglishlanguageproficiency
levelingrade6cohort B8
v
7/17/2019 The Achievement Progress of English-learner Students in Arizona
http://slidepdf.com/reader/full/the-achievement-progress-of-english-learner-students-in-arizona 8/53
Whythisstudy?
AcrosstheUnitedStates,particularlyinstatesservedbyRegionalEducationalLaboratory
(REL)West,concerniswidespreadabouthowtosuccessfullyeducategrowingnumbersof
Englishlearnerstudents,especiallythosewhostruggletopassstateEnglishlanguagearts
andmathcontenttests (Horwitzet al.,2009;Olsen,2010;QualityCounts,2009).The
membersofRELWest’sEnglishLearnerAlliance,whichincludesrepresentativesofstatedepartmentsofeducationinArizona,Nevada,andUtah,requestedstudiesoftheEnglish
languageproficiencyandacademicprogressofEnglishlearnerstudentsintheirstates.This
studyisforArizona.
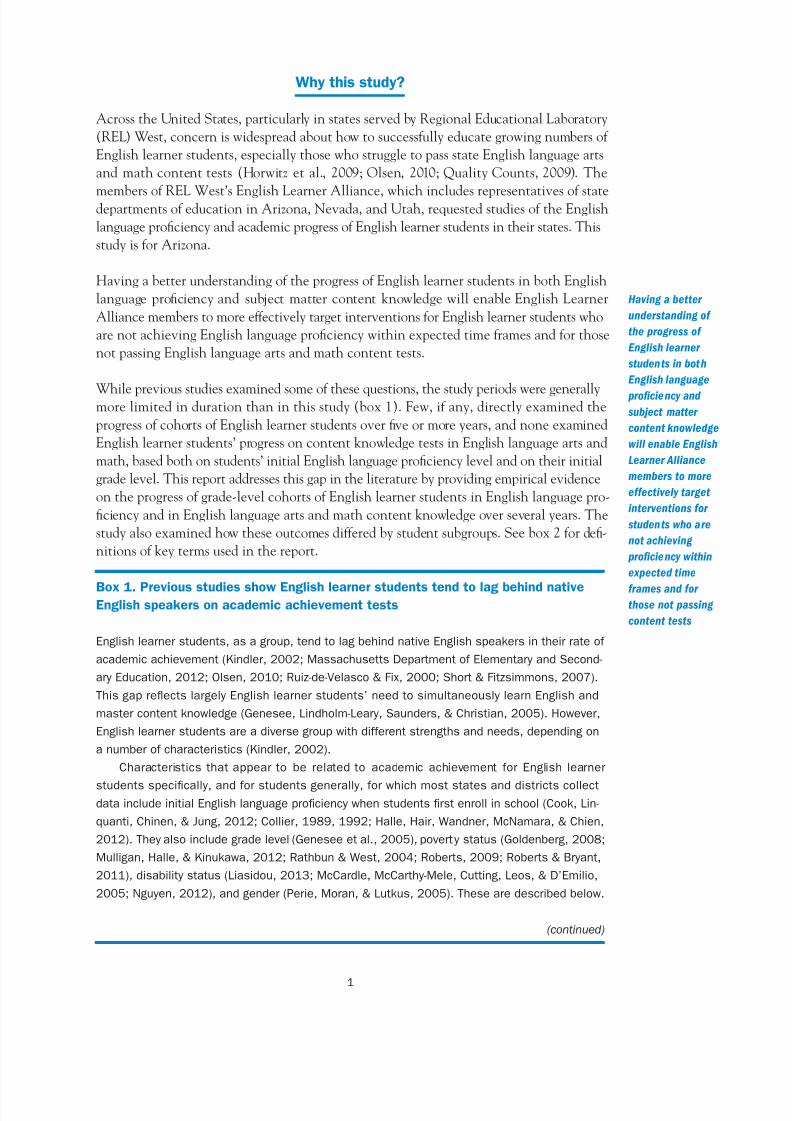
HavingabetterunderstandingoftheprogressofEnglishlearnerstudentsinbothEnglish
languageproficiencyand subjectmattercontentknowledgewill enableEnglishLearner
AlliancememberstomoreeffectivelytargetinterventionsforEnglishlearnerstudentswho
arenotachievingEnglishlanguageproficiencywithinexpectedtimeframesandforthose
notpassingEnglishlanguageartsandmathcontenttests.
Whilepreviousstudiesexaminedsomeofthesequestions,thestudyperiodsweregenerallymorelimitedindurationthaninthisstudy(box1).Few,ifany,directlyexaminedthe
progressofcohortsofEnglishlearnerstudentsoverfiveormoreyears,andnoneexamined
Englishlearnerstudents’progressoncontentknowledgetestsinEnglishlanguageartsand
math,basedbothonstudents’initialEnglishlanguageproficiencylevelandontheirinitial
gradelevel.Thisreportaddressesthisgapintheliteraturebyprovidingempiricalevidence
ontheprogressofgradelevelcohortsofEnglishlearnerstudentsinEnglishlanguagepro-
ficiencyandinEnglishlanguageartsandmathcontentknowledgeoverseveralyears.The
studyalsoexaminedhowtheseoutcomesdifferedbystudentsubgroups.Seebox2fordefi-
nitionsofkeytermsusedinthereport.
Box1.PreviousstudiesshowEnglishlearnerstudentstendtolagbehindnativeEnglishspeakersonacademicachievementtests
Englishlearnerstudents,asagroup,tendtolagbehindnativeEnglishspeakersintheirrateof
academicachievement(Kindler,2002;MassachusettsDepartmentofElementaryandSecond-
aryEducation,2012;Olsen,2010;RuizdeVelasco&Fix,2000;Short&Fitzsimmons,2007).
ThisgapreflectslargelyEnglishlearnerstudents’needtosimultaneouslylearnEnglishand
mastercontentknowledge(Genesee,LindholmLeary,Saunders,&Christian,2005).However,
Englishlearnerstudentsareadiversegroupwithdifferentstrengthsandneeds,dependingon
anumberofcharacteristics(Kindler,2002).
Characteristics thatappearto be relatedto academic achievement forEnglish learner
studentsspecifically,andforstudentsgenerally,forwhichmoststatesanddistrictscollectdataincludeinitialEnglishlanguageproficiencywhenstudentsfirstenrollinschool(Cook,Lin-
quanti,Chinen,&Jung,2012;Collier,1989,1992;Halle,Hair,Wandner,McNamara,&Chien,
2012).Theyalsoincludegradelevel(Geneseeet al.,2005),povertystatus(Goldenberg,2008;
Mulligan,Halle,&Kinukawa,2012;Rathbun&West,2004;Roberts,2009;Roberts&Bryant,
2011),disabilitystatus(Liasidou,2013;McCardle,McCarthyMele,Cutting,Leos,&D’Emilio,
2005;Nguyen,2012),andgender(Perie,Moran,&Lutkus,2005).Thesearedescribedbelow.
(continued)
Having a better
understanding of
the progress of
English learner
students in both
English language
proficiency and
subject matter
content knowledge
will enable English
Learner Alliance
members to more
effectively target
interventions for
students who are
not achieving
proficiency within
expected time
frames and forthose not passing
content tests
1
7/17/2019 The Achievement Progress of English-learner Students in Arizona
http://slidepdf.com/reader/full/the-achievement-progress-of-english-learner-students-in-arizona 9/53
Box1.PreviousstudiesshowEnglishlearnerstudentstendtolagbehindnative
Englishspeakersonacademicachievementtests(continued)
Initial English language proficiency and grade level.Researchshows that generallyEnglish
learnerstudentswhoenterschoolatthesameEnglishproficiencyleveltendtomakegreater
yeartoyear progress in English language proficiency and academic content knowledge in
thelowergradesthantheydoin thehighergrades(Cook,Wilmes,Boals,&Santos,2008;Grissom,2004;Kieffer,2008,2010,2011;Salazar,2007).
Poverty status. Englishlearnerstudentsfromhomesoflowersocioeconomicstatusgenerally
scoreloweronacademiccontenttestsandarelesslikelytoachievereclassificationasfluent
Englishproficientstudentsthantheirpeersofhighersocioeconomicstatus(Mulliganet al.,
2012;Roberts&Bryant,2011).
English learner students with disabilities. Nearly 400,000English learnerstudents in the
UnitedStatesin gradesK–12were identifiedasneedingspecial education servicesin the
2001/02schoolyear (McCardleet al., 2005).While a learning disability canaffecta stu-
dent’sacademic achievement,it isoftendifficult todeterminewhetherEnglishlearnerstu-
dentsstruggletodevelopliteracyandotheracademicbenchmarksbecauseoftheirlimited
English proficiency orbecause they have a learningdisability(Klingner, Artiles,&Barletta,
2006;Nguyen,2012).
Gender.DifferencesinacademicachievementbygenderhavebeenfoundamongK–12stu-
dents,includingsmallbutpersistentmathgenderdisparitiesfavoringboys(McGraw,Lubiens-
ki,&Strutchens,2006;Perieet al.,2005)andsmallreadingachievementgenderdisparities
favoringgirls(Perieet al.,2005).
Box2.Keyterms
Annual measurable achievement objective 1.ThefederalElementaryandSecondaryEduca-
tion Actof 2001askedstatesto setexpectations ofhowquickly English learnerstudents
shouldbeexpectedtoprogressfromoneEnglishproficiencyleveltothenext,measuredby
annualincreasesinthenumberorpercentageofstudentsmakingprogressinlearningEnglish.
Arizona,likeabouthalfthestates,setanexpectationofincreasingoneEnglishlanguagepro-
ficiencylevel,forexamplefromemergenttobasic,perschoolyear.ThatmeansthatEnglish
learnerstudentsinthestudyshouldhavebeen reclassifiedasfluentEnglishproficientstu-
dentswithinonetofouryearsofthestartofthestudy,dependingonthelevelatwhichthey
startedin2006/07.SeeappendixA.
Arizona English Language Learner Assessment (AZELLA).Thisassessmentmakestheinitial
determinationofwhetherastudentisclassifiedasanEnglishlearnerandplacesthestudentat
oneoffivelevelsofEnglishproficiency.Theassessmentmeasuresproficiencyinfourdomains:
listening,writing,reading,andspeaking.StudentsarereclassifiedasfluentEnglishproficient
studentswhentheypassthefifthleveloftheassessment.TheAZELLAisgiveneveryspring,
and studentscan retakeit upto twice a year with therecommendationof a teacher.See
appendixA.
(continued)
2
7/17/2019 The Achievement Progress of English-learner Students in Arizona
http://slidepdf.com/reader/full/the-achievement-progress-of-english-learner-students-in-arizona 10/53
Box2.Keyterms(continued)
Arizona’s Instrument to Measure Standards (AIMS) English language arts and math content
tests.ArizonaadministersstatecontenttestsinseveralsubjectsincludingEnglishlanguage
artsandmath.Studentstakecontenttestsannuallyingrades3–8andineithergrade10or
11inhighschool;thereisnotestingrade 9.
Cohorts. Students were grouped into three analytic gradelevel cohorts based on their
2006/07gradelevel:kindergarten,grade3,orgrade6.Withineachcohort,students’initial
Englishlanguageproficiencylevelwasdeterminedbasedonthe2006/07AZELLA.Thefirst
academicassessmenttestswerealsoadministeredin2006/07.Thestudycoveredthesix
schoolyears2006/07–2011/12.Thusthekindergartencohortfollowedstudentsfromkinder-
gartentograde5,thegrade3cohortfromgrade3tograde8,andthegrade6cohortfrom
grade6tograde11(alsoseebox3).
Cumulative percentage.Thetotalpercentageofstudentsmeetinganachievementoutcomeup
tothatpointintime.Forexample,thecumulativepercentageofEnglishlearnerstudentswho
passedthemathcontenttestinyear3ofthestudyisthetotalpercentageofEnglishlearner
studentswhopassedyears1,2,and3addedtogether.
English learner.StudentsareclassifiedasEnglishlearnerstudentsiftheyfallintolevels1–4
ontheAZELLA.Studentsareaskedtotaketheassessmentiftheirfamilyspeaksalanguage
otherthanEnglishathome.
English language proficiency levels. ArizonahasfivelevelsofEnglish languageproficiency:
preemergent(level1),emergent(level2),basic(level3),intermediate(level4),andproficient
(level5).EnglishlearnerstudentsarereclassifiedasfluentEnglishproficientstudentswhen
theyachievelevel5.ThelevelsarebasedontheAZELLA(seeabove).Throughoutthisreport,
EnglishlanguageproficiencylevelreferstotheEnglishlanguageproficiencylevelinthefirst
yearofthestudyperiod.
Fluent English proficient students. StudentsarereclassifiedfromEnglishlearnerstudentstofluentEnglishproficientstudentswhentheyachievelevel5,proficient,ontheEnglishlanguage
proficiencyassessment(AZELLA).
Special education services.Allspecialeducationservicesandindividualizededucationpro-
grams under this Arizona Department of Education designation in the state datasetwere
includedinthestudysample.Datawerenotcollectedonindividualtypesoflearningdisabili-
tiesorspecialeducationserviceswithinthisgeneralcategory.
Whatthestudyexamined
ThisstudyisadescriptiveanalysisoftheprogressofthreegradelevelcohortsofArizonaEnglishlearnerstudentsinEnglishlanguageproficiencyandinEnglishlanguageartsand
mathcontentknowledgeover2006/07–2011/12.Englishlanguageproficiencyscoresand
Englishlanguageartsandmathcontenttestscoreswerefollowedoverthestudyperiod.
Threecohortsofstudentswereexaminedbasedontheirgradelevelin2006/07:kindergar-
ten,grade3,orgrade6.Students’initialEnglishlanguageproficiencylevelwasbasedon
resultsonArizona’s2006/07Englishlanguageproficiencytest(seebox2).
3
7/17/2019 The Achievement Progress of English-learner Students in Arizona
http://slidepdf.com/reader/full/the-achievement-progress-of-english-learner-students-in-arizona 11/53
The study examined the cumulative percentages of students in each of these cohorts
who reached each of three specific academic milestones over the course of the study
(2006/07–2011/12):
• Scoringator abovethe level for reclassificationas fluentEnglishproficient stu-
dentsonthestateEnglishlanguageproficiencytest.
• PassingtheEnglishlanguageartscontenttestforthefirsttime.
• Passingthemathcontenttestforthefirsttime.
Thestudy alsoexamined how meetingthese criteria variedbystudents’ initialEnglish
languageproficiencylevel(seebox2),eligibilityforspecialeducationservices,eligibility
forfederalschoollunchprograms(aproxyforlowincomestatus),gender,andgradelevel
(which,ofcourse,changedoverthestudyperiod).
Specifically, this report addresses the following researchquestions for each year of the
studyperiod.
TodeterminehowquicklyEnglishlearnerstudentsbecameproficientinEnglish:
• WhatwasthecumulativepercentageofEnglishlearnerstudentsfromeachcohortwhowerereclassifiedasfluentEnglishproficientstudentsforthefirsttimeafterthe
baselineyear(2006/07)?
• How did the cumulative percentage of English learner students who achieved
reclassificationasfluentEnglishproficientstudentsvarybystudents’initialEnglish
languageproficiencylevel,eligibilityforspecialeducationservices,eligibilityfor
schoollunchprogram,gender,andgradelevel?
TodeterminehowwellEnglishlearnerstudentsdidacademicallyinEnglishlanguagearts
andmath:
• WhatwasthecumulativepercentageofEnglishlearnerstudentsfromeachcohort
whopassedtheEnglishlanguageartscontenttestforthefirsttimeafterthebase-lineyear?
• HowdidthecumulativepercentageofEnglishlearnerstudentswhopassedthe
Englishlanguageartscontenttestforthefirsttimevarybystudents’initialEnglish
languageproficiencylevel,eligibilityforspecialeducationservices,eligibilityfor
theschoollunchprogram,gender,andgradelevel?
• WhatwasthecumulativepercentageofEnglishlearnerstudentsfromeachcohort
whopassedthemathcontenttestforthefirsttimeafterthebaselineyear?
• HowdidthecumulativepercentageofEnglishlearnerstudentswhopassedthe
mathcontenttestforthefirsttimevarybystudents’initialEnglishlanguagepro-
ficiencylevel,eligibilityforspecialeducationservices,eligibilityforaschoollunch
program,gender,andgradelevel?
The study also compared the cumulative reclassification rates of English learner stu-
dentsontheEnglishproficiency testsandthecumulativepassingratesoncontenttests
inEnglishlanguageartsandmath.Finallyitcomparedthecumulativepassingratesfor
EnglishlearnerstudentsateachEnglishproficiencylevelwithArizona’sprogressexpec-
tationsonannualmeasurableachievementobjective1,ofadvancingatleastoneEnglish
languageproficiencyleveleachyear.
Box3summarizesthestudy’sdatasourcesandmethods.AppendixBprovidesmoredetail.
This report
provides empir ical
evidence on the
progress of grade-
level cohorts of
English learner
students in
English language
proficiency and in
English language
arts and math
content knowledge
over several years
4
7/17/2019 The Achievement Progress of English-learner Students in Arizona
http://slidepdf.com/reader/full/the-achievement-progress-of-english-learner-students-in-arizona 12/53
Box3.Dataandmethods
Data source. Thestateof Arizonaprovideddataonall studentswhohadEnglish language
proficiencytestresultsandsubjectmattercontenttestresultsinEnglishlanguageartsand
mathfrom2006/07through2011/12,startinginkindergarten,grade3,andgrade6.Thisset
ofdataenabledRegionalEducationalLaboratoryWesttoexamineaspectsofthesestudents’
progressinEnglishlanguageproficiencyandacademicknowledgeoversixschoolyears.
Analysis sample and methods. BecausethestudyanalyzedtheentirepopulationofArizona
English learner studentswho met the analytic sample criteria for each of the gradelevel
cohorts,statisticaltestswerenotconducted.
TheanalyticsampleincludedallstudentsidentifiedasEnglishlearnerstudentswhowere
enrolledinthestate’spublicschoolsinthedesignatedgradeofthefirstyearofthecohort,
whoprogressedtothenextgradeleveleachyear,andwhohadtherequiredtestdatathrough-
outthesixyearsbeinganalyzed.
Eachcohortconsistedofaseparatesampleofstudents.Forexample,thestudentsin
thegrade3cohort were English learnerstudentswhoenrolled inanArizonapublicschool
ingrade3in2006/07,progressedtothenextgrade leveleachyear,andhadthe required
Arizonatestscoredatathroughgrade8in2011/12.Eachcohortwasprogressivelysmaller
becausethegrade3andgrade6cohortsdidnotincludeanystudentswhowereidentifiedas
Englishlearnerstudentsinpreviousschoolyearsbutwhometthereclassificationcriteriaas
fluentEnglishproficientstudentsbeforethestudybegan.(ForEnglishlearnerstudentsinthe
kindergartencohort,theirEnglishlanguageproficiencylevelwastheirlevelwhentheystarted
schoolin2006/07.)Forexample,fortheEnglishproficiencytests,thekindergartencohorthad
16,377students,thegrade3cohorthad7,938students,andthegrade6cohorthad4,287
students.Foradescriptionofthestepstakentodefineeachanalyticsample,seetableB1in
appendixB.
TheanalysesweredoneforeachEnglishlearnergradelevelcohortasawholeandalso
bybothcohortandeachoffourstudentcharacteristicsatthestartofthe2006/07school
year:Englishlanguageproficiencylevel,eligibilityforspecialeducationservices,eligibilityfor
federalschoollunchprograms,andgender.Forabreakdownofthecharacteristicsofthewhole
sampleandeachcohort,seetablesB2–B5inappendixB.
FortheEnglishlanguageproficiencyanalysis,2007/08wasthefirstyearwhendatawere
availableonmeasuredprogress(relativeto2006/07),and2011/12wasthefinalyear,for
atotaloffiveyearsofprogressmeasurement.Forthesubjectmattercontenttests,English
learnerstudents’achievementlevelsforschoolyears2006/07–2011/12wereexamined,for
atotalofsixyears.
SeeappendixBforfurtherdetailsondataandmethods.
Whatthestudyfound
Between2006/07and 2011/12allthreecohortsof Englishlearnerstudentsmademajor
progress in achieving reclassificationas fluent Englishproficient students.By2011/12at
least90 percentofeachcohort’sstudentswerereclassifiedasfluentEnglishproficientstu-
dentsbasedontheirperformanceontheArizonaEnglishLanguageLearnerAssessment
(AZELLA; see box2). English learner students in the grade 3 cohort had the highest
cumulativereclassificationrate(97 percent),whilestudentsinthekindergartencohorthad
thelowestcumulativereclassificationrate(91 percent).Thisfindingdiffersfromprevious
researchnationally,whichfoundthatEnglishlearnerstudentsinthelowergradesmade
The study included
all students
identified as
English learner
students who
were enrolled in
the state’s public
schools in the
designated grade,
who progressed
to the next grade
level each year,
and who had the
required test
data throughout
the six years
being analyzed
5
7/17/2019 The Achievement Progress of English-learner Students in Arizona
http://slidepdf.com/reader/full/the-achievement-progress-of-english-learner-students-in-arizona 13/53
better progress in developing fluency. Still, the differences in rates of achieving English
proficiency among this study’s cohorts were small.
As expected, English learner students who started the study at the highest level below pro-
ficient (the intermediate level of English proficiency) had the highest cumulative rates of
reclassification as fluent English proficient students. However, in the grade 3 and 6 cohorts,
English learner students who started the study at the two lowest English language pro-ficiency levels (preemergent and emergent) had higher cumulative reclassification rates
than students who began the study at the third highest level (basic).
Findings were similar for cumulative passing rates on the English language arts and math
knowledge content tests, known as Arizona’s Instrument to Measure Standards. English
learner students in the kindergarten cohort had the highest cumulative passing rates in
English language arts and math, while English learner students in the grade 6 cohort had
the lowest cumulative passing rates. This finding is consistent with previous research that
found that students in lower grades made better academic progress than students in higher
grades. For the kindergarten and grade 3 cohorts, English learner students who started the
study at the intermediate English proficiency level had the highest cumulative passing ratesin English language arts and math, as expected. However, for the grade 6 cohort, students
who started the study at the lowest English language proficiency (preemergent) level had
the highest cumulative passing rates.
Across all three tests, the range of cumulative passing rates for the three gradelevel
cohorts was highest for the English language proficiency test (91–97 percent), followed by
the English language arts content test (51–80 percent), and then the math content test
(43–70 percent). The same pattern occurred for each English learner student subgroup.
English learner students who were eligible for special education services had lower cumula-
tive proficiency rates than their peers who were not eligible. This difference was the largest
in the study. The largest differences in the cumulative passing rates for the two academiccontent tests were also between English learner students who were and those who were
not eligible for special education services. The grade 3 and 6 cohorts had up to 25 percent
of students who were both eligible for special education services and at the basic level of
English proficiency.
English learner students eligible for school lunch programs and male students also scored
lower on the English proficiency test and the two academic tests than their counterparts
who were not eligible for school lunch programs and female students.
Rather than progressing one English proficiency level per year, as called for in Arizona’s
annual measurable achievement objective 1, English learner students made progress atdifferent rates, with 6 of 12 (50 percent) groupings achieving the expected rate of prog-
ress. For example, students making progress at the recommended rate ranged from a low
of 27 percent (grade 6 cohort, initial English language proficiency level 3) to a high of
89 percent (grade 3 cohort, initial English language proficiency level 1). This variation
suggests that the standards might be unrealistic or too uniform, needing further research
and adjustment to fit the different types of student.
Specific results related to each research question are presented below.
Between 2006/07
and 2011/12 all
three cohorts of
English learner
students made
major progress
in achieving
reclassification
as fluent English
proficient students
6
7/17/2019 The Achievement Progress of English-learner Students in Arizona
http://slidepdf.com/reader/full/the-achievement-progress-of-english-learner-students-in-arizona 14/53
How quickly English learner students became proficient in English
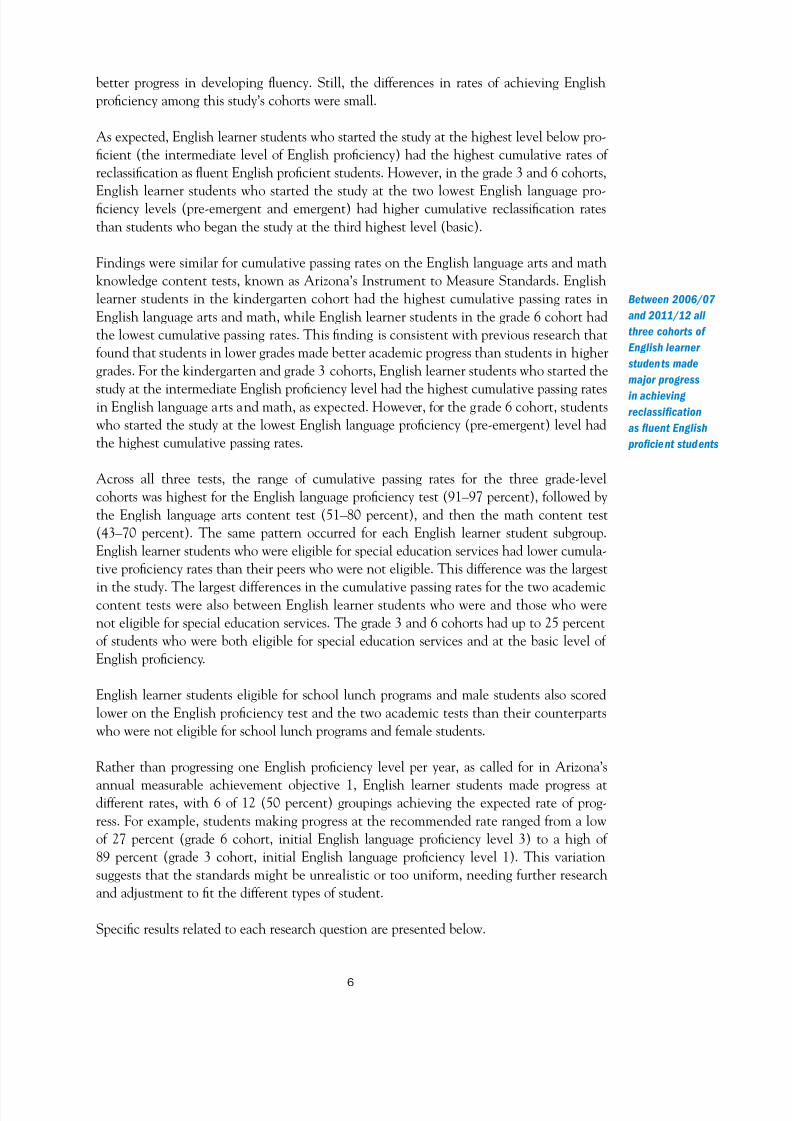
Almost all the English learner students were reclassified as fluent English proficient.
Acrossallthreegradelevelcohorts,afterfiveyears,morethan90 percentoftheEnglish
learnerstudentsscoredatorabovetherequiredlevelforreclassificationasfluentEnglish
proficientontheArizonaEnglishlanguageproficiencytest(figure1).Thegrade3cohort
hadthehighestcumulativereclassificationrate,whilethekindergartencohorthadthelowest.
English learner students in all three cohorts made greater progress in cumulative
reclassification rates in the first few years of the study than toward its end. Thekinder-
gartencohort’sprogresstowardachievingreclassificationasfluentEnglishproficientstu-
dentswasfasterduringgrades1and2andthenslowedingrade3throughtheendofthe
study.Forthegrade3cohort,thebreakintherateofprogresswasseeningrade6,after
whichprogressslowedingrade7throughtheendofthestudy.Thispatternhasnotbeen
notedintheliterature,perhapsbecausepreviousstudieswerenotabletotrackstudent
progressforfiveyearsasthisstudydid.
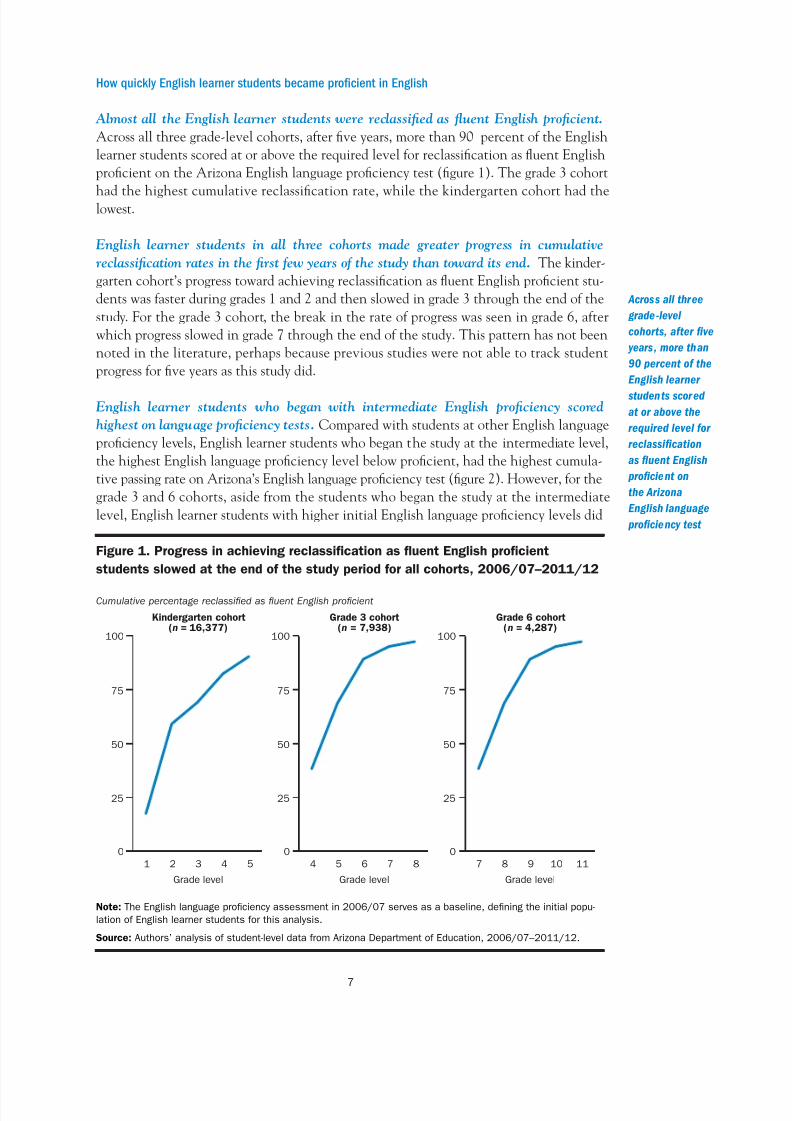
English learner students who began with intermediate English proficiency scored
highest on language proficiency tests. ComparedwithstudentsatotherEnglishlanguage
proficiencylevels,Englishlearnerstudentswhobeganthestudyattheintermediatelevel,
thehighestEnglishlanguageproficiencylevelbelowproficient,hadthehighestcumula-
tivepassingrateonArizona’sEnglishlanguageproficiencytest(figure2).However,forthe
grade3and6cohorts,asidefromthestudentswhobeganthestudyattheintermediate
level,EnglishlearnerstudentswithhigherinitialEnglishlanguageproficiencylevelsdid
Across all three
grade-level
cohorts, after five
years, more than
90 percent of the
English learner
students scored
at or above the
required level for
reclassification
as fluent English
proficient on
the Arizona
English language
proficiency test
Figure1.ProgressinachievingreclassificationasfluentEnglishproficient
studentsslowedattheendofthestudyperiodforallcohorts,2006/07–2011/12
Cumulative percentage reclassified as fluent English proficient
100
75
50
25
0
Kindergarten cohort(n = 16,377)
100
75
50
25
0
1 2 3 4 5
Grade level
Grade 3 cohort Grade 6 cohort(n = 7,938) (n = 4,287)
100
75
50
25
0
4 5 6 7 8 7 8 9 10 11
Grade level Grade level
Note:TheEnglishlanguageproficiencyassessmentin2006/07servesasabaseline,definingtheinitialpopu-
lationofEnglishlearnerstudentsforthisanalysis.
Source:Authors’analysisofstudentleveldatafromArizonaDepartmentofEducation,2006/07–2011/12.
7
7/17/2019 The Achievement Progress of English-learner Students in Arizona
http://slidepdf.com/reader/full/the-achievement-progress-of-english-learner-students-in-arizona 15/53
Figure 2. For the grade 3 and grade 6 cohorts, English learner students at the two
lowest initial English language proficiency levels (pre-emergent and emergent)
outperformed students with an initial English language proficiency level of basic in
achieving reclassification as fluent English proficient, 2006/07–2011/12
Cumulative percentage reclassified as fluent English proficient
Kindergarten cohort Grade 3 cohort Grade 6 cohort
100 100 100
75 75 75
50 50 50
25 25 25
0 0 0
1 2 3 4 5 4 5 6 7 8 7 8 9 10 11
Grade level Grade level Grade level
Pre-emergent Emergent Basic Intermediate Overall
Note: The English language proficiency assessment in 2006/07 serves as a baseline, defining the initial popu-
lation of English learner students for this analysis. The number of English learner students in each subgroup is
as follows. Kindergarten cohort: preemergent, 857; emergent, 1,323; basic, 8,991; and intermediate, 5,206.
Grade 3 cohort: preemergent, 176; emergent, 123; basic, 1,397; and intermediate, 6,242. Grade 6 cohort:
preemergent, 105; emergent, 82; basic, 556; and intermediate, 3,544.
Source: Authors’ analysis of studentlevel data from Arizona Department of Education, 2006/07–2011/12.
English learner
students who
began the study at
the intermediate
level had the
highest cumulative
passing rate
on Arizona’s
English language
proficiency test
not always have higher cumulative passing rates than their lower level peers. For example,in the grade 3 and 6 cohorts, students who started the study at the preemergent (level 1)
and emergent (level 2) proficiency levels had higher final cumulative passing rates on the
English language proficiency test than the students who started the study at the basic level
(level 3).
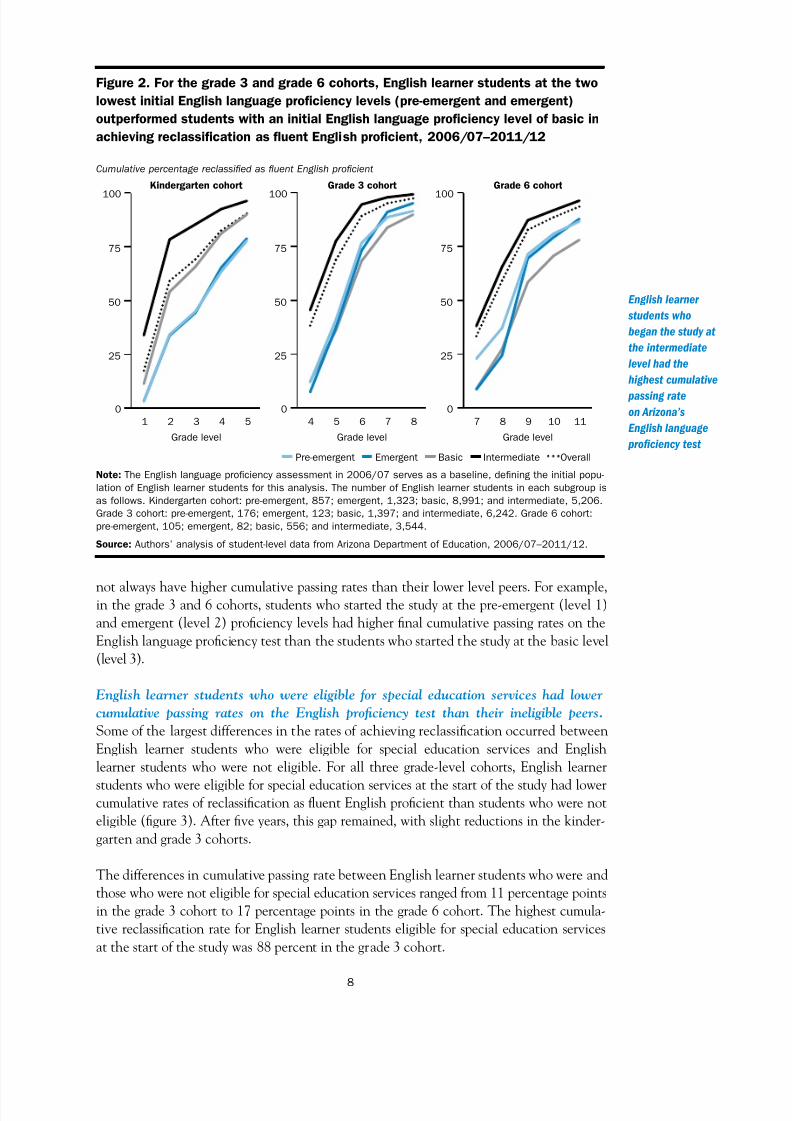
English learner students who were eligible for special education services had lower
cumulative passing rates on the English proficiency test than their ineligible peers.
Some of the largest differences in the rates of achieving reclassification occurred between
English learner students who were eligible for special education services and English
learner students who were not eligible. For all three gradelevel cohorts, English learner
students who were eligible for special education services at the start of the study had lowercumulative rates of reclassification as fluent English proficient than students who were not
eligible (figure 3). After five years, this gap remained, with slight reductions in the kinder-
garten and grade 3 cohorts.
The differences in cumulative passing rate between English learner students who were and
those who were not eligible for special education services ranged from 11 percentage points
in the grade 3 cohort to 17 percentage points in the grade 6 cohort. The highest cumula-
tive reclassification rate for English learner students eligible for special education services
at the start of the study was 88 percent in the grade 3 cohort.
8
7/17/2019 The Achievement Progress of English-learner Students in Arizona
http://slidepdf.com/reader/full/the-achievement-progress-of-english-learner-students-in-arizona 16/53
Figure3.Thegrade6cohorthadthelargestdifferenceinthecumulative
percentageofstudentsachievingreclassificationasfluentEnglishproficient
studentsbetweenEnglishlearnerstudentswhowereeligibleforspecialeducation
servicesandthosewhowerenoteligible,2006/07–2011/12
Cumulative percentage reclassified as fluent English proficient
Kindergarten cohort Grade 3 cohort Grade 6 cohort
100 100 100
75 75 75
50 50 50
25 25 25
0 0 0
1 2 3 4 5 4 5 6 7 8 7 8 9 10 11
Grade level Grade level Grade level
Unknown Not eligible for special education Eligible for special education Overall
Note:TheEnglishlanguageproficiencyassessmentin2006/07servesasabaseline,definingtheinitialpop-
ulationofEnglishlearnerstudentsforthisanalysis.ThenumberofEnglishlearnerstudentsineachsubgroup
isasfollows.Kindergartencohort:unknown,279;eligibleforspecialeducationservices,904;noteligible,
15,194.Grade3cohort:unknown,170;eligibleforspecialeducationservices,952;noteligible,6,816.Grade
6cohort:unknown,72;eligibleforspecialeducationservices,725;noteligible,3,490.
Source:Authors’analysisofstudentleveldatafromArizonaDepartmentofEducation,2006/07–2011/12.
For all three grade-
level cohorts,
English learner
students who were
eligible for special
education services
at the start of the
study had lower
cumulative rates
of reclassification
as fluent English
proficient than
students who
were not eligible
English learner students eligible for school lunch programs and male English learnerstudents had lower cumulative passing rates of reclassification as fluent English profi-
cient students than their peers who were not eligible and female students. Intwoofthe
threecohorts,Englishlearnerstudentswhowereeligibleforschoollunchprogramshad
lower cumulative ratesofreclassificationasfluentEnglishproficient students thantheir
ineligiblecounterparts.Thedifferencewas3 percentagepointsinthekindergartencohort,
1 percentagepointinthegrade3cohort,and0 percentagepointinthegrade6cohort.
MaleEnglishlearnerstudentshadlowercumulativereclassificationratesthantheirfemale
Englishlearnerpeersby5 percentagepointsinthekindergartencohortand1 percentage
pointinthegrade3andgrade6cohorts(seefiguresC1andC2inappendixC).
How well English learner students did academically in reading and math
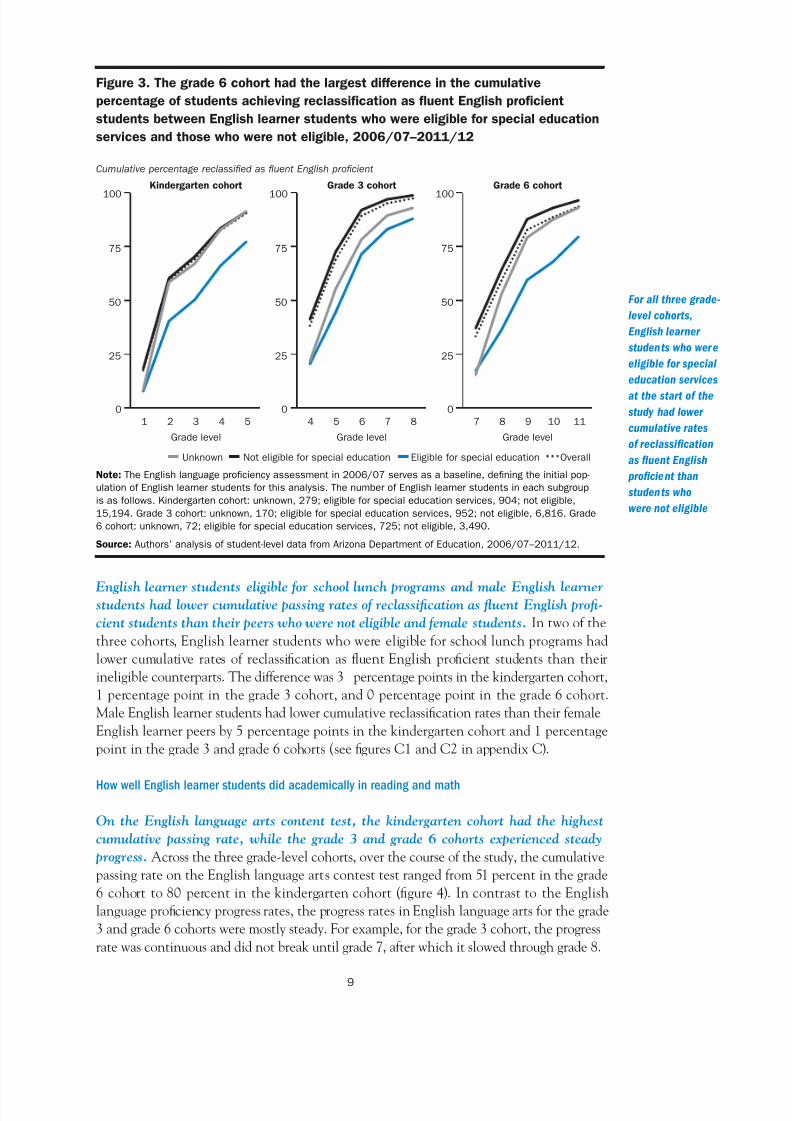
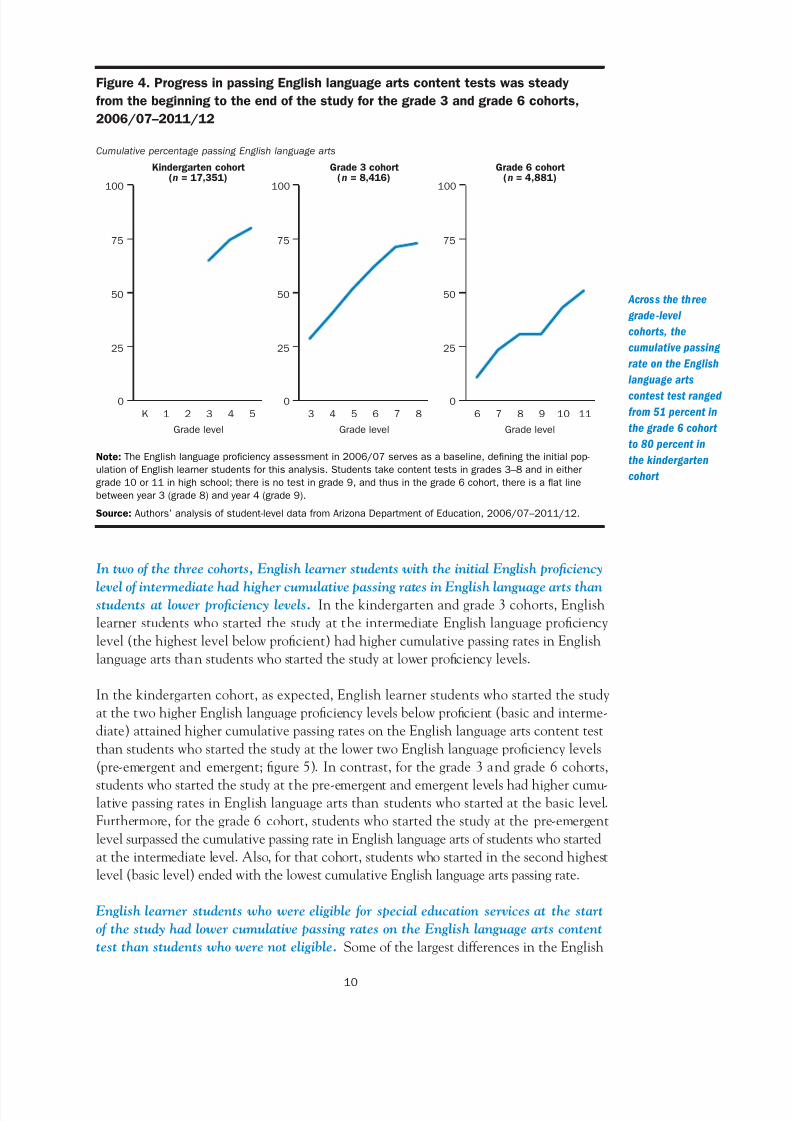
On the English language arts content test, the kindergarten cohort had the highest
cumulative passing rate, while the grade 3 and grade 6 cohorts experienced steady
progress. Acrossthethreegradelevelcohorts,overthecourseofthestudy,thecumulative
passingrateontheEnglishlanguageartscontesttestrangedfrom51 percentinthegrade
6cohortto80 percent inthekindergartencohort(figure4).Incontrastto theEnglish
languageproficiencyprogressrates,theprogressratesinEnglishlanguageartsforthegrade
3andgrade6cohortsweremostlysteady.Forexample,forthegrade3cohort,theprogress
ratewascontinuousanddidnotbreakuntilgrade7,afterwhichitslowedthroughgrade8.
9
7/17/2019 The Achievement Progress of English-learner Students in Arizona
http://slidepdf.com/reader/full/the-achievement-progress-of-english-learner-students-in-arizona 17/53
Figure4.ProgressinpassingEnglishlanguageartscontenttestswassteady
fromthebeginningtotheendofthestudyforthegrade3andgrade6cohorts,
2006/07–2011/12
Cumulative percentage passing English language arts
Kindergarten cohort Grade 3 cohort Grade 6 cohort(n = 17,351) (n = 8,416) (n = 4,881)
100 100 100
75 75 75
50 50 50
25 25 25
0 0 0
K 1 2 3 4 5 3 4 5 6 7 8 6 7 8 9 10 11
Grade level Grade level Grade level
Note:TheEnglishlanguageproficiencyassessmentin2006/07servesasabaseline,definingtheinitialpop-
ulationofEnglishlearnerstudentsforthisanalysis.Studentstakecontenttestsingrades3–8andineither
grade10or11inhighschool;thereisnotestingrade9,andthusinthegrade6cohort,thereisaflatline
betweenyear3(grade8)andyear4(grade9).
Source:Authors’analysisofstudentleveldatafromArizonaDepartmentofEducation,2006/07–2011/12.
Across the three
grade-level
cohorts, the
cumulative passing
rate on the English
language arts
contest test ranged
from 51 percent in
the grade 6 cohort
to 80 percent in
the kindergarten
cohort
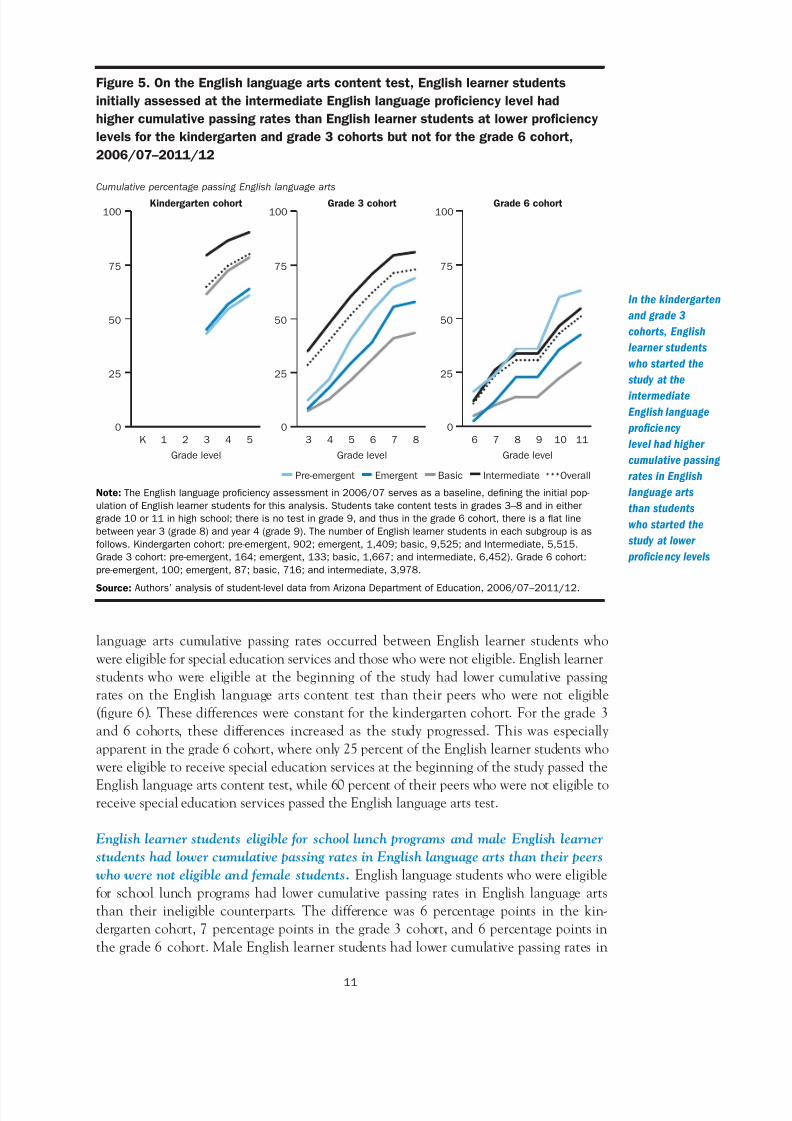
In two of the three cohorts, English learner students with the initial English proficiency
level of intermediate had higher cumulative passing rates in English language arts thanstudents at lower proficiency levels. Inthekindergartenandgrade3cohorts,English
learnerstudentswho startedthestudyattheintermediateEnglishlanguageproficiency
level(thehighestlevelbelowproficient)hadhighercumulativepassingratesinEnglish
languageartsthanstudentswhostartedthestudyatlowerproficiencylevels.
Inthekindergartencohort,asexpected,Englishlearnerstudentswhostartedthestudy
atthetwohigherEnglishlanguageproficiencylevelsbelowproficient(basicandinterme-
diate)attainedhighercumulativepassingratesontheEnglishlanguageartscontenttest
thanstudentswhostartedthestudyatthelowertwoEnglishlanguageproficiencylevels
(preemergentandemergent;figure5).Incontrast, forthegrade3andgrade6cohorts,
studentswhostartedthestudyatthepreemergentandemergentlevelshadhighercumu-lativepassingratesinEnglishlanguageartsthanstudentswhostartedatthebasiclevel.
Furthermore,forthegrade6 cohort,studentswhostartedthestudyatthepreemergent
levelsurpassedthecumulativepassingrateinEnglishlanguageartsofstudentswhostarted
attheintermediatelevel.Also,forthatcohort,studentswhostartedinthesecondhighest
level(basiclevel)endedwiththelowestcumulativeEnglishlanguageartspassingrate.
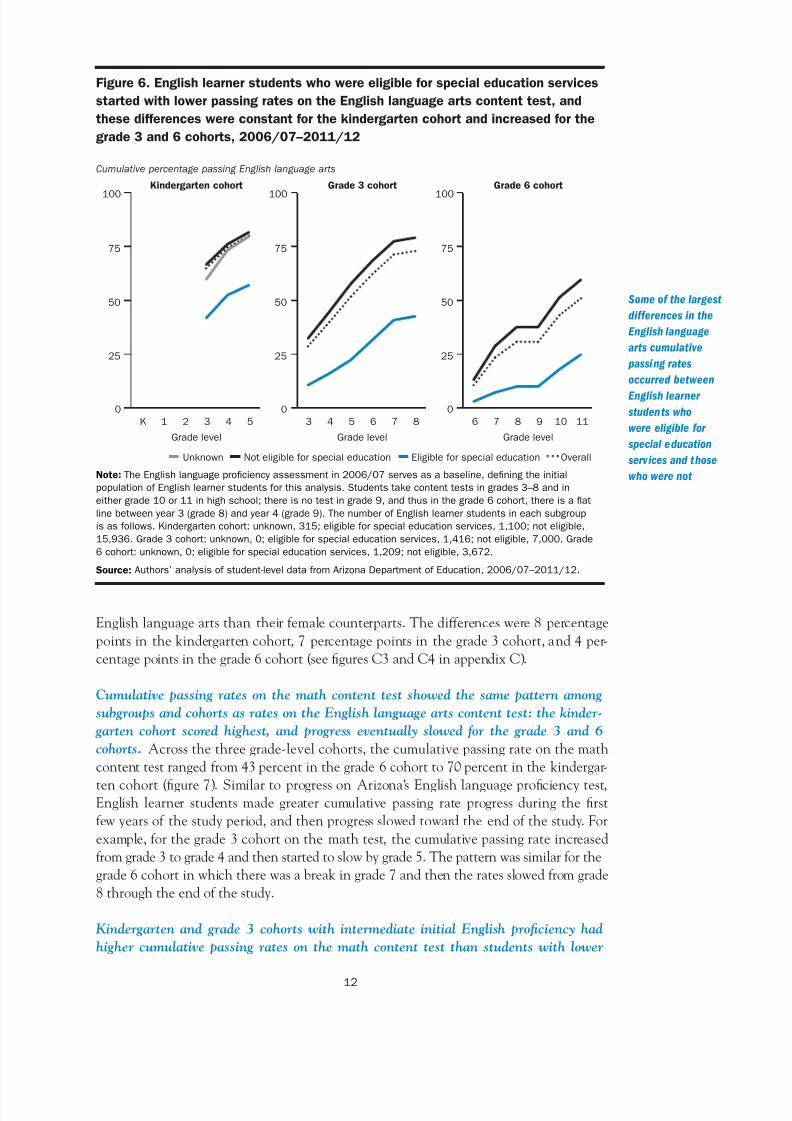
English learner students who were eligible for special education services at the start
of the study had lower cumulative passing rates on the English language arts content
test than students who were not eligible. SomeofthelargestdifferencesintheEnglish
10
7/17/2019 The Achievement Progress of English-learner Students in Arizona
http://slidepdf.com/reader/full/the-achievement-progress-of-english-learner-students-in-arizona 18/53
Figure5.OntheEnglishlanguageartscontenttest,Englishlearnerstudents
initiallyassessedattheintermediateEnglishlanguageproficiencylevelhad
highercumulativepassingratesthanEnglishlearnerstudentsatlowerproficiency
levelsforthekindergartenandgrade3cohortsbutnotforthegrade6cohort,
2006/07–2011/12
Cumulative percentage passing English language arts
Kindergarten cohort Grade 3 cohort Grade 6 cohort100 100 100
75 75 75
50 50 50
25 25 25
0 0 0
K 1 2 3 4 5 3 4 5 6 7 8 6 7 8 9 10 11
Grade level Grade level Grade level
Pre-emergent Emergent Basic Intermediate Overall
Note:TheEnglishlanguageproficiencyassessmentin2006/07servesasabaseline,definingtheinitialpop-
ulationofEnglishlearnerstudentsforthisanalysis.Studentstakecontenttestsingrades3–8andineither
grade10or11inhighschool;thereisnotestingrade9,andthusinthegrade6cohort,thereisaflatline
betweenyear3(grade8)andyear4(grade9).ThenumberofEnglishlearnerstudentsineachsubgroupisas
follows.Kindergartencohort:preemergent,902;emergent,1,409;basic,9,525;andIntermediate,5,515.
Grade3cohort:preemergent,164;emergent,133;basic,1,667;andintermediate,6,452).Grade6cohort:
preemergent,100;emergent,87;basic,716;andintermediate,3,978.
Source:Authors’analysisofstudentleveldatafromArizonaDepartmentofEducation,2006/07–2011/12.
In the kindergarten
and grade 3
cohorts, English
learner students
who started the
study at the
intermediate
English language
proficiency
level had higher
cumulative passing
rates in English
language arts
than students
who started the
study at lower
proficiency levels
language arts cumulative passing rates occurred betweenEnglish learner students who
wereeligibleforspecialeducationservicesandthosewhowerenoteligible.Englishlearner
studentswho were eligibleatthebeginningofthestudy hadlower cumulativepassing
ratesonthe English language artscontent test thantheir peerswhowerenot eligible
(figure 6).Thesedifferenceswereconstantforthekindergartencohort.Forthegrade3
and 6cohorts, thesedifferences increasedas the studyprogressed.This was especially
apparentinthegrade6cohort,whereonly25 percentoftheEnglishlearnerstudentswho
wereeligibletoreceivespecialeducationservicesatthebeginningofthestudypassedthe
Englishlanguageartscontenttest,while60 percentoftheirpeerswhowerenoteligibletoreceivespecialeducationservicespassedtheEnglishlanguageartstest.
English learner students eligible for school lunch programs and male English learner
students had lower cumulative passing rates in English language arts than their peers
who were not eligible and female students. Englishlanguagestudentswhowereeligible
for school lunchprogramshadlower cumulative passing rates inEnglishlanguage arts
than their ineligible counterparts. The difference was 6 percentage points in thekin-
dergartencohort,7 percentagepointsin thegrade3cohort,and6 percentagepointsin
thegrade6 cohort.MaleEnglishlearnerstudentshadlowercumulativepassingratesin
11
7/17/2019 The Achievement Progress of English-learner Students in Arizona
http://slidepdf.com/reader/full/the-achievement-progress-of-english-learner-students-in-arizona 19/53
Figure6.Englishlearnerstudentswhowereeligibleforspecialeducationservices
startedwithlowerpassingratesontheEnglishlanguageartscontenttest,and
thesedifferenceswereconstantforthekindergartencohortandincreasedforthe
grade3and6cohorts,2006/07–2011/12
Cumulative percentage passing English language arts
Kindergarten cohort Grade 3 cohort Grade 6 cohort
100 100 100
75 75 75
50 50 50
25 25 25
0 0 0
K 1 2 3 4 5 3 4 5 6 7 8 6 7 8 9 10 11
Grade level Grade level Grade level
Unknown Not eligible for special education Eligible for special education Overall
Note:TheEnglishlanguageproficiencyassessmentin2006/07servesasabaseline,definingtheinitial
populationofEnglishlearnerstudentsforthisanalysis.Studentstakecontenttestsingrades3–8andin
eithergrade10or11inhighschool;thereisnotestingrade9,andthusinthegrade6cohort,thereisaflat
linebetweenyear3(grade8)andyear4(grade9).ThenumberofEnglishlearnerstudentsineachsubgroup
isasfollows.Kindergartencohort:unknown,315;eligibleforspecialeducationservices,1,100;noteligible,
15,936.Grade3cohort:unknown,0;eligibleforspecialeducationservices,1,416;noteligible,7,000.Grade
6cohort:unknown,0;eligibleforspecialeducationservices,1,209;noteligible,3,672.
Source:Authors’analysisofstudentleveldatafromArizonaDepartmentofEducation,2006/07–2011/12.
Some of the largest
differences in the
English language
arts cumulative
passing rates
occurred between
English learner
students who
were eligible for
special education
services and those
who were not
Englishlanguageartsthan theirfemalecounterparts.Thedifferenceswere8 percentage
pointsinthekindergartencohort,7 percentagepointsinthegrade3cohort,and4 per-
centagepointsinthegrade6cohort(seefiguresC3andC4inappendixC).
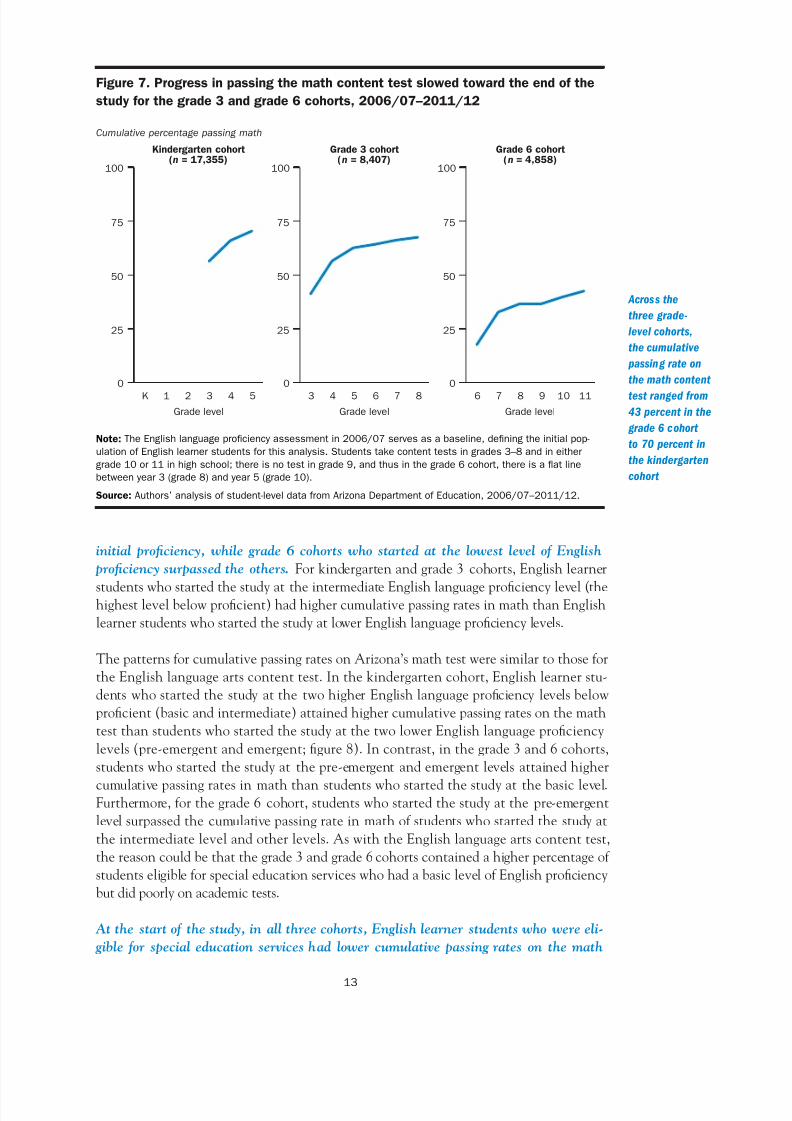
Cumulative passing rates on the math content test showed the same pattern among
subgroups and cohorts as rates on the English language arts content test: the kinder-
garten cohort scored highest, and progress eventually slowed for the grade 3 and 6
cohorts. Acrossthethreegradelevelcohorts,thecumulativepassingrateonthemath
contenttestrangedfrom43 percentinthegrade6cohortto70 percentinthekindergar-
tencohort(figure7).SimilartoprogressonArizona’sEnglishlanguageproficiencytest,English learner studentsmade greatercumulative passing rate progressduring the first
fewyearsofthestudyperiod,andthenprogressslowedtowardtheendofthestudy.For
example,forthegrade3cohortonthemathtest,thecumulativepassingrateincreased
fromgrade3tograde4andthenstartedtoslowbygrade5.Thepatternwassimilarforthe
grade6cohortinwhichtherewasabreakingrade7andthentheratesslowedfromgrade
8throughtheendofthestudy.
Kindergarten and grade 3 cohorts with intermediate initial English proficiency had
higher cumulative passing rates on the math content test than students with lower
12
7/17/2019 The Achievement Progress of English-learner Students in Arizona
http://slidepdf.com/reader/full/the-achievement-progress-of-english-learner-students-in-arizona 20/53
Figure7.Progressinpassingthemathcontenttestslowedtowardtheendofthe
studyforthegrade3andgrade6cohorts,2006/07–2011/12
Cumulative percentage passing math
Kindergarten cohort Grade 3 cohort Grade 6 cohort(n = 17,355) (n = 8,407) (n = 4,858)
100 100 100
75 75 75
50 50 50
25 25 25
0 0 0
K 1 2 3 4 5 3 4 5 6 7 8 6 7 8 9 10 11
Grade level Grade level Grade level
Note:TheEnglishlanguageproficiencyassessmentin2006/07servesasabaseline,definingtheinitialpop-
ulationofEnglishlearnerstudentsforthisanalysis.Studentstakecontenttestsingrades3–8andineither
grade10or11inhighschool;thereisnotestingrade9,andthusinthegrade6cohort,thereisaflatline
betweenyear3(grade8)andyear5(grade10).
Source:Authors’analysisofstudentleveldatafromArizonaDepartmentofEducation,2006/07–2011/12.
Across the
three grade-
level cohorts,
the cumulative
passing rate on
the math content
test ranged from
43 percent in the
grade 6 cohort
to 70 percent in
the kindergarten
cohort
initial proficiency, while grade 6 cohorts who started at the lowest level of English
proficiency surpassed the others. Forkindergartenandgrade3 cohorts,Englishlearner
studentswhostartedthestudyattheintermediateEnglishlanguageproficiencylevel(thehighestlevelbelowproficient)hadhighercumulativepassingratesinmaththanEnglish
learnerstudentswhostartedthestudyatlowerEnglishlanguageproficiencylevels.
ThepatternsforcumulativepassingratesonArizona’smathtestweresimilartothosefor
theEnglishlanguageartscontenttest.Inthekindergartencohort,Englishlearnerstu-
dentswhostartedthestudyatthe twohigherEnglishlanguageproficiencylevelsbelow
proficient(basicandintermediate)attainedhighercumulativepassingratesonthemath
testthanstudentswhostartedthestudyatthetwolowerEnglishlanguageproficiency
levels(preemergentandemergent;figure8).Incontrast,inthegrade3and6cohorts,
studentswhostartedthestudyat thepreemergentandemergent levelsattainedhigher
cumulativepassingratesinmaththanstudentswhostartedthestudyatthebasiclevel.Furthermore,forthegrade6 cohort,studentswhostartedthestudyatthepreemergent
levelsurpassedthecumulativepassingrateinmathofstudentswhostartedthestudyat
theintermediatelevelandotherlevels.AswiththeEnglishlanguageartscontenttest,
thereasoncouldbethatthegrade3andgrade6cohortscontainedahigherpercentageof
studentseligibleforspecialeducationserviceswhohadabasiclevelofEnglishproficiency
butdidpoorlyonacademictests.
At the start of the study, in all three cohorts, English learner students who were eli-
gible for special education services had lower cumulative passing rates on the math
13
7/17/2019 The Achievement Progress of English-learner Students in Arizona
http://slidepdf.com/reader/full/the-achievement-progress-of-english-learner-students-in-arizona 21/53
Figure8.Onthemathcontenttest,Englishlearnerstudentsinitiallyassessedat
theintermediateEnglishlanguageproficiencylevelhadhighercumulativepassing
ratesthanEnglishlearnerstudentsatlowerEnglishlanguageproficiencylevelsfor
kindergartenandgrade3cohorts,butnotforthegrade6cohort,2006/07–2011/12
Cumulative percentage passing math
Kindergarten cohort Grade 3 cohort Grade 6 cohort
100 100 100
75 75 75
50 50 50
25 25 25
0 0 0
K 1 2 3 4 5 3 4 5 6 7 8 6 7 8 9 10 11
Grade level Grade level Grade level
Pre-emergent Emergent Basic Intermediate Overall
Note:TheEnglishlanguageproficiencyassessmentin2006/07servesasabaseline,definingtheinitialpop-
ulationofEnglishlearnerstudentsforthisanalysis.Studentstakecontenttestsingrades3–8andineither
grade10or11inhighschool;thereisnotestingrade9,andthusinthegrade6cohort,thereisaflatline
betweenyear3(grade8)andyear4(grade9).ThenumberofEnglishlearnerstudentsineachsubgroupisas
follows.Kindergartencohort:preemergent,901;emergent,1,409;basic,9,530;andintermediate,5,515.
Grade3cohort:preemergent,164;emergent,132;basic,1,662;andintermediate,6,449.Grade6cohort:
preemergent,101;emergent,85;basic,712;andintermediate,3,960.
Source:Authors’analysisofstudentleveldatafromArizonaDepartmentofEducation,2006/07–2011/12.
In the kindergarten
cohort, English
learner students
who started the
study at the
two basic and
intermediate
proficiency levels
attained higher
cumulative passing
rates on the math
test than students
who started the
study at the
pre-emergent and
emergent levels
assessment than English learner students who were not eligible, and the gap widened
toward the end of the study. AsintheresultsontheEnglishlanguageartscontenttest,
thelargestdifferencesinthefinalcumulativepassingratesonthemathknowledgetest
werebetweenEnglishlearnerstudentswhowereeligibleforspecialeducationservicesand
thosewhowerenot.Englishlearnerstudentswhowereeligibleforspecialeducationser-
vices atthebeginningof the study had lowcumulative passing rateson themathtest
bothoverallandcomparedwiththeirpeerswhowerenoteligibleforspecialeducation
services(figure 9).Again,thisgapwasespeciallyapparentinthegrade6cohort,where
only18 percent ofEnglishlearner students who were eligiblefor specialeducationser-
vicespassedthemathtest,while51 percentoftheirpeerswhowerenoteligibletoreceivespecial education services passed the math test. Similarly, in the grade 3 cohort, the
Englishlearnerstudentswhowereeligibleforspecialeducationserviceshadacumulative
passingrateonthemathknowledgetestof40 percent,whiletheirpeerswhowerenot
eligibleforspecialeducationserviceshadacumulativepassingrateof73 percent.
With one exception, English learner students eligible for school lunch programs and
male English learner students had lower cumulative passing rates in math than English
learner students who were not eligible and female students. Englishlearnerstudents
whowereeligibleforschoollunchprogramshadlowercumulativepassingratesinmath
14
7/17/2019 The Achievement Progress of English-learner Students in Arizona
http://slidepdf.com/reader/full/the-achievement-progress-of-english-learner-students-in-arizona 22/53
Figure9.Onthemathcontenttest,thedifferencesinthecumulativepassingrate
betweenEnglishlearnerstudentswhowereeligibleforspecialeducationservicesand
thosewhowerenoteligiblewidenedovertimeforallcohorts,2006/07–2011/12
Cumulative percentage passing math
Kindergarten cohort Grade 3 cohort Grade 6 cohort100 100 100
75 75 75
50 50 50
25 25 25
0 0 0K 1 2 3 4 5 3 4 5 6 7 8 6 7 8 9 10 11
Grade level Grade level Grade level
Unknown Not eligible for special education Eligible for special education Overall
Note:TheEnglishlanguageproficiencyassessmentin2006/07servesasabaseline,definingtheinitialpop-
ulationofEnglishlearnerstudentsforthisanalysis.Studentstakecontenttestsingrades3–8andineither
grade10or11inhighschool;thereisnotestingrade9,andthusinthegrade6cohort,thereisaflatline
betweenyear3(grade8)andyear4(grade9).ThenumberofEnglishlearnerstudentsineachsubgroupisas
follows.Kindergartencohort:unknown,315;eligibleforspecialeducationservices,1,099;andnoteligible
forspecialeducationservices,15,941.Grade3cohort:unknown,0;eligibleforspecialeducationservices,
1,415,andnoteligibleforspecialeducationservices,6,992.Grade6cohort:unknown,0;eligibleforspecial
educationservices,1,204;andnoteligibleforspecialeducationservices,3,654.
Source:Authors’analysisofstudentleveldatafromArizonaDepartmentofEducation,2006/07–2011/12.
As in the results
on the English
language arts
content test, the
largest differences
in the final
cumulative passing
rates on the math
knowledge test
were between
English learner
students who
were eligible for
special education
services and those
who were not
thantheirineligiblepeers.Thesedifferencesrelativetotheirineligiblecounterpartswere
7 percentagepointsinthekindergartencohort,5 percentagepointsinthegrade3cohort,
and4 percentagepointsinthegrade6cohort.Inthekindergartenandgrade3cohorts,
maleEnglishlearnerstudentshadlowercumulativemathpassingratesthantheirfemale
counterparts:3 percentagepoints inthekindergartencohortand1 percentagepoint in
thegrade 3cohort.Inthegrade6cohort,maleEnglishlearnerstudentshada1 percent-
agepointgreatercumulativepassingratethan their femalecounterparts(seefiguresC5
andC6inappendixC).
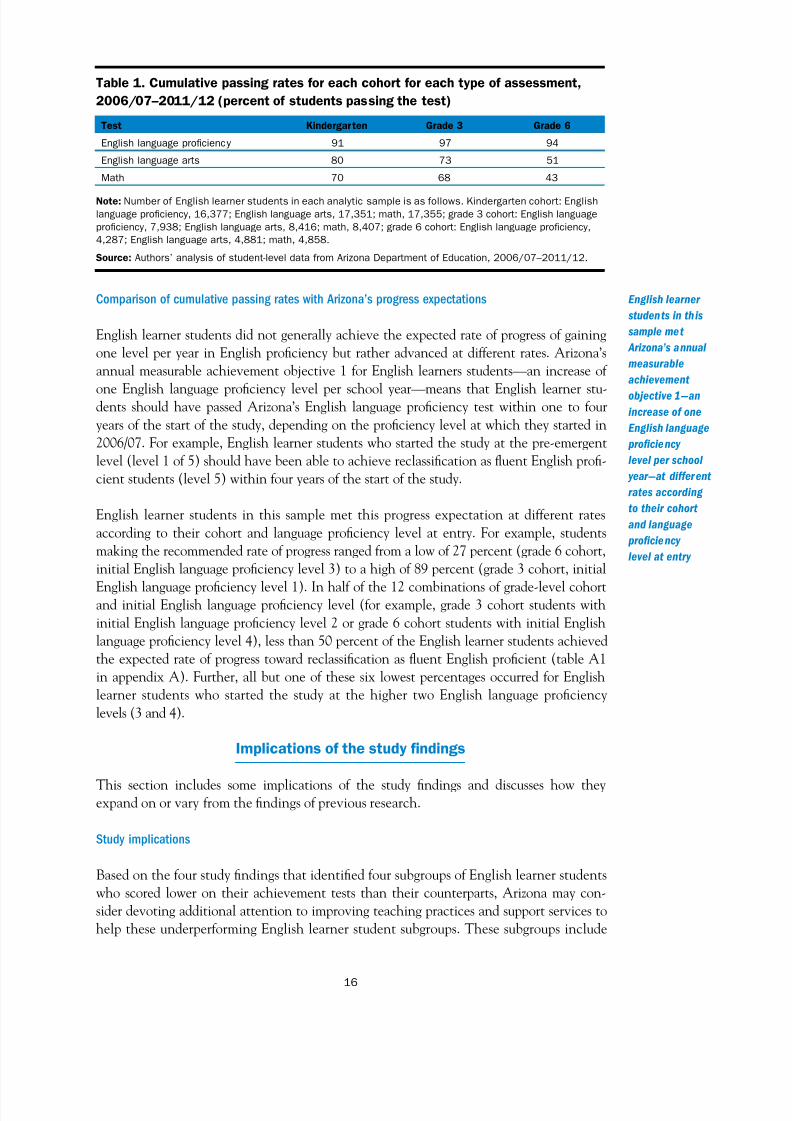
Comparison of cumulative passing rates across tests and cohorts
Englishlearnerstudentsacrossallcohortsandstudentsubgroupsscoredhighestonthe
Englishlanguageproficiencytestandnexthigheston theEnglishlanguagearts content
test. Across all three tests, the overall cumulative passing rate for each of the three
gradelevelcohortswashighestfortheEnglishlanguageproficiencytest,followedbythe
Englishlanguageartscontenttest,andthenthemathcontenttest(table1).Thesame
patternoccurredforeachcharacteristicsubgroupofEnglishlearnerstudents.
15
7/17/2019 The Achievement Progress of English-learner Students in Arizona
http://slidepdf.com/reader/full/the-achievement-progress-of-english-learner-students-in-arizona 23/53
Table 1. Cumulative passing rates for each cohort for each type of assessment,
2006/07–2011/12 (percent of students passing the test)
Test Kindergarten Grade 3 Grade 6
English language proficiency 91 97 94
English language arts 80 73 51
Math 70 68 43
Note: Number of English learner students in each analytic sample is as follows. Kindergarten cohort: English
language proficiency, 16,377; English language arts, 17,351; math, 17,355; grade 3 cohort: English language
proficiency, 7,938; English language arts, 8,416; math, 8,407; grade 6 cohort: English language proficiency,
4,287; English language arts, 4,881; math, 4,858.
Source: Authors’ analysis of student-level data from Arizona Department of Education, 2006/07–2011/12.
Comparison of cumulative passing rates with Arizona’s progress expectations
English learner students did not generally achieve the expected rate of progress of gaining
one level per year in English proficiency but rather advanced at different rates. Arizona’s
annual measurable achievement objective 1 for English learners students—an increase of
one English language proficiency level per school year—means that English learner stu-dents should have passed Arizona’s English language proficiency test within one to four
years of the start of the study, depending on the proficiency level at which they started in
2006/07. For example, English learner students who started the study at the preemergent
level (level 1 of 5) should have been able to achieve reclassification as fluent English profi-
cient students (level 5) within four years of the start of the study.
English learner students in this sample met this progress expectation at different rates
according to their cohort and language proficiency level at entry. For example, students
making the recommended rate of progress ranged from a low of 27 percent (grade 6 cohort,
initial English language proficiency level 3) to a high of 89 percent (grade 3 cohort, initial
English language proficiency level 1). In half of the 12 combinations of gradelevel cohortand initial English language proficiency level (for example, grade 3 cohort students with
initial English language proficiency level 2 or grade 6 cohort students with initial English
language proficiency level 4), less than 50 percent of the English learner students achieved
the expected rate of progress toward reclassification as fluent English proficient (table A1
in appendix A). Further, all but one of these six lowest percentages occurred for English
learner students who started the study at the higher two English language proficiency
levels (3 and 4).
Implications of the study findings
This section includes some implications of the study findings and discusses how theyexpand on or vary from the findings of previous research.
Study implications
Based on the four study findings that identified four subgroups of English learner students
who scored lower on their achievement tests than their counterparts, Arizona may con-
sider devoting additional attention to improving teaching practices and support services to
help these underperforming English learner student subgroups. These subgroups include
English learner
students in this
sample met
Arizona’s annual
measurable
achievement
objective 1—an
increase of one
English language
proficiency
level per school
year—at different
rates according
to their cohort
and language
proficiency
level at entry
16
7/17/2019 The Achievement Progress of English-learner Students in Arizona
http://slidepdf.com/reader/full/the-achievement-progress-of-english-learner-students-in-arizona 24/53
studentsinhighergrades,studentseligibleforspecialeducationservices,studentseligible
forschoollunchprograms,andmalestudents.
English learner students who are eligible for special education services. AllEnglish
learnerstudentswhoareeligibleforspecialeducationserviceswilllikelyneedadditional
supportstobesuccessful,andthissupportmayneedtovarybyspecificsubgroupsoflearn-
ingdisabilities.Englishlearnerstudentsinhighergradeswhoareeligibleforspecialedu-cationserviceswillneeddifferentsupportfromthatgiventothegrade6cohortEnglish
learnerstudentsduringthestudyperiodiftheyaregoingtoachieveevenminimallevels
ofacademicachievementinEnglishlanguageartsandmath.Furtherinvestigationsinto
moreeffectivepracticesforimprovingtheachievementofEnglishlearnerstudents,espe-
ciallysecondaryEnglishlearnerstudents,whowereeligibleforspecialeducationservices
appearswarranted.
English learner students in higher grades. On the English language arts and math
contenttests,Englishlearnerstudentsinthegrade6cohortnearlyalwaysmadelessprog-
ressthantheyoungercohorts.Englishlearnerstudentsinhighergradesmayrequireaddi-
tional,possiblydifferent,supportsiftheyaretomeetatleastminimalexpectationsforacademicachievement.Or,perhaps,middleandhighschoolteacherswillneedadditional
ordifferent skills than they currently have.Accordingly, secondary teachers mayneed
additional,targetedprofessionaldevelopmentinordertoeffectivelysupporttheacademic
EnglishliteracyneedsoftheirEnglishlearnerstudentsinhighergradesacrossthecontent
areas.
English learner students eligible for school lunch programs and male English learner
students. There were small but consistent performance differences between English
learnerstudentswhowereeligibleforschoollunchprogramsandthosewhowerenotand
betweenmaleandfemaleEnglishlearnerstudents.Accordingly,comprehensivesupports
toimproveEnglishlearnerachievementwouldlikelyincludesupportstargetedtowardtheadditionaloruniqueneedsofEnglishlearnerstudentswhoareeligible forschoollunch
programsandEnglishlearnerstudentswhoaremale.
State expectations of regular progress in English proficiency may be unrealistic or too
rigid. Apolicyimplicationisapparentinthefindingsrelatedtothestate’sAnnualMea-
surableAchievementObjectivesexpectationsofanincreaseofoneEnglishlanguagepro-
ficiencylevelperschoolyear.Thisstudy’sfindingsthatacrossthegradelevelcohortsand
Englishlanguageproficiencylevels,the percentageof Englishlearnerstudentswhomet
thisprogressexpectationrangedwidelyfromalowof27 percent(grade6cohort,English
languageproficiencylevel3)toahighof89 percent(grade3cohort,Englishlanguagepro-
ficiencylevel1).ItmaybetoorigidorsimplistictoassumethatallEnglishlearnerstudentswilladvanceatthesamepace.Moreflexiblestandardsmaybemoreusefultoeducators.
Three findings expand the current research literature and point to areas for further research
Threeofthestudyfindingsofferevidencenotfoundwithinthegeneralresearchliterature.
For all English learner student subgroups, the largest cumulative performance dif-
ference was between English learner students who were eligible for special education
services and those who were not. Englishlearnerstudentswhowereeligibleforspecial
All English learner
students who
are eligible for
special education
services will likely
need additional
supports to be
successful, and
this support may
need to vary by
specific subgroups
of learning
disabilities
17
7/17/2019 The Achievement Progress of English-learner Students in Arizona
http://slidepdf.com/reader/full/the-achievement-progress-of-english-learner-students-in-arizona 25/53
educationserviceshadlowerfinalcumulativepassingratesinallthreeteststhantheir
ineligiblecounterparts,whichisconsistentwiththeresearchliterature(see,forexample,
Lipka,Siegel,&Vukovic,2005).Forexample,thefinalcumulativepassingratesonthe
mathcontenttestforEnglishlearnerstudentswhowereeligibleforspecialeducationser-
viceswerethehighestforthekindergartencohort(51 percent)andlowestforthegrade
6cohort(18 percent).Thisdifferenceof33 percentagepointssuggeststhatonthemath
content tests, English learner students who were eligible for special education servicesstruggledmuchmoreinthehighergradecohortsthaninthelowerones.Perhapsthisdif-
ferenceisduetodifficultiesinproperlyidentifyingEnglishlearnerstudentswithdisabili-
ties,whichdistinguisheslearningdisabilitiesfromthetypicallanguage,andoftencultural,
strugglesofasecondlanguagelearner;thesedifficultieshavebeenshowntoleadtoboth
over andunderidentification(Artiles,Rueda,Salazar,&Higareda,2005a,b;Rueda&
Windmueller,2006;Sullivan,2011;Sullivan&Bal,2013;Zehler,Fleischman,Hopstock,
Pendzick,&Stephenson,2003;Zehler,Fleischman,Hopstock,Stephensonet al.,2003).
Moreresearchisneededinthisarea.
AdditionalresearchcouldtakeintoconsiderationthefactthatEnglishlearnerstudents
who are eligible for special education services cover a diverse set of learningrelateddisabilities—ranging from autism to hearing impairments to emotional disabilities to
traumatic brain injury (Arizona Department of Education, 2012). Separating out the
achievementlevelsofthesedifferentgroupsmayprovideusefulinformationforhowbest
tosupporteach.
Noother studieswere identified that attempted to describe the influenceof the other
student characteristics (English language proficiency level, eligibility for school lunch
program,andgender)ontheperformanceofEnglishlearnerstudents.
All English learner students had the highest cumulative passing rates on the English
language proficiency tests, followed by the English language arts content test, thenthe math content test. Since no research was found that directly compared English
learnerstudents’performanceacrossmultipleyearsonthesethreetypesofassessments,
thisstudyaddsusefulresearch.ItseemslogicalthatEnglishlearnerstudentswouldpass
theirEnglishlanguageproficiency test sooner than theirEnglishlanguagearts content
areatests.Englishlanguageproficiencyassessmentsaregenerallyintendedtodenotethe
achievementofalevelofEnglishliteracysufficienttoenablemeaningfulparticipationin
mainstreamEnglishdominant classes,as theEnglish learner studentworks toward full
academicfluency.Englishlanguageartsandmathcontenttestsareintendedtodenotea
levelofcontentknowledgethathelpsstudentsachievefullacademicEnglishfluency.
ItwassurprisingtofindthatEnglishlearnerstudentspassedtheirEnglishlanguageartscontenttestmorequicklyforthefirsttimethantheirmathtest.Thestudyteaminitial-
lyexpectedthatEnglishlearnerstudentswouldpassthemathcontenttestsoonerthan
theEnglishlanguageartscontenttestbecausetheteambelievedthatnumbersandmath
operationsrequiredalowerlevelofacademicEnglishlanguageliteracythanthereading
and writing assessed by the English language artscontent test.However, researchhas
shownthatacademicEnglishliteracyplaysacentralroleinstudentachievementonmath
tests.PerhapstheseresultsindicatethatthelevelofacademicEnglishliteracynecessary
forsuccessonamathassessmentisactuallysimilartoorpossiblygreaterthanthatforan
Englishlanguageartscontenttest.Or,perhaps,studentshavegreaterexposuretoEnglish
It was surprising
to find that English
learner students
passed their
English language
arts content test
more quickly for
the first time than
their math test
18
7/17/2019 The Achievement Progress of English-learner Students in Arizona
http://slidepdf.com/reader/full/the-achievement-progress-of-english-learner-students-in-arizona 26/53
language arts–relatedcontent andskills in theirdaily fourhourEnglishliteracyclasses
thantheydoexposuretomathcontentandskills.Or,perhapsEnglishlanguageskillscan
begainedmoreeasilyoutsideofschoolthanmathskills,soEnglishlearnerstudentscan
actuallyprogressfasterinEnglishlanguageartsabilitythanintheirmoreschoolcentered
mathability.
For English learner students in the grade 3 and grade 6 cohorts, passing rate progresson the English language proficiency and math tests slowed toward the end of the study.
Noother researchwas foundthatshowedtheperformancetrendsofcohortsofEnglish
learnerstudentsovertime.Thisstudy’sfindingofaslowingintherateofpassingprogress
afterthefirstfewyearsofthestudyperiodcouldbeduetochangesinthecompositionof
thecohortstudentswhosetestresultswerestillbeingmeasured.Thetestmeasuresforthis
studywerebasedonstudents’firsttimepassingofeachtest.Thenumberofstudentswhose
scoreswerebeingmeasuredchangedoverthecourseofthestudybecauseonlythescores
ofthenonpassingEnglishlearnerstudentsremainedeachyear.Forexample,becauseof
thischangein thecompositionoftheEnglishlearnerstudentswhosescoreswerebeing
measuredastheyearsprogressed,therewereprobablygreaterpercentagesofstudentseli-
gibleforspecialeducationservicesandschoollunchprogramsandwhohadlowerEnglishlanguageproficiencylevels.That is,Englishlearnerstudentswhowere lessatrisk likely
attainedpassinglevelsfasterthanstudentswhoweremoreatrisk;hence,bytheendof
thestudy,itmayhavebeenharderfortheremainingstudentstoachievepassinglevels,
becausetheyhadmoreriskfactorsthanthosewhohadpassedinpreviousyears.
PerhapstheslowingintherateofpassingprogresswascausedbyEnglishlearnerstudent
attitudestowardthetests.Repeatedfailuremayleadtofrustrationandlessmotivationto
dowell.Anotherreasonmightberelatedtotheincreaseindifficultyofthetestsasthe
gradelevelrises.Furtherresearchisneededtodeterminewhetherthesefindingsholdupin
othercontextsand,ifso,why.
Three findings were not consistent with the research literature and point to areas for additional
research
Threeofthestudyfindingswerenotconsistentwiththegeneralresearchliterature.These
findings point to areas for additional research to better understand the discrepancies
betweenthisstudy’sresultsandthecurrentresearchbase.1
On the math assessment, female English learner students sometimes achieved higher
levels of proficiency than male students. Thisfindingissomewhatinconsistentwiththe
research literature on mathachievement for the general (nonEnglish learner) student
population,whichshowsslightlyhighermathachievementformalethanfemalestudents(McGraw et al., 2006;Perieet al.,2005). This study’sparticular resultsmay show that
English learner students experience math assessments differently than native English
speakers.Specifically,theymaypointtothepossibilitythatacademicEnglishliteracymay
playacentralroleinmathassessmentsforEnglishlearnerstudents(Abedi&Lord,2001;
Beal,Adams,&Cohen,2010;Martiniello,2008,2009;Moschkovich,1999,2002;Shaftel,
BeltonKocher, Glasnapp, & Poggio, 2006)—a role that is a larger influence on score
resultsforthemthanfornativeEnglishspeakers.Thus,thehighermathperformanceof
femaleEnglishlearnerstudentsmaythenbeduetotheirgreaterEnglishlanguageabili-
ties,askillarea inwhichtheresearchshowsfemalestudentsgenerallyoutperformmale
19
7/17/2019 The Achievement Progress of English-learner Students in Arizona
http://slidepdf.com/reader/full/the-achievement-progress-of-english-learner-students-in-arizona 27/53
students(Perieet al., 2005;Robinson &Theule, 2011). Likewise, for this study, female
EnglishlearnerstudentsattainedhighercumulativepassingratesontheEnglishlanguage
proficiencyandEnglishlanguageartscontenttests,whichinturncouldalsohavehelped
themattainhigherresultsonthemathcontenttest.
On the English language proficiency test, the English learner students in the kinder-
garten cohort had the lowest final cumulative reclassification rate. Thisfindingisnotfully consistentwiththe research literature,whichshows thatEnglishlearner students
in lowergrades generallymakegreaterachievementprogressthan theircounterpartsin
highergrades.Itisunclearwhythisstudy’sEnglishlanguageproficiencytestresultsturned
outastheydid,whiletheresultsfortheEnglishlanguageartsandmathcontenttestswere
consistentwiththeresearchliterature(thatis,thekindergartencohortoutperformedthe
highergradelevelcohorts).However,threeobservationsregardingtheEnglishlanguage
proficiencydatashouldbenoted.First,asawhole,allthreegradelevelcohortshadfinal
cumulativereclassificationratesover90 percentontheEnglishlanguageproficiencytest.
Second,thedifferenceinthefinaloverallcumulativereclassificationratesontheEnglish
languageproficiencytestsacrossthethreecohortswas6 percentagepointsorless,which
wassmallerthanmostofthedifferencesobservedontheEnglishlanguageartsandmathcontenttests.Third,thefirstyearreclassificationratesontheEnglishlanguageproficiency
testwerealsolowestforthekindergartencohort;thismightindicatethatmoreEnglish
learner students inthe grade3and 6cohortswere readytopass the English language
proficiencytest,whichcouldhaveaffectedthecumulativereclassificationrateevenafter
fiveyears.
FurtherresearchmighthelpidentifywhichspecificEnglishskillstotargetin supporting
English learner students. Additional research could be done to examine English lan-
guageproficiency subtest differencesacross the four testeddomainsof listening, speak-
ing,reading,andwriting.Inaddition,itisimportanttoexplorewhysomeEnglishlearner
studentsinhighergradesperformedbetterontheEnglishlanguageproficiencytestthanstudentsinlowergrades,tohelpinformpossiblechangesinpracticeoradditionalinter-
ventionstoimprovetheacademicperformanceoftheEnglishlearnerstudentsin lower
grades.Furtherresearchmightalsoilluminatepositivepracticesthathaveledtothepossi-
blegreaterthanexpectedEnglishlanguageproficiencyachievementoftheEnglishlearner
studentsinhighergrades.
Inaddition,researchisneededtoexaminepossiblereasonswhyEnglishlearnerstudents
inhighergradeslagbehindyoungeronesintheirperformanceonthecontenttestsbut
notontheEnglishlanguageproficiencytest.InArizona,thismaybeduetothegreater
difficultyof thecontenttestsinthehighergradelevelscompoundedbythelossoftime
devotedtocontentareasamongEnglishlearnerstudents,whoarerequiredtospendfourhours a dayin structuredEnglishimmersionclassesuntil they arereclassified as fluent
Englishproficientandassignedtomainstreamcontentclasses.Theresultsfromthistype
of research could provide more precise understandings of English learner achievement
progress and how to better target supports within Arizona’s current English language
developmentprograms.
English language students with lower initial English language proficiency levels often
had higher cumulative passing rates than their counterparts who had higher initial
proficiency levels. Thisfindingmaydeviatefromtheresearchliteraturepartlybecauseof
Research is needed
to examine why
English learner
students in
higher grades lag
behind younger
ones in their
performance on
the content tests
but not on the
English language
proficiency test
20
7/17/2019 The Achievement Progress of English-learner Students in Arizona
http://slidepdf.com/reader/full/the-achievement-progress-of-english-learner-students-in-arizona 28/53
thedifferingpercentagesof eachcohort’s studentsacrossthedifferentEnglishlanguage
proficiencylevelswhowereeligibleforspecialeducationservices.Forinstance,inboth
thegrade3andgrade6cohorts,ahigherpercentageofstudentswhohadanEnglishlan-
guageproficiencylevelofbasic(level3of5)wereeligibleforspecialeducationservicesin
2006/07comparedwiththosewhowereatthetwolowestEnglishlanguageproficiency
levels(preemergentandemergent;see tablesB4andB5 inappendixB). Inaddition,a
higherpercentageoftheEnglishlearnerstudentsinthegrade6cohortwhostartedattheintermediate level(level 4)wereeligibleforspecialeducation services in 2006/07com-
paredwiththoseatthepreemergentgroup(level1;seetableB5inappendixB).Further
analysesofsubgroupcharacteristicdifferences,suchasthedifferentpercentagesofEnglish
learner students eligible for specialeducation servicesacross theEnglish language pro-
ficiencylevels,couldhelpclarifywhyEnglishlearnerstudentswhowere initiallyatthe
higherEnglishlanguageproficiencylevelsoftenperformedworsethanEnglishlearnerstu-
dentswhowereinitiallyatthelowerEnglishlanguageproficiencylevels.
ThisperformancedifferencemightalsohavebeenduetothepossibilitythatlowerEnglish
languageproficiencylevelstudentswerenewerEnglishlearnerstudentswithstrongeredu-
cationandliteracy in theirnativelanguage(Collier, 1992,1989). Itmayalsobe worthexaminingwhetherstudentsat higherEnglishlanguageproficiencylevelsarelongterm
EnglishlearnerstudentswhomaybelessmotivatedtopasstheirEnglishlanguagearts
andmathcontentteststhannewEnglishlearnerstudentsatlowerEnglishlanguageprofi-
ciencylevels.AstudylookingatadditionalcharacteristicsofEnglishlearnerstudentswho
make upeach Englishlanguage proficiency level subgroup—suchas ethnicity, parental
education, lengthoftimeintheUnitedStates, levelofnative languagefluency, and/or
attitudestowardschool—mighthelpexplainthedifferentcumulativepassinglevels.
Limitationsofthestudy
Thereweretwolimitationstothisstudy.Thefirstrelatestothescopeofthesample.ThestudyaddressestheprogressofEnglishlearnerstudentsinthreecohortsforwhichtest
scoredatawereavailableforeachschoolyearoverthesixschoolyearperiodofthestudy
andwho advanced a gradelevel each year. Thus, the sampleexcludes mobile students
wholeftorenteredthestateduringthestudyperiod.Italsoexcludesstudentswhorepeat-
edorskippedagrade,duetodifficultiestrackingstudentswhodidnotprogresswiththe
restoftheirgradelevelcohort.Asaresult,thissampleisamorestablegroupofEnglish
learnerstudentsthan isthecaseinmostschools.Thus,thecumulativepassingrateson
theEnglishproficiencytestandtheEnglishlanguageartsandmathcontenttestscould
behigherthanfortheEnglishlearnerpopulationasawhole.Thecohortswerechosenfor
theirimportanceinthedevelopmentandschoolexperienceofEnglishlearnerstudents,
K–12.Nostatisticaltestswereperformed.Thus,thefindingsarenotdirectlycomparabletothoseforothercontexts.
ToaddressthepossibilitythatthestudysamplemaydifferfromtheEnglishlearnerpopu-
lationasawhole,tableB2inappendixBshowsthefollowingcomparisonsoftheanalytic
sampletotheentiresampleofEnglishlearnerstudentsin2006/07:thenumberofEnglish
learnerstudentsintheanalyticsampleandinthesampleofallEnglishlearnerstudents;
thepercentagethattheanalyticsampleiswithinthesampleofallEnglishlearnerstu-
dents;andthepercentageofeachofthestudentcharacteristicsexaminedinthestudyfor
boththeanalyticsampleandthesampleofallEnglishlearnerstudents.
It may be worth
examining whether
students at higher
English language
proficiency levels
are long-term
English learner
students who
may be less
motivated to pass
their English
language arts
and math content
tests than new
English learner
students at lower
English language
proficiency levels
21
7/17/2019 The Achievement Progress of English-learner Students in Arizona
http://slidepdf.com/reader/full/the-achievement-progress-of-english-learner-students-in-arizona 29/53
The second limitation relates to comparisons among cohorts based on differences in
samplecharacteristicsandincontenttesttakingopportunities.First,therearelikelytobe
differencesinthecharacteristicsofthestudentsinthekindergarten,grade3,andgrade6
cohorts,especiallyrelatedtoinitialEnglishlanguageproficiencylevel.ForEnglishlearner
students in the kindergarten cohort,kindergarten was their initial enrollment year in
Arizona,andtheirEnglishlanguageproficiencylevelwastheirinitialEnglishlanguage
proficiencylevelwhentheystartedschool(whichwaswhenthestudybeganforthekin-dergartencohort).ForEnglishlearnerstudentsinthegrade3andgrade6cohorts,their
Englishlanguageproficiencylevelwastheirlevelatthestartofthestudy.However,itis
notknownwhentheseEnglishlearnerstudentsstartedschoolinArizonanortheirinitial
Englishlanguageproficiencylevelwhentheystartedschool.Furthermore,thecomposition
ofthekindergarten,grade3,andgrade6cohortscouldbedifferentbecauseofdifferences
instudentmobilityandgraderepetitionacrosscohorts.
Thegrade 3andgrade6cohortscouldalsobedifferentinthat,comparedwiththekin-
dergartencohort,theyarelikelycomposedofthestudentswhohadthemostdifficulty
learningEnglish,sincefasterlearnerswouldhavealreadyachievedreclassificationasfluent
Englishproficientstudentsandthereforewouldnotbeamongthegrade3and6cohorts.Forexample,inthegrade6cohort,therewerehigherpercentagesofEnglishlearnerstu-
dentseligibleforspecialeducationservicesthaninthegrade3andkindergartencohorts.
Thosehigherpercentagescouldbeduetograde6studentshavinghadmoreopportunities
inpreviousgradestobeidentifiedasneedingspecialeducationservices.Theycouldalso
beduetothefactthattheEnglishlearnerstudentswhomorequicklyachievedreclassifica-
tionasfluentEnglishproficientwerenolongeramongtheEnglishlearnerstudentsbythe
timetheyreachedgrade6(oracombinationofboth).
Asagroup,Englishlearnerstudentswhowereeligibleforspecialeducationserviceshad
lowercumulativepassingratesthantheirpeerswhowerenoteligible(seefigures3,6,and
9).Bycontrast,inkindergarten,thefasterEnglishlearnerstudents(who,asnotedearlier,arelikelyEnglishlearnerstudentswithfewerriskfactors)hadnotyetbeengivenachance
toachievereclassificationasfluentEnglishproficientandthuswerestillinthecohortat
thestartofthestudy.Also,differencesinEnglishlearnerstudentachievementpercentages
acrossthethreecohortsarelikelyinfluencedbydifferencesinthecontentofthetests,
becauseeachstateincreasesthedifficultyofitsEnglishlanguageproficiencyandEnglish
languageartscontenttestsasthegradelevelincreases.Further,duringthe studyperiod
studentsinthekindergartencohorthadfeweropportunitiestotake,andthereforetopass,
their stateEnglishlanguagearts content test, which isfirstadministered ingrade 3 in
Arizona.However,whilethesefactorsarealllimitationsofthestudy,theyalsoreflectthe
actualexperienceofEnglishlearnerstudentsovertimeinthestatesystem.
22
7/17/2019 The Achievement Progress of English-learner Students in Arizona
http://slidepdf.com/reader/full/the-achievement-progress-of-english-learner-students-in-arizona 30/53
AppendixA.Arizonaprogramsthatprovidecontextforthestudy
Toprovidecontextfortheanalysisinthisreport,thisappendixdescribesArizona’sprocess
foridentifyingstudentswhoareeligibleforspecialeducationservicesandforidentifying
studentsasEnglishlearnerstudents;thestate’sEnglishlanguageproficiencytestandlevels,
Englishlanguageartsandmathcontenttestsandachievementlevels,andEnglishlearner
supportprograms;andhowArizona(andotherstates)definesmakingprogressinlearningEnglish.Thesedescriptionsprovideacontextforthestateanalysisandarenotintendedas
evaluationsofthestateprogramsorassessments.
Identifying students who are eligible for special education services
Childrenareeligibleforspecialeducationservicesiftheyaredeterminedtohavealearn-
ingdisability under the IndividualswithDisabilities Education Act of2004, 34C.F.R.
Secs.300et al.,andSection504oftheRehabilitationActof1973.Arizona’sprocedures
formakingthisdeterminationareintendedtocomplywiththesefederalstatutes,Arizona
state statutes, and the Arizona administrative code. The procedures are described in
AZTAS: Evaluation and Eligibility: Process and Procedures from Referral to Determinationof Eligibility(ArizonaDepartmentofEducation,2012).Thestepsintheprocessofdeter-
miningwhetherstudentshavealearningdisabilityandareeligibleforspecialeducation
servicesinclude:
• Proactiveeffortsbypubliceducationagenciestoidentify,locate,andevaluatestu-
dentswithdisabilitieswithintheirjurisdictions.
• Useofprereferralinterventionstoassiststudentswhomayhaveadisabilityto
improvetheirschoolsuccess.
• Referralofstudentswhomayhaveadisabilitywhodidnotrespondsufficiently
toprereferralservices,forafullevaluationinitiatedbyachild’sparentorpublic
educationagencystaffmember.
• Conveningofanevaluationteamthat:• Reviewsexistinginformationonthechild’sprogress;
• Collects and reviews additional functional, developmental, and academic
information followingreasonableeffortsto obtainparentconsentto collect
thisinformationalongwithparentinputandteacherrecommendations;and
• Determines,alongwiththeparent(s),whetherthestudenthasalearningdis-
abilitythatimpactslearningandwhetherthereisaneedforspeciallydesigned
instruction.
Thespeciallydesignedinstructionforeachstudentissetforthinanindividualizededu-
cationprogram.Accommodationsoradditionalsupportsfor languageneeds forEnglish
learnerstudentsaremadeonan individualbasisbyeachevaluationteam.EachEnglishlearnerstudent’sevaluationteamdeterminesthedegreetowhichtheindividualizededuca-
tionprogramaltershisorherparticipationinArizona’sdailyfourhourStructuredEnglish
Immersionprogram(describedbelow).
Identifying students for an English learner program
AsrequiredbyTitleIIIoftheElementaryandSecondaryEducationActof2001,each
statemustdistributeahomelanguagesurveytoallstudentswhentheyfirstenrollinthe
state’spublicschools.TheschoolsmustassesstheEnglishproficiencyofallstudentswhose
A1
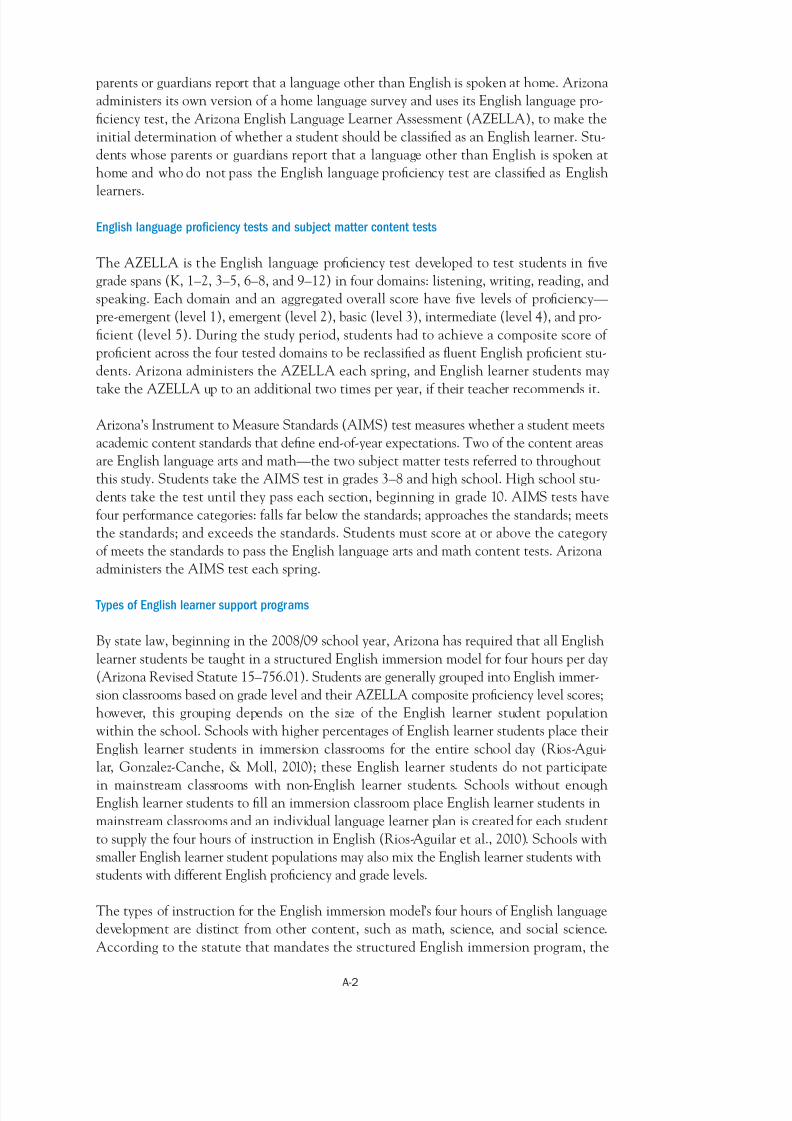
7/17/2019 The Achievement Progress of English-learner Students in Arizona
http://slidepdf.com/reader/full/the-achievement-progress-of-english-learner-students-in-arizona 31/53
parentsorguardiansreportthatalanguageotherthanEnglishisspokenathome.Arizona
administersitsownversionofahomelanguagesurveyandusesitsEnglishlanguagepro-
ficiencytest,theArizonaEnglishLanguageLearnerAssessment(AZELLA),tomakethe
initialdeterminationofwhetherastudentshouldbeclassifiedasanEnglishlearner.Stu-
dentswhoseparentsorguardiansreportthatalanguageotherthanEnglishisspokenat
homeandwhodonotpasstheEnglishlanguageproficiencytestareclassifiedasEnglish
learners.
English language proficiency tests and subject matter content tests
TheAZELLAistheEnglishlanguageproficiencytestdeveloped toteststudentsinfive
gradespans(K,1–2,3–5,6–8,and9–12)infourdomains:listening,writing,reading,and
speaking.Eachdomainandan aggregatedoverall scorehavefivelevelsofproficiency—
preemergent(level1),emergent(level2),basic(level3),intermediate(level4),andpro-
ficient(level5).Duringthestudyperiod,studentshadtoachieveacompositescoreof
proficientacrossthefourtesteddomainstobereclassifiedasfluentEnglishproficientstu-
dents.ArizonaadministerstheAZELLAeachspring,andEnglishlearnerstudentsmay
taketheAZELLAuptoanadditionaltwotimesperyear,iftheirteacherrecommendsit.
Arizona’sInstrumenttoMeasureStandards(AIMS)testmeasureswhetherastudentmeets
academiccontentstandardsthatdefineendofyearexpectations.Twoofthecontentareas
areEnglishlanguageartsandmath—thetwosubjectmattertestsreferredtothroughout
thisstudy.StudentstaketheAIMStestingrades3–8andhighschool.Highschoolstu-
dentstakethetestuntiltheypasseachsection,beginningingrade10.AIMStestshave
fourperformancecategories:fallsfarbelowthestandards;approachesthestandards;meets
thestandards;andexceedsthestandards.Studentsmustscoreatorabovethecategory
ofmeetsthestandardstopasstheEnglishlanguageartsandmathcontenttests.Arizona
administerstheAIMStesteachspring.
Types of English learner support programs
Bystatelaw,beginninginthe2008/09schoolyear,ArizonahasrequiredthatallEnglish
learnerstudentsbetaughtinastructuredEnglishimmersionmodelforfourhoursperday
(ArizonaRevisedStatute15–756.01).StudentsaregenerallygroupedintoEnglishimmer-
sionclassroomsbasedongradelevelandtheirAZELLAcompositeproficiencylevelscores;
however, this grouping depends on the size of the English learner student population
withintheschool.SchoolswithhigherpercentagesofEnglishlearnerstudentsplacetheir
Englishlearnerstudentsin immersionclassrooms for theentireschoolday (RiosAgui-
lar, GonzalezCanche, &Moll, 2010); theseEnglishlearnerstudentsdonotparticipate
in mainstream classrooms withnonEnglish learner students. Schools without enoughEnglishlearnerstudentstofillanimmersionclassroomplaceEnglishlearnerstudentsin
mainstreamclassroomsandanindividuallanguagelearnerplaniscreatedforeachstudent
tosupplythefourhoursofinstructioninEnglish(RiosAguilaret al.,2010).Schoolswith
smallerEnglishlearnerstudentpopulationsmayalsomixtheEnglishlearnerstudentswith
studentswithdifferentEnglishproficiencyandgradelevels.
ThetypesofinstructionfortheEnglishimmersionmodel’sfourhoursofEnglishlanguage
developmentaredistinct fromothercontent,suchasmath, science,andsocialscience.
AccordingtothestatutethatmandatesthestructuredEnglishimmersionprogram,the
A2
7/17/2019 The Achievement Progress of English-learner Students in Arizona
http://slidepdf.com/reader/full/the-achievement-progress-of-english-learner-students-in-arizona 32/53
instructionmustfocusonpronunciationandontheinternalstructureofwords,syntax,
vocabulary, andsemantics; inaddition,a specific numberofminutes mustbe spenton
each language instructioncomponent(forexample,60 minutesofgrammar instruction
forEnglishlearnerstudentsatthe twolowestEnglishlanguageproficiencylevelsinthe
elementarygrades).Asaresultoftheserequirements,Englishlearnerstudentsgenerallydo
notparticipateinmathandEnglishlanguageartscontentclasseswhiletheyarerequired
toparticipateinthedailyfourhourEnglishimmersionclasses.Thus,Englishlearnerstu-dentslearnspecificmathandEnglishlanguageartscontent,oranyothersubjectmatter
content,basedonthedegreetowhichtheirteacherincorporatesitintotheirstructured
Englishimmersioncurriculum.Forexample,astructuredEnglishimmersionteachercould
analyzemathorEnglishlanguageartstextsduringthegrammarinstructiontime.
Guidelines for making progress in learning English
States have discretion to determine what is considered “making progress in learning
English”undertheannualmeasurableachievementobjective1(AMAO1)requirements
ofTitleIII oftheElementaryandSecondaryEducationActof2001. Accordingtoan
AmericanInstitutesforResearchbriefpreparedfortheU.S.DepartmentofEducationinMay2010,halfofthestateswithsufficientdocumentationoftheirclassificationcriteria(17
of34statesexaminedinthestudy)definedAMAO1progressasadvancingoneEnglish
languageproficiencylevel(ormore)perschoolyearuntilscoringattherequiredEnglish
language proficiency level for reclassificationas fluentEnglishproficient (Boyle, Taylor,
Hurlburt,&Soga,2010).
ArizonadefinesAMAO1progressasprogressingatleastoneEnglishlanguageproficien-
cylevelperschoolyear(ArizonaDepartmentofEducation,2011).Theotherhalfofthe
34statesintheAmericanInstitutesforResearchbriefdefinedprogressasvariousrates
oflessthanoneEnglishlanguageproficiencylevelperschoolyear.Atthefasterrateof
oneEnglishlanguageproficiencylevelperschoolyear,Englishlearnerstudentswouldbeexpected toachievereclassificationas fluentEnglishproficientwithinonetofouryears,
dependingontheirinitialEnglishlanguageproficiencylevel.In Arizona,lessthanhalf
theEnglishlearnerstudentsinthethreecohortsmettheAMAO1expectationsoverthe
periodofthestudy(tableA1).
TableA1.ProgressofEnglishlearnerstudentsinmeetingArizona’sannualmeasurableachievement
objective1,byinitialEnglishlanguageproficiencylevelandcohort,2006/07–2011/12
Englishlanguageproficiencylevelin2006/07
AMAO1 Kindergartencohort(%) Grade3cohort(%) Grade6cohort(%)
Expectedyearsto
reclassificationasfluentEnglishproficientstudent
Targetyear
Cumulativepassingrateby
AMAO1expected
year
Actualcumulative
passing
ratesattheendofthestudy
Cumulativepassingrateby
AMAO1expected
year
Actualcumulative
passing
ratesattheendofthestudy
Cumulativepassingrateby
AMAO1expected
year
Actualcumulative
passing
ratesattheendofthestudy
1(preemergent) 4 2010/11 63 78 89 92 81
2(emergent) 3 2009/10 44 79 73 95 70
3(basic) 2 2008/09 54 90 36 90 27
4(intermediate) 1 2007/08 34 96 45 99 38
AMAO1isannualmeasurableachievementobjective1,whichsetanexpectationofincreasingoneEnglishlanguageproficiencylevel
perschoolyearforEnglishlearnerstudents.
Source:Authors’analysisofstudentleveldatafromArizonaDepartmentofEducation,2006/07–2011/12.
A3
87
88
78
96
7/17/2019 The Achievement Progress of English-learner Students in Arizona
http://slidepdf.com/reader/full/the-achievement-progress-of-english-learner-students-in-arizona 33/53
AppendixB.Dataandmethodology
Thisappendixdescribesconstructionoftheanalyticsamplesandexplainshowthedata
wereanalyzed.
Analytic sample
Studentsweregroupedintothreeanalyticgradelevelcohortsbasedontheir2006/07gradelevel:kindergarten,grade3,andgrade6.Withineachcohort,students’initialEnglishlan-
guageproficiencylevelwasdeterminedbasedonthe2006/07Englishlanguageproficiency
test.Thus,2006/07wastheEnglishlearnerbaselineidentificationyear,andEnglishlearner
studentproficiencyprogresswasinitiallymeasuredin2007/08.FortheEnglishlanguage
artsandmathcontenttests,Englishlearnerstudentachievementprogresswasmeasured
fromthefirstyearofthestudy,2006/07(boxB1).
For each gradelevelcohort,theanalyticsamplewasbasedonthefollowingcriteria (a
studentwasincludedintheanalyticsampleifthestudentmetcriteria1–3below,aswellas
either4a,4b,or4c):
1. Wasinthedatasysteminallsixschoolyears,2006/07–2011/12.
2. HadaninitialEnglishlanguageproficiencyassessmentscorelowerthanproficientin
2006/07.
3. Startedfromthecohortgrade(K,3,or6)in2006/07andhadnormalgradeprogress
(nograderepeatersorgradeskippers)through2011/12.
and either
4a. FortheEnglishlanguageproficiencylevelassessmentanalysis,achievedEnglishlan-
guage proficiency assessment level for reclassification as fluentEnglishproficient or
tooktheEnglishlanguageproficiencyassessmentinthelastschoolyear(2011/12).
or
4b. For theEnglishlanguagearts analysis,hadstateEnglishlanguagearts content test
resultsineachyearthetestwasadministeredduringthestudyperiod.
or
4c. Forthemathanalysis,hadstatemathcontent testresultsineachyearthetestwas
administeredduringthestudyperiod.
BoxB1.Timingofproficiency,languagearts,andmathtests
TheanalyticperioddifferedfortheEnglishlanguageproficiencytestandthesubjectmattercontenttests.FortheEnglishlanguageproficiencyanalysis,2006/07wasthebaselineyear
fortheidentificationoftheEnglishlanguageproficiencylevelsubgroupsbecausetherewereno
Englishlanguageproficiencyleveldatapriorto2006/07acrossthreestates,Arizona,Nevada,
andUtah,whichwererequiredforparallelreportsthatwerepartofthisanalysis.Englishlan-
guageproficiencyprogresswasmeasuredforwardfromthatpoint.Thus,in theEnglishlan-
guageproficiency analysis,2007/08 represented thefirst year ofmeasured progress, and
2011/12thefinalyear,foratotaloffiveschoolyears.Forthesubjectmattercontenttests,
studentsclassifiedasEnglishlearnerstudentsin2006/07wereidentified,andtheirachieve-
mentlevelsfrom2006/07through2011/12examined,foratotalofsixyears.
B1
7/17/2019 The Achievement Progress of English-learner Students in Arizona
http://slidepdf.com/reader/full/the-achievement-progress-of-english-learner-students-in-arizona 34/53
Insum,theanalyticsampleincludedallstudentsidentifiedasEnglishlearnerstudentswho
wereenrolledinthestate’spublicschoolsinthedesignatedgradeofthefirstyearofthe
cohort,whoprogressedtothenextgradeleveleachyear,andwhohadtherequiredtest
datathroughoutthesixschoolyearsanalyzed.Eachcohortconsistedofaseparatesample
ofstudents.Forexample,thestudentsinthegrade3cohortwereEnglishlearnerstudents
whoenrolledin anArizonapublicschoolingrade3 in2006/07,progressedtothenext
gradeleveleachyear,andhadtherequiredArizonatestscoredatathroughgrade8in2011/12.
Duetothesecriteriaforinclusion,thesampleexcludedmobilestudentswholeftorentered
thestateduringthestudyperiod.Graderepeatersorskipperswereexcludedbecausetests
differbygradelevel.Thus,itisnotaccuratetoannuallyaggregatetestresultsacrossa
cohortofstudentswhenstudentsaretakingdifferentgradeleveltests,suchas asecond
graderepeaterandathirdgraderinthesameyear.Further,itisdifficulttotrackstudents
whodidnotprogresswiththerestoftheirgradelevelcohort,whichwouldrequirestatesto
provideadditionalyearsofdatatoaccountforonlyasmallpercentageofstudents.
ThenumbersandpercentagesforEnglishlearnerstudentswhodidnotmakenormalgradeprogresswere—kindergartencohort,1,576(5.4 percent);grade3cohort,414(2.9 percent);
andgrade6cohort,330(3.8 percent).
Hence,becausethefinalsamplewasamoregeographicallystablepopulation,theprofi-
ciencyratesandpassingratescouldbehigherthanfortheEnglishlearnerpopulationas
awhole.Limitationsduetothecharacteristicsoftheanalyticsampleandotherissuesare
describedinthelimitationssectionofthereport.
The steps for preparingthe studentsamplesfor each ofthethreeassessments(English
proficiency,Englishlanguageartscontent,andmathcontent)aredescribedintableB1.
Data and analysis
Thedataincludestudentleveldatafromschoolyears2006/07through2011/12.Datawere
analyzedinthethreeparallelgradespancohorts:kindergartenthroughgrade5,grade 3
throughgrade8,andgrade6throughgrade11.Toaddresstheresearchquestions,annual,
cumulativenumbersandpercentagesofEnglishlearnerstudentswhometeachprogress
criterionwerecalculatedandgroupedbygradelevelcohort(ananalyticalmethodrecom-
mendedbyCooket al.,2012).Atthestartofthestudy(2006/07),analyseswereconduct-
edforeachEnglishlearnergradelevelcohortasawhole,aswellasbythefourstudent
characteristics:Englishlanguageproficiencylevel,eligibilityforspecialeducationservices,
eligibilityforfederalschoollunchprograms,andgender.Thesimilaritiesanddifferencesacrossthethreecohortswerealsoexplored.
NotethatArizonaadministersitsEnglishlanguageartsandmathcontenttestsstartingin
grade3.Inhighschool,Arizonadoesnotadministercontenttestsingrade9.Therefore,
thekindergartencohorthasresultsforgrades3–5,andthegrade6cohorthasthesame
cumulativepassingratesingrades8and9(asseeninfigures4–9).
B2
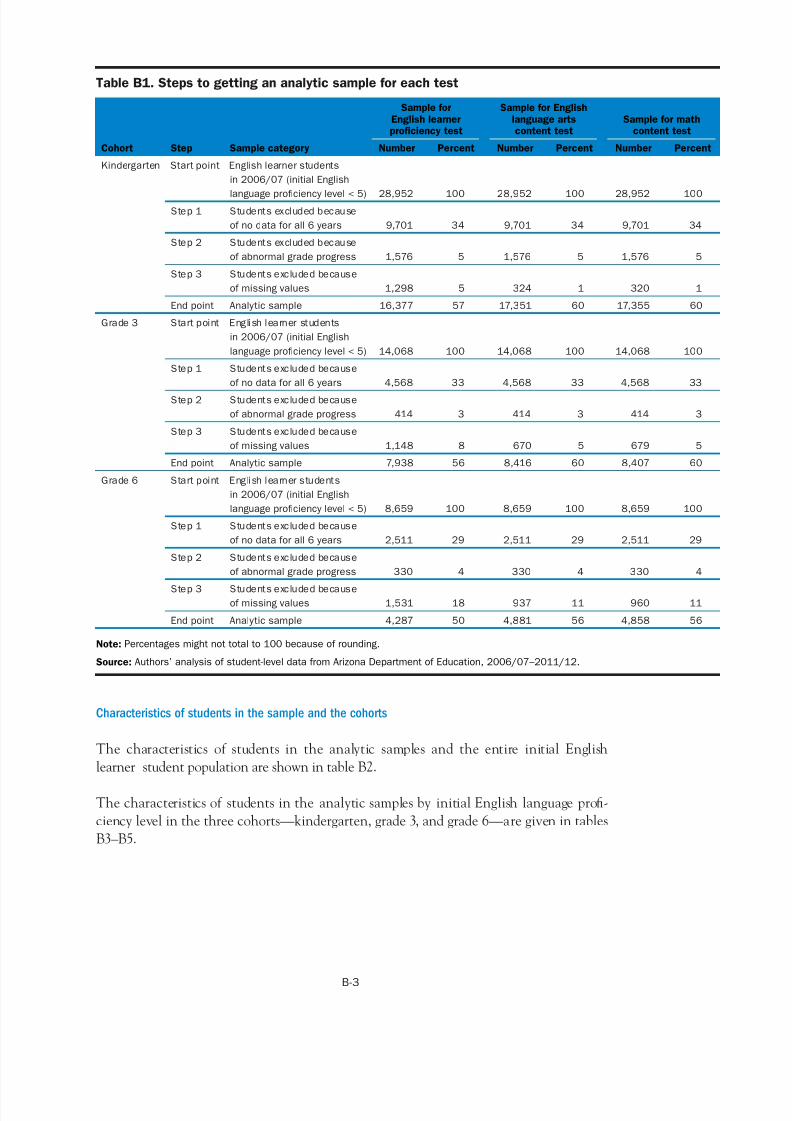
7/17/2019 The Achievement Progress of English-learner Students in Arizona
http://slidepdf.com/reader/full/the-achievement-progress-of-english-learner-students-in-arizona 35/53
34
TableB1.Stepstogettingananalyticsampleforeachtest
Cohort Step Samplecategory
Samplefor
Englishlearnerproficiencytest
SampleforEnglish
languageartscontenttest
Sampleformathcontenttest
Number Percent Number Percent Number Percent
Kindergarten Startpoint Englishlearnerstudents
in2006/07(initialEnglish
languageproficiencylevel<5) 28,952 100 28,952 100 28,952 100Step1 Studentsexcludedbecause
ofnodataforall6years 9,701 34 9,701 34 9,701
Step2 Studentsexcludedbecause
ofabnormalgradeprogress 1,576 5 1,576 5 1,576
Step3 Studentsexcludedbecause
ofmissingvalues 1,298 5 324 1 320
Endpoint Analyticsample 16,377 57 17,351 60 17,355 60
Grade3 Startpoint Englishlearnerstudents
in2006/07(initialEnglish
languageproficiencylevel<5) 14,068 100 14,068 100 14,068 100
Step1 Studentsexcludedbecause
ofnodataforall6years 4,568 33 4,568 33 4,568
Step2 Studentsexcludedbecause
ofabnormalgradeprogress 414 3 414 3 414
Step3 Studentsexcludedbecause
ofmissingvalues 1,148 8 670 5 679
Endpoint Analyticsample 7,938 56 8,416 60 8,407 60
Grade6 Startpoint Englishlearnerstudents
in2006/07(initialEnglish
languageproficiencylevel<5) 8,659 100 8,659 100 8,659 100
Step1 Studentsexcludedbecause
ofnodataforall6years 2,511 29 2,511 29 2,511
Step2 Studentsexcludedbecause
ofabnormalgradeprogress 330 4 330 4 330
Step3 Studentsexcludedbecauseofmissingvalues 1,531 18 937 11 960
Endpoint Analyticsample 4,287 50 4,881 56 4,858 56
Note:Percentagesmightnottotalto100becauseofrounding.
Source:Authors’analysisofstudentleveldatafromArizonaDepartmentofEducation,2006/07–2011/12.
Characteristics of students in the sample and the cohorts
The characteristics of students in the analytic samples and the entire initial English
learner studentpopulationareshownintableB2.
Thecharacteristicsof students intheanalyticsamplesby initialEnglishlanguageprofi-
ciencylevelinthethreecohorts—kindergarten,grade3,andgrade6—aregivenintables
B3–B5.
B3
5
1
33
3
5
29
4
11
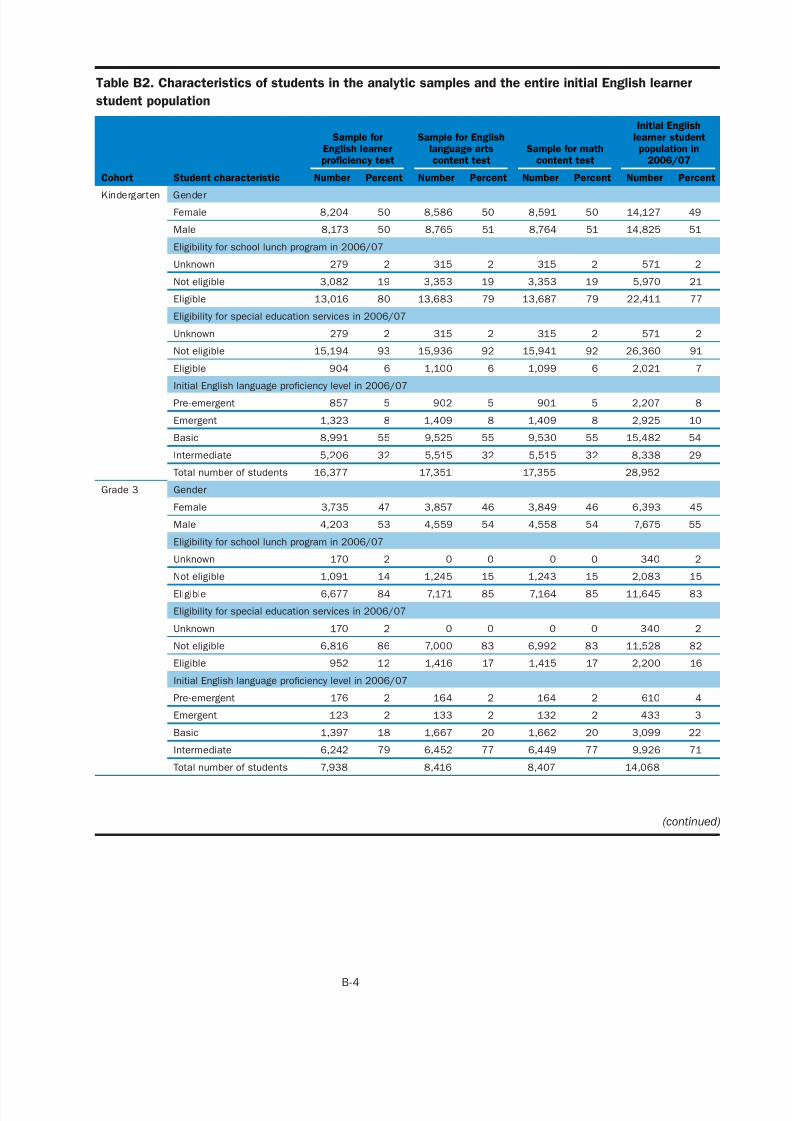
7/17/2019 The Achievement Progress of English-learner Students in Arizona
http://slidepdf.com/reader/full/the-achievement-progress-of-english-learner-students-in-arizona 36/53
49
51
TableB2.CharacteristicsofstudentsintheanalyticsamplesandtheentireinitialEnglishlearner
studentpopulation
Cohort Studentcharacteristic
SampleforEnglishlearnerproficiencytest
SampleforEnglishlanguageartscontenttest
Sampleformathcontenttest
InitialEnglish
learner studentpopulationin
2006/07
Number Percent Number Percent Number Percent Number Percent
Kindergarten Gender
Female 8,204 50 8,586 50 8,591 50 14,127
Male 8,173 50 8,765 51 8,764 51 14,825
Eligibilityforschoollunchprogramin2006/07
Unknown 279 2 315 2 315 2 571
Noteligible 3,082 19 3,353 19 3,353 19 5,970 21
Eligible 13,016 80 13,683 79 13,687 79 22,411 77
Unknown 279 2 315 2 315 2 571 2
Eligibilityforspecialeducationservicesin2006/07
Noteligible 15,194 93 15,936 92 15,941 92 26,360 91
Eligible 904 6 1,100 6 1,099 6 2,021 7
Preemergent 857 5 902 5 901 5 2,207 8
InitialEnglishlanguageproficiencylevelin2006/07
Emergent 1,323 8 1,409 8 1,409 8 2,925
Basic 8,991 55 9,525 55 9,530 55 15,482
Intermediate 5,206 32 5,515 32 5,515 32 8,338
Totalnumberofstudents 16,377 17,351 17,355 28,952
Grade3
Female 3,735 47 3,857 46 3,849 46 6,393 45
Gender
Male 4,203 53 4,559 54 4,558 54 7,675
Eligibilityforschoollunchprogramin2006/07
Unknown 170 2 0 0 0 0 340
Noteligible 1,091 14 1,245 15 1,243 15 2,083 15
Eligible 6,677 84 7,171 85 7,164 85 11,645 83
Unknown 170 2 0 0 0 0 340 2
Eligibilityforspecialeducationservicesin2006/07
Noteligible 6,816 86 7,000 83 6,992 83 11,528 82
Eligible 952 12 1,416 17 1,415 17 2,200 16
Preemergent 176 2 164 2 164 2 610 4
InitialEnglishlanguageproficiencylevelin2006/07
Emergent 123 2 133 2 132 2 433
Basic 1,397 18 1,667 20 1,662 20 3,099
Intermediate 6,242 79 6,452 77 6,449 77 9,926
Totalnumberofstudents 7,938 8,416 8,407 14,068
(continued)
B4
2
10
54
29
55
2
3
22
71
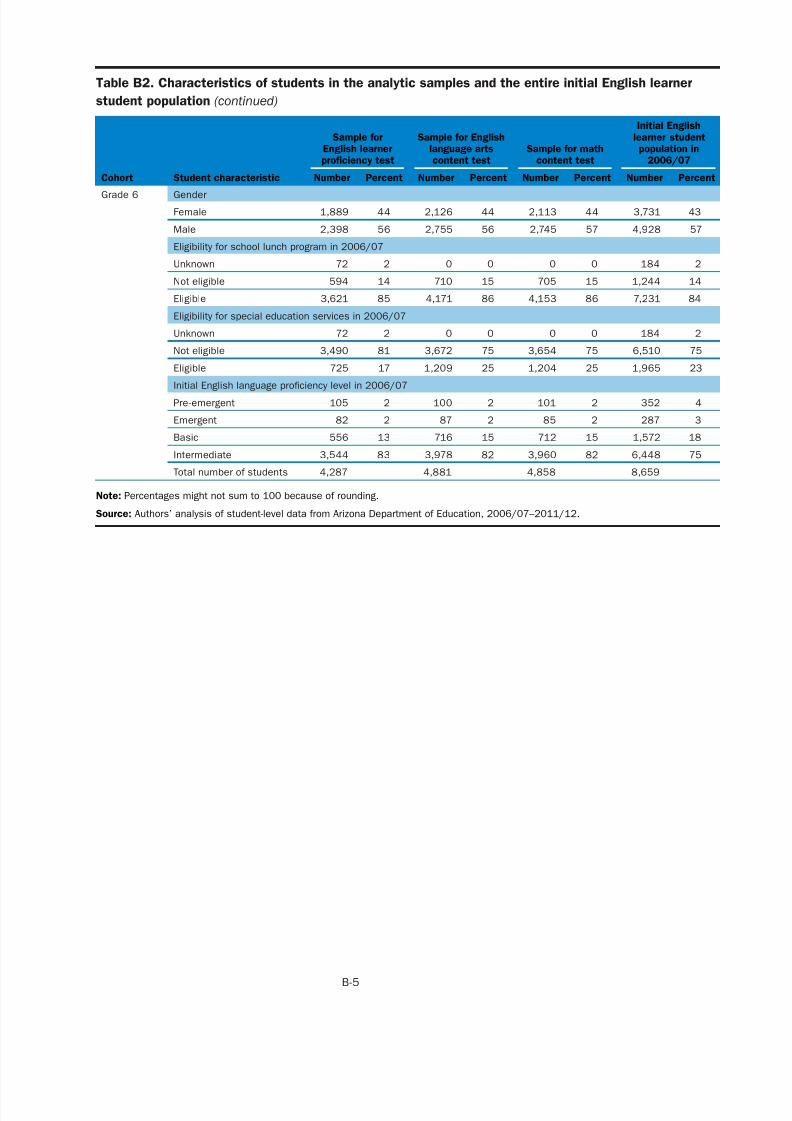
7/17/2019 The Achievement Progress of English-learner Students in Arizona
http://slidepdf.com/reader/full/the-achievement-progress-of-english-learner-students-in-arizona 37/53
43
TableB2.CharacteristicsofstudentsintheanalyticsamplesandtheentireinitialEnglishlearner
studentpopulation(continued)
Cohort Studentcharacteristic
SampleforEnglishlearnerproficiencytest
SampleforEnglishlanguageartscontenttest
Sampleformathcontenttest
InitialEnglish
learner studentpopulationin
2006/07
Number Percent Number Percent Number Percent Number Percent
GenderGrade6
Female 1,889 44 2,126 44 2,113 44 3,731
Male 2,398 56 2,755 56 2,745 57 4,928 57
Eligibilityforschoollunchprogramin2006/07
Unknown 72 2 0 0 0 0 184
Noteligible 594 14 710 15 705 15 1,244
Eligible 3,621 85 4,171 86 4,153 86 7,231
Eligibilityforspecialeducationservicesin2006/07
Unknown 72 2 0 0 0 0 184
Noteligible 3,490 81 3,672 75 3,654 75 6,510 75
Eligible 725 17 1,209 25 1,204 25 1,965 23
Preemergent 105 2 100 2 101 2 352 4
InitialEnglishlanguageproficiencylevelin2006/07
Emergent 82 2 87 2 85 2 287
Basic 556 13 716 15 712 15 1,572
Intermediate 3,544 83 3,978 82 3,960 82 6,448
Totalnumberofstudents 4,287 4,881 4,858 8,659
Note:Percentagesmightnotsumto100becauseofrounding.
Source:Authors’analysisofstudentleveldatafromArizonaDepartmentofEducation,2006/07–2011/12.
B5
2
14
84
2
3
18
75
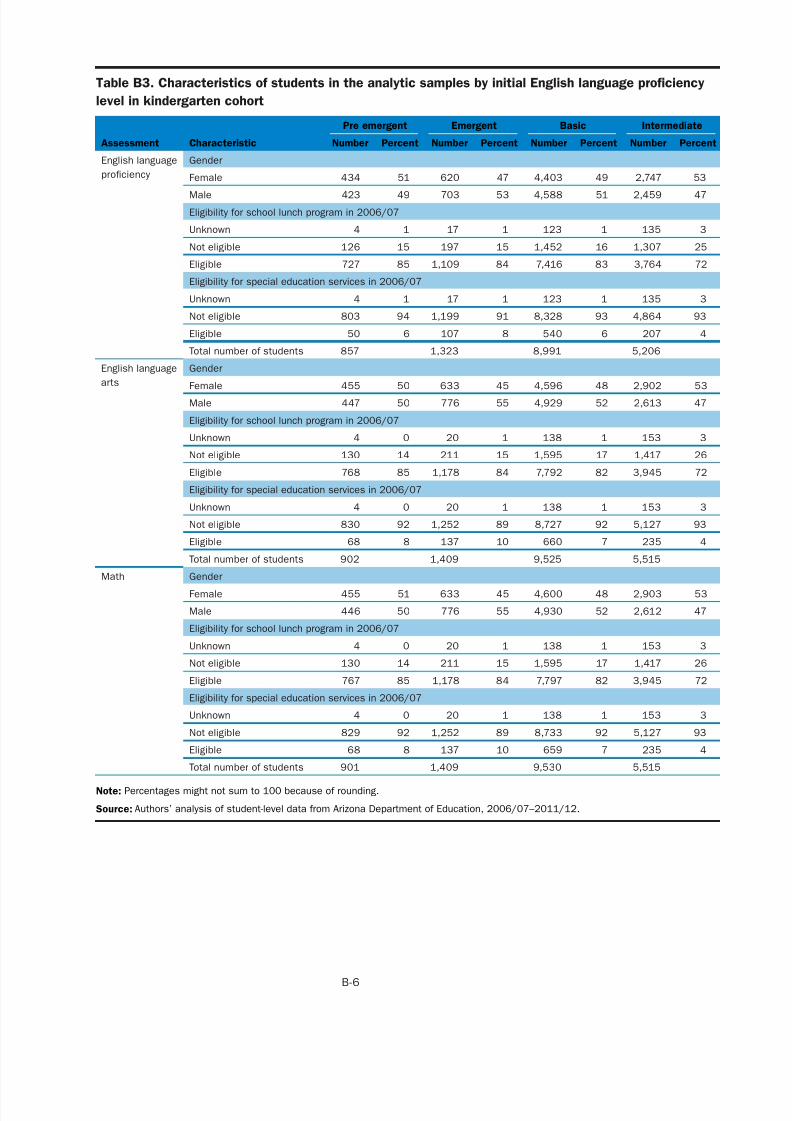
7/17/2019 The Achievement Progress of English-learner Students in Arizona
http://slidepdf.com/reader/full/the-achievement-progress-of-english-learner-students-in-arizona 38/53
53
47
3
TableB3.CharacteristicsofstudentsintheanalyticsamplesbyinitialEnglishlanguageproficiency
levelinkindergartencohort
Assessment Characteristic
Preemergent Emergent Basic Intermediate
Number Percent Number Percent Number Percent Number Percent
Englishlanguage
proficiency Female 434 51 620 47 4,403 49 2,747
Gender
Male 423 49 703 53 4,588 51 2,459
Eligibilityforschoollunchprogramin2006/07
Unknown 4 1 17 1 123 1 135
Noteligible 126 15 197 15 1,452 16 1,307 25
Eligible 727 85 1,109 84 7,416 83 3,764 72
Unknown 4 1 17 1 123 1 135 3
Eligibilityforspecialeducationservicesin2006/07
Noteligible 803 94 1,199 91 8,328 93 4,864
Eligible 50 6 107 8 540 6 207
Totalnumberofstudents 857 1,323 8,991 5,206
Englishlanguage
arts Female 455 50 633 45 4,596 48 2,902 53
Gender
Male 447 50 776 55 4,929 52 2,613
Eligibilityforschoollunchprogramin2006/07
Unknown 4 0 20 1 138 1 153
Noteligible 130 14 211 15 1,595 17 1,417 26
Eligible 768 85 1,178 84 7,792 82 3,945 72
Unknown 4 0 20 1 138 1 153 3
Eligibilityforspecialeducationservicesin2006/07
Noteligible 830 92 1,252 89 8,727 92 5,127
Eligible 68 8 137 10 660 7 235
Totalnumberofstudents 902 1,409 9,525 5,515
Math
Female 455 51 633 45 4,600 48 2,903 53
Gender
Male 446 50 776 55 4,930 52 2,612
Eligibilityforschoollunchprogramin2006/07
Unknown 4 0 20 1 138 1 153
Noteligible 130 14 211 15 1,595 17 1,417 26
Eligible 767 85 1,178 84 7,797 82 3,945 72
Unknown 4 0 20 1 138 1 153 3
Eligibilityforspecialeducationservicesin2006/07
Noteligible 829 92 1,252 89 8,733 92 5,127
Eligible 68 8 137 10 659 7 235
Totalnumberofstudents 901 1,409 9,530 5,515
Note:Percentagesmightnotsumto100becauseofrounding.
Source:Authors’analysisofstudentleveldatafromArizonaDepartmentofEducation,2006/07–2011/12.
B6
93
4
47
3
93
4
47
3
93
4
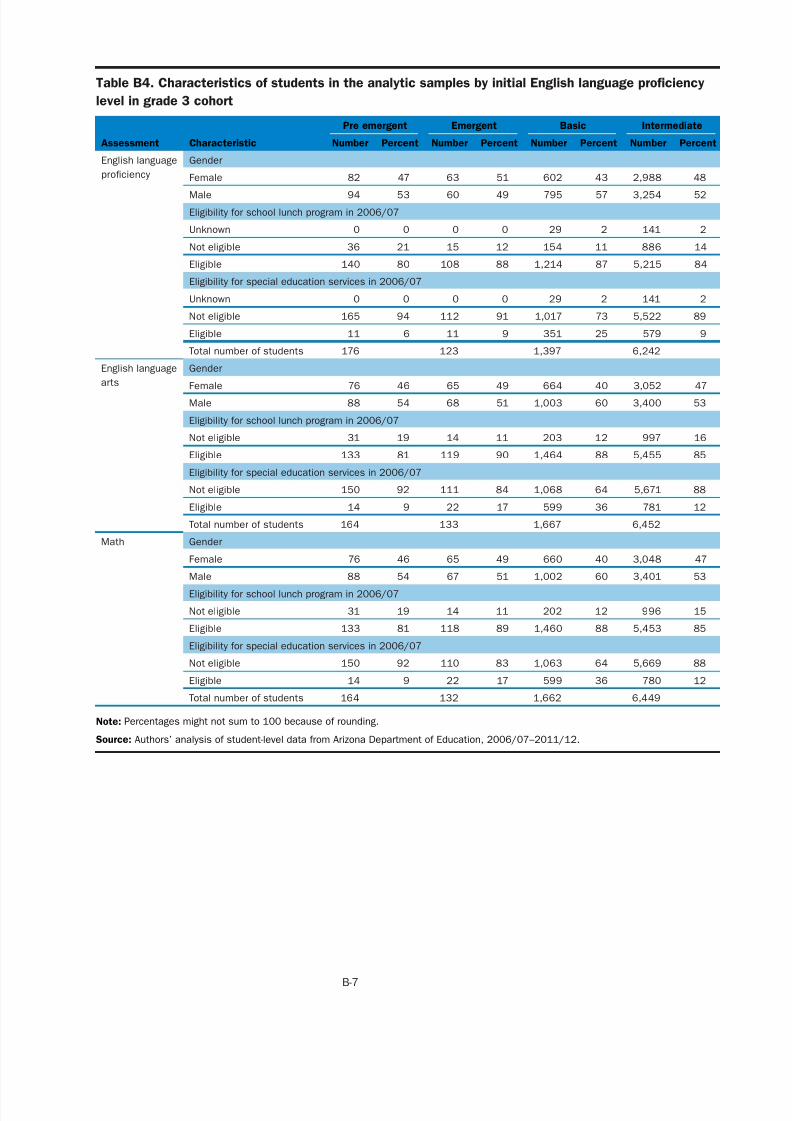
7/17/2019 The Achievement Progress of English-learner Students in Arizona
http://slidepdf.com/reader/full/the-achievement-progress-of-english-learner-students-in-arizona 39/53
48
52
2
TableB4.CharacteristicsofstudentsintheanalyticsamplesbyinitialEnglishlanguageproficiency
levelingrade3cohort
Assessment Characteristic
Preemergent Emergent Basic Intermediate
Number Percent Number Percent Number Percent Number Percent
Englishlanguage
proficiency Female 82 47 63 51 602 43 2,988
Gender
Male 94 53 60 49 795 57 3,254
Eligibilityforschoollunchprogramin2006/07
Unknown 0 0 0 0 29 2 141
Noteligible 36 21 15 12 154 11 886 14
Eligible 140 80 108 88 1,214 87 5,215 84
Unknown 0 0 0 0 29 2 141 2
Eligibilityforspecialeducationservicesin2006/07
Noteligible 165 94 112 91 1,017 73 5,522
Eligible 11 6 11 9 351 25 579
Totalnumberofstudents 176 123 1,397 6,242
Englishlanguage
arts Female 76 46 65 49 664 40 3,052 47
Gender
Male 88 54 68 51 1,003 60 3,400
Eligibilityforschoollunchprogramin2006/07
Noteligible 31 19 14 11 203 12 997
Eligible 133 81 119 90 1,464 88 5,455
Eligibilityforspecialeducationservicesin2006/07
Noteligible 150 92 111 84 1,068 64 5,671
Eligible 14 9 22 17 599 36 781
Totalnumberofstudents 164 133 1,667 6,452
Math
Female 76 46 65 49 660 40 3,048 47
Gender
Male 88 54 67 51 1,002 60 3,401
Eligibilityforschoollunchprogramin2006/07
Noteligible 31 19 14 11 202 12 996
Eligible 133 81 118 89 1,460 88 5,453
Eligibilityforspecialeducationservicesin2006/07
Noteligible 150 92 110 83 1,063 64 5,669
Eligible 14 9 22 17 599 36 780
Totalnumberofstudents 164 132 1,662 6,449
Note:Percentagesmightnotsumto100becauseofrounding.
Source:Authors’analysisofstudentleveldatafromArizonaDepartmentofEducation,2006/07–2011/12.
B7
89
9
53
16
85
88
12
53
15
85
88
12
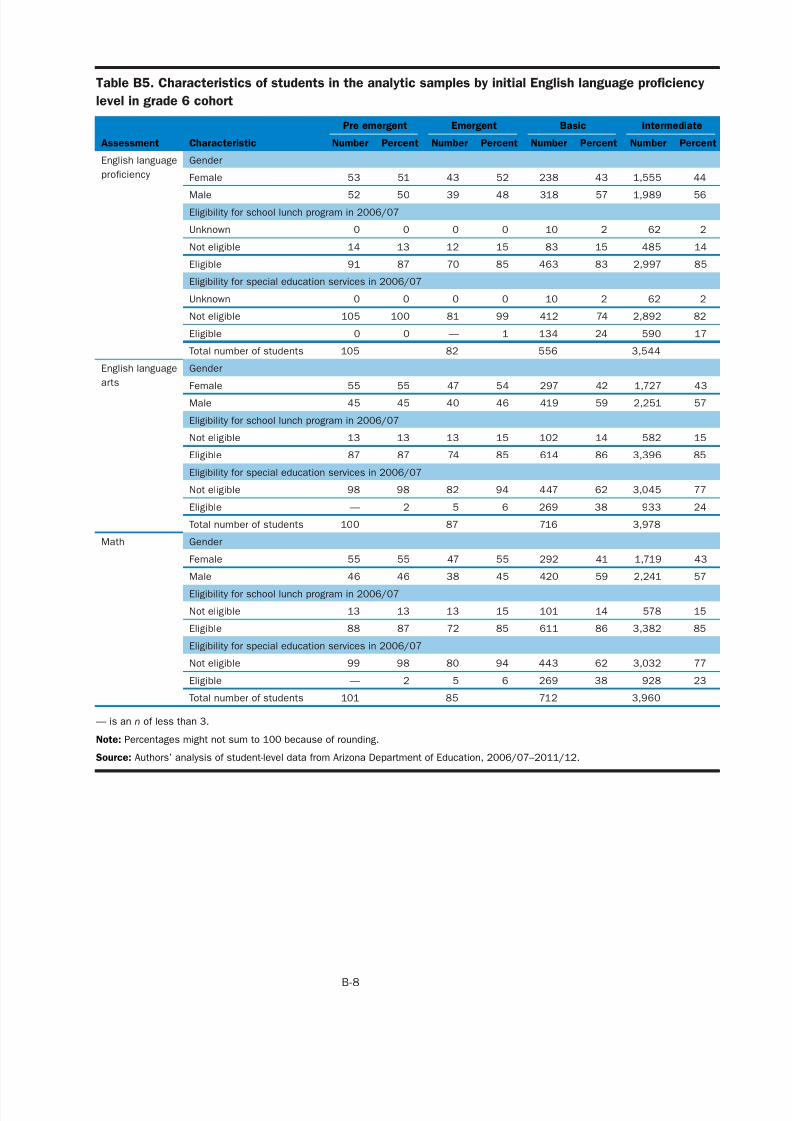
7/17/2019 The Achievement Progress of English-learner Students in Arizona
http://slidepdf.com/reader/full/the-achievement-progress-of-english-learner-students-in-arizona 40/53
44
56
2
TableB5.CharacteristicsofstudentsintheanalyticsamplesbyinitialEnglishlanguageproficiency
levelingrade6cohort
Assessment Characteristic
Preemergent Emergent Basic Intermediate
Number Percent Number Percent Number Percent Number Percent
Englishlanguage
proficiency Female 53 51 43 52 238 43 1,555
Gender
Male 52 50 39 48 318 57 1,989
Eligibilityforschoollunchprogramin2006/07
Unknown 0 0 0 0 10 2 62
Noteligible 14 13 12 15 83 15 485 14
Eligible 91 87 70 85 463 83 2,997 85
Unknown 0 0 0 0 10 2 62 2
Eligibilityforspecialeducationservicesin2006/07
Noteligible 105 100 81 99 412 74 2,892
Eligible 0 0 — 1 134 24 590
Totalnumberofstudents 105 82 556 3,544
Englishlanguage
arts Female 55 55 47 54 297 42 1,727 43
Gender
Male 45 45 40 46 419 59 2,251
Eligibilityforschoollunchprogramin2006/07
Noteligible 13 13 13 15 102 14 582
Eligible 87 87 74 85 614 86 3,396
Eligibilityforspecialeducationservicesin2006/07
Noteligible 98 98 82 94 447 62 3,045
Eligible — 2 5 6 269 38 933
Totalnumberofstudents 100 87 716 3,978
Math
Female 55 55 47 55 292 41 1,719 43
Gender
Male 46 46 38 45 420 59 2,241
Eligibilityforschoollunchprogramin2006/07
Noteligible 13 13 13 15 101 14 578
Eligible 88 87 72 85 611 86 3,382
Eligibilityforspecialeducationservicesin2006/07
Noteligible 99 98 80 94 443 62 3,032
Eligible — 2 5 6 269 38 928
Totalnumberofstudents 101 85 712 3,960
—isannoflessthan3.
Note:Percentagesmightnotsumto100becauseofrounding.
Source:Authors’analysisofstudentleveldatafromArizonaDepartmentofEducation,2006/07–2011/12.
B8
82
17
57
15
85
77
24
57
15
85
77
23
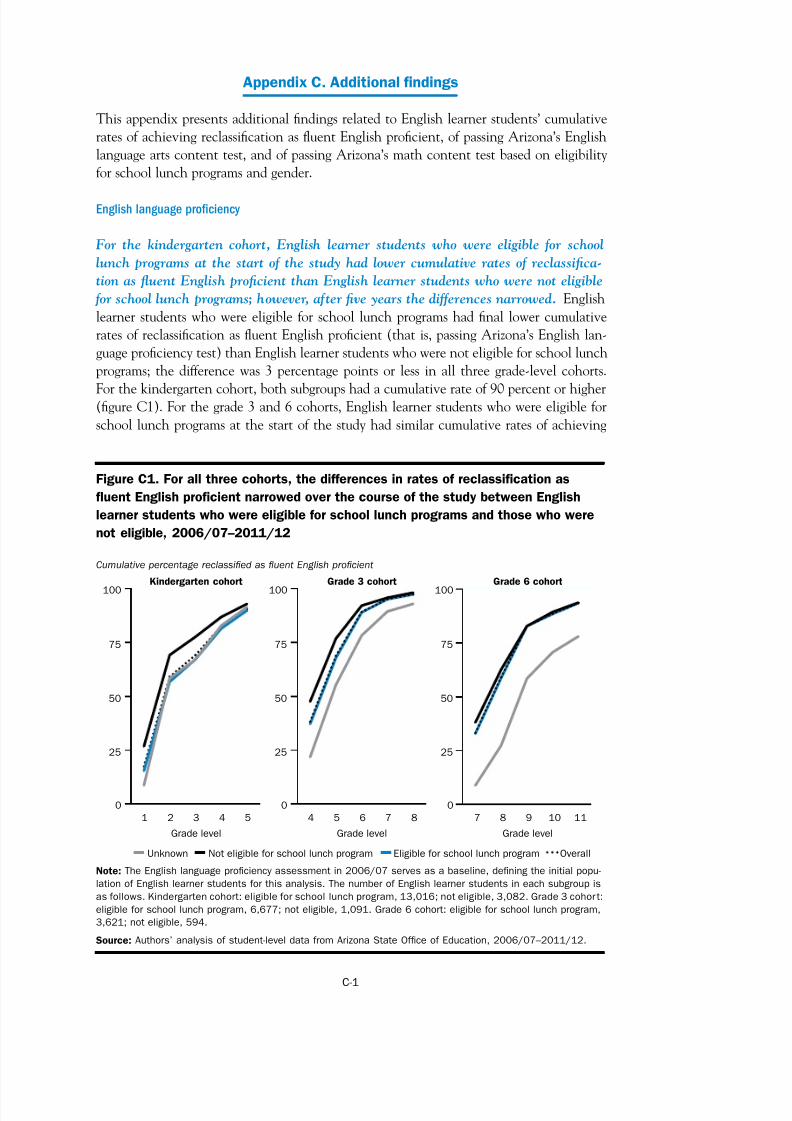
7/17/2019 The Achievement Progress of English-learner Students in Arizona
http://slidepdf.com/reader/full/the-achievement-progress-of-english-learner-students-in-arizona 41/53
Appendix C. Additional findings
This appendix presents additional findings related to English learner students’ cumulative
rates of achieving reclassification as fluent English proficient, of passing Arizona’s English
language arts content test, and of passing Arizona’s math content test based on eligibility
for school lunch programs and gender.
English language proficiency
For the kindergarten cohort, English learner students who were eligible for school
lunch programs at the start of the study had lower cumulative rates of reclassifica-
tion as fluent English proficient than English learner students who were not eligible
for school lunch programs; however, after five years the differences narrowed. English
learner students who were eligible for school lunch programs had final lower cumulative
rates of reclassification as fluent English proficient (that is, passing Arizona’s English lan-
guage proficiency test) than English learner students who were not eligible for school lunch
programs; the difference was 3 percentage points or less in all three gradelevel cohorts.
For the kindergarten cohort, both subgroups had a cumulative rate of 90 percent or higher(figure C1). For the grade 3 and 6 cohorts, English learner students who were eligible for
school lunch programs at the start of the study had similar cumulative rates of achieving
Figure C1. For all three cohorts, the differences in rates of reclassification as
fluent English proficient narrowed over the course of the study between English
learner students who were eligible for school lunch programs and those who were
not eligible, 2006/07–2011/12
Cumulative percentage reclassified as fluent English proficient
100
75
50
25
0
Kindergarten cohort
100
75
50
25
0
Grade 3 cohort
100
75
50
25
0
Grade 6 cohort
1 2 3 4 5 4 5 6 7 8 7 8 9 10 11
Grade level Grade level Grade level
Unknown Not eligible for school lunch program Eligible for school lunch program Overall
Note: The English language proficiency assessment in 2006/07 serves as a baseline, defining the initial popu-
lation of English learner students for this analysis. The number of English learner students in each subgroup is
as follows. Kindergarten cohort: eligible for school lunch program, 13,016; not eligible, 3,082. Grade 3 cohor t:
eligible for school lunch program, 6,677; not eligible, 1,091. Grade 6 cohort: eligible for school lunch program,
3,621; not eligible, 594.
Source: Authors’ analysis of studentlevel data from Arizona State Office of Education, 2006/07–2011/12.
C1
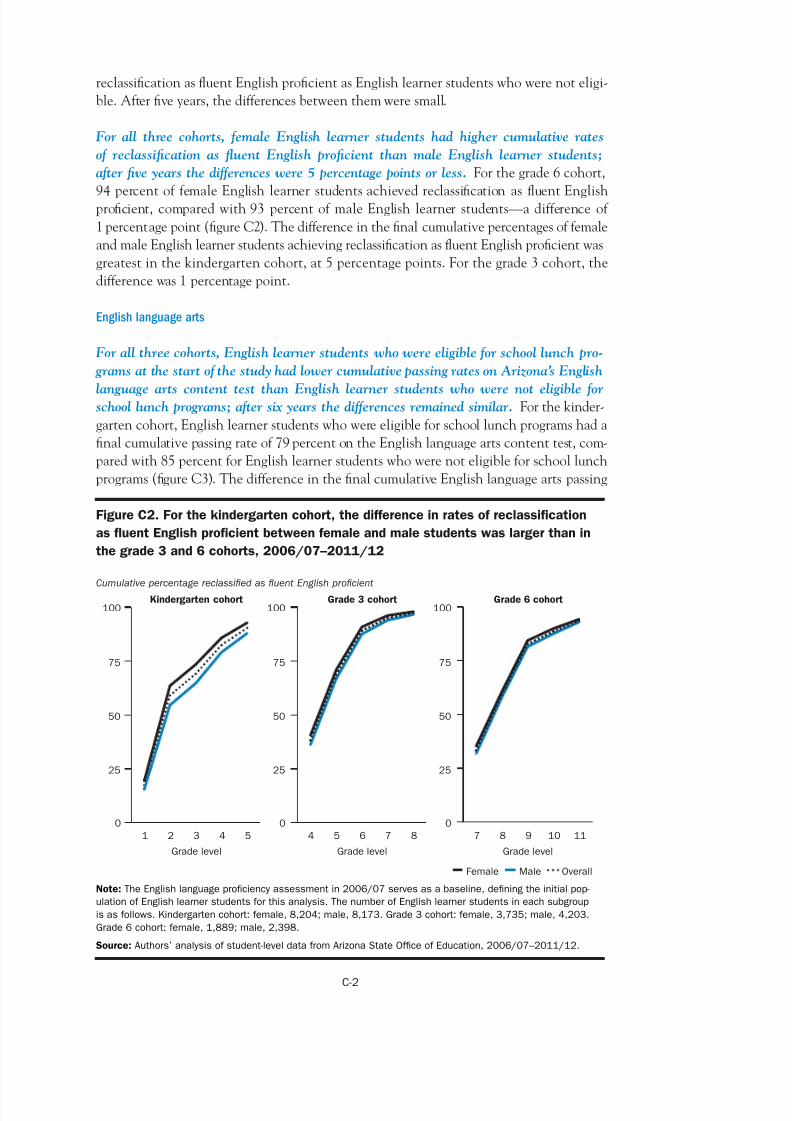
7/17/2019 The Achievement Progress of English-learner Students in Arizona
http://slidepdf.com/reader/full/the-achievement-progress-of-english-learner-students-in-arizona 42/53
reclassificationasfluentEnglishproficientasEnglishlearnerstudentswhowerenoteligi-
ble.Afterfiveyears,thedifferencesbetweenthemweresmall.
For all three cohorts, female English learner students had higher cumulative rates
of reclassification as fluent English proficient than male English learner students;
after five years the differences were 5 percentage points or less. Forthegrade6cohort,
94 percentof female Englishlearnerstudentsachieved reclassificationasfluentEnglishproficient,compared with93 percent ofmale Englishlearner students—adifferenceof
1 percentagepoint(figureC2).Thedifferenceinthefinalcumulativepercentagesoffemale
andmaleEnglishlearnerstudentsachievingreclassificationasfluentEnglishproficientwas
greatestinthekindergartencohort,at5 percentagepoints.Forthegrade3cohort,the
differencewas1 percentagepoint.
English language arts
For all three cohorts, English learner students who were eligible for school lunch pro-
grams at the start of the study had lower cumulative passing rates on Arizona’s English
language arts content test than English learner students who were not eligible forschool lunch programs; after six years the differences remained similar. Forthekinder-
gartencohort,Englishlearnerstudentswhowereeligibleforschoollunchprogramshada
finalcumulativepassingrateof79 percentontheEnglishlanguageartscontenttest,com-
paredwith85 percentforEnglishlearnerstudentswhowerenoteligibleforschoollunch
programs(figureC3).ThedifferenceinthefinalcumulativeEnglishlanguageartspassing
FigureC2.Forthekindergartencohort,thedifferenceinratesofreclassification
asfluentEnglishproficientbetweenfemaleandmalestudentswaslargerthanin
thegrade3and6cohorts,2006/07–2011/12
Cumulative percentage reclassified as fluent English proficient
100
75
50
25
0
Kindergarten cohort100
75
50
25
0
Grade 3 cohort100
75
50
25
0
Grade 6 cohort
21 3 54 54 6 87 7 8 9 10 11
Grade level Grade level Grade level
Female Male Overall
Note:TheEnglishlanguageproficiencyassessmentin2006/07servesasabaseline,definingtheinitialpop-
ulationofEnglishlearnerstudentsforthisanalysis.ThenumberofEnglishlearnerstudentsineachsubgroup
isasfollows.Kindergartencohort:female,8,204;male,8,173.Grade3cohort:female,3,735;male,4,203.
Grade6cohort:female,1,889;male,2,398.
Source:Authors’analysisofstudentleveldatafromArizonaStateOfficeofEducation,2006/07–2011/12.
C2
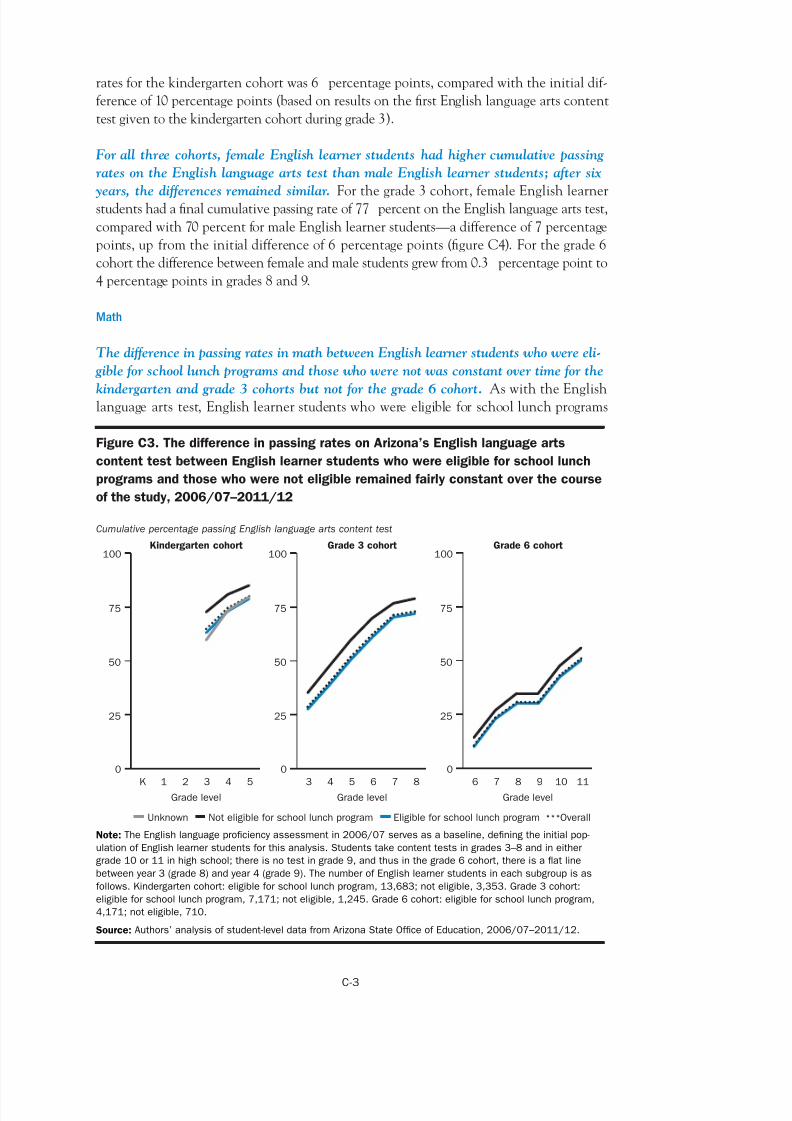
7/17/2019 The Achievement Progress of English-learner Students in Arizona
http://slidepdf.com/reader/full/the-achievement-progress-of-english-learner-students-in-arizona 43/53
ratesforthekindergartencohortwas6 percentagepoints,comparedwiththeinitialdif-
ferenceof10 percentagepoints(basedonresultsonthefirstEnglishlanguageartscontent
testgiventothekindergartencohortduringgrade3).
For all three cohorts, female English learner students had higher cumulative passing
rates on the English language arts test than male English learner students; after six
years, the differences remained similar. Forthegrade3cohort,femaleEnglishlearnerstudentshadafinalcumulativepassingrateof77 percentontheEnglishlanguageartstest,
comparedwith70 percentformaleEnglishlearnerstudents—adifferenceof7 percentage
points,upfromtheinitialdifferenceof6 percentagepoints(figureC4).Forthegrade6
cohortthedifferencebetweenfemaleandmalestudentsgrewfrom0.3 percentagepointto
4 percentagepointsingrades8and9.
Math
The difference in passing rates in math between English learner students who were eli-
gible for school lunch programs and those who were not was constant over time for the
kindergarten and grade 3 cohorts but not for the grade 6 cohort. AswiththeEnglishlanguageartstest,Englishlearnerstudentswhowereeligible forschoollunchprograms
FigureC3.ThedifferenceinpassingratesonArizona’sEnglishlanguagearts
contenttestbetweenEnglishlearnerstudentswhowereeligibleforschoollunch
programsandthosewhowerenoteligibleremainedfairlyconstantoverthecourse
ofthestudy,2006/07–2011/12
Cumulative percentage passing English language arts content test
100
75
50
25
0
Kindergarten cohort100
75
50
25
0
Grade 3 cohort100
75
50
25
0
Grade 6 cohort
K 1 2 3 4 5 3 4 5 6 7 8 6 7 8 9 10 11Grade level Grade level Grade level
Unknown Not eligible for school lunch program Eligible for school lunch program Overall
Note:TheEnglishlanguageproficiencyassessmentin2006/07servesasabaseline,definingtheinitialpop-
ulationofEnglishlearnerstudentsforthisanalysis.Studentstakecontenttestsingrades3–8andineither
grade10or11inhighschool;thereisnotestingrade9,andthusinthegrade6cohort,thereisaflatline
betweenyear3(grade8)andyear4(grade9).ThenumberofEnglishlearnerstudentsineachsubgroupisas
follows.Kindergartencohort:eligibleforschoollunchprogram,13,683;noteligible,3,353.Grade3cohort:
eligibleforschoollunchprogram,7,171;noteligible,1,245.Grade6cohort:eligibleforschoollunchprogram,
4,171;noteligible,710.
Source:Authors’analysisofstudentleveldatafromArizonaStateOfficeofEducation,2006/07–2011/12.
C3
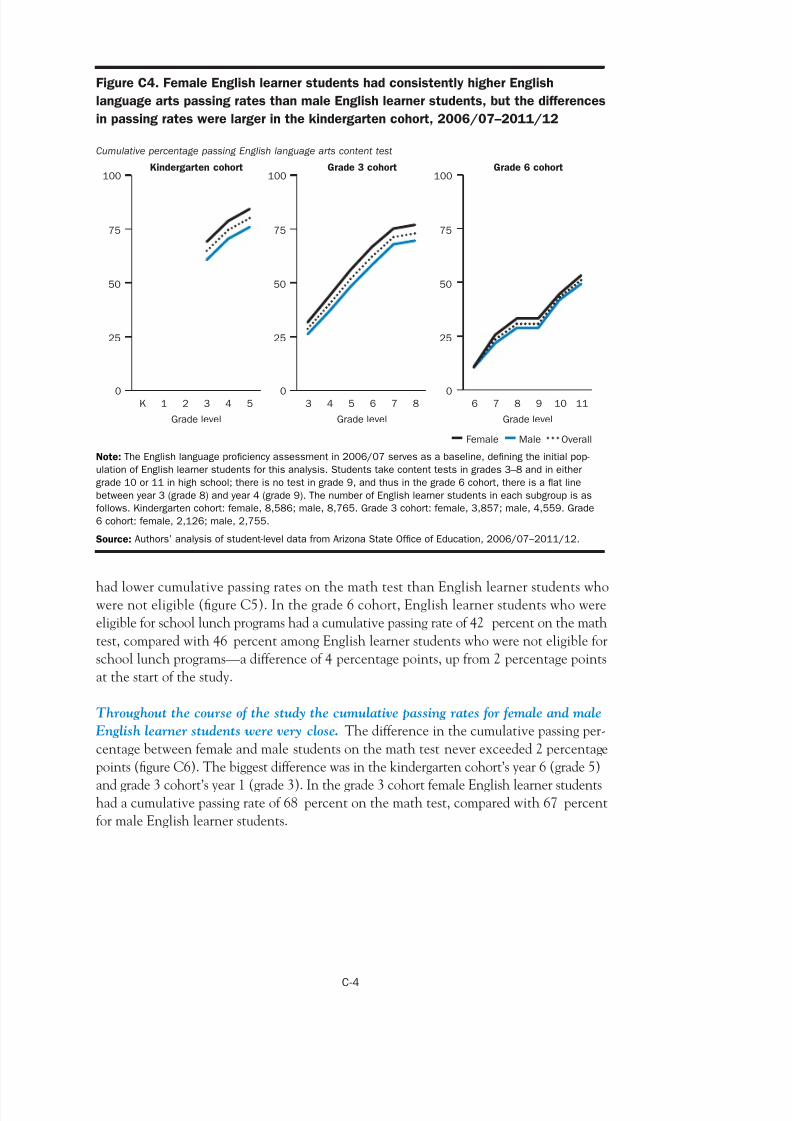
7/17/2019 The Achievement Progress of English-learner Students in Arizona
http://slidepdf.com/reader/full/the-achievement-progress-of-english-learner-students-in-arizona 44/53
FigureC4.FemaleEnglishlearnerstudentshadconsistentlyhigherEnglish
languageartspassingratesthanmaleEnglishlearnerstudents,butthedifferences
inpassingrateswerelargerinthekindergartencohort,2006/07–2011/12
Cumulative percentage passing English language arts content test
100
75
50
25
0
Kindergarten cohort100
75
50
25
0
Grade 3 cohort100
75
50
25
0
Grade 6 cohort
K 1 2 3 4 5 3 4 5 6 7 8 6 7 8 9 10 11
Grade level Grade level Grade level
Female Male Overall
Note:TheEnglishlanguageproficiencyassessmentin2006/07servesasabaseline,definingtheinitialpop-
ulationofEnglishlearnerstudentsforthisanalysis.Studentstakecontenttestsingrades3–8andineither
grade10or11inhighschool;thereisnotestingrade9,andthusinthegrade6cohort,thereisaflatline
betweenyear3(grade8)andyear4(grade9).ThenumberofEnglishlearnerstudentsineachsubgroupisas
follows.Kindergartencohort:female,8,586;male,8,765.Grade3cohort:female,3,857;male,4,559.Grade
6cohort:female,2,126;male,2,755.
Source:Authors’analysisofstudentleveldatafromArizonaStateOfficeofEducation,2006/07–2011/12.
hadlowercumulativepassingratesonthemathtestthanEnglishlearnerstudentswhowerenoteligible(figureC5).Inthegrade6cohort,Englishlearnerstudentswhowere
eligibleforschoollunchprogramshadacumulativepassingrateof42 percentonthemath
test,comparedwith46 percentamongEnglishlearnerstudentswhowerenoteligiblefor
schoollunchprograms—adifferenceof4 percentagepoints,upfrom2 percentagepoints
atthestartofthestudy.
Throughout the course of the study the cumulative passing rates for female and male
English learner students were very close. Thedifferenceinthecumulativepassingper-
centagebetweenfemaleandmalestudentsonthemathtestneverexceeded2 percentage
points(figureC6).Thebiggestdifferencewasinthekindergartencohort’syear6(grade5)
andgrade3cohort’syear1(grade3).Inthegrade3cohortfemaleEnglishlearnerstudentshadacumulativepassingrateof68 percentonthemathtest,comparedwith67 percent
formaleEnglishlearnerstudents.
C4
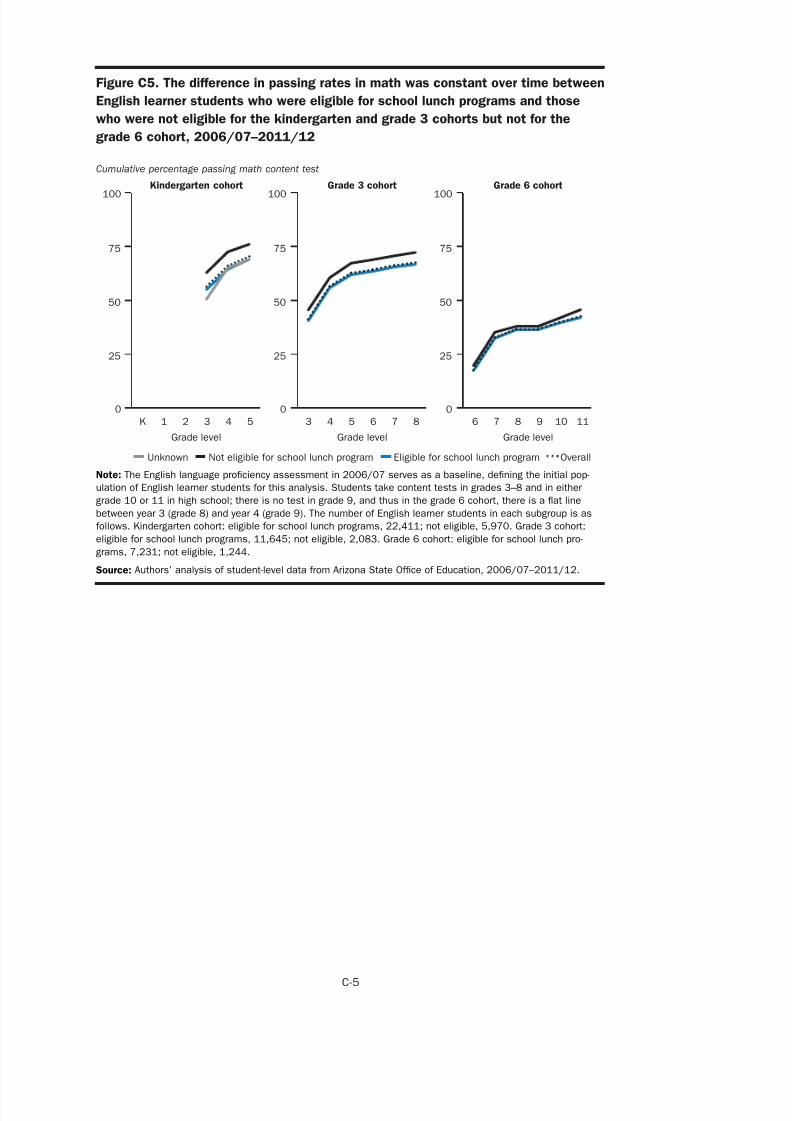
7/17/2019 The Achievement Progress of English-learner Students in Arizona
http://slidepdf.com/reader/full/the-achievement-progress-of-english-learner-students-in-arizona 45/53
FigureC5.Thedifferenceinpassingratesinmathwasconstantovertimebetween
Englishlearnerstudentswhowereeligibleforschoollunchprogramsandthose
whowerenoteligibleforthekindergartenandgrade3cohortsbutnotforthe
grade6cohort,2006/07–2011/12
Cumulative percentage passing math content test
100
75
50
25
0
Kindergarten cohort
100
75
50
25
0
K 1 2 3 4 5
Grade level
Grade 3 cohort Grade 6 cohort
100
75
50
25
0
3 4 5 6 7 8 6 7 8 9 10 11
Grade level Grade level
Unknown Not eligible for school lunch program Eligible for school lunch program Overall
Note:TheEnglishlanguageproficiencyassessmentin2006/07servesasabaseline,definingtheinitialpop-
ulationofEnglishlearnerstudentsforthisanalysis.Studentstakecontenttestsingrades3–8andineither
grade10or11inhighschool;thereisnotestingrade9,andthusinthegrade6cohort,thereisaflatline
betweenyear3(grade8)andyear4(grade9).ThenumberofEnglishlearnerstudentsineachsubgroupisas
follows.Kindergartencohort:eligibleforschoollunchprograms,22,411;noteligible,5,970.Grade3cohort:
eligibleforschoollunchprograms,11,645;noteligible,2,083.Grade6cohort:eligibleforschoollunchpro-
grams,7,231;noteligible,1,244.
Source:Authors’analysisofstudentleveldatafromArizonaStateOfficeofEducation,2006/07–2011/12.
C5
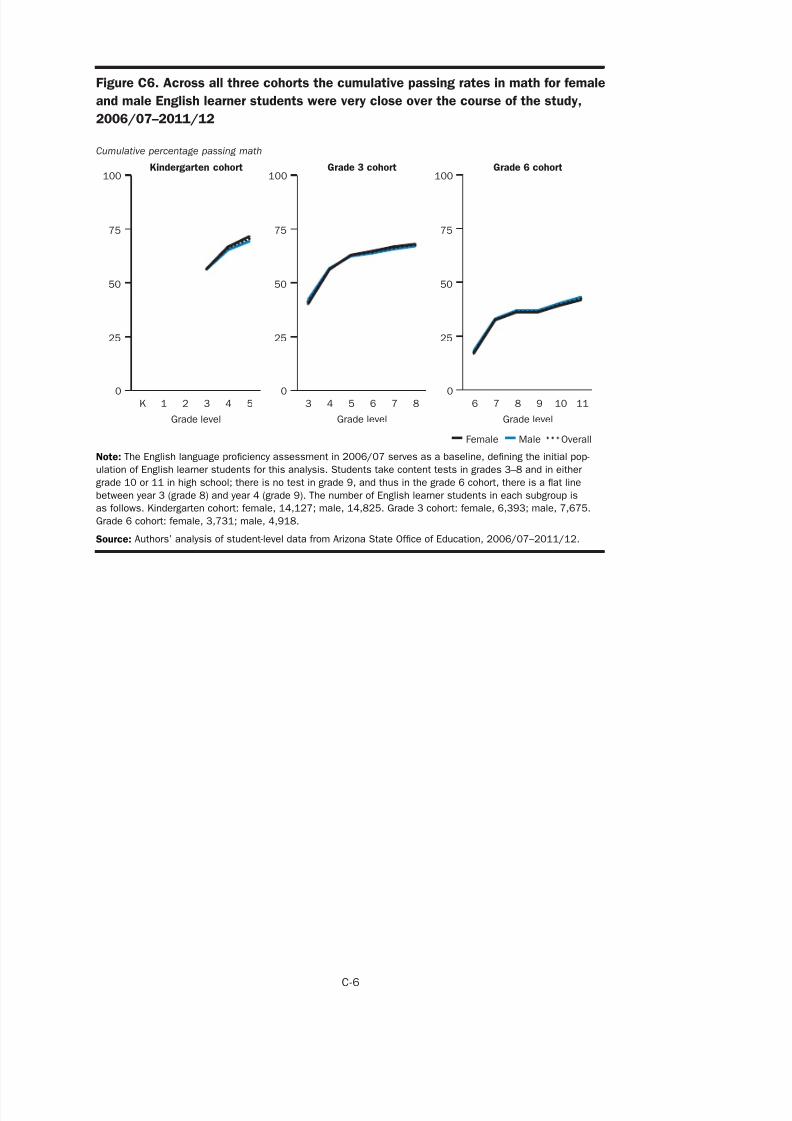
7/17/2019 The Achievement Progress of English-learner Students in Arizona
http://slidepdf.com/reader/full/the-achievement-progress-of-english-learner-students-in-arizona 46/53
FigureC6.Acrossallthreecohortsthecumulativepassingratesinmathforfemale
andmaleEnglishlearnerstudentswereverycloseoverthecourseofthestudy,
2006/07–2011/12
Cumulative percentage passing math
100
75
50
25
0
Kindergarten cohort100
75
50
25
0K 1 2 3 4 5
Grade level
Grade 3 cohort Grade 6 cohort100
75
50
25
03 4 5 6 7 8 6 7 8 9 10 11
Grade level Grade level
Female Male Overall
Note:TheEnglishlanguageproficiencyassessmentin2006/07servesasabaseline,definingtheinitialpop-
ulationofEnglishlearnerstudentsforthisanalysis.Studentstakecontenttestsingrades3–8andineither
grade10or11inhighschool;thereisnotestingrade9,andthusinthegrade6cohort,thereisaflatline
betweenyear3(grade8)andyear4(grade9).ThenumberofEnglishlearnerstudentsineachsubgroupis
asfollows.Kindergartencohort:female,14,127;male,14,825.Grade3cohort:female,6,393;male,7,675.
Grade6cohort:female,3,731;male,4,918.
Source:Authors’analysisofstudentleveldatafromArizonaStateOfficeofEducation,2006/07–2011/12.
C6
7/17/2019 The Achievement Progress of English-learner Students in Arizona
http://slidepdf.com/reader/full/the-achievement-progress-of-english-learner-students-in-arizona 47/53
Note
1. Inthis study,nostatisticaltestswereperformed. Hence, the smalldifferences that
werefoundinthisstudymaynotyieldastatisticallysignificantdifference.
Notes1
7/17/2019 The Achievement Progress of English-learner Students in Arizona
http://slidepdf.com/reader/full/the-achievement-progress-of-english-learner-students-in-arizona 48/53
References
Abedi,J.,&Lord,C.(2001).Thelanguagefactorinmathematicstests. Applied Measure-
ment in Education,14(3),219–234.http://eric.ed.gov/?id=EJ636352
ArizonaDepartmentofEducation.(2011). Arizona’s school accountability system: Technical
manual. Volume III: Title III Accountability.Phoenix,AZ:Author.RetrievedDecember19, 2013, from http://www.azed.gov/wpcontent/uploads/PDF/TitleIIIAccountability
TechnicalManual.pdf.
ArizonaDepartmentofEducation.(2012). AZTAS: Evaluation and eligibility: Process and
procedures from referral to determination of eligibility.Phoenix,AZ:Author.Retrieved
August 22, 2014, from http://www.azed.gov/specialeducation/files/2012/02/evaluation
aztas6–13–12.pdf.
Artiles,A. J., Rueda,R., Salazar, J., & Higareda, I. (2005a). Withingroup diversity in
minoritydisproportionaterepresentation:Englishlanguagelearnersinurbanschool
districts.Exceptional Children, 71(3),283–300.http://eric.ed.gov/?id=EJ696979
Artiles,A.J.,Rueda,R.,Salazar,J.,&Higareda,I.(2005b).Englishlanguagelearnerrep-
resentationinspecialeducationinCaliforniaurbanschooldistricts.InD.Losen&
G.Orfield(Eds.),Racial inequality in special education(pp.117–136).Cambridge,MA:
HarvardEducationPress.
Beal,C.R.,Adams,M.N.,&Cohen,R.C.(2010).Readingproficiencyandmathemat-
icsproblemsolvingbyhighschoolEnglishlanguagelearners.Urban Education, 45(1),
58–74.http://eric.ed.gov/?id=EJ877166
Boyle, A.,Taylor, J., Hurlburt, S.,& Soga,K. (2010). Title III accountability: Behind thenumbers: ESEA evaluation brief: The English language acquisition, language enhance-
ment, and academic achievement act.Washington,DC:U.S.DepartmentofEducation.
http://eric.ed.gov/?id=ED511982
Collier,V.P.(1989).Howlong?Asynthesisonacademicachievementinasecondlan-
guage.TESOL Quarterly, 23(3), 509–531.http://eric.ed.gov/?id=EJ396653
Collier,V.P.(1992).Asynthesisofstudiesexamininglongtermlanguageminoritystudent
dataon academic achievement.Bilingual Research Journal, 16(1&2), 187–212. http://
eric.ed.gov/?id=EJ460177
Cook,H.G.,Linquanti,R.,Chinen,M.,&Jung,H.(2012). National evaluation of Title
III implementation supplemental report: Exploring approaches to setting English language
proficiency performance criteria and monitoring English learner progress. Washington,
DC:U.S.DepartmentofEducationandAmericanInstitutesforResearch.http://eric.
ed.gov/?id=ED531979
Cook,H.G.,Wilmes,C.,Boals,T.,&Santos,M.(2008).Issues in the development of annual
measurable achievement objectives for WIDA Consortium states (WCER No. 2008–2).
Ref1
7/17/2019 The Achievement Progress of English-learner Students in Arizona
http://slidepdf.com/reader/full/the-achievement-progress-of-english-learner-students-in-arizona 49/53
NationalCenterforEducationStatisticsWorkingPaper.Madison,WI:Universityof
Wisconsin,WisconsinCenterforEducationResearch. http://eric.ed.gov/?id=ED501340
Genesee,F.,LindholmLeary,K.,Saunders,W.,&Christian,D.(2005).Englishlearnersin
U.S. schools:Anoverviewofresearchfindings. Journal of Education for Students Placed
at Risk, 10(4),363–385.http://eric.ed.gov/?id=EJ717935
Goldenberg,C.(2008).TeachingEnglishlanguagelearners:Whattheresearchdoes—and
doesnot—say. American Educator, 32(2),8–23.
Grissom, J. B. (2004). Reclassification of English learners. Education Policy Analysis
Archives, 12(36),1–38.http://eric.ed.gov/?id=EJ852317
Halle,T.,Hair,E.,Wandner,L.,McNamara,M.,&Chien,N.(2012).Predictorsandout-
comesofearlyversuslaterEnglishlanguageproficiencyamongEnglishlanguagelearn-
ers.Early Childhood Research Quarterly, 27(1),1–20.http://eric.ed.gov/?id=EJ947502
Horwitz, A. R., Uro, G., PriceBaugh, R., Simon, C., Uzzell, R., Lewis, S., & Casser-ly, M. (2009). Succeeding with English language learner students: Lessons learned from
the Great City Schools. Washington,DC:CouncilofGreatCitySchools.http://eric.
ed.gov/?id=ED508234
Kieffer,M.(2008).Catchinguporfallingbehind?InitialEnglishproficiency,concentrated
poverty,andthereadinggrowthoflanguageminoritylearnersintheUnitedStates.
Journal of Educational Psychology, 100(4),851–868.http://eric.ed.gov/?id=EJ823716
Kieffer,M.(2010).Socioeconomicstatus,Englishproficiency,andlateemergingreading
difficulties.Educational Researcher, 39(6),484–486.http://eric.ed.gov/?id=EJ901134
Kieffer,M.(2011).Convergingtrajectories:Readinggrowthinlanguageminoritylearners
andtheirclassmates,kindergartentograde8. American Educational Research Journal,
48(5),1187–1225.http://eric.ed.gov/?id=EJ939251
Kindler,A.L.(2002).Survey of the states’ limited English proficient students and available edu-
cational programs and services 2000–2001: Summary report.Washington,DC:George
WashingtonUniversity,NationalClearinghouseforEnglishLanguageAcquisition&
LanguageInstructionEducationalPrograms.
Klingner, J.K., Artiles,A.J., &Barletta, M.L. (2006). Englishlanguage learnerswho
struggle with reading:Language acquisition or LD? Journal of Learning Disabilities,39(2),108–128.http://eric.ed.gov/?id=EJ757924
Liasidou,A.(2013).Bilingualandspecialeducationalneedsininclusiveclassrooms:Some
criticalandpedagogicalconsiderations.Support for Learning, 28(1),11–16.http://eric.
ed.gov/?id=EJ1003202
Lipka, O., Siegel,L. S., & Vukovic, R. (2005). The literacy skills of English language
learnersinCanada.Learning Disabilities Research and Practice, 20(1),39–49.http://eric.
ed.gov/?id=EJ687027
Ref2
7/17/2019 The Achievement Progress of English-learner Students in Arizona
http://slidepdf.com/reader/full/the-achievement-progress-of-english-learner-students-in-arizona 50/53
Martiniello, M. (2008). Language and the performance of English language learn-
ersinmathwordproblems. Harvard Educational Review, 78(2),333–368. http://eric.
ed.gov/?id=EJ800934
Martiniello,M.(2009).Linguisticcomplexity,schematicrepresentations,anddifferential
itemfunctioningforEnglishlanguagelearnersinmathtests. Educational Assessment,
14(3&4),160–179.http://eric.ed.gov/?id=EJ870417
MassachusettsDepartmentofElementaryandSecondaryEducation.(2012).Transitioning
English language learners in Massachusetts: An exploratory data review. Malden, MA:
Author.
McCardle,P.,McCarthyMele,J.,Cutting,L.,Leos,K.,&D’Emilio,T.(2005).Learning
disabilities in English language learners: Identifying the issues. Learning Disabilities
Research and Practice, 20(1),1–5.
McGraw,R.,Lubienski,S.T.,&Strutchens,M.E.(2006).AcloserlookatgenderinNAEP
mathematicsachievementandaffectdata:Intersectionswithachievement,raceandsocioeconomicstatus. Journal for Research in Mathematics Education, 37(2),129–150.
Moschkovich,J.N.(1999).SupportingtheparticipationofEnglishlanguagelearnersin
mathematical discussions.For the Learning of Mathematics, 19(1), 11–19. http://eric.
ed.gov/?id=EJ592201
Moschkovich, J.N.(2002). Asituatedand socioculturalperspectiveonbilingualmath-
ematics learners. Mathematical Thinking and Learning, 4(2&3), 189–212. http://eric.
ed.gov/?id=EJ654518
Mulligan,G.,Halle,T.,&Kinukawa,A.(2012).Reading, mathematics, and science achieve-ment of languageminority students in grade 8. (Issuebrief,NCESNo.2012–028).Wash-
ington,DC:NationalCenterforEducationStatistics,InstituteofEducationSciences,
U.S.DepartmentofEducation. http://eric.ed.gov/?id=ED531335
Nguyen, H.T. (2012). Generaleducation and specialeducation teachers collaborate to
supportEnglishlanguagelearnerswithlearningdisabilities. Issues in Teacher Educa-
tion, 21(1),127–152.http://eric.ed.gov/?id=EJ986820
NoChildLeftBehindActof2001.(2002).Pub.L.No.107–110,115Stat,1425.
Olsen,L.(2010).Reparable harm: Fulfilling the promise of educational opportunity for Califor-nia’s long term English learners.LongBeach,CA:CaliforniansTogether.
Perie,M., Moran,R., &Lutkus,A.D.(2005). NAEP 2004 trends in academic progress:
Three decades of student performance in reading and mathematics (NCES No. 2005–
464). NationalCenterforEducationStatisticsWorkingPaper.Washington,DC:U.S.
DepartmentofEducation.http://eric.ed.gov/?id=ED485627
QualityCounts.(2009).Portraitofapopulation:HowEnglishlanguagelearnerstudents
areputtingschoolstothetest.Education Week, 28(17).http://eric.ed.gov/?id=EJ826948
Ref3
7/17/2019 The Achievement Progress of English-learner Students in Arizona
http://slidepdf.com/reader/full/the-achievement-progress-of-english-learner-students-in-arizona 51/53
Rathbun,A., & West,J.(2004). From kindergarten through third grade: Children’s begin-
ning school experiences (NCESNo. 2004–007). National Center for EducationSta-
tisticsWorkingPaper. Washington,DC:U.S.Department ofEducation.http://eric.
ed.gov/?id=ED483078
RiosAguilar,C.,GonzalezCanche,M.,&Moll,L.C.(2010). A study of Arizona’s teachers
of English language learners.LosAngeles,CA:UniversityofCalifornia–LosAngeles,The Civil Rights Project. Retrieved [date] from http://civilrightsproject.ucla.edu/
research/k12education/languageminoritystudents/astudyofarizonasteachers
ofenglishlanguagelearners/riosaguilararizonasteachersell2010.pdf
Roberts,G., & Bryant, D.(2011).Earlymathematics achievement trajectories:English
language learner and native Englishspeaker estimates, using the early childhood
longitudinal survey. Developmental Psychology, 47(4), 916–930. http://eric.ed.gov/?id=
EJ934434
Roberts,S.A.(2009).SupportingEnglishlanguagelearners’developmentofmathematical
literacy.Democracy & Education, 18(3),29–36.http://eric.ed.gov/?id=EJ856295
Robinson,J.P.,&Theule,L.S.(2011).Thedevelopmentofgenderachievementgaps in
mathematicsandreadingduringelementaryandmiddleschool:Examiningdirectcog-
nitiveassessmentsandteacherratings. American Educational Research Journal,48(2),
268–302.http://eric.ed.gov/?id=EJ921698
Rueda,R., & Windmueller, M.P. (2006). English language learners,LD, andoverrep-
resentation:A multiple levelanalysis. Journal of Learning Disabilities, 39(2),99–107.
RetrievedJune6,2012,fromhttp://eric.ed.gov/?id=EJ757902
RuizdeVelasco, J., & Fix, M. (2000). Overlooked & underserved: Immigrant studentsin U.S. secondary schools. Washington, DC: The Urban Institute. http://eric.
ed.gov/?id=ED449275
Salazar, J. J. (2007). Master Plan evaluation report for English learners—2005/2006.
Los Angeles, CA: Los Angeles Unified School District, Program Evaluation and
AssessmentBranch.
Shaftel,J.,BeltonKocher,E.,Glasnapp,D.,&Poggio,J.(2006).Theimpactoflanguage
characteristics in mathematics test items on the performance of English language
learnersandstudentswithdisabilities. Educational Assessment,11(2),105–126. http://
eric.ed.gov/?id=EJ736295
Short,D.J.,&Fitzsimmons,S.(2007). Double the work: Challenges and solutions to acquir-
ing language and academic literacy for adolescent English language learners.NewYork,
NY:CarnegieCorporation.
Sullivan, A.L. (2011). Disproportionality in specialeducation identification and place-
ment of English language learners. Exceptional Children, 77(3), 317–34. http://eric.
ed.gov/?id=EJ918896
Ref4
7/17/2019 The Achievement Progress of English-learner Students in Arizona
http://slidepdf.com/reader/full/the-achievement-progress-of-english-learner-students-in-arizona 52/53
Sullivan,A.L.,&Bal,A.(2013).Disproportionalityinspecialeducation:Effectsof indi-
vidual and schoolvariables on disability risk. Exceptional Children, 79(4), 475–494.
http://eric.ed.gov/?id=EJ1016833
Zehler,A.M.,Fleischman,H.L.,Hopstock,P.J.,Pendzick,M.L.,&Stephenson,T.G.
(2003). Descriptive study of services to LEP students and LEP students with disabilities:
Special topic report #4(ReportsubmittedtoU.S.DepartmentofEducation,OfficeofEnglishLanguageAcquisition,LanguageEnhancement,andAcademicAchievement
of Limited English Proficient Students). Arlington, VA: Development Associates.
RetrievedJuly12,2012,fromhttp://www.ncela.us/files/rcd/BE021199/special_ed4.pdf.
Zehler,A.M.,Fleischman,H.L.,Hopstock,P.J.,Stephenson,T.G.,Pendzick,M.L.,&
Sapru,S.(2003). Policy report: Summary of findings related to LEP and SpEdLEP stu-
dents (ReportsubmittedtoU.S.DepartmentofEducation,OfficeofEnglishLanguage
Acquisition,LanguageEnhancement,andAcademicAchievementofLimitedEnglish
ProficientStudents).Arlington,VA:DevelopmentAssociates.RetrievedMay31,2012,
fromhttp://www.ncela.us/files/rcd/BE021195/policy_report.pdf .
Ref5
7/17/2019 The Achievement Progress of English-learner Students in Arizona
http://slidepdf.com/reader/full/the-achievement-progress-of-english-learner-students-in-arizona 53/53
The Regional Educational Laboratory Program produces 7 types of reports
Making Connections
Studiesofcorrelationalrelationships
Making an Impact
Studiesofcauseandeffect
What’s HappeningDescriptionsofpolicies,programs,implementationstatus,ordatatrends
What’s Known
Summariesofpreviousresearch
Stated Briefly
Summariesofresearchfindingsforspecificaudiences
Applied Research Methods
Researchmethodsforeducationalsettings