Embed Size (px)
Citation preview

51 01 -283 F ! a?- P! a!e Solar Array Project
( N A S A - C R - 176661) THE A G I B G C C B P E L B T I O N (RH h86-2 1980 + t): B E L A T I V E H U H I D X ' I Y [ F ) + I E F P E H A T U B E (DEG C) [Jet E r o p u l s i c n L a b . ) 22 p HC A02/HF Ad1 C S C L 10A Unclas
DOEIJPL-1012-121 Distribution Category UC-63b
The Aging Correlation (RH + t): I I
I Relative Humidity (%) + I Temperature ("C)
I E.F. Cuddihy
January 15, 1986
Prepared for U.S. Department of Energy Through an Agreement with National Aeronautics and Space Administration
Jet Propulsion Laboratory California Institute of Technology Pasadena, California
by
JPL Publication 86-7

5101 -283 Flat-Plate Solar Array Project
DOEIJPL-1012-121 Distribution Category UC-63b
The Aging Correlation (RH + t): Relative Humidity (%) + Temperature ("C) E.F. Cuddihy
January 15, 1986
Prepared for U.S. Department of Energy Through an Agreement with National Aeronautics and Space Administration
by Jet Propulsion Laboratory California Institute of Technology Pasadena. California
JPL Publication 86-7

Prepared by the Jet Propulsion Laboratory, California Institute of Technology, for the U.S. Department of Energy through an agreement with the National Aeronautics and Space Administration.
The JPL Flat-Plate Solar Array Project is sponsored by the U.S. Department of Energy and is part of the National Photovoltaics Program to initiate a major effort toward the development of cost-competitive solar arrays.
This report was prepared as an account of work sponsored by an agency of the United States Government. Neither the United States Government nor any agency thereof, nor any of their employees, makes any warranty, express or implied, o r assumes any legal liability or responsibility for the accuracy, com- pleteness, or usefulness of any information, apparatus, product, or process disclosed, or represents that its use would not infringe privately owned rights.
Reference herein to any specific commercial product, process, or service by trade name, trademark, manufacturer, o r otherwise, does not necessarily constitute or imply its endorsement, recommendation, or favoring by the United States Government or any agency thereof. The views and opinions of authors expressed herein do not necessarily state or reflect those of the United States Government or any agency thereof.
1 This document reports on work done under NASA Task RE-152, Amendment 419, DOE/NASA IAA NO. DE-Ai01 -85CE89008.

ABSTRACT
An aging correlation between corrosion lifetime, and relative humidity RH(%) and temperature t(OC) has been reported in the literature. This aging correlation is a semi-log plot of corrosion lifetime on the log scale versus the interesting summation term {RH(%) + t(OC)} on the linear scale. This empirical correlation was derived from observation of experimental data trends and has been referred t o as an experimental law.
Using electrical resistivity data of polyvinyl butyral (PVB) measured as a function of relative humidity and temperature, it was found that the electrical resistivity could be expressed as a function of the term {RH(%) + t(OC)}. Thus, if corrosion is related to leakage current through an organic insulator, which, in turn, is a function of RH and t, then some partial theoretical validity for the correlation is indicated. This article describes the derivation of the term {RH(%) + t(OC)} from PVB electrical resistivity data.
iii

ACKNOWLEDGMENT
The author acknowledges Professor John Orehotsky for obtaining the original polyvinyl butyral resistivity data, with the aid of Senior Engineering Assistant Elizabeth Jetter and technicians Scott Leland and Otto Witte.

CONTENTS
I. INTRODUCTION........... . . . . . . . . . . . . . . . . 1-1
I 11. DERIVATION..
I A. THE {RH(%) + t ( W } OBSERVATION . . . . . . . . . . . . . . 2-1 . . . . . . . . . . . . . . . . . . . . . . . . . . 2-1
I B. HYGROSCOPIC PROPERTIES . . . . . . . . . . . . . . . . . . . 2-2 c . THE {RH(%) + tpc)} DERIVATION . . . . . . . . . . . . . . . 2-7 I
III. ANALYSES. . . . . . . . . . . . . . . . . . . . . . . . . . . . . 3-1 t
A. DATA ANALYSIS . . . . . . . . . . . . . . . . . . . . . . . 3-1 ~
, B. LEAST-SQUARES ANALYSIS . . . . . . . . . . . . . . . . . . .
IV. SUMMARY I I . . . . . . . . . . . . . . . . . . . . . . . . . . . . .
v. REFERENCES . . . . . . . . . . . . . . . . . . . . . . . . . . . .
Figures
! 2-1. Electrical Resistivity of PVB as a Function of
Relative Humidity . . . . . . . . . . . . . . . . . . . . . . 2-2. Electrical Resistivity of PVB as a Function of
the Variable (RH + t) . . . . . . . . . . . . . . . . . . . I 2-3. Generalized Hygroscopic Behavior of Polymeric Materials . .
2-4. Electrical Conductivity Ratio for PVB as a Function of Atmospheric Water Vapor Pressure . . . . . . . . . . . .
2-5. Electrical Resistivity of PVB Versus Atmospheric Water Vapor Pressure (Absolute Humidity) . . . . . . . . . .
Tables
3-1. Electrical Resistivity of PVB Versus the Variable (1.414 t + RH) . . . . . . . . . . . . . . . . . . . . . . .
2-1. Electrical Resistivity of PVB at Various Temperatures and Relative Humidities . . . . . . . . . . . . . . . . . .
2-2. Saturation Vapor Pressure, Vp, of Water at 30, 40 , and 5OoC . . . . . . . . . . . . . . . . . . . . . . . . . .
3-2
4-1
5-1
2-3
2-4
2-5
2-8
2-9
3-3
2-2
2-6
V

SECTION I
INTRODUCTION
The Jet Propulsion Laboratory (JPL) manages the Flat-Plate Solar Array (FSA) Froject for the C.S. Department of Energy (EOE), having as a mjor goal the development of technologies related to achieving highly reliable and long-life photovoltaic (PV) modules for outdoor service. Accordingly, the project supports activities related to understanding fundamental mechanisms of degradation and aging, topics of which are reported on in References 1 and 2. An understanding of fundamental aging mechanisms should permit a rational basis for evolving aging models and, therefore, for generating relevant predictive mathematical expressions for assessing the outdoor service life of a photovoltaic module.
Occasionally, however, experimental aging studies chance on an empirically derived mathematical aging correlation, an experimental law, which seems to work, but which is apparently without any fundamental or theoretical support. Such a mathematical aging correlation has been reported by Desombre (Reference 31 , who noted that the rate of corrosion is logarithmically related to the summation term, RH + t, where RH is relative humidity in percent, and "t" is temperature in degrees Centigrade. Thus, an accelerated aging experiment could be carried out at high levels of relative humidity and temperature, and from a semi-log plot of the experimentally measured corrosion lifetimes versus the variable term, RH + t, an estimate of corrosion lifetimes at lower levels of RH and t could be made by linear extrapolation.
The Reliability and Engineering Sciences Branch of the FSA Project is actively investigating electrochemical corrosion phenomena in encapsulated PV modules (References 4 , 5, 6 , 7 ) , including accelerated aging from exposure to high levels of relative humidity and temperatures. The (RH + t) aging correlation could be used for lifetime predictions related to electrochemical corrosion in photovoltaic modules. As part of the corrosion studies, the electrical resistivity of polyvinyl butyral (PVB) was measured as a function of relative humidity and temperature. An effort to estimate the electrical resistivity of PVB at 0% RH resulted in an observation which enabled a theoretical derivation of the variable term, RH + t. The derivation is described in this project report.
1-1

SECTION I1
DERIVATION
A. THE {RH(%) + t(OC)} OBSERVATION
Electrical resistivity of PVB as a function of relative humidity and temperature is given in Table 2-1. These data were measured by Professor John Orehotsky of Wilkes-Barre College under FSA Contract 956766. The resistivity data are plotted in Figure 2-1 as log resistivity p versus relative humidity (RH) in percent, for the three temperature levels 30, 40, and 50OC. The intent was to estimate the resistivity of PVB at 0% RH by linear extrapolation, the estimated values of which are shown as black dots in Figure 2-1, and which are as follows:
t, oc p(t,o), ohm-cm
30 5.8 * 1O1O 40 3 . 3 * 1010 50 1.8 * 1O1O
These values of resistivity at 0% RH obey an Arrhenius relationship
where by least-squares po = 453.05 ohm-cm and AH = 11.243 kcal/mole. Equation (l), R is the gas constant having a value of 1.987 cal/mole-K, and T = t + 273 K.
In
However, it was observed for these semi-log plots that not only were the data traces basically straight lines, but that they were also essentially parallel, and separated horizontally on the RH axis by a RH difference in percent almost numerically equal to the difference in temperature in degrees Celcius. It was evident that the three data lines could be shifted horizontally to merge into a single, and common master line, using as a new variable on the abscissa, RH(%) + t(OC). log p versus {RH(%) + t(OC)}, yielding essentially a common data line as shown in Figure 2-2. This interesting observation suggests that, perhaps, corrosion, as correlated with the variable term, RH(%) + t(OC), may be related to leakage currents through insulation materials whose resistivity (or conductivity), in turn, are related to the variable term. It then became of interest to determine if there was some fundamental basis for this observation, and the approach taken was to assume that this behavior derived, in part, from mathematical relationships associated with atmospheric water vapor absorption as a function of relative humidity and temperature.
Therefore, the resistivity data were again replotted as
2-1

Table 2-1. Electrical Resistivity of PVB at Various Temperatures and Relative Humidities*
RH, Relative t, Temp p , Resistivity, Data Humidity, % OC ohm-cm Symbol
100
85
80
54
30
40
50
50
30
40
50
30
40
50
2. 53*108
9.86*10
4.44*107
8 .86*107
6. 24*108
2. 60*108
1. 35*108
3 .02*109
1.51*109
7 .07*108
6 0-
Q v A
4 b
P *Experimental data measured by Professor John Orehotsky under JPL/DOE FSA Contract 956766.
B. HYGROSCOPIC PROPERTIES
From Figure 2-1, the electrical resistivity of PVB is clearly related to relative humidity, which alternately suggests that the electrical resistivity is related to the concentration of absorbed water vapor in the PVB. Absorption of atmospheric water vapor by polymers is a hygroscopic property which typically behaves as schematically illustrated in Figure 2-3. At any constant temperature, the absorbed water vapor content in a polymer increases with absolute water vapor concentration, V, in the atmosphere, here expressed as a pressure in units of mm Hg, and W is the absorbed water vapor content. The connective relationship between W and V, assuming linearity, is
W(t,V) = K(t)V ( 2 )
2-2

E
E Y -r 0 . P
-1 w
RH, RELATIVE HUMIDITY, %
Figure 2-1. Electrical Resistivity of PVB as a Function of Relative Humidity
2-3

I I I I I 80 1 00 120 140 160
(RH f t), RELATIVE HUMIDITY (%) + TEMPERATURE (“c)
Figure 2-2. Elec Func
trical Resistivity of PVB as a tion of the Variable (RH + t)
2-4

. oi
cd q 0 3lL
O Z % - 5 2 z 5 W W
- 0 3 V
V, ATMOSPHERIC WATER VAPOR PRESSURE, mmHg
0
SATURATION WATER VAPOR PRESSURE (V ) AT
INDICATED TEMPERATURES t (100% RH) P
Figure 2-3. Generalized Hygroscopic Behavior of Polymeric Materials
where t is temperature W(t,V) is the absorbed water vapor content at temperature t and atmospheric water vapor concentration V and K(t) is the absorption isotherm, the slope of the line.
The temperature-dependence of K(t) is generally Arrhenius,
2-5

where T is absolute temperature (K), E1 is the activation energy for water vapor absorption, in units of cal/mole (or kcal/mole), and R is equal to 1.987 cal/mole-K. (Note in Figure 2-3 that for constant V, the absorbed water vapor content of hygroscopic materials decreases with increasing temperature t
At any given air temperature, the concentration of water vapor in the atmosphere cannot exceed a saturation limit, called the saturation vapor pressure, Vp. Vp is a function of temperature and obeys the exponential function I
V (t) = V exp P 0 ( 4 )
Values of V (in mm Hg) for the nominal temperatures 3 0 , 40, and 5OoC are given in Tagle 2-2 , and by least squares, Vo = 1.031 * lo9 mm Hg and E2 = 10.41 kcal/mole.
Because, at constant air temperature t, V cannot exceed Vp(t>, the absorption lines for any constant temperature t shown i n Figure 2-3 stop at the value of V equal to Vp(t).
Relative humidity for any temperature t is the ratio of V to Vp, or more formally defined as
RH(t) = ~ x 100 (in percentage) VP(t)
Table 2-2. Saturation Vapor Pressure, Vp, of Water at 3 0 , 40, and 5OoC
Temperatures Saturation Vapor Pressure
30 30 3 40 313 50 323
31.824 55 .324 92.51
2 -6

I C . THE (RH(z) + t(GC)) DERIVATION
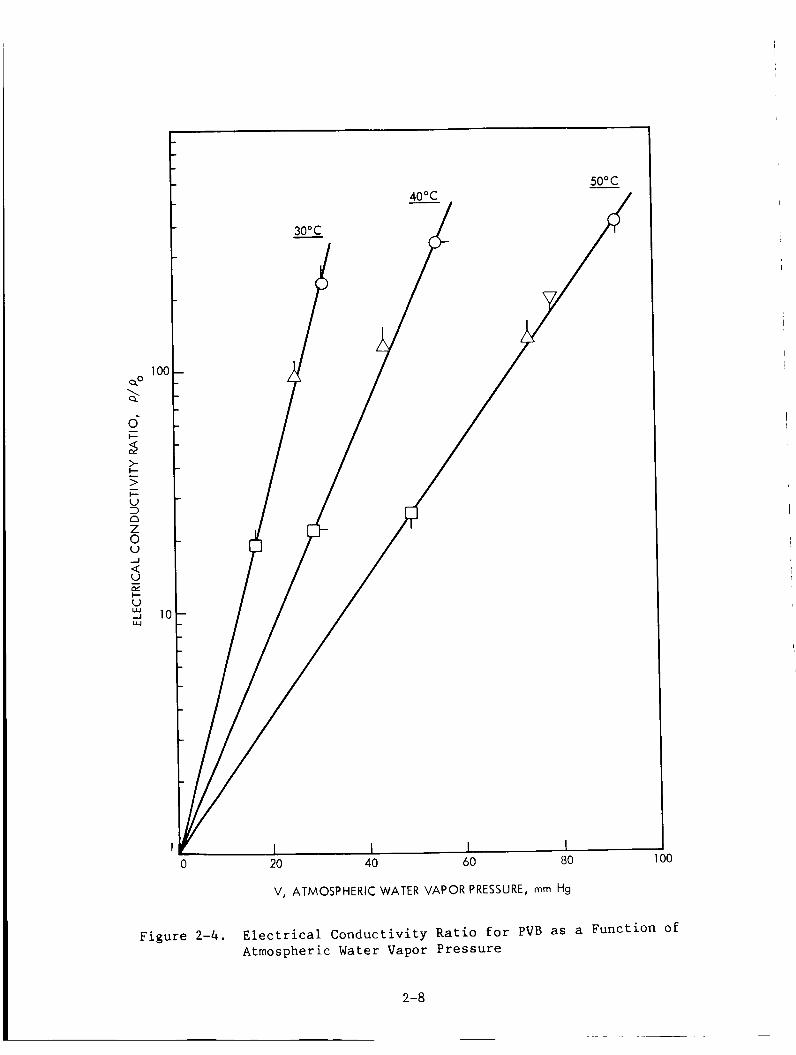
The hygroscopic character of the PVB electrical resistivity data are illustrated in Figure 2-4. Here, electrical conductivity, 0, is used rather than electrical resistivity in order to generate a plotting format similar to that of Figure 2-3. in addition, t he electrical conductivity data are normalized, using the values of conductivity, a. (actually, resistivity), which were estimated in Figure 2-1 at 0% RH. V, the atmospheric water vapor pressure in units of nun Hg, were derived using Equation (51, and the values of RH in Table 2-1 and the values of Vp given in Table 2-2.
I
i
Note that the electrical conductivity increases with increasing V, I
presumably as a result of an increasing absorbed-water content in the PVB. But also note that, with increasing temperature, the conductivity increases more slowly with increasing V, similarly as shown in Figure 2-3.
I I f it can be assumed that the slopes of these data lines in Figure 2-4 are related to the absorption isotherm K(t), then an estimate of El, the activation energy for water vapor absorption in PVB can be made. So doing, a value of E1 = 9 .23 kcal/mole can be calculated.
,
I I
I To derive the variable term {RH(%) + t(OC)}, it is convenient to begin
by plotting the resistivity data given in Table 2-1 versus V, the absolute I water vapor concentration in units of nun Hg. These data plots are shown in I Figure 2-5. Note that the slopes of the data lines in Figure 2-5 decrease
i with increasing temperature, reflecting the hygroscopic behavior that, at constant V, less water vapor is absorbed with increasing t.
The data lines of Figure 2-5 can be described by the following exponential expression
p(t,V) = p(t,O) exp {s(t)v} ( 6 1 i
where S(t) is the slope of each constant temperature line. Note that the i exponential term S(t)V, is similar in form to Equation ( 2 ) , K(t)V.
Values of S(t) were generated from least-squares of the data lines in ~ Figure 2-5 , as follows:
30 40 50
1.70 x 10-I 1.08 x 10⁻¹ 6 . 6 2 x
l and these values were found to obey an Arrhenius relationship I i
( 7 )
2- 7
I
V, ATMOSPHERIC WATER VAPOR PRESSURE, mm Hg
Figure 2 - 4 . Electrical Conductivity Ratio for PVB as a Function of Atmospheric Water Vapor Pressure
2-a
1

I
I
V, ATM. WATER VAPOR PRESSURE, rnrnHg
Figure 2-5. Electrical Resistivity of PVB versus Atmospheric Water Vapor Pressure (Absolute Humidity)
2-9

where, by least squares, So = 3.78 * 1 0 8 (mm Hg1-I and E1 = 9 . 2 3 kcal/mole. Because Figures 2-4 and 2-5 are the Same data plotted in two different ways, the slopes of the data lines must yield the same value of El. The purpose of Figure 2-4 was to more dramatically illustrate the hygroscopic character of the resistivity data, and to suggest that the activation energy value of 9.23 kcal/mole derived from these data may be the activation energy for water vapor absorption in PVB; hence, the use of E1 as the symbol for this activation energy. Nevertheless, the derivation of the variable term, RH(%) + t(OC), is independent of this assignment.
Equations (1) and ( 6 ) can now be combined to form the following expression
which can be rewritten as
( 9 ) AH In p(t,V) = In po + fi - S(t) V
Equations ( 4 ) and (5) can be combined to yield the following expression which connects V and RH(%),
* (RH) vO V = - * exp 100
and, then, this Equation (10) and Equation - ( 7 ) - can be substituted into Equation ( 9 ) to yield an expression for p as a function of t and RH(%). doing this, p(t,V) becomes p(t,RH), and it must be remembered that T = t + 2 7 3 . The resultant expression is
In
r1 ;."zi (RH) AH '0'0 In p(t,RH) = In p, + - - - RT 100
In Equation (11), it is noted that RH is present as a numerator term; therefore, the next step is to introduce t into this expression also as a numerator term. This can be done by a Taylor's expansion where T is replaced by its definition, t + 2 7 3 . Defining following series can be generated
1
2 t t +3-
AH RT - R
0
For t in the order of 30 to 50OC, all terms t2 and higher with small error and, thus, AH/RT can be approximated as
of the term, AH/RT, To = 2 7 3 , the
. . .I can be ignored
2-10

I t Substituting Equation (13) into Equation (11) yields the expression
In p(t,RH) = l n p o + - - AH - AH 2 t - - 100 exp tE1 iTE2t (RH) RTo RTo
having t and RH as numerator terms.
2-1 1

SECTION I11
ANALYSES
A. DATA ANALYSIS
For convenience, Equation (14) can be simplified by defining the I following:
A = In po + AH/RTo, all constants
AH k = -, a constant 1 R T ~ ~
k = - exp PI iTE2], a function of T 2 100
Therefore, Equation (14) becomes
I In p(t,RH) = A - klt - k2(RH) (15 1
The term k2 is a function of T, and all the constants, S o , Vo, E1 and E2, have been derived.
I Therefore, k2 at 30, 40, and 50OC can be calculated, and are I as follows:
/I
30 40 50
30 3 0.0548 313 0.0584 323 0.0619
I Over this temperature range, k2 is practically a constant, having an average value of 0.0584.
The term kl can also be calculated, as AH has been derived I (11.243 kcal/mole), and To is equal to 273, hence
k = 11,243 = 0.0759 (1.987) (27312
Thus, it is observed that kl and k2 are numerically very close when t is in degrees Celcius, and RH is in percent; therefore, if treated as essentially equal, that is, kl = k2 = k, Equation (15) becomes, simply,
~
I
In p(t,RH) = A - k(t + RH) (16)
3-1

which corresponds to the empirical aging correlation reported by Desombre (Reference 3 ) . This equation relates electrical resistivity, or equally electrical conductivity, to relative humidity and temperature. If corrosion is related to the leakage current through an organic insulator such as PVB, and if corrosion lifetime is monitored by some end-point which is related to a finite but fixed quantity of coulombs transferred, then Equation (16) would be experimentally associated with the correlation between corrosion lifetimes and relative humidity and temperature.
B . LEAST-SQUARES ANALYSIS
Earlier, AH was derived by a long, linear extrapolation of the data curves in Figure 2-1. any extrapolation. the data in Table 2-1, a least-squares analysis for Equation (15) can be carried out to generate A , .kl, and k2. So doing, the following values are generated:
Equation (15) permits a direct estimation of AH without To do this, k2 is considered to be a constant and given
A = 25.9468
kl = 0.08033
k2 = 0.0568
Therefore, AH can be calculated using the expression for kl,
AH = R k T = 11.896 kcal/mole 1 0
which agrees well with the value of AH = 11.243 kcal/mole derived from linear extrapolation.
Because direct least-squares analyses also show that kl and k 2 are not exact, Equation (15) can be rewritten as
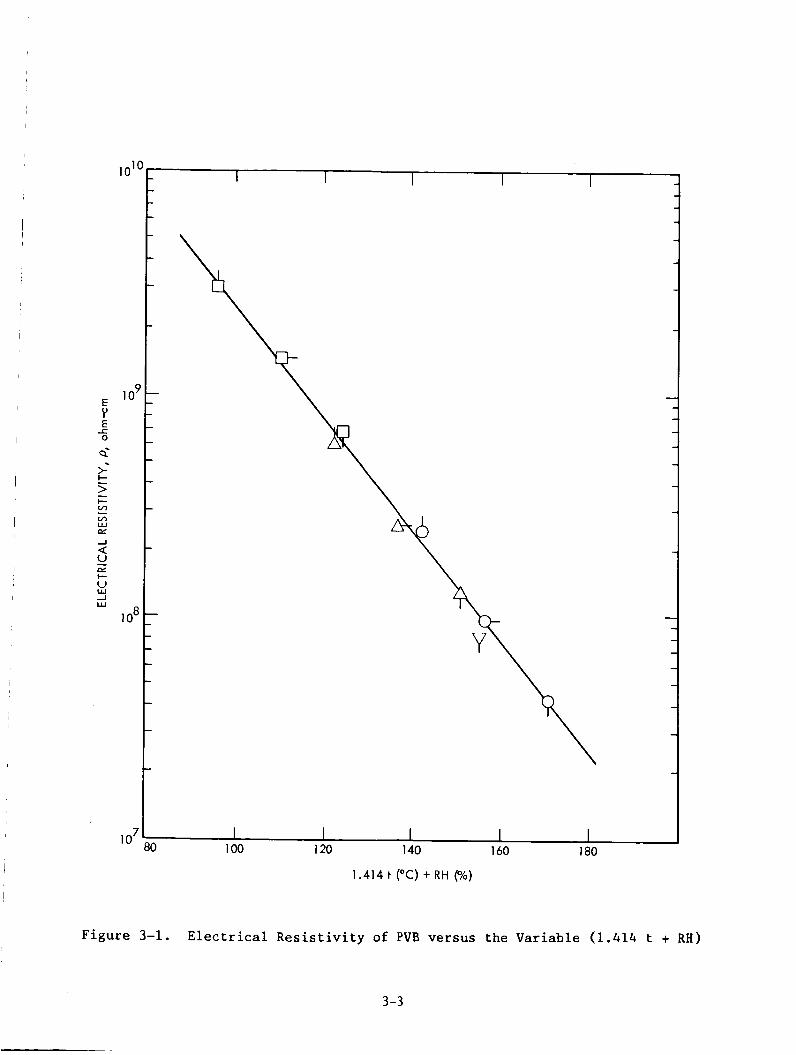
where arbitrarily k2 has been factored out. better fit of data superposition will occur when In p (or log p ) is plotted against the correlation variable, (kl/k2)t + RH, with t in degrees Celcius and RH in percentage. Using the above least-squared values for k l and k2, the ratio of kl and k2 is equal to 1.414.
Equation ( 1 7 ) states that a
Figure 3-1 is a plot of log p versus (1.414 t + RH} f o r the resistivity data given in Table 2-1. Data superposition is excellent.
3-2
l o l o t
I I I I 100 120 140 160 180
1.414 t (“C) + RH (%)
Figure 3-1. Electrical Resistivity of PVB versus the Variable (1.414 t + RH)
3-3
I SECTION I V
SUMMARY
I An aging correlation between corrosion lifetimes and both relative
This correlation involves a semi-log plot of the corrosion lifetime plotted on the log scale versus the summation term {RH(%) + t(OC)} which is plotted on the linear scale. This correlation permits estimations of corrosion lifetimes at lower or ambient conditions of relative humidity and temperature, from accelerated corrosion aging studies carried out at higher levels of
I humidity RH ( X ) and temperature t ( O C ) has been reported in the literature. I I
I
I I relative humidity and temperatures.
! This article attempts to demonstrate that this empirical observation has some theoretical validity, deriving from the dependence of the electrical resistivity of organic insulators as a function of this summation term {RH(%) + t(0C)).
related to this summation term.
Thus, electrochemical corrosion related to leakage I currents through electrical insulation materials could be expected to be also
I
4-1

SECTION V
REFERENCES
1.
2.
3.
4.
5.
6.
7.
Proceedings of T'nin-Film Photovoltaic Modules, chaired by R.G. Koss and E.L. Royai, DOE/JPL Document 1012-111, JPL Publication 85-73, Jet Propulsion Laboratory, Pasadena, California, October 1, 1985.
he FSA Research Forum on Reliability an Engineering of
Proceedings of the FSA Research Forum on Quantifying Degradation, chaired by E.F. Cuddihy, DOE/JPL Document 1012-89, JPL Publication 83-52, Jet Propulsion Laboratory, Pasadena, California, June 1, 1983.
Desombre, A . , "Methodology For a Reliability Study on Photovoltaic Modules," Proceedings of Third E.C. Photovoltaic Solar Energy Conference, pp. 741-745, Cannes, France, October 27-31, 1980.
Mon, G., Wen, L., Ross, R.G., Jr., and Adent, D., "Effects of Temperature and Moisture on Module Leakage Currents," Proceedings of the 18th IEEE Photovoltaic Specialists Conference, Las Vegas, Nevada, October 21-25, 1985.
Mon, G., Orehotsky, J . , Ross, R., Jr., and Whitla, G., "Predicting Electrochemical Breakdown in Terrestrial Photovoltaic Modules," Proceedings of the 17th IEEE Photovoltaic Specialists Conference, pp. 682-692, 1984.
Mon, G., Whitla, G., Ross, R., Jr., and Neff, M., "The Role of Electrical Insulation in Electrochemical Degradation of Terrestrial Photovoltaic Modules," IEEE Transactions on Electrical Insulation, December 1985.
Mon, G., and Ross, R.G., Jr., "Electrochemical Degradation of Amorphous- Silicon Photovoltaic Modules," Proceedings of the 18th IEEE Photovoltaic Specialists Conference, Las Vegas, Nevada, October 21-25, 1985.
5-1

TECHNICAL REPORT STANDARD TITLE PAGE
7. Authorb)
9. Performing Organization Nanc ond Address
E. Cuddihy
1 . Report No. 2. Govament Accession No. 3. Recipient's Catalog No. 8 6-7
8 . Performing Organizotlon Report No,
IO. Work b i t No.
4. Title ond Subtitle
The Aging Corre la t ion (RH + t ) : Relat ive Humidity (%I + Temperature (OC)
5. Report Dote
JET PROPULSION LABORATORY C a l i f o r n i a I n s t i t u t e of Technology 4800 Oak Grove Drive Pasadena, C a l i f o r n i a 91109
Contract or Grant No. NAS7-918
Type of Report and Period Covered
JPL Publ ica t ion 12. Sponsoring k e n c y Nune and Address
NATIONAL AERONAUTICS AND SPACE ADMINISTRATION Washington, D.C. 20546
15. Supplementary Notes Sponsored by t h e U.S. Department of Energy through Interagency Agreement DE-AI01-85CE89008 wi th NASA; a l s o i d e n t i f i e d as WE/JPL 1012-121 and as JPL P r o j e c t No. 5101-283 (RTOP o r Customer Code 776-52-61).
16. Abstract
An aging c o r r e l a t i o n between Corrosion l i f e t i m e , and r e l a t i v e humidity RH ( X ) and temperature t (OC) has been reported i n t h e l i t e r a t u r e . c o r r e l a t i o n i s a semi-log p l o t of corrosion lifetime on t h e log scale ve r sus t h e i n t e r e s t i n g summation term e m p i r i c a l c o r r e l a t i o n w a s derived from observa t ion of experimental da t a t r e n d s and has been r e fe r r ed t o as an experimental law.
Using e l e c t r i c a l r e s i s t i v i t y d a t a of polyvinyl bu tyra l (PVB) measured a s a func t ion of r e l a t i v e humidity and temperature, i t w a s found that t h e e l e c t r i c a l r e s i s t i v i t y could be expressed as a funct ion of t h e term {RH(%) + t(OC)). Thus, i f cor ros ion is r e l a t e d t o leakage cu r ren t through an organic i n s u l a t o r , which, i n tu rn , is a func t ion of RH and t , then some p a r t i a l t h e o r e t i c a l v a l i d i t y f o r t h e c o r r e l a t i o n is indicated. This a r t i c l e desc r ibes t h e d e r i v a t i o n of t h e term (RH(%) + t(OC)/ from PVB e l e c t r i c a l r e s i s t i v i t y da t a .
This aging
I R H ( X ) + t(OC)I on t h e l i n e a r scale. This
17. Key WorQ (Selected by Author(s))
Energy Engineering Re1 ia b i l it y
19. Security Chsif . (of this roport) I 10. Socurfty
18. Distribution Stotement
Uncla s s i f ied-unl hi t ed
crrif. (of this w) 21. No. of Pospr
Unclass i f ied Unclassified 28 I I JCL 0104 R # I I


![Healthy and comfortable indoor air humidity · 2020. 8. 19. · The relative humidity [RH] is the most meaningful value for the current humidity content of the air. This value indicates](https://img.pdfslide.net/doc/110x75/60d4813a8eceea7d64273b80/healthy-and-comfortable-indoor-air-humidity-2020-8-19-the-relative-humidity.jpg)