Embed Size (px)
Citation preview

The Aon Benfield AggregateSix months ended June 30, 2010
reDEFININGCapital | Access | Advocacy | Innovation

About Aon Benfield
As the industry leader in treaty, facultative and capital markets, Aon Benfield is redefining the role of the reinsurance intermediary and capital advisor. Through our unmatched talent and industry-leading proprietary tools and products, we help our clients to redefine themselves and their success. Aon Benfield offers unbiased capital advice and customized access to more reinsurance and capital markets than anyone else. As a trusted advocate, we provide local reach to the world’s markets, an unparalleled investment in innovative analytics, including catastrophe management, actuarial, and rating agency advisory, and the right professionals to advise clients in making the optimal capital choice for their business. With an international network of more than 4,000 professionals in 50 countries, our worldwide client base is able to access the broadest portfolio of integrated capital solutions and services. Learn more at aonbenfield.com.

Aon Benfield
3
Table of Contents Global Reinsurer Capital 4
The Aon Benfield Aggregate 5
Income 6 Premium Income 6 Premium Distribution 7 Pricing and Outlook 7
Earnings 8 Technical Performance 9
Balance Sheet 12 Shareholders’ Funds 12 Invested Assets 14 Capital Management 15
Appendix 1 – Aon Benfield Aggregate 17
Appendix 2 – Financial Strength Ratings 22

The Aon Benfield Aggregate – Six Months Ended June 30, 2010
4
Global Reinsurer Capital Based on those companies that have reported first half 2010 numbers, Aon Benfield estimates that global reinsurer capital is USD442 billion at 1H 2010. This represents an increase of 10% from year end 2009, with growth in the second quarter significantly less than the growth in the first quarter of 2010 (0.3% versus 9.6% respectively). This reflects higher levels of share repurchases in the second quarter and the effects of currency translation.
The improvement reflects reinsurers’ positive operating results during the last eighteen months and the general recovery and stabilization of the financial markets. However, reinsurer capital growth exceeds the growth in demand for most lines and geographic territories of reinsurance capacity. While a number of companies have stated that they see share repurchases as an important component of capital management, the level of repurchases may be muted in the third quarter due to the uncertainties of the hurricane season.
Chart 1 – Global Reinsurer Capital
10%
18%-17%
0
50
100
150
200
250
300
350
400
450
500
2007 2008 2009 1H 2010E
USD
bn
Source: Individual company accounts, Aon Benfield Analytics

Aon Benfield
5
The Aon Benfield Aggregate Increased catastrophe losses and higher underwriting expenses resulted in the combined ratio for the Aon Benfield Aggregate (ABA)1 increasing by 8.2 percentage points (pp) to 100.0% for the first half of 2010. Positive prior year reserve development of 4.7pp kept underwriting during the period at break even point.
Shareholders’ funds growth was 12% for the six months ended June 30, 2010. Net income and realized gains were offset by a return of capital to shareholders in the form of dividends and share buy-backs and by negative foreign exchange fluctuations. During the period, ABA companies repurchased USD5.1 billion of their own shares, equivalent to 2.4% of opening shareholders’ funds.
At USD837 billion, total invested assets decreased by 1% from year end 2009. The composition of the invested assets portfolio has changed marginally from December 31, 2009, reflecting recovery in equity valuations and a renewed appetite for riskier investments.
Pre-tax profit rose 65% to USD15 billion in the first half of 2010. Realized gains boosted an otherwise stable investment return, which more than offset the break-even underwriting performance. Excluding capital gains, operating income fell by 36%.
1 The ABA consists of a group of 30 of the largest traditional reinsurance companies, representing approximately half of the estimated global reinsurer capital.

The Aon Benfield Aggregate – Six Months Ended June 30, 2010
6
Income Property & Casualty (P&C) gross premiums written (GPW) by the ABA increased by 0.3% in the first half of 2010 to USD73 billion. Results ranged from a decline of 42% to growth of 368%. Acquisitions significantly impacted the results of a number of those reporting the larger increases. Company managements commented that certain lines of business had been scaled back in response to inadequate pricing and increased competition.
Premium Income
Chart 2 – First Half 2010 P&C Gross Premiums Written Percentage Change2
-50% -40% -30% -20% -10% 0% 10% 20% 30% 40% 50%
American Agricultural
Argo Group
Platinum
National Indemnity
Swiss Re
ABA
Flagstone Re
Maiden
Validus
PartnerRe
Starr Indemnity
% Change in P&C Gross Premiums Written (Reporting Currency)
368%
Source: Company data, Aon Benfield Research
The difference in premiums written by American Agricultural is as a result of a change of how the company is recording premiums on a quarterly basis. On an annual basis, the company expects recording of premium will be both consistent and similar to the levels seen last year.
Argo Group’s 21% decline in GPW was the second largest recorded by the ABA group, with a reduction from USD1.1 billion to USD0.8 billion. The company cited continued competition and declining rates as the principal drivers, as premiums written declined across most segments. Reinsurance was the exception, where premiums grew by 12%, primarily due to the new primary excess casualty and professional lines unit which commenced underwriting in the second quarter of 2009.
Platinum’s GPW decreased by 11%, with each of the three business segments reporting a decline. Platinum’s Property & Marine segment writing was down by 12% year over year, with the decline primarily occurring in North American crop business, which in part was offset by an increase in catastrophe business. The Casualty segment registered declines across most classes as a result of fewer opportunities that met the company’s underwriting requirements.
Swiss Re’s premiums written declined by 10% to USD8.6 billion. On an earned basis, the company recorded a decline in each of the P&C segments as the group reported lower January renewals, reflecting their active cycle management and portfolio steering. The largest decline was in the non-traditional segment, which fell by 23%.
Maiden, Validus and PartnerRe have all recently completed acquisitions and as a result GPW figures are not comparable with the prior year. Starr Indemnity’s growth was due to the relative infancy of the company. Flagstone recorded 12% organic GPW growth, the highest of the ABA companies. Premiums increased from USD690 million to USD770 million at
2 This chart, and all similar, identifies the companies reporting the five highest and lowest outliers compared to the ABA average.

Aon Benfield
7
the half year point. Both the Reinsurance and Lloyd’s segments increased writings in the period. At 31% the Lloyd’s segment growth was the larger of the two and was as a result of expanded activity within the property lines, principally due to the growth in direct, facultative and binder business.
Premium Distribution
Chart 3 shows the net premiums written split of the ABA companies, noting that the ten largest ABA companies account for 73% of the total, unchanged from the same period last year. There was little movement within the top ten as compared to the same period in 2009. PartnerRe has entered the top ten due to its acquisition of Paris Re which brought its share to 4.3%, up from 3.2% in the comparable period.
Chart 3 – First Half 2010 Total P&C Net Premiums Written Split
1H 2010 P&C Net Premiums WrittenUSD60bn
Munich Re 20.7%
Swiss Re 11.1%
ACE 10.4%
Hannover Re 6.6%
XL Group 4.5%
National Indemnity 4.3%
PartnerRe 4.3%
Fairfax 3.7%
SCOR 3.6%
Axis Capital 3.4%
Remainder 27.4%
Source: Company data, Aon Benfield Research
Pricing and Outlook
June renewals were dominated by the Florida market. Companies said rates in Florida continued to soften, reducing by between 7% and 15% year over year, depending on line and layer, although they were generally deemed still to be adequate.
At June 30, 2010 capital surpassed the pre-credit crisis levels of 2007, and this continued to exert downward pressure on rates. Despite an above-average incidence of large losses, including the Chile earthquake and European windstorm Xynthia, the burden of catastrophe claims was not sufficient to turn the market as companies estimated that global premium rates decreased by 3% to 5%. The exceptions to this general trend were the recently loss affected lines (such as Chile and Australia), which experienced strong rate increases, with reinsurers recording rises in Chile loss exposed lines of between 50% and 70%.
During conference calls companies remained cautious about the Atlantic hurricane season. The predicted higher than average severity has thus far failed to materialize, however at the time of writing, the peak two months of the season are still to be seen. Reinsurers commented that it would take a sizable event to turn the market.
The Aon Benfield Aggregate – Six Months Ended June 30, 2010
8
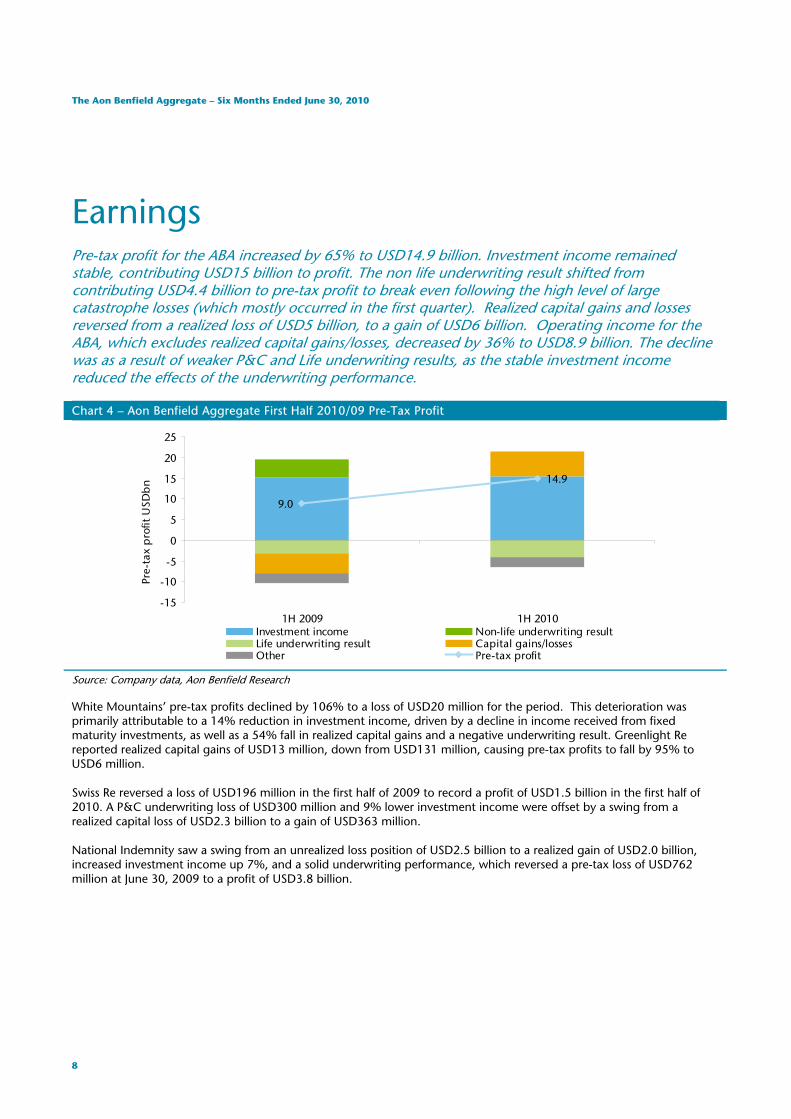
Earnings Pre-tax profit for the ABA increased by 65% to USD14.9 billion. Investment income remained stable, contributing USD15 billion to profit. The non life underwriting result shifted from contributing USD4.4 billion to pre-tax profit to break even following the high level of large catastrophe losses (which mostly occurred in the first quarter). Realized capital gains and losses reversed from a realized loss of USD5 billion, to a gain of USD6 billion. Operating income for the ABA, which excludes realized capital gains/losses, decreased by 36% to USD8.9 billion. The decline was as a result of weaker P&C and Life underwriting results, as the stable investment income reduced the effects of the underwriting performance.
Chart 4 – Aon Benfield Aggregate First Half 2010/09 Pre-Tax Profit
9.0
14.9
-15
-10
-5
0
5
10
15
20
25
1H 2009 1H 2010
Pre-
tax
pro
fit U
SDb
n
Investment income Non-life underwriting resultLife underwriting result Capital gains/lossesOther Pre-tax profit
Source: Company data, Aon Benfield Research
White Mountains’ pre-tax profits declined by 106% to a loss of USD20 million for the period. This deterioration was primarily attributable to a 14% reduction in investment income, driven by a decline in income received from fixed maturity investments, as well as a 54% fall in realized capital gains and a negative underwriting result. Greenlight Re reported realized capital gains of USD13 million, down from USD131 million, causing pre-tax profits to fall by 95% to USD6 million.
Swiss Re reversed a loss of USD196 million in the first half of 2009 to record a profit of USD1.5 billion in the first half of 2010. A P&C underwriting loss of USD300 million and 9% lower investment income were offset by a swing from a realized capital loss of USD2.3 billion to a gain of USD363 million.
National Indemnity saw a swing from an unrealized loss position of USD2.5 billion to a realized gain of USD2.0 billion, increased investment income up 7%, and a solid underwriting performance, which reversed a pre-tax loss of USD762 million at June 30, 2009 to a profit of USD3.8 billion.

Aon Benfield
9
Chart 5 – First Half 2010/09 Percentage Change in Pre-Tax Profit
Source: Company data, Aon Benfield Research
Technical Performance
The ABA combined ratio3 increased by 8.2 percentage points (pp) to 100.0%. Both the loss and expense ratios increased over the prior year. Excluding the effect of prior year reserve releases, the loss ratio increased 7.9pp to 74.4%, reflecting an increase in large catastrophe losses. Reserve releases continued across the industry, improving the loss ratio by 4.7pp, which is higher than the comparable period last year. The expense ratio increased 1.5pp to 30.2%.
Chart 6 – Composition of Aon Benfield Aggregate Combined Ratio
28.7%30.2%
100.0%
74.4%66.5%
-3.4% -4.7%
91.8%
-10%
10%
30%
50%
70%
90%
110%
1H 2009 1H 2010
Loss ratio Expense ratio Prior year reserve adj
Source: Company data, Aon Benfield Research
Starr Indemnity recorded the highest combined ratio of the ABA at 122.3%. The high combined ratio was driven by the expense ratio, which at 52.9% was 13pp lower than in the comparative period, but remained 22.7pp higher than the ABA. White Mountains’ expense and loss ratios were higher than the ABA, by 9.5pp and 3.3pp respectively. Increased
3 For consistency, Aon Benfield calculates combined ratios as the sum of net claims incurred and expenses to net premiums earned, all as recorded for the published technical accounts. In some cases, the resulting ratios differ from those published by companies, where different calculation bases have been used or adjustments have been made to the figures shown in the income statements.
-150% -100% -50% 0% 50% 100% 150% 200% 250%
Swiss Re
National Indemnity
XL Group
Fairfax
American Agricultural
ABA
Everest Re
Flagstone Re
Validus
Greenlight Re
White Mountains
% Change in 1H 2010/09 Pre-Tax Profit (Reporting Currency)
598%
846%

The Aon Benfield Aggregate – Six Months Ended June 30, 2010
10
catastrophe losses were the reason behind the 13.8pp increase in the loss ratio, while the expense ratio, although high, remained stable.
Everest Re’s combined ratio increased from 88.4% to 108.5%, with a 20.7pp increase in the loss ratio driven by catastrophe losses. Everest Re recorded a USD400 million increase in catastrophe costs year over year, primarily attributable to the Chilean earthquake and Australian hailstorms. The company raised its loss estimate for the Chilean earthquake from an initial USD225 million to USD306 million4.
Fairfax’s combined ratio increased by 7.8pp to 106.3%, and both the company’s insurance and reinsurance operations reported an underwriting loss in the six months to June 30, 2010. Catastrophe losses added 10.1pp in the first six months of 2010, compared to 3.4pp for the comparative period. Losses included USD134 million relating to Chile and USD36 million to Deepwater Horizon.
At 54.0%, RenaissanceRe’s combined ratio was 45.9pp below the ABA and the lowest recorded by the ABA companies. Positive reserve development of USD248 million drove the loss ratio down to 21.0%, although the expense ratio increased by 6pp to 33.0%. RenaissanceRe commented that the increase in operational expenses was primarily due to higher staff numbers.
Chart 7 – Combined Ratios
0% 20% 40% 60% 80% 100% 120% 140%
RenaissanceRe
Platinum
Alterra
National Indemnity
Dorinco
ABASwiss Re
Fairfax
Everest Re
White Mountains
Starr Indemnity
Combined Ratio (Reporting Currency)
Source: Company data, Aon Benfield Research
RenaissanceRe and National Indemnity had the largest reserve releases, with loss ratios reduced by 41.0pp and 22.7pp, respectively. Excluding the positive prior year development RenaissanceRe’s combined ratio would have been 95.0% and National Indemnity’s 109.9%. RenaissanceRe released a total of USD248 million from both the Insurance and Reinsurance segments, though approximately 75% of the releases were from the latter. National Indemnity released USD491 million of reserves; the development was primarily in the company’s Reinsurance Divisions catastrophe business, on quota share assumed reinsurance for Swiss Reinsurance Company and affiliated quota share agreements.
Greenlight was the only company to increase its reserves, with negative prior year development adding 4.0pp to the loss ratio. The company commented that adverse development was on a motor liability contract as well as 2007 California wildfires, partially offset by favorable development on two catastrophe contracts.
4 Both figures are net of tax and reinstatement premiums.

Aon Benfield
11
Chart 8 – Loss Reserve Development
-5% 0% 5% 10% 15% 20% 25% 30% 35% 40% 45%
Greenlight Re
Everest Re
Transatlantic Holdings
Fairfax
Aspen
ABA
Montpelier Re
Platinum
Gen Re
National Indemnity
RenaissanceRe
Prior Year Reserve Adj as % NPE (Reporting Currency)
Source: Company data, Aon Benfield Research

The Aon Benfield Aggregate – Six Months Ended June 30, 2010
12
Balance Sheet Shareholders’ Funds
ABA shareholders’ funds grew by 12% in the first half of 2010 to end at USD235 billion. Additional contributed capital to the ABA includes USD22.5 billion issued by National Indemnity relating to Berkshire Hathaway group’s acquisition of Burlington Northern Santa Fe Corporation (BNSF) during the first quarter. Also, Max Capital issued USD1.4 billion of common shares to purchase Harbor Point to form Alterra during the second quarter. A few other companies issued small quantities of new capital (for example, to satisfy share options or scrip dividends). Net income nearly doubled over the prior year to USD12.2 billion and unrealized capital gains increased USD0.4 billion to USD3.4 billion. Capital was returned to shareholders in the form of share buy-backs of USD5.1 billion and dividend payments of USD3.6 billion. Negative foreign exchange movements of USD5.1 billion also dragged on shareholders’ funds development.
Excluding the additional capital raised during the first half of 2010, shareholders’ funds only increased by USD0.3 billion, approximately 0.1% of opening capital.
Chart 9 – First Half 2010 Shareholders’ Funds Development
Source: Company data, Aon Benfield Research
12.2
234.824.7
209.8
3.4 -1.6-5.1-5.1
-3.6
180
190
200
210
220
230
240
250
260
FY 2009SHF
Additionalcapital
Netincome
Dividends FX Investmentgains
Sharebuybacks
Other 1H 2010SHF
USD
bn
Aon Benfield
13
Chart 10 – First Half 2009 Shareholders’ Funds Development
Source: Company data, Aon Benfield Research
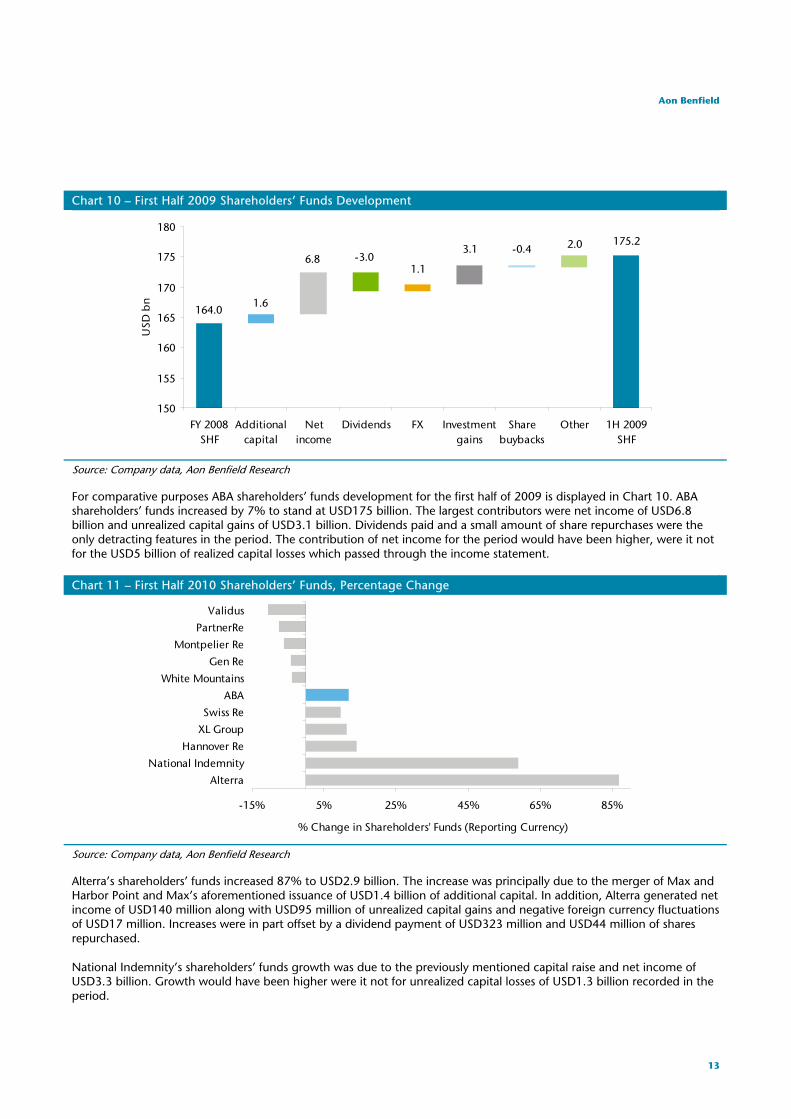
For comparative purposes ABA shareholders’ funds development for the first half of 2009 is displayed in Chart 10. ABA shareholders’ funds increased by 7% to stand at USD175 billion. The largest contributors were net income of USD6.8 billion and unrealized capital gains of USD3.1 billion. Dividends paid and a small amount of share repurchases were the only detracting features in the period. The contribution of net income for the period would have been higher, were it not for the USD5 billion of realized capital losses which passed through the income statement.
Chart 11 – First Half 2010 Shareholders’ Funds, Percentage Change
-15% 5% 25% 45% 65% 85%
Alterra
National Indemnity
Hannover Re
XL Group
Swiss Re
ABA
White Mountains
Gen Re
Montpelier Re
PartnerRe
Validus
% Change in Shareholders' Funds (Reporting Currency)
Source: Company data, Aon Benfield Research
Alterra’s shareholders’ funds increased 87% to USD2.9 billion. The increase was principally due to the merger of Max and Harbor Point and Max’s aforementioned issuance of USD1.4 billion of additional capital. In addition, Alterra generated net income of USD140 million along with USD95 million of unrealized capital gains and negative foreign currency fluctuations of USD17 million. Increases were in part offset by a dividend payment of USD323 million and USD44 million of shares repurchased.
National Indemnity’s shareholders’ funds growth was due to the previously mentioned capital raise and net income of USD3.3 billion. Growth would have been higher were it not for unrealized capital losses of USD1.3 billion recorded in the period.
175.22.0-0.43.1
1.1-3.06.8
1.6164.0
150
155
160
165
170
175
180
FY 2008SHF
Additionalcapital
Netincome
Dividends FX Investmentgains
Sharebuybacks
Other 1H 2009SHF
USD
bn

The Aon Benfield Aggregate – Six Months Ended June 30, 2010
14
Hannover Re’s shareholders’ funds grew 14% in the period. This growth was driven by net income of EUR310 million, unrealized gains of EUR230 million and foreign currency translation gains of EUR250 million. These were partly were offset by a dividend payment of EUR253 million.
XL’s shareholders’ funds increased by 11% to end at USD10.5 billion. The increase was due to net income and the unrealized gains of USD354 million and USD912 million, respectively. Offsetting this were negative foreign currency movements of USD108 million and dividend payments of USD100 million.
Validus’ shareholders’ funds decreased by 11% to USD3.6 billion, principally due to the USD444 million of repurchased shares, which was equivalent to 11% of opening shareholders’ funds. Validus indicated their intention is to continue repurchasing shares within the remaining share authorization, with USD355 million outstanding under the recently reloaded authorization.
PartnerRe’s shareholders’ funds declined by 8% to USD7.1 billion. Key drivers were USD600 million of share repurchases, USD174 million of negative foreign exchange movements and dividends totaling USD97 million. Net income for the period of USD270 million only partially offset the decline.
Invested Assets
Total invested assets increased 4% year over year, but decreased 1% over year-end 2009. The composition of the ABA investment portfolio has changed marginally from the position at full-year 2009. Other investments increased to account for 20% (2009: 15%). Several factors have influenced the shift. First, the recovery in market value vs June 2009 in equities and alternative investments; second, a return to investing in new and riskier assets as companies chase yield; and third, the impact from currency fluctuations, particularly the euro vs the US dollar.
Chart 12 – Invested Assets Split
ABA Invested Assets 1H 2010 USD837bn
62%11%
7%
20%
Fixed income securities Equities Cash Other
ABA Invested Assets FY 2009 USD844bn
66%
12%
7%
15%
Source: Company data, Aon Benfield Research

Aon Benfield
15
Capital Management
Share Repurchases
Table 1 – Capital Management
USD (millions)
Opening SHF
(FY 2009) 1H 2010
Buy-backs
Buy-backs as % of
Opening SHF
Dividends paid
1H 2010
Dividends as % of
Opening SHF
Debt issuance
2010
ACE 19,667 0 0% 218 1% 0
Allied World 3,213 49 2% 20 1% 0
Alterra 1,565 44 3% 323 21% 0
American Agricultural 483 0 0% 1 0% 0
Arch Capital 4,323 455 11% 13 0% 0
Argo Group 1,615 37 2% 7 0% 0
Aspen 3,305 200 6% 35 1% 0
Axis Capital 5,500 419 8% 80 1% 500
Dorinco 604 0 0% 0 0% 0
Endurance Specialty 2,787 118 4% 35 1% 85
Everest Re 6,102 247 4% 56 1% 0
Fairfax 7,619 6 0% 212 3% 275
Flagstone Re 1,211 58 5% 7 1% 0
Gen Re 9,889 0 0% 0 0% 0
Greenlight Re 699 0 0% 0 0% 0
Hannover Re 5,319 0 0% 337 6% 0
Maiden 677 0 0% 9 1% 0
Montpelier Re 1,728 175 10% 13 1% 0
Munich Re 31,596 1,334 4% 1,427 5% 0
National Indemnity 38,435 0 0% 250 1% 0
PartnerRe 7,646 600 8% 97 1% 500
Platinum 2,078 213 10% 7 0% 0
RenaissanceRe 3,841 411 11% 50 1% 250
SCOR 5,580 0 0% 238 4% 0
Starr International 519 0 0% 0 0% 0
Swiss Re 22,674 0 0% 0 0% 0
Transatlantic Holdings 4,034 141 3% 27 1% 0
Validus 4,031 444 11% 57 1% 250
White Mountains 3,657 118 3% 9 0% 0
XL Capital 9,430 2 0% 103 1% 0
ABA 209,829 5,071 2% 3,630 2% 1,860
Source: Company information, Aon Benfield Research
Capital management was a recurring theme in company conference calls with investors and analysts. Current underwriting conditions, low interest rates and surplus capital are pressuring most ABA companies’ return on equity. With the common stock of many reinsurers trading below book value, share repurchases are seen as an attractive way to increase price to book ratios as well as being accretive to earnings per share. In the first half of 2010, ABA companies have returned 2.4% of opening shareholders’ funds, with roughly equal amounts returned each quarter and buy-backs have continued since June 30.
The Aon Benfield Aggregate – Six Months Ended June 30, 2010
16
1H 2009 share repurchases as a percent of opening capital were under 0.3% while this number for the full year 2009 was approximately 1.5%. By June 30, 2010, the ABA had repurchased 2.4% of opening capital. In dollar terms, the ABA has already repurchased more shares in 2010 than all of 2009. Dividends have also increased over 1H 2009, by USD600 million, and the ABA is on par to return full year dividends in excess of the 3.1% return seen in 2009.
Lloyd’s Syndicates
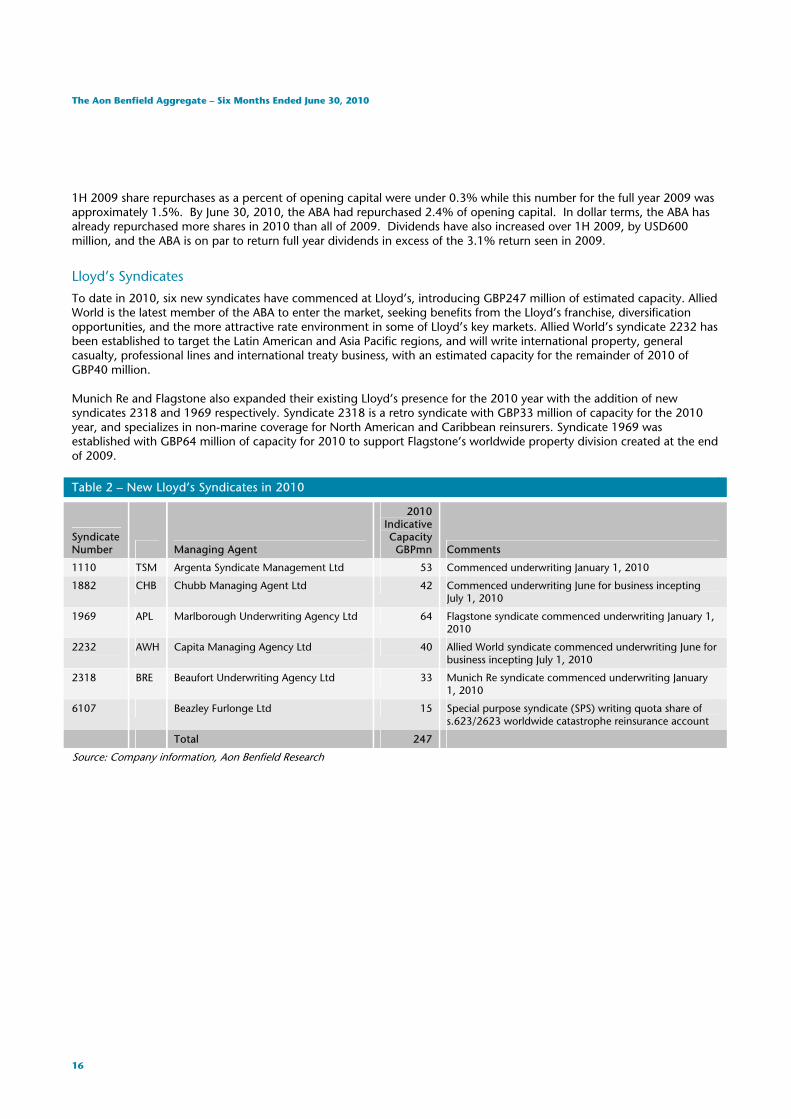
To date in 2010, six new syndicates have commenced at Lloyd’s, introducing GBP247 million of estimated capacity. Allied World is the latest member of the ABA to enter the market, seeking benefits from the Lloyd’s franchise, diversification opportunities, and the more attractive rate environment in some of Lloyd’s key markets. Allied World’s syndicate 2232 has been established to target the Latin American and Asia Pacific regions, and will write international property, general casualty, professional lines and international treaty business, with an estimated capacity for the remainder of 2010 of GBP40 million.
Munich Re and Flagstone also expanded their existing Lloyd’s presence for the 2010 year with the addition of new syndicates 2318 and 1969 respectively. Syndicate 2318 is a retro syndicate with GBP33 million of capacity for the 2010 year, and specializes in non-marine coverage for North American and Caribbean reinsurers. Syndicate 1969 was established with GBP64 million of capacity for 2010 to support Flagstone’s worldwide property division created at the end of 2009.
Table 2 – New Lloyd’s Syndicates in 2010
Syndicate Number Managing Agent
2010 Indicative Capacity
GBPmn Comments
1110 TSM Argenta Syndicate Management Ltd 53 Commenced underwriting January 1, 2010
1882 CHB Chubb Managing Agent Ltd 42 Commenced underwriting June for business incepting July 1, 2010
1969 APL Marlborough Underwriting Agency Ltd 64 Flagstone syndicate commenced underwriting January 1, 2010
2232 AWH Capita Managing Agency Ltd 40 Allied World syndicate commenced underwriting June for business incepting July 1, 2010
2318 BRE Beaufort Underwriting Agency Ltd 33 Munich Re syndicate commenced underwriting January 1, 2010
6107 Beazley Furlonge Ltd 15 Special purpose syndicate (SPS) writing quota share of s.623/2623 worldwide catastrophe reinsurance account
Total 247
Source: Company information, Aon Benfield Research

Aon Benfield
17
Appendix 1 – Aon Benfield Aggregate Table 3 – First Half 2010 Results
Company
Reporting Currency (millions)
P&C GPW 1H 2009
P&C GPW 1H 2010
Change %
Loss Ratio 1H 2010
Combined Ratio
1H 2009
Combined Ratio
1H 2010
Combined Ratio
Change
ACE USD 8,883 9,156 3% 60.3% 87.6% 91.2% 3.7pp
Allied World USD 972 998 3% 62.1% 78.9% 93.2% 14.2pp
Alterra USD 789 768 -3% 58.6% 90.3% 86.2% -4.1pp
American Agricultural USD 769 449 -42% 83.2% 134.7% 99.7% -35.0pp
Arch Capital USD 1,937 1,771 -9% 61.2% 87.1% 93.5% 6.4pp
Argo Group USD 1,068 840 -21% 66.0% 96.0% 103.8% 7.8pp
Aspen USD 1,171 1,248 7% 69.2% 86.0% 98.5% 12.5pp
Axis Capital USD 2,238 2,365 6% 60.9% 83.4% 92.1% 8.7pp
Dorinco USD 218 213 -2% 74.3% 86.2% 88.4% 2.2pp
Endurance Specialty USD 1,342 1,308 -3% 64.0% 90.8% 93.8% 3.0pp
Everest Re USD 1,972 2,035 3% 80.9% 88.4% 108.5% 20.2pp
Fairfax USD 2,647 2,673 1% 75.7% 98.5% 106.2% 7.7pp
Flagstone Re USD 690 770 12% 62.2% 74.3% 100.6% 26.3pp
Gen Re USD 626 619 -1% 56.3% 88.8% 96.2% 7.4pp
Greenlight Re USD 142 156 10% 61.8% 96.6% 99.6% 3.0pp
Hannover Re EUR 3,081 3,272 6% 74.3% 97.7% 99.7% 2.0pp
Maiden USD 575 662 15% 63.1% 95.9% 96.7% 0.7pp
Montpelier Re USD 435 474 9% 61.2% 67.6% 92.7% 25.1pp
Munich Re EUR 10,665 10,659 0% 74.0% 97.8% 104.9% 7.1pp
National Indemnity USD 3,159 2,839 -10% 56.1% 84.4% 87.2% 2.8pp
PartnerRe USD 1,901 2,692 42% 73.9% 85.3% 103.8% 18.5pp
Platinum USD 464 415 -11% 57.3% 78.6% 84.2% 5.6pp
RenaissanceRe USD 1,453 1,405 -3% 21.0% 49.4% 54.0% 4.6pp
SCOR EUR 1,699 1,764 4% 74.5% 95.3% 101.0% 5.7pp
Starr Indemnity USD 47 221 368% 69.4% 142.6% 122.3% -20.3pp
Swiss Re USD 9,515 8,562 -10% 77.8% 92.6% 105.6% 13.0pp
Transatlantic Holdings USD 2,201 2,096 -5% 73.1% 94.3% 101.8% 7.6pp
Validus USD 1,035 1,388 34% 75.2% 73.4% 105.3% 31.9pp
White Mountains USD 2,103 2,113 0% 73.0% 96.8% 112.6% 15.9pp
XL Group USD 3,379 3,429 1% 66.1% 92.6% 96.4% 3.9pp
ABA USD 72,352 72,557 0% 69.7% 91.8% 100.0% 8.2pp
Source: Company data, Aon Benfield Research

The Aon Benfield Aggregate – Six Months Ended June 30, 2010
18
Table 3 – First Half 2010 Results (cont’d)
Company
Prior Year Reserve (Release)
Strengthen 1H 2009
Prior Year Reserve (Release)
Strengthen 1H 2010
Prior Year Reserve Adj
as % NPE 1H 2010
Net Investment
Income 1H 2009
Net Investment
Income 1H 2010
Change %
ACE -224 -245 4.3% 1,008 1,022 1%
Allied World -97 -138 20.4% 154 134 -13%
Alterra -32 -41 8.5% 82 102 24%
American Agricultural 10 -18 10.0% 10 9 -14%
Arch Capital -113 -70 5.4% 196 184 -7%
Argo Group 14 -20 3.1% 81 67 -18%
Aspen -27 -15 1.6% 131 117 -11%
Axis Capital -181 -160 11.2% 212 187 -11%
Dorinco -13 -8 7.1% 26 23 -10%
Endurance Specialty -75 -68 8.3% 153 90 -41%
Everest Re 24 -9 0.5% 236 327 39%
Fairfax -23 -32 1.5% 356 378 6%
Flagstone Re -16 -21 4.6% 9 16 74%
Gen Re -59 -70 21.8% 502 640 28%
Greenlight Re 0 4 -4.0% -15 -7 -52%
Hannover Re 0 -140 5.3% 520 565 9%
Maiden 0 0 0.0% 29 36 24%
Montpelier Re -32 -64 20.7% 40 39 -2%
Munich Re 0 0 0.0% 3,519 3,727 6%
National Indemnity -374 -491 22.7% 1,388 1,491 7%
PartnerRe -242 -214 11.1% 269 348 29%
Platinum -46 -90 21.8% 78 73 -7%
RenaissanceRe -99 -248 41.0% 156 95 -39%
SCOR 0 0 0.0% 267 284 6%
Starr Indemnity 0 0 0.0% 3 10 236%
Swiss Re 0 0 0.0% 3,117 2,839 -9%
Transatlantic Holdings -7 -22 1.1% 221 228 3%
Validus -21 -76 8.5% 54 69 29%
White Mountains -39 -47 2.7% 138 118 -15%
XL Group -180 -169 6.8% 621 589 -5%
ABA -1,852 -2,517 4.7% 15,005 15,314 2% Reporting currency (millions) Source: Company data, Aon Benfield Research

Aon Benfield
19
Table 3 – First Half 2010 Results (cont’d)
Company
Pre-Tax Profit
1H 2009
Pre-Tax Profit
1H 2010 Change
% SHF
1H 2009 SHF
1H 2010 Change
%
Pre-Tax Operating
ROE 1H 2009
Pre-Tax Operating
ROE 1H 2010
ACE 1,328 1,698 28% 19,667 21,410 9% 22% 15%
Allied World 266 331 24% 3,213 3,469 8% 21% 10%
Alterra 92 144 56% 1,565 2,927 87% 8% 14%
American Agricultural -57 8 113% 483 488 1% -23% 3%
Arch Capital 323 469 45% 4,323 4,398 2% 18% 15%
Argo Group 54 66 22% 1,615 1,628 1% 11% 6%
Aspen 238 141 -41% 3,305 3,304 0% 17% 7%
Axis Capital 311 353 13% 5,500 5,495 0% 16% 11%
Dorinco 28 48 70% 604 603 0% 14% 12%
Endurance Specialty 223 115 -49% 2,787 2,844 2% 20% 8%
Everest Re 446 151 -66% 6,102 6,036 -1% 16% 5%
Fairfax 373 822 120% 7,619 8,274 9% 6% 0%
Flagstone Re 117 38 -67% 1,211 1,196 -1% 16% 6%
Gen Re 340 654 92% 9,889 9,461 -4% 12% 13%
Greenlight Re 121 6 -95% 699 706 1% -4% -2%
Hannover Re 562 452 -19% 3,712 4,239 14% 29% 21%
Maiden 29 33 12% 677 725 7% 11% 9%
Montpelier Re 210 79 -62% 1,728 1,621 -6% 15% 6%
Munich Re 1,695 1,639 -3% 22,049 23,504 7% 16% 3%
National Indemnity -762 3,796 598% 38,435 61,099 59% 12% 7%
PartnerRe 733 312 -57% 7,646 7,071 -8% 18% 3%
Platinum 185 148 -20% 2,078 2,105 1% 17% 11%
RenaissanceRe 475 457 -4% 3,841 3,775 -2% 23% 15%
SCOR 93 158 70% 3,894 4,209 8% 13% 5%
Starr Indemnity -7 -3 -55% 519 528 2% -6% -1%
Swiss Re -196 1,462 846% 22,674 24,847 10% 22% 9%
Transatlantic Holdings 228 150 -34% 4,034 4,050 0% 18% 7%
Validus 231 65 -72% 4,031 3,603 -11% 19% -1%
White Mountains 352 -20 -106% 3,657 3,514 -4% 9% -5%
XL Group 151 412 172% 9,430 10,505 11% 14% 11%
ABA 8,969 14,926 66% 209,829 234,689 12% 16% 8% Reporting currency (millions) Source: Company data, Aon Benfield Research

The Aon Benfield Aggregate – Six Months Ended June 30, 2010
20
Table 3 – First Half 2010 Results (cont’d)
Company
Total Investments
1H 2009
Total Investments
1H 2010
Invested Asset
Leverage 1H 2009
Invested Asset
Leverage 1H 2010
Total Gains / Losses
1H 2010
Total Gains / Losses
as % of FY 2009 SHF
ACE 45,105 51,601 2.7 2.4 808 4%
Allied World 7,244 8,011 2.6 2.3 161 5%
Alterra 5,171 7,800 3.8 2.7 86 5%
American Agricultural 798 843 1.7 1.7 -2 0%
Arch Capital 11,614 11,982 2.9 2.7 175 4%
Argo Group 4,135 4,360 2.8 2.7 26 2%
Aspen 6,090 6,895 2.0 2.1 118 4%
Axis Capital 11,289 12,344 2.3 2.2 179 3%
Dorinco 1,440 1,372 2.4 2.3 -18 -3%
Endurance Specialty 5,935 6,543 2.4 2.3 101 4%
Everest Re 14,743 15,634 2.7 2.6 160 3%
Fairfax 19,490 21,875 2.9 2.6 645 8%
Flagstone Re 1,850 1,989 1.4 1.5 1 0%
Gen Re 13,833 14,063 1.5 1.5 -934 -9%
Greenlight Re 1,116 1,414 1.8 1.9 13 2%
Hannover Re 32,819 39,432 8.9 8.2 217 5%
Maiden 1,758 2,001 2.9 2.8 26 4%
Montpelier Re 2,613 2,687 1.6 1.7 30 2%
Munich Re 175,399 181,335 8.2 7.6 1,905 9%
National Indemnity 62,344 97,161 2.2 1.6 770 2%
PartnerRe 13,083 18,801 2.7 2.7 191 2%
Platinum 4,553 4,641 2.3 2.2 114 5%
RenaissanceRe 6,323 6,554 1.5 1.5 100 2%
SCOR 17,727 21,663 4.9 5.1 72 2%
Starr Indemnity 269 631 1.0 1.2 0 0%
Swiss Re 201,642 179,939 10.5 0.0 0 0%
Transatlantic Holdings 11,444 12,778 3.2 3.2 10 0%
Validus 3,717 5,900 1.7 1.6 81 2%
White Mountains 9,630 8,910 2.5 2.1 172 4%
XL Group 32,762 34,709 4.4 3.3 774 8%
ABA 801,954 837,396 4.5 3.5 9,477 5% Reporting currency (millions) Source: Company data, Aon Benfield Research

Aon Benfield
21
Table 4 – Invested Assets as at June 30, 2010
Invested Assets as percentage of SHF
Company
Reporting Currency (millions)
SHF incl mins
Fixed Income
Securities Equities Cash Other
Total Invested
Assets
ACE USD 210% 1% 3% 23% 21,410 50,763
Allied World USD 203% 0% 16% 13% 3,469 8,011
Alterra USD 224% 0% 25% 17% 2,927 7,800
American Agricultural USD 98% 20% 52% 3% 488 843
Arch Capital USD 219% 0% 8% 46% 4,398 11,982
Argo Group USD 218% 14% 4% 32% 1,628 4,360
Aspen USD 174% 0% 22% 13% 3,304 6,895
Axis Capital USD 183% 4% 22% 16% 5,495 12,344
Dorinco USD 151% 56% 6% 14% 603 1,372
Endurance Specialty USD 173% 0% 24% 33% 2,844 6,543
Everest Re USD 225% 6% 3% 25% 6,036 15,634
Fairfax USD 153% 53% 38% 17% 8,386 21,875
Flagstone Re USD 109% 0% 30% 13% 1,304 1,989
Gen Re USD 18% 95% 18% 18% 9,461 14,063
Greenlight Re USD 8% 88% 73% 23% 735 1,414
Hannover Re EUR 452% 0% 11% 359% 4,801 39,432
Maiden USD 225% 0% 48% 3% 725 2,001
Montpelier Re USD 137% 8% 16% 5% 1,621 2,687
Munich Re EUR 686% 35% 14% 28% 23,749 181,335
National Indemnity USD 3% 72% 3% 82% 61,099 97,161
PartnerRe USD 192% 13% 15% 46% 7,071 18,801
Platinum USD 158% 0% 52% 10% 2,105 4,641
RenaissanceRe USD 102% 0% 6% 38% 4,483 6,554
SCOR EUR 247% 30% 25% 212% 4,216 21,663
Starr Indemnity USD 113% 0% 4% 2% 528 631
Swiss Re USD 323% 66% 122% 175% 26,250 179,939
Transatlantic Holdings USD 283% 12% 8% 13% 4,050 12,778
Validus USD 138% 0% 14% 12% 3,603 5,900
White Mountains USD 134% 13% 8% 59% 4,160 8,910
XL Group USD 268% 0% 36% 26% 10,507 34,709
ABA USD 220% 38% 25% 69% 238,163 836,558
Source: Company data, Aon Benfield Research

The Aon Benfield Aggregate – Six Months Ended June 30, 2010
22
Appendix 2 – Financial Strength Ratings Table 5 – Ratings
Company A.M. Best Fitch Moody’s Standard &
Poor’s
ACE Bermuda Insurance Ltd A+ AA- Aa3 A+
Allied World Assurance Co Ltd A NR A2 A-
Alterra Insurance Ltd A A A3 A-
American Agricultural Insurance Co A NR NR Api
Arch Reinsurance Ltd A A+ A2 A+
Argo Re Ltd A NR NR -
Aspen Insurance Ltd A NR A2 A
AXIS Specialty Ltd A NR A2 A+
Dorinco Reinsurance Co A- NR NR NR
Endurance Specialty Insurance Ltd A A A2 A
Everest Reinsurance (Bermuda) Ltd A+ AA- Aa3 A+
Flagstone Reassurance Suisse SA A- A- A3 NR
General Reinsurance Corporation A++ AA+ Aa1 AA+
Greenlight Reinsurance Ltd A- NR NR -
Hannover Rückversicherungs AG A A+ NR AA-
Maiden Insurance Company Ltd A- NR NR -
Montpelier Reinsurance Ltd A- A- NR A-
Munich Reinsurance Co A+ AA- Aa3 AA-
National Indemnity Company A++ AA+ Aa1 AA+
Odyssey America Reinsurance Corp A A- A3 A-
Partner Reinsurance Co Ltd A+ AA Aa3 AA-
Platinum Underwriters Bermuda Ltd A A NR A
Renaissance Reinsurance Ltd A+ A A1 AA-
SCOR SE A- A A2 A
Sirius International Insurance Corp A A- A3 A-
Starr Indemnity & Liability Company A NR NR -
Swiss Reinsurance Co A NR A1 A+
Transatlantic Reinsurance Co A NR A1 A+
Validus Reinsurance Ltd A- A- A3 NR
XL Re Ltd A A A2 A
Source: A.M. Best, Fitch, Moody’s, Standard & Poor’s

©Aon Limited trading as Aon Benfield (for itself and on behalf of each subsidiary company of Aon Corporation) (“Aon Benfield”) reserves all rights to the content of this report (“Report”). This Report is for distribution to Aon Benfield and the organisation to which it was originally delivered only. Copies may be made by that organisation for its own internal purposes but this Report may not be distributed in whole or in part to any third party without both (i) the prior written consent of Aon Benfield. and (ii) the third party having first signed a “recipient of report” letter in a form acceptable to Aon Benfield. Aon Benfield cannot accept any liability to any third party to whom this Report is disclosed, whether disclosed in compliance with the preceding sentence of otherwise.
To the extent this Report expresses any recommendation or assessment on any aspect of risk, the recipient acknowledges that any such recommendation or assessment is an expression of Aon Benfields opinion only, and is not a statement of fact. Any decision to rely on any such recommendation or assessment of risk is entirely the responsibility of the recipient. Aon Benfield will not in any event be responsible for any losses that may be incurred by any party as a result of any reliance placed on any such opinion. The recipient acknowledges that this Report does not replace the need for the recipient to undertake its own assessment.
The recipient acknowledges that in preparing this Report Aon Benfield may have based analysis on data provided by the recipient and/or from third party sources. This data may have been subjected to mathematical and/or empirical analysis and modelling. Aon Benfield has not verified, and accepts no responsibility for, the accuracy or completeness of any such data. In addition, the recipient acknowledges that any form of mathematical and/or empirical analysis and modelling (including that used in the preparation of this Report) may produce results which differ from actual events or losses.
The Aon Benfield analysis has been undertaken from the perspective of a reinsurance broker. Consequently this Report does not constitute an opinion of reserving levels or accounting treatment. This Report does not constitute any form of legal, accounting, taxation, regulatory or actuarial advice.
Contact InformationShould you have questions about this report, please do not hesitate to contact a member of the Aon Benfield Analytics team, including:
Jonny EgginsAon Benfield ResearchT: [email protected]
Lewis PhillipsAon Benfield ResearchT: [email protected]
Mike McClaneAon Benfield ResearchT: [email protected]
Aon Benfield ResearchT: [email protected]

55 Bishopsgate, London, EC2N 3BD t: +44 (0)20 7088 0044 | f: +44 (0)20 7575 7001 | www.aonbenfield.com
Copyright Aon Limited trading as Aon Benfield 2009 | #2913 - 09/2010