Embed Size (px)
Citation preview
An Economic Analysis of the Appalachian Coal Industry Ecosystem County-level CIE Supply Chain Analysis
Randall Jackson, Director, and
Péter Járosi, Research Assistant Professor
Regional Research Institute, West Virginia University
Prepared for The Appalachian Regional Commission, under contract # PW-18673-16
January 2018
1
Estimating County-level Supply Chain Impacts and Key Suppliers .............................................. 3
Executive Summary .................................................................................................. 3
Introduction ........................................................................................................... 5
Overview .............................................................................................................. 5
Analysis ................................................................................................................ 6
CIE Dependence ................................................................................................... 6
CIE Impact ......................................................................................................... 15
CIE Risk ............................................................................................................. 18
CIE County Typology ............................................................................................. 23
Coal Distressed Counties ........................................................................................... 29
Summary .............................................................................................................. 33
References .............................................................................................................. 34
Appendices .............................................................................................................. 35
Appendix I. CIE Scores, All Industries ........................................................................... 35
Appendix II. All Dependence, Impact, and Risk Scores ....................................................... 49
Appendix III. Dependence, Impact, and Risk Formulae ...................................................... 60
Variable Definitions .............................................................................................. 60
Industry CIE Scores ............................................................................................... 61
Dependency Scores ............................................................................................... 62
Impact Scores ..................................................................................................... 64
Risk Scores ......................................................................................................... 64
Defining categories by median ................................................................................. 68
Table of Contents
2
List of Figures
Figure 1: Major Coal Industry Supply Chain Link .................................................................. 7
Figure 2: Map of Coal-Dependent Counties, 2005 ................................................................ 10
Figure 3: Map of Coal-Dependent Counties, 2015 ................................................................ 11
Figure 4: Map of Coal Dependence, 2005 .......................................................................... 12
Figure 5: Map of Coal Dependence, 2015 ......................................................................... 13
Figure 6: Map of CIE Impacted Counties ........................................................................... 16
Figure 7: Map of CIE Impact by Quintile ........................................................................... 17
Figure 8: Correlation (-0.7786) between Coal Risk Score and Coal Impact Score ........................... 20
Figure 9: Map of 2015 CIE Risk ....................................................................................... 21
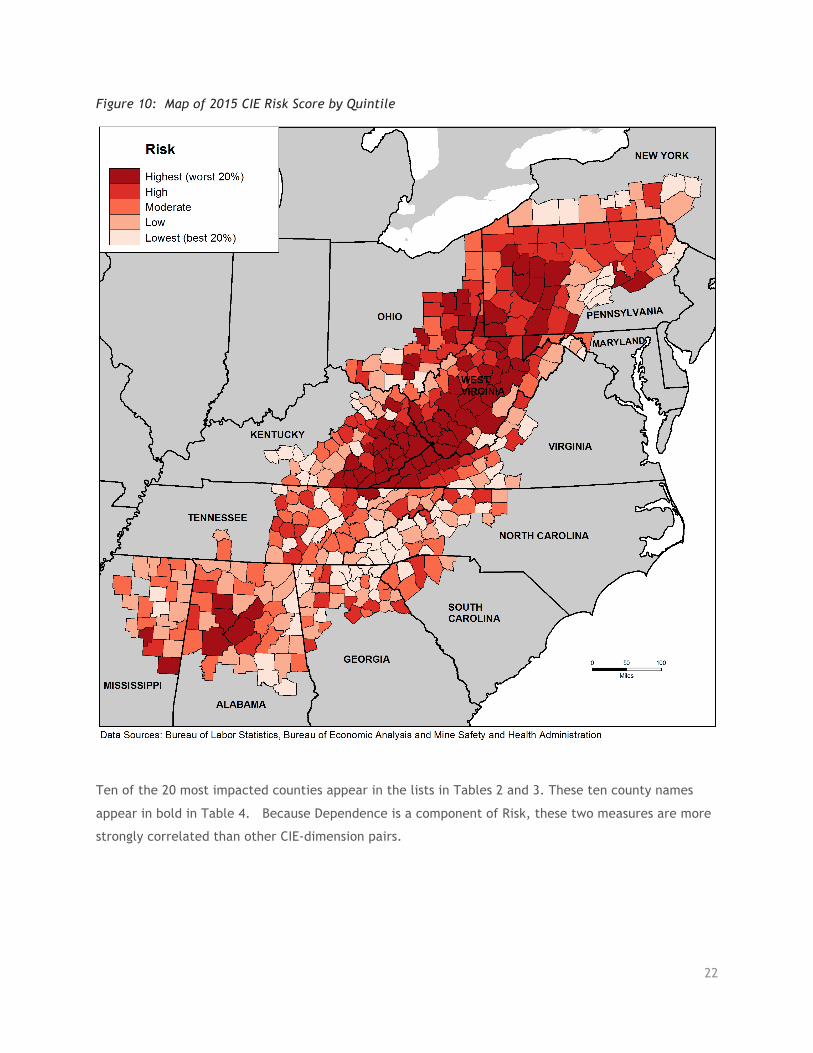
Figure 10: Map of 2015 CIE Risk Score by Quintile ............................................................... 22
Figure 11: CIE County Typology ..................................................................................... 24
Figure 12: Maps of CIE Typology, Classes 1 through 4 ........................................................... 26
Figure 13: Maps of CIE Typology, Classes 5 through 8 ........................................................... 27
Figure 14: Map of CIE Typology, all Classes ....................................................................... 28
Figure 15: CIE Class 1 Counties with One or More Top-20 Rankings .......................................... 30
Figure 16: Top Coal-Distressed Appalachian CIE Counties – All Scores ....................................... 32
List of Tables
Table 1: Top Industry CIE Scores .................................................................................... 9
Table 2: Highest CIE Dependence Counties, 2005 and 2015 .................................................... 14
Table 3: Highest CIE Impact Counties ............................................................................. 18
Table 4: Highest CIE Risk Counties and Associated Values .................................................. 23
Table 5: Typology Score Combinations ............................................................................ 24
Table 6: CIE Class 1 Counties with One or More Top-20 Rankings ............................................. 29
Table 7: Top Coal-Distressed Appalachian CIE Counties – All Scores .......................................... 31
3
Estimating County-level Supply Chain Impacts and Key Suppliers
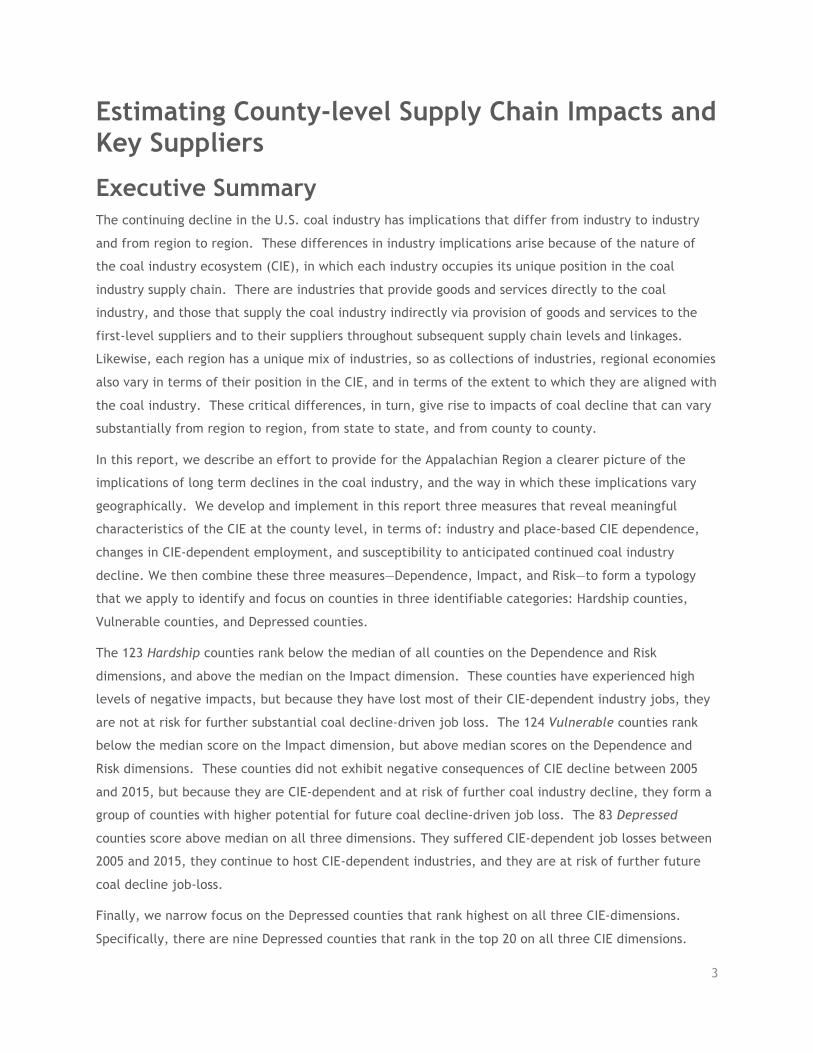
Executive Summary The continuing decline in the U.S. coal industry has implications that differ from industry to industry
and from region to region. These differences in industry implications arise because of the nature of
the coal industry ecosystem (CIE), in which each industry occupies its unique position in the coal
industry supply chain. There are industries that provide goods and services directly to the coal
industry, and those that supply the coal industry indirectly via provision of goods and services to the
first-level suppliers and to their suppliers throughout subsequent supply chain levels and linkages.
Likewise, each region has a unique mix of industries, so as collections of industries, regional economies
also vary in terms of their position in the CIE, and in terms of the extent to which they are aligned with
the coal industry. These critical differences, in turn, give rise to impacts of coal decline that can vary
substantially from region to region, from state to state, and from county to county.
In this report, we describe an effort to provide for the Appalachian Region a clearer picture of the
implications of long term declines in the coal industry, and the way in which these implications vary
geographically. We develop and implement in this report three measures that reveal meaningful
characteristics of the CIE at the county level, in terms of: industry and place-based CIE dependence,
changes in CIE-dependent employment, and susceptibility to anticipated continued coal industry
decline. We then combine these three measures―Dependence, Impact, and Risk―to form a typology
that we apply to identify and focus on counties in three identifiable categories: Hardship counties,
Vulnerable counties, and Depressed counties.
The 123 Hardship counties rank below the median of all counties on the Dependence and Risk
dimensions, and above the median on the Impact dimension. These counties have experienced high
levels of negative impacts, but because they have lost most of their CIE-dependent industry jobs, they
are not at risk for further substantial coal decline-driven job loss. The 124 Vulnerable counties rank
below the median score on the Impact dimension, but above median scores on the Dependence and
Risk dimensions. These counties did not exhibit negative consequences of CIE decline between 2005
and 2015, but because they are CIE-dependent and at risk of further coal industry decline, they form a
group of counties with higher potential for future coal decline-driven job loss. The 83 Depressed
counties score above median on all three dimensions. They suffered CIE-dependent job losses between
2005 and 2015, they continue to host CIE-dependent industries, and they are at risk of further future
coal decline job-loss.
Finally, we narrow focus on the Depressed counties that rank highest on all three CIE-dimensions.
Specifically, there are nine Depressed counties that rank in the top 20 on all three CIE dimensions.

4
These are Mingo and Boone Counties in West Virginia; Harlan, Leslie, Martin, Pike, and Perry Counties
in Kentucky; and Buchanan and Dickenson in Virginia. Unemployment rates in these counties range
from a low of 8.9 percent to a high of 13.2 percent; job losses have been substantial, as high as 34
percent and averaging 21 percent. On average in these counties, roughly one in ten employees works in
the coal industry itself, and their wages account for almost 23 percent of county totals. In two of these
counties, coal-industry employment shares exceed 20 percent, and corresponding wage shares of total
exceed 37 percent. These Depressed counties clearly warrant special attention and concern if current
coal industry trends continue.
5
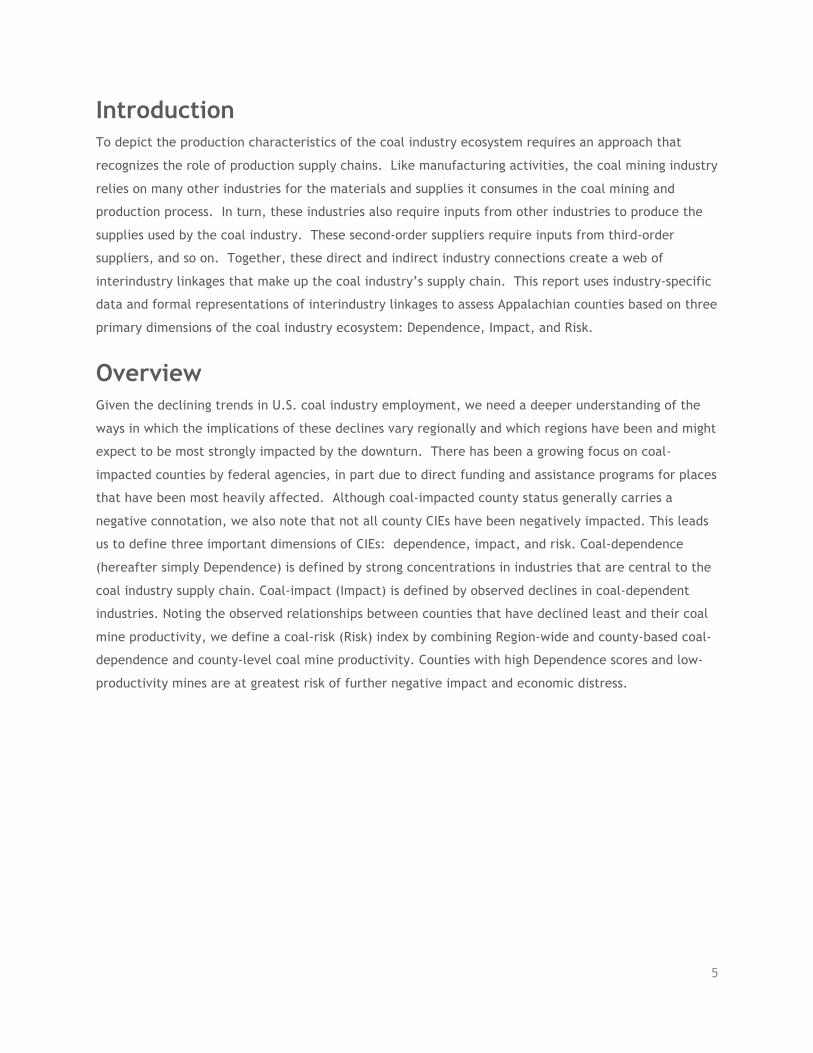
Introduction To depict the production characteristics of the coal industry ecosystem requires an approach that
recognizes the role of production supply chains. Like manufacturing activities, the coal mining industry
relies on many other industries for the materials and supplies it consumes in the coal mining and
production process. In turn, these industries also require inputs from other industries to produce the
supplies used by the coal industry. These second-order suppliers require inputs from third-order
suppliers, and so on. Together, these direct and indirect industry connections create a web of
interindustry linkages that make up the coal industry’s supply chain. This report uses industry-specific
data and formal representations of interindustry linkages to assess Appalachian counties based on three
primary dimensions of the coal industry ecosystem: Dependence, Impact, and Risk.
Overview Given the declining trends in U.S. coal industry employment, we need a deeper understanding of the
ways in which the implications of these declines vary regionally and which regions have been and might
expect to be most strongly impacted by the downturn. There has been a growing focus on coal-
impacted counties by federal agencies, in part due to direct funding and assistance programs for places
that have been most heavily affected. Although coal-impacted county status generally carries a
negative connotation, we also note that not all county CIEs have been negatively impacted. This leads
us to define three important dimensions of CIEs: dependence, impact, and risk. Coal-dependence
(hereafter simply Dependence) is defined by strong concentrations in industries that are central to the
coal industry supply chain. Coal-impact (Impact) is defined by observed declines in coal-dependent
industries. Noting the observed relationships between counties that have declined least and their coal
mine productivity, we define a coal-risk (Risk) index by combining Region-wide and county-based coal-
dependence and county-level coal mine productivity. Counties with high Dependence scores and low-
productivity mines are at greatest risk of further negative impact and economic distress.
6
Analysis To characterize counties relative to the CIE, we develop and implement a set of tools that target key
supply chain industries and supply chain level impacts at the county level. Our methods use national
benchmark input-output data from the U.S. Bureau of Economic Analysis, U.S. Department of Labor
Mine Safety and Health Administration, U.S. Department of Commerce, Census of Population, and U.S.
Bureau of Labor Statistics (BLS) Census of Employment and Wages (CEW).1
Each of the next three subsections describes one of the CIE dimensions used to characterize
Appalachian counties, including conceptual underpinnings and discussions of results presented
graphically and numerically in tabular format. Mathematical formulations for the three dimensions are
included as appendices. Next, we present a typology of Appalachian counties derived by combining the
information generated by the three separate dimensions. The typology’s eight classes provide an
effective summary of the extent to which Appalachian counties have been affected by coal industry
declines.
CIE Dependence The overall objective in developing a county-based measure of coal dependence is to quantify the
extent to which a county’s economy is dependent on coal. Counties that have relatively large and
diverse economies would be expected to be able to adapt to changes in the CIE better than those
whose economic activities are tied strongly, either directly or indirectly, to the coal industry. In terms
of economic resilience to coal industry downturns, then, Dependence is considered to be a negative.
CIE Industry Scores
To estimate county dependence on coal requires that we develop a way to measure each industry’s
direct and indirect dependence on coal. We can then combine this metric with county distributions of
employment by industry to determine the shares of each industry’s employment that are coal-oriented.
The ratio of the sum of all industries’ coal-oriented employment to county total employment will then
provide a direct measure of county coal-dependence.
1 The BLS data are enhanced and extended by the Implan Group, a well-established commercial provider of such data. Published BLS CEW data omit data values that are subject to disclosure rules. Implan provides consistent estimates for missing data at the county level.
7
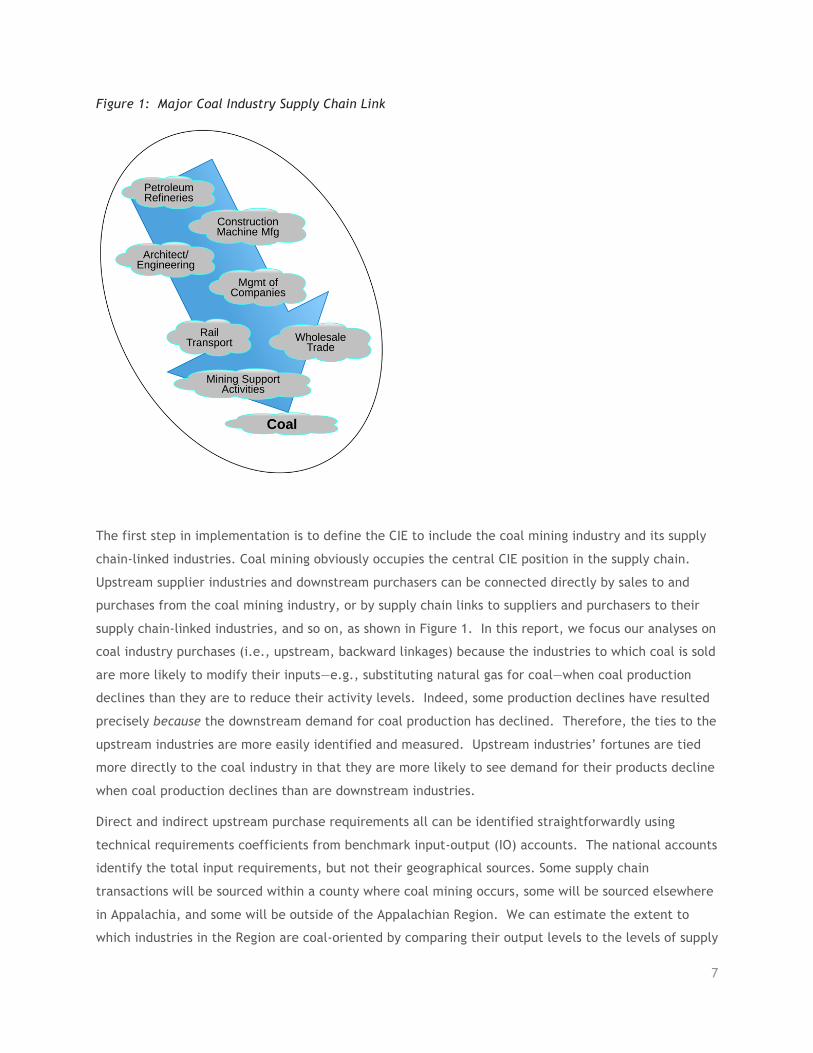
Figure 1: Major Coal Industry Supply Chain Link
The first step in implementation is to define the CIE to include the coal mining industry and its supply
chain-linked industries. Coal mining obviously occupies the central CIE position in the supply chain.
Upstream supplier industries and downstream purchasers can be connected directly by sales to and
purchases from the coal mining industry, or by supply chain links to suppliers and purchasers to their
supply chain-linked industries, and so on, as shown in Figure 1. In this report, we focus our analyses on
coal industry purchases (i.e., upstream, backward linkages) because the industries to which coal is sold
are more likely to modify their inputs—e.g., substituting natural gas for coal—when coal production
declines than they are to reduce their activity levels. Indeed, some production declines have resulted
precisely because the downstream demand for coal production has declined. Therefore, the ties to the
upstream industries are more easily identified and measured. Upstream industries’ fortunes are tied
more directly to the coal industry in that they are more likely to see demand for their products decline
when coal production declines than are downstream industries.
Direct and indirect upstream purchase requirements all can be identified straightforwardly using
technical requirements coefficients from benchmark input-output (IO) accounts. The national accounts
identify the total input requirements, but not their geographical sources. Some supply chain
transactions will be sourced within a county where coal mining occurs, some will be sourced elsewhere
in Appalachia, and some will be outside of the Appalachian Region. We can estimate the extent to
which industries in the Region are coal-oriented by comparing their output levels to the levels of supply
8
needed to satisfy the direct and indirect demand due to coal industry operation in the Appalachian
Region. For these reasons, we use information from the U.S. Bureau of Economic Analysis national
input-output accounts to define the technical relationships among industries and, in turn, use this
technical information in combination with Appalachian coal production statistics to identify the shares
of output from other industries that would be needed to support the Appalachian Region’s coal
industry. If an industry in the Appalachian Region produces less output than is needed to support
Appalachian coal production, then we assume that all its production is entirely coal-dependent. If it
produces more than enough to satisfy demands directly and indirectly associated with coal, then the
coal-dependent share is the ratio of the amount needed by the Appalachian coal industry to the
amount produced.
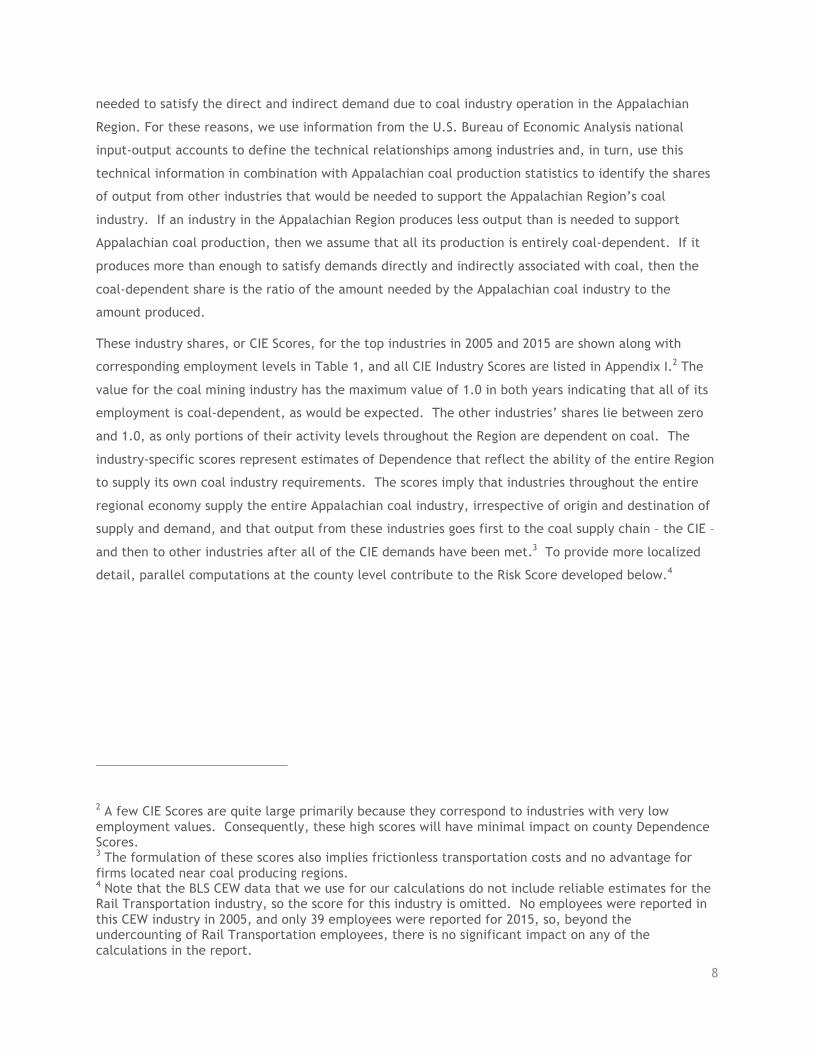
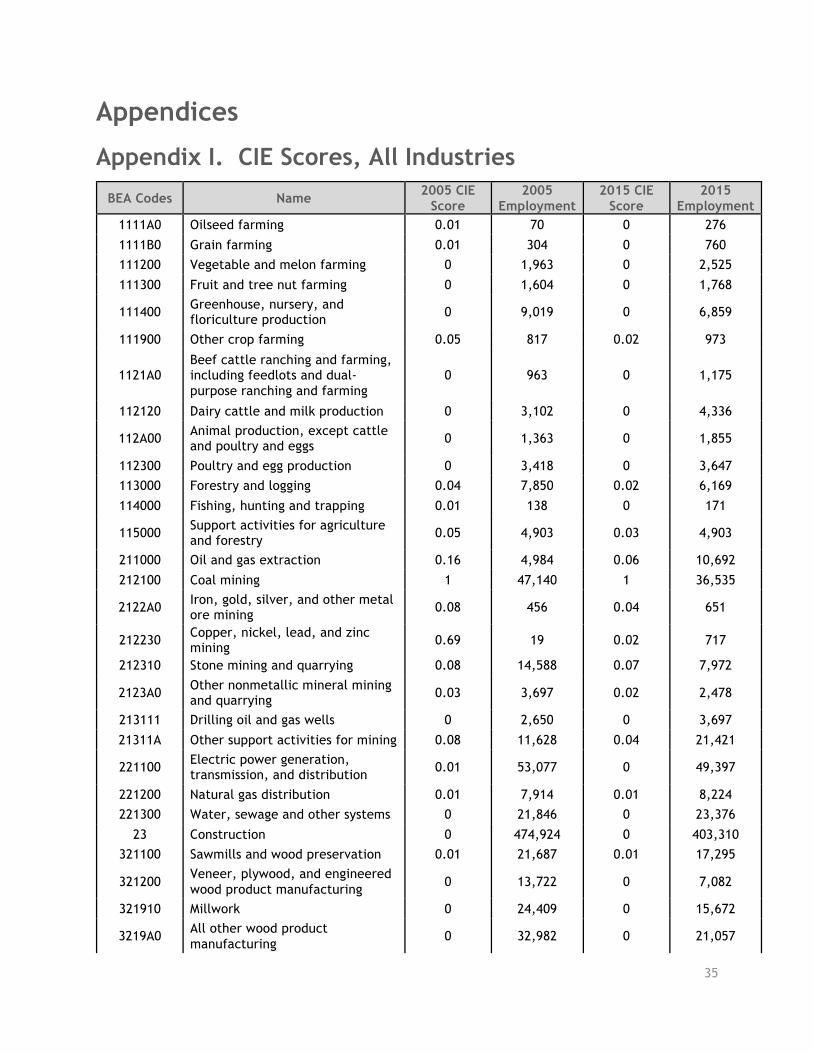
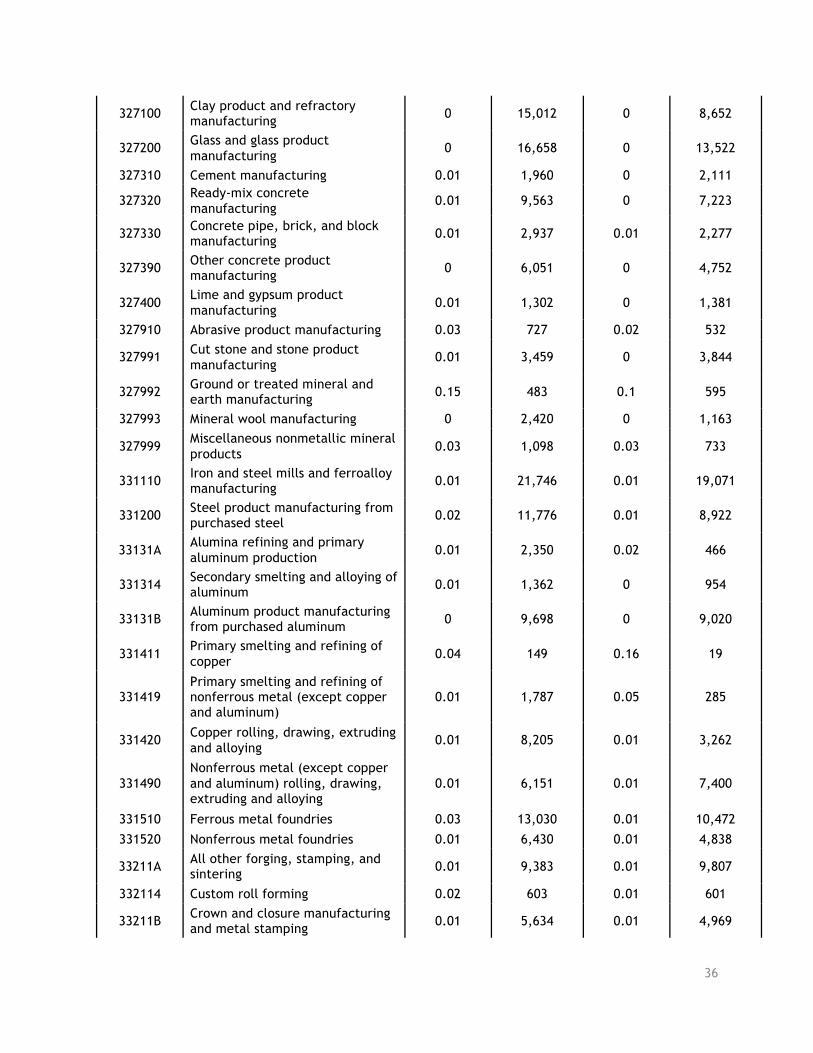
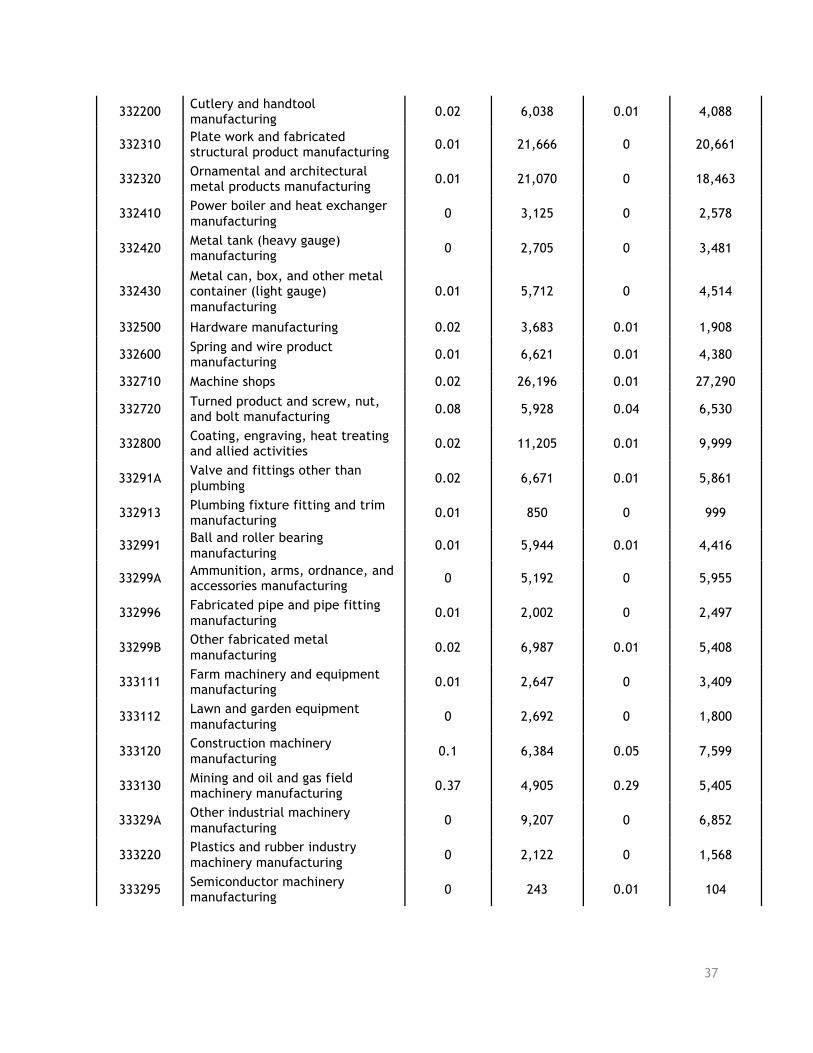
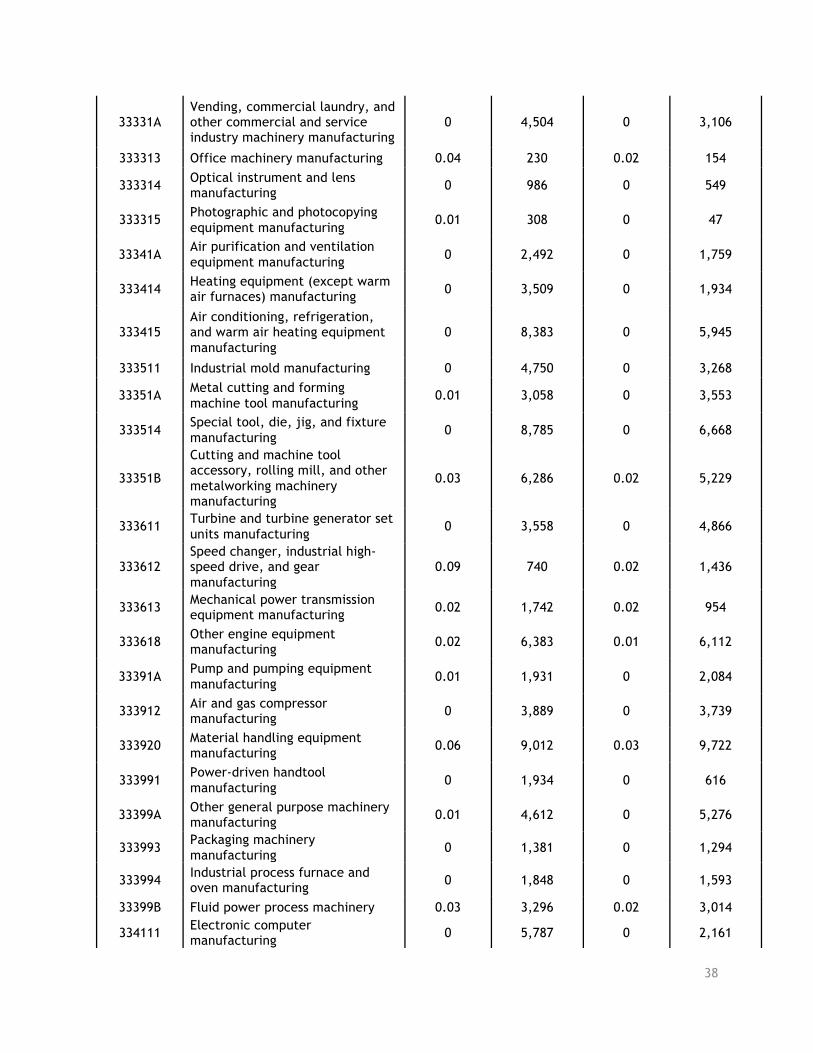
These industry shares, or CIE Scores, for the top industries in 2005 and 2015 are shown along with
corresponding employment levels in Table 1, and all CIE Industry Scores are listed in Appendix I.2 The
value for the coal mining industry has the maximum value of 1.0 in both years indicating that all of its
employment is coal-dependent, as would be expected. The other industries’ shares lie between zero
and 1.0, as only portions of their activity levels throughout the Region are dependent on coal. The
industry-specific scores represent estimates of Dependence that reflect the ability of the entire Region
to supply its own coal industry requirements. The scores imply that industries throughout the entire
regional economy supply the entire Appalachian coal industry, irrespective of origin and destination of
supply and demand, and that output from these industries goes first to the coal supply chain – the CIE –
and then to other industries after all of the CIE demands have been met.3 To provide more localized
detail, parallel computations at the county level contribute to the Risk Score developed below.4
2 A few CIE Scores are quite large primarily because they correspond to industries with very low employment values. Consequently, these high scores will have minimal impact on county Dependence Scores. 3 The formulation of these scores also implies frictionless transportation costs and no advantage for firms located near coal producing regions. 4 Note that the BLS CEW data that we use for our calculations do not include reliable estimates for the Rail Transportation industry, so the score for this industry is omitted. No employees were reported in this CEW industry in 2005, and only 39 employees were reported for 2015, so, beyond the undercounting of Rail Transportation employees, there is no significant impact on any of the calculations in the report.
9
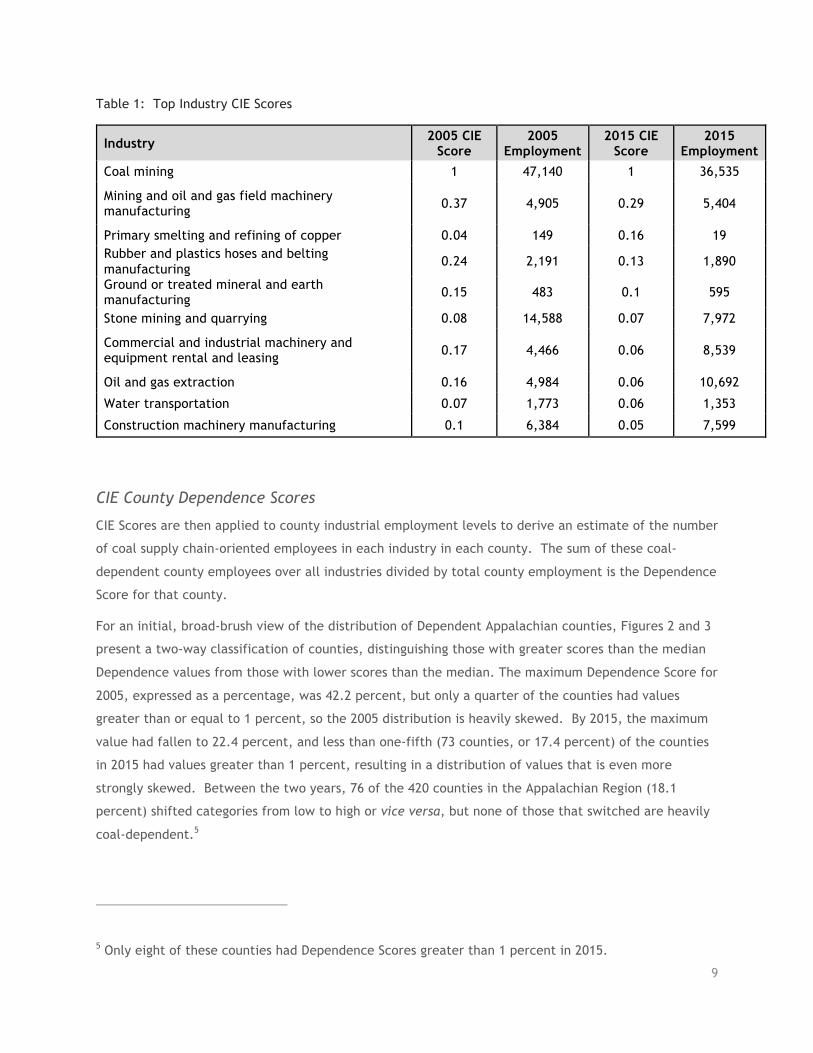
Table 1: Top Industry CIE Scores
Industry 2005 CIE Score
2005 Employment
2015 CIE Score
2015 Employment
Coal mining 1 47,140 1 36,535
Mining and oil and gas field machinery manufacturing 0.37 4,905 0.29 5,404
Primary smelting and refining of copper 0.04 149 0.16 19 Rubber and plastics hoses and belting manufacturing
0.24 2,191 0.13 1,890
Ground or treated mineral and earth manufacturing 0.15 483 0.1 595
Stone mining and quarrying 0.08 14,588 0.07 7,972
Commercial and industrial machinery and equipment rental and leasing 0.17 4,466 0.06 8,539
Oil and gas extraction 0.16 4,984 0.06 10,692
Water transportation 0.07 1,773 0.06 1,353
Construction machinery manufacturing 0.1 6,384 0.05 7,599
CIE County Dependence Scores
CIE Scores are then applied to county industrial employment levels to derive an estimate of the number
of coal supply chain-oriented employees in each industry in each county. The sum of these coal-
dependent county employees over all industries divided by total county employment is the Dependence
Score for that county.
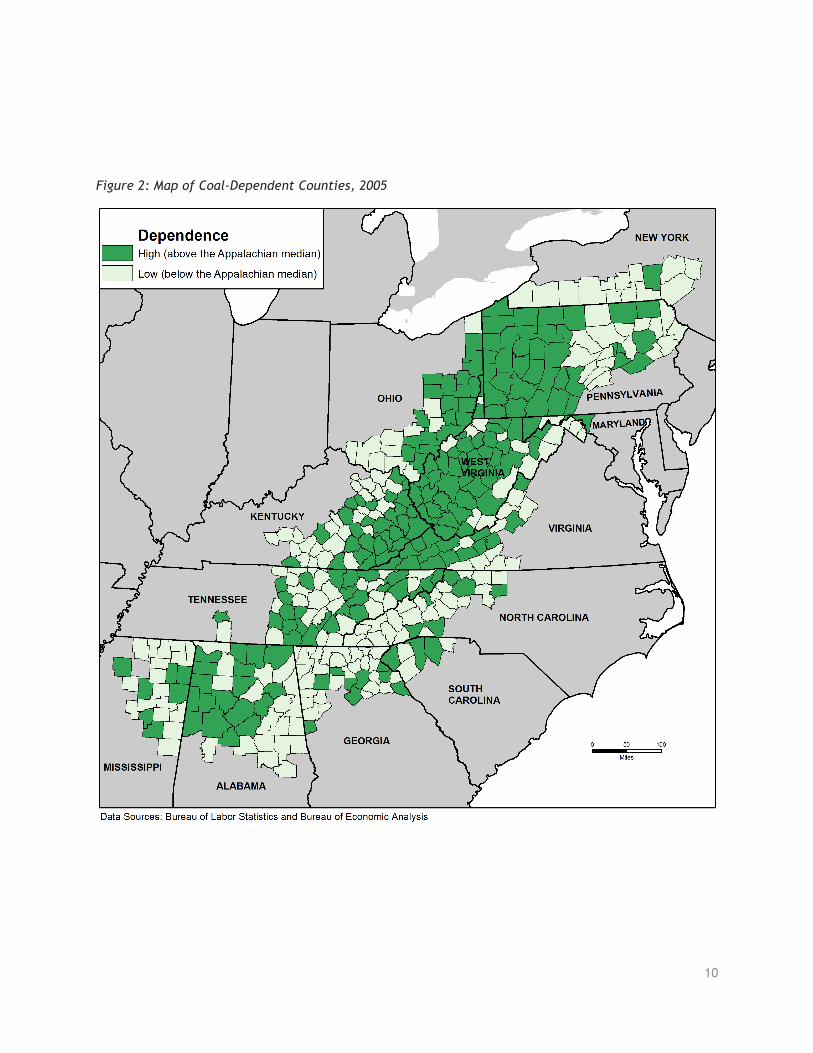
For an initial, broad-brush view of the distribution of Dependent Appalachian counties, Figures 2 and 3
present a two-way classification of counties, distinguishing those with greater scores than the median
Dependence values from those with lower scores than the median. The maximum Dependence Score for
2005, expressed as a percentage, was 42.2 percent, but only a quarter of the counties had values
greater than or equal to 1 percent, so the 2005 distribution is heavily skewed. By 2015, the maximum
value had fallen to 22.4 percent, and less than one-fifth (73 counties, or 17.4 percent) of the counties
in 2015 had values greater than 1 percent, resulting in a distribution of values that is even more
strongly skewed. Between the two years, 76 of the 420 counties in the Appalachian Region (18.1
percent) shifted categories from low to high or vice versa, but none of those that switched are heavily
coal-dependent.5
5 Only eight of these counties had Dependence Scores greater than 1 percent in 2015.
10
Figure 2: Map of Coal-Dependent Counties, 2005
11
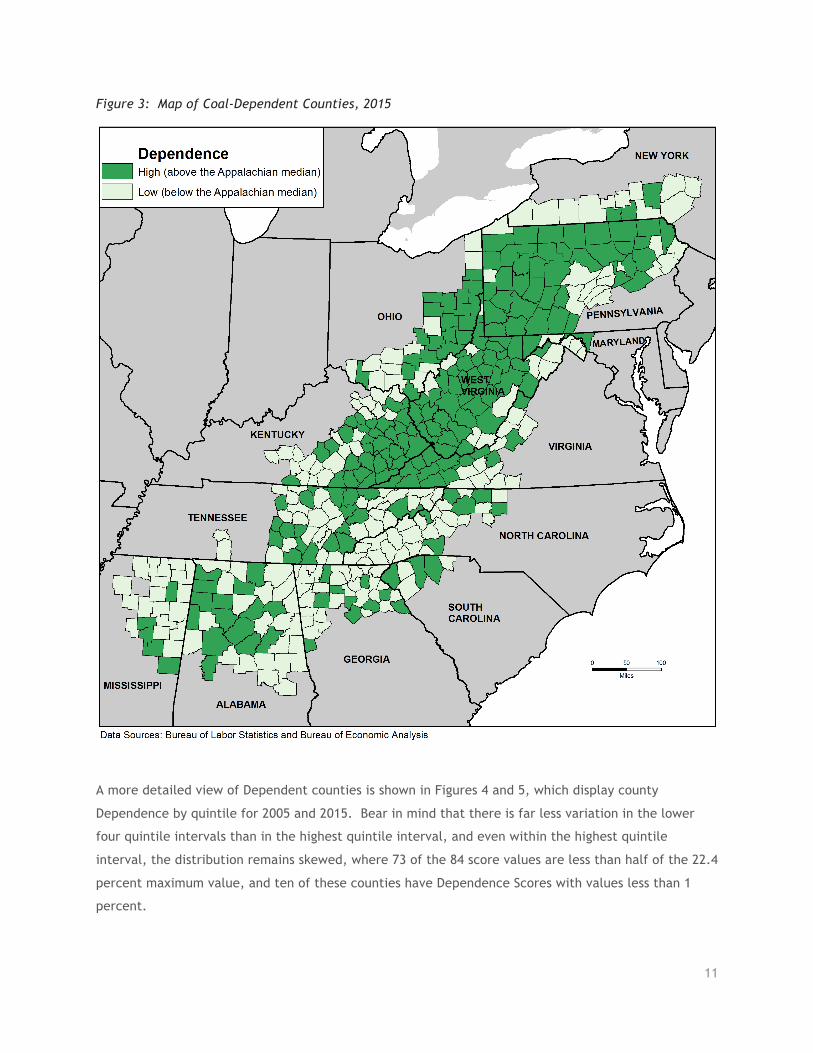
Figure 3: Map of Coal-Dependent Counties, 2015
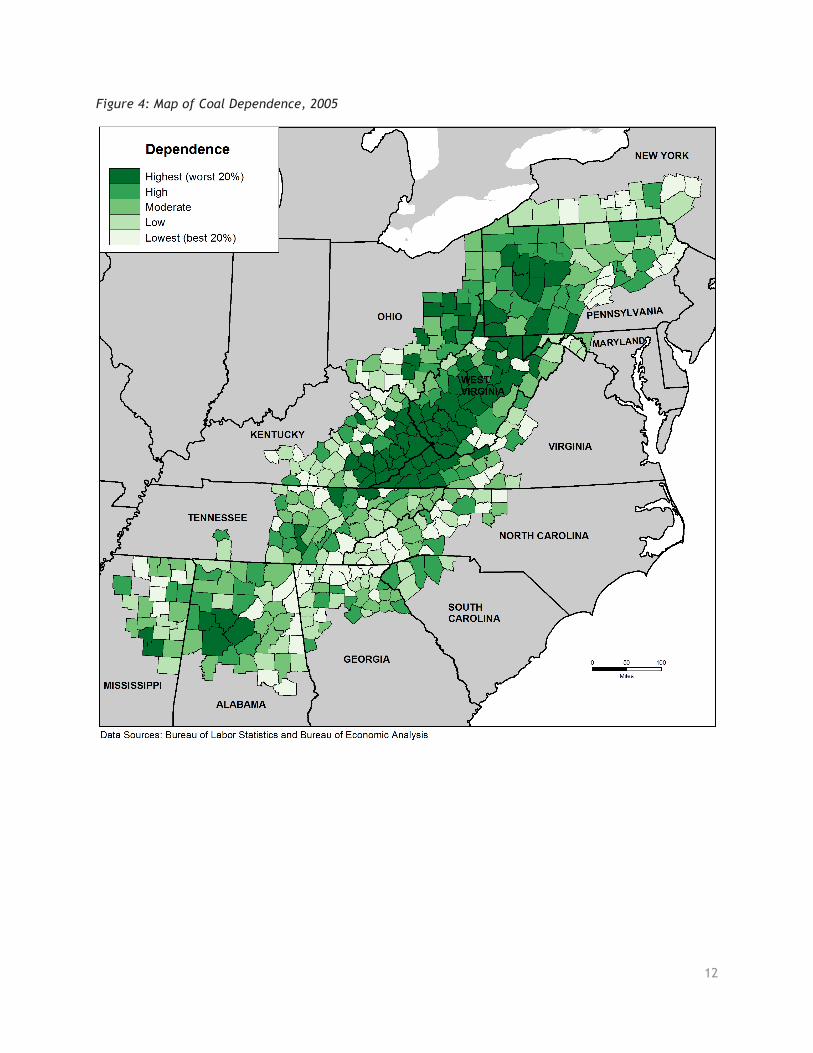
A more detailed view of Dependent counties is shown in Figures 4 and 5, which display county
Dependence by quintile for 2005 and 2015. Bear in mind that there is far less variation in the lower
four quintile intervals than in the highest quintile interval, and even within the highest quintile
interval, the distribution remains skewed, where 73 of the 84 score values are less than half of the 22.4
percent maximum value, and ten of these counties have Dependence Scores with values less than 1
percent.
12
Figure 4: Map of Coal Dependence, 2005
13
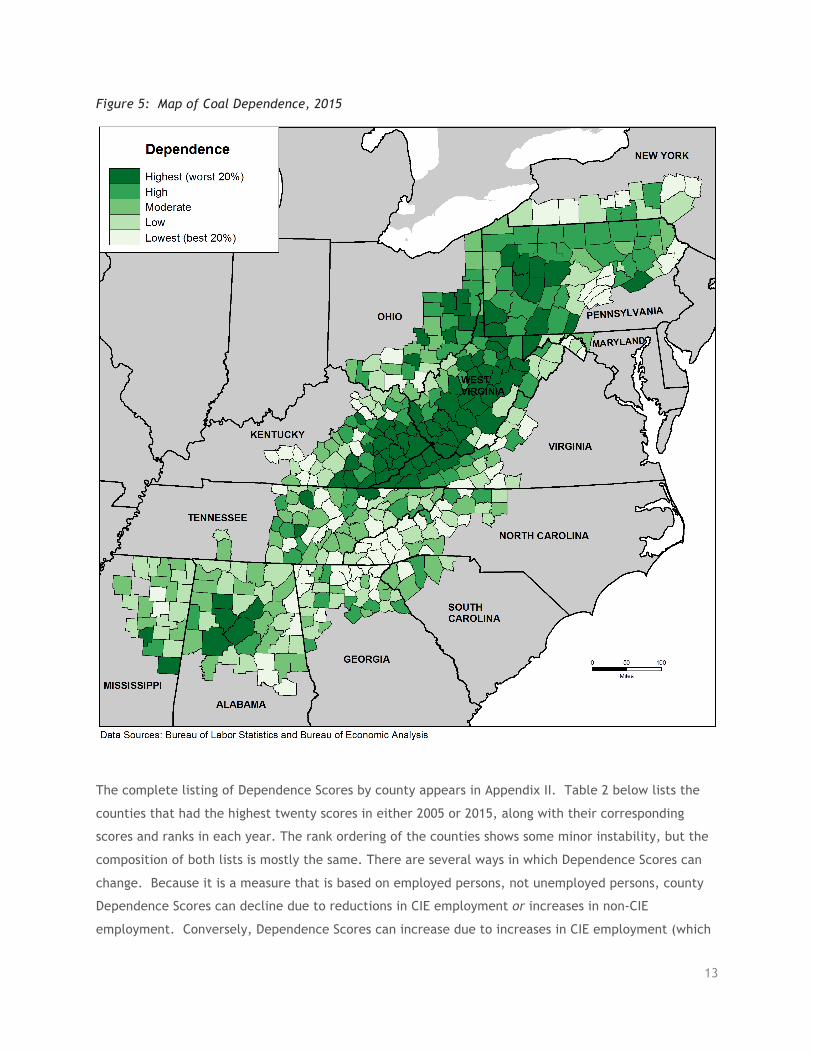
Figure 5: Map of Coal Dependence, 2015
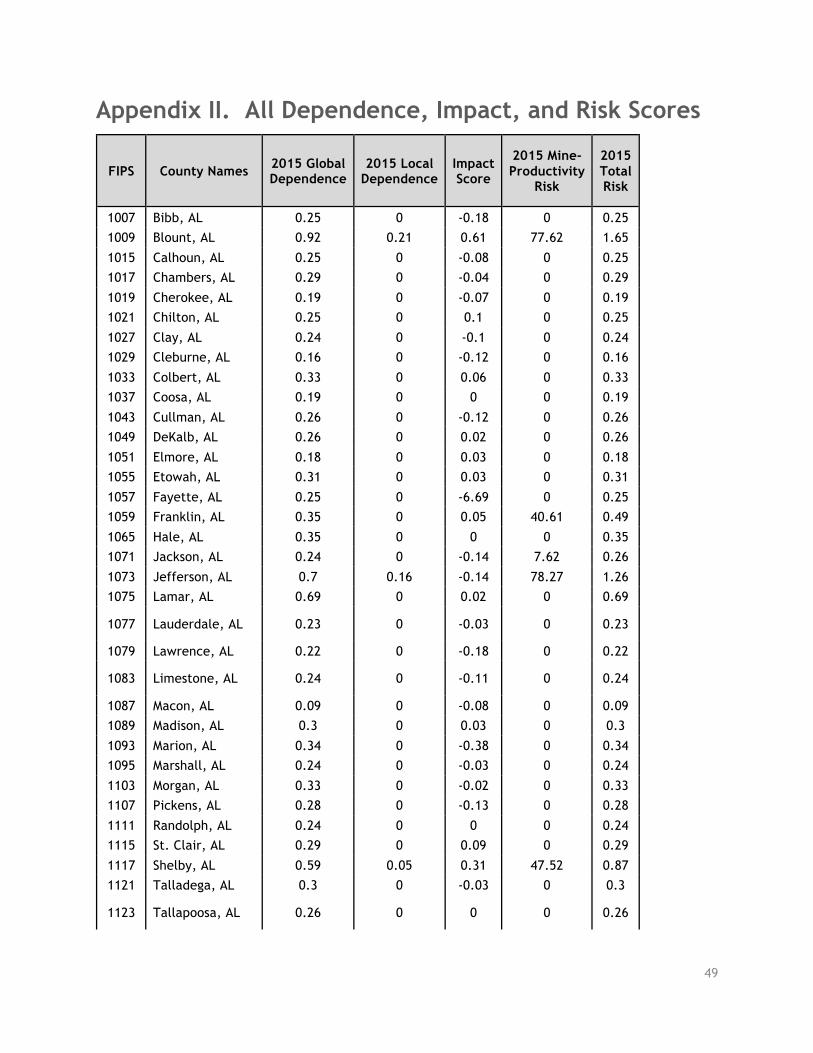
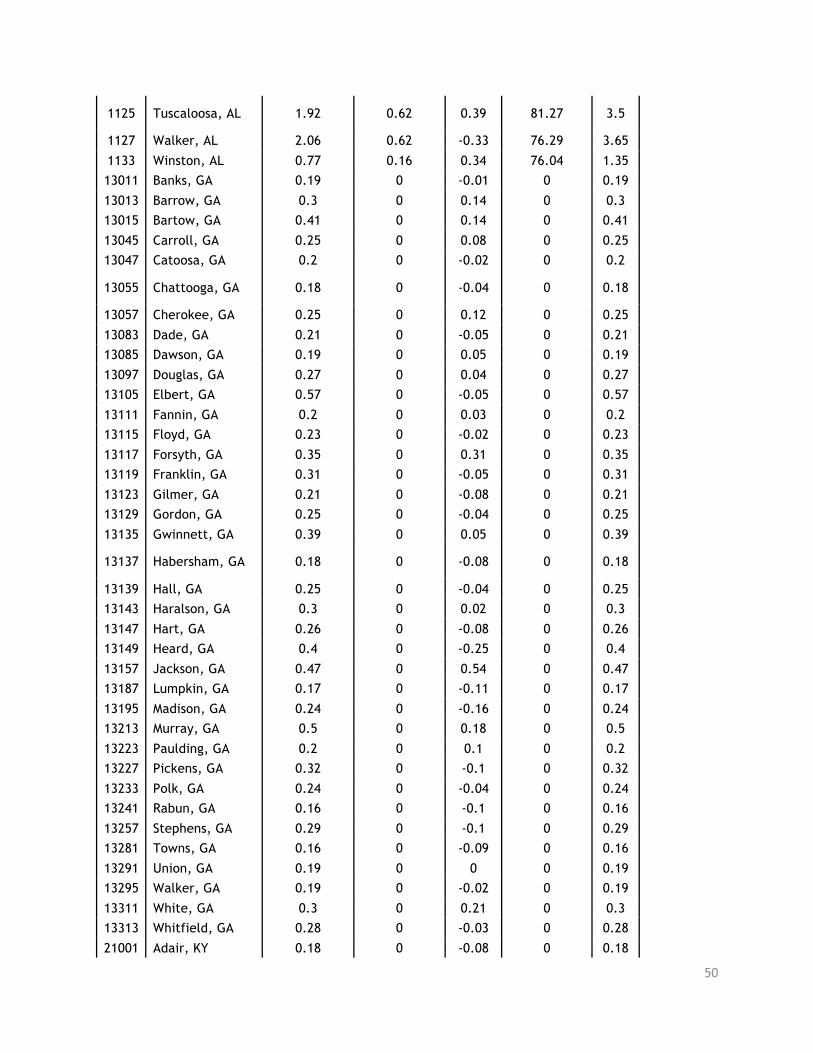
The complete listing of Dependence Scores by county appears in Appendix II. Table 2 below lists the
counties that had the highest twenty scores in either 2005 or 2015, along with their corresponding
scores and ranks in each year. The rank ordering of the counties shows some minor instability, but the
composition of both lists is mostly the same. There are several ways in which Dependence Scores can
change. Because it is a measure that is based on employed persons, not unemployed persons, county
Dependence Scores can decline due to reductions in CIE employment or increases in non-CIE
employment. Conversely, Dependence Scores can increase due to increases in CIE employment (which
14
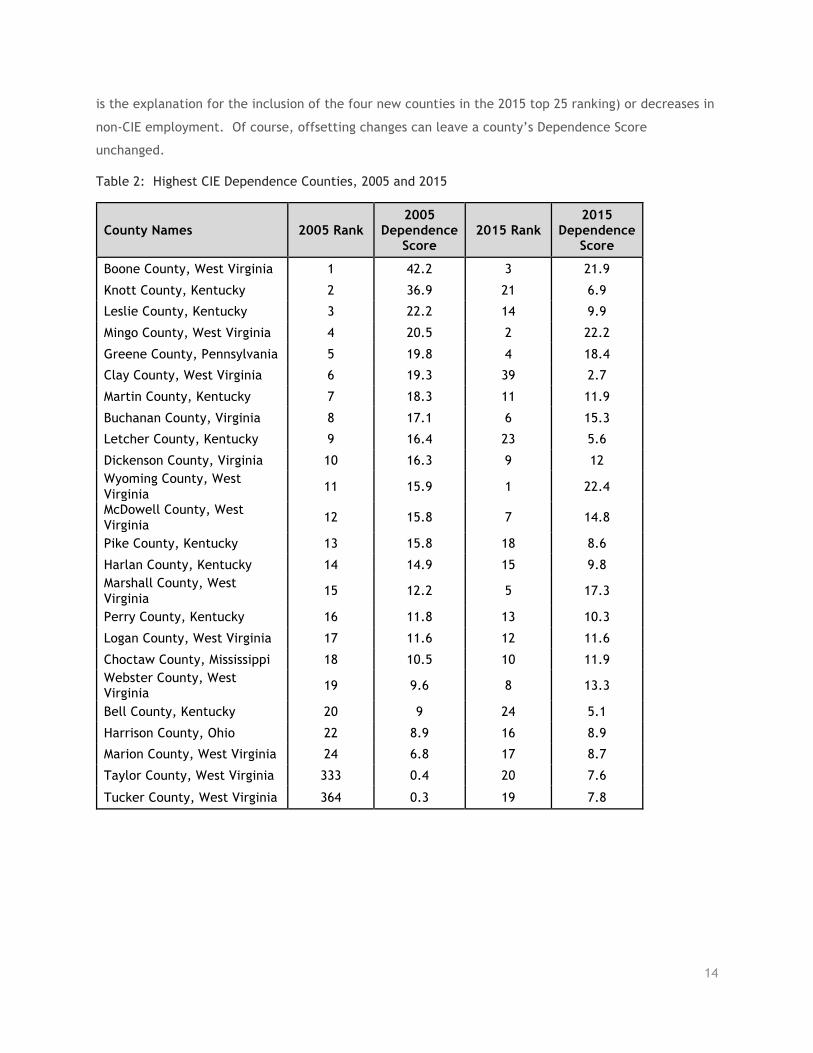
is the explanation for the inclusion of the four new counties in the 2015 top 25 ranking) or decreases in
non-CIE employment. Of course, offsetting changes can leave a county’s Dependence Score
unchanged.
Table 2: Highest CIE Dependence Counties, 2005 and 2015
County Names 2005 Rank 2005
Dependence Score
2015 Rank 2015
Dependence Score
Boone County, West Virginia 1 42.2 3 21.9
Knott County, Kentucky 2 36.9 21 6.9
Leslie County, Kentucky 3 22.2 14 9.9
Mingo County, West Virginia 4 20.5 2 22.2
Greene County, Pennsylvania 5 19.8 4 18.4
Clay County, West Virginia 6 19.3 39 2.7
Martin County, Kentucky 7 18.3 11 11.9
Buchanan County, Virginia 8 17.1 6 15.3
Letcher County, Kentucky 9 16.4 23 5.6
Dickenson County, Virginia 10 16.3 9 12 Wyoming County, West Virginia 11 15.9 1 22.4
McDowell County, West Virginia
12 15.8 7 14.8
Pike County, Kentucky 13 15.8 18 8.6
Harlan County, Kentucky 14 14.9 15 9.8 Marshall County, West Virginia
15 12.2 5 17.3
Perry County, Kentucky 16 11.8 13 10.3
Logan County, West Virginia 17 11.6 12 11.6
Choctaw County, Mississippi 18 10.5 10 11.9 Webster County, West Virginia 19 9.6 8 13.3
Bell County, Kentucky 20 9 24 5.1
Harrison County, Ohio 22 8.9 16 8.9
Marion County, West Virginia 24 6.8 17 8.7
Taylor County, West Virginia 333 0.4 20 7.6
Tucker County, West Virginia 364 0.3 19 7.8
15
CIE Impact Our county-level CIE Impact Scores are formed by combining the industry-based CIE Scores with
employment change by industry, expressing the sum of the employment change-weighted CIE Scores as
a share of total employment. The rationale for this approach is that if observed job loss occurs in coal-
oriented industries, then this negative economic impact and accompanying economic distress is the
share of that employment loss that is associated with the coal industry. Employment change is defined
as 2015 employment less 2005 employment.6 Employment loss yields negative values, so larger
negative values correspond to greater negative Impact. Perhaps somewhat surprisingly, roughly 40
percent of counties actually gained in CIE related employment, which supports the observation that
reliance on coal has not been uniformly negative across Appalachia. In 150 Appalachian counties, the
Impact Score was between 0 percent and 1 percent, indicating relatively insubstantial change in CIE
employment. Another 15 counties had Impact Scores between 1 percent and 3 percent, and the
remaining positive Impact Scores fell between 3 percent and 8 percent. Of the counties in the High
Negative Impact and Moderate Negative Impact categories, the largest value is 32.797. All but three of
the 84 counties in the Low Impact category have negative values greater between -0.059 and -0.006,
and the three positive values are less than 0.002. The Moderate Positive Impact category values range
from 0.002 to 0.112, and the remainder range upward to 7.733. All Impact Scores are included in
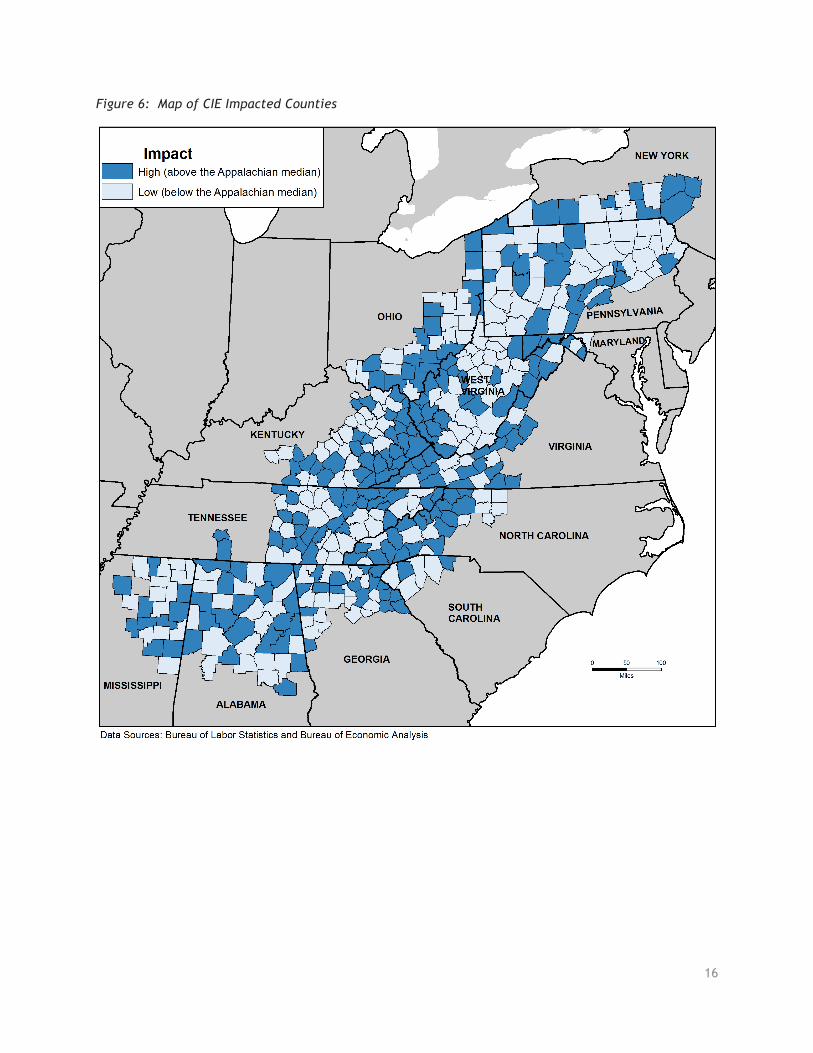
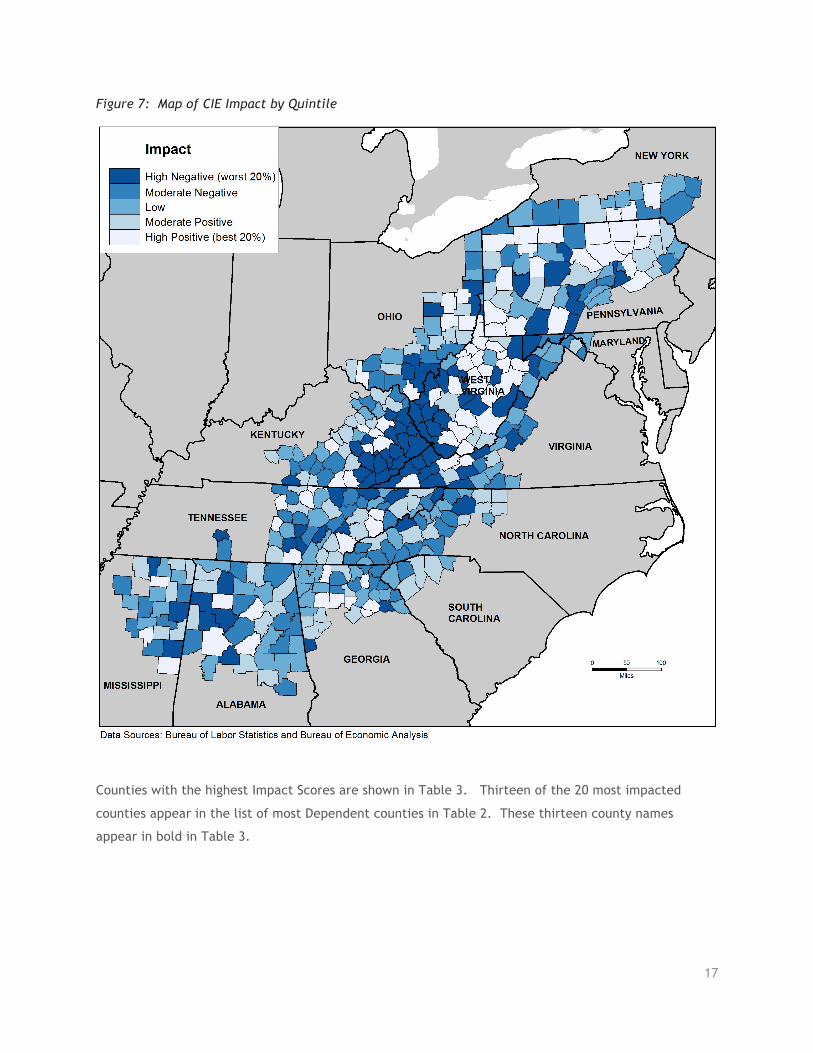
Appendix I. Figures 6 and 7 show Appalachian county Impact in two-category and quintile
representation formats, paralleling the Dependence figures above.
6 Of course, employment in CIE industries could be changing for other reasons, but the implied assumption of causality is used because of a lack of mechanism by which to identify other causes.
16
Figure 6: Map of CIE Impacted Counties
17
Figure 7: Map of CIE Impact by Quintile
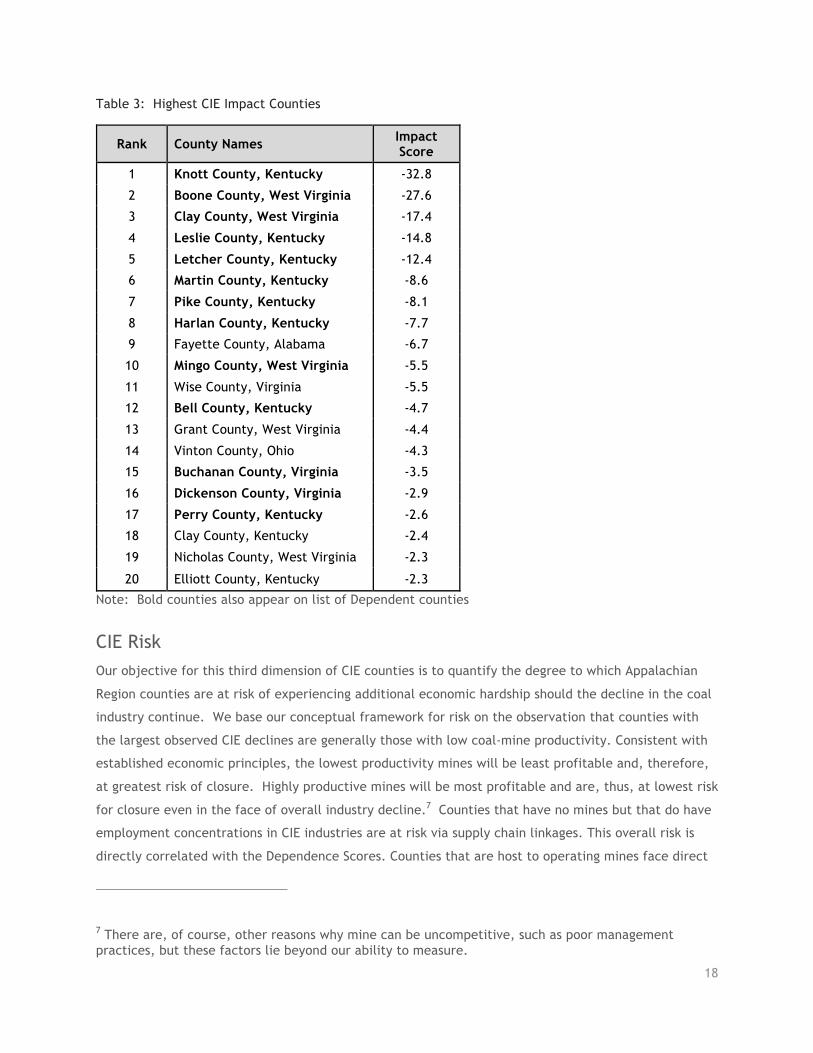
Counties with the highest Impact Scores are shown in Table 3. Thirteen of the 20 most impacted
counties appear in the list of most Dependent counties in Table 2. These thirteen county names
appear in bold in Table 3.
18
Table 3: Highest CIE Impact Counties
Rank County Names Impact Score
1 Knott County, Kentucky -32.8
2 Boone County, West Virginia -27.6
3 Clay County, West Virginia -17.4
4 Leslie County, Kentucky -14.8
5 Letcher County, Kentucky -12.4
6 Martin County, Kentucky -8.6
7 Pike County, Kentucky -8.1
8 Harlan County, Kentucky -7.7
9 Fayette County, Alabama -6.7
10 Mingo County, West Virginia -5.5
11 Wise County, Virginia -5.5
12 Bell County, Kentucky -4.7
13 Grant County, West Virginia -4.4
14 Vinton County, Ohio -4.3
15 Buchanan County, Virginia -3.5
16 Dickenson County, Virginia -2.9
17 Perry County, Kentucky -2.6
18 Clay County, Kentucky -2.4
19 Nicholas County, West Virginia -2.3
20 Elliott County, Kentucky -2.3
Note: Bold counties also appear on list of Dependent counties
CIE Risk Our objective for this third dimension of CIE counties is to quantify the degree to which Appalachian
Region counties are at risk of experiencing additional economic hardship should the decline in the coal
industry continue. We base our conceptual framework for risk on the observation that counties with
the largest observed CIE declines are generally those with low coal-mine productivity. Consistent with
established economic principles, the lowest productivity mines will be least profitable and, therefore,
at greatest risk of closure. Highly productive mines will be most profitable and are, thus, at lowest risk
for closure even in the face of overall industry decline.7 Counties that have no mines but that do have
employment concentrations in CIE industries are at risk via supply chain linkages. This overall risk is
directly correlated with the Dependence Scores. Counties that are host to operating mines face direct
7 There are, of course, other reasons why mine can be uncompetitive, such as poor management practices, but these factors lie beyond our ability to measure.
19
risks of declining coal industry operation and localized supply-chain linkages that are tied to localized
coal industry support activity. To capture this additional level of localized risk in coal-producing
counties, we compute county-specific CIE industry scores from localized rather than Region-wide
production levels, and we then use these localized scores to generate a localized dependence score for
each county.
Mine productivity is assigned an index value between 0.0 and 1.0, and the localized dependence score
values can vary from 0.0 to 1.0. The final Risk Score is the original, Region-wide Dependence Score
combined with these two new variables. The formula for doing so is CRS = (CDS)(1 + Q)(1 + B), where
CRS and CDS are CIE Risk and Dependence Scores, Q is the county-specific productivity-based risk
index, and B is the localized, county-specific dependence score. More formal mathematical
expressions for all measures are included in Appendix III.
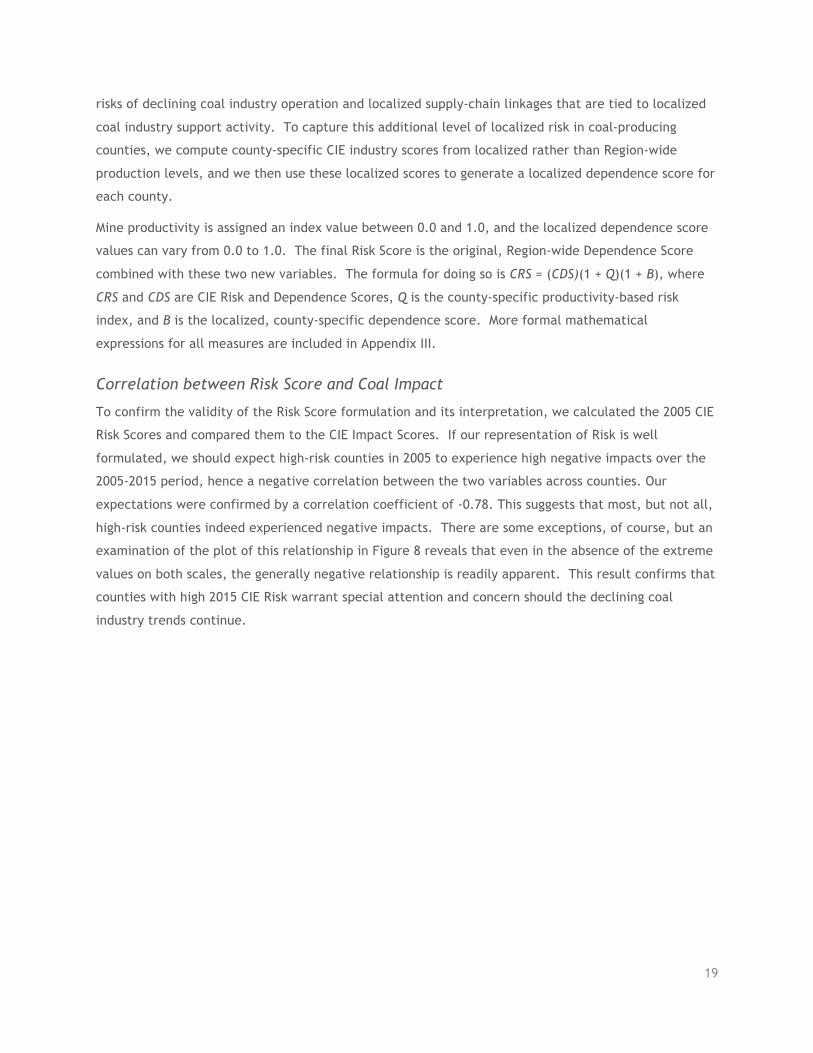
Correlation between Risk Score and Coal Impact
To confirm the validity of the Risk Score formulation and its interpretation, we calculated the 2005 CIE
Risk Scores and compared them to the CIE Impact Scores. If our representation of Risk is well
formulated, we should expect high-risk counties in 2005 to experience high negative impacts over the
2005-2015 period, hence a negative correlation between the two variables across counties. Our
expectations were confirmed by a correlation coefficient of -0.78. This suggests that most, but not all,
high-risk counties indeed experienced negative impacts. There are some exceptions, of course, but an
examination of the plot of this relationship in Figure 8 reveals that even in the absence of the extreme
values on both scales, the generally negative relationship is readily apparent. This result confirms that
counties with high 2015 CIE Risk warrant special attention and concern should the declining coal
industry trends continue.
20
Figure 8: Correlation (-0.779) between Coal Risk Score and Coal Impact Score
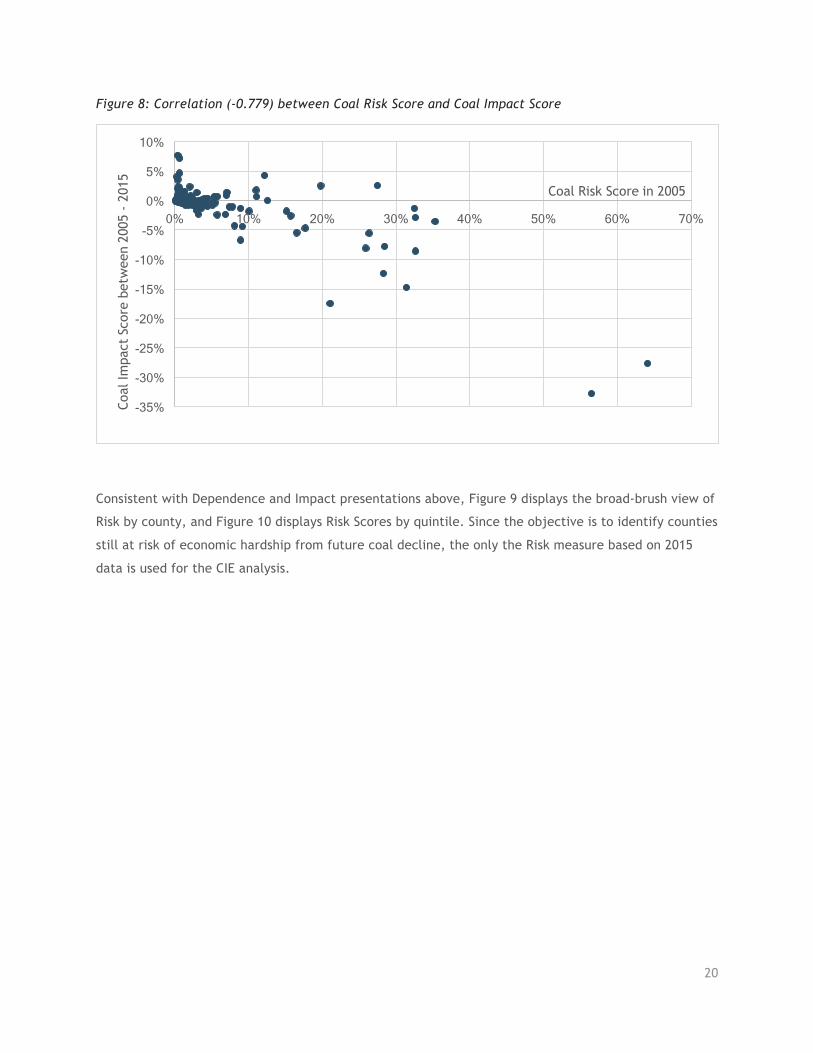
Consistent with Dependence and Impact presentations above, Figure 9 displays the broad-brush view of
Risk by county, and Figure 10 displays Risk Scores by quintile. Since the objective is to identify counties
still at risk of economic hardship from future coal decline, the only the Risk measure based on 2015
data is used for the CIE analysis.
-35%
-30%
-25%
-20%
-15%
-10%
-5%
0%
5%
10%
0% 10% 20% 30% 40% 50% 60% 70%
Coal
Impa
ct S
core
bet
wee
n 20
05 -
2015 Coal Risk Score in 2005
21
Figure 9: Map of 2015 CIE Risk
22
Figure 10: Map of 2015 CIE Risk Score by Quintile
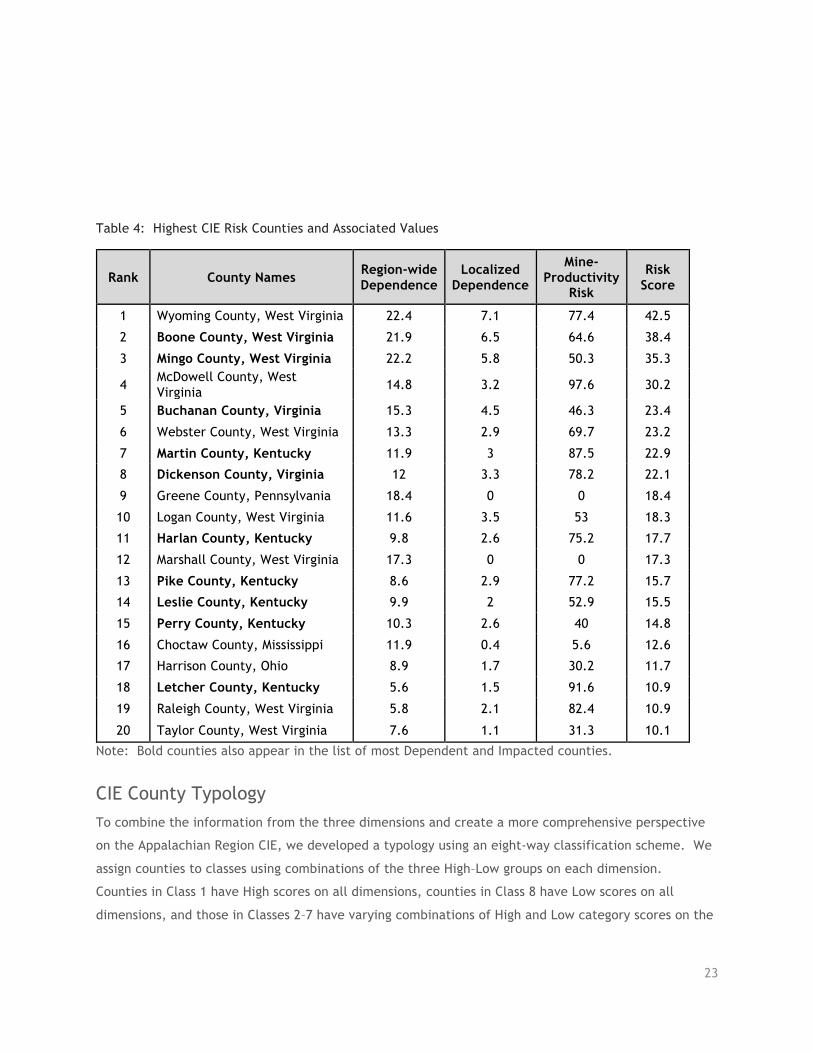
Ten of the 20 most impacted counties appear in the lists in Tables 2 and 3. These ten county names
appear in bold in Table 4. Because Dependence is a component of Risk, these two measures are more
strongly correlated than other CIE-dimension pairs.
23
Table 4: Highest CIE Risk Counties and Associated Values
Rank County Names Region-wide Dependence
Localized Dependence
Mine-Productivity
Risk
Risk Score
1 Wyoming County, West Virginia 22.4 7.1 77.4 42.5
2 Boone County, West Virginia 21.9 6.5 64.6 38.4
3 Mingo County, West Virginia 22.2 5.8 50.3 35.3
4 McDowell County, West Virginia 14.8 3.2 97.6 30.2
5 Buchanan County, Virginia 15.3 4.5 46.3 23.4
6 Webster County, West Virginia 13.3 2.9 69.7 23.2
7 Martin County, Kentucky 11.9 3 87.5 22.9
8 Dickenson County, Virginia 12 3.3 78.2 22.1
9 Greene County, Pennsylvania 18.4 0 0 18.4
10 Logan County, West Virginia 11.6 3.5 53 18.3
11 Harlan County, Kentucky 9.8 2.6 75.2 17.7
12 Marshall County, West Virginia 17.3 0 0 17.3
13 Pike County, Kentucky 8.6 2.9 77.2 15.7
14 Leslie County, Kentucky 9.9 2 52.9 15.5
15 Perry County, Kentucky 10.3 2.6 40 14.8
16 Choctaw County, Mississippi 11.9 0.4 5.6 12.6
17 Harrison County, Ohio 8.9 1.7 30.2 11.7
18 Letcher County, Kentucky 5.6 1.5 91.6 10.9
19 Raleigh County, West Virginia 5.8 2.1 82.4 10.9
20 Taylor County, West Virginia 7.6 1.1 31.3 10.1
Note: Bold counties also appear in the list of most Dependent and Impacted counties.
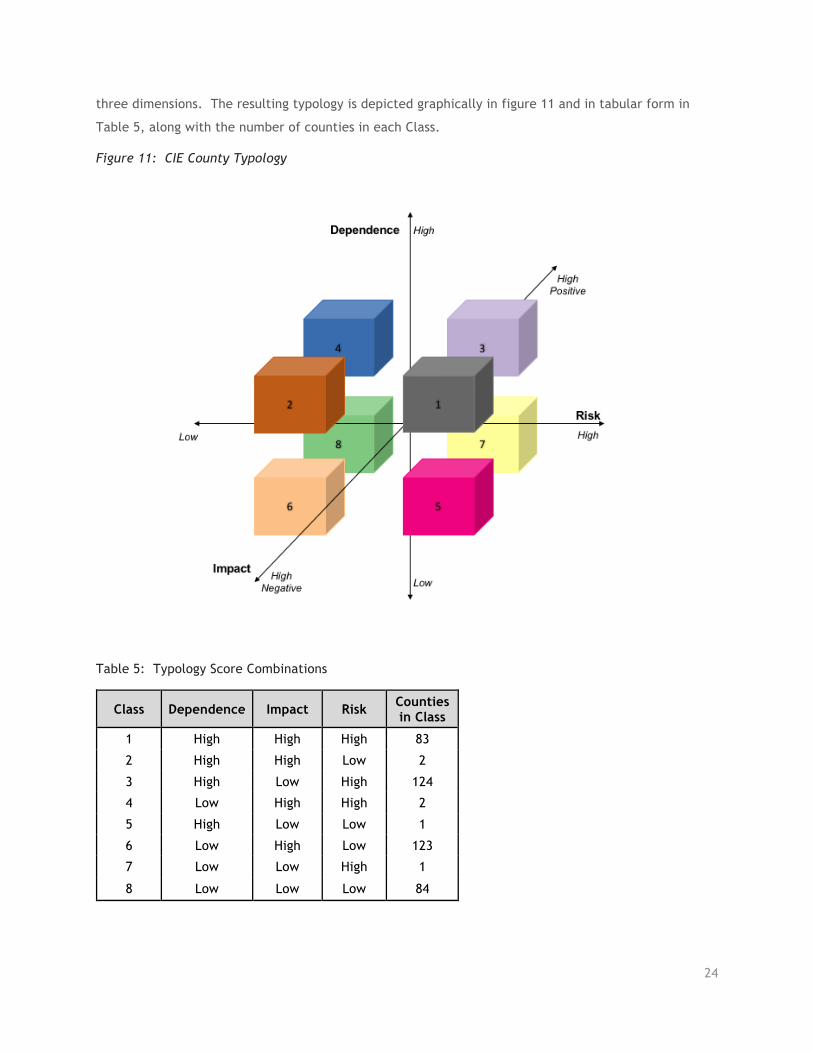
CIE County Typology To combine the information from the three dimensions and create a more comprehensive perspective
on the Appalachian Region CIE, we developed a typology using an eight-way classification scheme. We
assign counties to classes using combinations of the three High–Low groups on each dimension.
Counties in Class 1 have High scores on all dimensions, counties in Class 8 have Low scores on all
dimensions, and those in Classes 2–7 have varying combinations of High and Low category scores on the
24
three dimensions. The resulting typology is depicted graphically in figure 11 and in tabular form in
Table 5, along with the number of counties in each Class.
Figure 11: CIE County Typology
Table 5: Typology Score Combinations
Class Dependence Impact Risk Counties in Class
1 High High High 83
2 High High Low 2
3 High Low High 124
4 Low High High 2
5 High Low Low 1
6 Low High Low 123
7 Low Low High 1
8 Low Low Low 84

25
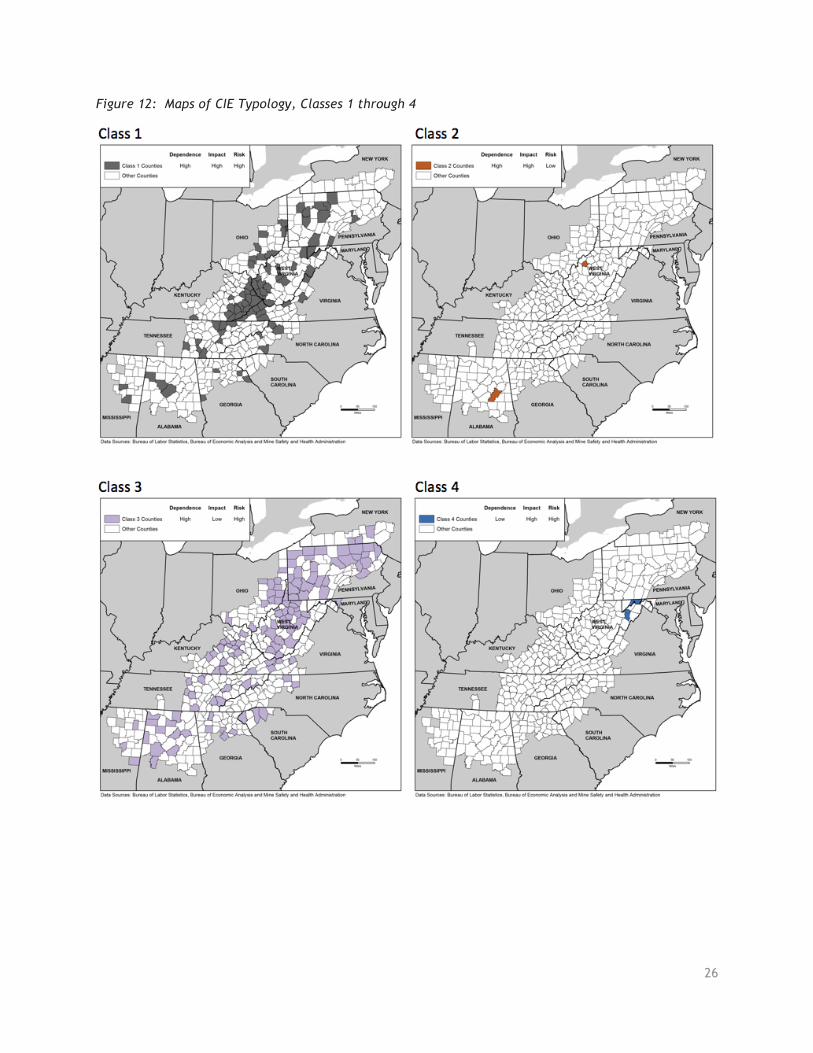
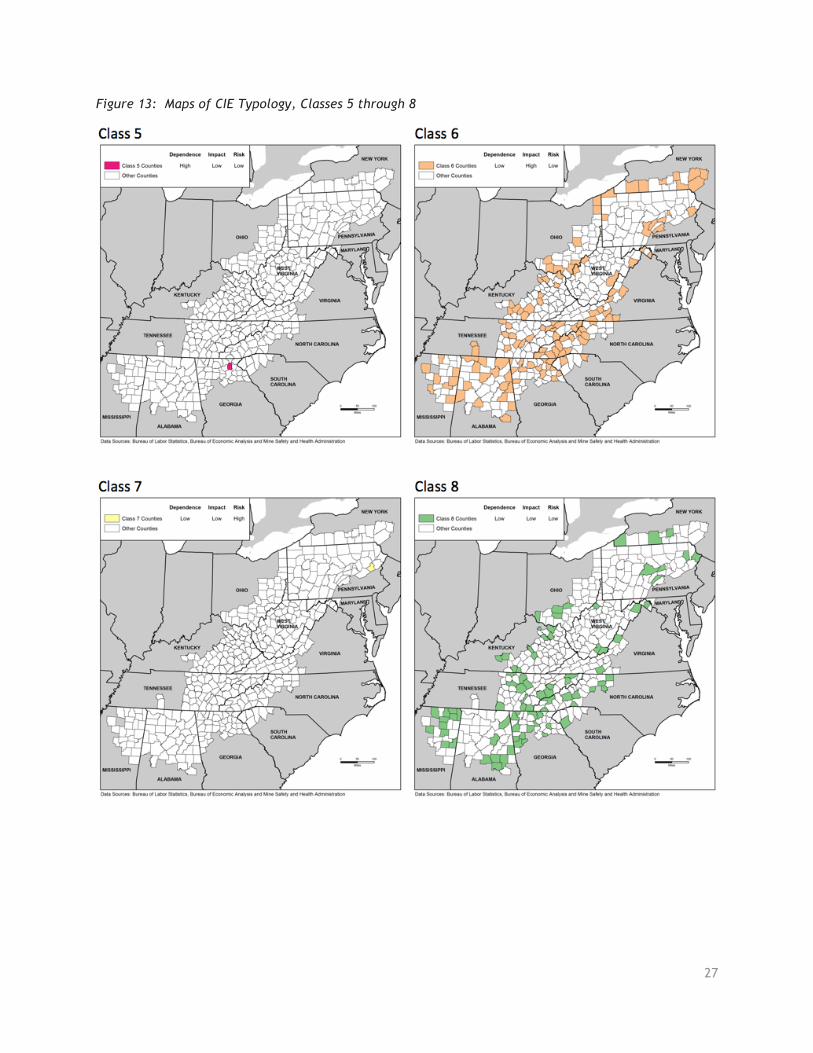
Counties in Classes 1 through 8 can be seen in the panels of Maps 9 and 10, and the overall distribution
of counties by Class is shown in Map 11. Classes 1, 3, 6, and 8 are the most heavily populated, as would
be expected given the correlation between Dependence and Risk. Counties in Class 1 are clearly the
most distressed, and comprise the Depressed category. Counties in Class 3, the Vulnerable counties,
have not yet faced the levels of economic hardship of other CIE-dependent counties but are vulnerable
to continued coal-industry decline. The Class 6 Hardship counties have experienced CIE-based
declines, but because they have lost the majority of their CIE, their economies are no longer CIE-
dependent, so are not expected to incur further substantial CIE-based job loss. Counties in Class 8 are
the least affected by the coal industry.
26
Figure 12: Maps of CIE Typology, Classes 1 through 4
27
Figure 13: Maps of CIE Typology, Classes 5 through 8
28
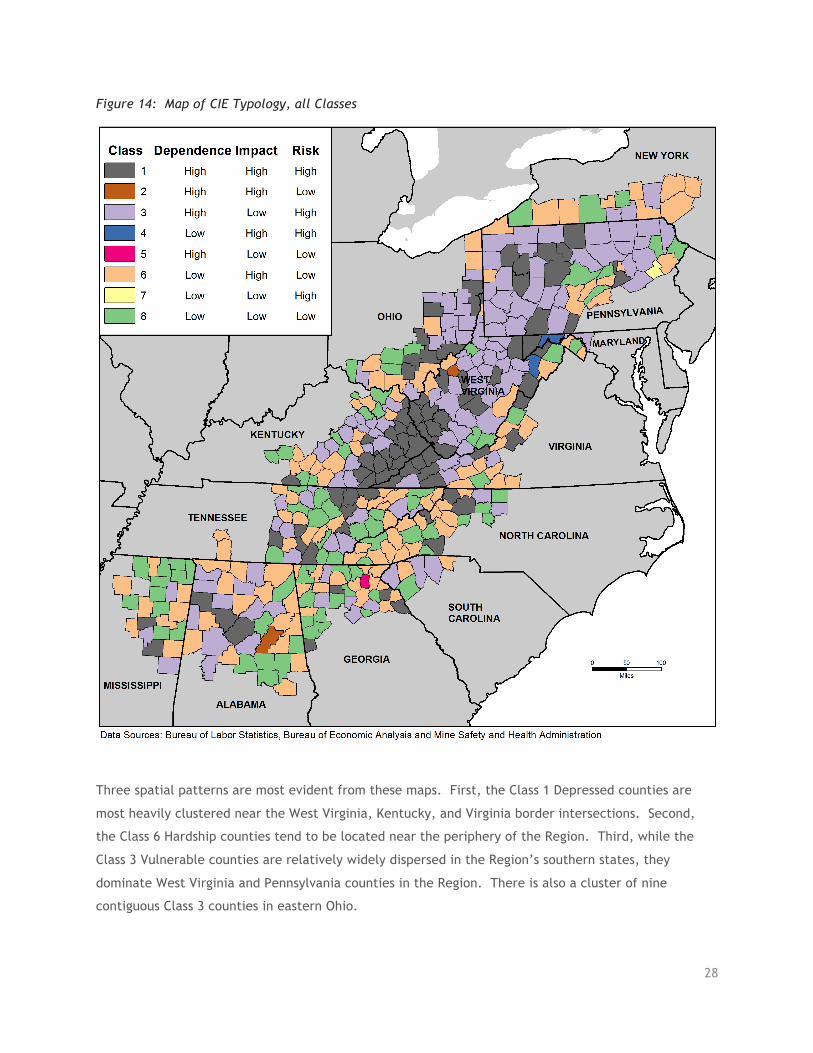
Figure 14: Map of CIE Typology, all Classes
Three spatial patterns are most evident from these maps. First, the Class 1 Depressed counties are
most heavily clustered near the West Virginia, Kentucky, and Virginia border intersections. Second,
the Class 6 Hardship counties tend to be located near the periphery of the Region. Third, while the
Class 3 Vulnerable counties are relatively widely dispersed in the Region’s southern states, they
dominate West Virginia and Pennsylvania counties in the Region. There is also a cluster of nine
contiguous Class 3 counties in eastern Ohio.
29
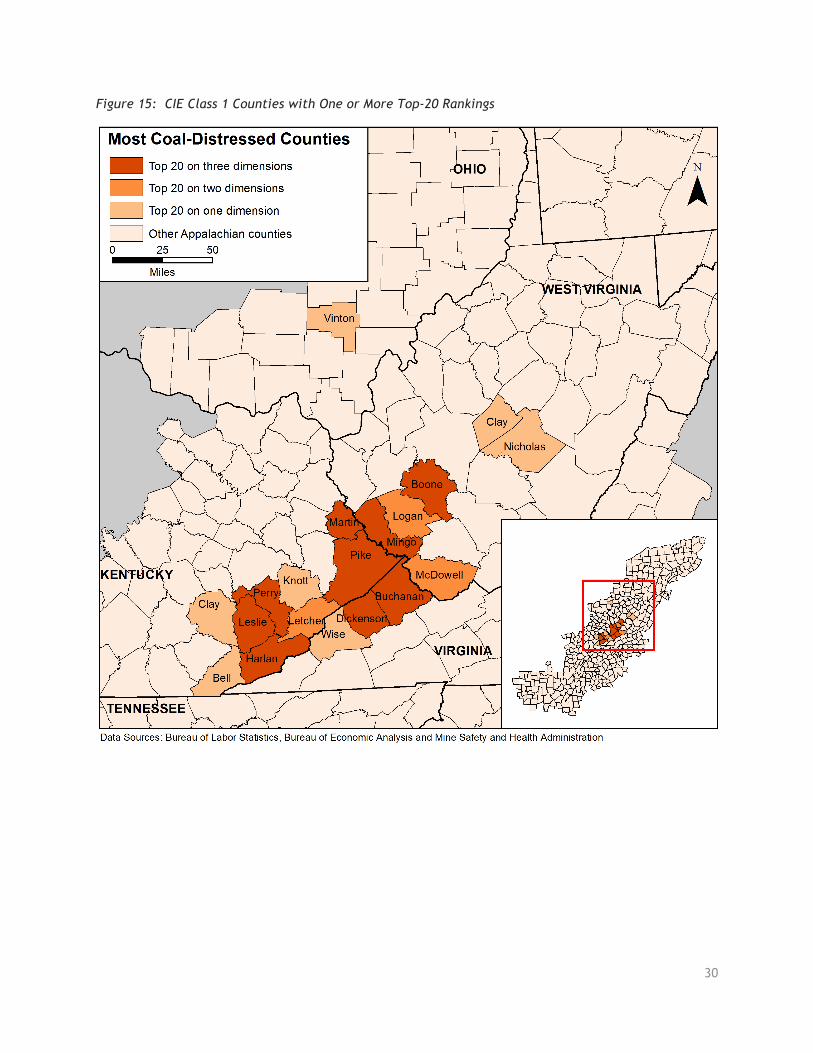
Coal-Distressed Counties This section focuses on counties in Class 1 whose scores on all dimensions distinguish them from the
others. We identify two sets of such counties. The first set is composed of those counties within Class
1 that also hold a top-20 ranking in at least one of the three CIE dimensions. This first set is shown in
Table 6, along with their dimension-rankings and key socioeconomic variables. The group of counties
shaded dark blue have no ranking lower than 20 on any of the CIE dimensions. The group in light blue
has only one ranking lower than the top-20 ranking, and the third group has only one top-20 ranking.
As can be seen in Figure 15, these counties are clustered in the heart of the Appalachian Region, with
Vinton County, Ohio, as the only county located outside of West Virginia, Virginia, and Kentucky.
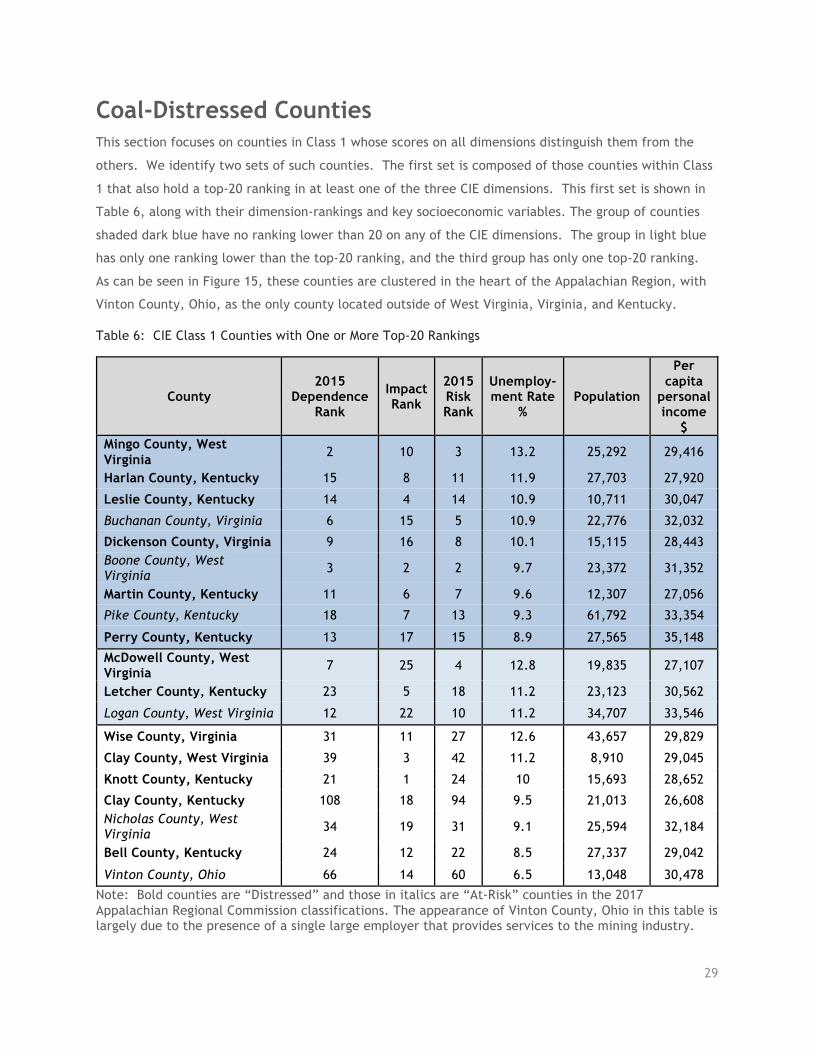
Table 6: CIE Class 1 Counties with One or More Top-20 Rankings
County 2015
Dependence Rank
Impact Rank
2015 Risk Rank
Unemploy-ment Rate
% Population
Per capita
personal income
$ Mingo County, West Virginia 2 10 3 13.2 25,292 29,416
Harlan County, Kentucky 15 8 11 11.9 27,703 27,920
Leslie County, Kentucky 14 4 14 10.9 10,711 30,047
Buchanan County, Virginia 6 15 5 10.9 22,776 32,032
Dickenson County, Virginia 9 16 8 10.1 15,115 28,443 Boone County, West Virginia 3 2 2 9.7 23,372 31,352
Martin County, Kentucky 11 6 7 9.6 12,307 27,056
Pike County, Kentucky 18 7 13 9.3 61,792 33,354
Perry County, Kentucky 13 17 15 8.9 27,565 35,148
McDowell County, West Virginia 7 25 4 12.8 19,835 27,107
Letcher County, Kentucky 23 5 18 11.2 23,123 30,562
Logan County, West Virginia 12 22 10 11.2 34,707 33,546
Wise County, Virginia 31 11 27 12.6 43,657 29,829
Clay County, West Virginia 39 3 42 11.2 8,910 29,045
Knott County, Kentucky 21 1 24 10 15,693 28,652
Clay County, Kentucky 108 18 94 9.5 21,013 26,608 Nicholas County, West Virginia 34 19 31 9.1 25,594 32,184
Bell County, Kentucky 24 12 22 8.5 27,337 29,042
Vinton County, Ohio 66 14 60 6.5 13,048 30,478
Note: Bold counties are “Distressed” and those in italics are “At-Risk” counties in the 2017 Appalachian Regional Commission classifications. The appearance of Vinton County, Ohio in this table is largely due to the presence of a single large employer that provides services to the mining industry.
30
Figure 15: CIE Class 1 Counties with One or More Top-20 Rankings
31
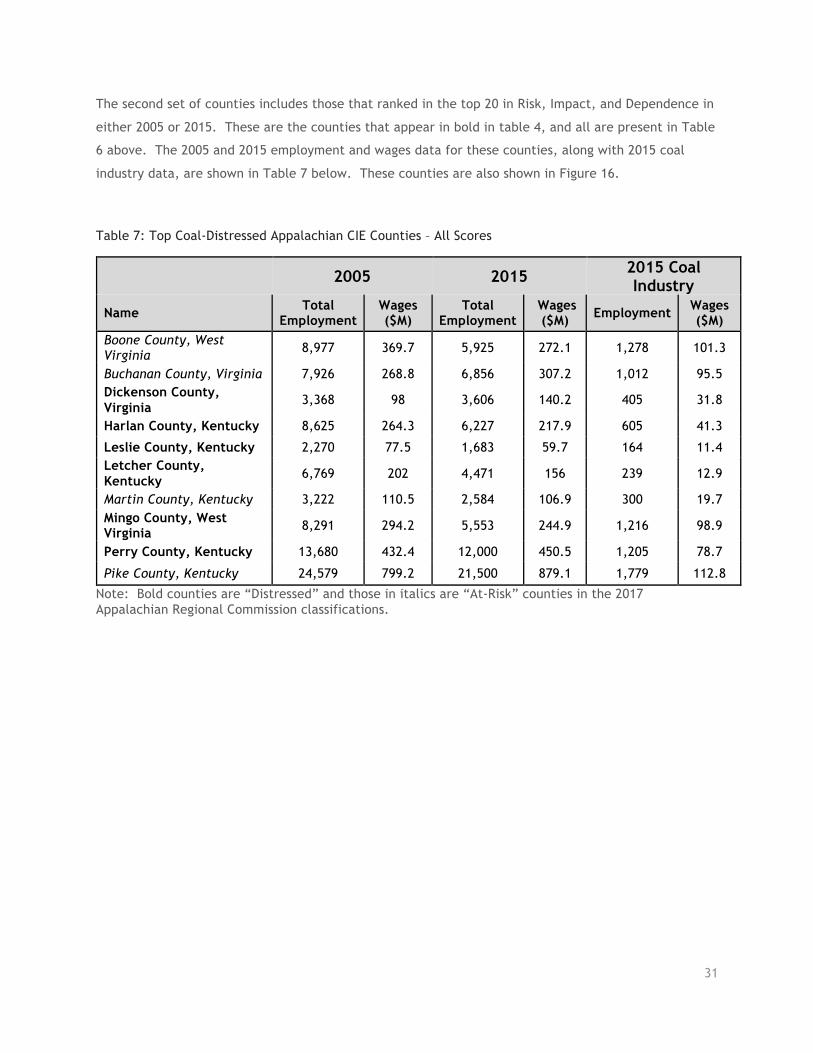
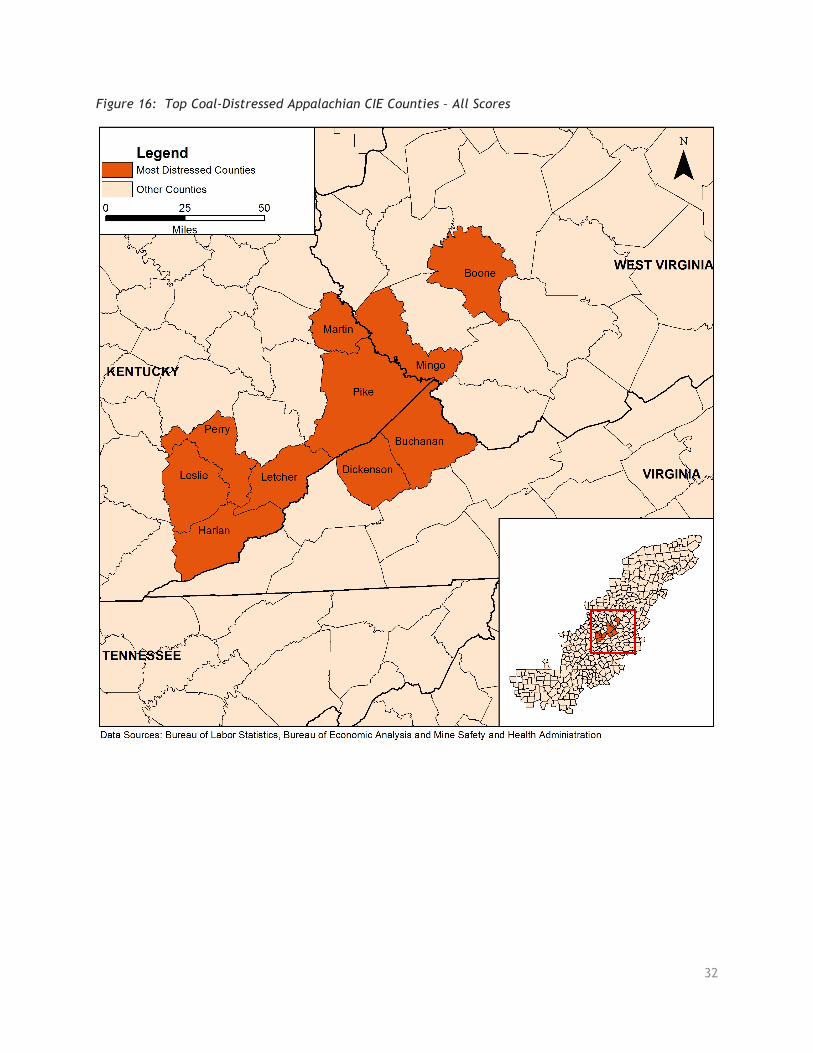
The second set of counties includes those that ranked in the top 20 in Risk, Impact, and Dependence in
either 2005 or 2015. These are the counties that appear in bold in table 4, and all are present in Table
6 above. The 2005 and 2015 employment and wages data for these counties, along with 2015 coal
industry data, are shown in Table 7 below. These counties are also shown in Figure 16.
Table 7: Top Coal-Distressed Appalachian CIE Counties – All Scores
2005 2015 2015 Coal Industry
Name Total Employment
Wages ($M)
Total Employment
Wages ($M) Employment Wages
($M) Boone County, West Virginia 8,977 369.7 5,925 272.1 1,278 101.3
Buchanan County, Virginia 7,926 268.8 6,856 307.2 1,012 95.5 Dickenson County, Virginia 3,368 98 3,606 140.2 405 31.8
Harlan County, Kentucky 8,625 264.3 6,227 217.9 605 41.3
Leslie County, Kentucky 2,270 77.5 1,683 59.7 164 11.4 Letcher County, Kentucky 6,769 202 4,471 156 239 12.9
Martin County, Kentucky 3,222 110.5 2,584 106.9 300 19.7 Mingo County, West Virginia 8,291 294.2 5,553 244.9 1,216 98.9
Perry County, Kentucky 13,680 432.4 12,000 450.5 1,205 78.7
Pike County, Kentucky 24,579 799.2 21,500 879.1 1,779 112.8
Note: Bold counties are “Distressed” and those in italics are “At-Risk” counties in the 2017 Appalachian Regional Commission classifications.
32
Figure 16: Top Coal-Distressed Appalachian CIE Counties – All Scores
33
Summary Through a comprehensive, quantitative, supply chain-based assessment of Appalachian Region
counties, we identified industry and county characteristics related to the Coal Industry Ecosystem
(CIE). Industry measures were developed to identify their relative positions in the coal industry supply
chain, and these measures were weighted by employment and by employment change to construct
county-based measures of CIE Dependence and CIE Impacts. We also developed a measure of risk that
indicates each county’s susceptibility to continued coal industry decline. This risk measure is built
upon the Region-wide CIE industry self-sufficiency Dependence Score, and adds a locally-based CIE
industry self-sufficiency measure and an independent dimension that varies with the inverse of coal
mine productivity. The 2005 Risk Score was shown to have a strong negative correlation with the
Impact Score, validating its use as an indicator of susceptibility to negative impacts of continuing coal
industry decline.
Each of these dimensions, as measured by Dependence, Impact, and Risk Scores, was assessed
independently, and used subsequently in the construction of an eight-class county typology. The
typology was used to identify four dominant county classes. Class 1 Depressed counties are the most
highly distressed, with High Dependence, High Negative Impact, and High Risk Scores. They have
already suffered negative CIE-related economic impacts, and are susceptible to future coal-industry
declines. Class 3 Vulnerable counties have not yet faced levels of economic hardship comparable to
those in Class 1, but they remain vulnerable to continued coal-industry decline. Class 6 Hardship
counties have experienced CIE-based decline, but their economies are no longer CIE-dependent, so
they are not subject to increased CIE-driven hardship in future, though many continue to suffer the
consequences of recent coal-industry decline. Counties in Class 8 are not strongly tied to the CIE ― and
have been and are expected to continue to be ― the least affected by the coal industry fortunes.
The typology and the three county-level CIE Scores were used as a lens through which to identify the
most distressed Appalachian counties whose condition can be most directly attributed to the CIE.
These counties would be distressed by any number of measures, but given their strong ties to the CIE
and vulnerability to continued coal-industry decline, they are particularly strong candidates for more
in-depth analysis to identify policies and programs that might be implemented to dampen the negative
impacts and alleviate some of the economic distress that can and will continue to be attributable to
coal industry decline.
34
References
U.S. Department of Commerce, Bureau of Economic Analysis. Benchmark Input-Output Data.
https://www.bea.gov/industry/io_benchmark.htm
U.S. Department of Commerce, Census of Population. https://www.census.gov/topics/population.html
U.S. Department of Labor, Bureau of Labor Statistics. Census of Employment and Wages.
http://www.bls.gov/home.htm
U.S. Department of Labor, Mine Safety and Health Administration. https://www.msha.gov/data-
reports/data-sources-calculators
35
Appendices
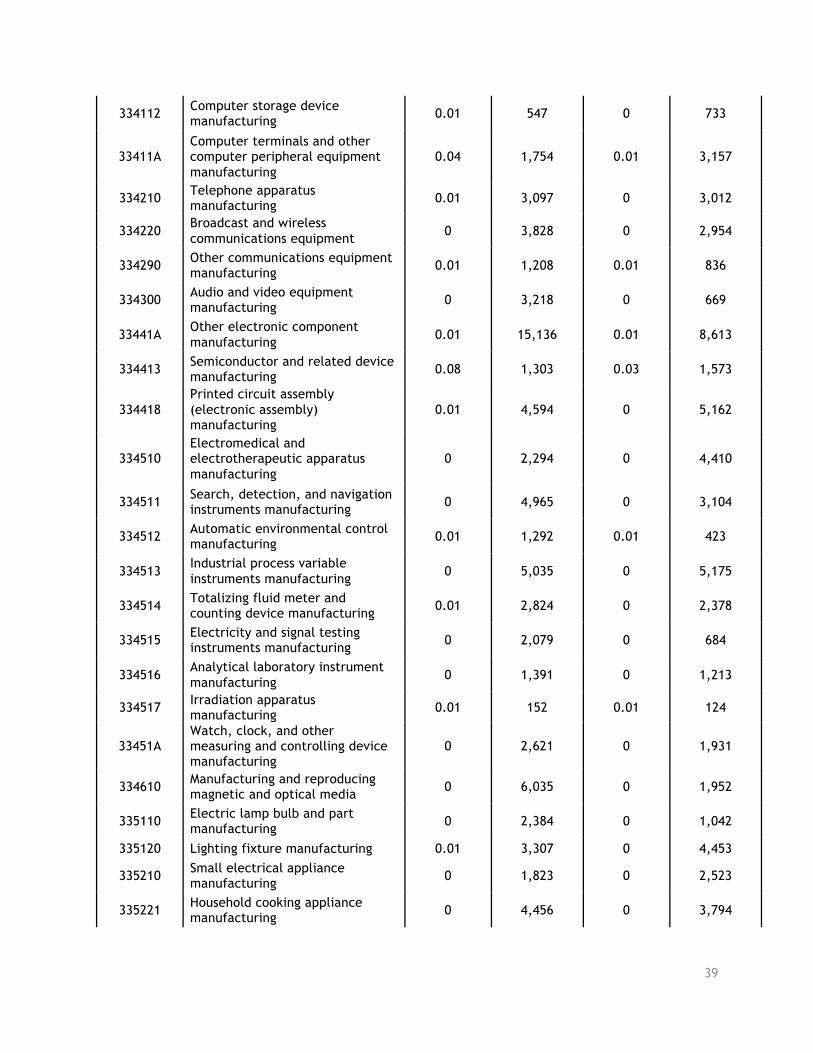
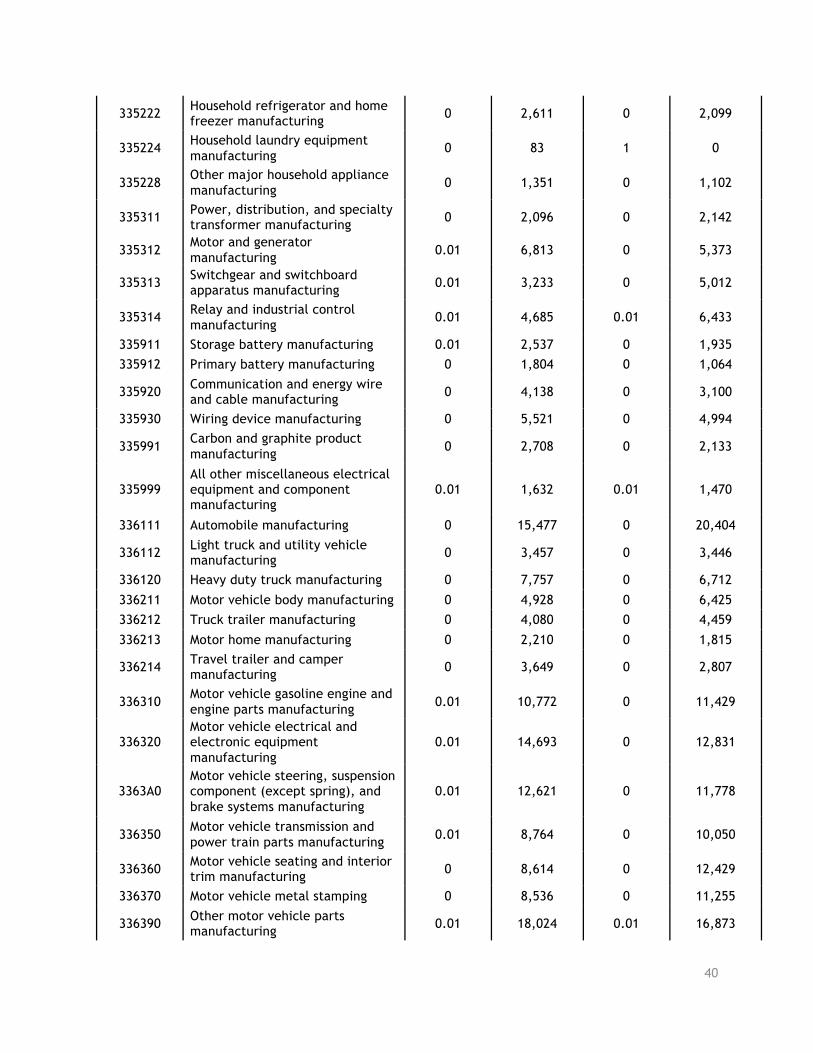
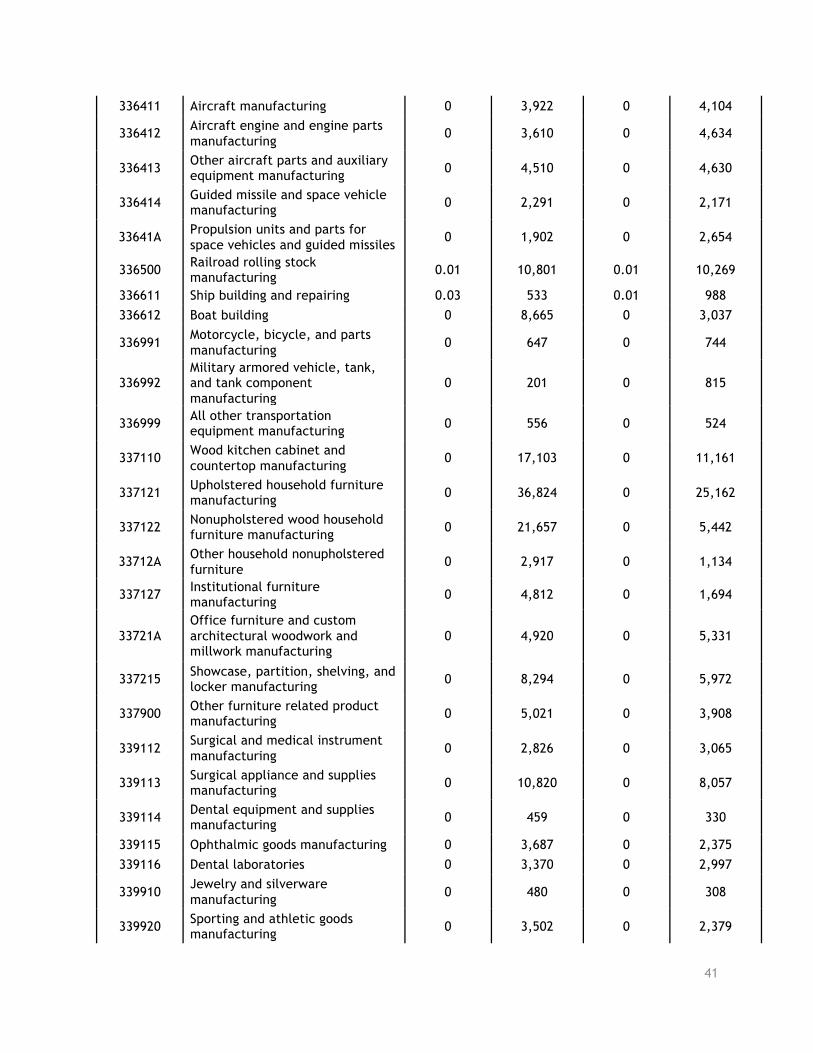
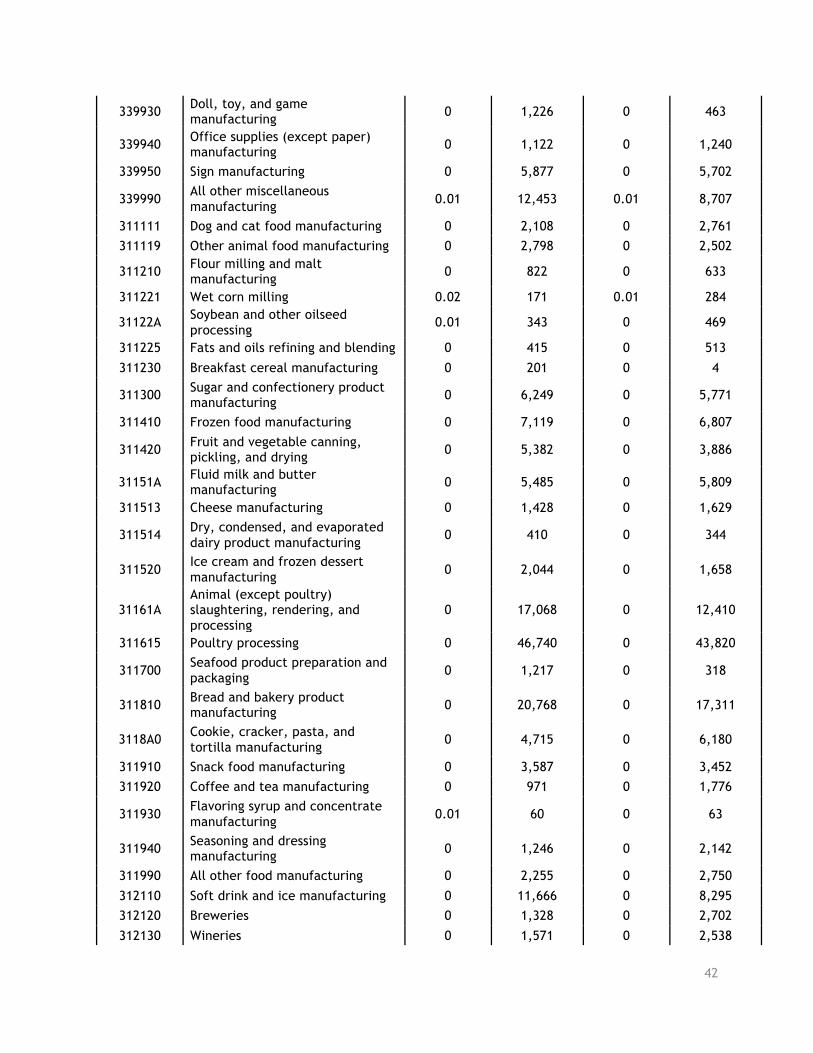
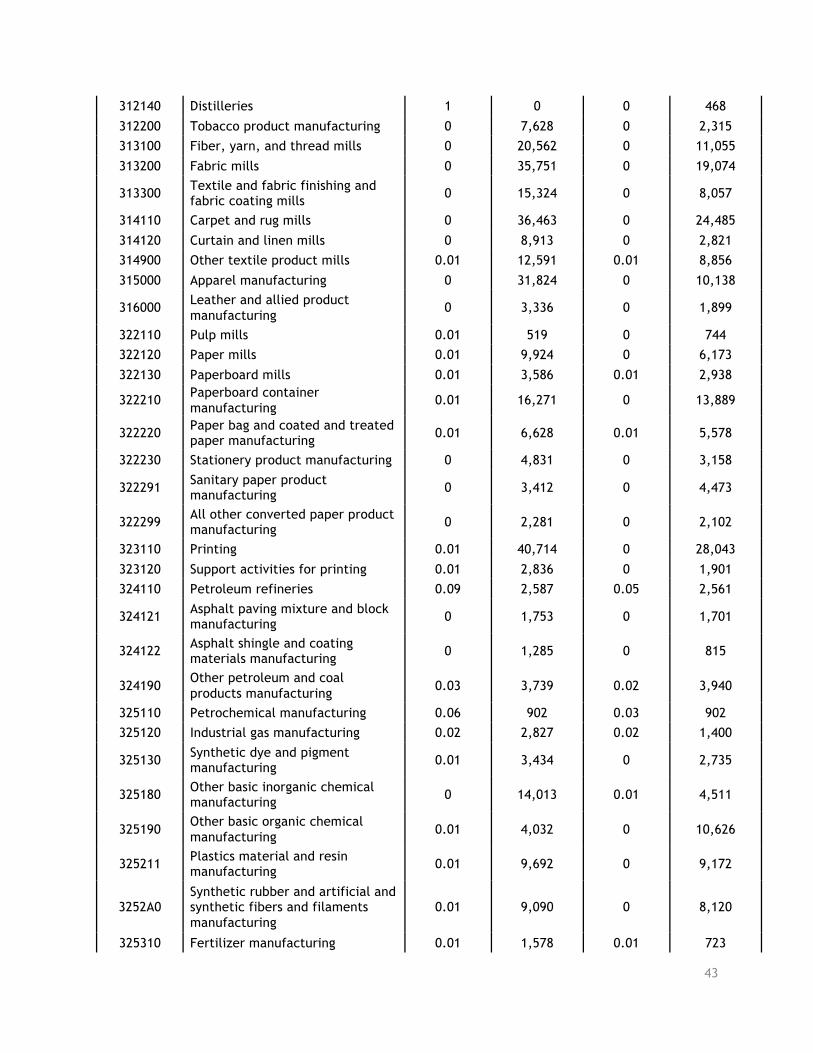
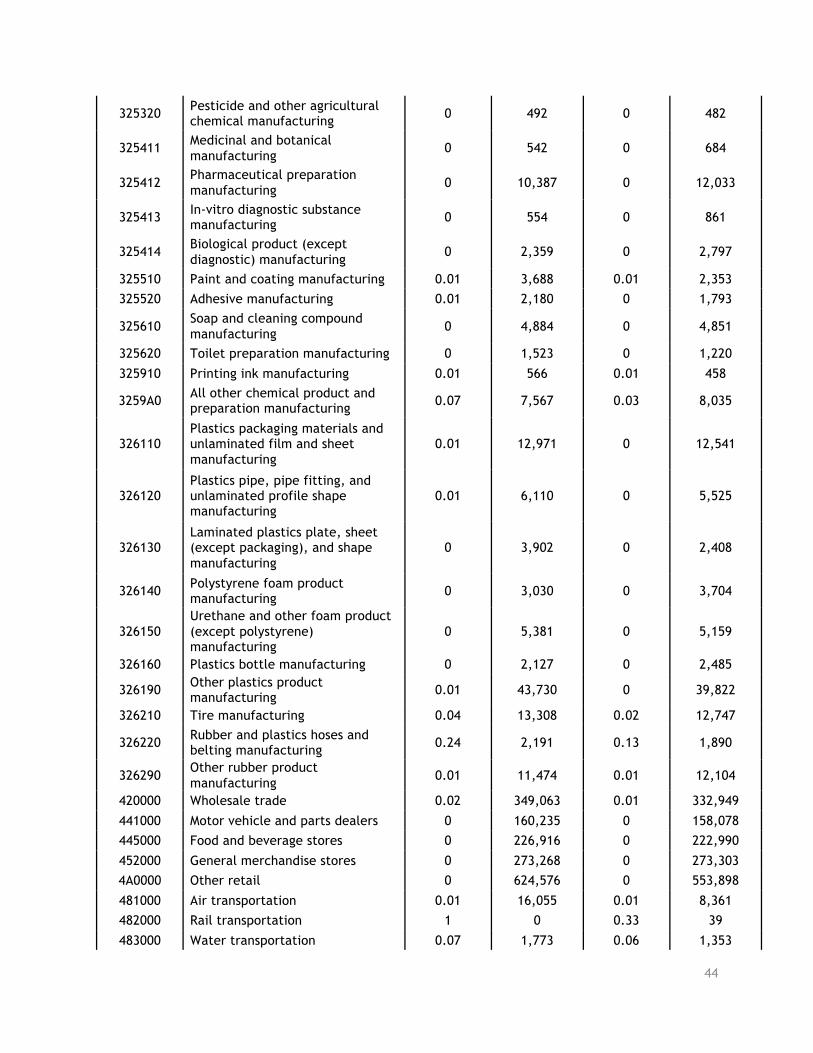
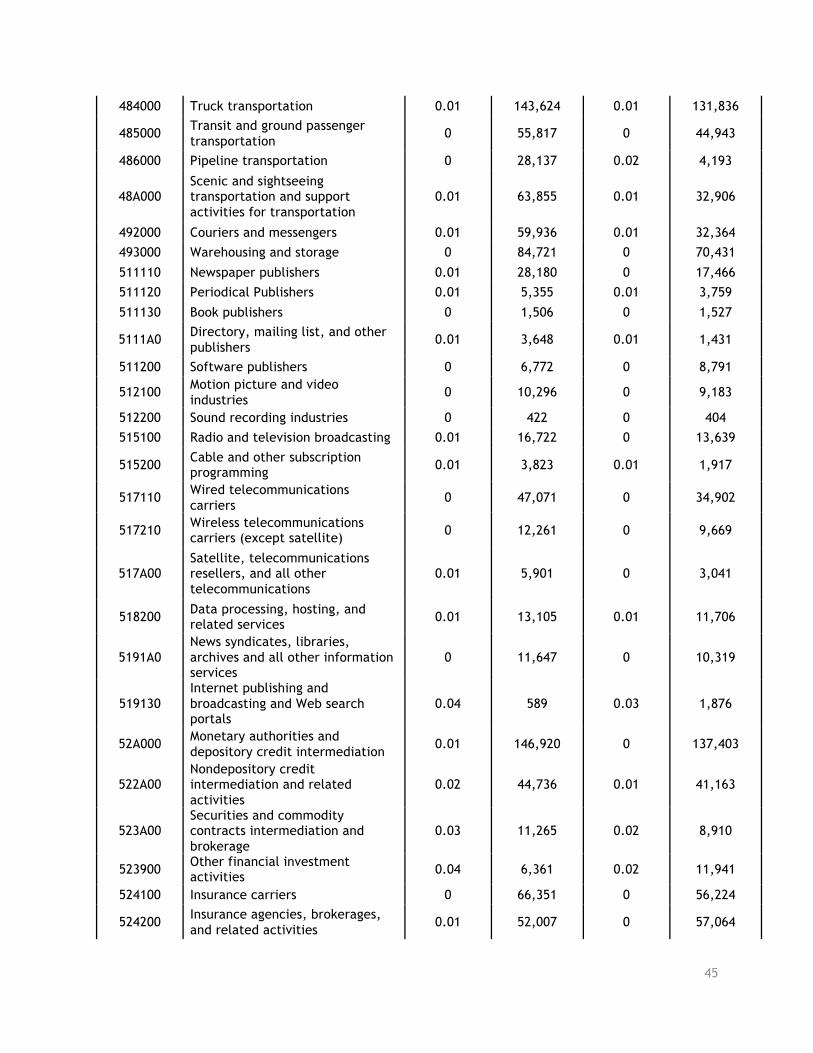
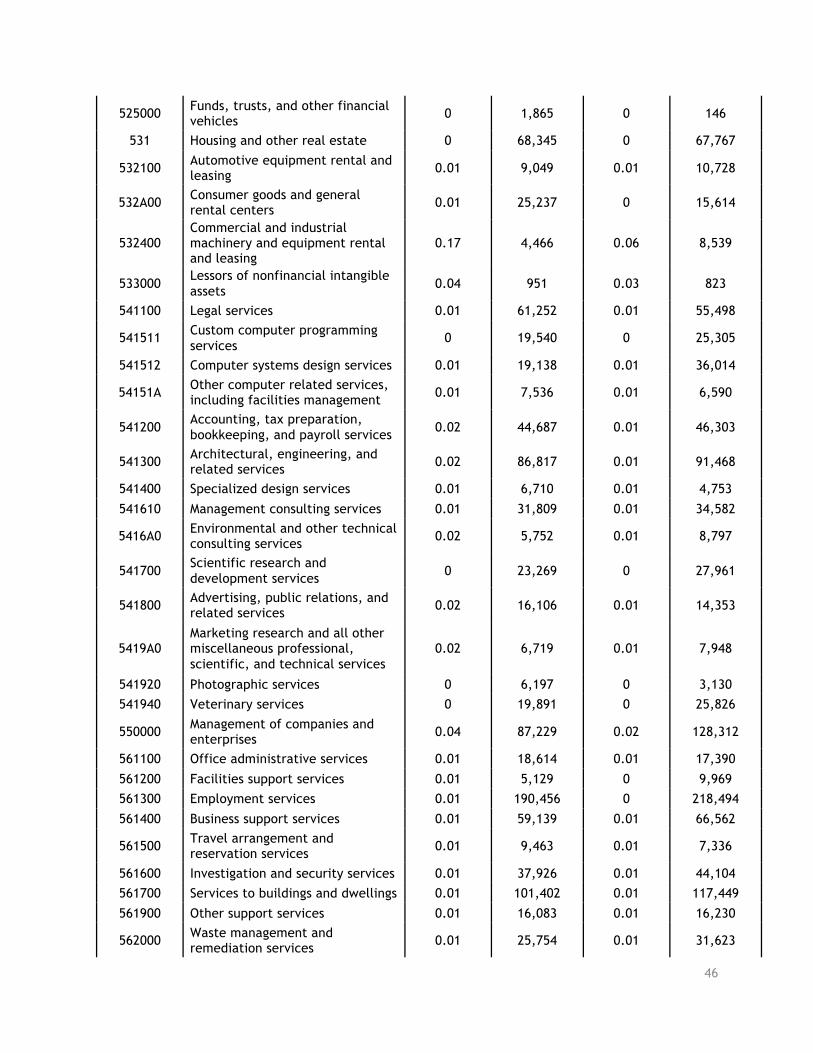
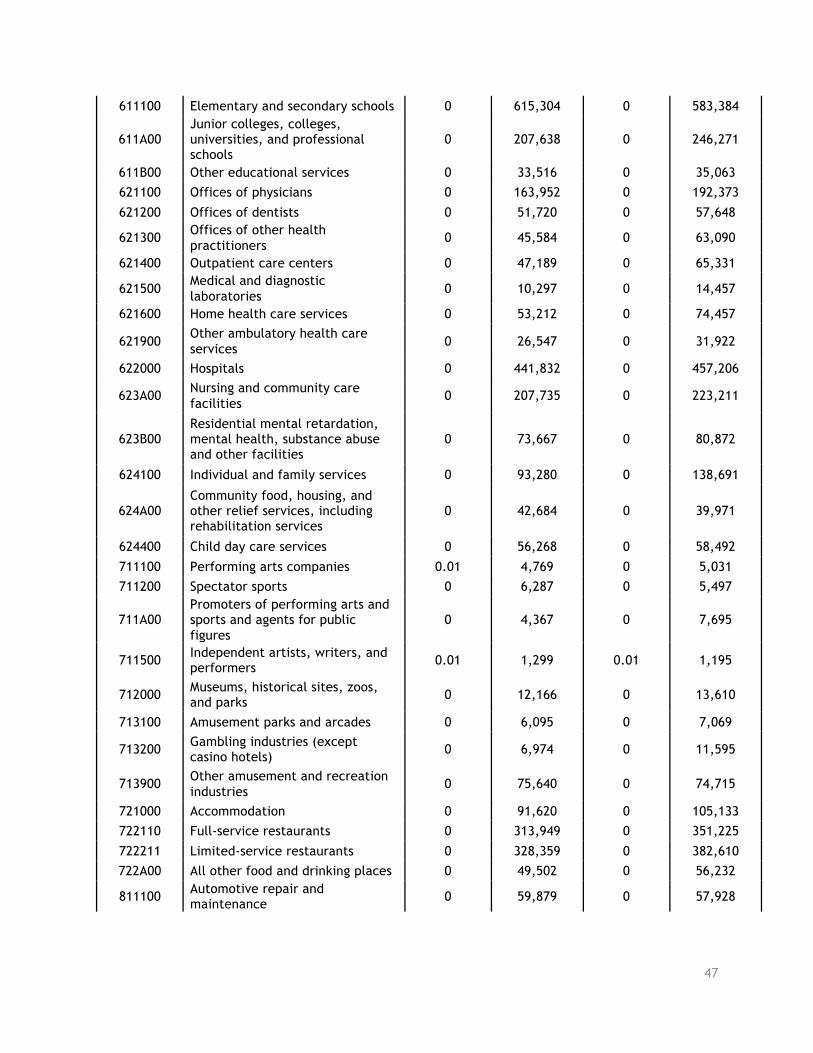
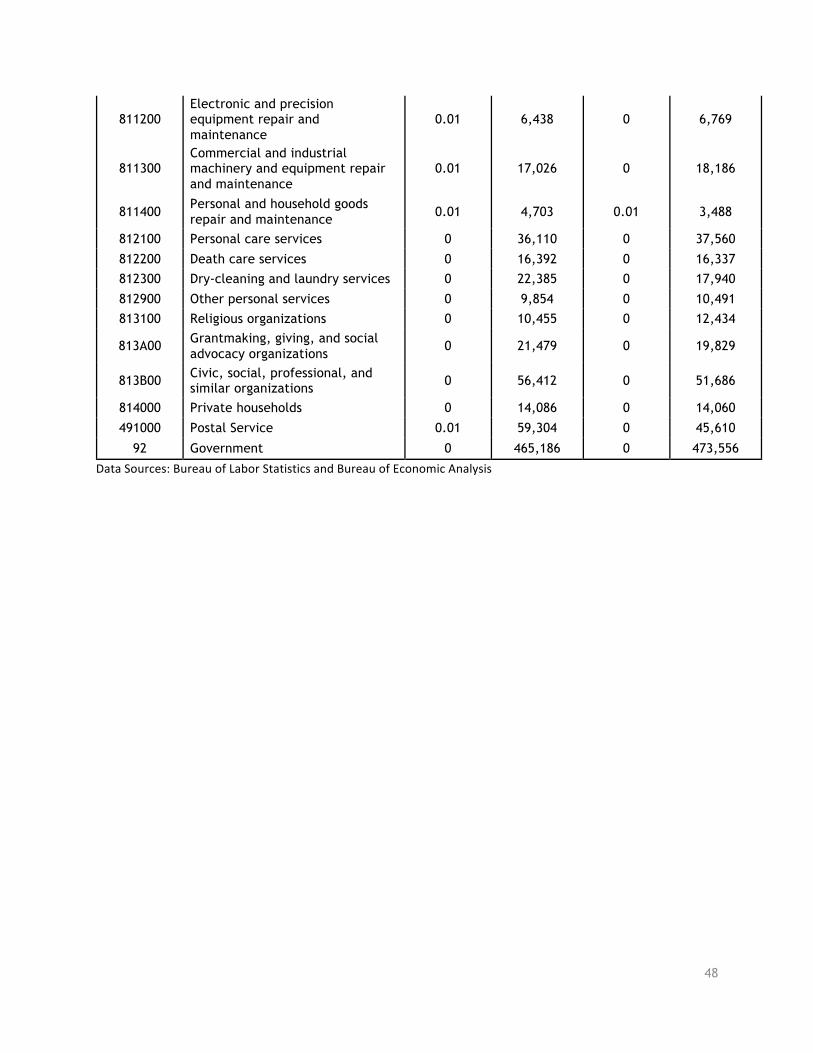
Appendix I. CIE Scores, All Industries
BEA Codes Name 2005 CIE Score
2005 Employment
2015 CIE Score
2015 Employment
1111A0 Oilseed farming 0.01 70 0 276
1111B0 Grain farming 0.01 304 0 760
111200 Vegetable and melon farming 0 1,963 0 2,525
111300 Fruit and tree nut farming 0 1,604 0 1,768
111400 Greenhouse, nursery, and floriculture production 0 9,019 0 6,859
111900 Other crop farming 0.05 817 0.02 973
1121A0 Beef cattle ranching and farming, including feedlots and dual-purpose ranching and farming
0 963 0 1,175
112120 Dairy cattle and milk production 0 3,102 0 4,336
112A00 Animal production, except cattle and poultry and eggs 0 1,363 0 1,855
112300 Poultry and egg production 0 3,418 0 3,647
113000 Forestry and logging 0.04 7,850 0.02 6,169
114000 Fishing, hunting and trapping 0.01 138 0 171
115000 Support activities for agriculture and forestry 0.05 4,903 0.03 4,903
211000 Oil and gas extraction 0.16 4,984 0.06 10,692
212100 Coal mining 1 47,140 1 36,535
2122A0 Iron, gold, silver, and other metal ore mining 0.08 456 0.04 651
212230 Copper, nickel, lead, and zinc mining 0.69 19 0.02 717
212310 Stone mining and quarrying 0.08 14,588 0.07 7,972
2123A0 Other nonmetallic mineral mining and quarrying 0.03 3,697 0.02 2,478
213111 Drilling oil and gas wells 0 2,650 0 3,697
21311A Other support activities for mining 0.08 11,628 0.04 21,421
221100 Electric power generation, transmission, and distribution 0.01 53,077 0 49,397
221200 Natural gas distribution 0.01 7,914 0.01 8,224
221300 Water, sewage and other systems 0 21,846 0 23,376
23 Construction 0 474,924 0 403,310
321100 Sawmills and wood preservation 0.01 21,687 0.01 17,295
321200 Veneer, plywood, and engineered wood product manufacturing 0 13,722 0 7,082
321910 Millwork 0 24,409 0 15,672
3219A0 All other wood product manufacturing
0 32,982 0 21,057
36
327100 Clay product and refractory manufacturing 0 15,012 0 8,652
327200 Glass and glass product manufacturing
0 16,658 0 13,522
327310 Cement manufacturing 0.01 1,960 0 2,111
327320 Ready-mix concrete manufacturing
0.01 9,563 0 7,223
327330 Concrete pipe, brick, and block manufacturing 0.01 2,937 0.01 2,277
327390 Other concrete product manufacturing 0 6,051 0 4,752
327400 Lime and gypsum product manufacturing 0.01 1,302 0 1,381
327910 Abrasive product manufacturing 0.03 727 0.02 532
327991 Cut stone and stone product manufacturing
0.01 3,459 0 3,844
327992 Ground or treated mineral and earth manufacturing 0.15 483 0.1 595
327993 Mineral wool manufacturing 0 2,420 0 1,163
327999 Miscellaneous nonmetallic mineral products 0.03 1,098 0.03 733
331110 Iron and steel mills and ferroalloy manufacturing 0.01 21,746 0.01 19,071
331200 Steel product manufacturing from purchased steel 0.02 11,776 0.01 8,922
33131A Alumina refining and primary aluminum production 0.01 2,350 0.02 466
331314 Secondary smelting and alloying of aluminum 0.01 1,362 0 954
33131B Aluminum product manufacturing from purchased aluminum 0 9,698 0 9,020
331411 Primary smelting and refining of copper 0.04 149 0.16 19
331419 Primary smelting and refining of nonferrous metal (except copper and aluminum)
0.01 1,787 0.05 285
331420 Copper rolling, drawing, extruding and alloying
0.01 8,205 0.01 3,262
331490 Nonferrous metal (except copper and aluminum) rolling, drawing, extruding and alloying
0.01 6,151 0.01 7,400
331510 Ferrous metal foundries 0.03 13,030 0.01 10,472
331520 Nonferrous metal foundries 0.01 6,430 0.01 4,838
33211A All other forging, stamping, and sintering 0.01 9,383 0.01 9,807
332114 Custom roll forming 0.02 603 0.01 601
33211B Crown and closure manufacturing and metal stamping 0.01 5,634 0.01 4,969
37
332200 Cutlery and handtool manufacturing 0.02 6,038 0.01 4,088
332310 Plate work and fabricated structural product manufacturing 0.01 21,666 0 20,661
332320 Ornamental and architectural metal products manufacturing 0.01 21,070 0 18,463
332410 Power boiler and heat exchanger manufacturing
0 3,125 0 2,578
332420 Metal tank (heavy gauge) manufacturing 0 2,705 0 3,481
332430 Metal can, box, and other metal container (light gauge) manufacturing
0.01 5,712 0 4,514
332500 Hardware manufacturing 0.02 3,683 0.01 1,908
332600 Spring and wire product manufacturing 0.01 6,621 0.01 4,380
332710 Machine shops 0.02 26,196 0.01 27,290
332720 Turned product and screw, nut, and bolt manufacturing 0.08 5,928 0.04 6,530
332800 Coating, engraving, heat treating and allied activities 0.02 11,205 0.01 9,999
33291A Valve and fittings other than plumbing 0.02 6,671 0.01 5,861
332913 Plumbing fixture fitting and trim manufacturing 0.01 850 0 999
332991 Ball and roller bearing manufacturing
0.01 5,944 0.01 4,416
33299A Ammunition, arms, ordnance, and accessories manufacturing 0 5,192 0 5,955
332996 Fabricated pipe and pipe fitting manufacturing
0.01 2,002 0 2,497
33299B Other fabricated metal manufacturing 0.02 6,987 0.01 5,408
333111 Farm machinery and equipment manufacturing 0.01 2,647 0 3,409
333112 Lawn and garden equipment manufacturing
0 2,692 0 1,800
333120 Construction machinery manufacturing 0.1 6,384 0.05 7,599
333130 Mining and oil and gas field machinery manufacturing 0.37 4,905 0.29 5,405
33329A Other industrial machinery manufacturing
0 9,207 0 6,852
333220 Plastics and rubber industry machinery manufacturing 0 2,122 0 1,568
333295 Semiconductor machinery manufacturing 0 243 0.01 104
38
33331A Vending, commercial laundry, and other commercial and service industry machinery manufacturing
0 4,504 0 3,106
333313 Office machinery manufacturing 0.04 230 0.02 154
333314 Optical instrument and lens manufacturing 0 986 0 549
333315 Photographic and photocopying equipment manufacturing
0.01 308 0 47
33341A Air purification and ventilation equipment manufacturing 0 2,492 0 1,759
333414 Heating equipment (except warm air furnaces) manufacturing 0 3,509 0 1,934
333415 Air conditioning, refrigeration, and warm air heating equipment manufacturing
0 8,383 0 5,945
333511 Industrial mold manufacturing 0 4,750 0 3,268
33351A Metal cutting and forming machine tool manufacturing
0.01 3,058 0 3,553
333514 Special tool, die, jig, and fixture manufacturing 0 8,785 0 6,668
33351B
Cutting and machine tool accessory, rolling mill, and other metalworking machinery manufacturing
0.03 6,286 0.02 5,229
333611 Turbine and turbine generator set units manufacturing
0 3,558 0 4,866
333612 Speed changer, industrial high-speed drive, and gear manufacturing
0.09 740 0.02 1,436
333613 Mechanical power transmission equipment manufacturing 0.02 1,742 0.02 954
333618 Other engine equipment manufacturing 0.02 6,383 0.01 6,112
33391A Pump and pumping equipment manufacturing 0.01 1,931 0 2,084
333912 Air and gas compressor manufacturing 0 3,889 0 3,739
333920 Material handling equipment manufacturing 0.06 9,012 0.03 9,722
333991 Power-driven handtool manufacturing 0 1,934 0 616
33399A Other general purpose machinery manufacturing 0.01 4,612 0 5,276
333993 Packaging machinery manufacturing 0 1,381 0 1,294
333994 Industrial process furnace and oven manufacturing 0 1,848 0 1,593
33399B Fluid power process machinery 0.03 3,296 0.02 3,014
334111 Electronic computer manufacturing 0 5,787 0 2,161
39
334112 Computer storage device manufacturing 0.01 547 0 733
33411A Computer terminals and other computer peripheral equipment manufacturing
0.04 1,754 0.01 3,157
334210 Telephone apparatus manufacturing 0.01 3,097 0 3,012
334220 Broadcast and wireless communications equipment 0 3,828 0 2,954
334290 Other communications equipment manufacturing 0.01 1,208 0.01 836
334300 Audio and video equipment manufacturing 0 3,218 0 669
33441A Other electronic component manufacturing 0.01 15,136 0.01 8,613
334413 Semiconductor and related device manufacturing 0.08 1,303 0.03 1,573
334418 Printed circuit assembly (electronic assembly) manufacturing
0.01 4,594 0 5,162
334510 Electromedical and electrotherapeutic apparatus manufacturing
0 2,294 0 4,410
334511 Search, detection, and navigation instruments manufacturing 0 4,965 0 3,104
334512 Automatic environmental control manufacturing 0.01 1,292 0.01 423
334513 Industrial process variable instruments manufacturing 0 5,035 0 5,175
334514 Totalizing fluid meter and counting device manufacturing 0.01 2,824 0 2,378
334515 Electricity and signal testing instruments manufacturing 0 2,079 0 684
334516 Analytical laboratory instrument manufacturing 0 1,391 0 1,213
334517 Irradiation apparatus manufacturing 0.01 152 0.01 124
33451A Watch, clock, and other measuring and controlling device manufacturing
0 2,621 0 1,931
334610 Manufacturing and reproducing magnetic and optical media 0 6,035 0 1,952
335110 Electric lamp bulb and part manufacturing 0 2,384 0 1,042
335120 Lighting fixture manufacturing 0.01 3,307 0 4,453
335210 Small electrical appliance manufacturing 0 1,823 0 2,523
335221 Household cooking appliance manufacturing 0 4,456 0 3,794
40
335222 Household refrigerator and home freezer manufacturing 0 2,611 0 2,099
335224 Household laundry equipment manufacturing
0 83 1 0
335228 Other major household appliance manufacturing 0 1,351 0 1,102
335311 Power, distribution, and specialty transformer manufacturing 0 2,096 0 2,142
335312 Motor and generator manufacturing 0.01 6,813 0 5,373
335313 Switchgear and switchboard apparatus manufacturing 0.01 3,233 0 5,012
335314 Relay and industrial control manufacturing
0.01 4,685 0.01 6,433
335911 Storage battery manufacturing 0.01 2,537 0 1,935
335912 Primary battery manufacturing 0 1,804 0 1,064
335920 Communication and energy wire and cable manufacturing 0 4,138 0 3,100
335930 Wiring device manufacturing 0 5,521 0 4,994
335991 Carbon and graphite product manufacturing 0 2,708 0 2,133
335999 All other miscellaneous electrical equipment and component manufacturing
0.01 1,632 0.01 1,470
336111 Automobile manufacturing 0 15,477 0 20,404
336112 Light truck and utility vehicle manufacturing 0 3,457 0 3,446
336120 Heavy duty truck manufacturing 0 7,757 0 6,712
336211 Motor vehicle body manufacturing 0 4,928 0 6,425
336212 Truck trailer manufacturing 0 4,080 0 4,459
336213 Motor home manufacturing 0 2,210 0 1,815
336214 Travel trailer and camper manufacturing 0 3,649 0 2,807
336310 Motor vehicle gasoline engine and engine parts manufacturing 0.01 10,772 0 11,429
336320 Motor vehicle electrical and electronic equipment manufacturing
0.01 14,693 0 12,831
3363A0 Motor vehicle steering, suspension component (except spring), and brake systems manufacturing
0.01 12,621 0 11,778
336350 Motor vehicle transmission and power train parts manufacturing 0.01 8,764 0 10,050
336360 Motor vehicle seating and interior trim manufacturing 0 8,614 0 12,429
336370 Motor vehicle metal stamping 0 8,536 0 11,255
336390 Other motor vehicle parts manufacturing 0.01 18,024 0.01 16,873
41
336411 Aircraft manufacturing 0 3,922 0 4,104
336412 Aircraft engine and engine parts manufacturing
0 3,610 0 4,634
336413 Other aircraft parts and auxiliary equipment manufacturing 0 4,510 0 4,630
336414 Guided missile and space vehicle manufacturing 0 2,291 0 2,171
33641A Propulsion units and parts for space vehicles and guided missiles
0 1,902 0 2,654
336500 Railroad rolling stock manufacturing 0.01 10,801 0.01 10,269
336611 Ship building and repairing 0.03 533 0.01 988
336612 Boat building 0 8,665 0 3,037
336991 Motorcycle, bicycle, and parts manufacturing 0 647 0 744
336992 Military armored vehicle, tank, and tank component manufacturing
0 201 0 815
336999 All other transportation equipment manufacturing 0 556 0 524
337110 Wood kitchen cabinet and countertop manufacturing
0 17,103 0 11,161
337121 Upholstered household furniture manufacturing 0 36,824 0 25,162
337122 Nonupholstered wood household furniture manufacturing 0 21,657 0 5,442
33712A Other household nonupholstered furniture
0 2,917 0 1,134
337127 Institutional furniture manufacturing 0 4,812 0 1,694
33721A Office furniture and custom architectural woodwork and millwork manufacturing
0 4,920 0 5,331
337215 Showcase, partition, shelving, and locker manufacturing 0 8,294 0 5,972
337900 Other furniture related product manufacturing 0 5,021 0 3,908
339112 Surgical and medical instrument manufacturing 0 2,826 0 3,065
339113 Surgical appliance and supplies manufacturing 0 10,820 0 8,057
339114 Dental equipment and supplies manufacturing 0 459 0 330
339115 Ophthalmic goods manufacturing 0 3,687 0 2,375
339116 Dental laboratories 0 3,370 0 2,997
339910 Jewelry and silverware manufacturing 0 480 0 308
339920 Sporting and athletic goods manufacturing 0 3,502 0 2,379
42
339930 Doll, toy, and game manufacturing 0 1,226 0 463
339940 Office supplies (except paper) manufacturing 0 1,122 0 1,240
339950 Sign manufacturing 0 5,877 0 5,702
339990 All other miscellaneous manufacturing 0.01 12,453 0.01 8,707
311111 Dog and cat food manufacturing 0 2,108 0 2,761
311119 Other animal food manufacturing 0 2,798 0 2,502
311210 Flour milling and malt manufacturing 0 822 0 633
311221 Wet corn milling 0.02 171 0.01 284
31122A Soybean and other oilseed processing
0.01 343 0 469
311225 Fats and oils refining and blending 0 415 0 513
311230 Breakfast cereal manufacturing 0 201 0 4
311300 Sugar and confectionery product manufacturing 0 6,249 0 5,771
311410 Frozen food manufacturing 0 7,119 0 6,807
311420 Fruit and vegetable canning, pickling, and drying 0 5,382 0 3,886
31151A Fluid milk and butter manufacturing 0 5,485 0 5,809
311513 Cheese manufacturing 0 1,428 0 1,629
311514 Dry, condensed, and evaporated dairy product manufacturing
0 410 0 344
311520 Ice cream and frozen dessert manufacturing 0 2,044 0 1,658
31161A Animal (except poultry) slaughtering, rendering, and processing
0 17,068 0 12,410
311615 Poultry processing 0 46,740 0 43,820
311700 Seafood product preparation and packaging 0 1,217 0 318
311810 Bread and bakery product manufacturing 0 20,768 0 17,311
3118A0 Cookie, cracker, pasta, and tortilla manufacturing
0 4,715 0 6,180
311910 Snack food manufacturing 0 3,587 0 3,452
311920 Coffee and tea manufacturing 0 971 0 1,776
311930 Flavoring syrup and concentrate manufacturing 0.01 60 0 63
311940 Seasoning and dressing manufacturing 0 1,246 0 2,142
311990 All other food manufacturing 0 2,255 0 2,750
312110 Soft drink and ice manufacturing 0 11,666 0 8,295
312120 Breweries 0 1,328 0 2,702
312130 Wineries 0 1,571 0 2,538
43
312140 Distilleries 1 0 0 468
312200 Tobacco product manufacturing 0 7,628 0 2,315
313100 Fiber, yarn, and thread mills 0 20,562 0 11,055
313200 Fabric mills 0 35,751 0 19,074
313300 Textile and fabric finishing and fabric coating mills 0 15,324 0 8,057
314110 Carpet and rug mills 0 36,463 0 24,485
314120 Curtain and linen mills 0 8,913 0 2,821
314900 Other textile product mills 0.01 12,591 0.01 8,856
315000 Apparel manufacturing 0 31,824 0 10,138
316000 Leather and allied product manufacturing
0 3,336 0 1,899
322110 Pulp mills 0.01 519 0 744
322120 Paper mills 0.01 9,924 0 6,173
322130 Paperboard mills 0.01 3,586 0.01 2,938
322210 Paperboard container manufacturing
0.01 16,271 0 13,889
322220 Paper bag and coated and treated paper manufacturing 0.01 6,628 0.01 5,578
322230 Stationery product manufacturing 0 4,831 0 3,158
322291 Sanitary paper product manufacturing 0 3,412 0 4,473
322299 All other converted paper product manufacturing 0 2,281 0 2,102
323110 Printing 0.01 40,714 0 28,043
323120 Support activities for printing 0.01 2,836 0 1,901
324110 Petroleum refineries 0.09 2,587 0.05 2,561
324121 Asphalt paving mixture and block manufacturing 0 1,753 0 1,701
324122 Asphalt shingle and coating materials manufacturing 0 1,285 0 815
324190 Other petroleum and coal products manufacturing 0.03 3,739 0.02 3,940
325110 Petrochemical manufacturing 0.06 902 0.03 902
325120 Industrial gas manufacturing 0.02 2,827 0.02 1,400
325130 Synthetic dye and pigment manufacturing 0.01 3,434 0 2,735
325180 Other basic inorganic chemical manufacturing 0 14,013 0.01 4,511
325190 Other basic organic chemical manufacturing 0.01 4,032 0 10,626
325211 Plastics material and resin manufacturing 0.01 9,692 0 9,172
3252A0 Synthetic rubber and artificial and synthetic fibers and filaments manufacturing
0.01 9,090 0 8,120
325310 Fertilizer manufacturing 0.01 1,578 0.01 723
44
325320 Pesticide and other agricultural chemical manufacturing 0 492 0 482
325411 Medicinal and botanical manufacturing
0 542 0 684
325412 Pharmaceutical preparation manufacturing 0 10,387 0 12,033
325413 In-vitro diagnostic substance manufacturing 0 554 0 861
325414 Biological product (except diagnostic) manufacturing
0 2,359 0 2,797
325510 Paint and coating manufacturing 0.01 3,688 0.01 2,353
325520 Adhesive manufacturing 0.01 2,180 0 1,793
325610 Soap and cleaning compound manufacturing 0 4,884 0 4,851
325620 Toilet preparation manufacturing 0 1,523 0 1,220
325910 Printing ink manufacturing 0.01 566 0.01 458
3259A0 All other chemical product and preparation manufacturing 0.07 7,567 0.03 8,035
326110 Plastics packaging materials and unlaminated film and sheet manufacturing
0.01 12,971 0 12,541
326120 Plastics pipe, pipe fitting, and unlaminated profile shape manufacturing
0.01 6,110 0 5,525
326130 Laminated plastics plate, sheet (except packaging), and shape manufacturing
0 3,902 0 2,408
326140 Polystyrene foam product manufacturing 0 3,030 0 3,704
326150 Urethane and other foam product (except polystyrene) manufacturing
0 5,381 0 5,159
326160 Plastics bottle manufacturing 0 2,127 0 2,485
326190 Other plastics product manufacturing 0.01 43,730 0 39,822
326210 Tire manufacturing 0.04 13,308 0.02 12,747
326220 Rubber and plastics hoses and belting manufacturing 0.24 2,191 0.13 1,890
326290 Other rubber product manufacturing 0.01 11,474 0.01 12,104
420000 Wholesale trade 0.02 349,063 0.01 332,949
441000 Motor vehicle and parts dealers 0 160,235 0 158,078
445000 Food and beverage stores 0 226,916 0 222,990
452000 General merchandise stores 0 273,268 0 273,303
4A0000 Other retail 0 624,576 0 553,898
481000 Air transportation 0.01 16,055 0.01 8,361
482000 Rail transportation 1 0 0.33 39
483000 Water transportation 0.07 1,773 0.06 1,353
45
484000 Truck transportation 0.01 143,624 0.01 131,836
485000 Transit and ground passenger transportation
0 55,817 0 44,943
486000 Pipeline transportation 0 28,137 0.02 4,193
48A000 Scenic and sightseeing transportation and support activities for transportation
0.01 63,855 0.01 32,906
492000 Couriers and messengers 0.01 59,936 0.01 32,364
493000 Warehousing and storage 0 84,721 0 70,431
511110 Newspaper publishers 0.01 28,180 0 17,466
511120 Periodical Publishers 0.01 5,355 0.01 3,759
511130 Book publishers 0 1,506 0 1,527
5111A0 Directory, mailing list, and other publishers
0.01 3,648 0.01 1,431
511200 Software publishers 0 6,772 0 8,791
512100 Motion picture and video industries
0 10,296 0 9,183
512200 Sound recording industries 0 422 0 404
515100 Radio and television broadcasting 0.01 16,722 0 13,639
515200 Cable and other subscription programming 0.01 3,823 0.01 1,917
517110 Wired telecommunications carriers
0 47,071 0 34,902
517210 Wireless telecommunications carriers (except satellite) 0 12,261 0 9,669
517A00 Satellite, telecommunications resellers, and all other telecommunications
0.01 5,901 0 3,041
518200 Data processing, hosting, and related services 0.01 13,105 0.01 11,706
5191A0 News syndicates, libraries, archives and all other information services
0 11,647 0 10,319
519130 Internet publishing and broadcasting and Web search portals
0.04 589 0.03 1,876
52A000 Monetary authorities and depository credit intermediation
0.01 146,920 0 137,403
522A00 Nondepository credit intermediation and related activities
0.02 44,736 0.01 41,163
523A00 Securities and commodity contracts intermediation and brokerage
0.03 11,265 0.02 8,910
523900 Other financial investment activities 0.04 6,361 0.02 11,941
524100 Insurance carriers 0 66,351 0 56,224
524200 Insurance agencies, brokerages, and related activities
0.01 52,007 0 57,064
46
525000 Funds, trusts, and other financial vehicles 0 1,865 0 146
531 Housing and other real estate 0 68,345 0 67,767
532100 Automotive equipment rental and leasing 0.01 9,049 0.01 10,728
532A00 Consumer goods and general rental centers 0.01 25,237 0 15,614
532400 Commercial and industrial machinery and equipment rental and leasing
0.17 4,466 0.06 8,539
533000 Lessors of nonfinancial intangible assets 0.04 951 0.03 823
541100 Legal services 0.01 61,252 0.01 55,498
541511 Custom computer programming services
0 19,540 0 25,305
541512 Computer systems design services 0.01 19,138 0.01 36,014
54151A Other computer related services, including facilities management 0.01 7,536 0.01 6,590
541200 Accounting, tax preparation, bookkeeping, and payroll services 0.02 44,687 0.01 46,303
541300 Architectural, engineering, and related services 0.02 86,817 0.01 91,468
541400 Specialized design services 0.01 6,710 0.01 4,753
541610 Management consulting services 0.01 31,809 0.01 34,582
5416A0 Environmental and other technical consulting services 0.02 5,752 0.01 8,797
541700 Scientific research and development services 0 23,269 0 27,961
541800 Advertising, public relations, and related services 0.02 16,106 0.01 14,353
5419A0 Marketing research and all other miscellaneous professional, scientific, and technical services
0.02 6,719 0.01 7,948
541920 Photographic services 0 6,197 0 3,130
541940 Veterinary services 0 19,891 0 25,826
550000 Management of companies and enterprises 0.04 87,229 0.02 128,312
561100 Office administrative services 0.01 18,614 0.01 17,390
561200 Facilities support services 0.01 5,129 0 9,969
561300 Employment services 0.01 190,456 0 218,494
561400 Business support services 0.01 59,139 0.01 66,562
561500 Travel arrangement and reservation services 0.01 9,463 0.01 7,336
561600 Investigation and security services 0.01 37,926 0.01 44,104
561700 Services to buildings and dwellings 0.01 101,402 0.01 117,449
561900 Other support services 0.01 16,083 0.01 16,230
562000 Waste management and remediation services 0.01 25,754 0.01 31,623
47
611100 Elementary and secondary schools 0 615,304 0 583,384
611A00 Junior colleges, colleges, universities, and professional schools
0 207,638 0 246,271
611B00 Other educational services 0 33,516 0 35,063
621100 Offices of physicians 0 163,952 0 192,373
621200 Offices of dentists 0 51,720 0 57,648
621300 Offices of other health practitioners
0 45,584 0 63,090
621400 Outpatient care centers 0 47,189 0 65,331
621500 Medical and diagnostic laboratories 0 10,297 0 14,457
621600 Home health care services 0 53,212 0 74,457
621900 Other ambulatory health care services 0 26,547 0 31,922
622000 Hospitals 0 441,832 0 457,206
623A00 Nursing and community care facilities
0 207,735 0 223,211
623B00 Residential mental retardation, mental health, substance abuse and other facilities
0 73,667 0 80,872
624100 Individual and family services 0 93,280 0 138,691
624A00 Community food, housing, and other relief services, including rehabilitation services
0 42,684 0 39,971
624400 Child day care services 0 56,268 0 58,492
711100 Performing arts companies 0.01 4,769 0 5,031
711200 Spectator sports 0 6,287 0 5,497
711A00 Promoters of performing arts and sports and agents for public figures
0 4,367 0 7,695
711500 Independent artists, writers, and performers 0.01 1,299 0.01 1,195
712000 Museums, historical sites, zoos, and parks 0 12,166 0 13,610
713100 Amusement parks and arcades 0 6,095 0 7,069
713200 Gambling industries (except casino hotels) 0 6,974 0 11,595
713900 Other amusement and recreation industries
0 75,640 0 74,715
721000 Accommodation 0 91,620 0 105,133
722110 Full-service restaurants 0 313,949 0 351,225
722211 Limited-service restaurants 0 328,359 0 382,610
722A00 All other food and drinking places 0 49,502 0 56,232
811100 Automotive repair and maintenance 0 59,879 0 57,928
48
811200 Electronic and precision equipment repair and maintenance
0.01 6,438 0 6,769
811300 Commercial and industrial machinery and equipment repair and maintenance
0.01 17,026 0 18,186
811400 Personal and household goods repair and maintenance 0.01 4,703 0.01 3,488
812100 Personal care services 0 36,110 0 37,560
812200 Death care services 0 16,392 0 16,337
812300 Dry-cleaning and laundry services 0 22,385 0 17,940
812900 Other personal services 0 9,854 0 10,491
813100 Religious organizations 0 10,455 0 12,434
813A00 Grantmaking, giving, and social advocacy organizations
0 21,479 0 19,829
813B00 Civic, social, professional, and similar organizations 0 56,412 0 51,686
814000 Private households 0 14,086 0 14,060
491000 Postal Service 0.01 59,304 0 45,610
92 Government 0 465,186 0 473,556
DataSources:BureauofLaborStatisticsandBureauofEconomicAnalysis
49
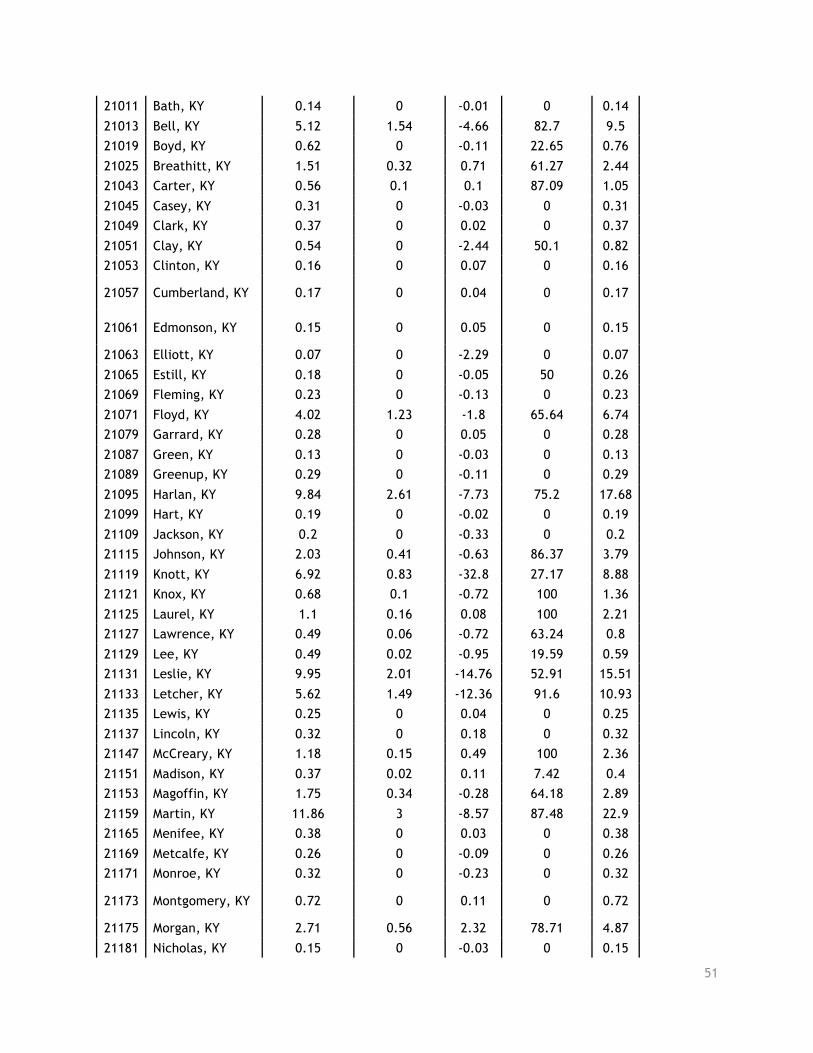
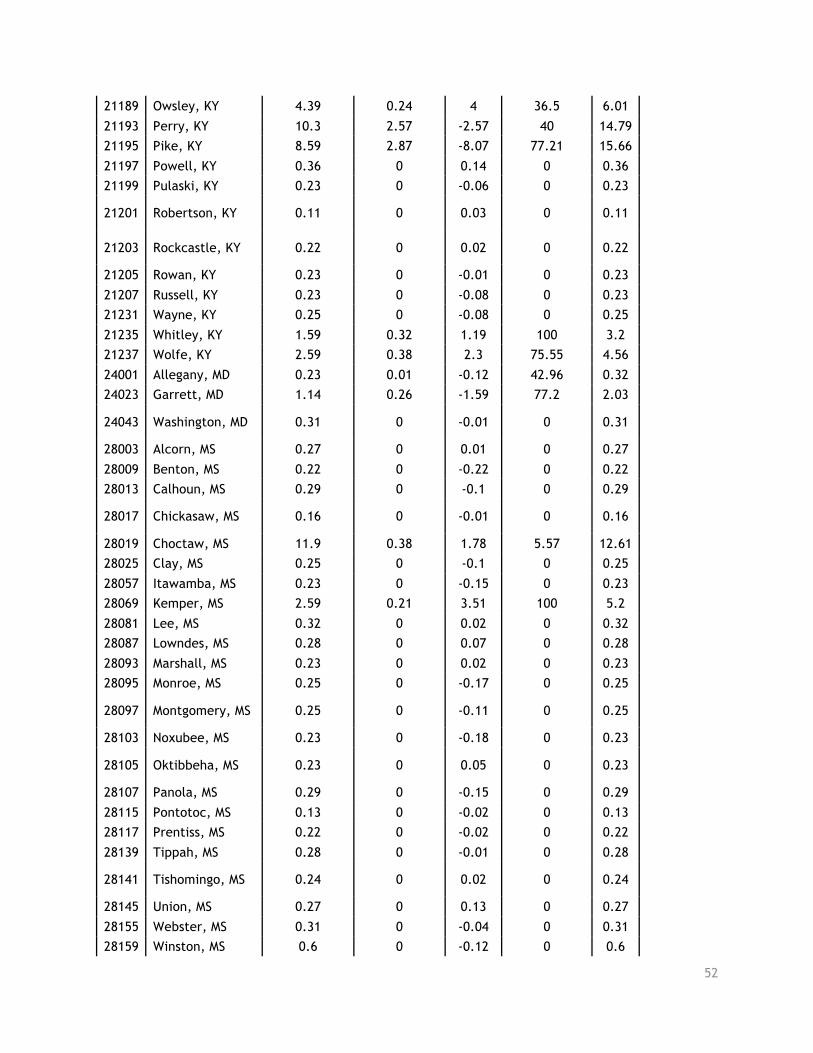
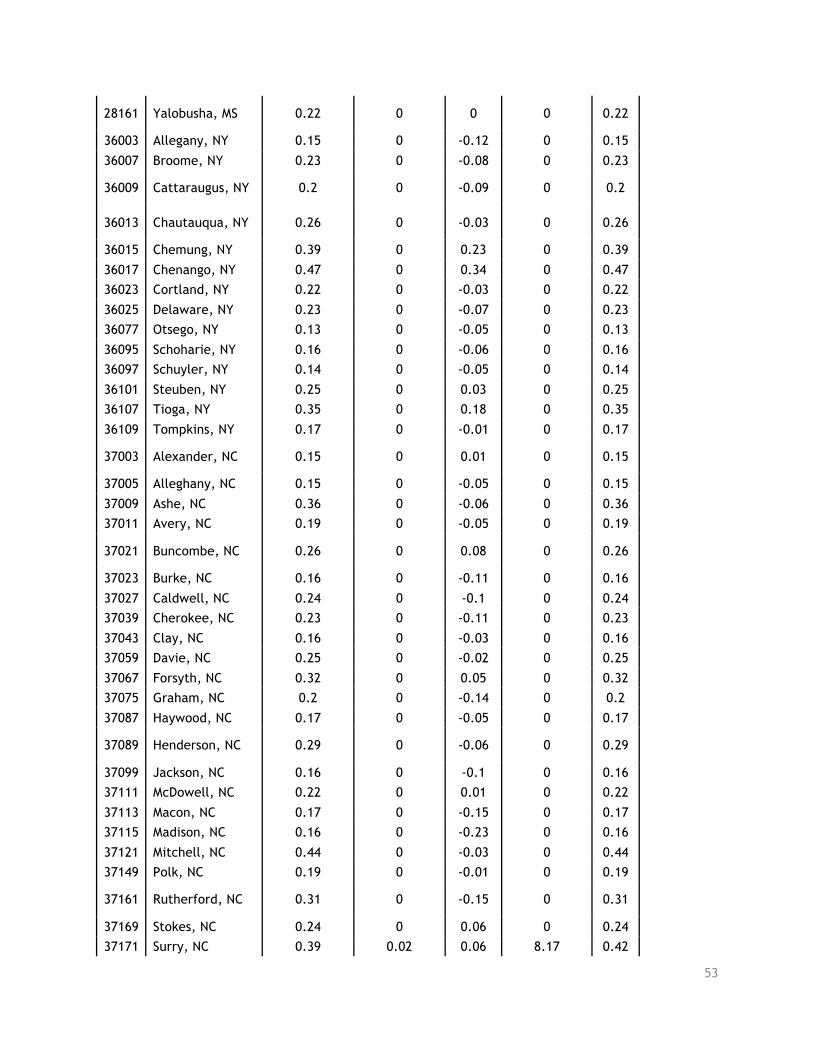
Appendix II. All Dependence, Impact, and Risk Scores
FIPS County Names 2015 Global Dependence
2015 Local Dependence
Impact Score
2015 Mine-Productivity
Risk
2015 Total Risk
1007 Bibb, AL 0.25 0 -0.18 0 0.25
1009 Blount, AL 0.92 0.21 0.61 77.62 1.65
1015 Calhoun, AL 0.25 0 -0.08 0 0.25
1017 Chambers, AL 0.29 0 -0.04 0 0.29
1019 Cherokee, AL 0.19 0 -0.07 0 0.19
1021 Chilton, AL 0.25 0 0.1 0 0.25
1027 Clay, AL 0.24 0 -0.1 0 0.24
1029 Cleburne, AL 0.16 0 -0.12 0 0.16
1033 Colbert, AL 0.33 0 0.06 0 0.33
1037 Coosa, AL 0.19 0 0 0 0.19
1043 Cullman, AL 0.26 0 -0.12 0 0.26
1049 DeKalb, AL 0.26 0 0.02 0 0.26
1051 Elmore, AL 0.18 0 0.03 0 0.18
1055 Etowah, AL 0.31 0 0.03 0 0.31
1057 Fayette, AL 0.25 0 -6.69 0 0.25
1059 Franklin, AL 0.35 0 0.05 40.61 0.49
1065 Hale, AL 0.35 0 0 0 0.35
1071 Jackson, AL 0.24 0 -0.14 7.62 0.26
1073 Jefferson, AL 0.7 0.16 -0.14 78.27 1.26
1075 Lamar, AL 0.69 0 0.02 0 0.69
1077 Lauderdale, AL 0.23 0 -0.03 0 0.23
1079 Lawrence, AL 0.22 0 -0.18 0 0.22
1083 Limestone, AL 0.24 0 -0.11 0 0.24
1087 Macon, AL 0.09 0 -0.08 0 0.09
1089 Madison, AL 0.3 0 0.03 0 0.3
1093 Marion, AL 0.34 0 -0.38 0 0.34
1095 Marshall, AL 0.24 0 -0.03 0 0.24
1103 Morgan, AL 0.33 0 -0.02 0 0.33
1107 Pickens, AL 0.28 0 -0.13 0 0.28
1111 Randolph, AL 0.24 0 0 0 0.24
1115 St. Clair, AL 0.29 0 0.09 0 0.29
1117 Shelby, AL 0.59 0.05 0.31 47.52 0.87
1121 Talladega, AL 0.3 0 -0.03 0 0.3
1123 Tallapoosa, AL 0.26 0 0 0 0.26
50
1125 Tuscaloosa, AL 1.92 0.62 0.39 81.27 3.5
1127 Walker, AL 2.06 0.62 -0.33 76.29 3.65
1133 Winston, AL 0.77 0.16 0.34 76.04 1.35
13011 Banks, GA 0.19 0 -0.01 0 0.19
13013 Barrow, GA 0.3 0 0.14 0 0.3
13015 Bartow, GA 0.41 0 0.14 0 0.41
13045 Carroll, GA 0.25 0 0.08 0 0.25
13047 Catoosa, GA 0.2 0 -0.02 0 0.2
13055 Chattooga, GA 0.18 0 -0.04 0 0.18
13057 Cherokee, GA 0.25 0 0.12 0 0.25
13083 Dade, GA 0.21 0 -0.05 0 0.21
13085 Dawson, GA 0.19 0 0.05 0 0.19
13097 Douglas, GA 0.27 0 0.04 0 0.27
13105 Elbert, GA 0.57 0 -0.05 0 0.57
13111 Fannin, GA 0.2 0 0.03 0 0.2
13115 Floyd, GA 0.23 0 -0.02 0 0.23
13117 Forsyth, GA 0.35 0 0.31 0 0.35
13119 Franklin, GA 0.31 0 -0.05 0 0.31
13123 Gilmer, GA 0.21 0 -0.08 0 0.21
13129 Gordon, GA 0.25 0 -0.04 0 0.25
13135 Gwinnett, GA 0.39 0 0.05 0 0.39
13137 Habersham, GA 0.18 0 -0.08 0 0.18
13139 Hall, GA 0.25 0 -0.04 0 0.25
13143 Haralson, GA 0.3 0 0.02 0 0.3
13147 Hart, GA 0.26 0 -0.08 0 0.26
13149 Heard, GA 0.4 0 -0.25 0 0.4
13157 Jackson, GA 0.47 0 0.54 0 0.47
13187 Lumpkin, GA 0.17 0 -0.11 0 0.17
13195 Madison, GA 0.24 0 -0.16 0 0.24
13213 Murray, GA 0.5 0 0.18 0 0.5
13223 Paulding, GA 0.2 0 0.1 0 0.2
13227 Pickens, GA 0.32 0 -0.1 0 0.32
13233 Polk, GA 0.24 0 -0.04 0 0.24
13241 Rabun, GA 0.16 0 -0.1 0 0.16
13257 Stephens, GA 0.29 0 -0.1 0 0.29
13281 Towns, GA 0.16 0 -0.09 0 0.16
13291 Union, GA 0.19 0 0 0 0.19
13295 Walker, GA 0.19 0 -0.02 0 0.19
13311 White, GA 0.3 0 0.21 0 0.3
13313 Whitfield, GA 0.28 0 -0.03 0 0.28
21001 Adair, KY 0.18 0 -0.08 0 0.18
51
21011 Bath, KY 0.14 0 -0.01 0 0.14
21013 Bell, KY 5.12 1.54 -4.66 82.7 9.5
21019 Boyd, KY 0.62 0 -0.11 22.65 0.76
21025 Breathitt, KY 1.51 0.32 0.71 61.27 2.44
21043 Carter, KY 0.56 0.1 0.1 87.09 1.05
21045 Casey, KY 0.31 0 -0.03 0 0.31
21049 Clark, KY 0.37 0 0.02 0 0.37
21051 Clay, KY 0.54 0 -2.44 50.1 0.82
21053 Clinton, KY 0.16 0 0.07 0 0.16
21057 Cumberland, KY 0.17 0 0.04 0 0.17
21061 Edmonson, KY 0.15 0 0.05 0 0.15
21063 Elliott, KY 0.07 0 -2.29 0 0.07
21065 Estill, KY 0.18 0 -0.05 50 0.26
21069 Fleming, KY 0.23 0 -0.13 0 0.23
21071 Floyd, KY 4.02 1.23 -1.8 65.64 6.74
21079 Garrard, KY 0.28 0 0.05 0 0.28
21087 Green, KY 0.13 0 -0.03 0 0.13
21089 Greenup, KY 0.29 0 -0.11 0 0.29
21095 Harlan, KY 9.84 2.61 -7.73 75.2 17.68
21099 Hart, KY 0.19 0 -0.02 0 0.19
21109 Jackson, KY 0.2 0 -0.33 0 0.2
21115 Johnson, KY 2.03 0.41 -0.63 86.37 3.79
21119 Knott, KY 6.92 0.83 -32.8 27.17 8.88
21121 Knox, KY 0.68 0.1 -0.72 100 1.36
21125 Laurel, KY 1.1 0.16 0.08 100 2.21
21127 Lawrence, KY 0.49 0.06 -0.72 63.24 0.8
21129 Lee, KY 0.49 0.02 -0.95 19.59 0.59
21131 Leslie, KY 9.95 2.01 -14.76 52.91 15.51
21133 Letcher, KY 5.62 1.49 -12.36 91.6 10.93
21135 Lewis, KY 0.25 0 0.04 0 0.25
21137 Lincoln, KY 0.32 0 0.18 0 0.32
21147 McCreary, KY 1.18 0.15 0.49 100 2.36
21151 Madison, KY 0.37 0.02 0.11 7.42 0.4
21153 Magoffin, KY 1.75 0.34 -0.28 64.18 2.89
21159 Martin, KY 11.86 3 -8.57 87.48 22.9
21165 Menifee, KY 0.38 0 0.03 0 0.38
21169 Metcalfe, KY 0.26 0 -0.09 0 0.26
21171 Monroe, KY 0.32 0 -0.23 0 0.32
21173 Montgomery, KY 0.72 0 0.11 0 0.72
21175 Morgan, KY 2.71 0.56 2.32 78.71 4.87
21181 Nicholas, KY 0.15 0 -0.03 0 0.15
52
21189 Owsley, KY 4.39 0.24 4 36.5 6.01
21193 Perry, KY 10.3 2.57 -2.57 40 14.79
21195 Pike, KY 8.59 2.87 -8.07 77.21 15.66
21197 Powell, KY 0.36 0 0.14 0 0.36
21199 Pulaski, KY 0.23 0 -0.06 0 0.23
21201 Robertson, KY 0.11 0 0.03 0 0.11
21203 Rockcastle, KY 0.22 0 0.02 0 0.22
21205 Rowan, KY 0.23 0 -0.01 0 0.23
21207 Russell, KY 0.23 0 -0.08 0 0.23
21231 Wayne, KY 0.25 0 -0.08 0 0.25
21235 Whitley, KY 1.59 0.32 1.19 100 3.2
21237 Wolfe, KY 2.59 0.38 2.3 75.55 4.56
24001 Allegany, MD 0.23 0.01 -0.12 42.96 0.32
24023 Garrett, MD 1.14 0.26 -1.59 77.2 2.03
24043 Washington, MD 0.31 0 -0.01 0 0.31
28003 Alcorn, MS 0.27 0 0.01 0 0.27
28009 Benton, MS 0.22 0 -0.22 0 0.22
28013 Calhoun, MS 0.29 0 -0.1 0 0.29
28017 Chickasaw, MS 0.16 0 -0.01 0 0.16
28019 Choctaw, MS 11.9 0.38 1.78 5.57 12.61
28025 Clay, MS 0.25 0 -0.1 0 0.25
28057 Itawamba, MS 0.23 0 -0.15 0 0.23
28069 Kemper, MS 2.59 0.21 3.51 100 5.2
28081 Lee, MS 0.32 0 0.02 0 0.32
28087 Lowndes, MS 0.28 0 0.07 0 0.28
28093 Marshall, MS 0.23 0 0.02 0 0.23
28095 Monroe, MS 0.25 0 -0.17 0 0.25
28097 Montgomery, MS 0.25 0 -0.11 0 0.25
28103 Noxubee, MS 0.23 0 -0.18 0 0.23
28105 Oktibbeha, MS 0.23 0 0.05 0 0.23
28107 Panola, MS 0.29 0 -0.15 0 0.29
28115 Pontotoc, MS 0.13 0 -0.02 0 0.13
28117 Prentiss, MS 0.22 0 -0.02 0 0.22
28139 Tippah, MS 0.28 0 -0.01 0 0.28
28141 Tishomingo, MS 0.24 0 0.02 0 0.24
28145 Union, MS 0.27 0 0.13 0 0.27
28155 Webster, MS 0.31 0 -0.04 0 0.31
28159 Winston, MS 0.6 0 -0.12 0 0.6
53
28161 Yalobusha, MS 0.22 0 0 0 0.22
36003 Allegany, NY 0.15 0 -0.12 0 0.15
36007 Broome, NY 0.23 0 -0.08 0 0.23
36009 Cattaraugus, NY 0.2 0 -0.09 0 0.2
36013 Chautauqua, NY 0.26 0 -0.03 0 0.26
36015 Chemung, NY 0.39 0 0.23 0 0.39
36017 Chenango, NY 0.47 0 0.34 0 0.47
36023 Cortland, NY 0.22 0 -0.03 0 0.22
36025 Delaware, NY 0.23 0 -0.07 0 0.23
36077 Otsego, NY 0.13 0 -0.05 0 0.13
36095 Schoharie, NY 0.16 0 -0.06 0 0.16
36097 Schuyler, NY 0.14 0 -0.05 0 0.14
36101 Steuben, NY 0.25 0 0.03 0 0.25
36107 Tioga, NY 0.35 0 0.18 0 0.35
36109 Tompkins, NY 0.17 0 -0.01 0 0.17
37003 Alexander, NC 0.15 0 0.01 0 0.15
37005 Alleghany, NC 0.15 0 -0.05 0 0.15
37009 Ashe, NC 0.36 0 -0.06 0 0.36
37011 Avery, NC 0.19 0 -0.05 0 0.19
37021 Buncombe, NC 0.26 0 0.08 0 0.26
37023 Burke, NC 0.16 0 -0.11 0 0.16
37027 Caldwell, NC 0.24 0 -0.1 0 0.24
37039 Cherokee, NC 0.23 0 -0.11 0 0.23
37043 Clay, NC 0.16 0 -0.03 0 0.16
37059 Davie, NC 0.25 0 -0.02 0 0.25
37067 Forsyth, NC 0.32 0 0.05 0 0.32
37075 Graham, NC 0.2 0 -0.14 0 0.2
37087 Haywood, NC 0.17 0 -0.05 0 0.17
37089 Henderson, NC 0.29 0 -0.06 0 0.29
37099 Jackson, NC 0.16 0 -0.1 0 0.16
37111 McDowell, NC 0.22 0 0.01 0 0.22
37113 Macon, NC 0.17 0 -0.15 0 0.17
37115 Madison, NC 0.16 0 -0.23 0 0.16
37121 Mitchell, NC 0.44 0 -0.03 0 0.44
37149 Polk, NC 0.19 0 -0.01 0 0.19
37161 Rutherford, NC 0.31 0 -0.15 0 0.31
37169 Stokes, NC 0.24 0 0.06 0 0.24
37171 Surry, NC 0.39 0.02 0.06 8.17 0.42
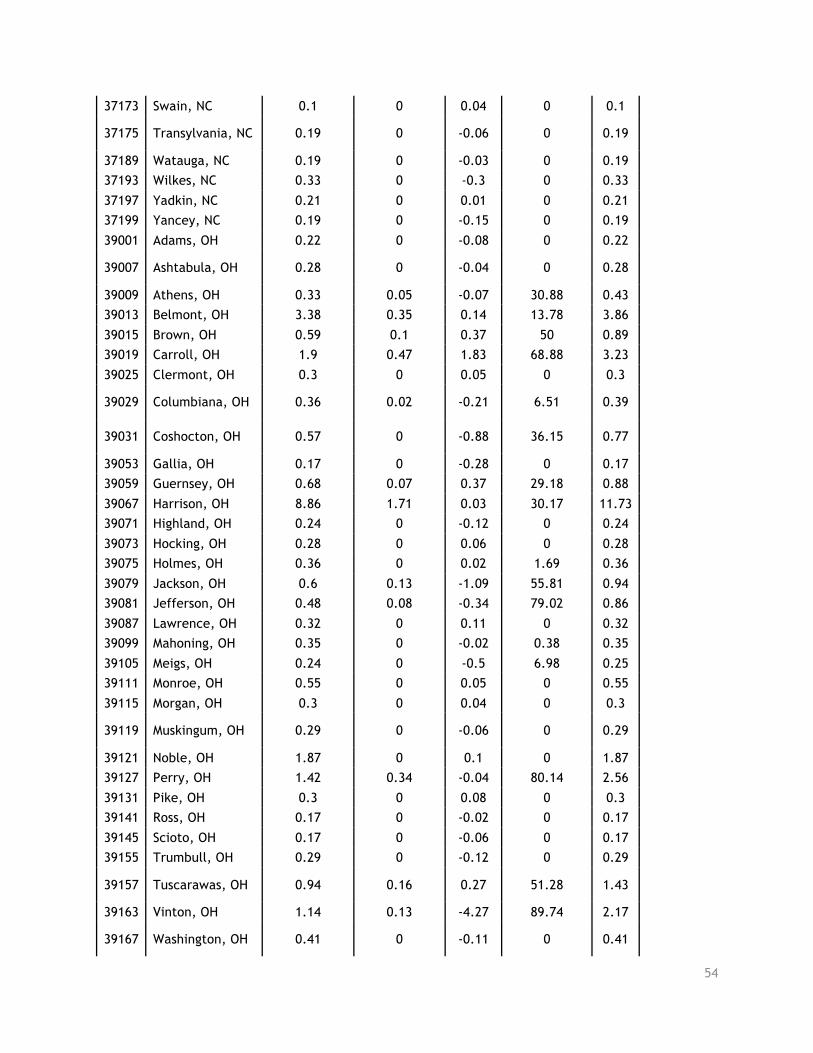
54
37173 Swain, NC 0.1 0 0.04 0 0.1
37175 Transylvania, NC 0.19 0 -0.06 0 0.19
37189 Watauga, NC 0.19 0 -0.03 0 0.19
37193 Wilkes, NC 0.33 0 -0.3 0 0.33
37197 Yadkin, NC 0.21 0 0.01 0 0.21
37199 Yancey, NC 0.19 0 -0.15 0 0.19
39001 Adams, OH 0.22 0 -0.08 0 0.22
39007 Ashtabula, OH 0.28 0 -0.04 0 0.28
39009 Athens, OH 0.33 0.05 -0.07 30.88 0.43
39013 Belmont, OH 3.38 0.35 0.14 13.78 3.86
39015 Brown, OH 0.59 0.1 0.37 50 0.89
39019 Carroll, OH 1.9 0.47 1.83 68.88 3.23
39025 Clermont, OH 0.3 0 0.05 0 0.3
39029 Columbiana, OH 0.36 0.02 -0.21 6.51 0.39
39031 Coshocton, OH 0.57 0 -0.88 36.15 0.77
39053 Gallia, OH 0.17 0 -0.28 0 0.17
39059 Guernsey, OH 0.68 0.07 0.37 29.18 0.88
39067 Harrison, OH 8.86 1.71 0.03 30.17 11.73
39071 Highland, OH 0.24 0 -0.12 0 0.24
39073 Hocking, OH 0.28 0 0.06 0 0.28
39075 Holmes, OH 0.36 0 0.02 1.69 0.36
39079 Jackson, OH 0.6 0.13 -1.09 55.81 0.94
39081 Jefferson, OH 0.48 0.08 -0.34 79.02 0.86
39087 Lawrence, OH 0.32 0 0.11 0 0.32
39099 Mahoning, OH 0.35 0 -0.02 0.38 0.35
39105 Meigs, OH 0.24 0 -0.5 6.98 0.25
39111 Monroe, OH 0.55 0 0.05 0 0.55
39115 Morgan, OH 0.3 0 0.04 0 0.3
39119 Muskingum, OH 0.29 0 -0.06 0 0.29
39121 Noble, OH 1.87 0 0.1 0 1.87
39127 Perry, OH 1.42 0.34 -0.04 80.14 2.56
39131 Pike, OH 0.3 0 0.08 0 0.3
39141 Ross, OH 0.17 0 -0.02 0 0.17
39145 Scioto, OH 0.17 0 -0.06 0 0.17
39155 Trumbull, OH 0.29 0 -0.12 0 0.29
39157 Tuscarawas, OH 0.94 0.16 0.27 51.28 1.43
39163 Vinton, OH 1.14 0.13 -4.27 89.74 2.17
39167 Washington, OH 0.41 0 -0.11 0 0.41
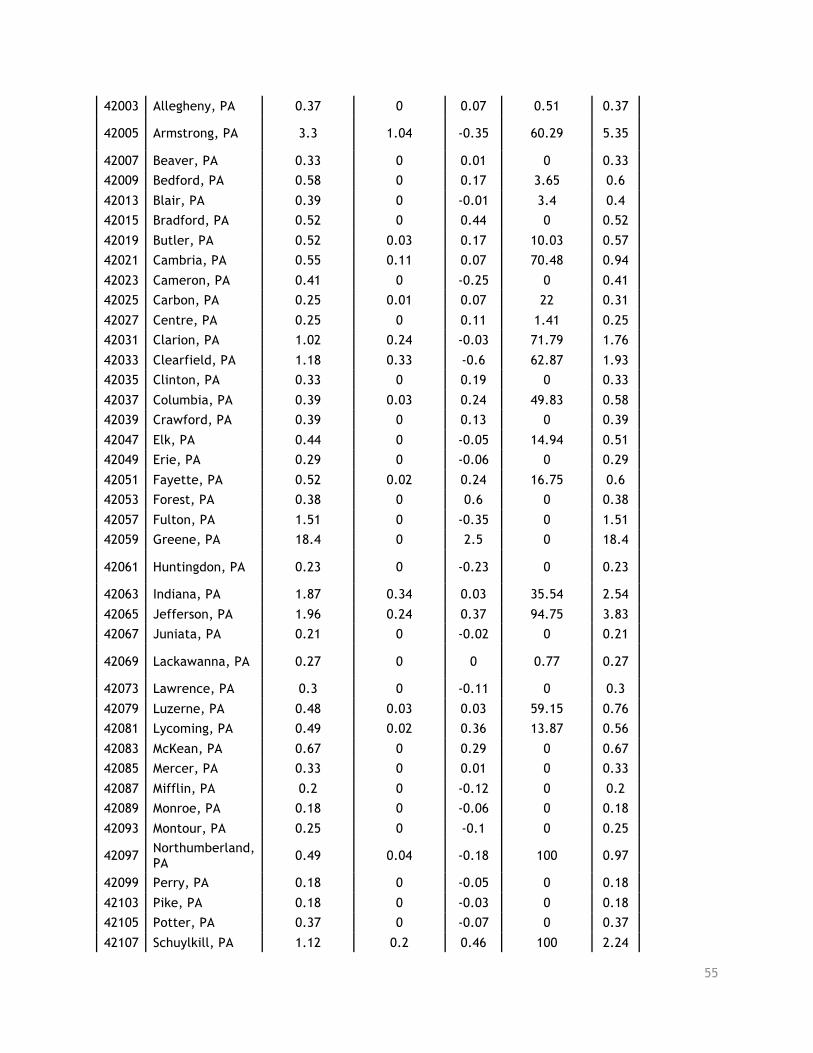
55
42003 Allegheny, PA 0.37 0 0.07 0.51 0.37
42005 Armstrong, PA 3.3 1.04 -0.35 60.29 5.35
42007 Beaver, PA 0.33 0 0.01 0 0.33
42009 Bedford, PA 0.58 0 0.17 3.65 0.6
42013 Blair, PA 0.39 0 -0.01 3.4 0.4
42015 Bradford, PA 0.52 0 0.44 0 0.52
42019 Butler, PA 0.52 0.03 0.17 10.03 0.57
42021 Cambria, PA 0.55 0.11 0.07 70.48 0.94
42023 Cameron, PA 0.41 0 -0.25 0 0.41
42025 Carbon, PA 0.25 0.01 0.07 22 0.31
42027 Centre, PA 0.25 0 0.11 1.41 0.25
42031 Clarion, PA 1.02 0.24 -0.03 71.79 1.76
42033 Clearfield, PA 1.18 0.33 -0.6 62.87 1.93
42035 Clinton, PA 0.33 0 0.19 0 0.33
42037 Columbia, PA 0.39 0.03 0.24 49.83 0.58
42039 Crawford, PA 0.39 0 0.13 0 0.39
42047 Elk, PA 0.44 0 -0.05 14.94 0.51
42049 Erie, PA 0.29 0 -0.06 0 0.29
42051 Fayette, PA 0.52 0.02 0.24 16.75 0.6
42053 Forest, PA 0.38 0 0.6 0 0.38
42057 Fulton, PA 1.51 0 -0.35 0 1.51
42059 Greene, PA 18.4 0 2.5 0 18.4
42061 Huntingdon, PA 0.23 0 -0.23 0 0.23
42063 Indiana, PA 1.87 0.34 0.03 35.54 2.54
42065 Jefferson, PA 1.96 0.24 0.37 94.75 3.83
42067 Juniata, PA 0.21 0 -0.02 0 0.21
42069 Lackawanna, PA 0.27 0 0 0.77 0.27
42073 Lawrence, PA 0.3 0 -0.11 0 0.3
42079 Luzerne, PA 0.48 0.03 0.03 59.15 0.76
42081 Lycoming, PA 0.49 0.02 0.36 13.87 0.56
42083 McKean, PA 0.67 0 0.29 0 0.67
42085 Mercer, PA 0.33 0 0.01 0 0.33
42087 Mifflin, PA 0.2 0 -0.12 0 0.2
42089 Monroe, PA 0.18 0 -0.06 0 0.18
42093 Montour, PA 0.25 0 -0.1 0 0.25
42097 Northumberland, PA 0.49 0.04 -0.18 100 0.97
42099 Perry, PA 0.18 0 -0.05 0 0.18
42103 Pike, PA 0.18 0 -0.03 0 0.18
42105 Potter, PA 0.37 0 -0.07 0 0.37
42107 Schuylkill, PA 1.12 0.2 0.46 100 2.24
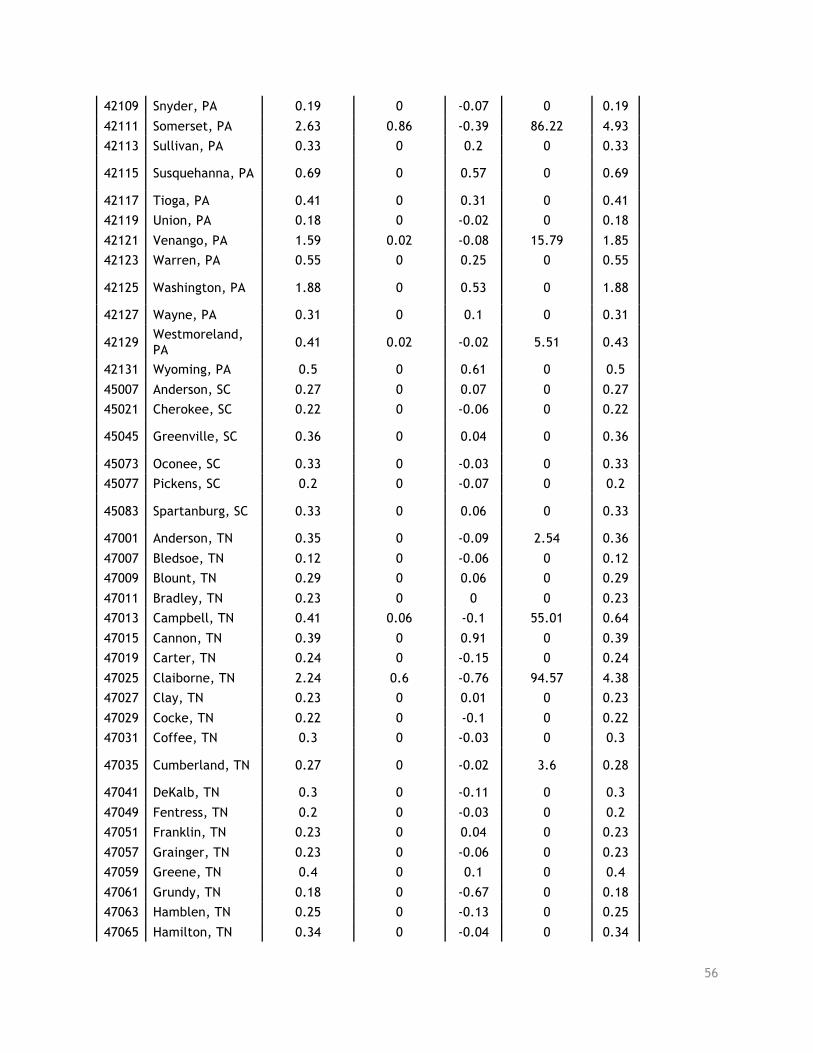
56
42109 Snyder, PA 0.19 0 -0.07 0 0.19
42111 Somerset, PA 2.63 0.86 -0.39 86.22 4.93
42113 Sullivan, PA 0.33 0 0.2 0 0.33
42115 Susquehanna, PA 0.69 0 0.57 0 0.69
42117 Tioga, PA 0.41 0 0.31 0 0.41
42119 Union, PA 0.18 0 -0.02 0 0.18
42121 Venango, PA 1.59 0.02 -0.08 15.79 1.85
42123 Warren, PA 0.55 0 0.25 0 0.55
42125 Washington, PA 1.88 0 0.53 0 1.88
42127 Wayne, PA 0.31 0 0.1 0 0.31
42129 Westmoreland, PA 0.41 0.02 -0.02 5.51 0.43
42131 Wyoming, PA 0.5 0 0.61 0 0.5
45007 Anderson, SC 0.27 0 0.07 0 0.27
45021 Cherokee, SC 0.22 0 -0.06 0 0.22
45045 Greenville, SC 0.36 0 0.04 0 0.36
45073 Oconee, SC 0.33 0 -0.03 0 0.33
45077 Pickens, SC 0.2 0 -0.07 0 0.2
45083 Spartanburg, SC 0.33 0 0.06 0 0.33
47001 Anderson, TN 0.35 0 -0.09 2.54 0.36
47007 Bledsoe, TN 0.12 0 -0.06 0 0.12
47009 Blount, TN 0.29 0 0.06 0 0.29
47011 Bradley, TN 0.23 0 0 0 0.23
47013 Campbell, TN 0.41 0.06 -0.1 55.01 0.64
47015 Cannon, TN 0.39 0 0.91 0 0.39
47019 Carter, TN 0.24 0 -0.15 0 0.24
47025 Claiborne, TN 2.24 0.6 -0.76 94.57 4.38
47027 Clay, TN 0.23 0 0.01 0 0.23
47029 Cocke, TN 0.22 0 -0.1 0 0.22
47031 Coffee, TN 0.3 0 -0.03 0 0.3
47035 Cumberland, TN 0.27 0 -0.02 3.6 0.28
47041 DeKalb, TN 0.3 0 -0.11 0 0.3
47049 Fentress, TN 0.2 0 -0.03 0 0.2
47051 Franklin, TN 0.23 0 0.04 0 0.23
47057 Grainger, TN 0.23 0 -0.06 0 0.23
47059 Greene, TN 0.4 0 0.1 0 0.4
47061 Grundy, TN 0.18 0 -0.67 0 0.18
47063 Hamblen, TN 0.25 0 -0.13 0 0.25
47065 Hamilton, TN 0.34 0 -0.04 0 0.34
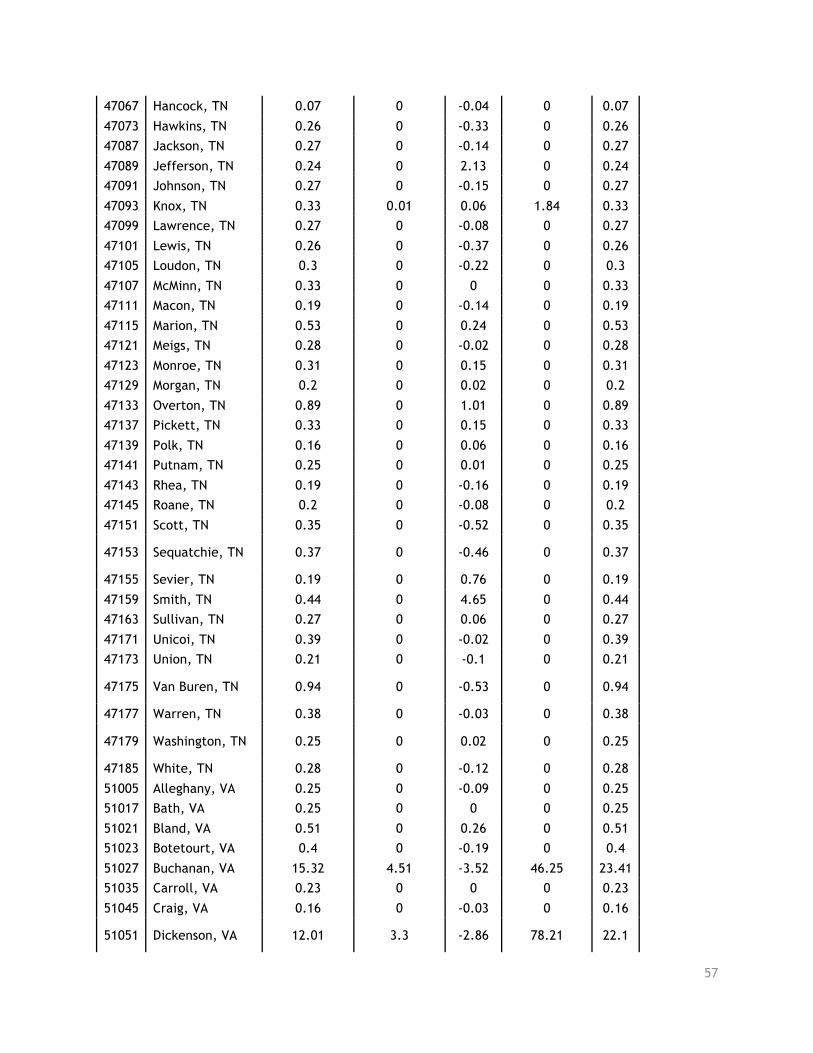
57
47067 Hancock, TN 0.07 0 -0.04 0 0.07
47073 Hawkins, TN 0.26 0 -0.33 0 0.26
47087 Jackson, TN 0.27 0 -0.14 0 0.27
47089 Jefferson, TN 0.24 0 2.13 0 0.24
47091 Johnson, TN 0.27 0 -0.15 0 0.27
47093 Knox, TN 0.33 0.01 0.06 1.84 0.33
47099 Lawrence, TN 0.27 0 -0.08 0 0.27
47101 Lewis, TN 0.26 0 -0.37 0 0.26
47105 Loudon, TN 0.3 0 -0.22 0 0.3
47107 McMinn, TN 0.33 0 0 0 0.33
47111 Macon, TN 0.19 0 -0.14 0 0.19
47115 Marion, TN 0.53 0 0.24 0 0.53
47121 Meigs, TN 0.28 0 -0.02 0 0.28
47123 Monroe, TN 0.31 0 0.15 0 0.31
47129 Morgan, TN 0.2 0 0.02 0 0.2
47133 Overton, TN 0.89 0 1.01 0 0.89
47137 Pickett, TN 0.33 0 0.15 0 0.33
47139 Polk, TN 0.16 0 0.06 0 0.16
47141 Putnam, TN 0.25 0 0.01 0 0.25
47143 Rhea, TN 0.19 0 -0.16 0 0.19
47145 Roane, TN 0.2 0 -0.08 0 0.2
47151 Scott, TN 0.35 0 -0.52 0 0.35
47153 Sequatchie, TN 0.37 0 -0.46 0 0.37
47155 Sevier, TN 0.19 0 0.76 0 0.19
47159 Smith, TN 0.44 0 4.65 0 0.44
47163 Sullivan, TN 0.27 0 0.06 0 0.27
47171 Unicoi, TN 0.39 0 -0.02 0 0.39
47173 Union, TN 0.21 0 -0.1 0 0.21
47175 Van Buren, TN 0.94 0 -0.53 0 0.94
47177 Warren, TN 0.38 0 -0.03 0 0.38
47179 Washington, TN 0.25 0 0.02 0 0.25
47185 White, TN 0.28 0 -0.12 0 0.28
51005 Alleghany, VA 0.25 0 -0.09 0 0.25
51017 Bath, VA 0.25 0 0 0 0.25
51021 Bland, VA 0.51 0 0.26 0 0.51
51023 Botetourt, VA 0.4 0 -0.19 0 0.4
51027 Buchanan, VA 15.32 4.51 -3.52 46.25 23.41
51035 Carroll, VA 0.23 0 0 0 0.23
51045 Craig, VA 0.16 0 -0.03 0 0.16
51051 Dickenson, VA 12.01 3.3 -2.86 78.21 22.1
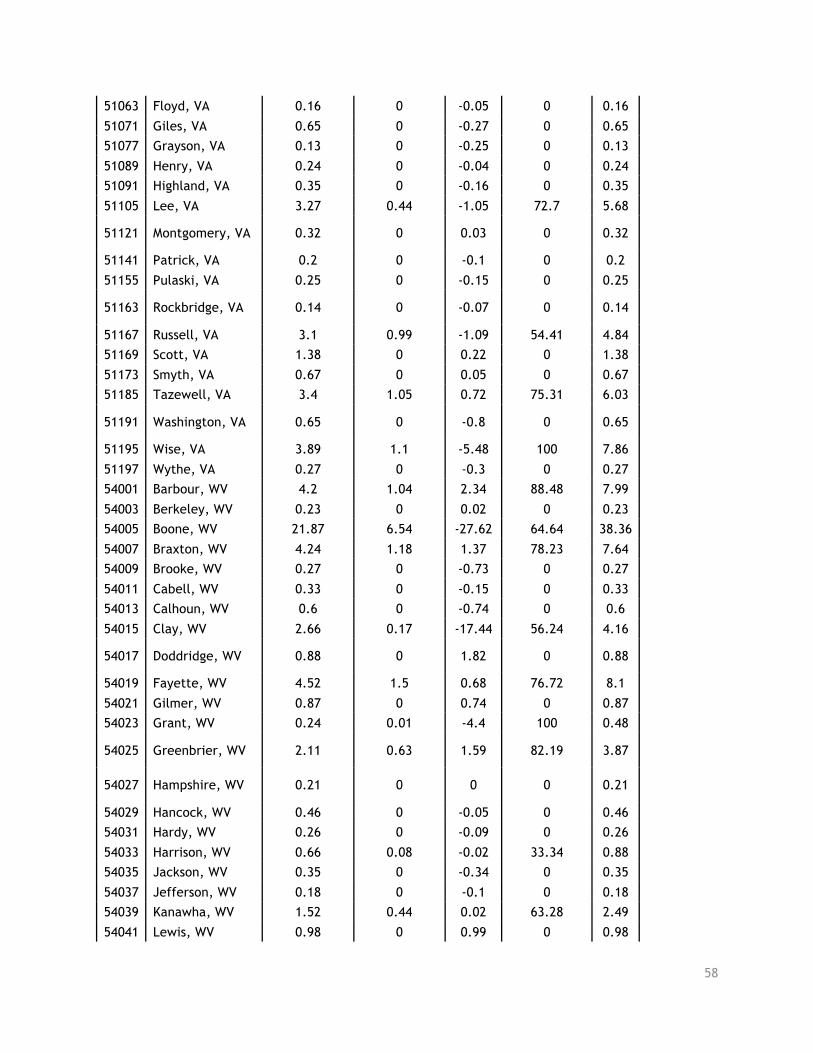
58
51063 Floyd, VA 0.16 0 -0.05 0 0.16
51071 Giles, VA 0.65 0 -0.27 0 0.65
51077 Grayson, VA 0.13 0 -0.25 0 0.13
51089 Henry, VA 0.24 0 -0.04 0 0.24
51091 Highland, VA 0.35 0 -0.16 0 0.35
51105 Lee, VA 3.27 0.44 -1.05 72.7 5.68
51121 Montgomery, VA 0.32 0 0.03 0 0.32
51141 Patrick, VA 0.2 0 -0.1 0 0.2
51155 Pulaski, VA 0.25 0 -0.15 0 0.25
51163 Rockbridge, VA 0.14 0 -0.07 0 0.14
51167 Russell, VA 3.1 0.99 -1.09 54.41 4.84
51169 Scott, VA 1.38 0 0.22 0 1.38
51173 Smyth, VA 0.67 0 0.05 0 0.67
51185 Tazewell, VA 3.4 1.05 0.72 75.31 6.03
51191 Washington, VA 0.65 0 -0.8 0 0.65
51195 Wise, VA 3.89 1.1 -5.48 100 7.86
51197 Wythe, VA 0.27 0 -0.3 0 0.27
54001 Barbour, WV 4.2 1.04 2.34 88.48 7.99
54003 Berkeley, WV 0.23 0 0.02 0 0.23
54005 Boone, WV 21.87 6.54 -27.62 64.64 38.36
54007 Braxton, WV 4.24 1.18 1.37 78.23 7.64
54009 Brooke, WV 0.27 0 -0.73 0 0.27
54011 Cabell, WV 0.33 0 -0.15 0 0.33
54013 Calhoun, WV 0.6 0 -0.74 0 0.6
54015 Clay, WV 2.66 0.17 -17.44 56.24 4.16
54017 Doddridge, WV 0.88 0 1.82 0 0.88
54019 Fayette, WV 4.52 1.5 0.68 76.72 8.1
54021 Gilmer, WV 0.87 0 0.74 0 0.87
54023 Grant, WV 0.24 0.01 -4.4 100 0.48
54025 Greenbrier, WV 2.11 0.63 1.59 82.19 3.87
54027 Hampshire, WV 0.21 0 0 0 0.21
54029 Hancock, WV 0.46 0 -0.05 0 0.46
54031 Hardy, WV 0.26 0 -0.09 0 0.26
54033 Harrison, WV 0.66 0.08 -0.02 33.34 0.88
54035 Jackson, WV 0.35 0 -0.34 0 0.35
54037 Jefferson, WV 0.18 0 -0.1 0 0.18
54039 Kanawha, WV 1.52 0.44 0.02 63.28 2.49
54041 Lewis, WV 0.98 0 0.99 0 0.98
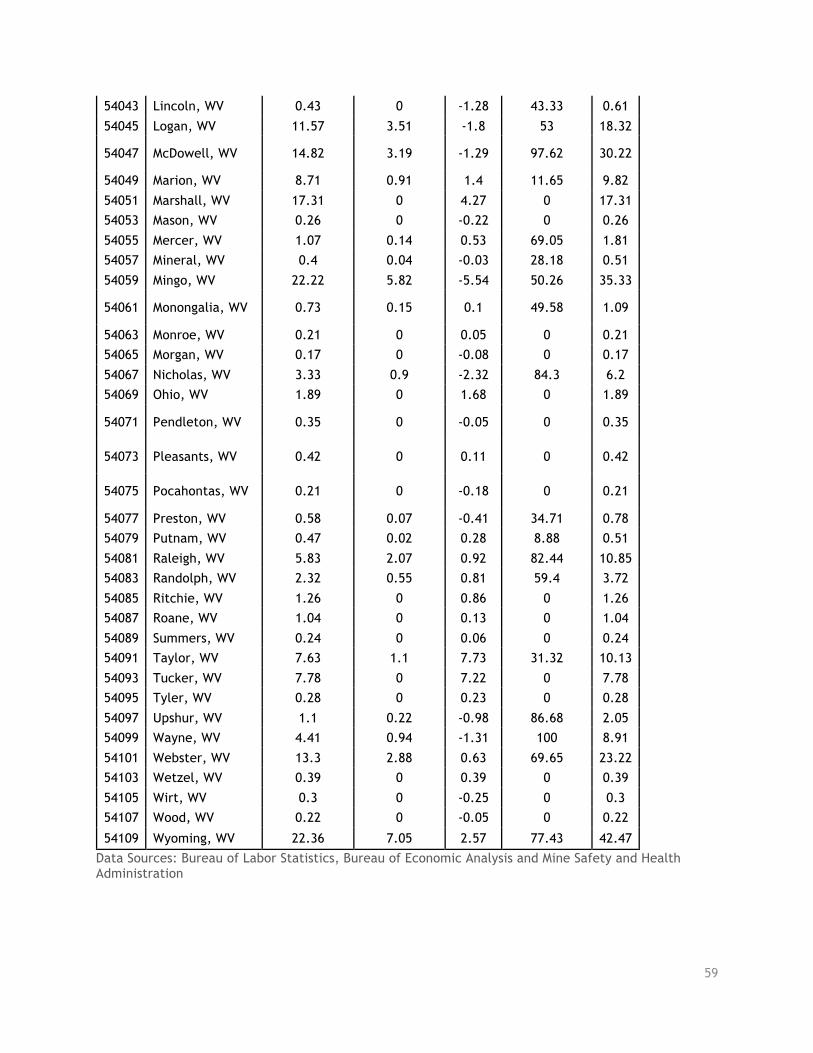
59
54043 Lincoln, WV 0.43 0 -1.28 43.33 0.61
54045 Logan, WV 11.57 3.51 -1.8 53 18.32
54047 McDowell, WV 14.82 3.19 -1.29 97.62 30.22
54049 Marion, WV 8.71 0.91 1.4 11.65 9.82
54051 Marshall, WV 17.31 0 4.27 0 17.31
54053 Mason, WV 0.26 0 -0.22 0 0.26
54055 Mercer, WV 1.07 0.14 0.53 69.05 1.81
54057 Mineral, WV 0.4 0.04 -0.03 28.18 0.51
54059 Mingo, WV 22.22 5.82 -5.54 50.26 35.33
54061 Monongalia, WV 0.73 0.15 0.1 49.58 1.09
54063 Monroe, WV 0.21 0 0.05 0 0.21
54065 Morgan, WV 0.17 0 -0.08 0 0.17
54067 Nicholas, WV 3.33 0.9 -2.32 84.3 6.2
54069 Ohio, WV 1.89 0 1.68 0 1.89
54071 Pendleton, WV 0.35 0 -0.05 0 0.35
54073 Pleasants, WV 0.42 0 0.11 0 0.42
54075 Pocahontas, WV 0.21 0 -0.18 0 0.21
54077 Preston, WV 0.58 0.07 -0.41 34.71 0.78
54079 Putnam, WV 0.47 0.02 0.28 8.88 0.51
54081 Raleigh, WV 5.83 2.07 0.92 82.44 10.85
54083 Randolph, WV 2.32 0.55 0.81 59.4 3.72
54085 Ritchie, WV 1.26 0 0.86 0 1.26
54087 Roane, WV 1.04 0 0.13 0 1.04
54089 Summers, WV 0.24 0 0.06 0 0.24
54091 Taylor, WV 7.63 1.1 7.73 31.32 10.13
54093 Tucker, WV 7.78 0 7.22 0 7.78
54095 Tyler, WV 0.28 0 0.23 0 0.28
54097 Upshur, WV 1.1 0.22 -0.98 86.68 2.05
54099 Wayne, WV 4.41 0.94 -1.31 100 8.91
54101 Webster, WV 13.3 2.88 0.63 69.65 23.22
54103 Wetzel, WV 0.39 0 0.39 0 0.39
54105 Wirt, WV 0.3 0 -0.25 0 0.3
54107 Wood, WV 0.22 0 -0.05 0 0.22
54109 Wyoming, WV 22.36 7.05 2.57 77.43 42.47
Data Sources: Bureau of Labor Statistics, Bureau of Economic Analysis and Mine Safety and Health Administration
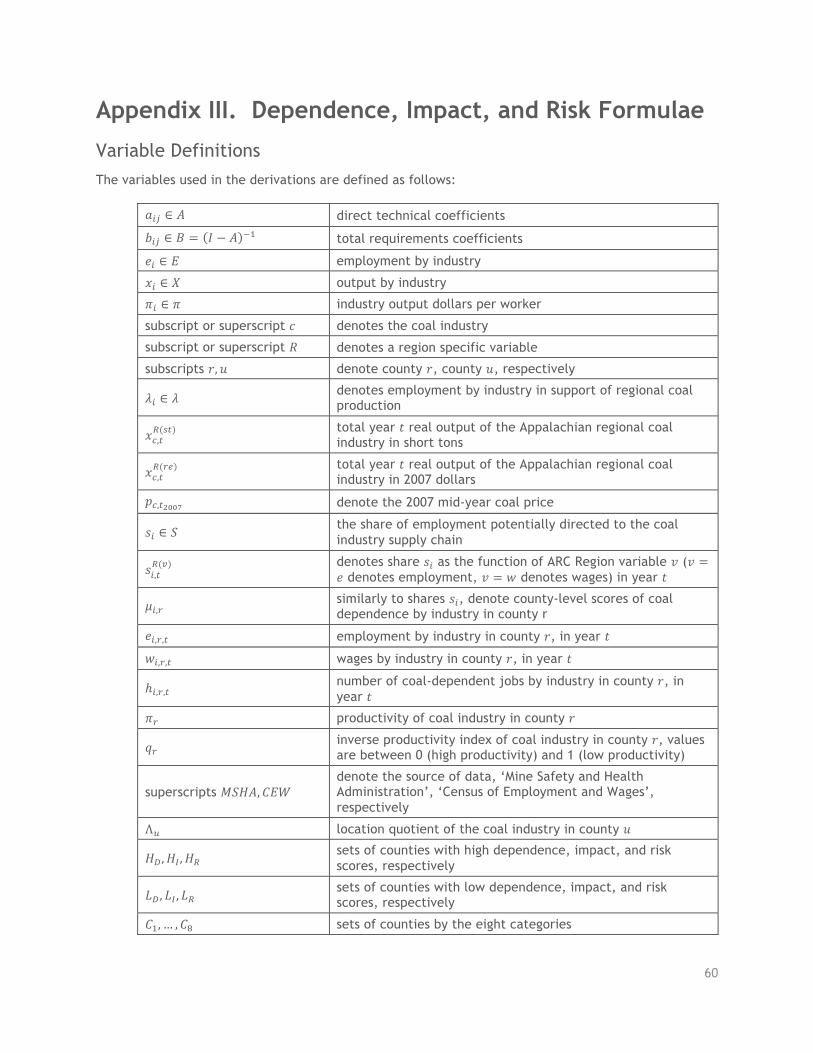
60
Appendix III. Dependence, Impact, and Risk Formulae
Variable Definitions The variables used in the derivations are defined as follows:
𝑎"# ∈ 𝐴 direct technical coefficients
𝑏"# ∈ 𝐵 = 𝐼 − 𝐴 +, total requirements coefficients
𝑒" ∈ 𝐸 employment by industry
𝑥" ∈ 𝑋 output by industry
𝜋" ∈ 𝜋 industry output dollars per worker
subscript or superscript 𝑐 denotes the coal industry
subscript or superscript 𝑅 denotes a region specific variable
subscripts 𝑟, 𝑢 denote county 𝑟, county 𝑢, respectively
𝜆" ∈ 𝜆 denotes employment by industry in support of regional coal production
𝑥8,9:(<9)
total year 𝑡 real output of the Appalachian regional coal industry in short tons
𝑥8,9:(?@)
total year 𝑡 real output of the Appalachian regional coal industry in 2007 dollars
𝑝8,9BCCD denote the 2007 mid-year coal price
𝑠" ∈ 𝑆 the share of employment potentially directed to the coal industry supply chain
𝑠",9:(G)
denotes share 𝑠" as the function of ARC Region variable 𝑣 (𝑣 =𝑒 denotes employment, 𝑣 = 𝑤 denotes wages) in year 𝑡
𝜇",? similarly to shares 𝑠", denote county-level scores of coal dependence by industry in county r
𝑒",?,9 employment by industry in county 𝑟, in year 𝑡
𝑤",?,9 wages by industry in county 𝑟, in year 𝑡
ℎ",?,9 number of coal-dependent jobs by industry in county 𝑟, in year 𝑡
𝜋? productivity of coal industry in county 𝑟
𝑞? inverse productivity index of coal industry in county 𝑟, values are between 0 (high productivity) and 1 (low productivity)
superscripts 𝑀𝑆𝐻𝐴, 𝐶𝐸𝑊 denote the source of data, ‘Mine Safety and Health Administration’, ‘Census of Employment and Wages’, respectively
ΛR location quotient of the coal industry in county 𝑢
𝐻S, 𝐻T, 𝐻: sets of counties with high dependence, impact, and risk scores, respectively
𝐿S, 𝐿T, 𝐿: sets of counties with low dependence, impact, and risk scores, respectively
𝐶,, … , 𝐶W sets of counties by the eight categories
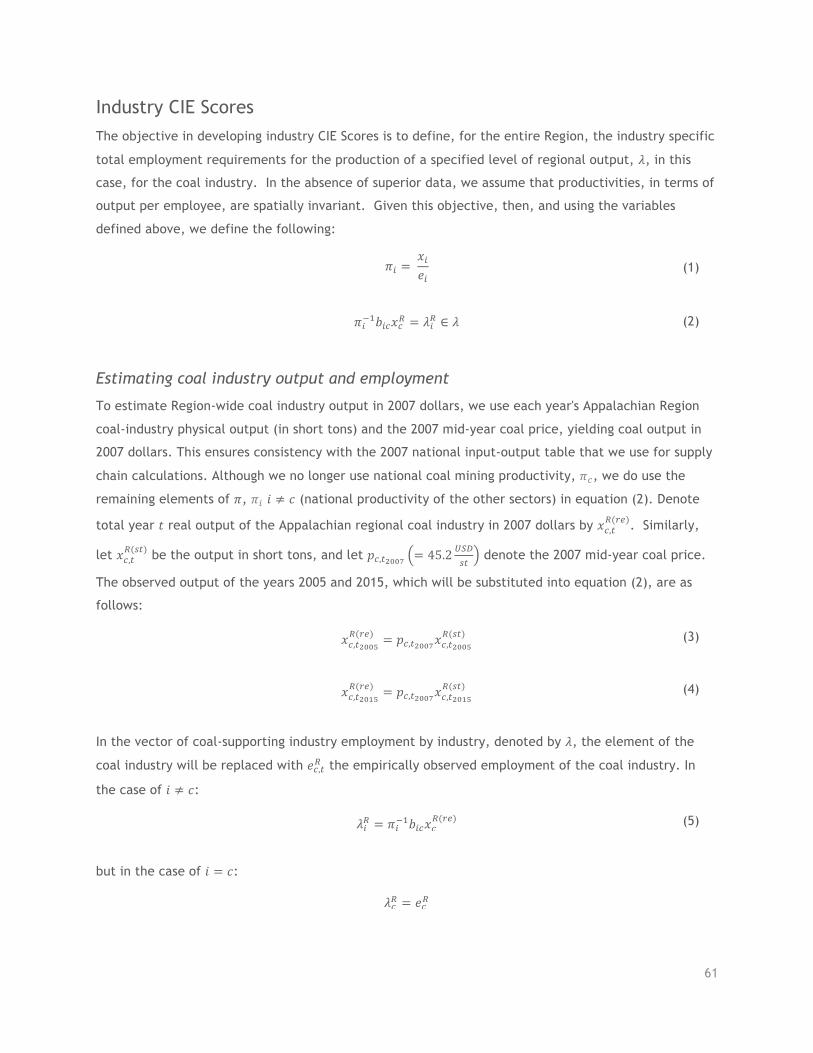
61
Industry CIE Scores The objective in developing industry CIE Scores is to define, for the entire Region, the industry specific
total employment requirements for the production of a specified level of regional output, 𝜆, in this
case, for the coal industry. In the absence of superior data, we assume that productivities, in terms of
output per employee, are spatially invariant. Given this objective, then, and using the variables
defined above, we define the following:
𝜋" = 𝑥"𝑒"
(1)
𝜋"+,𝑏"8𝑥8: = 𝜆": ∈ 𝜆 (2)
Estimating coal industry output and employment
To estimate Region-wide coal industry output in 2007 dollars, we use each year's Appalachian Region
coal-industry physical output (in short tons) and the 2007 mid-year coal price, yielding coal output in
2007 dollars. This ensures consistency with the 2007 national input-output table that we use for supply
chain calculations. Although we no longer use national coal mining productivity, 𝜋8, we do use the
remaining elements of 𝜋, 𝜋" 𝑖 ≠ 𝑐 (national productivity of the other sectors) in equation (2). Denote
total year 𝑡 real output of the Appalachian regional coal industry in 2007 dollars by 𝑥8,9:(?@). Similarly,
let 𝑥8,9:(<9) be the output in short tons, and let 𝑝8,9BCCD = 45.2 _`S
<9 denote the 2007 mid-year coal price.
The observed output of the years 2005 and 2015, which will be substituted into equation (2), are as
follows:
𝑥8,9BCCa:(?@) = 𝑝8,9BCCD𝑥8,9BCCa
:(<9) (3)
𝑥8,9BCba:(?@) = 𝑝8,9BCCD𝑥8,9BCba
:(<9) (4)
In the vector of coal-supporting industry employment by industry, denoted by 𝜆, the element of the
coal industry will be replaced with 𝑒8,9: the empirically observed employment of the coal industry. In
the case of 𝑖 ≠ 𝑐:
𝜆": = 𝜋"+,𝑏"8𝑥8:(?@) (5)
but in the case of 𝑖 = 𝑐:
𝜆8: = 𝑒8:
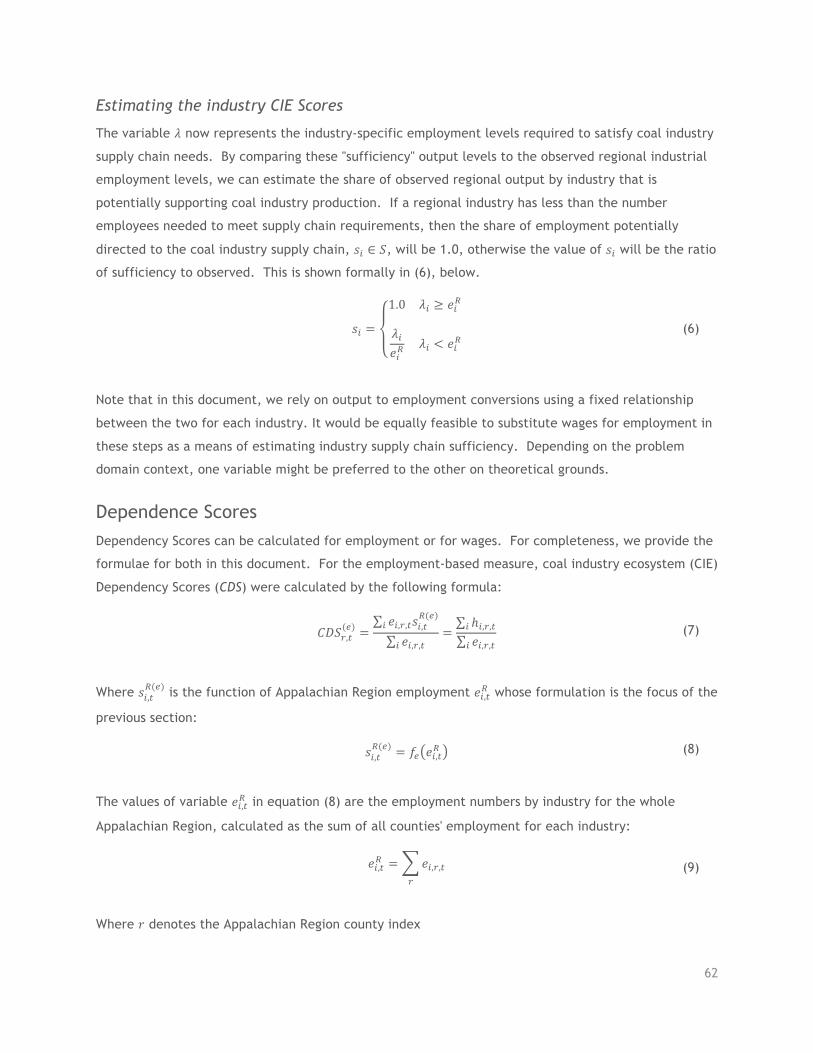
62
Estimating the industry CIE Scores
The variable 𝜆 now represents the industry-specific employment levels required to satisfy coal industry
supply chain needs. By comparing these "sufficiency" output levels to the observed regional industrial
employment levels, we can estimate the share of observed regional output by industry that is
potentially supporting coal industry production. If a regional industry has less than the number
employees needed to meet supply chain requirements, then the share of employment potentially
directed to the coal industry supply chain, 𝑠" ∈ 𝑆, will be 1.0, otherwise the value of 𝑠" will be the ratio
of sufficiency to observed. This is shown formally in (6), below.
𝑠" =
1.0 𝜆" ≥ 𝑒": 𝜆"𝑒":
𝜆" < 𝑒": (6)
Note that in this document, we rely on output to employment conversions using a fixed relationship
between the two for each industry. It would be equally feasible to substitute wages for employment in
these steps as a means of estimating industry supply chain sufficiency. Depending on the problem
domain context, one variable might be preferred to the other on theoretical grounds.
Dependence Scores Dependency Scores can be calculated for employment or for wages. For completeness, we provide the
formulae for both in this document. For the employment-based measure, coal industry ecosystem (CIE)
Dependency Scores (CDS) were calculated by the following formula:
𝐶𝐷𝑆?,9
(@) =𝑒",?,9𝑠",9
:(@)"
𝑒",?,9"=
ℎ",?,9"
𝑒",?,9" (7)
Where 𝑠",9:(@) is the function of Appalachian Region employment 𝑒",9: whose formulation is the focus of the
previous section:
𝑠",9:(@) = 𝑓@ 𝑒",9: (8)
The values of variable 𝑒",9: in equation (8) are the employment numbers by industry for the whole
Appalachian Region, calculated as the sum of all counties' employment for each industry:
𝑒",9: = 𝑒",?,9?
(9)
Where 𝑟 denotes the Appalachian Region county index
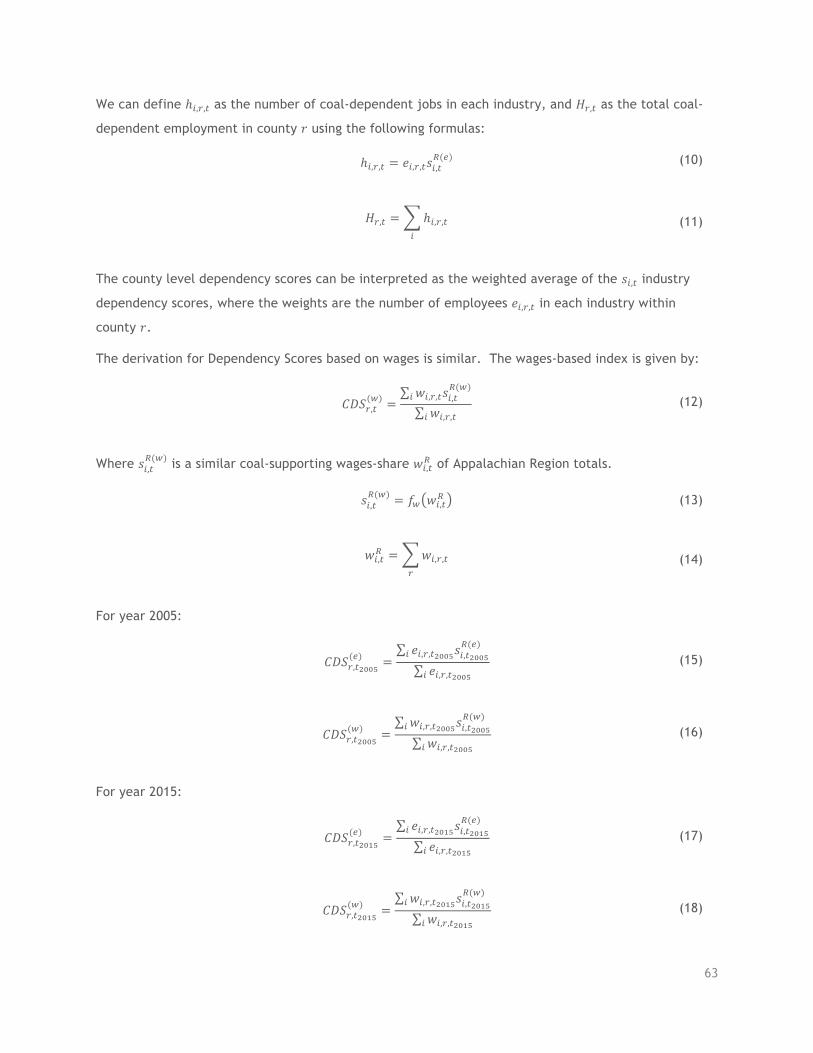
63
We can define ℎ",?,9 as the number of coal-dependent jobs in each industry, and 𝐻?,9 as the total coal-
dependent employment in county 𝑟 using the following formulas:
ℎ",?,9 = 𝑒",?,9𝑠",9:(@) (10)
𝐻?,9 = ℎ",?,9"
(11)
The county level dependency scores can be interpreted as the weighted average of the 𝑠",9 industry
dependency scores, where the weights are the number of employees 𝑒",?,9 in each industry within
county 𝑟.
The derivation for Dependency Scores based on wages is similar. The wages-based index is given by:
𝐶𝐷𝑆?,9
(i) =𝑤",?,9𝑠",9
:(i)"
𝑤",?,9" (12)
Where 𝑠",9:(i) is a similar coal-supporting wages-share 𝑤",9: of Appalachian Region totals.
𝑠",9:(i) = 𝑓i 𝑤",9: (13)
𝑤",9: = 𝑤",?,9?
(14)
For year 2005:
𝐶𝐷𝑆?,9BCCa
(@) =𝑒",?,9BCCa𝑠",9BCCa
:(@)"
𝑒",?,9BCCa" (15)
𝐶𝐷𝑆?,9BCCa
(i) =𝑤",?,9BCCa𝑠",9BCCa
:(i)"
𝑤",?,9BCCa" (16)
For year 2015:
𝐶𝐷𝑆?,9BCba
(@) =𝑒",?,9BCba𝑠",9BCba
:(@)"
𝑒",?,9BCba" (17)
𝐶𝐷𝑆?,9BCba
(i) =𝑤",?,9BCba𝑠",9BCba
:(i)"
𝑤",?,9BCba" (18)
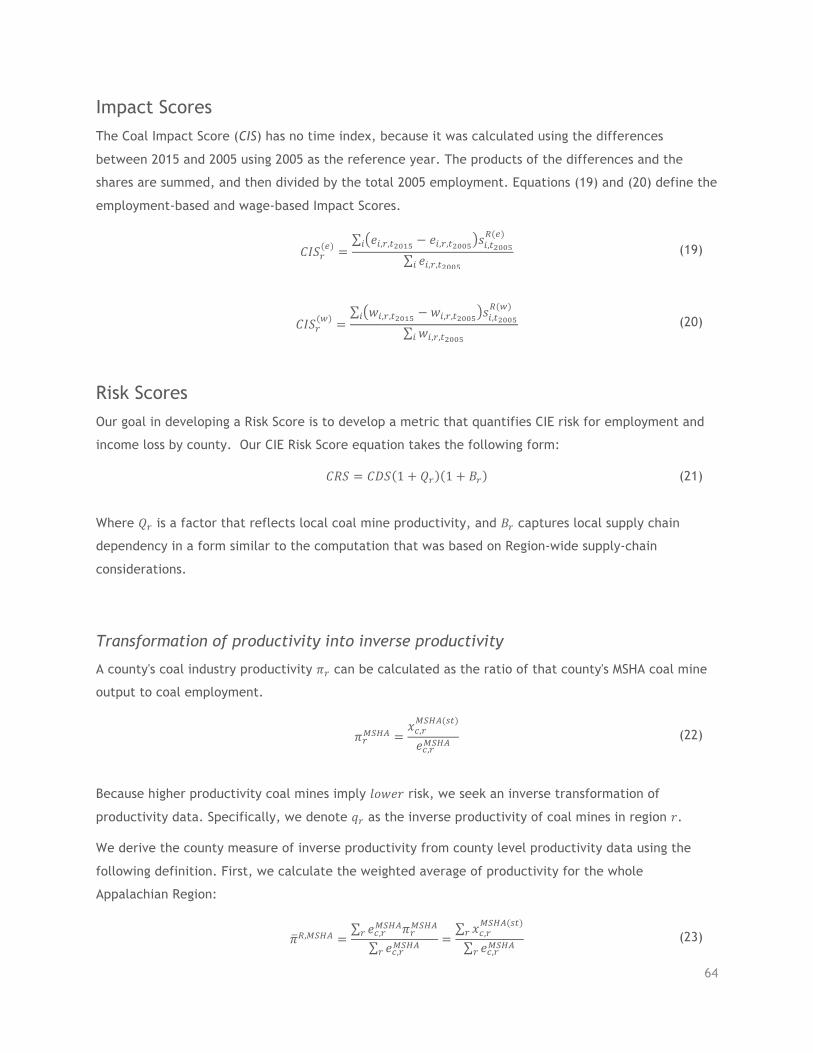
64
Impact Scores The Coal Impact Score (CIS) has no time index, because it was calculated using the differences
between 2015 and 2005 using 2005 as the reference year. The products of the differences and the
shares are summed, and then divided by the total 2005 employment. Equations (19) and (20) define the
employment-based and wage-based Impact Scores.
𝐶𝐼𝑆?
(@) =𝑒",?,9BCba − 𝑒",?,9BCCa 𝑠",9BCCa
:(@)"
𝑒",?,9BCCa" (19)
𝐶𝐼𝑆?
(i) =𝑤",?,9BCba − 𝑤",?,9BCCa 𝑠",9BCCa
:(i)"
𝑤",?,9BCCa" (20)
Risk Scores Our goal in developing a Risk Score is to develop a metric that quantifies CIE risk for employment and
income loss by county. Our CIE Risk Score equation takes the following form:
𝐶𝑅𝑆 = 𝐶𝐷𝑆 1 + 𝑄? 1 + 𝐵? (21)
Where 𝑄? is a factor that reflects local coal mine productivity, and 𝐵? captures local supply chain
dependency in a form similar to the computation that was based on Region-wide supply-chain
considerations.
Transformation of productivity into inverse productivity
A county's coal industry productivity 𝜋? can be calculated as the ratio of that county's MSHA coal mine
output to coal employment.
𝜋?l`mn =
𝑥8,?l`mn(<9)
𝑒8,?l`mn (22)
Because higher productivity coal mines imply 𝑙𝑜𝑤𝑒𝑟 risk, we seek an inverse transformation of
productivity data. Specifically, we denote 𝑞? as the inverse productivity of coal mines in region 𝑟.
We derive the county measure of inverse productivity from county level productivity data using the
following definition. First, we calculate the weighted average of productivity for the whole
Appalachian Region:
𝜋:,l`mn =
𝑒8,?l`mn𝜋?l`mn?
𝑒8,?l`mn?=
𝑥8,?l`mn(<9)
?
𝑒8,?l`mn? (23)
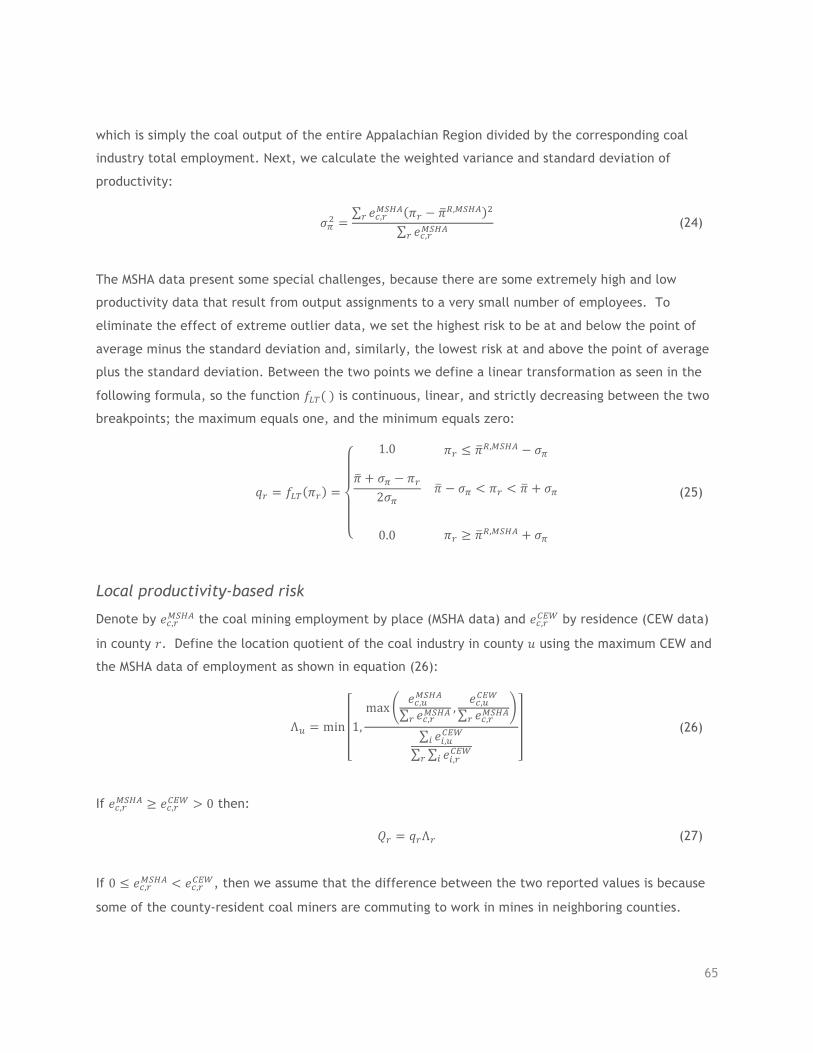
65
which is simply the coal output of the entire Appalachian Region divided by the corresponding coal
industry total employment. Next, we calculate the weighted variance and standard deviation of
productivity:
𝜎rs =
𝑒8,?l`mn 𝜋? − 𝜋:,l`mn s?
𝑒8,?l`mn? (24)
The MSHA data present some special challenges, because there are some extremely high and low
productivity data that result from output assignments to a very small number of employees. To
eliminate the effect of extreme outlier data, we set the highest risk to be at and below the point of
average minus the standard deviation and, similarly, the lowest risk at and above the point of average
plus the standard deviation. Between the two points we define a linear transformation as seen in the
following formula, so the function 𝑓tu() is continuous, linear, and strictly decreasing between the two
breakpoints; the maximum equals one, and the minimum equals zero:
𝑞? = 𝑓tu 𝜋? =
1.0
𝜋? ≤ 𝜋:,l`mn − 𝜎r
𝜋 + 𝜎r − 𝜋?2𝜎r
𝜋 − 𝜎r < 𝜋? < 𝜋 + 𝜎r0.0
𝜋? ≥ 𝜋:,l`mn + 𝜎r
(25)
Local productivity-based risk
Denote by 𝑒8,?l`mn the coal mining employment by place (MSHA data) and 𝑒8,?wxy by residence (CEW data)
in county 𝑟. Define the location quotient of the coal industry in county 𝑢 using the maximum CEW and
the MSHA data of employment as shown in equation (26):
ΛR = min 1,max
𝑒8,Rl`mn𝑒8,?l`mn?
,𝑒8,Rwxy𝑒8,?l`mn?
𝑒",Rwxy"
𝑒",?wxy"?
(26)
If 𝑒8,?l`mn ≥ 𝑒8,?wxy > 0 then:
𝑄? = 𝑞?Λ? (27)
If 0 ≤ 𝑒8,?l`mn < 𝑒8,?wxy, then we assume that the difference between the two reported values is because
some of the county-resident coal miners are commuting to work in mines in neighboring counties.
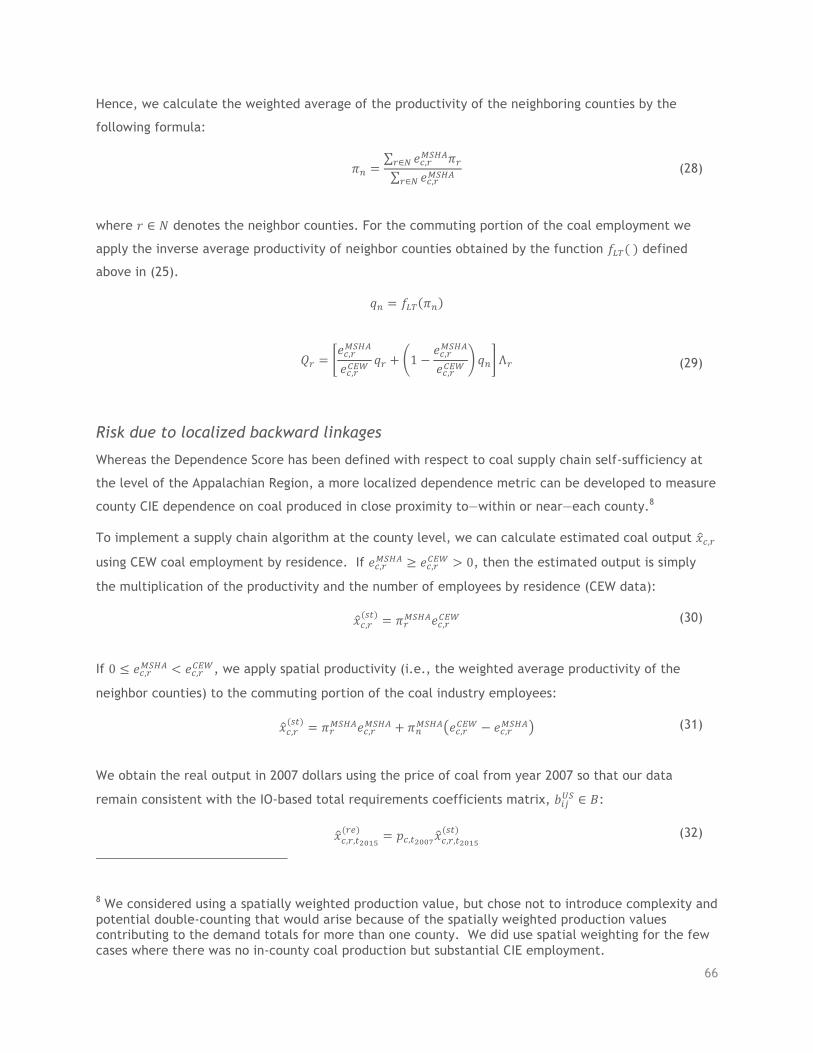
66
Hence, we calculate the weighted average of the productivity of the neighboring counties by the
following formula:
𝜋� =
𝑒8,?l`mn𝜋??∈�
𝑒8,?l`mn?∈� (28)
where 𝑟 ∈ 𝑁 denotes the neighbor counties. For the commuting portion of the coal employment we
apply the inverse average productivity of neighbor counties obtained by the function 𝑓tu() defined
above in (25).
𝑞� = 𝑓tu 𝜋�
𝑄? =
𝑒8,?l`mn
𝑒8,?wxy𝑞? + 1 −
𝑒8,?l`mn
𝑒8,?wxy𝑞� Λ? (29)
Risk due to localized backward linkages
Whereas the Dependence Score has been defined with respect to coal supply chain self-sufficiency at
the level of the Appalachian Region, a more localized dependence metric can be developed to measure
county CIE dependence on coal produced in close proximity to—within or near—each county.8
To implement a supply chain algorithm at the county level, we can calculate estimated coal output 𝑥8,?
using CEW coal employment by residence. If 𝑒8,?l`mn ≥ 𝑒8,?wxy > 0, then the estimated output is simply
the multiplication of the productivity and the number of employees by residence (CEW data):
𝑥8,?(<9) = 𝜋?l`mn𝑒8,?wxy (30)
If 0 ≤ 𝑒8,?l`mn < 𝑒8,?wxy, we apply spatial productivity (i.e., the weighted average productivity of the
neighbor counties) to the commuting portion of the coal industry employees:
𝑥8,?(<9) = 𝜋?l`mn𝑒8,?l`mn + 𝜋�l`mn 𝑒8,?wxy − 𝑒8,?l`mn (31)
We obtain the real output in 2007 dollars using the price of coal from year 2007 so that our data
remain consistent with the IO-based total requirements coefficients matrix, 𝑏"#_` ∈ 𝐵:
𝑥8,?,9BCba(?@) = 𝑝8,9BCCD𝑥8,?,9BCba
(<9) (32)
8 We considered using a spatially weighted production value, but chose not to introduce complexity and potential double-counting that would arise because of the spatially weighted production values contributing to the demand totals for more than one county. We did use spatial weighting for the few cases where there was no in-county coal production but substantial CIE employment.
67
As in the ARC level supply chain analysis, we can create variable 𝜆",?, which represents the industry
specific employment levels required to satisfy the county level coal industry needs. In the equation
(33), the notation 𝑥"→8,? represents the output level required in industry 𝑖 to satisfy the coal industry
needs.
𝜆",? =
1𝜋"_`
𝑏"8_`𝑥8,?(?@) =
𝑒"_`
𝑥"_`𝑥"→8,? = 𝑒"→8,? (33)
In equation (33), 𝑒"→8,? and 𝜆",? are the same thing. The notation 𝑒"→8 illustrates the employment level
required in industry 𝑖 to satisfy the coal industry needs. Again as in the computation of Appalachian
Region-level shares 𝑠":, we define the county level shares 𝜇",? (Note: 𝜇 = 1𝑖𝑓𝜆 ≥ 𝑒):
𝜇",? =𝜆",?𝑒",?wxy
=𝑒"→8,?𝑒",?wxy
(34)
Unlike the 𝑠":, the industry 𝜇",? scores are different in each county. The county level aggregated score
𝑀? can be defined as the weighted average of these industry scores, where the weights come from CEW
data excluding the coal mining sector:
𝑀? =
𝑒",?wxy𝜇",?"�8
𝑒",?wxy"�8
(35)
Finally, we can calculate the supply chain linkages factor 𝐵? as a product of the average industry scores
𝑀? and the inverse productivity 𝑞? of the county. If 𝑒8,?l`mn ≥ 𝑒8,?wxy > 0 then:
𝐵? = 𝑞?𝑀? (36)
If 0 ≤ 𝑒8,?l`mn < 𝑒8,?wxy, then we use the inverse spatial productivity (i.e., we apply the inverse
transformation of the weighted average productivity of the neighbor counties). The final inverse
productivity of the county is the weighted average of the inverse spatial productivity and the inverse
productivity of the county itself:
𝐵? =
𝑒8,?l`mn
𝑒8,?wxy𝑞? + 1 −
𝑒8,?l`mn
𝑒8,?wxy𝑞� 𝑀?
(37)
Now we have 𝑄? and 𝐵? factors to substitute into the original 1 + ⋯ form to obtain the county level
coal risk scores (CRS):
𝐶𝑅𝑆 = 𝐶𝐷𝑆 1 + 𝑄? 1 + 𝐵? = 𝐶𝐷𝑆 1 + 𝑄? + 𝐵? + 𝑄?𝐵? (38)
68
Defining categories by median Combining the three coal scores (CDS = Coal Dependency Score, CIS = Coal Impact Score, CRS = Coal
Risk Score), we can create eight categories of the counties. Denote 𝐶𝐷𝑆� the median of the Coal
Dependency Scores, 𝐶𝐼𝑆� the median of the Coal Impact Scores, 𝐶𝑅𝑆� the median of the Coal Risk
Scores. The set of the counties were defined as the following:
𝐻S = 𝑟 ∶ 𝐶𝐷𝑆? ≥ 𝐶𝐷𝑆�
𝐻T = 𝑟 ∶ 𝐶𝐼𝑆? ≤ 𝐶𝐼𝑆�
𝐻: = 𝑟 ∶ 𝐶𝑅𝑆? ≥ 𝐶𝑅𝑆�
𝐿S = 𝑟 ∶ 𝐶𝐷𝑆? < 𝐶𝐷𝑆�
𝐿T = 𝑟 ∶ 𝐶𝐼𝑆? > 𝐶𝐼𝑆�
𝐿: = 𝑟 ∶ 𝐶𝑅𝑆? < 𝐶𝑅𝑆�
The variations of the six sets above produce 2� = 8 eight categories 𝐶,, … , 𝐶W of the counties:
𝐶, = 𝐻S ∩ 𝐻T ∩ 𝐻:
𝐶s = 𝐻S ∩ 𝐻T ∩ 𝐿:
𝐶� = 𝐻S ∩ 𝐿T ∩ 𝐻:
𝐶� = 𝐿S ∩ 𝐻T ∩ 𝐻:
𝐶� = 𝐻S ∩ 𝐿T ∩ 𝐿:
𝐶� = 𝐿S ∩ 𝐻T ∩ 𝐿:
𝐶� = 𝐿S ∩ 𝐿T ∩ 𝐻:
𝐶W = 𝐿S ∩ 𝐿T ∩ 𝐿: