Embed Size (px)
Citation preview
THE APPLICATION OF MICRO-DIFFERENTIAL SCANNING CALORIMETER IN
CHARACTERISING HYDRATE DISPERSION STABILITY AND WAX
APPEARANCE
By
MOHD ZAKI BIN ZAINAL ABIDIN
B.Eng. (Hons) Chemical, MSc. Chemical Engineering
This thesis is presented for the degree of Doctor of Philosophy of
The University of Western Australia
Fluid Science and Resources Division
School of Mechanical and Chemical Engineering
2019

ii
THESIS DECLARATION
I, Mohd Zaki Bin Zainal Abidin, certify that:
This thesis has been substantially accomplished during enrolment in the degree.
This thesis does not contain material which has been submitted for the award of any other degree or diploma in my name, in any university or other tertiary institution.
No part of this work will, in the future, be used in a submission in my name, for any other degree or diploma in any university or other tertiary institution without the prior approval of The University of Western Australia and where applicable, any partner institution responsible for the joint-award of this degree.
This thesis does not contain any material previously published or written by another person, except where due reference has been made in the text and, where relevant, in the Declaration that follows.
The work(s) are not in any way a violation or infringement of any copyright, trademark, patent, or other rights whatsoever of any person.
Technical assistance was kindly provided by David Zhu and Kwanghee Jeong for assisting me on several laboratory works and writing part of the manuscript that is described in Chapter 4 and 5.
This thesis contains published work and/or work prepared for publication, some of which has been co-authored.
Signature:
Date: 30/4/2019

vii
ABSTRACT
Flow assurance is one of major engineering concerns in the petroleum industry,
as it ensures the safe and reliable transmission of reservoir fluids. As exploration
activities are expanding further into deep subsea environment, fluids require transport
through longer pipelines that are exposed to cold sea water, which increases the
potential of hydrate and wax formation and blockage. Under deepwater conditions,
current thermodynamic inhibition methods might not be viable due to their expense;
laboratory measurements offer fundamental insight as to the potential and severity of
antagonistic solids. Differential scanning calorimetry (DSC) has been deployed in the
laboratory to analyze several flow assurance concerns, which is advantageous due to
the small sample volume and rapid scanning rate. However, the reliability of DSC
compared to other analytical methods, and its limitation for detecting trace content, has
not been rigorously established in the flow assurance community.
This research work aims to adopt DSC as a reliable method for analysing hydrate
and wax formation. The effectiveness and limitations of micro-differential scanning
calorimetry (µDSC) were studied across three flow assurance dimensions: (1) analysing
hydrate dispersion stability, particularly in the presence of under-dosed hydrate
inhibitors (e.g. monoethylene glycol or MEG) and with the addition of low-dosage
hydrate inhibitors; (2) assessing wax precipitation in the presence of hydrate inhibitors;
and (3) analysing cloud point in low-wax content condensate samples.
The first set of experiments highlights DSC as an alternative method in analysing
stability of hydrate dispersion from agglomerates, by evaluating the performance of
anti-agglomerants (AA) in the presence of free water of under-inhibited MEG. µDSC was
adopted to analyze hydrate dispersion stability from the gradual change of hydrate
dissociation under cyclical procedure of hydrate formation and dissociation. Results
generated indicated surfactant-like properties at MEG fractions of 1 to 5 wt%, with
improvement in dispersion stability, while dispersion stability was reduced between 5
and 15 wt% MEG. Combining AA with under-inhibited MEG indicated potential
synergistic improvement, subjected to the free water produced at different under-
inhibited MEG concentration and the use of a strong ionic surfactants.

viii
The second set of experiments shows the capability of µDSC for evaluating minor
changes in hydrocarbon cloud point, particularly in the limit that the injected MEG
solution forms a separate aqueous phase. This study was carried out by analysing change
of cloud point in homogenized samples of paraffinic binary mixtures and MEG solutions
from a thermogram generated in µDSC. The results showed an increment of 0.5% in
cloud point was recorded in a binary mixture of octadecane (C18) in toluene at 80 wt%
MEG, where an additional increase of 0.35% was recorded at higher water cut (80%).
Additionally, the change in cloud point was only identified at a octadecane:toluene
molar ratio of 60:40 mol% under the same MEG concentration and watercut; the
enhanced hydrogen bond capacity of toluene may be responsible for the observed
increase in cloud point.
The third set of experiments studies the reliability of adopting µDSC for
evaluating cloud point for ultra-low wax content systems, such as might be encountered
in gas-condensate reservoirs; results were compared to temperature-controlled Raman
spectroscopy (RS) measurements. A set of three low wax content samples, with the
lowest content of 0.1 wt%, was analyzed by comparing the measurement of cloud point
in crystallization and melting stage at µDSC and RS. Comparison between measured and
equation of state (EOS)-predicted cloud point indicated large temperature deviation for
at least 15 K, suggesting the need for additional data of cloud point for low-content
systems that could be used to tune wax precipitation models. The deviation between
both experimental cloud point measurements was minor.

ix
ACKNOWLEDGEMENTS
Firstly, all praise to Almighty God who granted me an opportunity to learn and seek His
Knowledge in this journey. I guess without His grant and mercy, I would not be able to
reach the end of this study. The journey has given me to explore and appreciate the
wonder of science and technology through the eyes and minds of a decent person like
me. The three-and-half years of journey that I have gone through is not a rosy kind of
journey, there are up and down moments, but it is a good decision that I made in my
life. It is my utmost gratitude that this work presented will be benefitted to everyone;
not only for the industry itself but rather to the development of humankind.
I would like to extend my appreciation to my sponsors, Ministry of Higher Education,
Malaysia and MARA University of Technology, Malaysia (UiTM) for providing me a fund
to pursue my study in UWA. I would like to acknowledge my parents, Mr. Zainal Abidin
Surif and Madam Mariam Mohd Yazam, who are relentlessly supporting me throughout
my study. They always remind me about the importance of knowledge and being
humble, no matter how far I have gone and achieved in my life. Without their blessings,
I guess this is rather an impossible task to be done.
Secondly, I would like to thank my supervisors: Zach, Eric, Mike, and Prof Xia Lou, for
their advice and support and advice given during my study. I really learn a lot of things,
be in technical stuff and most importantly humanity aspects of life: discipline, high
integrity, focus and most importantly enjoy and appreciate science through our
research’s achievements.
I would like to give full credits to my lab mates: Tom, Shane, Kwanghee, Vincent, Temi,
Yahua, Xiong and others, my FYP friend: David Zhu and other research fellows: Jianwei,
Tom Hughes, Peter Metaxas, Mossayeb, and others. I could not repay your help,
guidance and support that you have given to me throughout this journey.
This thesis is not merely for fulfilling the academic requirement; rather I hope you enjoy
it will be used as a scientific reference which would give benefit to the industry, and
most importantly to the betterment of society.

x
“God will exalt those who believe among you and those who
have been granted knowledge to high ranks.”
(Qur’an 58:11)

xi
AUTHORSHIP DECLARATION
By the University of Western Australia’s regulations regarding Research Higher Degrees,
this thesis is presented as a series of draft manuscripts. The contribution of the
candidate and co-author(s) for the draft manuscripts are hereby set forth and presented
in this thesis under chapter 3, 4 and 5.
Chapter 3
The manuscript presented in Chapter 3 is first-authored by the candidate and co-
authored by Associate Professor Dr. Zachary M. Aman, Professor Xia Lou, Winthrop
Professor Eric F. May and Winthrop Professor Michael L. Johns, and was presented at
the 5th International Conference of Oil and Gas Engineering and Technology (ICOGET
2018), Kuala Lumpur, Malaysia 12-14 August 2018. The manuscript was intended not to
be published under the publication of the conference.
The candidate planned and carried out the experimental programme this paper
is based on under the supervision of Associate Professor Dr. Zachary M. Aman Winthrop
Professor Eric F. May and Winthrop Professor Michael L. Johns. The candidate analyzed
the experimental results and wrote the paper under the supervision of Associate
Professor Dr. Zachary M. Aman and Professor Xia Lou.
Chapter 4
The manuscript presented in Chapter 4 is first-authored by the candidate and co-
authored by David Zhu, Associate Professor Dr. Zachary M. Aman, Winthrop Professor
Eric F. May and Winthrop Professor Michael L. Johns. This paper is a draft manuscript
which will be published in any suitable journal related to this study.
The experimental programme was planned by the candidate, and it was carried
out by both the candidate and David Zhu, under the supervision of Associate Professor
Dr. Zachary M. Aman. The analysis of this experimental work was done by the candidate
and David Zhu. As for the contribution in the manuscript, the paper was written by the
candidate and David Zhu (by proofreading and checking the content of the paper).
The experimental programme and analysis were presented at the International
Conference of Green and Sustainable Environment (ICGSE 2018) at Kuala Lumpur,

xii
Malaysia on 3rd-4th September 2018. The manuscript was intended not to be published
under the publication of the conference.
Chapter 5
The manuscript presented in Chapter 5 is first-authored by the candidate and co-
authored by Kwanghee Jeong, Associate Professor Dr. Zachary M. Aman, Winthrop
Professor Eric F. May, and Winthrop Professor Michael L. Johns. The paper has yet to be
published and intended to be published in a suitable journal.
The experimental work was planned and carried out by the candidate and Kwanghee
Jeong under the supervision of Associate Professor Dr. Zachary M. Aman and Winthrop
Professor Eric F. May. It comprised two different measurements of cloud point: the
candidate conducted experimental work using micro differential scanning calorimeter
while Kwanghee Jeong conducted an experiment using Raman Spectroscopy. The
analysis of experimental work was carried out by both the candidate and Kwanghee
Jeong.
As for the manuscript, the paper was written by the candidate as the first author and
Kwanghee Jeong contributed to the explanation of Raman Spectroscopy, specifically in
its experimental procedure and results.

xiii
The following are the summary of authorship and signatures from each co-authors :
Details of the work:
Synergistic Hydrate Inhibition with Monoethylene Glycol and Anti-Agglomerants
Location in thesis: Chapter 3
Student contribution to work: Laboratory work and analysis (100%) Writing up manuscript (100%)
Co-author signatures and dates:
Prof Xia Lou Eric F. May Michael L. Johns Zachary M. Aman Date: 2/5/19 Date: 30/4/19 Date: 30/4/19 Date: 30/4/19
Details of the work: Effect of MEG on paraffinic cloud point
Location in thesis: Chapter 4
Student contribution to work: Laboratory work (60%) Writing up the manuscript (70%)
Co-author signatures and dates:
David Zhu Prof Xia Lou Eric F. May Michael L. Johns Date: 30/4/19 Date: 2/5/19 Date: 30/4/19 Date: 30/4/19
Zachary M. Aman Date: 30/4/19

xiv
Details of the work: Characterizing low wax content systems using DSC and spectroscopic methods Location in thesis: Chapter 5 Student contribution to work: Laboratory work (50%) Writing up the manuscript (60%) Co-author signatures and dates:
Kwanghee Jeong Prof Xia Lou Eric F. May Michael L. Johns
Date:30/4/19 Date: Date: 30/4/19 Date: 30/4/19
Zachary M. Aman Date: 30/4/19
Student signature: Date: 30/4/2019
I, Zachary M. Aman, certify that the student statements regarding their contribution to each of the works listed above are correct
Coordinating supervisor signature: Date: 30/4/19

xv
TABLE OF CONTENTS
ABSTRACT ..................................................................................................................................... vii
ACKNOWLEDGEMENTS ................................................................................................................. ix
AUTHORSHIP DECLARATION ......................................................................................................... xi
LIST OF ABBREVIATIONS AND NOMENCLATURE ....................................................................... xvii
CHAPTER 1: INTRODUCTION ......................................................................................................... 1
1.1 Overview of flow assurance and challenges to the field .................................................... 1
1.2 Hydrate plugging in flow assurance .................................................................................... 3
1.3 Wax precipitation in flow assurance ................................................................................. 10
1.4 Challenges in deep water production ............................................................................... 13
1.5 Calorimetric assessment of hydrate formation ................................................................ 17
1.6 Calorimetric analysis of wax precipitation ........................................................................ 18
1.7 Research aims and outlines of thesis ................................................................................ 21
CHAPTER 2: METHODOLOGY AND EXPERIMENTAL SETUP ......................................................... 24
2.1 Basis of Calorimetric Investigation .................................................................................... 24
2.2 Experimental setup ........................................................................................................... 27
2.3 µDSC calibration with reference materials and paraffins ................................................. 30
2.4 Chapter Summary ............................................................................................................. 33
CHAPTER 3: SYNERGISTIC HYDRATE INHIBITION WITH MONOETHYLENE GLYCOL AND ANTI-
AGGLOMERANTS ......................................................................................................................... 34
3.1 Introduction ...................................................................................................................... 34
3.2 Material and methods ...................................................................................................... 36
3.2.1 Materials .................................................................................................................... 36
3.2.2 Emulsion Preparation ................................................................................................. 37
3.2.3 µDSC experimental design ......................................................................................... 38
3.2.5 Analysing hydrate dispersion stability in µDSC .......................................................... 38
3.3 Results and Discussion ...................................................................................................... 43
3.3.1 Base case hydrate dispersion stability for blended crude oils ................................... 43
3.3.2 Dispersion stability with under-inhibited MEG .......................................................... 45
3.3.3 Dispersion stability with AAs ...................................................................................... 46
3.3.4 Synergistic inhibition with AA and under-dosed MEG ............................................... 47
3.3.5 Initial size of water droplet in a water-in-oil emulsion .............................................. 49
3.3.6 Mechanism of hydrate dispersion stability ................................................................ 56
3.4 Chapter Summary ............................................................................................................. 59
CHAPTER 4: EFFECT OF MEG ON PARAFFINIC CLOUD POINT ..................................................... 61
4.1 Introduction ...................................................................................................................... 61
4.2 Materials and method ...................................................................................................... 63

xvi
4.2.1 Materials .................................................................................................................... 63
4.2.2 Homogenization procedures for immiscible mixtures ............................................... 64
4.2.3 Experimental setup and method for determining cloud point from a thermogram
generated in µDSC .............................................................................................................. 64
4.2.4 Experimental workflow .............................................................................................. 67
4.3 Results and Discussion ...................................................................................................... 69
4.3.1 Selection of materials ................................................................................................ 69
4.3.2 Verifying cloud points of binary mixtures .................................................................. 70
4.3.3 Effect of MEG and water content on WAT and WDT ................................................. 71
4.3.4 WDT variation with MEG and hydrocarbon content ................................................. 74
4.3.5 Effect of solvent aromaticity ...................................................................................... 76
4.3.6 Effect of hydrocarbon composition on WAT and WDT .............................................. 79
4.4 Chapter Summary ............................................................................................................. 80
CHAPTER 5: CHARACTERIZING LOW WAX CONTENT SYSTEMS USING DSC AND SPECTROSCOPIC
METHODS .................................................................................................................................... 82
5.1 Introduction ...................................................................................................................... 82
5.2 Wax detection with Raman spectroscopy ........................................................................ 84
5.3 Materials and method ...................................................................................................... 87
5.3.1 Materials and method for preparing a binary mixture .............................................. 87
5.3.2 Experimental procedure for µDSC ............................................................................. 88
5.3.3 Experimental procedure for Raman Spectroscopy .................................................... 88
5.3.3 Experimental workflow .............................................................................................. 90
5.4 Results and discussion ...................................................................................................... 91
5.4.1 DSC assessment of low wax content .......................................................................... 91
5.4.2 Raman assessment of low wax content ..................................................................... 93
5.4.3 Deviations between predicted and measured cloud points ...................................... 94
5.4.4 Deviations between µDSC and Raman methods ....................................................... 96
5.5 Chapter Summary ............................................................................................................. 98
CHAPTER 6: CONCLUSIONS AND RECOMMENDATIONS ............................................................. 99
6.1 Original contributions and main findings.......................................................................... 99
6.1.1 Deployment of µDSC to assess hydrate dispersion stability ...................................... 99
6.1.2 Assessing hydrocarbon cloud point via µDSC .......................................................... 100
6.1.3 Identifying cloud point in low wax content systems ............................................... 101
6.2 Recommendations .......................................................................................................... 102
REFERENCES .............................................................................................................................. 105
APPENDICES .............................................................................................................................. 119
xvii
LIST OF ABBREVIATIONS AND NOMENCLATURE List of Abbreviations
AA Anti-Agglomerants
APR Advanced Peng Robinson Equation of State
CMC Critical Micelle Concentration
CPC Centrylpyridium Chloride
CPM Cross-Polarized Microscope
CTAC Cetyltrimethylammonium Chloride
DSC Differential Scanning Calorimeter/Calorimetry
µDSC Micro-Differential Scanning Calorimeter
EOS Equation of State
IFT Interfacial Tension
KHI Kinetic Hydrate Inhibitors
LLE Liquid Equilibrium
MCDSC Multi-Cell Micro-Differential Scanning Calorimeter
MEG Monoethylene Glycol
MMF Micromechanical Force
NMR Nuclear Magnetic Resonance
PVCap poly(vinylcaprolactam)
PVP poly(vinylpyrrolidone)
QA Quaternary Ammonium
RS Raman Spectroscopy
RTD Resistance Temperature Detector
SLE Solid Liquid Equilibrium
TED Thermo-Electric Device
THI Thermodynamic Hydrate Inhibitor
UHP Ultra-High Purity
WAT Wax Appearance Temperature
WDT Wax Disappearance Temperature

xviii
List of Nomenclature
Al2O3 Aluminium Oxide
CO2 Carbon Dioxide
C-H Carbon-hydrogen bond
C6 n-hexane
C16 Hexadecane
C18 Octadecane
C20 Eicosane
C30 Triacontante
C36 Hexatriacontane
C6+C18 Binary mixture of hexane and octadecane
H2S Hydrogen Sulfide
Toluene+C18 Binary mixture of toluene and octadecane
Toluene+C30 Binary mixture of toluene and triacontane
Toluene+MEG+water Ternary mixture of toluene, MEG and water
C6+MEG+water Ternary mixture of hexane, MEG and water
L Distance from polymer chains
σ Surface energy (N/m)
η Viscosity (cP)
V Sedimentation velocity (m/s)
ρ Density (kg/m3)
g Gravitational acceleration (9.8 m/s2)
σt Tensile strength (N/m2)

xix
List of units
cP Centipoise
°C Degree Celsius
°C/min Degree Celsius per minute
FPS Frame Per Second
K Kelvin
kg kilogram
M Molecular mass in atomic mass unit (a.m.u)
mN/m Millinewton per meter
µm Micrometer
m3 Meter cubic
RPM Revolution Per Minute
T Tesla
wt% Weight percentage
vol% Volume percentage
psi Pounds per square inch

1
CHAPTER 1: INTRODUCTION
1.1 Overview of flow assurance and challenges to the field
The oil and gas industry requires a significant investment in its facilities, with a
typical offshore facility costing exceeds USD$1 billion with approximately one third the
total cost dedicated to the prevention and management of gas hydrate solids [1].
Particularly in an offshore and coastal areas, operating petroleum facilities is a
challenging activity since it requires transporting fluid in long pipelines within extreme
surrounding environment where the pipelines are positioned. Under such conditions,
the fluid needs to be transported reliably and safely, from a reservoir up to a processing
facility. Therefore, a new sub-discipline in engineering and science, known as flow
assurance, was introduced to focus on the reliability of transporting petroleum fluids
through tiebacks. The term “flow assurance” was first coined by Petrobras in 1995 [2]
from the Portuguese phrase “garantia do escoamento,” which translates to “guarantee
of flow.”
The key information required for designing and operating petroleum pipelines is
based on the composition and properties of a transported fluids. The hydrocarbon fluid
consists of a large diversity of components, which can simultaneously exist in multiple
phases; hydrocarbon compounds are generally classified as paraffinic, naphthenic,
aromatic or asphaltic [3]. Traces of non-hydrocarbon components can also be present,
including sulphur, oxygen and nitrogen compounds, as well as a trace amount of metallic
elements [4]. This associated natural gas present in an oil reservoir can be either
dissolved in the liquid phase and/or present as a separate phase, and typically consists
of methane, ethane, propane, butane, and other non-hydrocarbon gasses such as
carbon dioxide and hydrogen sulfide.
Apart from petroleum compounds, water extracted from a reservoir is also
produced during petroleum transportation. Depending on the nature of the reservoir
and production system, water can exist as an immiscible liquid phase that is co-produced
with liquid hydrocarbons (crude oil or condensate). The turbulent flow inside the
pipeline can form an emulsion of water in the liquid hydrocarbon, further stabilized by
naturally-occurring surfactants in the condensate or oil; asphaltenes, resins and

2
naphthenic acids act to promote the stability of water-in-oil emulsions [5]. Under static
pipeline conditions (e.g. shut down), fluids phases inside the pipeline can separate due
to density differences.
The characteristics of fluid transported depend on the operating parameters
inside pipelines. These parameters are affected by the surrounding environment and
the design of pipelines. Initially, the fluid that is extracted from a reservoir flows at high
pressure before it gradually experiences pressure reduction due to the friction of inner
pipeline walls and a long pipeline connection. Concurrently, high-temperature fluid
transported from a reservoir gradually losses its heat to the cold sea water surrounded
the pipelines. The fluid continuously experiences changes in its operating environment,
which indirectly affects the properties and transportability of the fluid inside the
pipelines. Therefore, it is crucial to consider optimum pipeline sizing and strategic
pipeline layout to ensure the fluid could be transported with minimum frictional losses.
Consideration of the potential disruption of flow contributed by solids formation
in the flow is also one of the crucial aspects in flow assurance. The deposition of solids
emerging from produced fluids (e.g. gas hydrates or waxes) can form restrictions on
pipeline walls, joints, valves, and processing equipment. Hydrate deposition is
considered to be the primary challenge for deepwater tiebacks, as hydrates grow rapidly
compared to other solid deposits [2]; wax, asphaltene, scale, biofouling, and
naphthenates can also result in pipeline occlusion, compounding the challenge
presented by hydrates [6]. Further, complex multiphase flow patterns can generate high
frictional pressure losses, including the formation of foams, tight emulsions, or solid
slurries [6]. Other challenges impacting flow assurance design include hydrodynamic
slugging of pipelines and risers, as well as the co-production of sand from the reservoir,
which can erode pipeline walls and accelerate internal corrosion. This thesis focusses on
two of the most pressing concerns to pipeline wall deposition: gas hydrate formation
and wax precipitation.

3
1.2 Hydrate plugging in flow assurance
Gas hydrates, or clathrate hydrates, are non-stoichiometric crystals formed
when hydrate forming components are confined inside a cage-like structure of water
molecules held together by hydrogen bonding . The hydrate-forming components, or
hydrate guests, include light hydrocarbon gasses such as methane, ethane or propane
and other non-hydrocarbon gasses like carbon dioxide (CO2) or hydrogen sulfide (H2S)
[7]. The cage-like water structure that confines these gases forms thermodynamically
under hydrate equilibrium conditions at high pressure and low temperature. Repeated
formation of hydrate cages forms large crystallized cubic structure, depending on the
molecular size of hydrate guests. Typically, small molecular gases such as methane and
ethane forms either structure I (sI) or structure II (sII) and in some cases for large
molecular size such as propane, structure H (sH) might form [8]. Figure 1.1 represents
these three types of hydrate structure.
Figure 1.1 Three different types of hydrate structure [8]
Beyond subsea pipelines, hydrates occur naturally as deposits in seafloor
sediment, where biogenic or thermogenic methane contacts seawater at high pressure
and low temperature [9]. The abundance of natural hydrate deposits could be an
important future source of natural gas, where Ruppel [10] reported that the total
estimated hydrate gas deposits worldwide was about 1,800-12,400 gigatons,
corresponding to 3-2.48 x 10¹⁵ cubic metres (106,00-876,000 trillion cubic feet) of
methane [11]. However, in petroleum pipelines, the unwanted formation of hydrate

4
due to the presence of hydrocarbon gases and produced water, under high-pressure
flow and low temperature, requires flow assurance engineers to traditionally maintain
flowlines outside of the thermodynamic stability region.
The formation of hydrate in subsea pipelines can increase safety risks due to the
large volume of gas that is trapped within the clathrate structure. For example, 1 m3 of
hydrate can liberate approximately 170 m3 of gas [12] if the hydrate is
thermodynamically destabilized, which can result in unintended movement of fluids or
solids through the pipeline and may further enhance pipeline integrity concerns.
Moreover, hydrate blockage formation can result in extended shut-down periods for the
flowline, which can defer production for weeks or months in severe cases [8]. Similar to
ice, hydrate nucleation is stochastic, increasing the numerical difficulty of predicting the
onset of hydrate blockage formation. Unlike deterministic phenomenon, the stochastic
formation of hydrate occurs spontaneously and randomly and requires subcooling
temperature below the hydrate equilibrium curve for hydrate to produce [13, 14]. These
predictive complexities mean that operators typically maintain pipelines outside of the
thermodynamic stability region for hydrates.
To facilitate these design considerations, the hydrate equilibrium curve is often
used as a guideline by pipeline operators to ensure that pipelines are operated above
the hydrate formation region. Thermodynamic hydrate inhibitors (THIs) are commonly
injected in pipelines to shift hydrate equilibrium curve, allowing pipelines operated
away from the hydrate formation region. THIs such as methanol and monoethylene
glycol (MEG) are widely-used by petroleum operators as hydrate inhibitors, as both
chemicals have the capability in minimizing the tendency of water molecules to form a
cage-type arrangement, thus forcing hydrate to form below the hydrate equilibrium
curve [7, 8]. An example of hydrate equilibrium curves at different MEG mass fractions
(with respect to water) in crude oil pipelines is shown in Figure 1.2.

5
Figure 1.2 An example of hydrate equilibrium curves at different MEG concentration
in crude oil pipelines, generated from Multiflash (6.2).
The anti-freeze property of THIs is contributed by its hydrogen bond capacity
with water molecules; the dipole moment of the oxygen in MEG is attracted to the
positive dipole moment of hydrogen atoms in the water phase. These bonds are similar
to the interaction of oxygen and hydrogen atoms in other water molecules during the
formation of hydrate cages [8], where MEG must be rejected from the hydrate cage
during formation. It was reported that the MEG-water hydrogen bond is ten times
stronger than normal Van der Waals forces between uncharged, non-polar molecules
[8]. As the addition of MEG acts as a competitor to the formation of hydrate cages by
water molecules, increasing concentration of MEG prevent further accumulation of
hydrate which subsequently forming slurry flow inside pipelines.
MEG and methanol are preferred chemicals to be used in managing hydrate
because these chemicals could be employed in different modes of pipeline operation,
by continuous injection during steady-state operations, spot injection during pipeline
shutdown/startup procedures, or during the remediation of hydrate blockage in the
pipeline [8]. However, the use of MEG above alcoholic inhibitors (e.g. methanol) is
preferred for systems that require continuous injection due to low volatility in the gas
phase [8], as the loss of methanol in gas and water phases results in higher operating
costs [15]. Moreover, methanol is highly flammable, toxic and might poison catalytic
systems in downstream facilities [8]. As for their application in fields, a regeneration
process unit for recovering and recycling these chemicals could be employed for

6
continuous and economical application [6]. However, regeneration plants for MEG are
widely used while regeneration plants for methanol are less common [6].
Despite the protections afforded by thermodynamic inhibitors, operators
typically mandate high mass fractions of MEG be injected and regenerated, with a
typical upper limit of approximately 60 wt% in water [16]. MEG increases the viscosity
of transported fluids, and MEG regeneration systems can be complicated by salt
precipitation and boiler fouling [8]. When considering the relationship between MEG
concentration and the hydrate equilibrium curve, there are limited studies conducted
to determine accurately hydrate equilibrium curves at MEG concentration higher than
30 wt% [17]. However, under-dosing MEG is typically avoided as such an under-inhibited
operating condition is believed to increase the blockage potential of hydrate in the
system [18, 19]. Therefore, high MEG dosages are usually specified to ensure that
pipelines operate away from the hydrate formation region.
Low-dosage hydrate inhibitors (LDHIs) have been introduced as the latest
hydrate inhibition strategy, where hydrate formation is managed by injection rates that
are two orders of magnitude below a typical requirement for MEG [20]. Kinetic hydrate
inhibitors (KHIs) are one such example of LDHIs, where polyethylene polymers with
suspended lactam or pyrrolidone rings are attached to the backbone of the polymer.
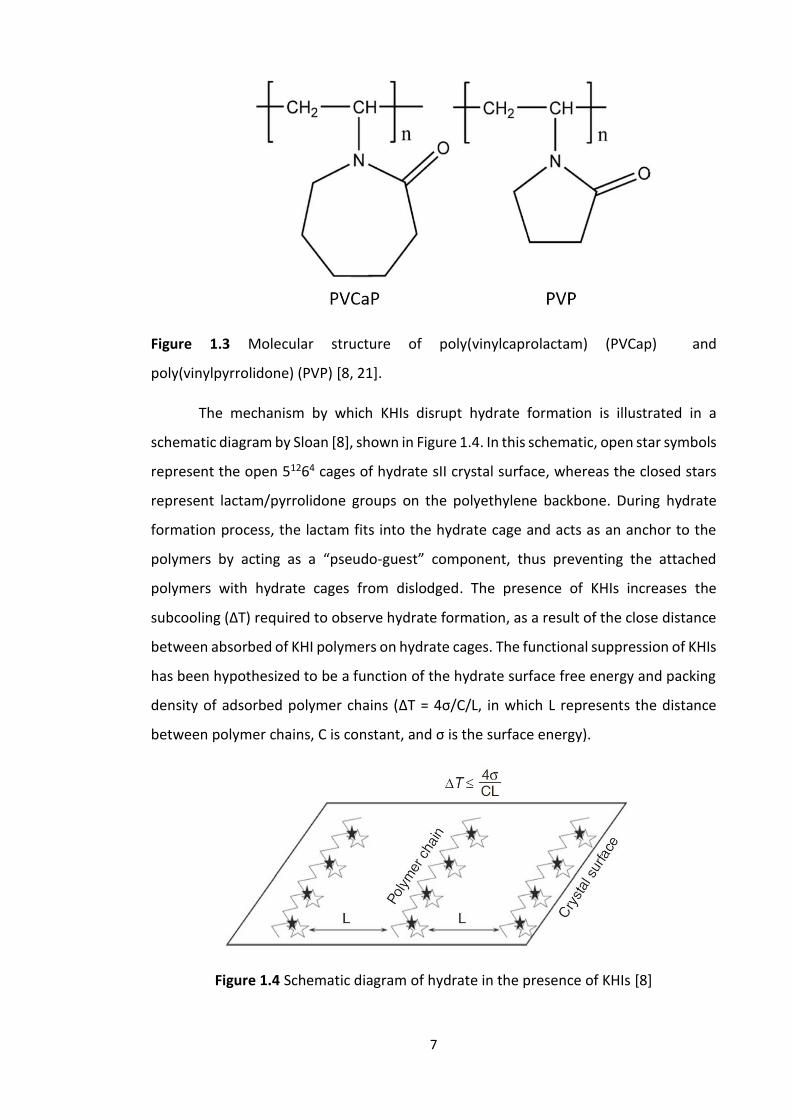
Figure 1.3 shows the molecular structure of poly(vinylpyrrolidone) (PVP) and
poly(vinylcaprolactam) (PVCap) which are commonly used as KHIs to respectively
suppress structure I and structure II nucleation.
7
Figure 1.3 Molecular structure of poly(vinylcaprolactam) (PVCap) and
poly(vinylpyrrolidone) (PVP) [8, 21].
The mechanism by which KHIs disrupt hydrate formation is illustrated in a
schematic diagram by Sloan [8], shown in Figure 1.4. In this schematic, open star symbols
represent the open 51264 cages of hydrate sII crystal surface, whereas the closed stars
represent lactam/pyrrolidone groups on the polyethylene backbone. During hydrate
formation process, the lactam fits into the hydrate cage and acts as an anchor to the
polymers by acting as a “pseudo-guest” component, thus preventing the attached
polymers with hydrate cages from dislodged. The presence of KHIs increases the
subcooling (∆T) required to observe hydrate formation, as a result of the close distance
between absorbed of KHI polymers on hydrate cages. The functional suppression of KHIs
has been hypothesized to be a function of the hydrate surface free energy and packing
density of adsorbed polymer chains (∆T = 4σ/C/L, in which L represents the distance
between polymer chains, C is constant, and σ is the surface energy).
Figure 1.4 Schematic diagram of hydrate in the presence of KHIs [8]

8
The resulting interaction between hydrate cages and polyethylene polymers
delays the onset formation of hydrates and avoids rapid hydrate crystallization, thus
allowing pipelines to transport fluid without hydrate blockage formation [22]. However,
the performance of KHIs is disrupted in high subcooling systems (above approximately
14oC [23]), wherein the driving force for hydrate formation can overwhelm the effect of
the KHI [24, 25]. KHI performance can also be affected by other injection chemicals, such
as corrosion inhibitors [26]. The usage of surface active compounds, or surfactants, to
control hydrate particle agglomeration has been discussed widely as one of the options
in the development of LDHIs. Hydrate anti-agglomerants (AAs) can be injected in an oil-
continuous system at low dosage to minimize hydrate agglomeration and generate a
flowable hydrate slurry over long distances. AAs are typically comprised of a hydrophilic
group (water soluble) and a lipophilic group (oil-soluble) [27], as shown in Figure 1.5.
These compounds act through the adsorption of surfactant on hydrate-oil interfacial
phase, thus increasing contact angle and reducing surface wettability [28, 29]. The
presence of natural surfactants such as carboxylic acids in crude oil was reported could
help in minimizing agglomeration of hydrate [30]. Synthetic surfactants such as AAs are
added externally, and are typically based on the use of quaternary ammonium (QAs)
ionic surfactants [31].
Figure 1.5 Schematic diagram of surfactant consisting of lipophilic tail (oil soluble) and
hydrophilic head (water soluble) [27].
The application of AAs has gained its favor, because they enable for
transportable slurry flow inside the pipeline with minimum risk of blockage. However,
the application of AA works best only in the presence of crude oil with less than
approximately 50% watercut [8]. In addition, the usage of AAs poses a problem to the
environment when they are disposed off [20, 32]. Current research is now focusing on

9
improving the effectiveness of KHIs and AAs in a way that is workable under actual
operating conditions in offshore pipelines.
The formation of hydrate blockages is typically characterized according to the
continuous flowing phase: oil-dominated flow [33], water-dominated flow [34] or gas-
dominated flow [35]. Classification of these flow mechanisms is based on their liquid
loading inside pipelines, in which liquid loading in oil-dominated and water-dominated
flow systems are typically beyond 30 vol%; below this threshold, hydrate formation
tends to follow a gas-dominated mechanism.
In each case, several steps must occur before hydrate can plug the pipeline.
Specifically in oil-dominated systems, hydrate plugging has been established to follow
four primary steps: (1) entrainment of water in the oil phase, forming an emulsion under
the turbulent and high shearing flow rate; (2) nucleation of hydrate at the water-oil
interface due to the high solubility of light hydrocarbon gases in the oil phase; (3)
formation of a large hydrate particles, which begin to agglomerate due to strong
cohesive forces between them; and (4) formation of a high viscosity slurry flow,
eventually leading to hydrate deposition on the pipeline wall and plugging (Figure 1.6;
Turner, et al. [33]).
Figure 1.6 Stages of hydrate plugging in an oil-dominated system [33].
The understanding of the hydrate plugging mechanism in an oil-dominated
system is expanded to the predictive models of hydrate blockage, which can be
implemented in commercial flow assurance software. These predictive models were
initially developed based on the kinetic model of hydrate growth, considering formation
at the interface of dispersed phase of water droplets entrained in the oil phase [16].
10
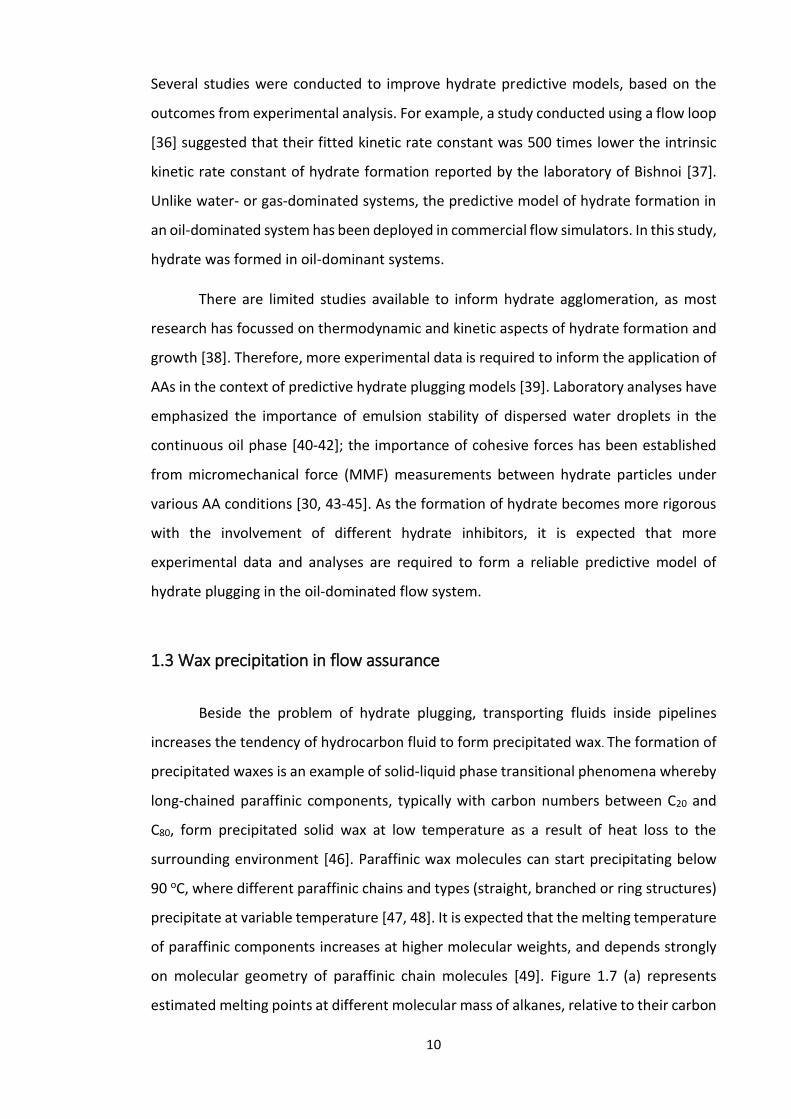
Several studies were conducted to improve hydrate predictive models, based on the
outcomes from experimental analysis. For example, a study conducted using a flow loop
[36] suggested that their fitted kinetic rate constant was 500 times lower the intrinsic
kinetic rate constant of hydrate formation reported by the laboratory of Bishnoi [37].
Unlike water- or gas-dominated systems, the predictive model of hydrate formation in
an oil-dominated system has been deployed in commercial flow simulators. In this study,
hydrate was formed in oil-dominant systems.
There are limited studies available to inform hydrate agglomeration, as most
research has focussed on thermodynamic and kinetic aspects of hydrate formation and
growth [38]. Therefore, more experimental data is required to inform the application of
AAs in the context of predictive hydrate plugging models [39]. Laboratory analyses have
emphasized the importance of emulsion stability of dispersed water droplets in the
continuous oil phase [40-42]; the importance of cohesive forces has been established
from micromechanical force (MMF) measurements between hydrate particles under
various AA conditions [30, 43-45]. As the formation of hydrate becomes more rigorous
with the involvement of different hydrate inhibitors, it is expected that more
experimental data and analyses are required to form a reliable predictive model of
hydrate plugging in the oil-dominated flow system.
1.3 Wax precipitation in flow assurance
Beside the problem of hydrate plugging, transporting fluids inside pipelines
increases the tendency of hydrocarbon fluid to form precipitated wax. The formation of
precipitated waxes is an example of solid-liquid phase transitional phenomena whereby
long-chained paraffinic components, typically with carbon numbers between C20 and
C80, form precipitated solid wax at low temperature as a result of heat loss to the
surrounding environment [46]. Paraffinic wax molecules can start precipitating below
90 oC, where different paraffinic chains and types (straight, branched or ring structures)
precipitate at variable temperature [47, 48]. It is expected that the melting temperature
of paraffinic components increases at higher molecular weights, and depends strongly
on molecular geometry of paraffinic chain molecules [49]. Figure 1.7 (a) represents
estimated melting points at different molecular mass of alkanes, relative to their carbon

11
number; Figure 1.7 (b) shows three different molecular geometries of paraffinic wax
encountered inside pipelines.
Figure 1.7 (a) Melting points of n-alkanes CnH2n+2 (n = 3-15) at different molecular mass
(M) [49]. (b) The complexity of paraffinic chains increases with increasing carbon
numbers which could be a straight, branched or ring structure [48].
As temperature reduces further, precipitated waxes start to nucleate, followed
by clustering among wax particles that can deposit radially along the cold pipeline wall
[47]. Continuous wax precipitation increases wax deposition on the wall; if it is left
untreated, precipitation can increase the viscosity or decrease the cross-sectional area
available for flow, thereby increasing the momentum requirement of fluid transport and
associated risk of blockage [50-52]. Another concern related to wax precipitation could
(a)
(b)
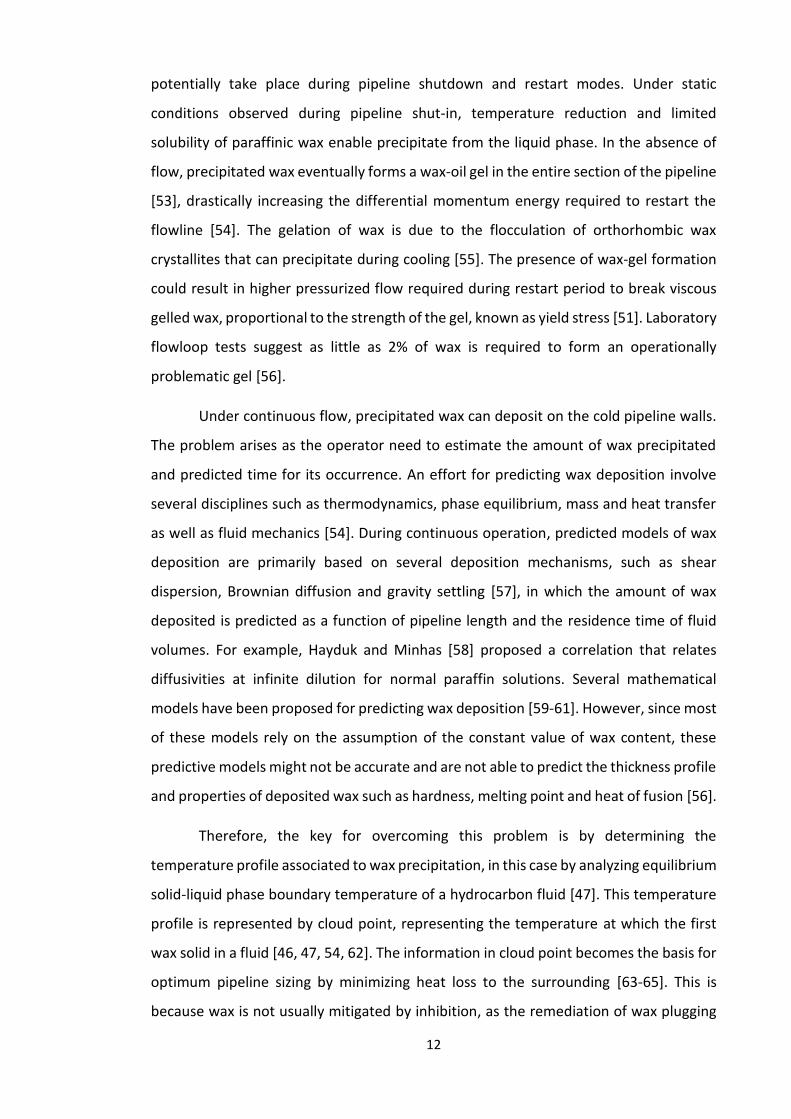
12
potentially take place during pipeline shutdown and restart modes. Under static
conditions observed during pipeline shut-in, temperature reduction and limited
solubility of paraffinic wax enable precipitate from the liquid phase. In the absence of
flow, precipitated wax eventually forms a wax-oil gel in the entire section of the pipeline
[53], drastically increasing the differential momentum energy required to restart the
flowline [54]. The gelation of wax is due to the flocculation of orthorhombic wax
crystallites that can precipitate during cooling [55]. The presence of wax-gel formation
could result in higher pressurized flow required during restart period to break viscous
gelled wax, proportional to the strength of the gel, known as yield stress [51]. Laboratory
flowloop tests suggest as little as 2% of wax is required to form an operationally
problematic gel [56].
Under continuous flow, precipitated wax can deposit on the cold pipeline walls.
The problem arises as the operator need to estimate the amount of wax precipitated
and predicted time for its occurrence. An effort for predicting wax deposition involve
several disciplines such as thermodynamics, phase equilibrium, mass and heat transfer
as well as fluid mechanics [54]. During continuous operation, predicted models of wax
deposition are primarily based on several deposition mechanisms, such as shear
dispersion, Brownian diffusion and gravity settling [57], in which the amount of wax
deposited is predicted as a function of pipeline length and the residence time of fluid
volumes. For example, Hayduk and Minhas [58] proposed a correlation that relates
diffusivities at infinite dilution for normal paraffin solutions. Several mathematical
models have been proposed for predicting wax deposition [59-61]. However, since most
of these models rely on the assumption of the constant value of wax content, these
predictive models might not be accurate and are not able to predict the thickness profile
and properties of deposited wax such as hardness, melting point and heat of fusion [56].
Therefore, the key for overcoming this problem is by determining the
temperature profile associated to wax precipitation, in this case by analyzing equilibrium
solid-liquid phase boundary temperature of a hydrocarbon fluid [47]. This temperature
profile is represented by cloud point, representing the temperature at which the first
wax solid in a fluid [46, 47, 54, 62]. The information in cloud point becomes the basis for
optimum pipeline sizing by minimizing heat loss to the surrounding [63-65]. This is
because wax is not usually mitigated by inhibition, as the remediation of wax plugging

13
problem is often expensive, and the application of wax inhibition is practical only to
specific wax plugging cases [47, 64]. Although it is not uncommon to overcome the wax
deposition problem by heat treatment or by pigging, these approaches are time-
consuming and expensive [66]. Moreover, they require proper estimation of the rate of
wax deposition or the properties of incipient gel [57]; inaccurate estimates of wax
thickness can result in failures of pipeline pigging, as was noted for one field in the Gulf
of Mexico [67]. Given the availability of temperature profile inside the pipeline, the
cloud point can be beneficial to predict the location at which wax starts to precipitate
[54], enabling considerations of the dynamic temperature profile between bulk fluid and
wall temperature during wax deposition [57, 68].
1.4 Challenges in deep water production
The growing demand for energy, especially in oil and gas, means that petroleum
exploration and production activities are expanding further into untapped petroleum
reservoirs in a deep subsea environment. It requires a longer pipeline and reduces
surrounding temperature which could be as low as -2 °C to 4 °C [69, 70]. Figure 1.8 shows
a temperature and pressure profile for pipelines transporting waxy crude oil. The data
for the hydrate equilibrium curve at different MEG mass fractions in water, alongside
the wax appearance curve, were generated from Multiflash (6.2) based on the
composition of saturated waxy crude oil. In this example, a shallow water pipeline that
generally operates within the maximum sea depth of 200 meters has the potential of
wax deposition at a temperature lower than 60 °C. However, deepwater pipelines, which
operate beyond 200 meters of water depth, are prone to have both wax and hydrate
deposition, as the pipeline walls can access lower temperatures. Under cold conditions,
longer pipelines and lower surrounding temperatures require fluids to be transported
within hydrate and wax formation regions, thus increasing the risk of partial or complete
pipeline occlusion.

14
Figure 1.8 A temperature-pressure graph of waxy crude oil flow indicates two operating
curves of pipelines representing both shallow and deep water conditions. Hydrate
equilibrium curves at different MEG concentrations and expected wax appearance curve
are presented as well in this graph. The curve representing pipeline operating
parameters in shallow water was based on the assumption of maximum sea depth
within 150 meters and seawater temperature at 25 °C. The data for hydrate equilibrium
curves and the wax appearance curve were obtained from Multiflash (6.2).
Focusing on the flow assurance issues in Malaysia, wax deposition during
transportation is known to be the major problem faced by the Malaysian petroleum
operator, PETRONAS, especially in marginal fields [71]. Apart from their natural high wax
content in crude oil [72], the problem of organic solid deposition is enhanced by
extended periods of petroleum production, where platforms that have operated more
than 20 years are likely to experience wax problems due to changes in reservoir
temperature, reservoir pressure, and composition of crude oils over time [73]. Most of
the shallow water productions are operated within the sea depth of 60-70 m, with
expected seawater temperature is at 25 °C, where it was reported that the WAT could
be as high as 53.67 °C [74]. Previous reports projected that the deepwater exploration
activities might contribute 30-35% of total oil production in 2013-2015 [75], providing
an opportunity for its development in Malaysia fields. However, this activity faces
technical challenges as the deepwater exploration might operate within the sea depth
of 200 to 1200 meters [76], increasing the comingled threats of wax precipitation and

15
hydrate blockage. Therefore, a new strategy is required to operate the pipelines safely
with feasible and economical approaches.
Considering current hydrate preventive approaches in deepwater exploration,
the application of long pipelines requires a high concentration of THIs, which indirectly
imposes a higher cost for such effort [17, 22]. It was estimated that the annual cost of
almost $200 million is required for the continuous injection of large THIs fractions [77].
While this preventive approach is expensive, petroleum operators need to maintain
their pipeline free from any blockage as it could be equally valuable, with a combined
remediation and deferred production cost on the order of $1 million/day [51]. These
additional costs of maintaining the pipeline outside both hydrate and wax stability
regions may outweigh the opportunity to exploit petroleum in deepwater production.
The industry has shifted to alternative solutions that attempt to minimize total
operating cost. Specifically for hydrates, a new approach in managing the risk of hydrate
blockage was introduced whereby a fine slurry of hydrates is encouraged in subsea
pipelines, through the use of multiphase flow tools (e.g. static mixers or recirculation
loops) alongside chemical AA technologies [2, 78]. This approach requires extensive
laboratory investigation for each field, especially in assessing kinetic growth rates and
the dynamic hydrate equilibrium curve during growth. For instance, Kinnari, et al. [79]
reported three different risk boundaries associated with hydrate formation, based on
adaptation of the traditional phase boundary curve (Figure 1.9); as pipeline conditions
move further inside the equilibrium region, the severity of hydrate formation is
predicted to increase. This basis may be explored further in order to optimize the
concentration of THIs with minimum impact on the risk of blockage formation. In this
thesis, studies on under-inhibited MEG and methanol were reported, and are used to
assess the severity of hydrate formation at different dosage rates, alongside potential
synergies with LDHIs [19, 32, 80, 81].

16
Figure 1.9 Different areas of risk hydrate formation based on the hydrate equilibrium
curves. The induction time of hydrate formation is estimated to be more than 12 hours
in the green region, less than 12 hours or down to 1 to 2 hours in the yellow region and
immediate hydrate formation in the red zone [79]
Unlike hydrate plug prevention methods, efforts for managing wax in deep water
production are still focussed on the fundamental aspect of wax management by
accurately predicting wax precipitation and deposition [66]. These efforts require
information of cloud point, along with other data obtained from experimental analyses
such as wax content, pour point, gel strength and deposition rate, which will be
ultimately used for designing optimum pipeline sizing [63]. Besides, the scope of analysis
has widened up by considering rigorous conditions surrounding the pipelines and longer
subsea tiebacks, where the system may operate inside both the wax and hydrate
stability regions [64]. Several studies have been initiated in recent years that focus on
the understanding of wax deposition in long subsea tiebacks [68, 82]. Laboratory-based
analyses of cloud point plays an important role in assessing the extent of potential wax
precipitation, and may also be used to characterize the minimum required dosage of
wax inhibitor injection chemicals [83] or the ability to maintain a cold-flow operation
[52, 84].

17
Apart from hydrate blockage and wax deposition, consideration of realistic
pipeline conditions requires an integrated understanding of multicomponent phase
behaviour for hydrocarbons, particularly under the harsh conditions experienced in
deep water. In this study, laboratory investigations were conducted to understand the
stability of hydrate-in-oil slurries when co-precipitated wax was also present. Laboratory
analysis conducted by de Oliveira, et al. [85] has examined the effect of both wax
properties on the possibility of hydrate plug formation, with results indicating that the
severity of hydrate blockage increased as a result of oil gelation during pipeline start-up.
In term of thermodynamic modeling, Mahabadian, et al. [86] reported an integrated
thermodynamic model for predicting both hydrate and wax precipitation; the
importance of cross-interaction between hydrate and wax becomes more substantial at
deepwater operating conditions. This thesis leverages the use of calorimetric methods
to assess the severity of hydrate and wax phenomena, and establishes the operational
boundaries of the associated analytical methods.
1.5 Calorimetric assessment of hydrate formation
The flow assurance community typically deploys thermophysical property tools
and multiphase flow simulations to assess the severity of potential hydrate formation
and blockage in subsea tiebacks. However, based on the hierarchical flow assurance
activities proposed by Sloan [2], the contribution of laboratory measurements in these
activities is crucial as it provides a fundamental understanding of issue related to flow
assurance and a basis for modeling specific phenomena [87]. Moreover, the data
generated from laboratory investigations provides a basis for pipeline design and
operating parameters [2].
Depending on a required study or phenomenon, the laboratory work is based on
a sample and analytical methods used in describing this problem accordingly. DSC
methods are commonly used to analyze specific thermophysical properties of a sample
when subjected to temperature change across a range of pressure conditions. The
application of DSC is most relevant for cases where a phase transition is expected, as the
apparatus can readily quantify the latent heat requirements of the system.

18
Application of DSC in flow assurance has been widely used with established
laboratory protocols and procedures through analysis of required energy during phase
changes, particularly in the case of exothermic hydrate formation or endothermic
hydrate dissociation [7, 8]. At high gas pressures and low temperatures suitable for
hydrate formation, the DSC has previously been deployed to characterize the extent of
exothermicity and endothermicity measured for repeated hydrate formation and
dissociation cycles, respectively, in the same water-in-oil emulsion system. That is, the
destabilization of the dispersion results in decreased water-hydrocarbon surface area,
which manifests as a decrease in the measured calorimetric signal. This method has
further deployed the DSC to investigate the effect of different chemical additives on
dispersion stability [88-90], which can be helpful in identifying whether a dispersion is
likely to remain stable during transport in deepwater pipelines [20, 91, 92].
1.6 Calorimetric analysis of wax precipitation
Exothermic wax crystallization, and endothermic melting, may be similarly
captured in the DSC. The solid-liquid phase transition provides useful information for
operators, where the initial apperance of wax crystals represents a key design
parameter for subsea systems. Cloud point, which is also referred to as wax appearance
temperature (WAT), is defined as the temperature at which the first crystal of wax is
observed in the system; wax disappearance temperature (WDT) represents the
temperature at which the final wax crystal melts, and is indicative of the true
thermodynamic phase boundary [93-95]. Quantitative measurement of the amount of
wax precipitated can be determined from DSC based on direct integration of the
measured enthalpy of melting or crystallization [93, 95]. Besides its widely-used
application for wax detection under atmospheric conditions, DSC was also used for
representing wax precipitation in a pressurized oil sample under high-pressure gas [64,
96, 97]. For example, Juyal, et al. [64] analyzed a pressurized crude oil sample (250 to
4000 psi using synthetic flashed gas mixture) that was equilibrated for 48 hours in a
µDSC, which showed reliable measurement of WAT that compared well with the
predicted cloud point from thermophysical property tools.

19
Theoretically, both WAT and WDT refer to the same thermodynamic solid-liquid
phase boundary temperature. As wax crystallisation is a stochastic process similar to
hydrate, WAT is often subjected to subcooling temperature, resulted in lower
temperature of WAT compared to WDT. Figure 1.10 represents an example of
thermogram of melting and crystallization stage of high purity of hexadecane (C16)
tested in the µDSC. For a high purity sample, both WAT and WDT are recorded from the
interception curve between onset crystallization and melting curves with their baseline
respectively [98]. Despite the usage of high purity sample of C16 (more than 99%), a
subcooling temperature 1.7 oC was observed for the system.
Figure 1.10 Thermogram of crystallization and melting curves generated from
experimental data of µDSC for high purity C16. WAT and WDT were determined from the
interception of onset crystallization curve (blue dashed line) and melting curve (red
dashed line) with baseline (green dashed line).
The subcooling requirement is manifest as initial wax crystallites attempt to
overcome high surface tension with respect to the continuous hydrocarbon phase [99],
after which a stable wax phase can continue to grow [100]. For this reason, WAT
measurements – and the distributed observation thereof – constitute a practical value
for field applications, while WDT measurements illuminate the true phase boundary. In
typical DSC investigations, the manipulation of scanning rate as a variable allows the
user to characterize the effect of thermal lags, whereby extrapolation to infinitely slow
scanning rates provides a basis to remove apparatus artefacts [46, 101]. The
ENDOTHERMIC

20
measurements of WAT and WDT must be deployed in context for pipeline applications,
when respectively considering the onset of wax precipitation conditions or the
temperatures required for wax removal.
There are several methods that can be used to analyze cloud point, including
visually-based techniques such as cross-polarized microscopy (CPM) or by quantitative
methods such as DSC, rheology or near-infrared (NIR) detection [46]. Figure 1.11 shows
an example of a photomicrograph of crystallized wax observed using CPM [102], where
crystallized wax appears as white flocs [46].
Figure 1.11 Photomicrograph of crystallized wax which was observed using CPM. The
image was first reported by Roenningsen, et al. [102] and was later taken as an example
by Huang, et al. [46].
These methods have been extensively studied, with a particular focus on their
limitations and accuracy [62, 101-104], where some degree of bias and uncertainty is
associated with each [46]. Calorimetry offers a more quantitative basis with which to
estimate the extent of wax precipitation in complex hydrocarbon systems [103],
providing an advantage over visually-based detection methods, such as CPM, that rely
on manual detection by an operator [62]. Although the DSC has comparable accuracy to
rheologically-based wax detection [68], it requires smaller sample volumes; the DSC is
also able to scan wide temperature regions more efficiently than conventional
rheological apparatus.
21
While previous studies have investigated the application of DSC for hydrate and
wax systems independently, there is a knowledge gap as to the applicability and
reliability of calorimetry in representing industrial pipelines where both solids may co-
exist. This thesis work seeks to address the lack of understanding around the reliability
of calorimetry compared to alterantive techniques for complex systems.
1.7 Research aims and outlines of thesis
This research aims to establish DSC as an industrially-viable assessment method
to detect the onset and extent of formation for both hydrate and wax in complex
hydrocarbon systems. The study focuses on establishing the reliability and accuracy of
µDSC to address three primary knowledge gaps in the flow assurance community:
(i) can a stable hydrate dispersion be maintained under synergistic hydrate
inhibition conditions, employing both MEG and AA?;
(ii) how does paraffin cloud point change in the presence of MEG?; and
(iii) can the DSC be used to detect cloud point analysis in low wax content
systems?
Five chapters are presented, where Chapter 2 discusses experimental
methodology and design; Chapters 3 through 5 provide experimental results, discussion,
and analysis of the three knowledge gaps identified above; and Chapter 6 provides
conclusions and recommendations for the future. A detailed summary of each chapter
is provided below to guide the reader.
Chapter 2 explains the methodology and experimental setup for this thesis. The
first part of this chapter covers the theoretical basis of DSC and experimental setup of
the µDSC. A set of results concerning on the calibration step of µDSC is presented using
a standard reference material using aluminium oxide (Al2O3) as well as four different
high purity paraffinic samples: hexadecane (C16), octadecane (C18), eicosane (C20) and
triacontane (C30).

22
Chapter 3 presents an analysis of hydrate dispersion stability for synergistic
hydrate inhibition using under-dosed MEG and AA. The initial section of this chapter
describes the concept of hydrate dispersion stability in assessing the tendency of
hydrate particles to remain dispersed in liquid hydrocarbon systems. In this study,
under-inhibited MEG could potentially destabilize hydrate dispersion as a result of free
water formation, but combining this additive with AA might synergistically improve
hydrate dispersion stability. This analysis was carried out using a set of emulsified
samples between crude oil mixtures and different MEG and AA concentrations. The
concept of hydrate dispersion stability analysis using µDSC is explained, followed by
experimental procedures to analyze a reduction of hydrate dissociation curves based on
cyclical steps of hydrate formation-dissociation stages. Results obtained in a series of
experiments are presented, based on observed changes relative to the base case for
different crude oil systems, followed by analysis at independent and co-injected MEG
and AA conditions. The chapter concludes by discussing the feasibility of using µDSC to
analyze hydrate dispersion stability in synergistic inhibition conditions.
Chapter 4 highlights the application of µDSC to analyze the variation of cloud
point in paraffinic binary mixtures in the presence of MEG as a second phase. The initial
portion of this chapter summarizes the concept of cloud point measurements, and
summarizes the techniques that are available to manipulate cloud point. This approach
is expanded to the possibility of altering cloud point in two-phase mixture with MEG.
Previous findings on the solubility of MEG in hydrocarbon compounds are presented as
well in this section, with a particular emphasis on the importance of aromatic
compounds in the hydrocarbon phase. The next section focuses on the preparation of
materials used in this study, involving binary mixtures of octadecane (C18) in hexane (C6)
or toluene with different MEG mass fractions. The chapter presents parameters used to
interrogate such two-phase systems, alongside the approach to analyse cloud point
during crystallization and melting steps. The chapter discusses the impact of MEG and
water content on measured increments to cloud point for binary hydrocarbon mixtures,
and provides a framework to contextualize the impact of toluene and MEG on paraffin
precipitation.

23
Chapter 5 focuses on the analysis of cloud point in low wax content industrial
fluids, using both µDSC and Raman spectroscopy (RS). The introduction emphases the
importance of adopting RS as a core method in cloud point detection, due to its high
sensitivity in detecting wax precipitation without relying on the minimum size of
crystallized wax. The basic concept of RS and its application in wax precipitation is
included in this chapter. Under the materials and methods section, experimental steps
for preparing a set of low wax content samples are highlighted using a binary mixture of
triacontane (C30) in toluene. A method for analysing cloud point in RS is provided in this
chapter, based on the intensity of Raman signature during hydrocarbon crystallization
and melting. A discrepancy between measured and predicted cloud point is discussed in
detail, suggesting the need to improve EOS-based approaches for characterizing low wax
content systems. A comparison between µDSC and RS is also provided, to illustrate the
potential for µDSC-based interrogation as an industrially viable method.

24
CHAPTER 2: METHODOLOGY AND EXPERIMENTAL SETUP
2.1 Basis of Calorimetric Investigation
Differential scanning calorimetry is an analytical method used to characterize the
energy required to maintain or change heat in a sample, and is appropriate to quantify
both sensible and latent heat changes. Latent heat describes the energy generated or
consumed during phase transitions in a material body; the melting process of ice from
solid to liquid is an example (Figure 2.1a). Conversely, sensible heat represents the
energy required to change the temperature of a substance without undergoing a phase
transition; increasing the temperature of liquid water from ambient to the boiling point
is an example. The physical or chemical characteristics of the sample subjected to phase
changing process are quantified by comparing the energy required to maintain a target
sample’s temperature with that of a reference material [105]. A temporal profile of the
energy flow to a target sample in DSC, known as a thermogram, is used to characterize
the sample. The example thermograms in Figure 2.1 illustrate that, over a small range
of temperature between -14 and -20 °C, exothermic freezing of water releases heat to
the surroundings, which is represented by a sharp peak before the energy flow returns
to a baseline condition. The peak provides information on heat released during
crystallization process, based on the area under the curve, and provides an indication of
the freezing point based on the interception of the baseline and the onset of the curve;
this example also serves to illustrate the typical induction requirements for solidification
in a quiescent DSC cell. The example melting behaviour of ice into liquid water is shown
in Figure 2.1b, where an endothermic melting curve can similarly be used to quantify
the amount of ice melted; the melting point of the sample is obtained from the
interception curve between a baseline and an endset melting curve, which provides a
characterization of the phase boundary for the system.

25
Figure 2.1 Thermograms generated in freezing (a) and melting (b) processes for a
deionized water sample. The area under the curves represents the amount of heat
released and contained during freezing and melting stages. The freezing and melting
points are obtained from the interception of a baseline curve and an onset solidifying
and melting curve respectively.
The amount of heat released or gained during phase-changing processes is
determined from the area under the curve over a range of temperature, based on
Equation 2.1:
∆𝐻 =1
𝑚𝛽∫ (
𝛿𝑄
𝑑𝑡)
𝑇2
𝑇1
𝑑𝑇 Eq. 2.1

26
In Equation 2.1, ∆H represents heat gained or lost, T2 and T1 are initial and final
temperature, and m is the weight of the sample. The curve represents a change in the
rate of heat flow (represented by 𝛿𝑄
𝑑𝑡 ) at constant scan rate (represented by 𝛽) over a
period of time. The above equation is only applicable at constant pressure, where a
detailed explanation on this equation is presented in the appendix to this thesis.
A schematic of the DSC is shown in Figure 2.2, which shows crucibles for both
the target sample and a reference fluid. In the case of a heating process, a scanning rate
specified by a user provides an input to the control system, which drives Peltier elements
to change the reference and sample crucible temperature. During this temperature
change, the energy provided to the Peltier elements and the associated change in
crucible temperatures is recorded, where the system minimizes the temperature
difference (ΔT) between the reference and sample crucibles; the difference in energy
required by Peltier elements driving the reference and sample crucibles is recorded by
the DSC (∆Q sample and ∆Qref). Subsequently, the power difference between the crucible
containing a target sample and the reference crucible is represented by a thermogram
over the range of temperature studied (∆Q thermogram). In the case of phase transition,
such as ice melting, the additional latent heat requirement is captured in the
thermogram, generating an endothermic spike.

27
Figure 2.2 Schematic diagram of a two-cell DSC.
2.2 Experimental setup
The DSC used in this study is a Multi-Cell Differential Scanning Calorimeter
(MCDSC) model by Calorimetry Sciences Corporation (now TA Instruments, Inc.). Unlike
other types of DSC, MCDSC is considered to be a µDSC, as it requires a small sample size,
limited to the volume of its crucible or ampoule (approximately 1 cm3). It has faster
typical scanning rates, between 0.01 and 2 °C/min, than in conventional, large-volume
DSC systems, which enable rapid changes in crucible temperature. The system operates
from -30 to 150 °C, with most experiments in this study between -30 and 80 °C. The
internal layout of µDSC is presented in Figure 2.3.

28
Figure 2.3 Internal configuration of MCDSC, with two of four crucibles visible (TA
Instruments).
Based on Figure 2.3, the µDSC consists of four Thermo-Electric Devices (TED)
detectors (label G in Figure 2.3) for three sampling cells and one reference cell. A Peltier
plate of Cascade TED (label D in Figure 2.3) functions for both heating and cooling the
crucibles is monitored and controlled by Resistance Temperature Detector (RTD) Control
Sensor (label B in Figure 2.3). The reference crucible is kept empty by purging it with an
inert gas (typically nitrogen), while a small amount of the target solid or fluid is added
to three experimental crucibles. To remove any moisture build-up during cooling
process, low-pressure nitrogen gas is continuously supplied at approximately 3 psig. The
µDSC is connected to a chiller via two separate lines, which acts as a thermal reservoir
for the system. A CF-40 Cryo-Compact Circulator by JULABO GmbH was used for this
investigation, where a mixture of 50 vol% MEG in water was used.
The µDSC crucibles contain Swagelok connections allowing them to be sealed for
high-pressure measurements, which are required for gas hydrate studies. Each sampling
cell is connected individually to a gas manifold with four control valves, where a
schematic of the laboratory setup is provided in Figure 2.4.

29
Figure 2.4 Schematic representation of MCDSC setup (for pressurized-mode setup) in
the laboratory.
A desktop computer was used to control the operation and analyze data from
the DSC. Two different software packages were used (TA Instruments). MCDSCRun was
used for the configuration of the µDSC, which provides control over sample temperature
and heating/cooling rate as a function of time during the experiment. NanoAnalyze Data
Analysis (version 3.6.0) was used to analyze thermograms obtained from MCDSCRun,
including integration of thermograms, identifying phase transition temperatures, and
comparing thermograms between experiments.
Both atmospheric and high-pressure crucibles were used in µDSC experiments,
which are shown in Figure 2.5. The ambient-pressure crucible is cylindrically-shaped,
with a threaded lid, and is made from Hastelloy-C. A gasket is placed between the
ampoule and the cover to ensure the ampoule is sealed. The second type of crucible,
also made from Hastelloy-C, contains a 1/8” stainless steel threaded Swagelok gas
tubing connection, which was used to pressurize and evacuate the crucible. High-
pressure cells were sealed with an o-ring with 0.737” internal diameter and 0.103” seal
height (NBR 70 DURO B5010 by Ludowici Seals). High-pressure crucibles were used for
gas hydrate experiments presented in Chapter 3, and ambient-pressure crucibles were
later to conduct experiments on hydrocarbon cloud point (Chapters 4 and 5).

30
Figure 2.5 (a) Atmospheric pressure crucible; and (b) high-pressure crucible with gas line
connection.
2.3 µDSC calibration with reference materials and paraffins
Calibrating the µDSC is essential to ensure that the results generated are reliable.
For this purpose, a standard reference material of aluminum oxide (Al2O3) was used. The
instrument was previously calibrated by the manufacturer using an in-built function with
a provided sample, the results of which were provided in the instrument
documentation; the heat capacity of an aluminum oxide calibration sample was
measured and compared with standard experimental data reported by Ditmars, et al.
[106] over a range of temperatures from -20 to 90°C. The measured specific heat
capacity represents the ratio of heat removed or retained by a material, normalized by
the change in temperature and sample mass. As the measured heat capacity represents
a combination of both the crucible material and solid/fluid sample, deductible heat
capacities were obtained by overlaying thermograms of a crucible containing aluminum
oxide and with the empty crucible.
A set of three crucibles were loaded with 1-2 gram of aluminum oxide, before
each crucible was placed in the µDSC. From room temperature (25°C), the crucibles were
cooled to -20 °C at scan rate 1 °C/min before they were kept isothermal for 1800 seconds
at -20°C. This was followed by heating step to 80 °C at scan rate 0.5 °C/min, isothermal
maintenance at 80 °C for 1800 seconds, and a final cooling step to -20 °C at 0.5 °C/min.
Estimation of heat capacity was performed through NanoAnalyze, based on the
specified weight of aluminum oxide. From three parallel measurements, an averaged
(a) (b)

31
value of heat capacity was calculated at a 95% confidence interval. Figure 2.6 represents
the percentage deviation of heat capacity between measured and literature data
obtained from Ditmars et al. [106]. The measured deviation between µDSC experiments
and literature is within 2% (Figure 2.6) for the range of temperatures studied.
Figure 2.6 Deviation between measured and literature aluminum oxide heat capacity
(Ditmars, et al. [106]) over a temperature range of 260 to 360 K (-13.2°C – 86.9°C)
Apart from the calibration of heat capacity using aluminum oxide, several pure
paraffinic components were used to analyze the accuracy of µDSC in assessing melting
temperature. This approach is relevant mainly for the application of cloud point
measurement presented in Chapter 4 and 5. Four different high-purity paraffinic
samples of hexadecane (C16), octadecane (C18), eicosane (C20) and triacontane (C30) were
tested in this second calibration step. Melting points were used in preference to
crystallization points, to avoid additional complications from subcooling requirements
that can obscure the thermodynamic phase boundary [46].
The measured melting points (Tm) were compared against the melting point from
literature data (Tm[ref]) reported by Marsh [107]. This report provided a list of average
melting points of pure paraffinic components, which considered several previous
experimental results. Table 2.1 shows a comparison between measured and literature
data for four different paraffinic components tested using µDSC. Results indicated that
the current µDSC setup generated a reliable measurement of average melting

32
temperature, with the highest deviation of approximately 4 K observed for C30. All
paraffinic components used in this calibration work were used without any additional
purification step.
Table 2.1 Absolute average temperature differences between melting temperature at
measured and literature data for four pure paraffinic components. The average
measured melting temperatures are the mean of three repeated measurements in each
case, at a 95% confidence interval.
Samples
Supplier and
purity
Measured
melting
temperature, Tm
(K)
Reference
melting
temperature, Tm
[ref] (K)
Absolute
average
temperature
difference
(|Tm[ref] - Tm|)
Hexadecane
(C16
)
Alfa Aeser
(>99%)
290.69 ± 0.2 291.33 ± 0.02 0.64
Octadecane
(C18
)
Sigma Aldrich
(>99%)
300.94 ± 0.25 301.33 ± 0.05 0.39
Eicosane
(C20
)
Sigma Aldrich
(>99%)
309.69 ± 0.05 309.7 ± 0.2 0.01
Triacontane
(C30
)
Tokyo
Chemical
(>99%)
342.57 ± 0.16 338.6 ± 0.2 3.97

33
2.4 Chapter Summary
Differential scanning calorimetry provides a quantification of the heat difference
between sample and reference cells over a range of temperature, where the apparatus
generates a thermogram containing information on sensible and latent heat
requirements of the sample as a function of absolute temperature. A µDSC from TA
Instruments was used for this investigation, which was equipped with both ambient and
high-pressure crucibles. Calibration activities were conducted using an aluminum oxide
reference standard provided by the manufacturer, alongside melting point studies for
four paraffinic samples. Calibration for aluminum oxide heat capacity over a
temperature range of -13 to 87 °C indicated an average uncertainty of 2%. Melting point
studies using four different pure paraffinic samples (C16, C18, C20, and C30) were compared
against reference values from Marsh [107], with a maximum uncertainty of 1.2% for C30.

34
CHAPTER 3: SYNERGISTIC HYDRATE INHIBITION WITH
MONOETHYLENE GLYCOL AND ANTI-AGGLOMERANTS
3.1 Introduction
Dispersion stability is a critical parameter that describes capability of hydrate
particles to remain suspended in the liquid hydrocarbon phase without the risk of
agglomeration [20]. Based on the hydrate blockage mechanism for oil-dominated
systems provided in Chapter 1, the aggregation process occurs among hydrate particles
as a result of macroscopic interaction forces between the hydrate particles, with the
potential to result in large-scale particle agglomeration and a large apparent viscosity of
the slurry, which can result in blockage formation inside the pipeline [27]. As such,
assessing hydrate dispersion stability requires consideration of mild-to non-flowing
conditions, such as start-up or shut-down [41, 42].
As the fluid remains static, the emulsion inside the oil-phase is subjected to mass
transfer and continuous temperature changes, which is the result of high heat transfer
to the surroundings while being maintained at high pressure from the gas phase; this
condition provides an appropriate environment for hydrate nucleation at the water-oil
interface [108]. This initial nucleation of hydrate on the surface of water droplets can
result in the formation of a hydrate shell, where unconverted water in the system can
form capillary bridges between hydrate particles [43]; larger capillary bridges result in
larger hydrate aggregates within the system and, as a consequence, decrease the
stability of hydrate-in-oil dispersions [43]. In high-shear oil-dominated pipelines,
considerable hydrate particle agglomeration increases the apparent viscosity of the
slurry; in the limit of a constant momentum driving force available across the flowline,
increases to slurry viscosity can decrease the flowing shear stress applied by the oil
phase on aggregated particles [27], enabling a positive feedback cycle ending in a non-
flowing condition. Quantifying the stability of hydrate-in-oil dispersions is an important
parameter for flow assurance engineers considering the management of hydrate
formation.
35
Various factors contribute to the stability of a hydrate-in-oil dispersions in the
pipeline, including the use of chemical additives. One such example is the application of
under-inhibited MEG, which limits the extent of potential hydrate growth and
guarantees the presence of unconverted water in the system. That is, continuous water
conversion into hydrate particles concurrently increases MEG concentration until it
reaches sufficient concentration for hydrate to “self-inhibit.” As a result, hydrate
particles retain unreacted water – either within the hydrate shell or at the particle
surface – during the hydrate formation period, which can result in higher cohesive forces
between individual hydrate particles. It is expected that, with increases in the amount
of unconverted water, a high degree of hydrate agglomeration may occur that ultimately
reduces hydrate dispersion stability.
Several studies have reported the severity of hydrate agglomeration particularly
in a dynamic and continuous setup [19, 22, 80, 81]. Despite these reported
consequences of hydrate agglomeration, under-inhibited MEG offers potential in
reducing operational expenditure [109] especially for longer pipelines such in a subsea
operation [22]. This is relevant as most of the on-going studies of under-inhibited MEG
are focusing on the involvement of several variables which are yet to be understood,
particularly on the kinetic properties of hydrate formation to MEG concentration.
While the usage of under-inhibited MEG may affect hydrate dispersion stability,
the usage of surfactant compounds, especially AAs, is widely known for minimizing
hydrate agglomeration by increasing contact angle and reducing surface wettability of
individual particles [28, 29]. Corrosion inhibitors such as centrylpyridium chloride (CPC)
and cetyltrimethylammonium chloride (CTAC) have been reported to achieve high
dispersion stability [92] due to their similar chemical character to AAs. Ionic-type AAs,
including QAs, are believed to function by adsorbing at the hydrate-oil interface [110].
However, the effectiveness of ionic surfactant AAs is limited to low and intermediate
watercuts [6], where limited studies with advanced AAs have shown promise with
watercuts above 60% [32].
Previous studies on hydrate dispersion stability have adopted multiple analytical
methods, including NMR [111]. The use of DSC to characterize hydrate formation was
introduced by Dalmazzone, et al. [12], who used a drilling mud to replicate hydrate
formation in a water-in-oil emulsion. This line of research was further extended to the

36
analysis of hydrate dispersion stability in different environments, such as with the co-
formation of ice [40], surfactant-like effects of asphaltenes and AAs [40], corrosion
inhibitors [92] and brine salinity [20]. The versatile and quantitative nature of DSC, as
well as its high repeatability and ability to use small samples, are some of the many
advantages of using DSC to analyze hydrate dispersion stability.
This chapter investigates the capability and reliability of µDSC in analyzing
hydrate dispersion stability, with a specific focus on MEG under-inhibition with and
without the addition of AA additives, for water-in-crude oil emulsion systems. By
studying both chemical additives, the study focusses on whether the addition of AA may
be used to manage free water generated from the under-dosage of MEG. The µDSC was
used to measure the thermogram during hydrate dissociation of a water-in-oil emulsion
with multiple, repeated heating and cooling stages where the sample entered and exited
the hydrate stability region. First, the base case conditions in different crude oil mixtures
were determined, followed by analysis of hydrate dispersion stability with single MEG
or AA dosages. The effect of applying both under-inhibited MEG and AA was then
studied in the µDSC, over the same parameter range, to determine whether the addition
of AA improved dispersion stability. The size of water droplet also was measured using
Nuclear Magnetic Resonance (NMR) techniques in a stable emulsified sample.
3.2 Material and methods
3.2.1 Materials
Three crude oil samples were prepared by mixing Australian heavy and light oils
(by mass fraction) at 40:60, 50:50 and 60:40 ratios. The blended crude oil mixtures were
prepared to generate a continuous-phase viscosity that maintain emulsions with
targeted metastability; specifically, this blend ratio was selected to ensure that, in the
absence of any hydrate inhibitor, a majority of the hydrate formation signal would
disappear within seven heating and cooling cycles. The densities of the crude oil blends
were 0.865 g/ml, 0.845 g/ml and 0.815 g/ml, respectively. Six MEG solutions (1, 3, 5, 7,
10 and 15 wt% with respect to the aqueous phase) were prepared by mixing deionized

37
water with MEG (99.8%, Sigma Aldrich). An industrial AA (Nalco-Champion) was studied
at four different mass fractions (1, 2, 3 and 4 wt% with respect to the aqueous phase).
3.2.2 Emulsion Preparation
A series of twenty-two emulsion samples containing varying fractions of crude oil,
MEG and AA were used in the µDSC. The first set of samples were used to identify a
baseline of blended heavy and light oils. The blend that provided the highest dispersion
stability was then used to prepare samples with different fractions of MEG, AA, and the
combination of both additives. Table 3.1 summarizes the chemical additive fractions
tested with emulsion samples, where all experiments were performed at constant
watercut of 30% for comparative purposes.
Table 3.1 Chemical dosages applied to emulsion samples used for hydrate dispersion
stability anlaysis.
System
Crude oil mixture
(heavy oil: light
oil) (wt%)
MEG
concentration
(wt%)
AA concentration
(wt%)
1. Base case 40:60
50:50
60:40
-
-
2. Effect of MEG 60:40 1, 3, 5, 7, 10, 15 -
3. Effect of AA 60:40 - 1, 2, 3, 4
4. Effect of MEG + AA 60:40 1, 5, 7 1, 2, 3
For the preparation of emulsified crude oil mixtures, a crude oil mixture was
titrated drop-wise with 30% (volume basis) of deionized water while homogenizing both
fluids using a D-91126 Heidolph Silent Crusher M homogenizer. The speed of the
homogenizer was set at 17,000 rpm, and a constant mixing time of five minutes was
used for all systems. The emulsion was then allowed to ripen for at least three hours at
room temperature, after which a sample of the emulsion was then extracted and

38
injected into the µDSC crucibles. A minimum three-hour period for emulsion ripening
was adequate to obtain metastable emulsion, based on visual observation of the sample
bottle. The same procedures were applied for the preparation of emulsions with under-
inhibited MEG, AA and a combination of both additives.
3.2.3 µDSC experimental design
A small droplet of the emulsion was titrated into each µDSC cell, with the weight of the
droplet was maintained between 2 and 5 mg to ensure the continuous oil phase could
be saturated with high-pressure gas within one hydrate formation/dissociation cycle.
The cells were then pressurized to 950 psi using ultra-high purity (UHP) methane gas
(purity of 99.995%, Coregas). Each cell underwent a repetitive four-step cycle: (i) cooling
from 25 to -30 °C at a rate of 1 °C/min; (ii) isothermal hold at -30 °C for one hour to
ensure complete formation of hydrate particles; (iii) heating from -30 to -4 °C at a rate
of 1 oC/min; and (iv) heating from -4 to 15 °C at a rate of 0.07 °C/min. The slow scanning
rate was used during the hydrate dissociation stage to enhance resolution of
thermogram generated in the µDSC, by improving thermal equilibrium during scanning
procedure. The temperature was set to the lowest operating temperature of µDSC at
(i.e. -30 °C) to achieve the highest driving force in hydrate conversion, by shifting the
operating temperature lower than the hydrate equilibrium curve. The desired target
temperatures and rates of heating and cooling were specified through the control
software (MCDSC Run), and a total of seven cycles of cooling and heating processes were
specified for each experiment. Hydrate dissociation curves were observed during
heating cycles for each cycle, depending on the thermodynamic hydrate equilibrium
conditions of the experiment.
3.2.5 Analysing hydrate dispersion stability in µDSC
The dispersion stability of hydrate particles is closely related to the emulsion
stability particularly during the hydrate dissociation stage. The instability of the
emulsion during the startup or shutdown stages causes the emulsion to coalesce when
two or more small water droplets merge upon contact, creating a large, single droplet
[20, 27]. Aman, et al. [20] described in detail the coalescence phenomena during this

39
stage, shown in a schematic diagram of Figure 3.1. During hydrate dissociation, the
“melted” hydrate particles release water and gas. The released gas can generate local
turbulence, inducing coalescence in nearby water droplets and ultimately generating a
larger water droplet size distribution. When re-introduced to the hydrate stability
region, crystal growth on these large water droplets may be limited to an interfacial
thickness of 50 µm, with unreacted remaining trapped inside the hydrate shell [112]. A
stable hydrate dispersion retains the same droplet size distribution, whereas for an
unstable dispersion, the droplet size increases with each successive hydrate
formation/dissociation cycle. As the interfacial thickness of 50 µm does not depend on
the absolute water droplet sizes, this mechanism generates less hydrate in repeated
formation/dissociation cycles, which is detected by the µDSC.
Figure 3.1 Schematic illustrating the µDSC-based investigation of hydrate dispersion
stability, from Aman et al. [20].
Hydrate dispersion stability is determined through the amount of hydrate
dissociated, which is represented by the product of the integrated thermogram and the
enthalpy of fusion. The decreasing trend of hydrate dissociation peaks shows the
decreasing trend of hydrate dispersion stability when an emulsion is subjected to a
series of hydrate formation and dissociation stages. Figure 3.2 illustrates an example of
hydrate dissociation curves at MEG 1 wt% for all seven repeated hydrate formation and
dissociation cycles. The temperature was set to the maximum of 15oC to ensure that
hydrate particles were fully dissociation and to avoid hydrate memory effect in the
subsequent cycle of hydrate formation.

40
Figure 3.2 Different trends of hydrate dissociation curves indicating dispersion stability
of the emulsion, in the above example is a case at MEG 1 wt%, where hydrate
dissociation curves formed at 9oC before the sample was heated to the maximum
temperature at 15oC.
In each cycle, the area underneath hydrate dissociation curve represents the
total amount of heat released, based on the specified heating rate and the weight of
sample added in µDSC. In this experiment, the heat released was determined using
Nanoanalyze (version 3.6.0) and it is linear to the weight of sample. For determining the
total amount of heat released per weight of sample, the value of integrated heat
released was divided by the weight of sample. The value of the integrated area from
each scan was normalized against the first scan of the hydrate dissociation curve. In the
example shown in Figure 3.2, Scan 1 indicates the largest integrated area of hydrate
dissociation curve while the next cycle (Scan 2) shows slight reduction in its integrated
area. Therefore, the normalized values of the integrated area was calculated by dividing
the total heat released in each cycle to the total heat released in the first cycle (Scan 1).
The results considered the the maximum dispersion stability achieved in each case,
indicated by a minimum change of average normalized dispersion stability between the
first scan (Scan 1) and the final scan of the hydrate dissociation stage (Scan 7).

41
3.2.6 Analysing water droplet sizes of a water-in-oil emulsion using NMR
The purpose of this measurement is to analyse the initial droplet sizes of
emulsions before the sample was subjected to a series of hydrate formation and
dissociation events. This measurement allows the correlation of hydrate conversion
with mean emulsion droplet size. In this study, NMR Pulse Field Gradient (PFG) method
was used to determine emulsion droplet size distribution of a water-in-oil emulsion.
Figure 3.3 shows an example of emulsion droplet size distribution measured using NMR
PFG technique, with comparison to the optical confocal microscopic technique [113].
Figure 3.3 Emulsion droplet size distribution as measured using NMR PFG techniques
and as measured using optical confocal microscopy, in the above example is for 40 wt %
toluene in water emulsion stabilized with Tween 80 [113].

42
Unlike other experimental methods of determining emulsion droplet sizes
(specifically optical microscopy), measurement of droplet sizes using NMR offers a few
advantages as the method is non-invasive, does not require any sample manipulation
and is not limited by the physical properties of the sample (most relevant to samples
with poor opacity [1]). Optical microscopy typically requires the emulsion sample to be
diluted to a droplet concentration of, at most 1-2 vol % for quantitative droplet size
distributions to be produced; optical microscopy can only be applied to a small total
sample size, which is typically six orders of magnitude smaller than that analyzed by
NMR, thus introducing uncertainty due to sample variability [114, 115].
For the systems studied herein, the mean water droplet size was captured on a
benchtop magnetic resonance instrument. Detailed specifications of the hardware and
steps required for determining droplet size distribution of an emulsion were explained
by Ling, et al. [114]. It consists of a 1 T Halbach array permanent magnet and a 5 mm
inner diameter of coil tuned to 1H resonance of 40 MHz. This arrangement of magnet
provides a homogenous magnetic field such that chemical resolution of the water and
oil is clearly distinguished. A custom-built gradient coil with maximum strength of 1 T/m
was used for all PFG diffusion experiments. This arrangement was carried out using a
Kea2 spectrometer using the software package, Prospa.
For the preparation of water-in-oil emulsion samples, the homogenization steps
which have been previously explained were carried out in a constant 30% water cut until
a stable, visually homogeneous emulsion was realized. This remained stable for at least
three hours, at which point, a sample of the emulsion was extracted using a syringe and
added into a 5 mm outer diameter NMR glass tube. A set of emulsion samples were
prepared for this measurement: three blended crude oil mixtures at 40:60, 50:50 and
60:40 weight ratio of heavy to light oils, MEG concentrations at 1, 7 and 10 wt%, AA
concentrations at 1 and 3 wt% and a set of combinations between MEG 7 wt% with AA
1 and 3 wt%. These samples selectively represent a range of dosages in each cases tested
in the analysis of hydrate dispersion stability.

43
3.3 Results and Discussion
3.3.1 Base case hydrate dispersion stability for blended crude oils
The baseline was determined using three different mixtures of heavy and light
oil at 60:40, 50:50 and 40:60 by mass fraction. Figure 3.4 indicates the seventh-cycle
hydrate dispersion stability for a 30% deionized watercut emulsion in all three oil blends.
The results showed unique hydrate dispersion stability behaviour the oil blends, with
seventh-cycle stability of 22, 37 and 55% for the 40:60, 50:50, and 60:40 blends,
respectively. Figure 3.5 summarizes hydrate dispersion stability in three different crude
oil mixtures at the seventh cycle of hydrate formation-dissociation.
Figure 3.4 Hydrate dispersion stability at each cycle of hydrate formation-dissociation of
three different crude oil mixtures in heavy to light oil ratio (in weight percentage). The
data presented are the mean value of three repeated measurements at a 95%
confidence interval.

44
Figure 3.5 Hydrate dispersion stability of different crude oil mixtures at Cycle 7. The data
presented are the mean value of three repeated measurements at a 95% confidence
interval.
In the absence of chemicals and additives that may enhance the stability of
hydrate dispersions, the above result is a consequence of both the continuous phase
viscosity and the presence of natural surfactants available in crude oil such as
asphaltene, resins and carboxylic acids. These components have a role in reducing
interfacial tension of water inside a crude oil [30]. The adsorption of natural surfactants
on a water-oil interface can generate hydrophobic behaviour [45], which minimizes
coalescence during hydrate dissociation stage.
To identify whether there is involvement of these components in the previous
results, additional measurements of interfacial tension (IFT) were recorded using the
pendant drop method on a ThetaLite tensiometer at ambient pressure and room
temperature, for the three different crude oil blends with deionized water. Experiments
were conducted for 8000 seconds for five repeated data (0.06 frame per second) to
estimate the equilibrium IFT. The observed difference in surface tension between the
three crude oil blends was relatively small, with 20.9±1.7 mN/m, 18.4±0.6 mN/m and
20.4±2.1mN/m (95% confidence interval) for 40:60, 50:50 and 60:40 oil blends,
respectively.

45
The minor variation of interfacial tension is unlikely to explain the observed
deviations in hydrate dispersion stability, which may instead be the consequence of a
higher continuous phase viscosity associated with the heavier crude oil. The 60:40 blend
condition was selected for analysis with injection chemicals (MEG and AA), with a
working assumption that the addition of MEG would function to destabilize the system.
3.3.2 Dispersion stability with under-inhibited MEG
Using the 60:40 oil blend described above, a set of water-in-oil emulsion samples
was prepared by homogenizing the crude oil mixture with six different MEG fractions (1,
3, 5, 7, 10 and 15 wt% with respect to water). Figure 3.6 represents hydrate dispersion
stability at the seventh cycle for different under-inhibited MEG conditions.
Figure 3.6 Hydrate dispersion stability at Cycle 7 for different fractions of under-
inhibited MEG (1, 3, 5, 7, 10 and 15 wt%), in the 60:40 blended oil. The data presented
above are an average of three repeated measurements at 95% confidence. The inset
pane was reported by Hemmingsen, et al. [19] and Li, et al. [80] to inform the effect of
MEG on hydrate plug potential in a flow wheel apparatus.
The above results agree with the trend reported both by Hemmingsen, et al. [19]
and Li, et al. [80], which considered hydrate plugging “potential” in a flow wheel system;
in this comparison, a lower hydrate dispersion stability is expected to be associated with
higher plugging “potential” in the oil phase, based on the blockage mechanism

46
described above. The µDSC results show hydrate dispersion stability monotonically
decreased from 3 to 10 wt%, which may correspond to the red region of the inset plot
in Figure 3.6; that is, the destabilization of a hydrate dispersion, and corresponding
generation of free water, agrees with the “higher degree of agglomeration” observation
reported by Hemmingsen, et al. [19] and Li, et al. [80]. The significant hydrate dispersion
stability observed in the µDSC for 1 to 5 wt% MEG further agrees with the intermediate
hydrate plug “potential” reported by Hemmingsen, et al. [19] and Li, et al. [80]. The
minor increase in hydrate dispersion stability observed at 3 wt% MEG may correspond
to surfactant-like effects of the glycol; that is, the MEG may function like a poor AA at
very low concentration, ultimately stabilizing the hydrate dispersion.
3.3.3 Dispersion stability with AAs
Four additional studies were performed to characterize the impact of AAs on hydrate
dispersion stability at 1, 2, 3 and 4 wt% (with respect to the aqueous phase). Figure 3.7
depicts hydrate dispersion stability in Cycle 7 when the water-in-oil emulsion for each
AA fraction, with a typical industrial dosage corresponding to between 2 and 3 wt%.
Figure 3.7 Hydrate dispersion stability at Cycle 7 for different AA fractions (1, 2, 3 and 4
wt% with respect to water), compared to the base case for the 60:40 oil blend; each
data point represents three repeated measurements at 95% confidence.

47
Figure 3.7 indicates that AA fractions above 1 wt% improved dispersion stability
compared to the base case, with the highest stability (90%) observed at 4 wt% AA
(compared to 55% for the base case). These results are consistent with industrial
performance, as commercial ionic surfactant AAs are designed to generate stable
dispersions. The results illustrate a minor improvement of 3% in the seventh-cycle
stability as the AA fraction increased from 3 to 4 wt%, which suggests the µDSC may be
a tool well-suited to the identification of minimum effective dosage for industrial
qualification.
Previous findings have reported usage of large-volume instruments related to
the usage of AA such as rocking cells [26, 31, 32, 115] and autoclaves [39, 116-118]. The
results illustrate that the AA reached its maximum potential effect at 3 wt%, which
would conventionally be identified using a set of large-volume rocking cell or autoclave
systems, where a cumulative sample volume between 1 and 10 litres may be required.
In the limit that only high-value wireline samples are available from prospective oil
reservoirs, the above-described µDSC method could provide an indication of minimum
dosage requirements for AA with less than one hundredth of the sample volume
requirement. Moreover, this method allows for repetitive and consistent measurement
of hydrate dispersion stability using a small-volume wireline sample.
3.3.4 Synergistic inhibition with AA and under-dosed MEG
To test the potential synergistic action of under-dosed MEG and AA in hydrate
inhibition, three different fractions of MEG (1, 5 and 7 wt%) and AA (1, 2 and 3 wt%)
were tested across a matrix, using the same 60:40 oil blend studied previously with 30%
watercut. Figure 3.8 shows hydrate dispersion stability of these combinations at the
seventh cycle of hydrate formation. Results for the hydrate dispersion stability at AA (1,2
and 3 wt%) which was presented earlier in Figure 3.7 are included in this figure.

48
Figure 3.8 Hydrate dispersion stability at Cycle 7 for samples containing both MEG and
AA; all mixtures were tested in the 60:40 oil blend with 30% watercut. The data
represent an average of three measurements at 95% confidence.
The results presented in Figure 3.8 show that, at 1 wt% MEG, the highest
dispersion stability in the seventh hydrate formation-dissociation cycle was observed for
3 wt% AA, corresponding to 91% . This data set follows the same trend observed
previously (Figure 3.7) for MEG-free systems containing AA, where the dispersion
stability increased monotonically with AA addition from 1 to 3 wt%. On the other hand,
the presence of free water was expected with 5 and 7 wt% MEG in the system, based on
the dramatic decrease in hydrate dispersion stability reported in Figure 3.6. At 5 wt%
MEG, hydrate dispersion stability in the base case (without AA) was recorded at 20%,
which increased to 60 % with 1 wt% AA; no statistically significant improvement in
hydrate dispersion stability was observed at higher AA dosages of 2 and 3 wt%. In
contrast, no improvement in hydrate stability recorded in the third set of combinations
at MEG 7 wt%, under all three different AA concentrations. These results suggested that
the presence of free water in 5 wt% MEG could be possibly counter-balanced by a
minimum concentration of AA at 1 wt% but as the amount of free water increased at
MEG 7 wt%, this combination gave no different in hydrate dispersion stability at any AA
concentration.

49
Despite variations in observed behaviour for 5 and 7 wt% MEG (giving rise to
large uncertainty bounds), the increase of hydrate dispersion stability recorded at 1 wt%
AA suggests that this dosage condition may be appropriate to support under-dosed MEG
systems. Above 1 wt%, the addition of AA may result in more complex behaviour, such
as micelle formation [27], that prevents the additive from balancing the destabilizing
effect of under-dosed MEG.
3.3.5 Initial size of water droplet in a water-in-oil emulsion
Figure 3.9 (a) shows the resultant water-in-oil emulsion droplet size distributions
for emulsion formed with three different crude oil blended at 40:60, 50:50 and 60:40 of
heavy oil and light oil respectively. The three samples show relatively small change in
water droplet diameter, ranging from 2.8 to 2.6 µm, as shown in Figure 3.9 (b). This
measurement is consistent with the previous findings in regard to interfacial tension
where the results indicated no variation in interfacial tension measurement.

50
Figure 3.9 (a) Droplet size distribution measured via low-field NMR and (b) mean
emulsion droplet diameter for three different crude oil mixtures.
Considering a crude oil blending of heavy oil and light oil at 60:40 mass ratio as
a base case, a comparison of emulsion droplet sizes for three different MEG
concentrations of 1, 7 and 10 wt% relative to water content was conducted, as
illustrated in Figure 3.10 (a). The results indicated that the variation of emulsion droplet
size was recorded at 1.8-1.6 µm for the MEG concentrations of 1, 7 and 10 wt%. This
outcome may be contributed by the minor change in IFT at different MEG
concentrations which was recorded at 22.11±0.4 mN/m, 21.57±0.2 mN/m and
21.37±0.8 mN/m, for 1, 7 and 10 wt% MEG concentrations, respectively. Therefore, the
(a)
(b)

51
overall small variation of emulsion droplet size with MEG content, and thus small
variation in droplet surface area, suggests that a consistent rate of hydrate formation
would be expected when formed from these respective emulsion systems.
Figure 3.10 (a) Droplet size distribution measured via low-field NMR and (b) mean
emulsion droplet size at three different MEG concentrations.
On the other hand, the observation of emulsion droplet at two concentrations
of AA at 1 and 3 wt%, presented in Figure 3.11, showed increasing emulsion droplet sizes
relative to the base case. The mean diameter of emulsion droplet size increased fourfold
relative to the base case, with the highest recorded at AA 3 wt% (8.1 µm). Similar
observations were recorded for the combination of MEG and AA, as presented in Figure
3.12 for the combination of MEG at 7 wt% with the AA at 1 and 7 wt% respectively.
(a)
(b)

52
Figure 3.11 (a) Droplet size distribution measured via low-field NMR and (b) the mean
diameter of emulsion droplets at three different AA concentrations.
(a)
(b)

53
Figure 3.12 (a) Droplet size distribution measured via low-field NMR and (b) the mean
diameter of emulsion droplets for a system containing a combination of 7 wt% MEG and
two different AA concentrations.
The results presented in Figure 3.11 and 3.12 show the unexpected outcomes
of droplet size increasing with AA (nominally a surfactant) addition, where the reverse
would be expected as surfactants adsorb to the water-oil interface lowering the system
interfacial tension [8]. However, in some cases, the functionality of AA for minimizing
hydrate agglomeration may not necessarily result in the formation of an emulsion for a
water-oil system [119]. Many commercial AAs are often emulsifiers by type, but these
(a)
(b)

54
may also interact antagonistically with natural surfactants in the crude oil to destabilise
some emulsions [120], which is consistent with the observations above.
Comparing these results with the earlier data on the hydrate dispersion
stability (Figure 3.6-3.8), there is a similar trend between the initial diameter of water
droplets and the stability of hydrate dispersion at the seventh cycle of hydrate
dissociation stage. This was observed in three selective cases of under-inhibited MEG,
AA and the combination of MEG and AA, as illustrated in Figure 3.13.
In the first case at MEG 1, 7 and 10 wt%, a downward trend was observed at
higher MEG concentration. Although there was a slight difference between the base
case and MEG 1 wt% in the hydrate dispersion stability, the overall trend indicated major
reduction in both parameters. In contrast, a drastic increase in the diameter of water
droplet at AA 1 and 3 wt% generated similar upward trend in the hydrate dispersion
stability. In the third case where MEG 7 wt% was combined with AA (1 and 3 wt%),
comparable trend in both parameters was recorded with a sharp increase at AA 1 wt%
before a slight decreased at AA 3 wt%.
The analysis of hydrate dispersion stability in µDSC was based on the
destabilization of melted hydrate particles that coalesced and formed large water
droplets during hydrate dissociation stage. Based on the example of a gradual change in
hydrate dissociation curves in Figure 3.2, the diameter of water droplet is expected to
increase at the final stage of hydrate dissociation. Therefore, the comparable trends
between the initial diameter of water droplets and the hydrate dispersion stability
suggested a consistent change in the size of water droplets in a series of hydrate
formation and dissociation stages, with respect to the initial size of water droplet and
its represented conditions.
These observation may be attributed primarily by the presence of surface
active material at the interface (originating from the crude oil or synthetic injection
chemicals), which functions to minimise probability of coalescene upon contact. In
addition, the usage of under-inhibited MEG, as pointed earlier, might function as a poor
surfactant and maintain the size of water droplet.

55
Figure 3.13. Comparison between mean initial diameter of water droplet and dispersion stability at the seventh cycle for three different cases

56
3.3.6 Mechanism of hydrate dispersion stability
Hemmingsen, et al. [19], Li, et al. [80] have explained the physical mechanism of
hydrate formation for under-inhibited thermodynamic inhibitors (MEG and methanol).
Initially, hydrate nucleation takes place at the water-oil interface, typically at the surface
of water droplets in oil-dominant systems. For a system with no thermodynamic hydrate
inhibitor, complete hydrate conversion may take place at this interface, but may be
limited by the mass transfer of pressurized methane gas as the hydrate shell continues
growing [121]. Severe mass transport limitations arise when water droplets grow
beyond 100 microns [20], whereby continued conversion requires diffusion of gas and
water across the crystal shell. In contrast, for the partial hydrate conversion, un-
converted water surrounding hydrate shells produces capillary bridges that bind
individual particles and ultimately increase inter-particle cohesive force, resulting in high
slurry viscosity and blockage tendency.
By representing hydrate aggregates as wetted granules, the physical state of the
aggregates could be represented by the ratio of liquid to solid known as liquid
saturation, whether in pendular, funicular, capillary or droplet [19] as illustrated here in
Figure 3.14 (a). The liquid saturation of hydrate aggregates determines the inter-particle
force exerted by the capillary bridges, with higher cohesive force arising at higher
degrees of liquid saturation (Figure 3.14 (b)). As the amount of liquid is increased beyond
the capillary stage, the cohesive strength of the aggregates decreases rapidly as the
amount of saturation liquid increases.

57
Figure 3.14 (a) Different states of wetted granules: a) pendular, b) funicular, c) capillary,
and d) droplet. (b) relationship between cohesive (tensile) strength (σt) as a function of
different saturation states [19].
These explanations could be used to interpret the experimental results obtained
above for MEG 1-15 wt%. Based on the initial diameter of droplet in the water-in-oil
emulsion for MEG at 1, 7, and 10 wt% (Figure 3.10), the average size of droplet was
recorded at 2 µm in all cases. In this high ratio of surface area to the volume of water
droplets, it was expected that consistent hydrate conversion could take place in all
cases. However, the conversion of hydrate may be limited by the different MEG
concentration tested in each case. As the water was converted to hydrate shells, the
concentration of thermodynamic inhibitor in the aqueous phase increased until it
changed the hydrate thermodynamic equilibrium temperature, up to the point where
water was no longer converted into hydrate at the given temperature and pressure.
Connecting these explanations further to the results of hydrate dispersion
stability (Figure 3.6), the increasing trend in hydrate dispersion stability shown in the
first group of MEG concentrations at 1-3 wt% might indicate that nearly complete
hydrate conversion was achieved in this condition, with minimal residual (inhibited)
water. The high molar ratio of the water to the MEG in the diluted MEG concentration,
as well as the small size of water droplets, may have allowed for full conversion of water
into hydrate before the hydrate equilibrium temperature was reached. This in return
reduced the excess water surrounding hydrate particles at low liquid saturation, which
eventually led to high dispersion stability and severe aggregation (consistent with flow
(a)
(b)

58
wheel results). On the other hand, the second group of MEG concentrations at 5-15 wt%
indicated a sharp decrease in hydrate dispersion stability due to partial hydrate
conversion and a moderate extent of (inhibited) unconverted water, despite the small
droplet size observed. As a result, large capillary bridges formed within hydrate particles,
which led to higher degree of agglomeration and poor dispersion stability. However, in
the limit that MEG concentration was increased to 30 wt% or higher [80], a large extent
of unconverted water is expected to saturate hydrate particles (potentially also forming
a free phase), generating a wetted slurry with diminishing capillary bridge capacity, thus
reducing the extent of hydrate agglomeration.
For systems containing AAs, the high stability attained may be attributed to by
the absorption of crude oil or synthetic materials at the oil-water interface [28]. The AA
has both a lipophilic head and a hydrophilic tail, similar to the range of natural surface
active materials found in crude oil, which may interact with suspended water droplets
to reduce wettability [27, 28]. During the hydrate formation stage, excess surface active
material at the water-oil interface may inhibit the growth of hydrate and/or coalesence
of water droplets [40]. Upon dissociation, the methane released from hydrate particles
may rupture the interface, enabling droplet coalescence and reducing the apparent
dispersion stability under certain conditions.
Considering these two cases for the combination of under-inhibited MEG and
AA, the presence of a capillary bridge that formed under the application of under-
inhibited MEG may be hindered by the adsorption of surface active material to the
water-oil and/or hydrate-oil interface, thereby affecting particle wettability. In this limit,
a multi-phase interaction among hydrate, water and oil phases formed a complex
surface free energy landscape that changes during hydrate formation and dissociation.
Anklam, et al. [28] proposed several factors which may influence the effectiveness of
anti-agglomerants: (1) reducing size of hydrate particles by reducing size of droplet in
water-in-oil emulsion; (2) decreasing interfacial tension between water and oil in such a
way that it reduces the strength of a capillary water bridge between hydrate particles;
and (3) modifying surface wettability of hydrate particles by increasing contact angles.
Focusing on the aspect of interfacial tension and (by extension) wettability, the capillary
force experienced between hydrate particles is proportional to the interfacial tension
between the liquid bridge and in the continuous oil phase [27]. Therefore, in the
59
thermodynamic limit of a minimal liquid water bridge, a decrease in the interfacial
tension might also decrease the capillary forces between hydrate particles, thereby
minimizing the tendency toward hydrate agglomeration.
The above explanation supports the outcomes presented in Figure 3.8. This was
shown by large uncertainty observed at MEG 5 and 7 wt% in all tested AA fractions
tested (1, 2, and 3 wt%). As the large extent of unconverted water was expected in these
two MEG concentrations, this condition decreased the stability of hydrate dispersions
formed in the presence of synthetic surfactants. In contrast, the results obtained with
MEG 1 wt% indicated an increase in hydrate dispersion stability when added with AA 1,
2, and 3 wt%, in which there would be less or no water capillary bridge which could
hinder the stability contributed by the adsorbed surfactants.
3.4 Chapter Summary
Potential synergistic hydrate inhibition of under-inhibited MEG and AA was
evaluated to determine whether AA could stabilize hydrate dispersions that would
otherwise have been destabilized by the under-dosage of MEG. Experimental work was
carried out using µDSC to quantify the change in dispersion stability after seven repeat
hydrate formation and dissociation stages.
The first set of results for different crude oil blends showed significant variations
in the seventh-cycle stability. Water-oil IFT was confirmed to be consistent between the
blends, suggesting that the improved stability for the 60:40 blend was likely the
consequence of higher continuous phase viscosity; this blend, at 30% watercut, was
used to then study the addition of under-dosed MEG and/or AA on the dispersion
stability.
In the second set of experiments, under-inhibited MEG fractions between 1 and
15 wt% (with respect to water) illustrate that the dispersion destabilized monotonically
from 3 to 10 wt% MEG addition. These results agreed with the general trends reported
by Hemmingsen, et al. [19] and Li, et al. [80], which were collected on a flow wheel. The
results indicate that the free water formation generated by under-dosing MEG may
participate in the agglomeration process, generating higher hydrate blockage
“potential” (from Hemmingsen and Li) and poorer dispersion stability (characterised in

60
this thesis). Ultra-low MEG dosages between 1 and 3 wt% suggested a minor
improvement to dispersion stability, which may be the consequence of surfactant-like
behaviour from the glycol. As expected, the addition of between 1 and 4 wt% AA
resulted in stable hydrate dispersions, with the effective dosage expected between 2
and 3 wt% AA for the system tested; results collected with AAs suggest the µDSC may
be a suitable first-pass qualification apparatus to identify the minimum effective dosage
of AA in field applications, in preference to large-volume rocking cells or autoclaves.
Following the above analysis, the matrix of synergistic inhibition trials generally
showed improvement in hydrate dispersion stability as the AA fraction was increased at
three under-dosed MEG fractions. At 1 wt% MEG, an increase in hydrate dispersion
stability was observed as the AA fraction increased from 1 to 4 wt%, which may be the
consequence of minimal unconverted water in the system. However, adding AA to
systems under-dosed with either 5 or 7 wt% MEG resulted in only minor improvements
to dispersion stability, stability observed at 1 wt% AA did not improve from 2 to 4 wt%
AA. These findings suggest that the hydrate blockage risk in under-dosed MEG systems
may be partially managed by the minor addition of AA (1 wt%), but may not be fully
stabilized by higher AA dosages.
NMR measurements for the initial size of droplet in a stable water-in-oil
emulsion showed unexpected enlargement for the size of water droplet in a system
containing AA (with and without combination of MEG), with the mean diameter in this
system recorded at 8-12 µm; this value was approximately four times larger than the
base case. This observation might be contributed to by the presence of surface active
materials at the water-oil interface from natural and/or synthetic sources, which
reduces both emulsion and dispersion stability. Large initial diameters of water droplet
were found to correspond with a high degree of apparent dispersion stability in all three
chemical scenarios: MEG, AA, and the combination of MEG and AA. The presence of
surface active materials (from synthetic or natural sources) in the emulsified sample
might contribute to this observation, where an excess of surface material may both
prevent water droplets from coalescing and hydrate particles from aggregating.

61
CHAPTER 4: EFFECT OF MEG ON PARAFFINIC CLOUD POINT
4.1 Introduction
The cloud point represents the phase boundary below which wax molecules are
unable to remain soluble in the liquid hydrocarbon phase [65, 122]. In a simple binary
mixture consisting of a solute and a solvent, a complete liquid phase solution represents
a system with a well-dissolved solute (the wax component, in this case); upon
crystallization, the solute becomes immiscible in the solvent and precipitates as a
secondary, solid phase [123] while the solvent remains in the liquid phase. This latent
heat transition can be captured using the µDSC, where the extent of solidification can
be estimated with a knowledge of the component’s heat of fusion.
Previous research has identified several important factors that determine the
cloud point in complex crude oil and condensate systems [93, 124]. For example,
increasing gas pressure in a crude oil or condensate may affect the solubility of wax
components, and subsequently affect the measured cloud point; light hydrocarbon
gases such as methane and ethane can reduce the WAT, whereas largely insoluble gases
like nitrogen can increase the WAT [64, 96, 125]. Injecting CO2 in a crude oil provides a
similar effect to that of light hydrocarbon gases, in which WAT decreased significantly
as a result of improved wax solubility [74]. However, the dependence of WAT on gas
pressure is minor when compared with temperature, and the effect is often neglected
when considering industrial applications [126, 127].
The importance of solubility in wax precipitation is more relevant in the context
of liquid-liquid interaction compared to liquid-gas interaction, particularly in the case
that chemical additives are injected in the flowline. Alcazar-Vara and Buenrostro-
Gonzalez [93] reported a variation of WAT when different aromatic solvents were added
to a binary mixture of hexatriacontane (C36) and n-decane (C6). In a case where xylene
was added to the mixture, the measured WAT was lower than the original mixture due
to the aromatic structure of xylene that decreased crystal network ordering during the
solidification process. In contrast, when a less aromatic solvent of 1-phenyldodecane
was added at a similar dosage, a higher WAT was observed as a result of the aliphatic
chain (12 carbon atoms) creating more order in the paraffinic crystal network.

62
The above explanations are relevant to components that are soluble in a
hydrocarbon fluid. However, in a real pipeline environment, hydrocarbon fluid exists
with aqueous phase generated by condensed and reservoir water, where other water-
soluble additives may also have been injected in the pipelines; in these systems, liquid
hydrocarbon and aqueous phases often coexist in transit. The addition of chemicals and
additives affect the cross-solubility of components between the phases, which may
affect the hydrocarbon phase cloud point. One of example is the addition of MEG, which
has previously been discussed as a primary anti-freeze agent for hydrate prevention in
Chapter 1.
Since the anti-freeze effect of MEG injection scales directly with the amount
added, large quantities of MEG are used in most long tiebacks, where operators
continue to focus on methods by which the extent of MEG injection may be reduced for
cost savings [17, 22]. The injected MEG solutions are not miscible with a hydrocarbon
phase, and can either flow as a secondary liquid phase (typically in a stratified or slugging
flow regime) or as an aqueous emulsion that is transported by a liquid hydrocarbon
phase. In both conditions, the long residence times associated with subsea transport
suggest that the phases will readily reach an equilibrium condition, whereby a limited
amount of MEG will be dissolved in the hydrocarbon phase. In considering both this
dissolved MEG content and the interfacial contact between hydrocarbon liquid and the
MEG solution, there remains an outstanding question as to the effect of MEG injection
on hydrocarbon cloud point.
Studies involving MEG and pure or multicomponent hydrocarbon systems have
focussed on liquid-liquid equilibrium (LLE) analysis, particularly for the understanding of
component exchange between the hydrocarbon and aqueous phase [128, 129]. Among
essential findings in these studies is the solubility difference between MEG solutions and
different hydrocarbon compounds, for either linear components like hexane (C6), or
aromatic components like toluene [130, 131]. Toluene has greater solubility in a MEG
solution than C6 by a factor of 100 at the same concentration and temperature [132].
These findings might be the consequence of the aromatic pi cloud of toluene, the
enhanced dipole moment of which can promote hydrogen bonding strength by a factor
of two [133]. The presence of MEG in the hydrocarbon phase could potentially alter WAT
and/or WDT through the adjustment of wax solubility in which MEG acts as an additional

63
component in the phase. However, no studies have been done to test this assumed
effect on cloud point.
Considering systems with large MEG dosages and a tendecy toward wax
precipitation in long tiebacks, there is a need to test the effect of MEG on the cloud point
of hydrocarbon compounds for two-phase systems. This motivation is relevant, as the
outcomes from previous solubility studies indicated possible solubility changes of
hydrocarbon compounds in the presence of MEG. However, there are no specific studies
conducted concerning the impact on cloud point. This thesis aims to deploy the µDSC to
test effect of a secondary MEG phase on hydrocarbon cloud point by using two binary
mixtures of C6 or toluene with octadecane (C18). Based on the range of conditions
expected for subsea pipelines, the effects of MEG dosage rate, watercut, and heavy
hydrocarbon content are most relevant to the measurement.
4.2 Materials and method
4.2.1 Materials
Two binary mixtures were prepared gravimetrically by mixing C18 (Sigma Aldrich,
purity at 99%) with two different solvents: C6 (Sigma Aldrich, purity more than 97%) and
toluene (Sigma Aldrich, HPLC grade with purity more than 99.9%) at molar ratios of
58:42 and 60:40, respectively. Additionally, for the analysis of cloud point at different
ratios of solute and solvent, two different molar ratios of toluene+C18 were prepared at
30:70 and 80:20.
Separately, a set of MEG solutions (10, 20, 40, 60 and 80 wt% in water) were
prepared by mixing ethylene glycol anhydrous (purity more than 99% by Sigma Aldrich)
with deionized water. All chemicals were used without any additional purification steps.

64
4.2.2 Homogenization procedures for immiscible mixtures
The binary mixtures were homogenized with MEG solution using a D-91126
Heidolph Silent Crusher M homogenizer. During the homogenization stage, each sample
was prepared in a 100 ml bottle that was able to fully submerge the homogenizer blades.
Depending on a required watercut, the volume for MEG solutions was set to between
10 and 80 ml for each sample. During homogenization, the MEG solution was titrated
drop-wise at 5,000 RPM until the sample was fully loaded; this step ensured that the
MEG solution was fully mixed. The speed of homogenizer was then increased to 15,000
RPM and maintained for 5 minutes. Due to the immiscibility of the MEG solution in the
liquid hydrocarbon phase, two separated liquid layers were formed, with the
hydrocarbon layer at the top and a MEG-rich aqueous layer at the bottom; the viscosity
of both phases was less than 1 cP, such that no emulsion was formed during
homogenization. After completing the homogenization step, a sample from the
homogenized liquid was extracted immediately (i.e. prior to primary phase separation)
and loaded in each crucible of the µDSC. That is, the µDSC cells contained both a MEG-
rich aqueous phase and a hydrocarbon liquid phase, to mimic the expected behaviour
of the industrial system.
Specifically for toluene+C18 at 30:70 molar ratio, the homogenization stage was
conducted by submerging part of a test bottle in a warm water bath (temperature of the
water bath was between 40-45 oC) due to the possibility of the mixture forming
precipitated wax close to its predicted cloud point near the room temperature.
4.2.3 Experimental setup and method for determining cloud point from a
thermogram generated in µDSC
Each crucible was filled with a sample of homogenized liquid with a mass
between 300 and 400 mg. The sample was heated up from room temperature (25 °C) to
30 °C and maintained isothermally for at least 15 minutes to ensure the sample was
completely free from any precipitated wax. The sample was then cooled to 0 °C at a scan
rate of 0.5 °C/min and maintained isothermally for 30 minutes before being heated to
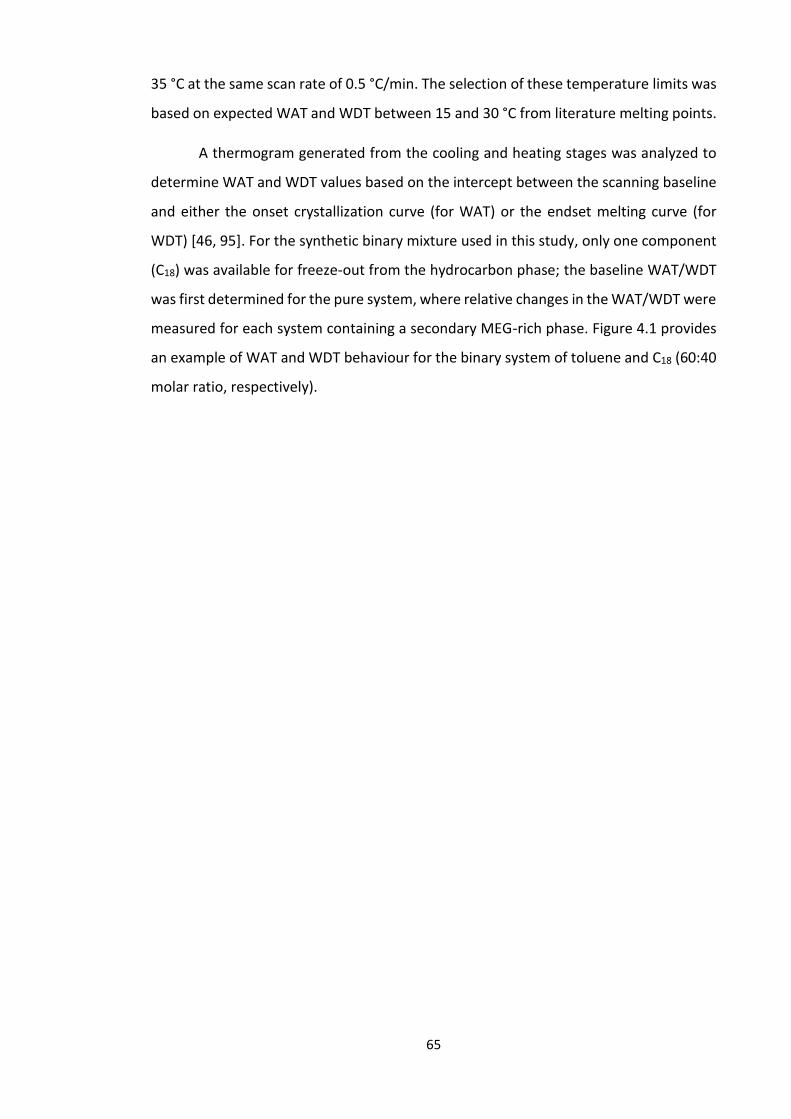
65
35 °C at the same scan rate of 0.5 °C/min. The selection of these temperature limits was
based on expected WAT and WDT between 15 and 30 °C from literature melting points.
A thermogram generated from the cooling and heating stages was analyzed to
determine WAT and WDT values based on the intercept between the scanning baseline
and either the onset crystallization curve (for WAT) or the endset melting curve (for
WDT) [46, 95]. For the synthetic binary mixture used in this study, only one component
(C18) was available for freeze-out from the hydrocarbon phase; the baseline WAT/WDT
was first determined for the pure system, where relative changes in the WAT/WDT were
measured for each system containing a secondary MEG-rich phase. Figure 4.1 provides
an example of WAT and WDT behaviour for the binary system of toluene and C18 (60:40
molar ratio, respectively).

66
Figure 4.1 Thermograms generated for cooling and heating stages of toluene+C18 (60:40
molar ratio). WAT was determined from the intercept between the baseline and onset
crystallization curve (Figure 4.2 (a)), while WDT was determined from the intercept
between the baseline and endset melting curve (Figure 4.2 (b)).

67
4.2.4 Experimental workflow
Variations in cloud point were measured for a range of samples containing the
binary hydrocarbon mixture and different MEG solutions. The first step requires
verification of original cloud point for each prepared binary mixture: one sample of
C6+C18 at 58:42 molar ratio, and three samples of toluene+C18 at molar ratios of 20:80,
60:40 and 80:20. This step was carried out by comparing either their available
experimental data or predicted cloud point obtained from thermodynamic software; in
this study, Multiflash (6.2) was used to predict cloud point by using the in-built freeze
out model associated with the Advanced Peng Robinson (APR) equation of state.
A series of experiments were then conducted with the presence of different MEG
solutions at different watercuts, across the range of binary hydrocarbon mixtures
selected. The first set of experiments focussed on homogenizing the binary hydrocarbon
mixtures with varying fractions of MEG at constant watercut. Any combination that
generated the highest changes of WAT and/or WDT was then taken as a target system
for the next set of studies. In the second traunch of measurements, binary mixtures
were homogenized at different watercut while maintaining the MEG dosage rate
constant.
In the final set of tests, a binary mixture of toluene+C18 that gave the highest
differences in WAT and/or WDT values in the first two traunches of the study was
evaluated with different molar ratios in the hydrocarbon phase. Two additional binary
mixtures were prepared gravimetrically, with each mixture representing the lowest and
highest molar ratio of solute to solvent, in this case for 30:70 and 80:20. These binary
mixtures were tested at a MEG fraction of 80 wt% and a watercut 50%. Table 4.1
summarizes chemical and watercut specifications for C6+C18 and toluene+C18 systems
across the three experimental campaigns.
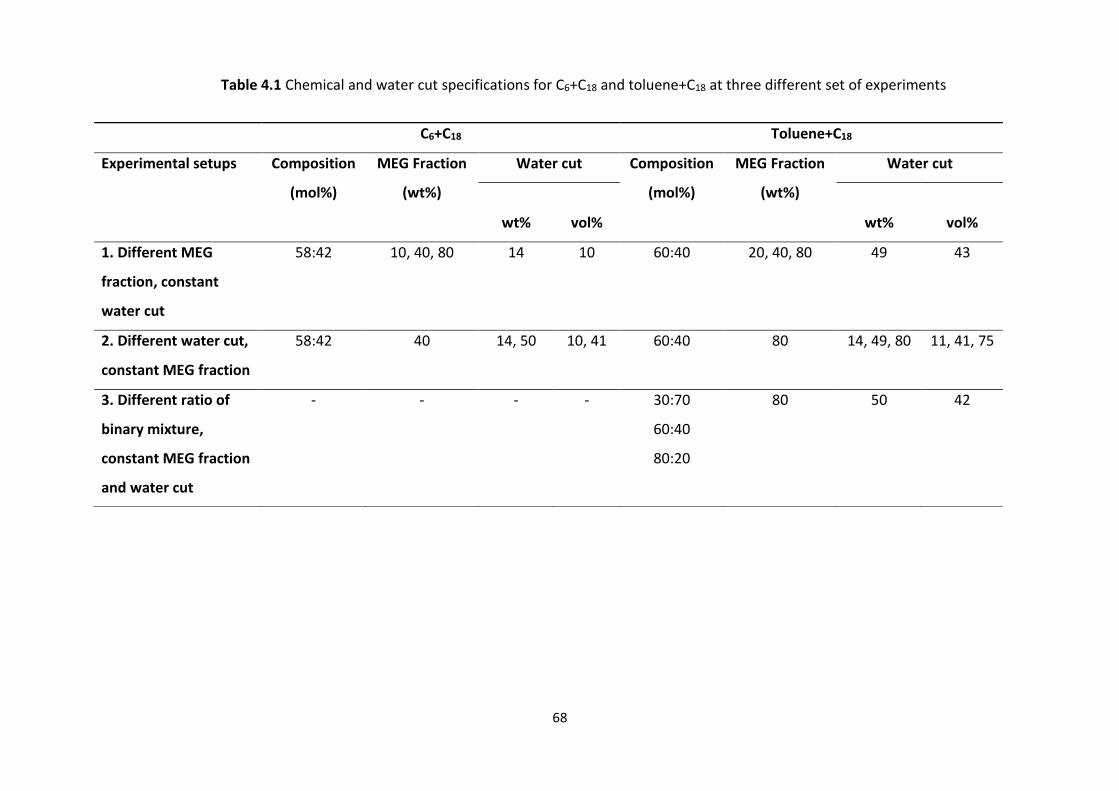
68
Table 4.1 Chemical and water cut specifications for C6+C18 and toluene+C18 at three different set of experiments
C6+C18 Toluene+C18
Experimental setups Composition
(mol%)
MEG Fraction
(wt%)
Water cut Composition
(mol%)
MEG Fraction
(wt%)
Water cut
wt%
vol%
wt%
vol%
1. Different MEG
fraction, constant
water cut
58:42 10, 40, 80 14 10 60:40 20, 40, 80 49 43
2. Different water cut,
constant MEG fraction
58:42 40 14, 50 10, 41 60:40 80 14, 49, 80 11, 41, 75
3. Different ratio of
binary mixture,
constant MEG fraction
and water cut
- - - - 30:70
60:40
80:20
80 50 42

69
4.3 Results and Discussion
4.3.1 Selection of materials
Hexane and toluene were chosen as the solvent for two different binary mixtures
based on previous reports by Folas et al. [130] and Razzouk et al. [132] that studied the
LLE behaviour of this system with MEG solutions. Molar fractions were selected to
ensure that the samples remained in full liquid form without wax precipitation between
15 and 25 °C. The temperature range was selected based on reported SLE phase
boundaries, which illustrate the variability in hydrocarbon melting point as a function of
solvent mole fraction (Figure 4.2). The SLE curve for C6+C18 was plotted based on the
experimental data by Domańska and Kniaż [134]. No previous experimental data was
available to inform the SLE behaviour for toluene+C18, the behaviour of which was
instead based on predictions from Multiflash (6.2) as described above. The APR-EOS was
chosen for this prediction, as it is suitable for representing thermophysical properties of
hydrocarbon mixtures exposed to an aqueous phase; Multiflash predictions were also
used to estimate the density of the hydrocarbon phase, which informed the mixing
procedure discussed above. In this study, the effect of pressurized gas on cloud point
was omitted due to limited solubility of light ends at interfacial surface of hydrocarbon
sample in a quiescent system; the lack of mixing in µDSC precludes equilibrium
measurements with large liquid droplets (>100 microns) at high pressure.

70
Figure 4.2 Solid-liquid equilibrium curves for binary mixtures of C6+C18 and toluene+C18.
The predicted melting points are 18.3 °C for C6+C18 (58:42 molar ratio) and 18.9 °C for
toluene+C18 (60:40 molar ratio); curves are provided to guide the eye.
4.3.2 Verifying cloud points of binary mixtures
To verify the cloud point of binary mixtures, the WDT was measured and
compared to reference values from either literature or Multiflash (6.2). The results for
binary mixtures of C6+C18 and toluene+C18 show average deviations of 1.11 and 0.1% for
both systems, respectively. An additional validation step was included for two additional
mixtures of toluene+C18 at molar ratios of 30:70 and 80:20, where measured WDT
results were compared with Multiflash (6.2) predicted melting points of 24.04 °C (30:70
molar ratio) and 15.22 °C (80:20 molar ratio). The measured WDT deviated from
prediction by 0.8 and 1%, respectively. These results provided a reasonable basis for
comparison in the experimental campaign, where the binary mixtures were mixed with
MEG solutions. The results of verification step are presented in Table 4.2.

71
Table 4.2 Deviation between measured WDT and predicted melting temperature for
binary mixture C6+C18 and toluene+C18. Measured WAT and WDT were based on the
average of three repeat trials at 95% confidence.
4.3.3 Effect of MEG and water content on WAT and WDT
Figure 4.3 illustrates results from the first set of experiments, where the WAT
and WDT were measured for C6+C18 (58:42 molar ratio) at 10, 40 and 80 wt% MEG in
water, with a constant watercut of 10%. The watercut was selected by considering a
moderate ratio of aqueous to hydrocarbon phase that may be expected for offshore
systems near the beginning of field life [135]. Figure 4.3 illustrates that, within a 95%
confidence interval, neither WAT nor WDT deviated from the base case across the range
of MEG dosages studied; Figure 4.3 also illustrates that the presence of a secondary
MEG-rich aqueous phase did not significantly affect the induction or subcooling
requirements of wax crystallisation in the system. At a constant MEG fraction of 40 wt%,
additional tests with variable watercuts (14 and 50 wt%) showed minimal change in WAT
and WDT when compared with the base case (Figure 4.4). These results suggest that the
presence of secondary, MEG-rich aqueous phase did not affect the WAT or WDT
behaviour of an alkane-dominant hydrocarbon phase. However, a meaningful trend was
identified for the binary mixture of toluene+C18, where changes in the cloud point were
observed for higher MEG fractions and watercuts (Figures 4.5 and 4.6, respectively).
Binary
mixture
Composition
(mol%)
Measured
WAT
(°C)
Measured
WDT
(°C)
Predicted
melting
temperature
(°C)
% deviation
(measured -
predicted
WDT)
C6+C18 58:42 17.72 21.53 18.3 1.11
Toluene+C18 30:70 22.03 26.41 24.04 0.8
60:40 16.29 19.2 18.91 0.1
80:20 8.36 12.29 15.22 1.02

72
Figure 4.3 WAT and WDT for a binary hydrocarbon mixture of C6+C18 (58:42 molar ratio)
homogenized with different MEG fractions at a constant 10 vol% (14 wt%) watercut;
data points represent an average of three repeat trials at 95% confidence.
Figure 4.4 WAT and WDT for a binary hydrocarbon mixture of C6+C18 (58:42 molar ratio)
homogenized with different watercuts at a constant 40 wt% MEG fraction; data points
represent an average of three repeat trials at 95% confidence.
Unlike the binary mixture of C6+C18, toluene+C18 (60:40 molar ratio) was
subjected to a higher watercut condition of 43 vol% (49 wt%) at three MEG fractions
(20, 40 and 80 wt%), as shown in Figure 4.5. This higher watercut condition provided

73
greater surface area for exchange between the phases [21]. Figure 4.5 illustrates that no
significant trend was observed in WAT for the systems tested, but a meaningful increase
in WDT was observed as a function of MEG fraction. To explore this trend further, the
highest MEG fraction (80 wt%) was tested over a range of watercut conditions with the
toluene+C18 system, where the results are shown in Figure 4.6. These extended results
show a similar insensitivity to MEG and water for WAT values, but identify a similar
increasing trend in WDT as a function of watercut (and subsequent MEG content): the
WDT increased by 0.35% as watercut was increased from 49 to 80 wt%.
The results presented in Figures 4.5 and 4.6 differ than the previous outcomes in
Figure 4.3 and 4.4, despite that both binary mixtures were tested under the same range
of MEG fraction and watercut. This observation suggests that the WAT in highly aromatic
hydrocarbon systems may be more susceptible to MEG content, when compared with
aliphatic hydrocarbons. In the limit that industrial wax removal may be accomplished by
pipeline heating (e.g. direct electrical heating), these results demonstrate that practical
calibration of WDT with the intended MEG solution (as applicable) should be undertaken
to ensure accurate removal of wax build-up from the pipeline wall.
Figure 4.5 WAT and WDT for a binary hydrocarbon mixture of toluene+C18 (60:40 molar
ratio) homogenized with different MEG fractions at a constant 43 vol% (49 wt%)
watercut; data points represent an average of three repeat trials at 95% confidence.
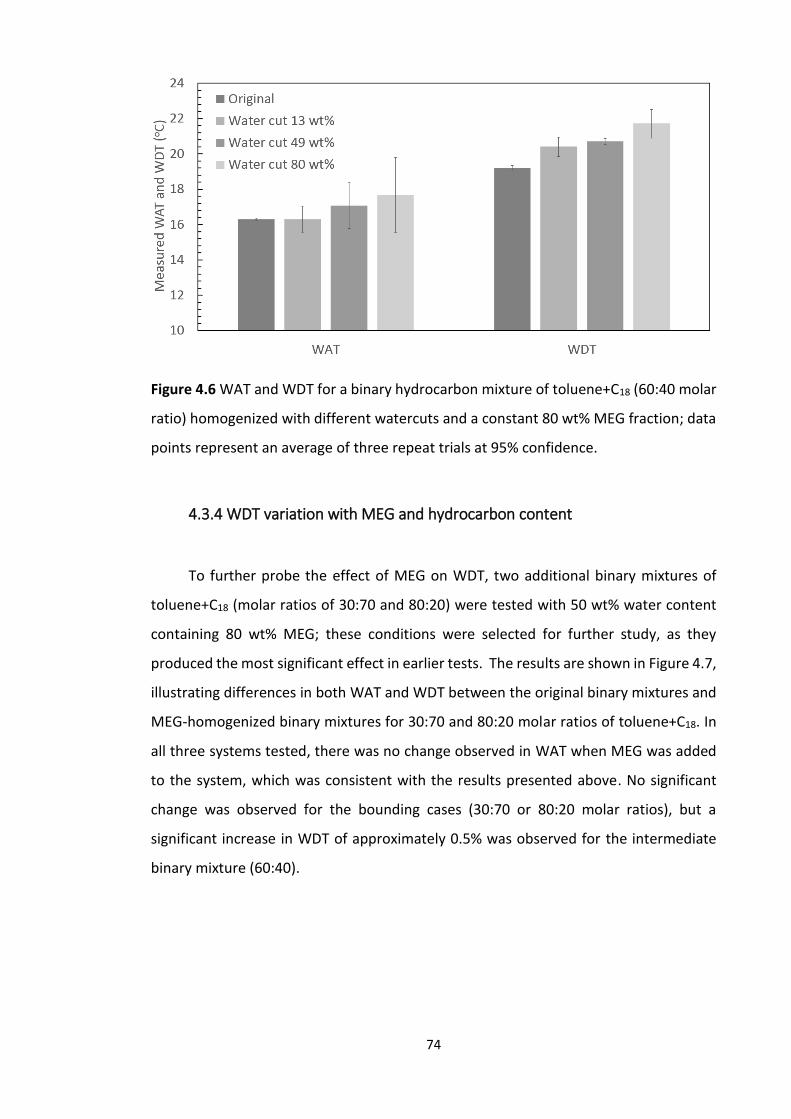
74
Figure 4.6 WAT and WDT for a binary hydrocarbon mixture of toluene+C18 (60:40 molar
ratio) homogenized with different watercuts and a constant 80 wt% MEG fraction; data
points represent an average of three repeat trials at 95% confidence.
4.3.4 WDT variation with MEG and hydrocarbon content
To further probe the effect of MEG on WDT, two additional binary mixtures of
toluene+C18 (molar ratios of 30:70 and 80:20) were tested with 50 wt% water content
containing 80 wt% MEG; these conditions were selected for further study, as they
produced the most significant effect in earlier tests. The results are shown in Figure 4.7,
illustrating differences in both WAT and WDT between the original binary mixtures and
MEG-homogenized binary mixtures for 30:70 and 80:20 molar ratios of toluene+C18. In
all three systems tested, there was no change observed in WAT when MEG was added
to the system, which was consistent with the results presented above. No significant
change was observed for the bounding cases (30:70 or 80:20 molar ratios), but a
significant increase in WDT of approximately 0.5% was observed for the intermediate
binary mixture (60:40).

75
Figure 4.7 Measured WAT and WDT at three different molar ratios of toluene+C18,
homogenized with 50 wt% water containing 80 wt% MEG: (a) 30:70; (b) 60:40; and (c)
80:20. Data points represent an average of three repeat trials at 95% confidence.
(a)
(b)
(c)

76
4.3.5 Effect of solvent aromaticity
This analysis followed the compositional basis of previous LLE studies reported
by Folas, et al. [130], who investigated the solubility of MEG and water in toluene;
Razzouk, et al. [132] conducted a similar study with MEG and water in C6. Both
experiments were conducted at atmospheric pressure and room temperature (298.2 K
for the toluene-added system and 303.15 K for the C6 system) and were mixed at an
equal mass fraction of 0.5 for both aqueous and hydrocarbon phases. Although the LLE
studies were completed with mild differences in absolute temperature and phase
fraction to the present investigation, they provide a context through which the current
WDT results may be understood.
Figure 4.8, reproduced from the above literature references, reports the
solubility of MEG and water in a hydrocarbon liquid phase as a function of MEG mass
fraction, where results for toluene are shown in panel (a) and results for C6 are shown
in panel (b). As both figures illustrate, the amount of MEG soluble in the hydrocarbon
phase increases monotonically with MEG concentration in the aqueous phase, where
the absolute solubility in toluene is approximately one order of magnitude higher than
in C6; as expected, the amount of water soluble in the hydrocarbon phase decreases
monotonically over the same concentration boundaries, with an order-of-magnitude
higher solubility observed in toluene than C6. These results suggest that, for systems
where MEG may be reasonably soluble in the liquid hydrocarbon phase, the MEG dosage
rate may impact WDT.

77
Figure 4.8 Solubility of MEG and water in liquid hydrocarbon as a function of MEG
fraction for (a) toluene at 298.2 K [130]; and (b) C6 at 303.15 K [132]. Curves are provided
to guide the eye.
The correspondence between the MEG solubility and measured WDT may be the
result of changes to the intermolecular forces within the liquid hydrocarbon phase, such
that MEG and water molecules – present at higher fractions in toluene than C6 – may
interact positively with the toluene liquid phase, such that the melting and subsequent
re-dissolution of solid C18 requires thermal energy.
(a)
(b)

78
At lower MEG fractions of 20 and 40 wt%, Figure 4.8 illustrates that the dissolved
water content in the hydrocarbon phase is between five and 10 times that of the
dissolved MEG content; the intermolecular potential between MEG and water [8] is
higher than that between toluene and water [133], which suggests that dissolved MEG
content may preferentially interact with dissolved water content for dilute MEG
systems, in preference to rich MEG. As the MEG fraction increased to 80 wt%, equimolar
portions of MEG and water molecules are present in toluene; the increased
intermolecular potential between toluene, MEG, and water provides an explanation as
to why additional energy is required to re-dissolve a solid hydrocarbon (C18) in the
continuous phase. As the (average) hydrocarbon chain length of waxing components in
the oil phase increases, the hydrophobicity of the phase also increases [136], where the
enhanced dipole moment of toluene (relative to C6) interacts more strongly with MEG
and water [137]. A schematic diagram of this scenario, relative to the equilibrium
solubility of MEG and water in toluene, is shown in Figure 4.9.
Figure 4.9 Schematic diagram relating equilibrium solubility to intermolecular
interactions between MEG, water, and toluene in the hydrocarbon phase.

79
The nature of this relationship limits the availability of toluene to act as a solvent
for waxing components (C18, in this case), which may impose a higher energy
requirement for the wax component to melt (i.e. a higher cloud point, as observed in
Figure 4.5). This justification is based on the manipulation of solvent chemistry, in this
case through the effect of chemical associations between solute-solvent and solvent-
solvent [124]. In this context, the experimental cloud point campaign illustrates the
importance of considering partially oil-soluble injection chemicals on the solvation
ability of the continuous hydrocarbon phase [93]; for example, current-generation AA
chemicals used to manage hydrate blockage risk are reasonably soluble in both
hydrocarbon and aqueous phases, which may affect WDT if the hydrocarbon fluid is
highly aromatic.
In the case of the C6+C18 binary mixture, the limited interaction between the
solvent, MEG, and water is minimized [138], due to a weaker dipole interaction from the
solvent an order-of-magnitude decrease in both water and MEG solubility [139].
Increasing the watercut in toluene+C18 systems (Figure 4.6) also increased the
measured WDT values, as a constant MEG fraction (80 wt%) was used for each watercut;
as such, the absolute amount of MEG in the system also increased. As observed
previously, the addition of MEG to either the toluene or C6 systems did not affect the
measured WAT; the extent of subcooling required for crystallization in these quiescent
cells was an order of magnitude larger than the effect of MEG on WDT, which may have
masked any observable change in WAT at the same operating conditions.
4.3.6 Effect of hydrocarbon composition on WAT and WDT
The above explanations focus on the contribution of the solvent, and
manipulations thereof, in binary hydrocarbon mixtures; the presence of solvent plays a
vital role in determining the solubility of MEG solution hydrocarbon phase [128, 140].
From this explanation, variations in solvent fraction may also affect the solubility of MEG
and consequently affect the measured cloud point. A final campaign sought to vary the
molar ratio of the hydrocarbon components, where results in Figure 4.7 indicate that a

80
change in the cloud point depends on the balance of solute and solvent in the binary
mixture.
For example, for the toluene+C18 system at 30:70 mol% (Figure 4.7, panel a), the
mixture had the majority of its components represented by a straight-chain alkane of
C18, which increases the hydrophobicity of the mixture. Under this condition, the
solubility of C18 in toluene may not have been significantly affected by the solubility of
MEG due to the limited availability of toluene to interact with aqueous components; as
a consequence, no change in WDT was observed when the MEG solution was added.
Increasing the toluene:C18 molar ratio from 60:40 (Figure 4.7, panel b) to 80:20
(Figure 4.7, panel c) increased the solubility of MEG and water in the hydrocarbon phase,
generating similar conditions to those shown in Figure 4.8 (panel a). As a result, the
presence of MEG and water in the hydrocarbon phase reduced the effective solubility
of C18. Although the expectation was for the WDT to decrease for the 80:20 mixture, the
opposite effect was observed; this may be the consequence of diluting the dissolved
MEG and water content in a large quantity of toluene, thereby limiting the effect of
dissolved aqueous content on the solubility of C18. These results illustrate that the most
significant changes in WDT were associated with an intermediate toluene fraction.
4.4 Chapter Summary
Dissolved aqueous components, including MEG and water, can affect the
measured cloud point for binary hydrocarbon systems where aqueous components are
partially soluble. This effect was shown by measuring WAT and WDT in the µDSC over a
range of binary hydrocarbon compositions, solvent types, MEG dosages, and watercuts.
Increases in the WDT by 0.5% was measured when 80 wt% MEG was added to a
toluene+C18 system with 50% watercut; a less pronounced increase (0.35%) was
observed at 80% watercut with 80 wt% MEG. However, no change in WDT was observed
in the C6+C18 system, both at higher MEG fraction or at higher watercut. In all cases,
neither MEG nor water content affected the measured WAT. The lack of an observable
change in WAT may have been the consequence of measuring crystallisation under
quiescent conditions.

81
Variations in WDT were maximised with an equimolar fraction of MEG and water
solubilized in a hydrocarbon phase at 80 wt% MEG, where the aromatic nature of the
solvent allowed it to interact more strongly with aqueous components. As a result, this
interaction limited the solubility of wax (C18) in toluene, resulting in a higher WDT.
Varying the molar fractions of toluene and C18 demonstrated that the most significant
impact of MEG and water on WDT was observed for a 60:40 molar ratio of hydrocarbon
components, respectively; this result suggests that the aromaticity of field fluids is an
important consideration in assessing whether the addition of MEG to the field (for
hydrate prevention) may affect WDT.
82
CHAPTER 5: CHARACTERIZING LOW WAX CONTENT SYSTEMS
USING DSC AND SPECTROSCOPIC METHODS
5.1 Introduction
The results presented in Chapter 4 all utilize reasonably high fractions of
potential freeze-out components, to accentuate the effect of chemical additives on WAT
or WDT behaviour. However, many industrial hydrocarbons may have extremely low
quantities of waxing components present (< 1 wt%), where their crystallisation or
melting may be difficult to detect using conventional methods (e.g. rheology). This low
wax content condition is worthy of investigation, as the expectation of wax deposition
on the flowline wall can significantly affect the design and operation of gas-condensate
fields. Previous studies have demonstrated that the detection of wax content as low as
0.5 wt% in the laboratory may correspond to more than 600 kg of solid formed for every
160 m3 of oil or condensate produced [141]. Particularly for deepwater production
systems, a low wax content fluid could potentially result in severe wax deposition along
the pipelines if the problem is neither monitored nor remediated.
When considering tests for prospective oil or condensate fields, the collection,
handling and measurement of wax content must be carefully controlled to ensure the
results are representative [62]. For example, variation in cloud point is expected when
a sample is taken prior to, and after, a separation system due to changes in the solvation
ability of the continuous phase (as discussed in Chapter 4). Similarly, sampling location
can play a role in dictating the observed wax content; collecting samples from the
bottom of a separator may artificially affect the measured wax content.
As the amount of wax in the hydrocarbon system decreases, the ability for the
DSC to detect small latent heat transitions also decreases; in the limit of this behaviour,
the DSC may be unable to detect wax crystallization, resulting in a false positive for flow
assurance engineers. Identifying the WDT in a low wax content sample is more
challenging than identifying WAT, due to the lower thermodynamic driving force
typically encountered during melting; as samples melt at the phase boundary, the
endset melting curve does not typically show a sharp peak as may be noted in WAT
curves [62]. Efforts to reduce thermal lags with smaller scan rates can improve clarity in

83
these signals, but significantly increase the time required to complete the measurement
[46]. Moreover, the usage of a smaller scan rate generates a smaller signal, wherein the
identification of WAT or WDT may be obscured by the noise of the baseline [46]; as such,
higher scanning rates may be beneficial in detecting low wax content systems.
It is important to understand the limitations and sensitivities associated with
different cloud point detection methods, which are often benchmarked by the minimum
detectable wax content. For example, DSC and rheological methods have similar
limitations in cloud point detection between 0.3 and 0.4 wt% [46]. Visually-based
techniques, such as CPM and filter plugging, have high sensitivity in detecting
crystallized wax particles, with the detectable size of precipitated wax was reported to
be 0.5 to 1 µm, or equivalent to approximately 0.1 wt% [46]. However, visual methods
like CPM may not be able to detect the first precipitated wax crystal accurately [46], but
may instead only capture the apparent WAT. As discussed above, many factors need to
be considered when measuring the cloud point in hydrocarbon systems, including the
hydrocarbon composition, thermal history, method(s) of detection, measurement time,
and thermophysical properties [47].
The application of infrared (IR) imaging techniques as a wax detection method
offers an advantage compared to other visually-based methods, as does not rely on the
subjectivity of operators [46]. IR works principally based on the response of a sample to
radiated light with wavelengths between 700 nm to 1 mm [46]. Based on this concept,
various implementations are available to quantitatively determine cloud point of a
sample, including Fourier transform infrared (FT-IR) [142, 143] and near-infrared (NIR)
[144]. NIR was reported to capture the smallest extent of precipitated wax (less than 55
nm) [144]. However, these methods assess cloud point based on the extent of
crystallized phase. For example, the use of FTIR is only appropriate for a high wax
content samples, as a system with low wax content might not give a definitive change
in either solute or solvent IR response during crystallization [46]. Conversely, the high
sensitivity of NIR might be only applicable for a non-quiescent samples, as the presence
of impurities like asphaltenes or resins may alter the refractive index of the fluid [144].
Based on the above description, a new approach to detecting low wax content is
required, which does not rely on the size of precipitated wax particles; to be industrially
applicable, this method must be suitable to detect cloud points and WAT/WDT below 1

84
wt%. Raman Spectroscopy (RS) is one promising option, as this method is sensitive to
both chemical composition and phase. RS offers several advantages to more
conventional methods, as systems do not require additional treatment before analysis
[145], and the method can be used for gas, liquid or water systems. Previous reports on
the application of RS to detect wax precipitation were limited, since most of them
focussed on morphological aspects and changes in chemical properties during the
crystallization stage [146-148]. Therefore, RS may be suitably adopted to accurately
determine cloud point for low wax content systems.
5.2 Wax detection with Raman spectroscopy
The concept of RS is based on inelastic light scattering when a sample is
illuminated with incident light, where a detailed description can be found in the
literature [145, 149, 150]. Fundamentally, light interacts with matter by either passing
through it or scattering. When a sample is subjected to incident light, the photons can
transfer energy to electrons in the sample of interest, which increases the vibrational
energy state of molecules in the sample.
The extent of excitation is associated with the amount of energy transferred
from the incident light. Under elastic (or Rayleigh) scattering, the scattered light has an
equal energy level to the incident light, thus there is no net energy difference between
the excited and incident light exists. However, a small fraction of scattered light
experiences inelastic scattering, whereby there is asymmetry in the energy difference
between the incident and scattered light; this outcome is known as Raman scattering,
which can result in final energy state being higher (Stoke scattering) or lower (Anti-Stoke
scattering) than the ground energy state of the sample. Figure 5.1 provides a schematic
addressing the concept of excitation during light scattering.

85
Figure 5.1 The incident light (1) excites high vibrational energy state (blue arrow) up to
the virtual state. Under the elastic scattering, both the excited energy (blue arrow) and
the released energy in the scattered light (grey arrow) have equal energy state which is
known as Rayleigh scattering. However, a small fraction of scattered light has an
unequal energy state than the incident light (Raman scattering). The yellow double-
head arrows represent the energy difference in Raman scattering, either higher than
its ground vibrational state (Stokes scattering) or lower than its ground vibrational
state (Anti-Stokes scattering). Reproduced from Smith and Dent [149].
The energy difference between the incident and scattered light, known as the
Raman shift, represents the vibrational energy attained by the molecule. It provides a
unique “chemical fingerprint” of a sample, as different chemical bonds of a molecule
have a unique set of vibrational frequencies. As the energy of electromagnetic radiation
is directly proportional to the frequency of the radiation, Raman shift is calculated based
on the difference of inverse wavelength such in Equation 5.1:
∆𝑤 = (1
𝜆0−
1
𝜆1)
Eq. 5.1
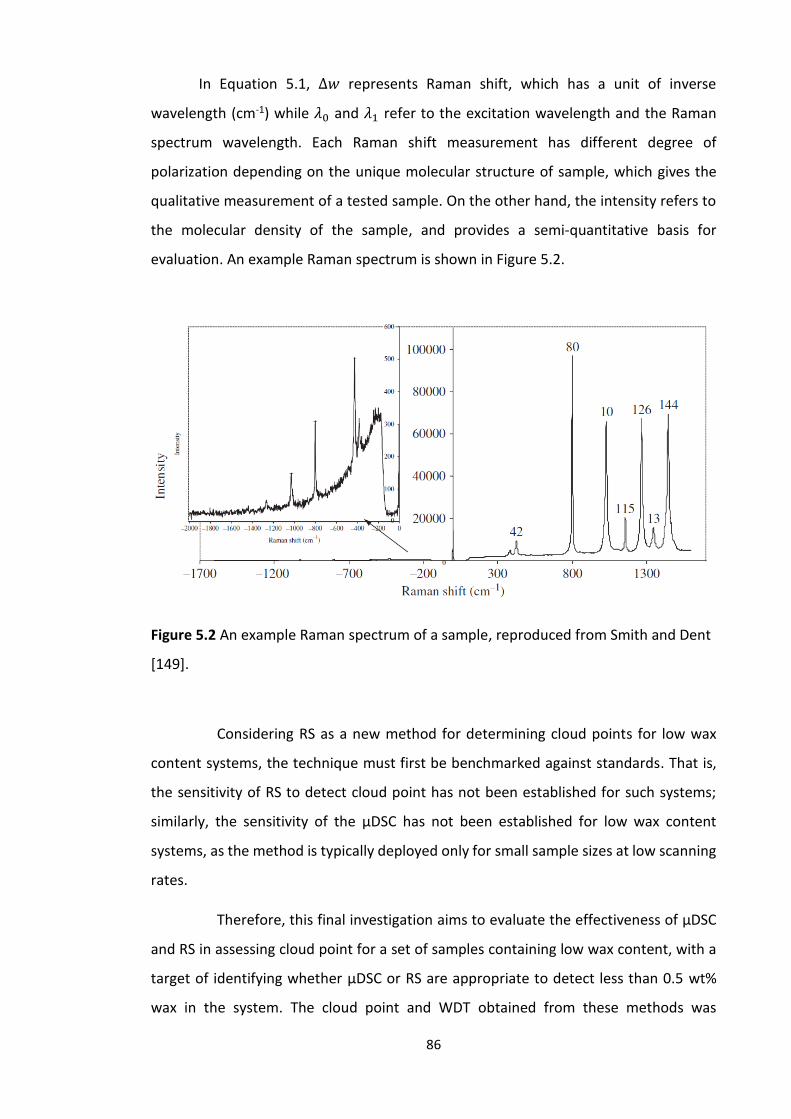
86
In Equation 5.1, ∆𝑤 represents Raman shift, which has a unit of inverse
wavelength (cm-1) while 𝜆0 and 𝜆1 refer to the excitation wavelength and the Raman
spectrum wavelength. Each Raman shift measurement has different degree of
polarization depending on the unique molecular structure of sample, which gives the
qualitative measurement of a tested sample. On the other hand, the intensity refers to
the molecular density of the sample, and provides a semi-quantitative basis for
evaluation. An example Raman spectrum is shown in Figure 5.2.
Figure 5.2 An example Raman spectrum of a sample, reproduced from Smith and Dent
[149].
Considering RS as a new method for determining cloud points for low wax
content systems, the technique must first be benchmarked against standards. That is,
the sensitivity of RS to detect cloud point has not been established for such systems;
similarly, the sensitivity of the µDSC has not been established for low wax content
systems, as the method is typically deployed only for small sample sizes at low scanning
rates.
Therefore, this final investigation aims to evaluate the effectiveness of µDSC
and RS in assessing cloud point for a set of samples containing low wax content, with a
target of identifying whether µDSC or RS are appropriate to detect less than 0.5 wt%
wax in the system. The cloud point and WDT obtained from these methods was

87
compared against thermophysical model predictions, where the sensitivity of the µDSC
to scanning rate was also investigated.
5.3 Materials and method
5.3.1 Materials and method for preparing a binary mixture
A set of three binary mixtures of toluene (HPLC grade, purity>99%, by Sigma
Aldrich) and triacontane (C30, purity >99%, by Tokyo Chemical Limited) was prepared to
represent low-wax content mixtures containing 0.5, 0.2 and 0.1 wt% wax. These
conditions were selected based on previous suggestions that the µDSC was insensitive
to wax content below 0.3-0.4 wt% [46, 102]. All chemicals were used without any
additional purification procedures. The binary mixtures of C30 in toluene (toluene+C30)
were prepared gravimetrically by mixing both solute C30 and solvent (toluene) at 20 to
25°C and 1 atm. Pure component and mixture densities were estimated from Multiflash
(6.2) using the APR-EOS. Each mixture was prepared with a large (50 ml) volume to
minimize uncertainty in the amount of wax added to the system.
Samples were weighed using a high-sensitivity scale (KERN and Sohn GmbH)
with accuracy up to ±0.1 mg. By using a thin filter paper, a solid sample of C30 was
weighed before it was mixed inside high-purity liquid toluene in a sampling bottle. The
sampling bottle was vigorously hand-shaken until the C30 was visibly dissolved. If the
solid C30 was still visible after mixing, the mixtures were gradually heated using a warm
water bath until visible dissolution was confirmed.
Synthetic binary mixtures were used in this study to better inform the
expected range of WAT and WDT conditions for evaluation in the µDSC and RS systems.
Simple binary mixtures are ideal for such calibration methods [151, 152], where the use
of complex industrial hydrocarbon systems (e.g. liquid condensates) are likely to have a
broad range of waxing components that can obscure the thermograms generated in
calorimetry. The use of a simple binary mixture is critical for this validation exercise, in
order to generate a distinguishable crystallization thermogram, allowing clear detection
of WAT from the interception point between the crystallization curve and the baseline
curve. C30 was selected as a model wax component with a toluene continuous phase, as

88
the dilute solution is predicted to have melting temperatures between 10 and 30 °C that
can be readily accessed through both µDSC and RS apparatus. C30 and toluene also have
distinguishable RS fingerprints, as described below. The binary mixture was finally
chosen due to low vapour pressure (when compared to a light alkane), which is
important for the unsealed RS sample chamber.
5.3.2 Experimental procedure for µDSC
The experiment was initiated by heating a sample from room temperature (298
K) to minimum of 10 K above its predicted cloud point, after which the sample was
maintained under isothermal conditions for 1000 seconds to ensure any remaining wax
was melted. The sample was then cooled to a temperature between 10 and 15 K below
its predicted cloud point, after which it was maintained under isothermal conditions for
1800 seconds to ensure that the crystallization process had reached completion. This
step was included to account for the potentially large induction requirement in low wax
content systems. The system was then heated to between 15 and 20 K above the
predicted cloud point, after which the µDSC data was analysed to identify the
experimental cloud point. Based on thermogram generated in µDSC, both WAT and WDT
were determined using the same analysis method presented in Chapter 4, whereby the
onset crystallization and endset melting curves were compared with the baseline scan.
5.3.3 Experimental procedure for Raman Spectroscopy
Figure 5.3 represents a schematic diagram of experimental setup to assess
cloud point using RS. The sample was loaded in a quartz crucible, with an inner diameter
of 15.2 mm and a height of 2.2 mm. The crucible was placed on a silver temperature-
controlled stage (THMS600, Linkam), which was programmed to follow either
isothermal or constant scanning rate modes; the temperature-controlled unit was
mounted on the translation stage of a Raman system (inVia Raman microscope,
Renishaw) and Raman spectra were acquired with a 532 nm laser. The system also
allowed intermittent recording of visual images captured with the 50x objective
deployed on the Raman microscope system (LMPlanFL N 50X, Olympus).

89
Figure 5.3 Schematic diagram of the experimental setup in measuring cloud point
using RS. A quartz crucible was placed on a silver plate under temperature control with
a laser was focussed on the middle of the liquid hydrocarbon mixture.
A series of reference spectra were measured at ambient conditions (25°C, 1 atm),
focusing on a range of Raman shifts between 2800 to 3100 cm-1, which includes the C-H
stretch mode shown in Figure 5.4. Two peaks are associated with the alkane group on
solid C30 [153], whereas two peaks of toluene at 2919 and 3056 cm-1 are attributed to C-
H stretch peaks with benzylic hydrogen and aromatic hydrogen, respectively [150].
Figure 5.4 Raman spectrum generated for toluene and C30 at an ambient conditions,
where analysis was focussed between 2700 and 3100 cm-1 to capture C-H stretching
modes.
To assess WAT, the sample was loaded into the RS crucible, and the Linkam stage
temperature was set at 20°C. Once the temperature reached steady state, the system
was cooled at 1 °C/min until wax crystallization was detected visually; the temperature
was then reduced in 1 °C intervals with a one-minute thermal equilibration period for
each temperature step. After reaching the lowest temperature step, a heating campaign
was initiated where the system was heated at 1 °C/min in 1 °C increments, where each
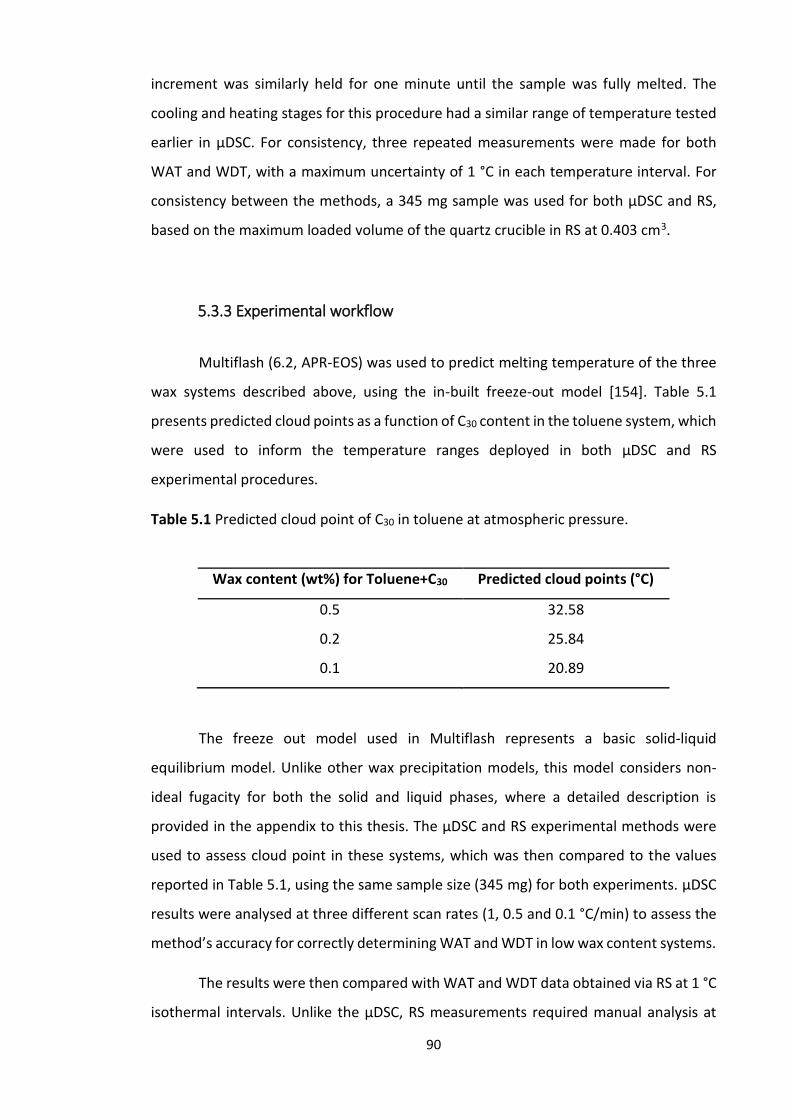
90
increment was similarly held for one minute until the sample was fully melted. The
cooling and heating stages for this procedure had a similar range of temperature tested
earlier in µDSC. For consistency, three repeated measurements were made for both
WAT and WDT, with a maximum uncertainty of 1 °C in each temperature interval. For
consistency between the methods, a 345 mg sample was used for both µDSC and RS,
based on the maximum loaded volume of the quartz crucible in RS at 0.403 cm3.
5.3.3 Experimental workflow
Multiflash (6.2, APR-EOS) was used to predict melting temperature of the three
wax systems described above, using the in-built freeze-out model [154]. Table 5.1
presents predicted cloud points as a function of C30 content in the toluene system, which
were used to inform the temperature ranges deployed in both µDSC and RS
experimental procedures.
Table 5.1 Predicted cloud point of C30 in toluene at atmospheric pressure.
Wax content (wt%) for Toluene+C30 Predicted cloud points (°C)
0.5 32.58
0.2 25.84
0.1 20.89
The freeze out model used in Multiflash represents a basic solid-liquid
equilibrium model. Unlike other wax precipitation models, this model considers non-
ideal fugacity for both the solid and liquid phases, where a detailed description is
provided in the appendix to this thesis. The µDSC and RS experimental methods were
used to assess cloud point in these systems, which was then compared to the values
reported in Table 5.1, using the same sample size (345 mg) for both experiments. µDSC
results were analysed at three different scan rates (1, 0.5 and 0.1 °C/min) to assess the
method’s accuracy for correctly determining WAT and WDT in low wax content systems.
The results were then compared with WAT and WDT data obtained via RS at 1 °C
isothermal intervals. Unlike the µDSC, RS measurements required manual analysis at

91
each temperature, where the uncertainty inherent in this approach may be reduced
through a reduction in the temperature step size.
5.4 Results and discussion
5.4.1 DSC assessment of low wax content
Figure 5.5 provides a set of thermograms that represent crystallization and
melting at three different wax fractions (0.1, 0.2 and 0.5 wt%). A gradual reduction in
the magnitude of the crystallization and melting curves was observed as wax content
was reduced from 0.5 to 0.1 wt%. Unlike melting, crystallization curves were more
distinct and showed a clear intersection point with the baseline. Analysis of the melting
curves was more complex, as the interception curve between the endset melting curve
and the baseline was less distinct; the simplicity of the binary system is likely to have
improved this interpretation, which may be significantly obscured when a complex
range of waxing components is present. Figure 5.5 illustrates the estimated WAT and
WDT values for each of the low wax content systems; the best resolution was obtained
with the lowest scanning rate of 0.1 °C/min [123], which maintained distinguishable
WAT and WDT signals [46].

92
Figure 5.5 Crystallization and melting peaks for three different wax contents: (A1 and
B1) 0.1 wt%; (A2 and B2) 0.2 wt%; and (A3 and B3) 0.5 wt%. The yellow dashed lines (--
-) represent a baseline, while the red dashed lines (---) and the green dashed lines (---)
represent onset crystallization curves and endset melting curves, respectively. The
curves represent a series of data at three different scan rates: ●, 1 °C/min; ●, 0.5 °C/min
and ●, 0.1 °C/min.
EXO
EXO
EXO ENDO
ENDO
ENDO
(A1)
(A2)
(A3)
(B1)
(B2)
(B3)
93
5.4.2 Raman assessment of low wax content
Figure 5.6 reports the measured Raman spectra for WAT and WDT
measurements – respectively in panels (a) and (b) – for the toluene system containing
0.2 wt% of C30. The band at 2880 cm-1 denotes as a Raman spectrum for solid C30,
highlighted in the subplots in Figure 5.6. A shoulder of the signal between 2875 cm-1and
2900 cm-1 indicates that the C30 started precipitating at 2°C, before it resulted in a
distinct peak at 1°C, corresponding to a larger solid hydrocarbon phase at the lower
temperature. Similar observations were made for WDT measurements, where heating
was initiated 5 °C below the measured WAT. The wax peak for this system was observed
up to 5 °C, after which it decreased in magnitude between 10 and 11 °C, indicating the
WDT had been reached; it is important to note that the RS measurement also identified
a deviation between WAT and WDT, on the same order of magnitude as was assessed
in the calorimetric investigation. To ensure complete melting stage of the wax, the
system was step-heated until any signature of the solid wax components was fully
resolved.

94
Figure 5.6 Raman spectrum for measurement of (a) WAT and (b) WDT in a sample with
wax content of 0.2 wt%. The highlighted band of the Raman spectra represents the
phase transition of the wax component.
5.4.3 Deviations between predicted and measured cloud points
Figures 5.7 and 5.8 report the WAT and WDT results obtained from µDSC at three
different scan rates (1, 0.5 and 0.1 °C/min) and RS using the step-heating configuration
in 1 K increments. The results illustrate that both the µDSC and RS methods agreed, with
the largest deviation of 1.8% for the WDT measured at 0.2 wt% wax. However, the
predicted cloud points were significantly higher than the WAT or WDT values obtained
(a)
(b)

95
from either µDSC and RS, with the largest deviation being 15 K. There was an
improvement in the model deviation (13 K) for the system containing 0.5 wt% wax.
Figure 5.7 Measured WATs from µDSC and RS using a 345 mg sample in each system;
predicted cloud points were obtained from Multiflash (6.2, APR-EOS). µDSC data
represent an average of three repeat trials at 95% confidence.
Figure 5.8 Measured WDTs from µDSC and RS using a 345 mg sample in each system;
predicted cloud points were obtained from Multiflash (6.2, APR-EOS). µDSC data
represent an average of three repeat trials at 95% confidence.

96
Comparing both experimental results with the model suggests that additional
research and data are required to refine the APR-EOS freeze out model under dilute wax
conditions; limited studies are available to inform the cloud point in low wax content
systems. For example, Coutinho, et al. [155] combined activity coefficient models with
an ideal solution model to describe wax precipitation, suggesting a maximum deviation
of 5% based on SLE measurements; increases in the molecular weight of the waxing
components is expected to increase model deviations [156]. The lower range of wax
content studied in this thesis suggests that additional model development may be
required before the models can be meaningfully deployed to assess risk in dilute wax
systems.
Beyond the consideration of subsea pipelines, a similar dilute waxing problem
can be present in liquefied natural gas (LNG) processing systems, which also suffer from
a lack of experimental data for predicting accurately the presence of heavy hydrocarbon
components which might be precipitated inside the liquefaction facilities [98, 157].
Given the consistency of results for both µDSC and RS approaches, additional studies
may be performed with methods to inform the future development of EOS-based
predictions.
5.4.4 Deviations between µDSC and Raman methods
Figure 5.7 illustrates that both the µDSC and RS are suitable to detect wax
content in a simple binary mixture on the order of 0.1 wt%; the temperature difference
between µDSC and RS was recorded at 0.6% for WAT and 0.2% for WDT. The senility of
both methods could be improved to extend to more complex (and less distinct) wax
systems, as the DSC scanning rate or RS temperature step size could be further reduced.
The results presented in Figure 5.5 illustrate that RS-based WAT was elevated in
comparison to the µDSC, although the RS study was limited to a 1 K uncertainty based
on the step size. The most significant difference (1.63%) was observed for a wax content
of 0.5 wt%, while a reduction in the scanning rate from 1 to 0.1°C/min at 0.2 wt%
improved the WAT deviation between µDSC than RS to 0.73%.

97
The high sensitivity of the spectroscopic approach means that small wax particles
may be identified, resulting in a higher measured WAT, and may exceed the minimum
detection limit for the µDSC. In the limit of deploying an infinitely small step size for the
RS method, the approach may even be suitable to detect early stages of growth
following critical nucleation, as described by Paso, et al. [158]; conversely, the µDSC is
likely to only detect growth of a macroscopic phase, thereby obscuring the measured
WAT.
The “zero scan rate” estimates of µDSC-based WDT were provided in Figure 5.8
based on extrapolation of the experimental data, which were included to estimate the
theoretical melting temperature; the estimates were obtained by considering the
ordinate intercept of µDSC data shown in Figure 5.9; the estimated WDTs at zero scan
rate were 280.21 K, 286.13 K and 288.95 K for 0.1, 0.2 and 0.5 wt%, respectively.
Figure 5.9 Measured WDTs from µDSC at three different scan rates. Predicted WDTs at
zero scan rate were obtained from by estimating the ordinate intercept. Data represent
an average of three repeat trials at 95% confidence, where curves are provided to guide
the eye.

98
5.5 Chapter Summary
Reliable measurements of cloud point in low wax content systems are critical, as
the inability to detect wax precipitation in the laboratory may translate to severe
challenges during field operation. This chapter presents the results of a campaign to
identify both WAT and WDT in low wax content systems, using both the µDSC deployed
in Chapters 3 and 4 of this thesis, alongside the use of Raman spectroscopy to identify
solid hydrocarbon peaks in a step-heating configuration. A binary model system of
toluene and C30 was used successfully for this evaluation, where wax content between
0.1 and 0.5 wt% was successfully identified in both apparatus. Unlike multicomponent
and complex hydrocarbon mixtures, the application of binary mixture allowed for a
fundamental analysis of a cloud point in samples with low-wax content using a µDSC
apparatus. Comparing the measured and Multiflash-predicted WATs for these systems
identified significant deviations, where predictions were up to 15 K higher than
measured values. This result indicates the need to refine model predictions, particularly
around the degree of non-ideality generated by dilute wax, and the need to collect a
suitable library of data across multicomponent systems to support model refinement.
Results generated in the µDSC illustrate the capability of this method to
accurately measure WAT in low wax content sample, where results compared well to
the high sensitivity of the RS system. For the most severe system tested (0.1 wt% C30),
the deviation between experimental methods was 0.6% in WAT and 0.2% in WDT, noting
that the RS system was configured with 1 °C step-heating increments. Reducing the
µDSC scanning rate can help minimize thermal lag. For these model systems, the
measured WAT and WDT respectively shifted toward higher and lower temperatures at
low scanning rates; the lowest scanning rate employed decreased deviations between
the apparatus to less than 0.1% for WAT, but resulted in higher deviations (0.7%) for
WDT.
The industry-standard APR-EOS method failed to predict cloud point accurately
at low wax content, with a maximum deviation of 15 K. Particularly in the limit that WAT
is a design consideration for subsea pipelines, this degree of uncertainty may
unnecessarily increase design and construction costs.

99
CHAPTER 6: CONCLUSIONS AND RECOMMENDATIONS
The main findings of this thesis focus on the contribution and application of µDSC
in analysing offshore flow assurance challenges, particularly around hydrate
management and wax precipitation. The primary conclusions of the thesis are shown
below, which are organized around the original knowledge gaps identified at the outset
of this thesis.
6.1 Original contributions and main findings
6.1.1 Deployment of µDSC to assess hydrate dispersion stability
The results presented in Chapter 3 illustrate the first use of a µDSC system to assess
hydrate dispersion stability in systems with complex inhibition strategies. The results
provide context as to the destabilizing effect of under-dosed MEG on hydrate-in-oil
dispersions, and illusrate the first use of the µDSC method to identify the stabilizing
impact of AA on the system. This thesis provides a context for adopting µDSC as a
complementary technique to current characterization standards, including autoclaves,
rheometers, and rocking cells. The µDSC method presented in Chapter 3 may be
particularly useful for the analysis of wireline samples, which are extremely expensive
to collect. Three conclusions are presented below, based on the novel studies presented
in Chapter 3.
1. The µDSC is suited to characterize hydrate dispersion stability.
Using industrially-applied anti-agglomerant (AA) chemicals as a benchmarking
tool, the µDSC was able to assess hydrate dispersion stability using an innovative
approach with multiple hydrate formation-dissociation cycles in series. The
results demonstrate that the use of a viscous hydrocarbon continuous phase is
attractive for such analysis, as viscosity-stabilized hydrate dispersions remain
susceptible to surfactant content.

100
2. Under-dosed MEG content may destabilize hydrate dispersions.
The benchmarking activities with AA chemicals provide a basis through which to
interpret the effect of under-dosed MEG on hydrate-in-oil dispersions.
Experimental results with 1-15 wt% MEG illuminated a dosage region (3-10 wt%)
where a significant decrease in hydrate dispersion stability was detected,
agreeing with high-shear results from Hemmingsen, et al. [19] and Li, et al. [80].
The data presented in Chapter 3 represent the first instance of this behaviour in
a quiescent µDSC system.
3. Mild AA dosage can partially remediate the destabilizing effect of MEG under-
dosage.
The addition of 1 wt% AA increased hydrate dispersion stability across the ‘high-
risk’ region of under-inhibition studied (3-10 wt% MEG), where the surface active
nature of the AA chemistry may decrease both hydrate-oil and water-oil surface
free energy, limiting the rate of droplet coalescence following hydrate
dissociation. Higher dosages of AA did not produce monotonic benefits in the
system, suggesting that the manipulation of surface free energy alone may not
be sufficient to maintain dispersion stability in an under-dosed MEG system.
6.1.2 Assessing hydrocarbon cloud point via µDSC
µDSC has proven to be a reliable method in analysing cloud point for conventional
oil and gas applications. This thesis presents new data to inform the effect of dissolved
MEG and water content on cloud point and melting temperature. Model binary
hydrocarbon systems were studied in the µDSC, generating one primary conclusion:
4. In aromatic systems, dissolved MEG and water content can increase the WDT.
The µDSC results presented in Chapter 4 illustrate that the extent of dissolved
MEG and water content had no impact on measured WAT, but were sufficient to
monotonically increase the WDT by up to 0.35% for a toluene-solvated system.
This effect was not present for an alkane solvent (C6), wherein the solubility limit
of both MEG and water is approximately one order of magnitude lower. The
results suggest that operators estimating WDT in highly aromatic oils or

101
condensates may require laboratory validation with MEG- and water-saturated
samples. In particular, this lesson may impact the energy requirements
associated with thermal wax remediation, such as can be achieved with subsea
direct electrical heating applications.
6.1.3 Identifying cloud point in low wax content systems
The final campaign of this thesis sought to establish the use of µDSC for the detection
of WAT and WDT in hydrocarbon systems with dilute wax content. The results were
compared with step-heating experiments equipped with Raman spectroscopy, and were
also compared with cloud point predictions from Multiflash (6.2) using the Advanced
Peng Robinson EOS. These investigations support two primary conclusions:
5. Model predictions of cloud point in a simple, dilute system deviated by up to
15 K.
Deviations of up to 15 K were detected between Multiflash and both
experimental methods deployed (µDSC and RS), for a simple binary system with
0.1 to 0.5 wt% C30 dissolved in toluene. These deviations suggest that a campaign
to collect cloud point measurements in dilute systems is required to support the
refinement of SLE models, particularly in fugacity associated with dilute wax
components.
6. The µDSC can detect 0.1 wt% wax content in a binary hydrocarbon system.
Applying Raman spectroscopy to a step-heating system for independent
comparison, the µDSC identified WAT and WDT in dilute systems (0.1 to 0.5 wt%
C30 in toluene). This minimum detection limit is a factor of four smaller than has
previously been reported, and may be further refined by decreasing the scanning
rate below 0.1 °C/min. The average deviation between µDSC and Raman
spectroscopic analysis (at a 1 °C step size) was 0.6% for WAT and 0.2% for WDT.

102
6.2 Recommendations
1. Physical behaviour of hydrate agglomeration in free water systems.
There is a gap in understanding the physical behaviour of hydrate particles when
exposed to a free water system, which can agglomerate readily in quiescent
measurements. Therefore, it is recommended that the physical behaviour of
hydrate particles during formation and dissociation in under-inhibited MEG be
studied, for systems with and without free water; microscopic methods, including
micromechanical cohesive force measurements, alongside macroscopic autoclave
and flowloop studies, would appropriately complement the learning reported in this
thesis.
2. Characterize the effect of AAs on interfacial tension, emulsion stability, and
hydrate cohesive force.
Measurements of water-oil interfacial tension and hydrate cohesive force in the oil
phase as a function of industrial AA concentration would provide further insight into
the dispersion stability results presented in Chapter 3. In particular, the effect of AA
concentration on hydrate dispersion stability could be further deconvoluted to
identify the primary interface of instability (water-oil or hydrate-oil). Classically, the
estimation of AA surface excess – through either technique – would require
knowledge of the surfactant’s molecular weight, which has historically been a
limitation due to the proprietary nature of the chemicals. Additional data on droplet
size distributions are useful to benchmark destabilization in hydrate dispersions,
particularly throughout the repeated hydrate formation-dissociation trials used in
this study. It is recommended to conduct a comprehensive emulsion stability
analysis using a non-invasive technique, such as Nuclear Magnetic Resonance
(NMR), to better understand the effect of hydrate anti-agglomerants. In particular,
the development of a high-pressure cell for the NMR would allow for direct
comparison with the results presented in Chapter 3.

103
3. Assess the impact of aqueous and surfactant pipeline chemistry on
hydrocarbon cloud point.
The results presented in Chapter 4 illustrate that MEG – a common hydrate inhibitor
– can affect cloud point within its solubility limit in the oil phase; further studies
could be performed with alternative glycol- and alcohol-based inhibitors (such as
methanol). More importantly, operators inject a wide range of surfactant
chemistries to protect subsea flowlines, where many of these chemistries are highly
soluble in the oil phase. Further studies should be conducted to assess the solubility
of these surfactants in the oil phase, alongside the impact of dissolved content on
cloud point.
4. Assess the impact of metastable emulsions on cloud point.
The results presented in Chapter 4 illustrate that the presence of hydrogen-bonding
species in the hydrocarbon phase can impact WDT. Further studies may be
conducted, particularly for viscous oil systems, with a tight, metastable emulsion (>
48 hours); the high surface area generated between the hydrocarbon and aqueous
phases [74, 159, 160], alongside the presence of any water-soluble injection
chemistries, may produce a similar effect.
5. Generate a library of WDT measurements in dilute wax systems.
The results shown in Chapter 5 illustrate that current industry-standard approaches
of assessing hydrocarbon cloud point may fail in the limit of dilute content, which
may introduce unnecessarily conservative design margins for subsea systems and/or
increase the risk of blockage if hydrocarbons are removed by pipeline heating. A
library of data, considering a range of aliphatic and aromatic solvents [161-163],
should be generated to improve phase boundary predictions in systems containing
less than 1 wt% wax.
6. Further refine Raman-based WAT/WDT measurements with smaller step sizes.
The analytical capability of Raman spectroscopy to identify wax solidification is
promising, as this technique compared well with calorimetry in Chapter 4. Further
development of this experimental method, particularly in a high-pressure, high-
shear sample chamber, may provide detection capability for ultra-low wax content

104
(< 0.1 wt%) systems. Previous study by Zheng and Du [148] reported the quantitative
determination of crystallization temperature using RS, but their report did not
explicitly relate to the cloud point analysis.
7. Adopting µDSC to detect co-mingled formation of hydrate and wax
Simulataneous formation of hydrate and wax can be challenging when both
boundaries are in proximity, particularly in large, visual system [164] [165]. In
comparison, µDSC may offer a reliable method of analysing simulataneous hydrate
and wax formation through calorimetric analysis over a range of temperature.
The preparation of a suitable sample and experimental procedure are required
for adopting simultaneous solid formation, based on the best practices identified
above for individual wax and hydrate formation detection. A sample with controllable
parameters, such as emulsified water in a binary hydrocarbon continuous phase, may
provide a suitable basis for fundamental investigation, noting that a small sample size
is required to ensure full saturation with gas species.

105
REFERENCES
[1] I. Forsdyke, "Integrated Flow Assurance Overview and Strategy Report," DeepStar
Report CTR, pp. 4211-1, 2000.
[2] E. D. Sloan, "A changing hydrate paradigm—from apprehension to avoidance to risk
management," Fluid Phase Equilibria, vol. 228, pp. 67-74, 2005.
[3] N. J. Hyne, Nontechnical guide to petroleum geology, exploration, drilling, and
production. PennWell Books, 2012.
[4] P. D. Lundegard and J. R. Knott, "Polar organics in crude oil and their potential impacts
on water quality," in Proceedings of the 2001 conference on petroleum hydrocarbons
and organic chemicals in groundwater. National Ground Water Association,
Westerville, 2001, pp. 138-144.
[5] H. FØrdedal, Ø. Midttun, J. Sjöblom, O. M. Kvalheim, Y. Schildberg, and J.-L. Volle, "A
multivariate screening analysis of W/O emulsions in high external electric fields as
studied by means of dielectric time domain spectroscopy, II: Model Emulsions
stabilized by interfacially active fractions from crude oils," Journal of colloid and
interface science, vol. 182, no. 1, pp. 117-125, 1996.
[6] M. A. Kelland, "History of the development of low dosage hydrate inhibitors," Energy
& Fuels, vol. 20, no. 3, pp. 825-847, 2006.
[7] E. D. Sloan Jr and C. Koh, Clathrate hydrates of natural gases. CRC press, 2007.
[8] E. D. Sloan, Natural gas hydrates in flow assurance. Gulf Professional Publishing, 2010.
[9] Y. F. Makogon, "Natural gas hydrates–A promising source of energy," Journal of
Natural Gas Science and Engineering, vol. 2, no. 1, pp. 49-59, 2010.
[10] C. D. Ruppel, "Gas hydrate in nature," US Geological Survey2327-6932, 2018.
[11] R. Boswell and T. S. Collett, "Current perspectives on gas hydrate resources," Energy &
environmental science, vol. 4, no. 4, pp. 1206-1215, 2011.
[12] C. Dalmazzone, D. Dalmazzone, and B. Herzhaft, "Differential scanning calorimetry: a
new technique to characterize hydrate formation in drilling muds," in SPE Annual
Technical Conference and Exhibition, 2000: Society of Petroleum Engineers.
[13] J. W. Lachance, E. D. Sloan, and C. A. Koh, "Determining gas hydrate kinetic inhibitor
effectiveness using emulsions," Chemical Engineering Science, vol. 64, no. 1, pp. 180-
184, 2009.
[14] R. Ohmura, M. Ogawa, K. Yasuoka, and Y. H. Mori, "Statistical study of clathrate-
hydrate nucleation in a water/hydrochlorofluorocarbon system: Search for the nature

106
of the “memory effect”," The Journal of Physical Chemistry B, vol. 107, no. 22, pp.
5289-5293, 2003.
[15] C. Bikkina, N. Radhakrishnan, S. Jaiswal, R. Harrington, and M. Charlesworth,
"Development of MEG Regeneration Unit Compatible Corrosion Inhibitor for Wet Gas
Systems," presented at the SPE Asia Pacific Oil and Gas Conference and Exhibition,
Perth, Australia, 2012/1/1/, 2012. Available: https://doi.org/10.2118/160301-MS
[16] L. E. Zerpa et al., "Predicting hydrate blockages in oil, gas and water-dominated
systems," in Offshore Technology Conference, 2012: Offshore Technology Conference.
[17] M. Cha et al., "Thermodynamic and kinetic hydrate inhibition performance of aqueous
ethylene glycol solutions for natural gas," Chemical Engineering Science, vol. 99, pp.
184-190, 2013.
[18] M. H. Yousif, "Effect of under-inhibition with methanol and ethylene glycol on the
hydrate control process," in Offshore Technology Conference, 1996: Offshore
Technology Conference.
[19] P. V. Hemmingsen, X. Li, and K. Kinnari, "Hydrate plugging potential in underinhibited
systems," in Proceedings of the 6th international conference on gas hydrates, 2008,
vol. 6, no. 10.
[20] Z. M. Aman, A. Haber, N. N. Ling, A. Thornton, M. L. Johns, and E. F. May, "Effect of
Brine Salinity on the Stability of Hydrate-in-Oil Dispersions and Water-in-Oil
Emulsions," Energy & Fuels, vol. 29, no. 12, pp. 7948-7955, 2015.
[21] G. Khatinzadeh, S. Taghipoor, A. Mehdizdaeh, and A. Roozbehani, "Synergistic Effect of
Glycol Ethers with a Kinetic Inhibitor (Poly (VP-VCap)) for Sweet Natural Gas Hydrate
Formation:(Concentration Effect of Glycol Ethers)," Journal of Petroleum Science and
Technology, vol. 9, no. 2, pp. 46-53, 2019.
[22] J. Kim, K. Shin, Y. Seo, S. J. Cho, and J. D. Lee, "Synergistic hydrate inhibition of
monoethylene glycol with poly(vinylcaprolactam) in thermodynamically underinhibited
system," J Phys Chem B, vol. 118, no. 30, pp. 9065-75, Jul 31 2014.
[23] J. Moore, L. V. Vers, and P. Conrad, "SS: Flow Assurance: Understanding Kinetic
Hydrate Inhibitor and Corrosion Inhibitor Interactions," in Offshore Technology
Conference, 2009: Offshore Technology Conference.
[24] H. Ohno, T. A. Strobel, S. F. Dec, J. Sloan, E Dendy, and C. A. Koh, "Raman studies of
methane− ethane hydrate metastability," The Journal of Physical Chemistry A, vol. 113,
no. 9, pp. 1711-1716, 2009.
[25] M. Cha, K. Shin, Y. Seo, J.-Y. Shin, and S.-P. Kang, "Catastrophic growth of gas hydrates
in the presence of kinetic hydrate inhibitors," The journal of physical chemistry a, vol.
117, no. 51, pp. 13988-13995, 2013.

107
[26] S. Gao, "Hydrate risk management at high watercuts with anti-agglomerant hydrate
inhibitors," Energy & Fuels, vol. 23, no. 4, pp. 2118-2121, 2009.
[27] L. E. Zerpa, J.-L. Salager, C. A. Koh, E. D. Sloan, and A. K. Sum, "Surface chemistry and
gas hydrates in flow assurance," Industrial & Engineering Chemistry Research, vol. 50,
no. 1, pp. 188-197, 2010.
[28] M. R. Anklam, J. D. York, L. Helmerich, and A. Firoozabadi, "Effects of antiagglomerants
on the interactions between hydrate particles," AIChE Journal, vol. 54, no. 2, pp. 565-
574, 2008.
[29] G. Aspenes, S. Høiland, A. E. Borgund, and T. Barth, "Wettability of petroleum
pipelines: Influence of crude oil and pipeline material in relation to hydrate
deposition," Energy & Fuels, vol. 24, no. 1, pp. 483-491, 2009.
[30] Z. M. Aman, E. D. Sloan, A. K. Sum, and C. A. Koh, "Lowering of clathrate hydrate
cohesive forces by surface active carboxylic acids," Energy & Fuels, vol. 26, no. 8, pp.
5102-5108, 2012.
[31] M. L. Zanota, C. Dicharry, and A. Graciaa, "Hydrate plug prevention by quaternary
ammonium salts," Energy & fuels, vol. 19, no. 2, pp. 584-590, 2005.
[32] J. D. York and A. Firoozabadi, "Alcohol cosurfactants in hydrate antiagglomeration,"
The Journal of Physical Chemistry B, vol. 112, no. 34, pp. 10455-10465, 2008.
[33] D. J. Turner, K. T. Miller, and E. Dendy Sloan, "Methane hydrate formation and an
inward growing shell model in water-in-oil dispersions," Chemical Engineering Science,
vol. 64, no. 18, pp. 3996-4004, 2009.
[34] S. V. Joshi et al., "Experimental flowloop investigations of gas hydrate formation in
high water cut systems," Chemical Engineering Science, vol. 97, pp. 198-209, 2013.
[35] M. Lingelem, A. Majeed, and E. Stange, "Industrial experience in evaluation of hydrate
formation, inhibition, and dissociation in pipeline design and operation," Annals of the
New York Academy of Sciences, vol. 715, no. 1, pp. 75-93, 1994.
[36] J. Boxall et al., "Hydrate blockage potential in an oil-dominated system studied using a
four inch flow loop," in Proceedings of the 6th International Conference on Gas
Hydrates, Vancouver, BC, Canada, 2008, pp. 6-10.
[37] A. Vysniauskas and P. Bishnoi, "A kinetic study of methane hydrate formation,"
Chemical Engineering Science, vol. 38, no. 7, pp. 1061-1072, 1983.
[38] B. R. Lee, C. A. Koh, and A. K. Sum, "Mechanism of Cohesive Forces of Cyclopentane
Hydrates with and without Thermodynamic Inhibitors," Industrial & Engineering
Chemistry Research, vol. 53, no. 47, pp. 18189-18193, 2014.

108
[39] D. C. Salmin et al., "Study of anti-agglomerant low dosage hydrate inhibitor
performance," in Offshore Technology Conference, 2017: Offshore Technology
Conference.
[40] J. W. Lachance, E. D. Sloan, and C. A. Koh, "Effect of hydrate formation/dissociation on
emulsion stability using DSC and visual techniques," Chemical Engineering Science, vol.
63, no. 15, pp. 3942-3947, 2008.
[41] F. H. Fadnes, "Natural hydrate inhibiting components in crude oils," Fluid Phase
Equilibria, vol. 117, no. 1-2, pp. 186-192, 1996.
[42] P. V. Hemmingsen, X. Li, J. L. Peytavy, and J. Sjöblom, "Hydrate Plugging Potential of
Original and Modified Crude Oils," Journal of Dispersion Science and Technology, vol.
28, no. 3, pp. 371-382, 2007.
[43] Z. M. Aman, E. P. Brown, E. D. Sloan, A. K. Sum, and C. A. Koh, "Interfacial mechanisms
governing cyclopentane clathrate hydrate adhesion/cohesion," Phys Chem Chem Phys,
vol. 13, no. 44, pp. 19796-806, Nov 28 2011.
[44] Z. M. Aman, S. E. Joshi, E. D. Sloan, A. K. Sum, and C. A. Koh, "Micromechanical
cohesion force measurements to determine cyclopentane hydrate interfacial
properties," J Colloid Interface Sci, vol. 376, no. 1, pp. 283-8, Jun 15 2012.
[45] Z. M. Aman, K. Olcott, K. Pfeiffer, E. D. Sloan, A. K. Sum, and C. A. Koh, "Surfactant
adsorption and interfacial tension investigations on cyclopentane hydrate," Langmuir,
vol. 29, no. 8, pp. 2676-82, Feb 26 2013.
[46] Z. Huang, S. Zheng, and H. S. Fogler, Wax Deposition: Experimental Characterizations,
Theoretical Modeling, and Field Practices. CRC Press, 2016.
[47] A. Hammami, J. Ratulowski, and J. A. Coutinho, "Cloud points: can we measure or
model them?," Petroleum science and technology, vol. 21, no. 3-4, pp. 345-358, 2003.
[48] A. Hunt, "Uncertainties remain in predicting paraffin deposition," Oil and Gas Journal,
vol. 94, no. 31, pp. 96-103, 1996.
[49] Y. L. Slovokhotov, I. S. Neretin, and J. A. Howard, "Symmetry of van der Waals
molecular shape and melting points of organic compounds," New Journal of Chemistry,
vol. 28, no. 8, pp. 967-979, 2004.
[50] A. Aiyejina, D. P. Chakrabarti, A. Pilgrim, and M. Sastry, "Wax formation in oil pipelines:
A critical review," International Journal of Multiphase Flow, vol. 37, no. 7, pp. 671-694,
2011.
[51] R. Venkatesan, N. Nagarajan, K. Paso, Y.-B. Yi, A. Sastry, and H. Fogler, "The strength of
paraffin gels formed under static and flow conditions," Chemical Engineering Science,
vol. 60, no. 13, pp. 3587-3598, 2005.

109
[52] D. Merino-Garcia and S. Correra, "Cold flow: A review of a technology to avoid wax
deposition," Petroleum Science and Technology, vol. 26, no. 4, pp. 446-459, 2008.
[53] H. S. Lee, "Computational and Rheological Study of Wax Deposition and Gelation in
Subsea Pipelines," 2008.
[54] L. F. A. Azevedo and A. M. Teixeira, "A Critical Review of the Modeling of Wax
Deposition Mechanisms," Petroleum Science and Technology, vol. 21, no. 3-4, pp. 393-
408, 2003/01/05 2003.
[55] M. Dirand, V. Chevallier, E. Provost, M. Bouroukba, and D. Petitjean, "Multicomponent
paraffin waxes and petroleum solid deposits: structural and thermodynamic state,"
Fuel, vol. 77, no. 12, pp. 1253-1260, 1998.
[56] P. Singh, H. S. Fogler, and N. Nagarajan, "Prediction of the wax content of the incipient
wax-oil gel in a pipeline: an application of the controlled-stress rheometer," Journal of
Rheology, vol. 43, no. 6, pp. 1437-1459, 1999.
[57] P. Singh, R. Venkatesan, H. S. Fogler, and N. Nagarajan, "Formation and aging of
incipient thin film wax‐oil gels," AIChE Journal, vol. 46, no. 5, pp. 1059-1074, 2000.
[58] W. Hayduk and B. Minhas, "Correlations for prediction of molecular diffusivities in
liquids," The Canadian Journal of Chemical Engineering, vol. 60, no. 2, pp. 295-299,
1982.
[59] T. Brown, V. Niesen, and D. Erickson, "Measurement and prediction of the kinetics of
paraffin deposition," in SPE annual technical conference and exhibition, 1993: Society
of Petroleum Engineers.
[60] P. A. Bern, V. R. Withers, and R. J. Cairns, "Wax deposition in crude oil pipelines," in
European offshore technology conference and exhibition, 1980: Society of Petroleum
Engineers.
[61] E. Burger, T. Perkins, and J. Striegler, "Studies of wax deposition in the trans Alaska
pipeline," Journal of Petroleum Technology, vol. 33, no. 06, pp. 1,075-1,086, 1981.
[62] J. A. Coutinho and J.-L. Daridon, "The limitations of the cloud point measurement
techniques and the influence of the oil composition on its detection," Petroleum
Science and Technology, vol. 23, no. 9-10, pp. 1113-1128, 2005.
[63] S. Suppiah et al., "Waxy crude production management in a deepwater subsea
environment," in SPE Annual Technical Conference and Exhibition, 2010: Society of
Petroleum Engineers.
[64] P. Juyal, T. Cao, A. Yen, and R. Venkatesan, "Study of live oil wax precipitation with
high-pressure micro-differential scanning calorimetry," Energy & Fuels, vol. 25, no. 2,
pp. 568-572, 2011.

110
[65] J. A. Coutinho and J.-L. Daridon, "Low-pressure modeling of wax formation in crude
oils," Energy & fuels, vol. 15, no. 6, pp. 1454-1460, 2001.
[66] A. Singh, H. S. Lee, P. Singh, and C. Sarica, "Flow assurance: validation of wax
deposition models using field data from a subsea pipeline," in Offshore Technology
Conference, 2011: Offshore Technology Conference.
[67] G. Fung, W. Backhaus, S. McDaniel, and M. Erdogmus, "To pig or not to pig: the marlin
experience with stuck pig," in Offshore Technology Conference, 2006: Offshore
Technology Conference.
[68] Z. Huang, H. S. Lee, M. Senra, and H. Scott Fogler, "A fundamental model of wax
deposition in subsea oil pipelines," AIChE Journal, vol. 57, no. 11, pp. 2955-2964, 2011.
[69] J. S. Gudmundsson, "Cold flow hydrate technology," in 4th International Conference on
Gas Hydrates, 2002, pp. 19-23.
[70] M. Senra, E. Panacharoensawad, K. Kraiwattanawong, P. Singh, and H. S. Fogler, "Role
of n-alkane polydispersity on the crystallization of n-alkanes from solution," Energy &
Fuels, vol. 22, no. 1, pp. 545-555, 2007.
[71] I. K. Cheong and A. Saidu, "Multi Strategy Approach to Manage Waxy Oil Wells in
Malaysia's Marginal Fields-A Unique Experience Offshore Peninsular Malaysia," in
International Petroleum Technology Conference, 2014: International Petroleum
Technology Conference.
[72] E. M. Kelechukwu and A. Yassin, "Potential risk of paraffin wax-related problems in
Malaysian oil fields," Jurnal Teknologi, vol. 49, pp. 1-7, 2008.
[73] A. Saidu Mohamed, "Thermo Chemical In-Situ Heat Generation Technique to Remove
Organic Solid Deposition: Effective Tool for Production Enhancement and Flow
Assurance," in Offshore Technology Conference, 2013: Offshore Technology
Conference.
[74] A. Hosseinipour, A. B. Japper-Jaafar, and S. Yusup, "The Effect of CO2 on Wax
Appearance Temperature of Crude Oils," Procedia engineering, vol. 148, pp. 1022-
1029, 2016.
[75] A. F. B. A. Jalil, "Malaysia: Driving Towards the Region’s Subsea and Deepwater
Industry Hub," in Asian Subsea Conference And Exhibition Kuala Lumpur Convention
Centre, Malaysia9-11June2010, 2010.
[76] N. Md Salleh and M. R. Sainal, "Malaysia Deepwater Project Execution Strategy and
Challenges," in Abu Dhabi International Petroleum Exhibition and Conference, 2010:
Society of Petroleum Engineers.
[77] E. D. Sloan Jr, "Fundamental principles and applications of natural gas hydrates,"
Nature, vol. 426, no. 6964, p. 353, 2003.

111
[78] C. A. Koh and E. D. Sloan, "Natural gas hydrates: Recent advances and challenges in
energy and environmental applications," AIChE journal, vol. 53, no. 7, pp. 1636-1643,
2007.
[79] K. Kinnari, J. Hundseid, X. Li, and K. M. Askvik, "Hydrate management in practice,"
Journal of Chemical & Engineering Data, vol. 60, no. 2, pp. 437-446, 2014.
[80] X. Li, P. Hemmingsen, and K. Kinnari, "Use of under-inhibition in hydrate control
strategies," in Proceedings of the 7th International Conference on Gas Hydrates, 2011,
pp. 17-21.
[81] Y. h. Sohn et al., "Hydrate plug formation risk with varying watercut and inhibitor
concentrations," Chemical Engineering Science, vol. 126, pp. 711-718, 2015.
[82] R. Hoffmann and L. Amundsen, "Single-phase wax deposition experiments," Energy &
Fuels, vol. 24, no. 2, pp. 1069-1080, 2009.
[83] R. Venkatesan, V. Sampath, and L. A. Washington, "Study of wax inhibition in different
geometries," in Offshore Technology Conference, 2012: Offshore Technology
Conference.
[84] M. Margarone, A. Bennardo, C. Busto, and S. Correra, "Waxy oil pipeline
transportation through cold flow technology: rheological and pressure drop analyses,"
Energy & Fuels, vol. 27, no. 4, pp. 1809-1816, 2012.
[85] M. C. K. de Oliveira, A. Teixeira, L. C. Vieira, R. M. de Carvalho, A. B. M. de Carvalho,
and B. C. do Couto, "Flow assurance study for waxy crude oils," Energy & Fuels, vol. 26,
no. 5, pp. 2688-2695, 2011.
[86] M. A. Mahabadian, A. Chapoy, R. Burgass, and B. Tohidi, "Mutual effects of paraffin
waxes and clathrate hydrates: A multiphase integrated thermodynamic model and
experimental measurements," Fluid Phase Equilibria, vol. 427, pp. 438-459, 2016.
[87] A. K. Sum, C. A. Koh, and E. D. Sloan, "Developing a Comprehensive Understanding and
Model of Hydrate in Multiphase Flow: From Laboratory Measurements to Field
Applications," Energy & Fuels, vol. 26, no. 7, pp. 4046-4052, 2012.
[88] H. Sharifi, J. Ripmeester, V. K. Walker, and P. Englezos, "Kinetic inhibition of natural gas
hydrates in saline solutions and heptane," Fuel, vol. 117, pp. 109-117, 2014.
[89] H. Ohno, R. Susilo, R. Gordienko, J. Ripmeester, and V. K. Walker, "Interaction of
antifreeze proteins with hydrocarbon hydrates," Chemistry–A European Journal, vol.
16, no. 34, pp. 10409-10417, 2010.
[90] P. U. Karanjkar, J. W. Lee, and J. F. Morris, "Calorimetric investigation of cyclopentane
hydrate formation in an emulsion," Chemical engineering science, vol. 68, no. 1, pp.
481-491, 2012.

112
[91] J. W. Lachance, E. Dendy Sloan, and C. A. Koh, "Effect of hydrate
formation/dissociation on emulsion stability using DSC and visual techniques,"
Chemical Engineering Science, vol. 63, no. 15, pp. 3942-3947, 2008.
[92] Z. M. Aman, K. Pfeiffer, S. J. Vogt, M. L. Johns, and E. F. May, "Corrosion inhibitor
interaction at hydrate–oil interfaces from differential scanning calorimetry
measurements," Colloids and Surfaces A: Physicochemical and Engineering Aspects,
vol. 448, pp. 81-87, 2014.
[93] L. A. Alcazar-Vara and E. Buenrostro-Gonzalez, Liquid-solid phase equilibria of
paraffinic systems by DSC measurements. INTECH Open Access Publisher, 2013.
[94] M. V. Kok, J.-M. Létoffé, P. Claudy, D. Martin, M. Garcin, and J.-L. Volle, "Comparison of
wax appearance temperatures of crude oils by differential scanning calorimetry,
thermomicroscopy and viscometry," Fuel, vol. 75, no. 7, pp. 787-790, 1996.
[95] J. Chen, J. Zhang, and H. Li, "Determining the wax content of crude oils by using
differential scanning calorimetry," Thermochimica acta, vol. 410, no. 1, pp. 23-26,
2004.
[96] L. C. Vieira, M. B. Buchuid, and E. F. Lucas, "Effect of pressure on the crystallization of
crude oil waxes. I. Selection of test conditions by microcalorimetry," Energy & Fuels,
vol. 24, no. 4, pp. 2208-2212, 2009.
[97] H. Pan, A. Firoozabadi, and P. Fotland, "Pressure and composition effect on wax
precipitation: experimental data and model results," SPE Production & Facilities, vol.
12, no. 04, pp. 250-258, 1997.
[98] J. H. Oakley, T. J. Hughes, B. F. Graham, K. N. Marsh, and E. F. May, "Determination of
melting temperatures in hydrocarbon mixtures by differential scanning calorimetry,"
The Journal of Chemical Thermodynamics, vol. 108, pp. 59-70, 2017.
[99] J. H. Hansen, A. Fredenslund, K. S. Pedersen, and H. P. Rønningsen, "A thermodynamic
model for predicting wax formation in crude oils," AIChE Journal, vol. 34, no. 12, pp.
1937-1942, 1988.
[100] A. Hammami and M. A. Raines, "Paraffin deposition from crude oils: comparison of
laboratory results to field data," in SPE Annual Technical Conference and Exhibition,
1997: Society of Petroleum Engineers.
[101] A. B. Hansen, E. Larsen, W. B. Pedersen, A. B. Nielsen, and H. Rønningsen, "Wax
precipitation from North Sea crude oils. 3. Precipitation and dissolution of wax studied
by differential scanning calorimetry," Energy Fuels, vol. 5, no. 6, pp. 914-923, 1991.
[102] H. P. Roenningsen, B. Bjoerndal, A. Baltzer Hansen, and W. Batsberg Pedersen, "Wax
precipitation from North Sea crude oils: 1. Crystallization and dissolution

113
temperatures, and Newtonian and non-Newtonian flow properties," Energy & Fuels,
vol. 5, no. 6, pp. 895-908, 1991.
[103] X. Guo, B. A. Pethica, J. S. Huang, R. K. Prud'homme, D. H. Adamson, and L. J. Fetters,
"Crystallization of mixed paraffin from model waxy oils and the influence of micro-
crystalline poly (ethylene-butene) random copolymers," Energy & fuels, vol. 18, no. 4,
pp. 930-937, 2004.
[104] M. Kök, J. Letoffe, and P. Claudy, "Comparative methods in the determination of wax
content and pour points of crude oils," Journal of Thermal Analysis and Calorimetry,
vol. 90, no. 3, pp. 827-831, 2007.
[105] C. Dalmazzone, C. Noïk, and D. Clausse, "Application of DSC for emulsified system
characterization," Oil & Gas Science and Technology-Revue de l'IFP, vol. 64, no. 5, pp.
543-555, 2009.
[106] D. Ditmars, S. Ishihara, S. Chang, G. Bernstein, and E. West, "Enthalpy and heat-
capacity standard reference material: synthetic sapphire (a-Al2O3) from 10 to 2250 K,"
J. Res. Natl. Bur. Stand, vol. 87, no. 2, pp. 159-163, 1982.
[107] K. Marsh, "Enthalpies of Fusion and Transition of Organic Compounds," Numerical
Data and Functional Relationships in Science and Technology-New Series, Group 4:
Physical Chemistry Series: Thermodynamic Properties of Organic Compounds and their
Mixtures, p. 362, 1995.
[108] C. J. Taylor, K. T. Miller, C. A. Koh, and E. D. Sloan, "Macroscopic investigation of
hydrate film growth at the hydrocarbon/water interface," Chemical Engineering
Science, vol. 62, no. 23, pp. 6524-6533, 2007.
[109] L. E. Zerpa, E. D. Sloan, C. Koh, and A. Sum, "Hydrate risk assessment and restart-
procedure optimization of an offshore well using a transient hydrate prediction
model," Oil and Gas Facilities, vol. 1, no. 05, pp. 49-56, 2012.
[110] C. Lo, J. Zhang, A. Couzis, P. Somasundaran, and J. Lee, "Adsorption of cationic and
anionic surfactants on cyclopentane hydrates," The Journal of Physical Chemistry C,
vol. 114, no. 31, pp. 13385-13389, 2010.
[111] A. Stoporev, A. Y. Manakov, L. Altunina, A. Bogoslovskii, L. Strelets, and E. Y. Aladko,
"Dependence of the rate of formation and the PT stability field of methane hydrate
suspensions in crude oils upon oil composition," Petroleum Chemistry, vol. 54, no. 3,
pp. 171-177, 2014.
[112] A. Haber et al., "Hydrate shell growth measured using NMR," Langmuir, vol. 31, no. 32,
pp. 8786-8794, 2015.

114
[113] M. Johns and K. Hollingsworth, "Characterisation of emulsion systems using NMR and
MRI," Progress in Nuclear Magnetic Resonance Spectroscopy, vol. 2, no. 50, pp. 51-70,
2007.
[114] N. N. Ling et al., "NMR studies of the effect of CO2 on oilfield emulsion stability,"
Energy & Fuels, vol. 30, no. 7, pp. 5555-5562, 2016.
[115] J. D. York and A. Firoozabadi, "Effect of brine on hydrate antiagglomeration," Energy &
Fuels, vol. 23, no. 6, pp. 2937-2946, 2009.
[116] Z. Huo, E. Freer, M. Lamar, B. Sannigrahi, D. Knauss, and E. Sloan Jr, "Hydrate plug
prevention by anti-agglomeration," Chemical Engineering Science, vol. 56, no. 17, pp.
4979-4991, 2001.
[117] J. Chen et al., "Evaluation of gas hydrate anti-agglomerant based on laser
measurement," Energy & Fuels, vol. 29, no. 1, pp. 122-129, 2014.
[118] D. Mukherjee, R. Fowles, D. Treybig, and P. Murugan, "Hydrate Anti-Agglomerants for
Sour Gases with Corrosion Inhibitor Properties," in SPE Oil & Gas India Conference and
Exhibition, 2015: Society of Petroleum Engineers.
[119] M. A. Kelland, Production chemicals for the oil and gas industry. CRC press, 2014.
[120] R. M. Charin, G. Salathe, M. Nele, and F. W. Tavares, "Influence of Commercial Anti-
agglomerants and Ammonium Quaternary Compounds on the Stability of Waxy Crude
Oil Emulsion," Energy & Fuels, vol. 29, no. 4, pp. 2211-2218, 2015.
[121] S. R. Davies et al., "Predicting hydrate plug formation in oil-dominated flowlines,"
Journal of Petroleum Science and Engineering, vol. 72, no. 3-4, pp. 302-309, 2010.
[122] B. Coto, C. Martos, J. J. Espada, M. D. Robustillo, and J. L. Peña, "Analysis of paraffin
precipitation from petroleum mixtures by means of DSC: Iterative procedure
considering solid–liquid equilibrium equations," Fuel, vol. 89, no. 5, pp. 1087-1094,
2010.
[123] J. Coutinho and V. Ruffier-Meray, "The use of differential scanning calorimetry in
studies of wax deposition: measuring the solid formation and binary solid-liquid
equilibrium phase diagrams," Oil & Gas Science and Technology, vol. 54, no. 5, pp. 641-
648, 1999.
[124] D. W. Jennings and K. Weispfennig, "Experimental solubility data of various n-alkane
waxes: effects of alkane chain length, alkane odd versus even carbon number
structures, and solvent chemistry on solubility," Fluid phase equilibria, vol. 227, no. 1,
pp. 27-35, 2005.
[125] L. C. Vieira, M. B. Buchuid, and E. F. Lucas, "Effect of pressure on the crystallization of
crude oil waxes. II. Evaluation of crude oils and condensate," Energy & Fuels, vol. 24,
no. 4, pp. 2213-2220, 2009.

115
[126] M. Sanjay, B. Simanta, and S. Kulwant, "Paraffin problems in crude oil production and
transportation: a review," SPE Production & facilities, vol. 10, no. 01, pp. 50-54, 1995.
[127] K. Schou Pedersen, P. Skovborg, and H. P. Roenningsen, "Wax precipitation from North
Sea crude oils. 4. Thermodynamic modeling," Energy & Fuels, vol. 5, no. 6, pp. 924-932,
1991.
[128] M. Riaz et al., "Measurement of Liquid–Liquid Equilibria for Condensate+ Glycol and
Condensate+ Glycol+ Water Systems," Journal of Chemical & Engineering Data, vol. 56,
no. 12, pp. 4342-4351, 2011.
[129] M. Riaz, M. A. Yussuf, G. M. Kontogeorgis, E. H. Stenby, W. Yan, and E. Solbraa,
"Distribution of MEG and methanol in well-defined hydrocarbon and water systems:
Experimental measurement and modeling using the CPA EoS," Fluid Phase Equilibria,
vol. 337, pp. 298-310, 2013.
[130] G. K. Folas, G. M. Kontogeorgis, M. L. Michelsen, E. H. Stenby, and E. Solbraa, "Liquid−
liquid equilibria for binary and ternary systems containing glycols, aromatic
hydrocarbons, and water: experimental measurements and modeling with the CPA
EOS," Journal of Chemical & Engineering Data, vol. 51, no. 3, pp. 977-983, 2006.
[131] P. Sentenac, C. Berro, E. Rauzy, I. Mokbel, and J. Jose, "Liquid− Liquid Equilibria for
Monoethylene Glycol+ Water+ Alkane Systems in the Range (273 to 313) K and
Atmospheric Pressure," Journal of Chemical & Engineering Data, vol. 49, no. 6, pp.
1577-1580, 2004.
[132] A. Razzouk et al., "Liquid− Liquid Equilibria for Monoethylene Glycol+ Hexane and 2, 2,
4-Trimethylpentane, Water+ Hexane and 2, 2, 4-Trimethylpentane, Monoethylene
Glycol+ Water+ Hexane, and Monoethylene Glycol+ Water+ 2, 2, 4-Trimethylpentane
in the Temperature Range between T= 283.15 K and T= 323.15 K," J. Chem. Eng. Data,
vol. 55, no. 4, pp. 1468-1472, 2010.
[133] M. Levitt and M. F. Perutz, "Aromatic rings act as hydrogen bond acceptors," Journal of
molecular biology, vol. 201, no. 4, pp. 751-754, 1988.
[134] U. Domańska and K. Kniaż, "Solid-Liquid Equilibria of Normal Alkanes (C 16, C 18, C
20)+ Hexane,+ 3-Methylpentane,+ 2, 2-Dimethylbutane, or+ Cyclohexane," Int. DATA
Ser., Sel. DATA Mixtures, Ser. A, vol. 2, pp. 83-92, 1990.
[135] R. Arnold et al., "Managing water–from waste to resource," Oilfield Review, vol. 16, no.
2, pp. 26-41, 2004.
[136] A. L. Ferguson, P. G. Debenedetti, and A. Z. Panagiotopoulos, "Solubility and molecular
conformations of n-alkane chains in water," The Journal of Physical Chemistry B, vol.
113, no. 18, pp. 6405-6414, 2009.

116
[137] D. J. Goss and R. H. Petrucci, General Chemistry Principles & Modern Applications,
Petrucci, Harwood, Herring, Madura: Study Guide. Pearson/Prentice Hall, 2007.
[138] T. M. Krygowski and B. T. Stepień, "Sigma-and pi-electron delocalization: focus on
substituent effects," Chemical reviews, vol. 105, no. 10, pp. 3482-3512, 2005.
[139] J. C. Ma and D. A. Dougherty, "The cation− π interaction," Chemical reviews, vol. 97,
no. 5, pp. 1303-1324, 1997.
[140] M. Frost et al., "Liquid–liquid equilibria for reservoir fluids+ monoethylene glycol and
reservoir fluids+ monoethylene glycol+ water: Experimental measurements and
modeling using the CPA EoS," Fluid Phase Equilibria, vol. 340, pp. 1-6, 2013.
[141] F. B. Thomas and D. B. Bennion, "Development and evaluation of paraffin technology:
Current status," Journal of petroleum technology, vol. 51, no. 02, pp. 60-61, 1999.
[142] L. A. Alcazar-Vara and E. Buenrostro-Gonzalez, "Experimental study of the influence of
solvent and asphaltenes on liquid–solid phase behavior of paraffinic model systems by
using DSC and FT-IR techniques," Journal of thermal analysis and calorimetry, vol. 107,
no. 3, pp. 1321-1329, 2012.
[143] R. Roehner and F. Hanson, "Determination of wax precipitation temperature and
amount of precipitated solid wax versus temperature for crude oils using FT-IR
spectroscopy," Energy & Fuels, vol. 15, no. 3, pp. 756-763, 2001.
[144] K. Paso, H. Kallevik, and J. Sjoblom, "Measurement of wax appearance temperature
using near-infrared (NIR) scattering," Energy & Fuels, vol. 23, no. 10, pp. 4988-4994,
2009.
[145] P. Larkin, Infrared and Raman spectroscopy: principles and spectral interpretation.
Elsevier, 2017.
[146] G. Schoukens and K. De Clerck, "Thermal analysis and Raman spectroscopic studies of
crystallization in poly (ethylene 2, 6-naphthalate)," Polymer, vol. 46, no. 3, pp. 845-
857, 2005.
[147] Y. Hu, J. K. Liang, A. S. Myerson, and L. S. Taylor, "Crystallization monitoring by Raman
spectroscopy: simultaneous measurement of desupersaturation profile and
polymorphic form in flufenamic acid systems," Industrial & engineering chemistry
research, vol. 44, no. 5, pp. 1233-1240, 2005.
[148] M. Zheng and W. Du, "Phase behavior, conformations, thermodynamic properties, and
molecular motion of multicomponent paraffin waxes: A Raman spectroscopy study,"
Vibrational spectroscopy, vol. 40, no. 2, pp. 219-224, 2006.
[149] E. Smith and G. Dent, Modern Raman spectroscopy: a practical approach. John Wiley &
Sons, 2013.
[150] N. Colthup, Introduction to infrared and Raman spectroscopy. Elsevier, 2012.

117
[151] I. Paunovic and A. K. Mehrotra, "Liquid–solid phase transformation of C 16 H 34, C 28 H
58 and C 41 H 84 and their binary and ternary mixtures," Thermochimica acta, vol. 356,
no. 1, pp. 27-38, 2000.
[152] S. Srivastava, J. Handoo, K. Agrawal, and G. Joshi, "Phase-transition studies in n-alkanes
and petroleum-related waxes—A review," Journal of Physics and Chemistry of Solids,
vol. 54, no. 6, pp. 639-670, 1993.
[153] J. B. Lambert, Introduction to Organic Spectroscopy. Macmillan, 1987.
[154] Infochem, "User Guide for Models and Physical Properties (Multiflash Version 6.2),"
Infochem/KBC Advanced Technologies plc, London, UK, 2017, 2017.
[155] J. A. Coutinho, S. I. Andersen, and E. H. Stenby, "Evaluation of activity coefficient
models in prediction of alkane solid-liquid equilibria," Fluid Phase Equilibria, vol. 103,
no. 1, pp. 23-39, 1995.
[156] D. Erickson, V. Niesen, and T. Brown, "Thermodynamic measurement and prediction of
paraffin precipitation in crude oil," in SPE Annual Technical Conference and Exhibition,
1993: Society of Petroleum Engineers.
[157] A. Siahvashi, S. Z. S. Al-Ghafri, J. H. Oakley, T. J. Hughes, B. F. Graham, and E. F. May,
"Visual Measurements of Solid–Liquid Equilibria and Induction Times for Cyclohexane
+ Octadecane Mixtures at Pressures to 5 MPa," Journal of Chemical & Engineering
Data, vol. 62, no. 9, pp. 2896-2910, 2017/09/14 2017.
[158] K. Paso, M. Senra, Y. Yi, A. Sastry, and H. S. Fogler, "Paraffin polydispersity facilitates
mechanical gelation," Industrial & engineering chemistry research, vol. 44, no. 18, pp.
7242-7254, 2005.
[159] S. Ahn, K. Wang, P. Shuler, J. Creek, and Y. Tang, "Paraffin crystal and deposition
control by emulsification," in SPE International Symposium on Oilfield Chemistry, 2005:
Society of Petroleum Engineers.
[160] A. Piroozian, M. Hemmati, I. Ismail, M. A. Manan, A. E. Bayat, and R. Mohsin, "Effect of
emulsified water on the wax appearance temperature of water-in-waxy-crude-oil
emulsions," Thermochimica Acta, vol. 637, pp. 132-142, 2016.
[161] C. McAuliffe, "Solubility in water of paraffin, cycloparaffin, olefin, acetylene,
cycloolefin, and aromatic hydrocarbons1," The Journal of Physical Chemistry, vol. 70,
no. 4, pp. 1267-1275, 1966.
[162] G. I. Makhatadze and P. L. Privalov, "Energetics of interactions of aromatic
hydrocarbons with water," Biophysical chemistry, vol. 50, no. 3, pp. 285-291, 1994.
[163] P. Schravendijk and N. F. van der Vegt, "From hydrophobic to hydrophilic solvation: an
application to hydration of benzene," Journal of chemical theory and computation, vol.
1, no. 4, pp. 643-652, 2005.

118
[164] S. Gao, "Investigation of interactions between gas hydrates and several other flow
assurance elements," Energy & Fuels, vol. 22, no. 5, pp. 3150-3153, 2008.
[165] H. Oschmann, R. Alapati, and K. Paso, "Risk Assessment of Concurrent Hydrate and
Wax Formation for Deepwater Production Restart Modeling and Experimental
Results," in SPE International Symposium on Oilfield Chemistry, 2013: Society of
Petroleum Engineers.
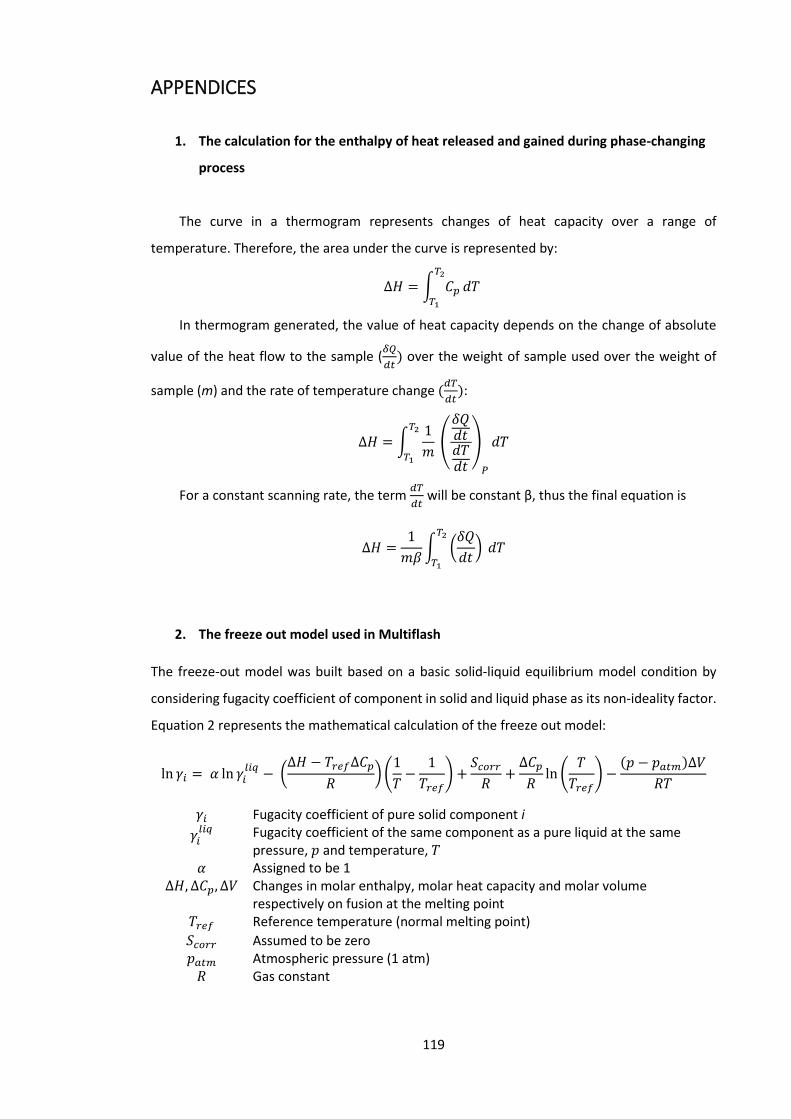
119
APPENDICES
1. The calculation for the enthalpy of heat released and gained during phase-changing
process
The curve in a thermogram represents changes of heat capacity over a range of
temperature. Therefore, the area under the curve is represented by:
∆𝐻 = ∫ 𝐶𝑝
𝑇2
𝑇1
𝑑𝑇
In thermogram generated, the value of heat capacity depends on the change of absolute
value of the heat flow to the sample (𝛿𝑄
𝑑𝑡) over the weight of sample used over the weight of
sample (m) and the rate of temperature change (𝑑𝑇
𝑑𝑡):
∆𝐻 = ∫1
𝑚
𝑇2
𝑇1
(
𝛿𝑄𝑑𝑡𝑑𝑇𝑑𝑡
)
𝑃
𝑑𝑇
For a constant scanning rate, the term 𝑑𝑇
𝑑𝑡 will be constant β, thus the final equation is
∆𝐻 =1
𝑚𝛽∫ (
𝛿𝑄
𝑑𝑡)
𝑇2
𝑇1
𝑑𝑇
2. The freeze out model used in Multiflash
The freeze-out model was built based on a basic solid-liquid equilibrium model condition by
considering fugacity coefficient of component in solid and liquid phase as its non-ideality factor.
Equation 2 represents the mathematical calculation of the freeze out model:
ln 𝛾𝑖 = 𝛼 ln 𝛾𝑖𝑙𝑖𝑞
− (∆𝐻 − 𝑇𝑟𝑒𝑓∆𝐶𝑝
𝑅) (
1
𝑇−
1
𝑇𝑟𝑒𝑓) +
𝑆𝑐𝑜𝑟𝑟
𝑅+
∆𝐶𝑝
𝑅ln (
𝑇
𝑇𝑟𝑒𝑓) −
(𝑝 − 𝑝𝑎𝑡𝑚)∆𝑉
𝑅𝑇
𝛾𝑖 Fugacity coefficient of pure solid component i
𝛾𝑖𝑙𝑖𝑞
Fugacity coefficient of the same component as a pure liquid at the same pressure, 𝑝 and temperature, 𝑇
𝛼 Assigned to be 1 ∆𝐻, ∆𝐶𝑝, ∆𝑉 Changes in molar enthalpy, molar heat capacity and molar volume
respectively on fusion at the melting point 𝑇𝑟𝑒𝑓 Reference temperature (normal melting point)
𝑆𝑐𝑜𝑟𝑟 Assumed to be zero 𝑝𝑎𝑡𝑚 Atmospheric pressure (1 atm)
𝑅 Gas constant