Embed Size (px)
Citation preview
751
THE APPLICATION OF ULTRASONIC TESTING IN THE PRESERVATION OF MONUMENTS.
BLUM, RAINER Laboratorium fOr Dynamik und Optik, Ludwig-Finckh-Weg 27, O 71229 Leonberg
1. INTRODUCTION
Ultrasound methods are very well established in material testing: They can be used to detect cracks, to measure the thickness of the rind of swine, the strength of wood materials can be determined and so on. One only has to glance the relevant textbooks Ill, 121, 131, 141 to see that the scope of applications is nearly unlimited. These methods are successful because they are essentially non-destructive, easy to apply and because they can easily be automated. The non-destructiveness must be mentioned first and would be of great advantage in the preservation of monuments. However references to the application on natural stones are rare even though recently with the promotion of the "Bundesministerium fur Bildung und Forschung" progress could be made. In this context the application of techniques injecting sound in solids in geophysics, where they are in a wider sense known as seismic techniques, has to be mentioned /5/, 161. As in the preservation of the monuments the material studied is natural stone but on a much bigger scale so that the relation to our field of application is not obvious. On closer examination the wavelengths used increase with the dimension of the examined object so that after scaling of the dimensions according to the wavelength the fields can be compared. Beside the classical ultrasonic testing seismic methods have to be considered in the discussion of our subject.
2. BASIC CONCEPTS
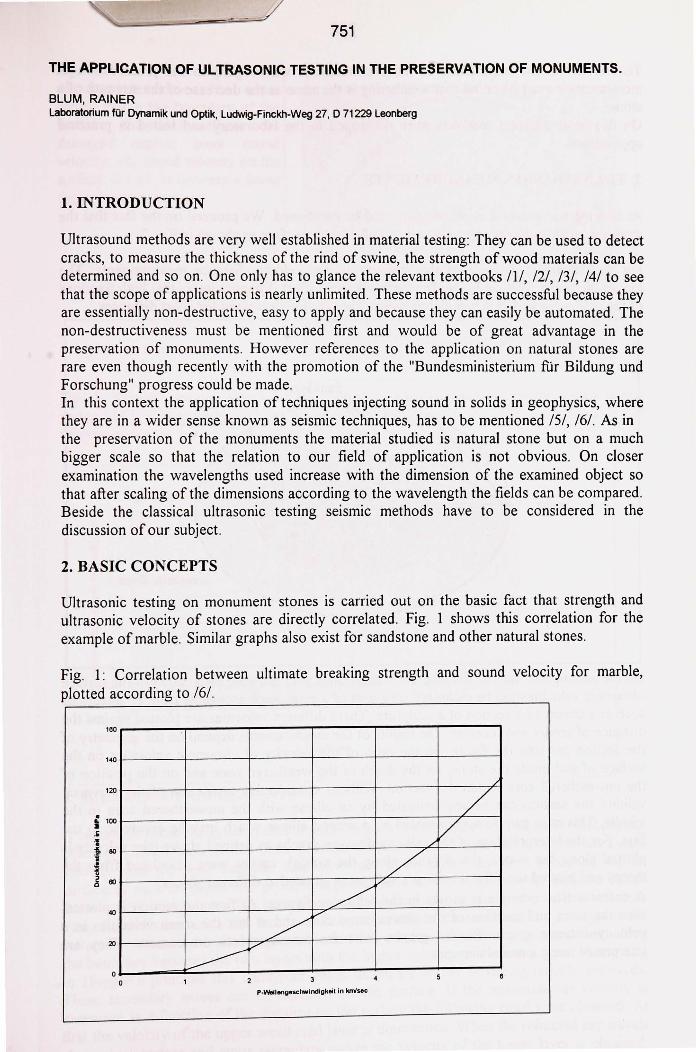
Ultrasonic testing on monument stones is carried out on the basic fact that strength and ultrasonic velocity of stones are directly correlated. Fig. 1 shows this correlation for the example of marble. Similar graphs also exist for sandstone and other natural stones.
Fig. I : Correlation between ultimate breaking strength and sound velocity for marble,
plotted according to 161.
160 ---...... ---"""T""---,.-----r---..,.-----,
1401----+----+----+------t----r--~
120 l----+----+----+--- ---t----r-z-71.L.
~ 1001------t----l----+---~----[//r----:r----;
~ L ,~ z ~~1--~-+---~-+-~-+--~~~v------r~-.
~'--~+---~+-/~~vr----t~---t~-m
~L-~+_______.~~v~~t--~--j--~---r-~1
P·W..longeschwindigkoit in km'sec
752
To understand the importance of these correlations with regard to the preservation of monuments it must be noted that weathering is the same as the decrease of the strength of a stone. On this basis different methods were developed in the laboratory and tested in practical applications.
3. TRANSMISSION MEASUREMENTS
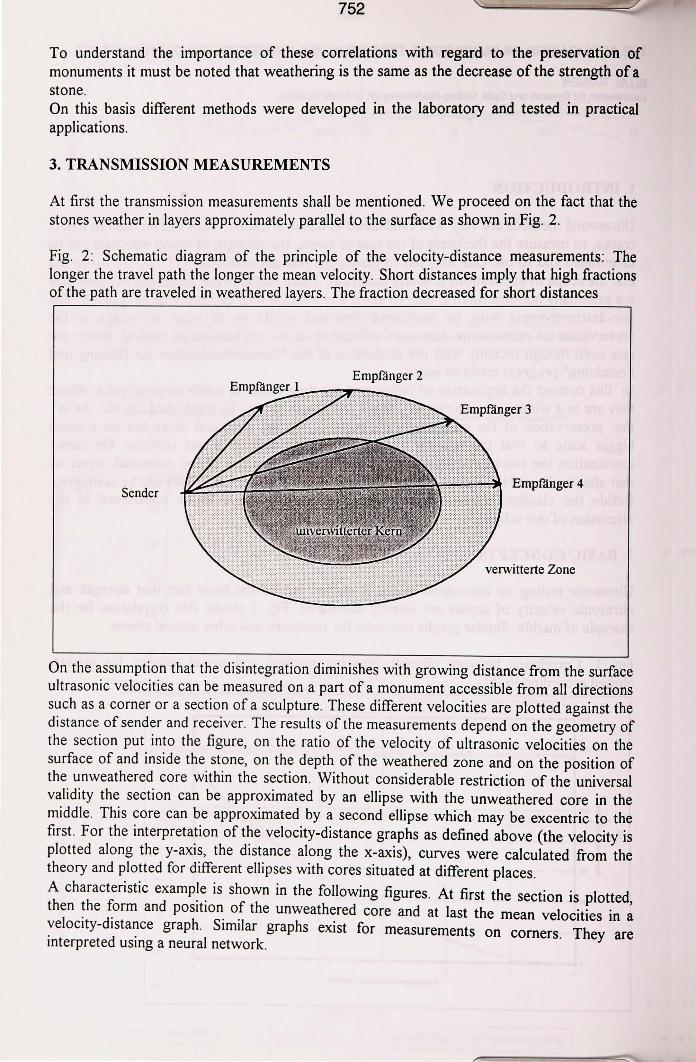
At first the transmission measurements shall be mentioned. We proceed on the fact that the stones weather in layers approximately parallel to the surface as shown in Fig. 2.
Fig. 2: Schematic diagram of the principle of the velocity-distance measurements: The longer the travel path the longer the mean velocity. Short distances imply that high fractions of the path are traveled in weathered layers. The fraction decreased for short distances
Empfanger 2
Sender Empfanger4
verwitterte Zone
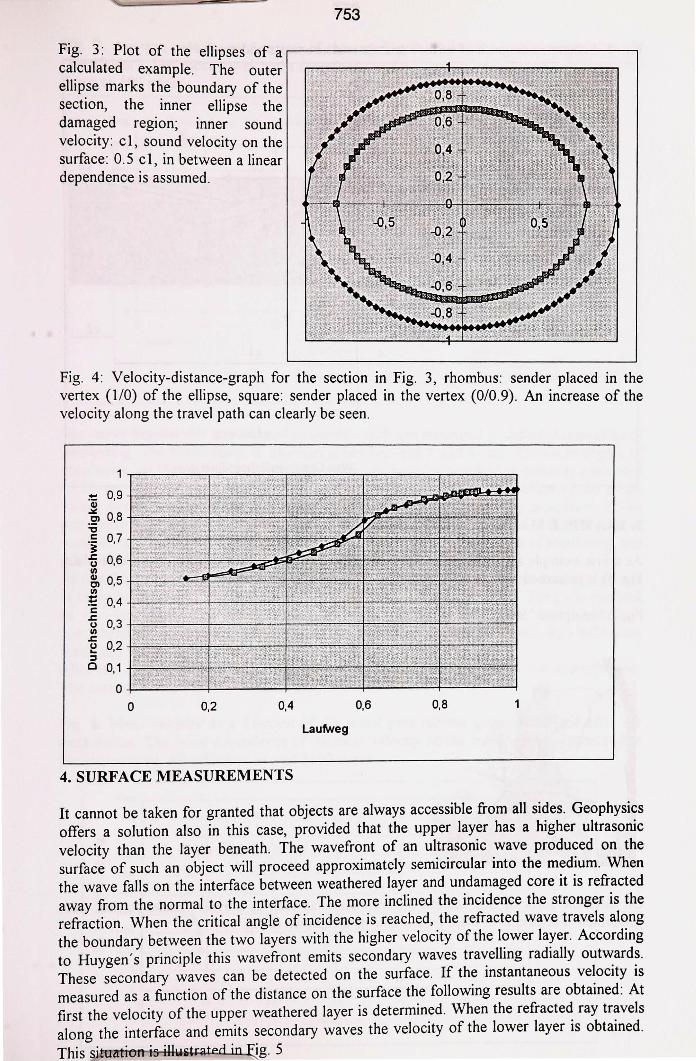
On the assumption that the disintegration diminishes with growing distance from the surface ultrasonic velocities can be measured on a part of a monument accessible from all directions such as a corner or a section of a sculpture. These different velocities are plotted against the distance of sender and receiver. The results of the measurements depend on the geometry of the section put into the figure, on the ratio of the velocity of ultrasonic velocities on the surface of and inside the stone, on the depth of the weathered zone and on the position of the unweathered core within the section. Without considerable restriction of the universal validity the section can be approximated by an ellipse with the unweathered core in the middle. This core can be approximated by a second ellipse which may be excentric to the first. For the interpretation of the velocity-distance graphs as defined above (the velocity is plotted along the y-axis, the distance along the x-axis), curves were calculated from the theory and plotted for different ellipses with cores situated at different places.
A characteristic examp!~ is shown in the following figures. At first the section is plotted, then the form and pos1t1on of the unweathered core and at last the mean velocities in a velocity-distance graph. Similar graphs exist for measurements on corners. They are interpreted using a neural network.
753
Fig. 3: Plot of the ellipses of ar------------------~ calculated example. The outer ellipse marks the boundary of the section, the inner ellipse the damaged region; inner sound velocity: c 1, sound velocity on the surface: 0.5 cl, in between a linear dependence is assumed.
Fig. 4: Velocity-dista~ce-graph for the section in Fig. 3, rhombus: sender placed in the verte~ (1/0) of the ellipse, square: sender placed in the vertex (0/0.9). An increase of the velocity along the travel path can clearly be seen.
-o.9~~~~~~ 'iii .:.= .21 0,8 "O .: 0,7 3:: 'fl 0,6 +,--,,~=.+~~ Cl)
~ 0, 5 +..:;-~.;;:.-~=ll!l= Cl)
~ 0, 4 ___ .....,..,.,~.,,..._"-+--.,,........~
'fl 0,3 +-~,,,...--.:,..,.J--~.:...,. Cl)
.c ~ 0,2 ::I c 0,1
0+-_.;;.;.......;.;;.;.;;,_;.,;;;:;.+.~_;_;~:::.=,+..:
0 0,2 0,4
4. SURFACE MEASUREMENTS
0,6 0,8 1
Lauf.veg
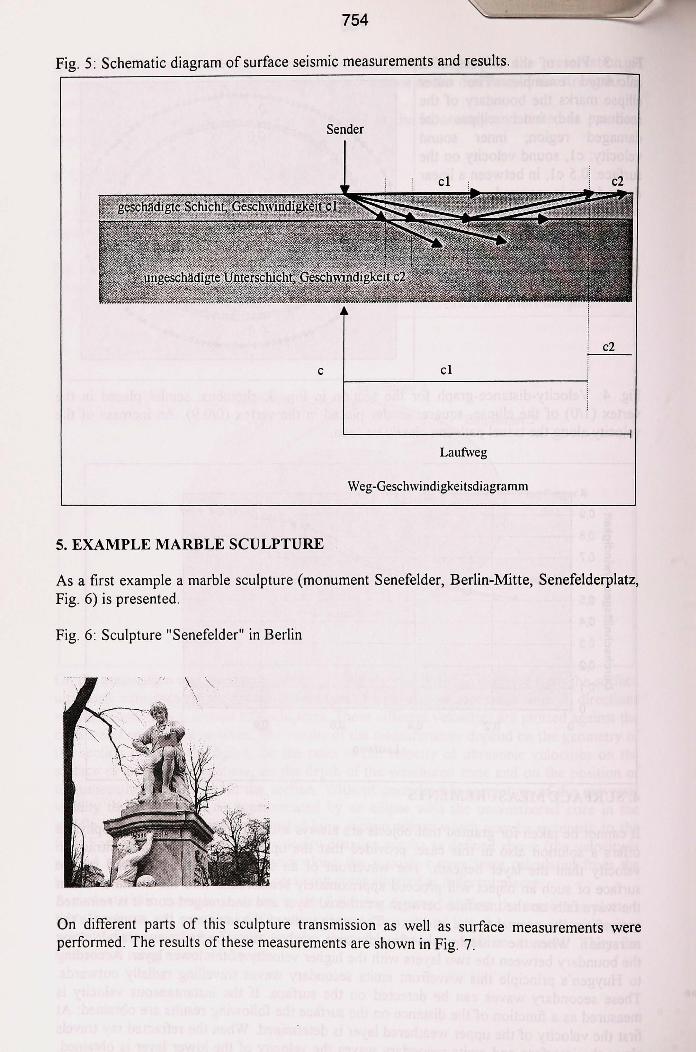
It cannot be taken for granted that objects are always accessible from all sides. Geophysics offers a solution also in this case, provided that the upper layer has a higher ultrasonic velocity than the layer beneath. The wavefront of an ultrasonic wave produced on the surface of such an object will proceed approximately semicircular into the medium. When the wave falls on the interface between weathered layer and undamaged core it is refracted away from the normal to the interface. The more inclined the incidence the stronger is the refraction. When the critical angle of incidence is reached, the refracted wave travels along the boundary between the two layers with the higher velocity of the lower layer. According to Huygen' s principle this wavefront emits secondary waves travelling radially outwards. These secondary waves can be detected on the surface. If the instantaneous velocity is measured as a function of the distance on the surface the following results are obtained: At first the velocity of the upper weathered layer is determined. When the refracted ray travels along the interface and emits secondary waves the velocity of the lower layer is obtained. This sitQation is illwiirated in ~g. 5
754
Fig. 5: Schematic diagram of surface seismic measurements and results.
Sender
c2
c cl
Laufweg
Weg-Geschwindigkeitsdiagramm
5. EXAMPLE MARBLE SCULPTURE
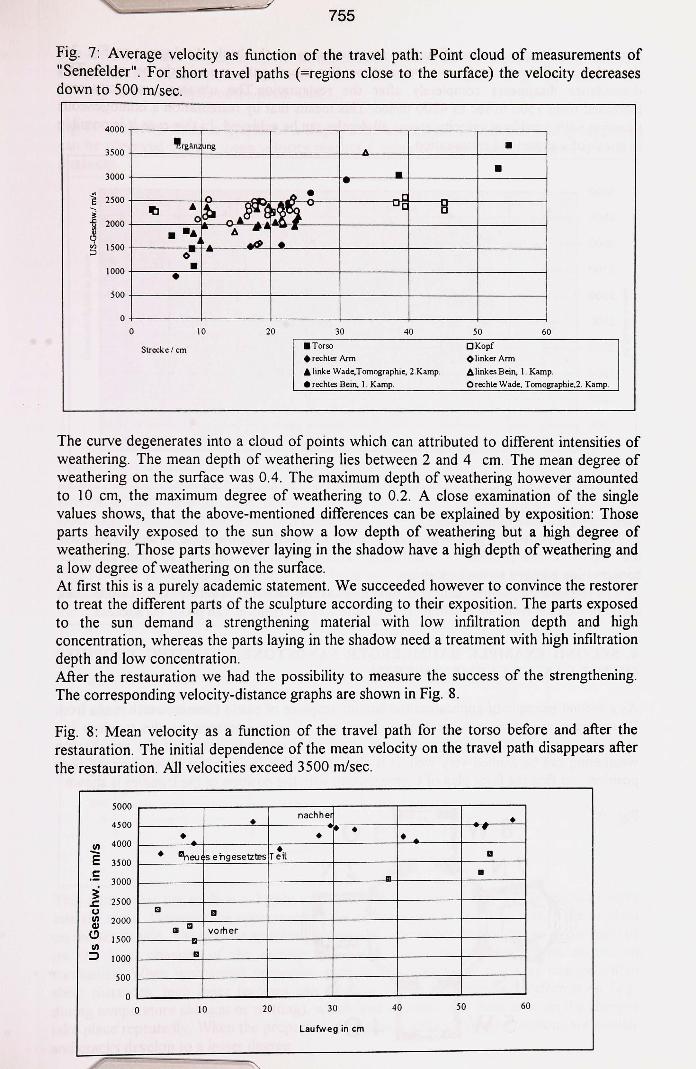
As a first example a marble sculpture (monument Senefelder, Berlin-Mitte, Senefelderplatz, Fig. 6) is presented.
Fig. 6: Sculpture "Senefelder" in Berlin
\ \.
On different parts of this sculpture transmission as well as surface measurements were performed. The results of these measurements are shown in Fig. 7.
755
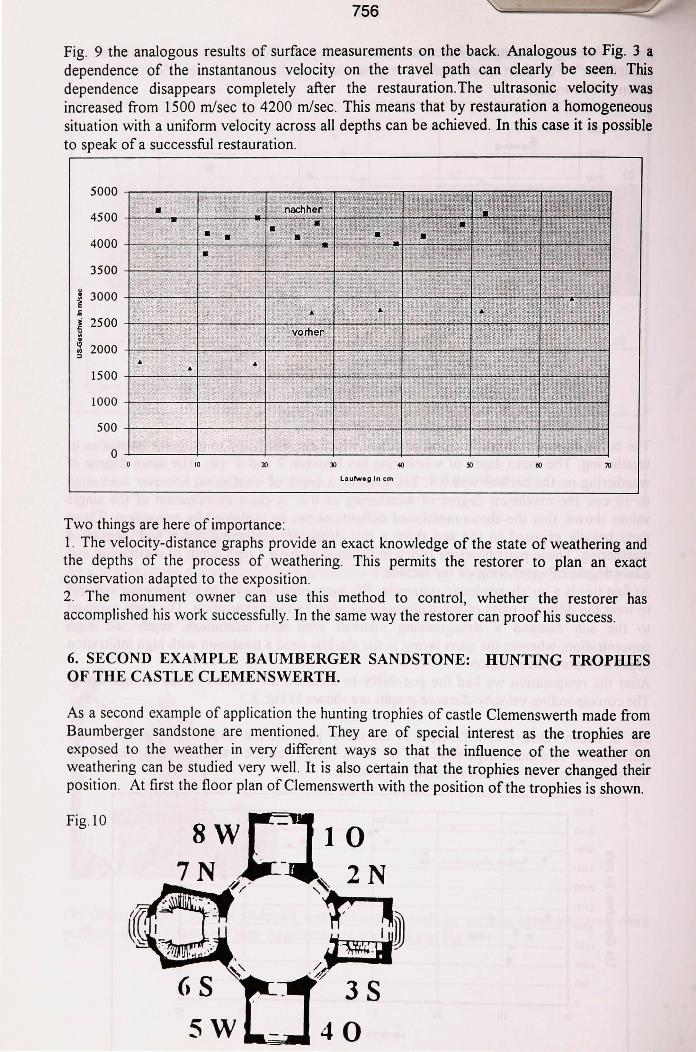
Fig. 7: Average velocity as function of the travel path: Point cloud of measurements of "Senefelder". For short travel paths (=regions close to the surface) the velocity decreases down to 500 m/sec.
4000
• 3500
• 3000
~ 2500
~ ..c 2000 " ~ "' 1500 ;:J
'3 ~~ _nA~~~l~ v ••• ~ 6 ---..--.,&IA: .. --.--I---+----4-----4---- --j
__::4 ..8 __._
1000 • 500
0
0 10 20 30 40 50 60
Strecke / cm •Torso OKopf
• rechler Arm OlinkerAnn
A linke Wade,Tomographie, 2.Kamp. 6 linkes Bein, I. Kamp.
a rechtes Bein. 1. Kamp. Orechte Wade. Tomographie.2. Kamp.
The curve degenerates into a cloud of points which can attributed to different intensities of weathering. The mean depth of weathering lies between 2 and 4 cm. The mean degree of weathering on the surface was 0.4. The maximum depth of weathering however amounted to 10 cm, the maximum degree of weathering to 0.2. A close examination of the single values shows, that the above-mentioned differences can be explained by exposition: Those parts heavily exposed to the sun show a low depth of weathering but a high degree of weathering. Those parts however laying in the shadow have a high depth of weathering and a low degree of weathering on the surface. At first this is a purely academic statement. We succeeded however to convince the restorer to treat the different parts of the sculpture according to their exposition. The parts exposed to the sun demand a strengthening material with low infiltration depth and high concentration, whereas the parts laying in the shadow need a treatment with high infiltration depth and low concentration. After the restauration we had the possibility to measure the success of the strengthening. The corresponding velocity-distance graphs are shown in Fig. 8.
Fig. 8: Mean velocity as a function of the travel path for the torso before and after the restauration. The initial dependence of the mean velocity on the travel path disappears after the restauration. All velocities exceed 3500 m/sec.
5000
4500
Ill 4000 -E 3500
• nachhe~ • ~ • -~ . .. • . _._
• ~eu~ • II s e ng esetztes Teil
c: 3000 ..IL •
~ 2500 .t::. CJ Ill 2000 CJ
(.!) 1500
Ill II
Iii Ill vorh er -..--
Ill ::::> IOOO II
500
0 0 IO 20 30 40 50 60
Laufweg in cm
756
Fig. 9 the analogous results of surface measurements on the back. Analogous to Fig. 3 a dependence of the instantanous velocity on the travel path can clearly be seen. This dependence disappears completely after the restauration. The ultrasonic velocity was increased from 1500 m/sec to 4200 m/sec. This means that by restauration a homogeneous situation with a uniform velocity across all depths can be achieved. In this case it is possible to speak of a successful restauration.
5 000 -r;::,...........--,.......,-~77"':::-::--.::7":1r::::
4500 -If'-,--_,,....~
4000
3500
I 3000
" ~ 2500
~ ., 2000 +..,,,..:;:.;r;""""""--"'-+;,i--'-..,<.-,-~~ :>
10 20
Two things are here of importance:
10
Lautw1g In cm
1. The velocity-distance graphs provide an exact knowledge of the state of weathering and the depths of the process of weathering. This permits the restorer to plan an exact conservation adapted to the exposition. 2. The monument owner can use this method to control, whether the restorer has accomplished his work successfully. In the same way the restorer can proof his success.
6. SECOND EXAMPLE BA UMBERGER SANDSTONE: HUNTING TROPHIES OF THE CASTLE CLEMENSWERTH.
As a second example of application the hunting trophies of castle Clemenswerth made from Baumberger sandstone are mentioned. They are of special interest as the trophies are exposed to the weather in very different ways so that · the influence of the weather on weathering can be studied very well. It is also certain that the trophies never changed their position. At first the floor plan of Clemenswerth with the position of the trophies is shown.
Fig.10
40
757
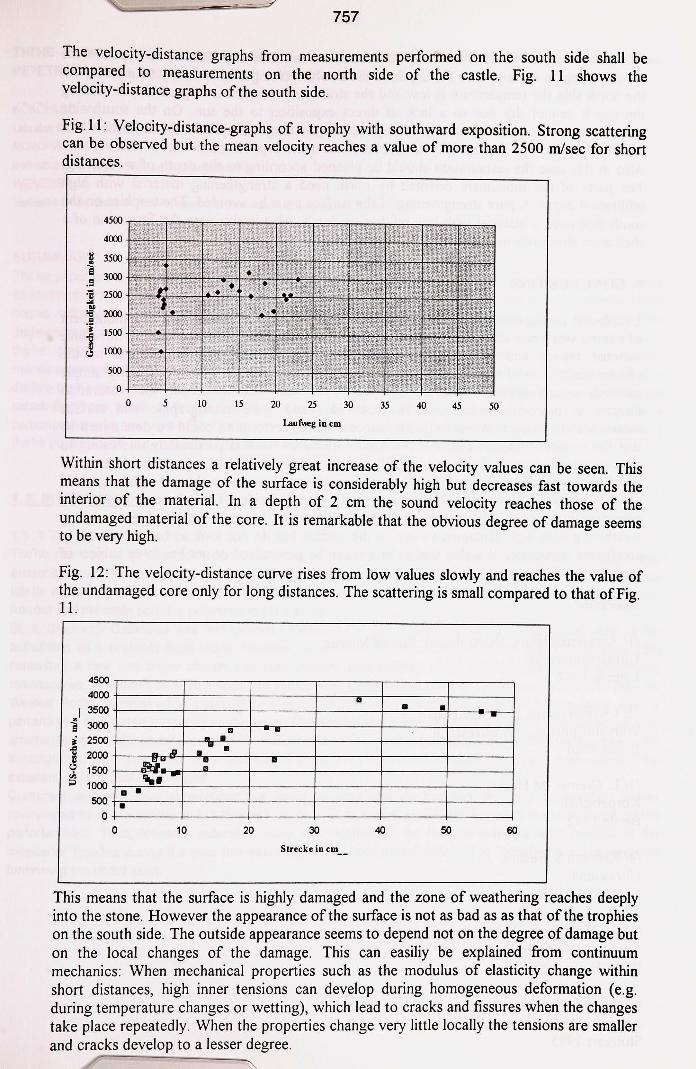
The velocity-distance graphs from measurements performed on the south side shall be compared to measurements on the north side of the castle. Fig. 11 shows the velocity-distance graphs of the south side.
Fig.11 : Velocity-distance-graphs of a trophy with southward exposition. Strong scattering can be observed but the mean velocity reaches a value of more than 2500 m/sec for short distances.
4500
4<XXl
-I 3500
.!! 3<XXl
·'ii 2500 ... ~ 2<XXl Cl
'i 1500
l l<XXl
500
5 10 15 20 25 30 35 40 45 50
l..aurneg in cm
Within short distances a relatively great increase of the velocity values can be seen. This means that the damage of the surface is considerably high but decreases fast towards the interior of the material. In a depth of 2 cm the sound velocity reaches those of the undamaged material of the core. It is remarkable that the obvious degree of damage seems to be very high.
Fig. 12: The velocity-distance curve rises from low values slowly and reaches the value of the undamaged core only for long distances. The scattering is small compared to that of Fig. 11.
4500 4000
I 3500 i 3000
~ 2500
~. 2000 c3 1500 "' ;J 1000
500
0 0
_.._ • Ill
zJ~ .... II D
II ,.-- _Ill
D D
• 10
• • • --. -.--.-
•
20 30 40 50 60
Strecke in cm __
This means that the surface is highly damaged and the zone of weathering reaches deeply into the stone. However the appearance of the surface is not as bad as as that of the trophies on the south side. The outside appearance seems to depend not on the degree of damage but on the local changes of the damage. This can easiliy be explained from continuum mechanics: When mechanical properties such as the modulus of elasticity change within short distances, high inner tensions can develop during homogeneous deformation (e.g. during temperature changes or wetting), which lead to cracks and fissures when the changes take place repeatedly. When the properties change very little locally the tensions are smaller and cracks develop to a lesser degree.

758
The greater depth of the weathering zone can also easily be explained: The depth ot the damaged region correlates to the depth down to which changes in humidity take place. On the north side the temperature is low and the stone gets wet down to great depth. During the day it cannot dry due to a lack of direct exposition to the sun. On the south side however the stone gets wet during the night when the temperature is low, but in the sun it can dry that fast, that the humidity cannot reach the same depth as on the north side. Also in this case the restauration should be planned according to the depth of weathering. The parts of the monument oriented by north need a strengthening material with high infiltration depth. A pure strengthening of the surface must be avoided. The trophies on the south side need a material with low infiltration depth. Also in this case the formation of a shell must absolutely be avoided.
7. CONCLUSIONS
Ultrasound measurements can be used to determine the state of weathering of a monument of natural stone non-distructively. The methods used are similar to those used in ultrasonic material testing and in seismic measurements. By adapting the wavelength to the characteristic size of the object they can easily be transferred. Two particularly simple methods were explained. Results were presented which had influenced the restoration directly in practical application. The methods used were tomographic and surface measurements (refraction method). The success of the restoration could be determined so that the restorer was able to proof the quality of his work. It is particularly interesting to note that depending on the exposition different properties of weathering can be determined which demand different treatment: Objects in southward exposition show weathering close to the surface which decreases quickly with depth inside. The obvious damage is considerable severe. Objects in northward exposition however show deep reaching weathering with high damaging values on the surface but do not look as bad as objects in southward exposition. Whether this statement can be generalised or not has to be subject of further investigation.
Literature:
III Autorenkollektiv, federfuhrend : Rudolf Millner Ultraschalltechnik Leipzig 1987
121 JKrautkramer, H. Krautkramer: Werkstoffprufung mit Ultraschall Berlin 1986
131 L. .Cremer, M.Heckl : Korperschall Berlin 1982
141 Kenneth S. Suslick Ultrasound New York 1988
151, H. Militzer, F. Weber Herausgeber Angeandte Geophysik Wien, Berlin 1985
161 F.Bender Herausgeber Angewandte Geowissenschaften Stuttgart 1985