Embed Size (px)
Citation preview
The Association for University and College Counseling Center Directors
Annual Survey – Public Version 2018
Reporting period: July 1, 2017 through June 30, 2018
Peter LeViness, Ph.D. Director, Counseling and Psychological Services
University of Richmond
Carolyn Bershad, Ph.D. Director, Counseling and Wellness Services
SUNY Cortland
Kim Gorman, Ph.D. Director, Counseling and Psychological Services
Western Carolina University
Lynn Braun, M.A., PCC-S Assistant Dean of Campus Wellness,
Director of Counseling and Accessibility Services Defiance College
Trish Murray, Ph.D., LPCS
Director, Student Health and Counseling Davidson College
AUCCCD
The Association for University and College Counseling Center Directors (AUCCCD) is
an international organization comprised of colleges and universities from the United
States and its territories, Armenia, Australia, Canada, China, France, Grenada, Ireland,
Japan, Oman, Qatar, St. Kitts Nevis Anguilla, Uganda, and the United Kingdom.
AUCCCD works to be the higher education leaders for collegiate mental health.
AUCCCD Mission Statement
“We are a professional community that fosters director development and
success. To advance the mission of higher education, we innovate, educate and
advocate for collegiate mental health. We are committed to inclusive excellence and
the promotion of social justice.”
The AUCCCD Annual Survey Overview
In 2006, AUCCCD first developed and administered the Annual Survey to its
membership as a means to increase the objective understanding of factors critical to the
functioning of college and university counseling centers.
In December 2018, all members of AUCCCD, plus about 50 non-members who asked
to participate, were invited to complete the annual survey. Unique survey links were
sent to 930 verified email accounts via a secure internet interface. A total of 571
counseling center administrators responded to the 2018 survey, 542 of which were
AUCCCD members. This represented 61.2% of the 886 total AUCCCD members as of
December 2018.
The reporting period for the information on the 2018 Annual Survey was July 1, 2017
through June 30, 2018. This monograph serves to provide a summary of data trends
reported in the AUCCCD Annual Survey. AUCCCD members have access to a
separate monograph with identical tables that also includes responses to questions
about ethical dilemmas and legal issues experienced by centers.
AUCCCD Director Survey 2017-18 (Public Version)
2
For the first time this year, center staff and salary data were collected via spreadsheets
sent to each center (aka the “2018 Staff and Salary Survey”), rather than including
these questions on the online survey. One hundred and seventy of the 886 AUCCCD
members (a 19.2% response rate) completed and sent back staff and salary
spreadsheets. It is expected that the response rate to the staff and salary spreadsheets
will increase substantially in future years. In this monograph, most of the staff
demographic questions, and staff FTE data are from the 170 completed spreadsheets.
A separate “College and University Counseling Center Salary Tables” monograph has
been prepared using the salary data from the 170 spreadsheets, and is available on the
members-only section of the AUCCCD website (https://www/aucccd.org).
Please direct all questions, comments, and clarifications to the AUCCCD Survey
Coordinator:
Peter LeViness, Ph.D. Director, Counseling and Psychological Services University of Richmond [email protected]
AUCCCD Director Survey 2017-18 (Public Version)
3
Table of Contents
EXECUTIVE SUMMARY ..................................................................................................................... 1 DIRECTOR INFORMATION ................................................................................................................ 3
DIRECTOR RACIAL/ETHNIC BACKGROUND ......................................................................................... 3 DIRECTOR GENDER ............................................................................................................................ 3 DIRECTOR SEXUAL ORIENTATION ...................................................................................................... 3 DIRECTOR DOCUMENTED DISABILITY ................................................................................................. 3 DIRECTOR HIGHEST DEGREE ............................................................................................................. 4 DIRECTOR PROFESSIONAL IDENTITY .................................................................................................. 4 DIRECTOR LICENSE OR BOARD CERTIFICATION ................................................................................. 4 DIRECTOR: YEARS OF EXPERIENCE AS DIRECTOR IN CURRENT POSITION ....................................... 4 DIRECTOR: TOTAL YEARS OF PROFESSIONAL EXPERIENCE .............................................................. 5 IS DIRECTOR POSITION FULL-TIME 12 MONTHS ................................................................................ 5 DIRECTOR: HOURS WORKS PER WEEK ............................................................................................. 5 DIRECTOR COUNTRY OF CITIZENSHIP ................................................................................................ 5 AUCCCD MEMBERSHIP STATUS ....................................................................................................... 6 ONE-PERSON CENTERS ..................................................................................................................... 6 TIME SPENT BY DIRECTORS ............................................................................................................... 6 AREAS / FUNCTIONS DIRECTOR OVERSEES ....................................................................................... 7
INSTITUTIONAL INFORMATION ....................................................................................................... 8 COUNTRY INSTITUTION IS LOCATED IN ............................................................................................... 8 STATE INSTITUTION IS LOCATED IN .................................................................................................... 8 SCHOOL LOCATION ............................................................................................................................. 9 SCHOOL SIZE (ENROLLMENT CATEGORIES)....................................................................................... 9 SCHOOL STATUS ................................................................................................................................ 9 PERCENT OF ENROLLED UNDERGRADUATE STUDENTS WHO LIVE ON-CAMPUS ............................ 10 CAMPUS TEAMS AND POLICIES ........................................................................................................ 10 TYPES OF ENROLLED STUDENTS ..................................................................................................... 11 AFFILIATIONS OF INSTITUTION .......................................................................................................... 11
CENTER INFORMATION .................................................................................................................. 12 INSTITUTIONAL DIVISION CENTER IS PART OF .................................................................................. 12 MONTHS OF YEAR THAT CENTER IS OPEN FOR COUNSELING SERVICES ........................................ 12 TIME FIRST CLINICAL APPOINTMENT BEGAN AT CENTER ................................................................. 12 DOES CENTER OFFER ANY CLINICAL APPOINTMENTS ON WEEKENDS ............................................ 12 TIME LAST CLINICAL APPOINTMENT ENDED AT CENTER .................................................................. 13 CENTER POLICY ABOUT FREQUENCY OF INDIVIDUAL COUNSELING APPOINTMENTS....................... 13 INTEGRAL PARTS OF CENTERS’ MISSION ......................................................................................... 14 TELE-HEALTH SERVICES: ANY PROVIDED ........................................................................................ 14 TELE-HEALTH SERVICES: TYPES PROVIDED .................................................................................... 14 EMBEDDED COUNSELORS: CENTERS THAT HAVE ANY .................................................................... 15 EMBEDDED COUNSELORS: LOCATION .............................................................................................. 15 AVERAGE TIME SPENT BY STAFF COUNSELORS .............................................................................. 16
AUCCCD Director Survey 2017-18 (Public Version)
4
CLINICAL MODEL, CLINICAL CAPACITY, CLINICAL FTE, AND CLINICAL LOAD INDEX .. 17 CLINICAL MODEL USED AT CENTER ................................................................................................. 17 CLINICAL MODEL BY SIZE OF INSTITUTION ....................................................................................... 17 CLINICAL CAPACITY OF CENTER BY SIZE OF INSTITUTION AND CLINICAL MODEL ............................ 18 CLINICAL FTE (CFTE) OF CENTER BY SIZE AND CLINICAL MODEL ................................................. 18 CLINICAL CAPACITY OF CENTER BY SIZE OF INSTITUTION ............................................................... 19 CLINICAL FTE OF CENTER BY SIZE .................................................................................................. 19 CLINICAL LOAD INDEX (CLI) BY SIZE ................................................................................................ 20 STAFF TURNOVER IN PAST YEAR ..................................................................................................... 20 STAFF TURNOVER: WAS LOW SALARY A FACTOR............................................................................ 21 STAFF TURNOVER: WERE CENTER WORK CONDITIONS A FACTOR ................................................. 21
CENTER BUDGET INFORMATION ................................................................................................. 22 CENTER SALARY AND BENEFITS BUDGET ........................................................................................ 22 CENTER OPERATING EXPENSES BUDGET ........................................................................................ 22 CENTER PROFESSIONAL DEVELOPMENT BUDGET ........................................................................... 23 PERCENT OF CENTER BUDGET PROVIDED BY MANDATORY FEE ..................................................... 23 SOURCE OF MANDATORY FEE .......................................................................................................... 24 NO-SHOW FEES ............................................................................................................................... 24 FEES CHARGED FOR NO-SHOWS ..................................................................................................... 25
PERCENT OF CAMPUS SERVED BY COUNSELING SERVICES ............................................. 26 PERCENT OF CAMPUS SERVED BY COUNSELING SERVICES* .......................................................... 26 PERCENT OF CAMPUS SERVED BY COUNSELING SERVICES: COMMUNITY COLLEGES ONLY .......... 26
CENTER CLINICAL SERVICES PROVIDED .................................................................................. 27 CRISIS APPOINTMENTS: CENTERS IN THE U.S. ............................................................................... 27 CRISIS APPOINTMENTS: CENTERS NOT IN THE U.S. ...................................................................... 27 CRISIS APPOINTMENTS AFTER-HOURS: CENTERS IN THE U.S. ....................................................... 28 CRISIS APPOINTMENTS AFTER-HOURS: CENTERS NOT IN THE U.S. .............................................. 28 TRIAGE APPOINTMENTS: HOW CONDUCTED .................................................................................... 29 TRIAGE APPOINTMENTS: HOW MANY WERE ATTENDED .................................................................. 29 TRIAGE APPOINTMENTS: TYPICAL LENGTH ...................................................................................... 30
“TALK THERAPY” APPOINTMENTS ............................................................................................. 31 TALK THERAPY: UNIQUE CLIENTS WHO ATTENDED ......................................................................... 31 TALK THERAPY: NUMBER OF APPOINTMENTS ATTENDED ................................................................ 31 TALK THERAPY: AVERAGE APPOINTMENTS ATTENDED PER CLIENT ................................................ 32 TALK THERAPY: APPOINTMENTS NO-SHOWED ................................................................................ 32 TALK THERAPY: APPOINTMENTS CANCELLED OR RESCHEDULED.................................................... 33 TALK THERAPY: ................................................................................................................................ 33 PERCENT APPOINTMENTS SCHEDULED FOR < 50 MIN ..................................................................... 33
PSYCHIATRIC APPOINTMENTS .................................................................................................... 34 PSYCHIATRIC SERVICES: ANY AVAILABLE AT CENTER ..................................................................... 34 PSYCHIATRIC SERVICES: UNIQUE CLIENTS WHO ATTENDED .......................................................... 34 PSYCHIATRIC SERVICES: APPOINTMENTS ATTENDED ...................................................................... 35 PSYCHIATRIC SERVICES: APPOINTMENTS ATTENDED PER CLIENT.................................................. 35 PSYCHIATRIC SERVICES: APPOINTMENTS NO-SHOWED BY CLIENTS .............................................. 36 PSYCHIATRIC SERVICES: APPOINTMENTS CANCELLED OR RESCHEDULED ..................................... 36 PSYCHIATRIC SERVICES: SUFFICIENCY OF AVAILABLE HOURS ........................................................ 37
AUCCCD Director Survey 2017-18 (Public Version)
5
GROUP THERAPY ............................................................................................................................ 38 GROUP THERAPY: NUMBER OF GROUPS CENTER RAN ................................................................... 38 GROUP THERAPY: UNIQUE STUDENTS WHO ATTENDED ................................................................. 38
CLIENT PRESENTING PROBLEMS ............................................................................................... 39 CLIENT PRESENTING PROBLEMS ...................................................................................................... 39
ACADEMIC IMPACT OF COUNSELING......................................................................................... 40 CLIENTS REPORTING COUNSELING HELPED THEIR ACADEMIC PERFORMANCE .............................. 40 CLIENTS REPORTING COUNSELING HELPED THEM STAY IN SCHOOL .............................................. 40
OTHER SIGNIFICANT EVENTS....................................................................................................... 40 CLIENTS WHO TOOK A LEAVE FOR PSYCHOLOGICAL REASONS ...................................................... 40 CLIENTS SENT TO HOSPITAL FOR PSYCHOLOGICAL REASONS ........................................................ 41 CLIENTS ADMITTED TO HOSPITAL FOR PSYCHOLOGICAL REASONS ................................................ 41 INVOLUNTARY HOSPITALIZATIONS .................................................................................................... 42 CLIENTS WHO ATTEMPTED SUICIDE ................................................................................................ 42 CLIENTS WHO DIED BY SUICIDE ....................................................................................................... 43 CLIENTS WHO DIED IN AN ACCIDENT ............................................................................................... 43
SESSION LIMITS ............................................................................................................................... 44 ANY SESSION LIMIT .......................................................................................................................... 44 TYPE OF SESSION LIMIT ................................................................................................................... 44 SESSION LIMIT TIME FRAME ............................................................................................................. 44 SESSION LIMIT NUMBER ................................................................................................................... 45
WAIT LISTS ........................................................................................................................................ 46 CENTERS THAT HAD ANY CLIENTS ON A WAITLIST .......................................................................... 46 WEEKS WAITLIST WAS IN EFFECT.................................................................................................... 46 MAXIMUM NUMBER OF CLIENTS ON WAITLIST .................................................................................. 47 WHEN CLIENTS ARE PUT ON WAITLIST ............................................................................................ 47 WHO HAS RESPONSIBILITY FOR WAITLIST CLIENTS ........................................................................ 47 AVERAGE WAIT FOR FIRST APPOINTMENT (ALL CLIENTS) ............................................................... 48 AVERAGE WAIT FOR FIRST APPOINTMENT AFTER TRIAGE APPOINTMENT....................................... 48 AVERAGE WAIT FOR FIRST APPOINTMENT (WAITLIST CLIENTS ONLY) ............................................ 49 FIRST APPOINTMENT WAS A CRISIS ................................................................................................. 49
FTE OF CLINICAL STAFF ................................................................................................................ 50 PROFESSIONAL / CLINICAL (“TALK THERAPY”) FTES ....................................................................... 50 PROFESSIONAL / CLINICAL (“TALK THERAPY”) TRAINEES FTES ...................................................... 50 PSYCHIATRIC PROVIDER FTES ........................................................................................................ 51 CENTERS THAT HAVE ANY PSYCHIATRIC PROVIDER ....................................................................... 51 SUPPORT STAFF FTES ..................................................................................................................... 52
DEMOGRAPHICS OF STAFF EMPLOYEES.................................................................................. 53
CASE MANAGERS ............................................................................................................................ 54 CASE MANAGERS: CENTERS THAT HAVE ANY ................................................................................. 54 CASE MANAGERS: HOW MANY ON THE CAMPUS ............................................................................. 54 CASE MANAGERS: SERVICES PROVIDED BY .................................................................................... 55 OTHER CAMPUS OFFICES WITH CASE MANAGER(S) ....................................................................... 55
CENTER POSITIONS GAINED AND LOST .................................................................................... 56
AUCCCD Director Survey 2017-18 (Public Version)
6
STUDENT TO STAFF RATIOS ........................................................................................................ 57 STUDENT TO COUNSELING STAFF RATIO (“TALK THERAPY” FTE STAFF ONLY).............................. 57 NUMBER OF STUDENTS SERVED PER FTE “TALK THERAPY” STAFF AND TRAINEES ....................... 57
COUNSELING AND HEALTH SERVICES COLLABORATION ................................................... 58 COUNSELING SERVICES’ PROXIMITY TO HEALTH SERVICES ............................................................ 58 RESOURCES COUNSELING AND HEALTH SERVICES SHARE IN COMMON ......................................... 58 NUMBER OF CLIENTS WHO REQUIRED COORDINATION OF CARE .................................................... 59 COORDINATION OF CARE BETWEEN COUNSELING AND HEALTH SERVICES .................................... 59 SHARING OF RECORDS BETWEEN COUNSELING AND HEALTH SERVICES ....................................... 59 CURRENT ARRANGEMENT BETWEEN COUNSELING AND HEALTH SERVICES ................................... 60 SUPERVISOR’S PROFESSIONAL BACKGROUND ................................................................................ 60 DEGREE OF COLLABORATION BETWEEN COUNSELING AND HEALTH SERVICES.............................. 60 QUALITY OF COLLABORATION BETWEEN COUNSELING AND HEALTH SERVICES ............................. 61 RECORD-KEEPING SYSTEM USED BY COUNSELING SERVICES ....................................................... 61 RECORD-KEEPING SYSTEM USED BY HEALTH SERVICES ................................................................ 61
PARTICIPATING COLLEGES AND UNIVERSITIES ..................................................................... 62
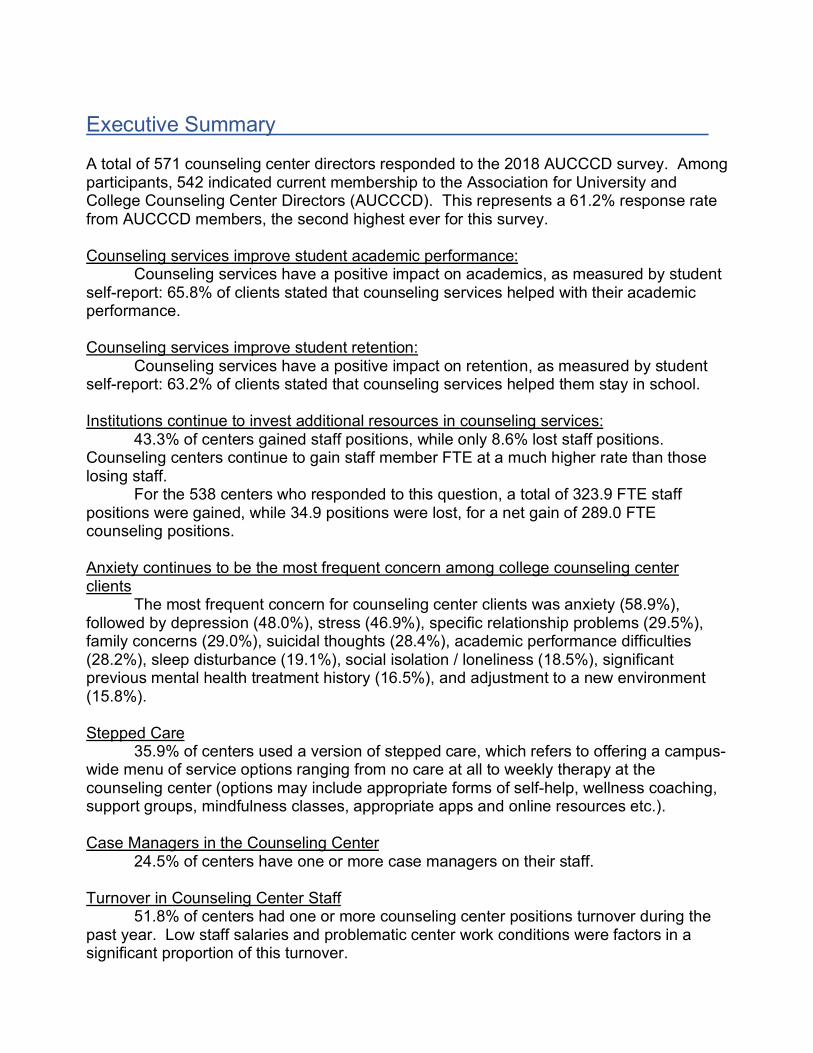
Executive Summary A total of 571 counseling center directors responded to the 2018 AUCCCD survey. Among participants, 542 indicated current membership to the Association for University and College Counseling Center Directors (AUCCCD). This represents a 61.2% response rate from AUCCCD members, the second highest ever for this survey. Counseling services improve student academic performance:
Counseling services have a positive impact on academics, as measured by student self-report: 65.8% of clients stated that counseling services helped with their academic performance. Counseling services improve student retention:
Counseling services have a positive impact on retention, as measured by student self-report: 63.2% of clients stated that counseling services helped them stay in school. Institutions continue to invest additional resources in counseling services:
43.3% of centers gained staff positions, while only 8.6% lost staff positions. Counseling centers continue to gain staff member FTE at a much higher rate than those losing staff.
For the 538 centers who responded to this question, a total of 323.9 FTE staff positions were gained, while 34.9 positions were lost, for a net gain of 289.0 FTE counseling positions. Anxiety continues to be the most frequent concern among college counseling center clients
The most frequent concern for counseling center clients was anxiety (58.9%), followed by depression (48.0%), stress (46.9%), specific relationship problems (29.5%), family concerns (29.0%), suicidal thoughts (28.4%), academic performance difficulties (28.2%), sleep disturbance (19.1%), social isolation / loneliness (18.5%), significant previous mental health treatment history (16.5%), and adjustment to a new environment (15.8%). Stepped Care
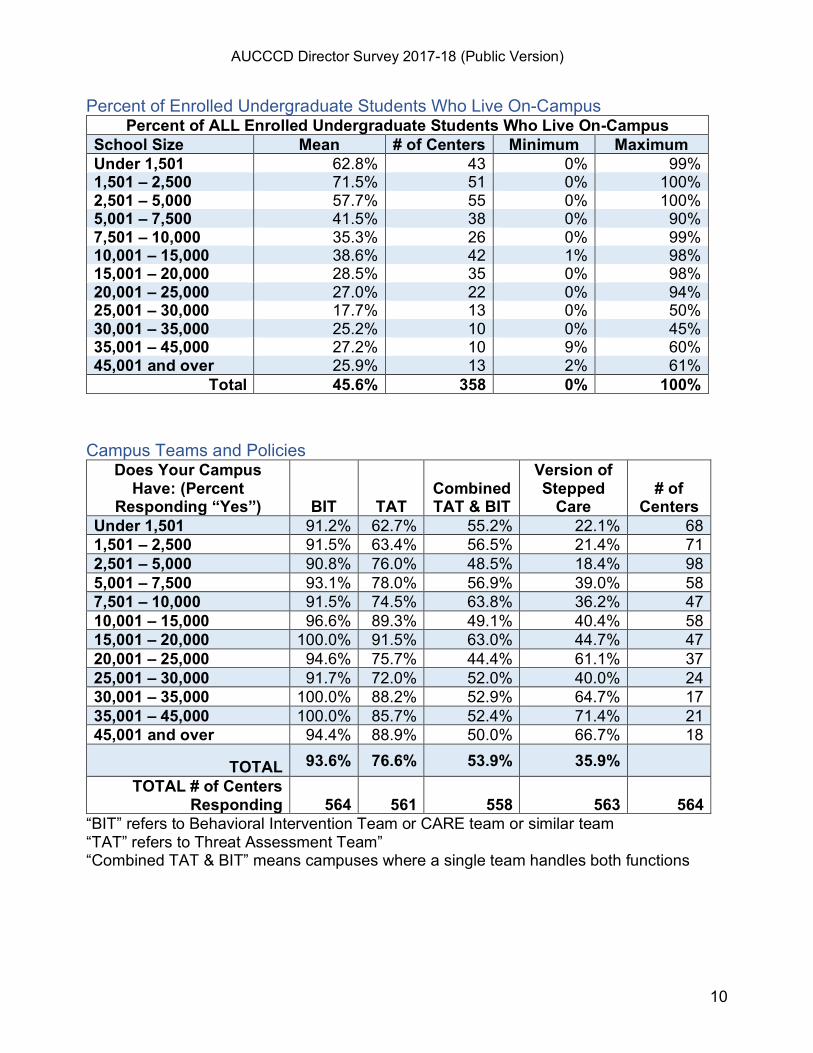
35.9% of centers used a version of stepped care, which refers to offering a campus-wide menu of service options ranging from no care at all to weekly therapy at the counseling center (options may include appropriate forms of self-help, wellness coaching, support groups, mindfulness classes, appropriate apps and online resources etc.). Case Managers in the Counseling Center 24.5% of centers have one or more case managers on their staff. Turnover in Counseling Center Staff 51.8% of centers had one or more counseling center positions turnover during the past year. Low staff salaries and problematic center work conditions were factors in a significant proportion of this turnover.
AUCCCD Director Survey 2017-18 (Public Version)
2
Clinical Models Used at Centers
At 37.3% of centers, clinical staff are expected to evaluate and then assume primary clinical responsibility for a specific number of new clients each week, regardless of how many clients they were currently responsible for. (Absorption model)
At 24.3% of centers, clinical staff are expected to evaluate a specific number of new clients per week (triage, screening, intake, etc.) but were not expected to assume primary clinical responsibility. (Standard Treatment Model A)
At 38.4% of centers, clinical staff are expected to accept a new client for an initial assessment and subsequently assume primary clinical responsibility for a client ONLY if there is an available space on their schedule. (Standard Treatment Model B)
Clinical Load Index A new measure, the Clinical Load Index (CLI) was introduced on the survey this year. The CLI, along with associated new measures (clinical capacity, and clinical FTE) may prove to be an improved method for evaluating and comparing counseling center clinical resources. Psychiatric Services on Campus
46.6% of directors reported that psychiatric services are offered on their campus. 57.0% of directors whose centers have psychiatric services reported that they need more hours of psychiatric services than they currently have to meet student needs. Session Limits
54.3% of centers do not have a session limit, another 44.5% have a flexible session limit (state a limit but exceptions are made), and only 1.2% have a “hard” session limit (no exceptions). Wait for a First Appointment
The average wait for all clients for a first appointment was 6.5 business days. Waitlist
66.3% of centers reported that they did NOT have a waitlist. For centers that have a waitlist, the average wait for a first appointment for clients on the waitlist was 17.7 business days. Counselors Embedded in Other Campus Locations
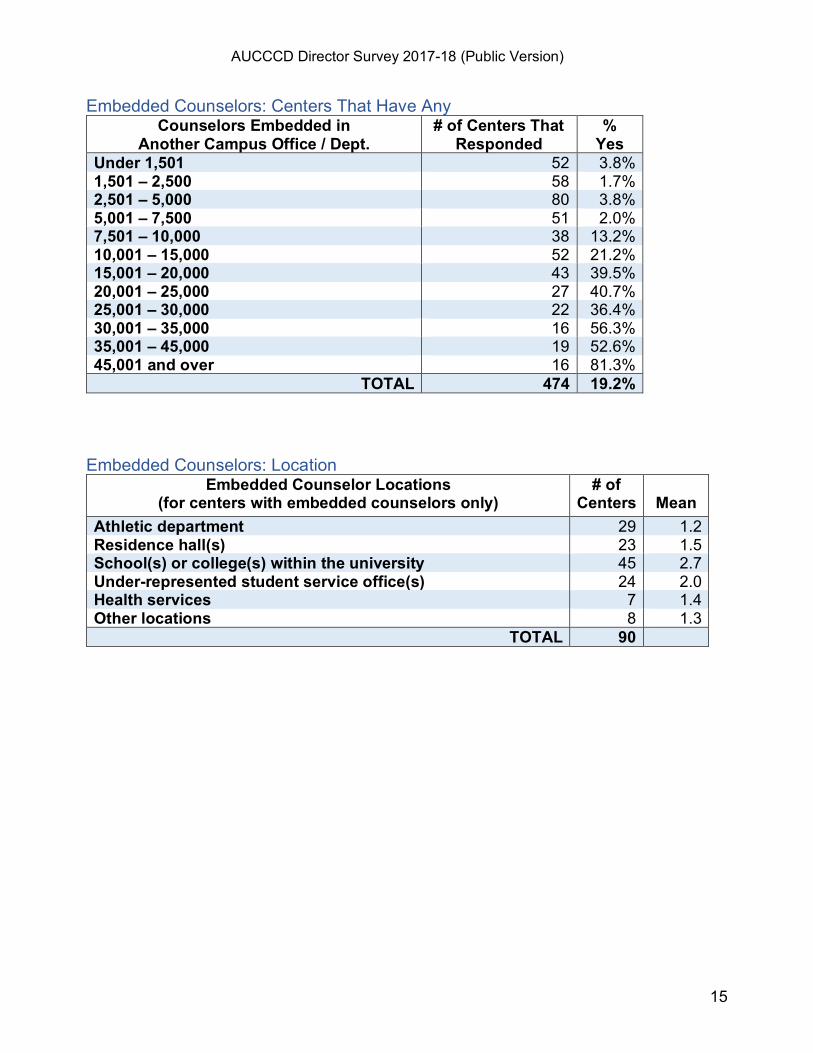
19.2% of centers have counselors embedded in other offices on campus. Larger centers are more likely to have embedded counselors. Counseling Clients Requiring Coordinated Care with Medical Providers
95.8% of counseling center clients did NOT require coordination of care with medical providers (except for psychiatric providers). 18.4% required coordination of care with psychiatric providers (often located in the counseling center).
AUCCCD Director Survey 2017-18 (Public Version)
3
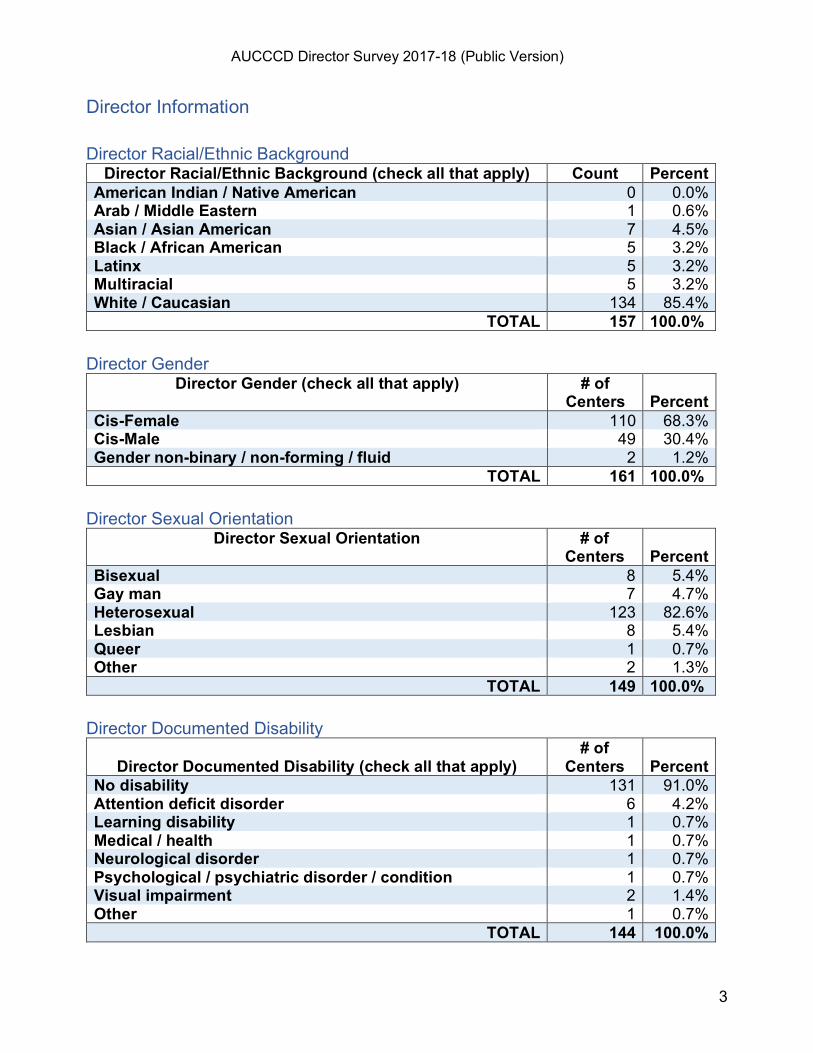
Director Information Director Racial/Ethnic Background
Director Racial/Ethnic Background (check all that apply) Count Percent American Indian / Native American 0 0.0% Arab / Middle Eastern 1 0.6% Asian / Asian American 7 4.5% Black / African American 5 3.2% Latinx 5 3.2% Multiracial 5 3.2% White / Caucasian 134 85.4%
TOTAL 157 100.0% Director Gender
Director Gender (check all that apply) # of Centers
Percent
Cis-Female 110 68.3% Cis-Male 49 30.4% Gender non-binary / non-forming / fluid 2 1.2%
TOTAL 161 100.0% Director Sexual Orientation
Director Sexual Orientation # of Centers
Percent
Bisexual 8 5.4% Gay man 7 4.7% Heterosexual 123 82.6% Lesbian 8 5.4% Queer 1 0.7% Other 2 1.3%
TOTAL 149 100.0% Director Documented Disability
Director Documented Disability (check all that apply)
# of Centers
Percent
No disability 131 91.0% Attention deficit disorder 6 4.2% Learning disability 1 0.7% Medical / health 1 0.7% Neurological disorder 1 0.7% Psychological / psychiatric disorder / condition 1 0.7% Visual impairment 2 1.4% Other 1 0.7%
TOTAL 144 100.0%
AUCCCD Director Survey 2017-18 (Public Version)
4
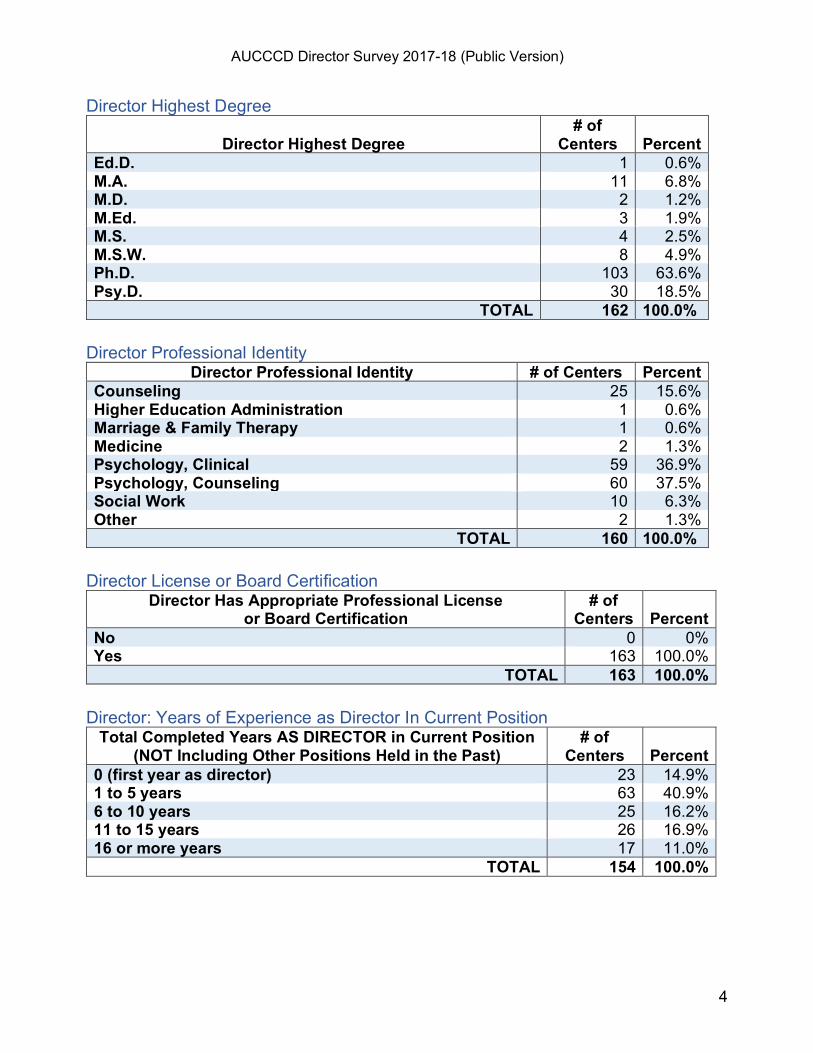
Director Highest Degree
Director Highest Degree # of
Centers
Percent Ed.D. 1 0.6% M.A. 11 6.8% M.D. 2 1.2% M.Ed. 3 1.9% M.S. 4 2.5% M.S.W. 8 4.9% Ph.D. 103 63.6% Psy.D. 30 18.5%
TOTAL 162 100.0% Director Professional Identity
Director Professional Identity # of Centers Percent Counseling 25 15.6% Higher Education Administration 1 0.6% Marriage & Family Therapy 1 0.6% Medicine 2 1.3% Psychology, Clinical 59 36.9% Psychology, Counseling 60 37.5% Social Work 10 6.3% Other 2 1.3%
TOTAL 160 100.0% Director License or Board Certification
Director Has Appropriate Professional License or Board Certification
# of Centers
Percent
No 0 0% Yes 163 100.0%
TOTAL 163 100.0% Director: Years of Experience as Director In Current Position
Total Completed Years AS DIRECTOR in Current Position (NOT Including Other Positions Held in the Past)
# of Centers
Percent
0 (first year as director) 23 14.9% 1 to 5 years 63 40.9% 6 to 10 years 25 16.2% 11 to 15 years 26 16.9% 16 or more years 17 11.0%
TOTAL 154 100.0%
AUCCCD Director Survey 2017-18 (Public Version)
5
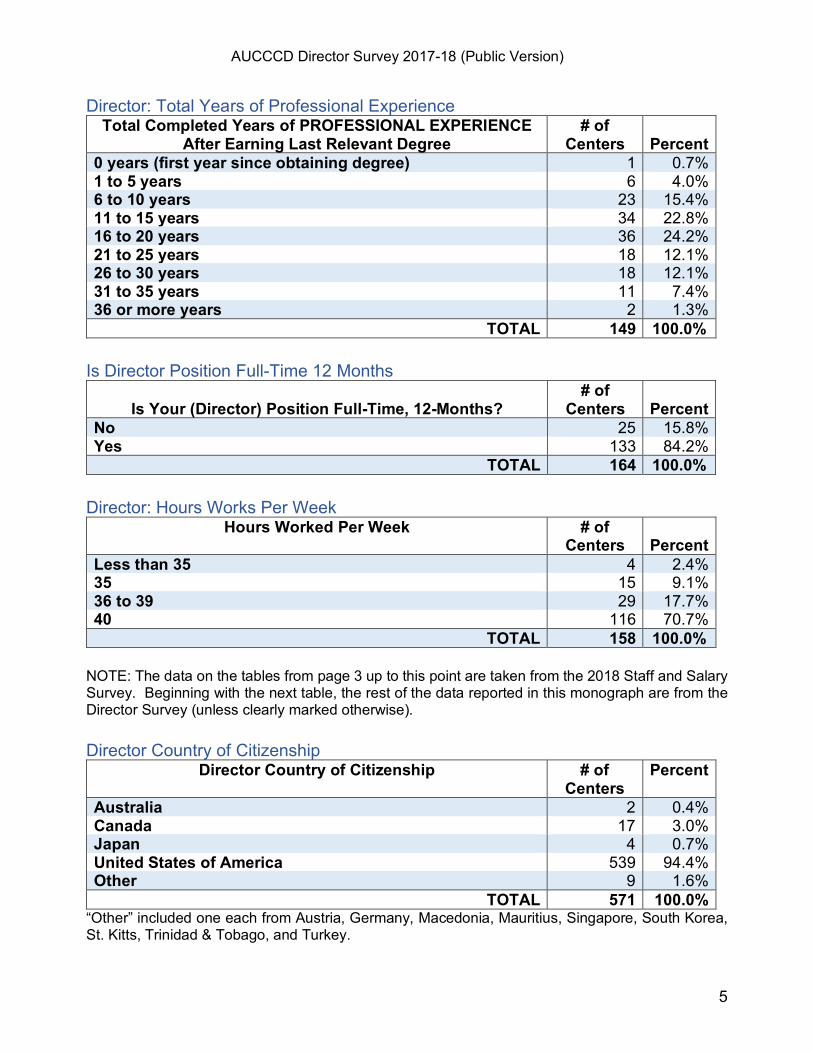
Director: Total Years of Professional Experience Total Completed Years of PROFESSIONAL EXPERIENCE
After Earning Last Relevant Degree # of
Centers
Percent 0 years (first year since obtaining degree) 1 0.7% 1 to 5 years 6 4.0% 6 to 10 years 23 15.4% 11 to 15 years 34 22.8% 16 to 20 years 36 24.2% 21 to 25 years 18 12.1% 26 to 30 years 18 12.1% 31 to 35 years 11 7.4% 36 or more years 2 1.3%
TOTAL 149 100.0% Is Director Position Full-Time 12 Months
Is Your (Director) Position Full-Time, 12-Months?
# of Centers
Percent
No 25 15.8% Yes 133 84.2%
TOTAL 164 100.0% Director: Hours Works Per Week
Hours Worked Per Week # of Centers
Percent
Less than 35 4 2.4% 35 15 9.1% 36 to 39 29 17.7% 40 116 70.7%
TOTAL 158 100.0% NOTE: The data on the tables from page 3 up to this point are taken from the 2018 Staff and Salary Survey. Beginning with the next table, the rest of the data reported in this monograph are from the Director Survey (unless clearly marked otherwise). Director Country of Citizenship
Director Country of Citizenship # of Centers
Percent
Australia 2 0.4% Canada 17 3.0% Japan 4 0.7% United States of America 539 94.4% Other 9 1.6%
TOTAL 571 100.0% “Other” included one each from Austria, Germany, Macedonia, Mauritius, Singapore, South Korea, St. Kitts, Trinidad & Tobago, and Turkey.
AUCCCD Director Survey 2017-18 (Public Version)
6
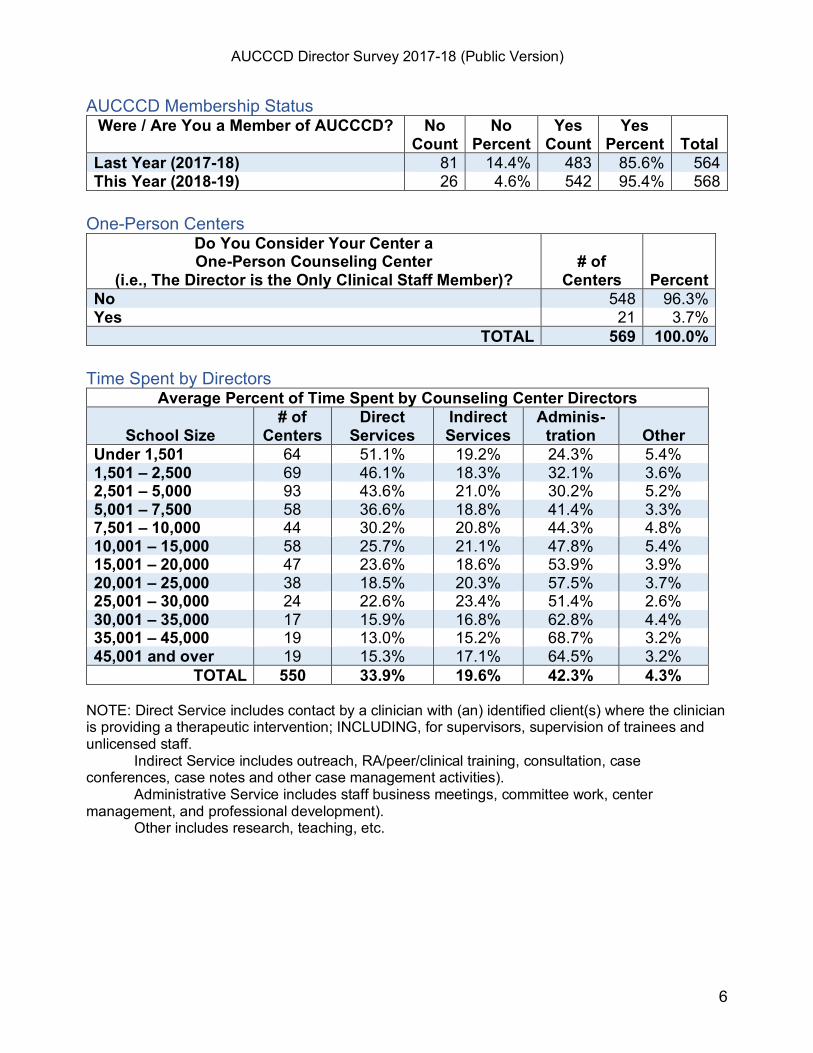
AUCCCD Membership Status Were / Are You a Member of AUCCCD? No
Count No
Percent Yes
Count Yes
Percent
Total Last Year (2017-18) 81 14.4% 483 85.6% 564 This Year (2018-19) 26 4.6% 542 95.4% 568
One-Person Centers
Do You Consider Your Center a One-Person Counseling Center
(i.e., The Director is the Only Clinical Staff Member)?
# of
Centers
Percent No 548 96.3% Yes 21 3.7%
TOTAL 569 100.0% Time Spent by Directors
Average Percent of Time Spent by Counseling Center Directors
School Size # of
Centers Direct
Services Indirect Services
Adminis-tration
Other
Under 1,501 64 51.1% 19.2% 24.3% 5.4% 1,501 – 2,500 69 46.1% 18.3% 32.1% 3.6% 2,501 – 5,000 93 43.6% 21.0% 30.2% 5.2% 5,001 – 7,500 58 36.6% 18.8% 41.4% 3.3% 7,501 – 10,000 44 30.2% 20.8% 44.3% 4.8% 10,001 – 15,000 58 25.7% 21.1% 47.8% 5.4% 15,001 – 20,000 47 23.6% 18.6% 53.9% 3.9% 20,001 – 25,000 38 18.5% 20.3% 57.5% 3.7% 25,001 – 30,000 24 22.6% 23.4% 51.4% 2.6% 30,001 – 35,000 17 15.9% 16.8% 62.8% 4.4% 35,001 – 45,000 19 13.0% 15.2% 68.7% 3.2% 45,001 and over 19 15.3% 17.1% 64.5% 3.2%
TOTAL 550 33.9% 19.6% 42.3% 4.3% NOTE: Direct Service includes contact by a clinician with (an) identified client(s) where the clinician is providing a therapeutic intervention; INCLUDING, for supervisors, supervision of trainees and unlicensed staff.
Indirect Service includes outreach, RA/peer/clinical training, consultation, case conferences, case notes and other case management activities).
Administrative Service includes staff business meetings, committee work, center management, and professional development).
Other includes research, teaching, etc.
AUCCCD Director Survey 2017-18 (Public Version)
7
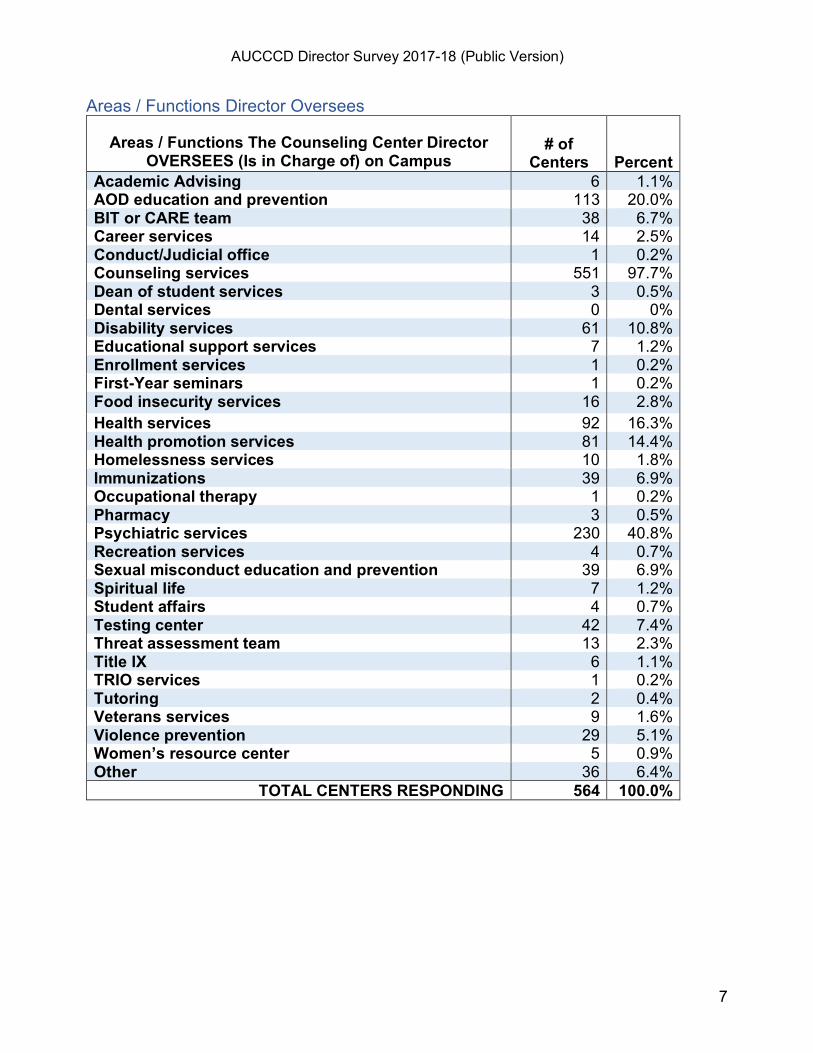
Areas / Functions Director Oversees
Areas / Functions The Counseling Center Director OVERSEES (Is in Charge of) on Campus
# of
Centers
Percent Academic Advising 6 1.1% AOD education and prevention 113 20.0% BIT or CARE team 38 6.7% Career services 14 2.5% Conduct/Judicial office 1 0.2% Counseling services 551 97.7% Dean of student services 3 0.5% Dental services 0 0% Disability services 61 10.8% Educational support services 7 1.2% Enrollment services 1 0.2% First-Year seminars 1 0.2% Food insecurity services 16 2.8% Health services 92 16.3% Health promotion services 81 14.4% Homelessness services 10 1.8% Immunizations 39 6.9% Occupational therapy 1 0.2% Pharmacy 3 0.5% Psychiatric services 230 40.8% Recreation services 4 0.7% Sexual misconduct education and prevention 39 6.9% Spiritual life 7 1.2% Student affairs 4 0.7% Testing center 42 7.4% Threat assessment team 13 2.3% Title IX 6 1.1% TRIO services 1 0.2% Tutoring 2 0.4% Veterans services 9 1.6% Violence prevention 29 5.1% Women’s resource center 5 0.9% Other 36 6.4%
TOTAL CENTERS RESPONDING 564 100.0%
AUCCCD Director Survey 2017-18 (Public Version)
8
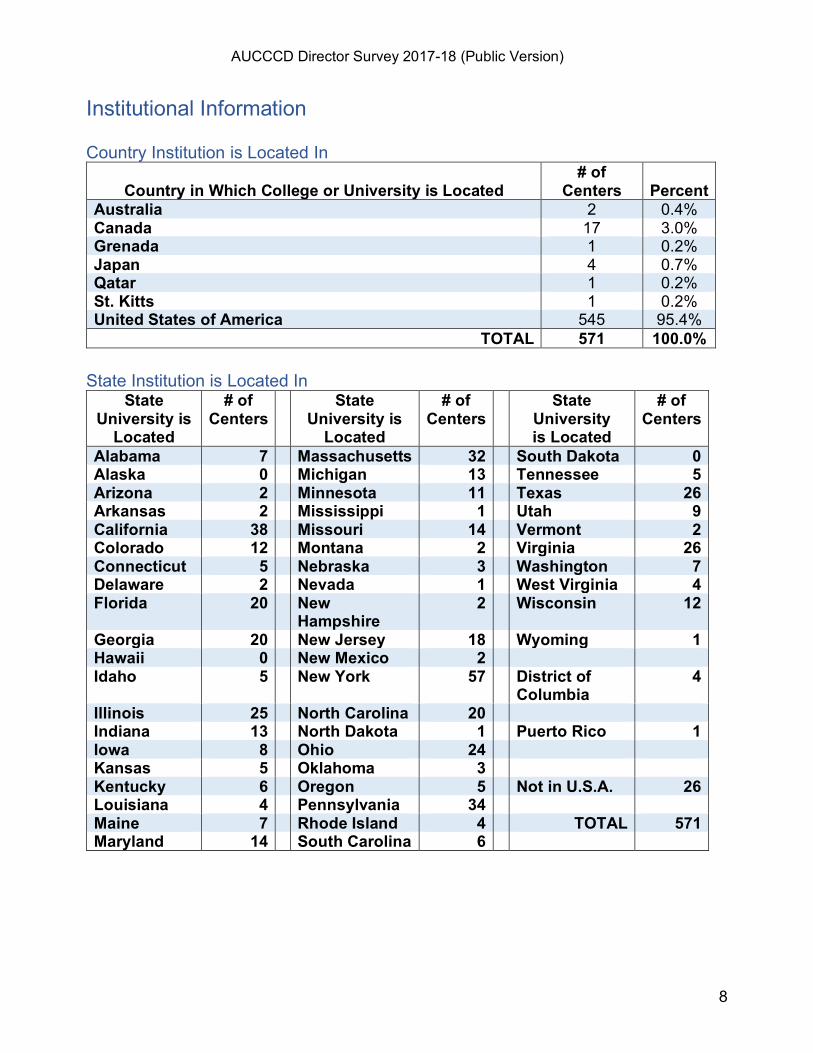
Institutional Information Country Institution is Located In
Country in Which College or University is Located
# of Centers
Percent
Australia 2 0.4% Canada 17 3.0% Grenada 1 0.2% Japan 4 0.7% Qatar 1 0.2% St. Kitts 1 0.2% United States of America 545 95.4%
TOTAL 571 100.0% State Institution is Located In
State University is
Located
# of Centers
State University is
Located
# of Centers
State University is Located
# of Centers
Alabama 7 Massachusetts 32 South Dakota 0 Alaska 0 Michigan 13 Tennessee 5 Arizona 2 Minnesota 11 Texas 26 Arkansas 2 Mississippi 1 Utah 9 California 38 Missouri 14 Vermont 2 Colorado 12 Montana 2 Virginia 26 Connecticut 5 Nebraska 3 Washington 7 Delaware 2 Nevada 1 West Virginia 4 Florida 20 New
Hampshire 2 Wisconsin 12
Georgia 20 New Jersey 18 Wyoming 1 Hawaii 0 New Mexico 2 Idaho 5 New York 57 District of
Columbia 4
Illinois 25 North Carolina 20 Indiana 13 North Dakota 1 Puerto Rico 1 Iowa 8 Ohio 24 Kansas 5 Oklahoma 3 Kentucky 6 Oregon 5 Not in U.S.A. 26 Louisiana 4 Pennsylvania 34 Maine 7 Rhode Island 4 TOTAL 571 Maryland 14 South Carolina 6
AUCCCD Director Survey 2017-18 (Public Version)
9
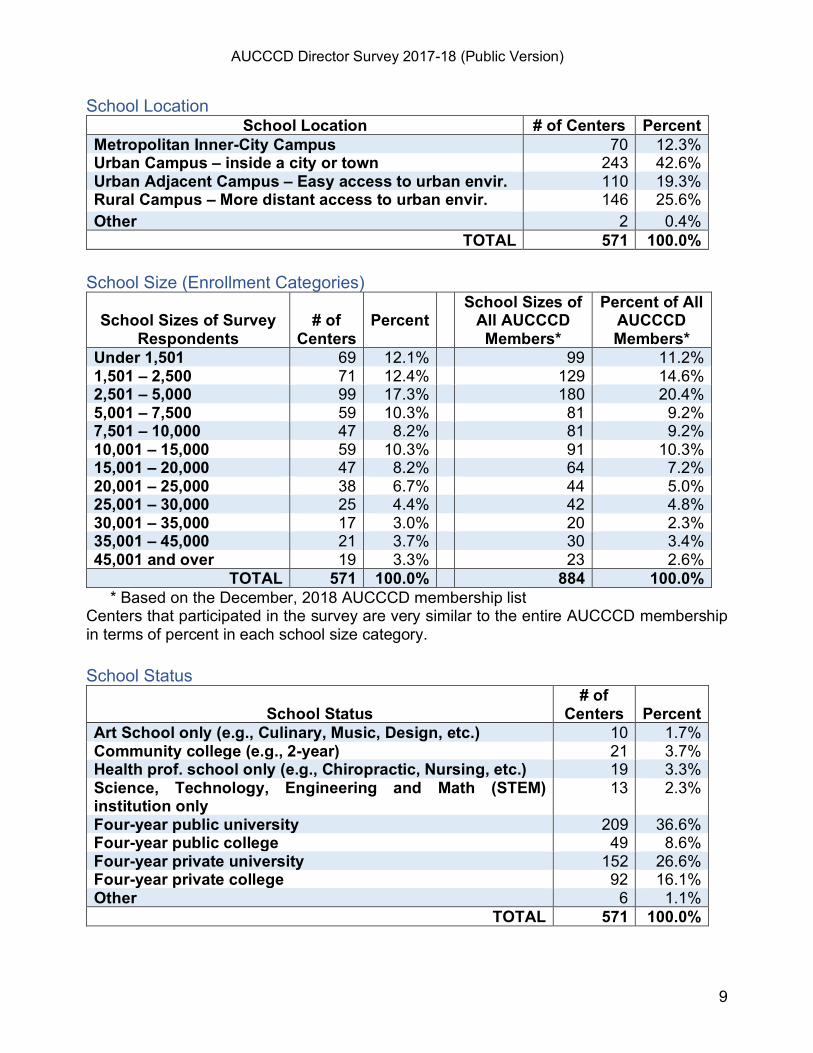
School Location School Location # of Centers Percent
Metropolitan Inner-City Campus 70 12.3% Urban Campus – inside a city or town 243 42.6% Urban Adjacent Campus – Easy access to urban envir. 110 19.3% Rural Campus – More distant access to urban envir. 146 25.6% Other 2 0.4%
TOTAL 571 100.0% School Size (Enrollment Categories)
School Sizes of Survey
Respondents
# of
Centers
Percent
School Sizes of All AUCCCD Members*
Percent of All AUCCCD Members*
Under 1,501 69 12.1% 99 11.2% 1,501 – 2,500 71 12.4% 129 14.6% 2,501 – 5,000 99 17.3% 180 20.4% 5,001 – 7,500 59 10.3% 81 9.2% 7,501 – 10,000 47 8.2% 81 9.2% 10,001 – 15,000 59 10.3% 91 10.3% 15,001 – 20,000 47 8.2% 64 7.2% 20,001 – 25,000 38 6.7% 44 5.0% 25,001 – 30,000 25 4.4% 42 4.8% 30,001 – 35,000 17 3.0% 20 2.3% 35,001 – 45,000 21 3.7% 30 3.4% 45,001 and over 19 3.3% 23 2.6%
TOTAL 571 100.0% 884 100.0% * Based on the December, 2018 AUCCCD membership list
Centers that participated in the survey are very similar to the entire AUCCCD membership in terms of percent in each school size category. School Status
School Status
# of Centers
Percent
Art School only (e.g., Culinary, Music, Design, etc.) 10 1.7% Community college (e.g., 2-year) 21 3.7% Health prof. school only (e.g., Chiropractic, Nursing, etc.) 19 3.3% Science, Technology, Engineering and Math (STEM) institution only
13 2.3%
Four-year public university 209 36.6% Four-year public college 49 8.6% Four-year private university 152 26.6% Four-year private college 92 16.1% Other 6 1.1%
TOTAL 571 100.0%
AUCCCD Director Survey 2017-18 (Public Version)
10
Percent of Enrolled Undergraduate Students Who Live On-Campus Percent of ALL Enrolled Undergraduate Students Who Live On-Campus
School Size Mean # of Centers Minimum Maximum Under 1,501 62.8% 43 0% 99% 1,501 – 2,500 71.5% 51 0% 100% 2,501 – 5,000 57.7% 55 0% 100% 5,001 – 7,500 41.5% 38 0% 90% 7,501 – 10,000 35.3% 26 0% 99% 10,001 – 15,000 38.6% 42 1% 98% 15,001 – 20,000 28.5% 35 0% 98% 20,001 – 25,000 27.0% 22 0% 94% 25,001 – 30,000 17.7% 13 0% 50% 30,001 – 35,000 25.2% 10 0% 45% 35,001 – 45,000 27.2% 10 9% 60% 45,001 and over 25.9% 13 2% 61%
Total 45.6% 358 0% 100%
Campus Teams and Policies
Does Your Campus Have: (Percent
Responding “Yes”)
BIT
TAT
Combined TAT & BIT
Version of Stepped
Care
# of
Centers Under 1,501 91.2% 62.7% 55.2% 22.1% 68 1,501 – 2,500 91.5% 63.4% 56.5% 21.4% 71 2,501 – 5,000 90.8% 76.0% 48.5% 18.4% 98 5,001 – 7,500 93.1% 78.0% 56.9% 39.0% 58 7,501 – 10,000 91.5% 74.5% 63.8% 36.2% 47 10,001 – 15,000 96.6% 89.3% 49.1% 40.4% 58 15,001 – 20,000 100.0% 91.5% 63.0% 44.7% 47 20,001 – 25,000 94.6% 75.7% 44.4% 61.1% 37 25,001 – 30,000 91.7% 72.0% 52.0% 40.0% 24 30,001 – 35,000 100.0% 88.2% 52.9% 64.7% 17 35,001 – 45,000 100.0% 85.7% 52.4% 71.4% 21 45,001 and over 94.4% 88.9% 50.0% 66.7% 18
TOTAL 93.6% 76.6% 53.9% 35.9%
TOTAL # of Centers Responding
564
561
558
563
564
“BIT” refers to Behavioral Intervention Team or CARE team or similar team “TAT” refers to Threat Assessment Team” “Combined TAT & BIT” means campuses where a single team handles both functions
AUCCCD Director Survey 2017-18 (Public Version)
11
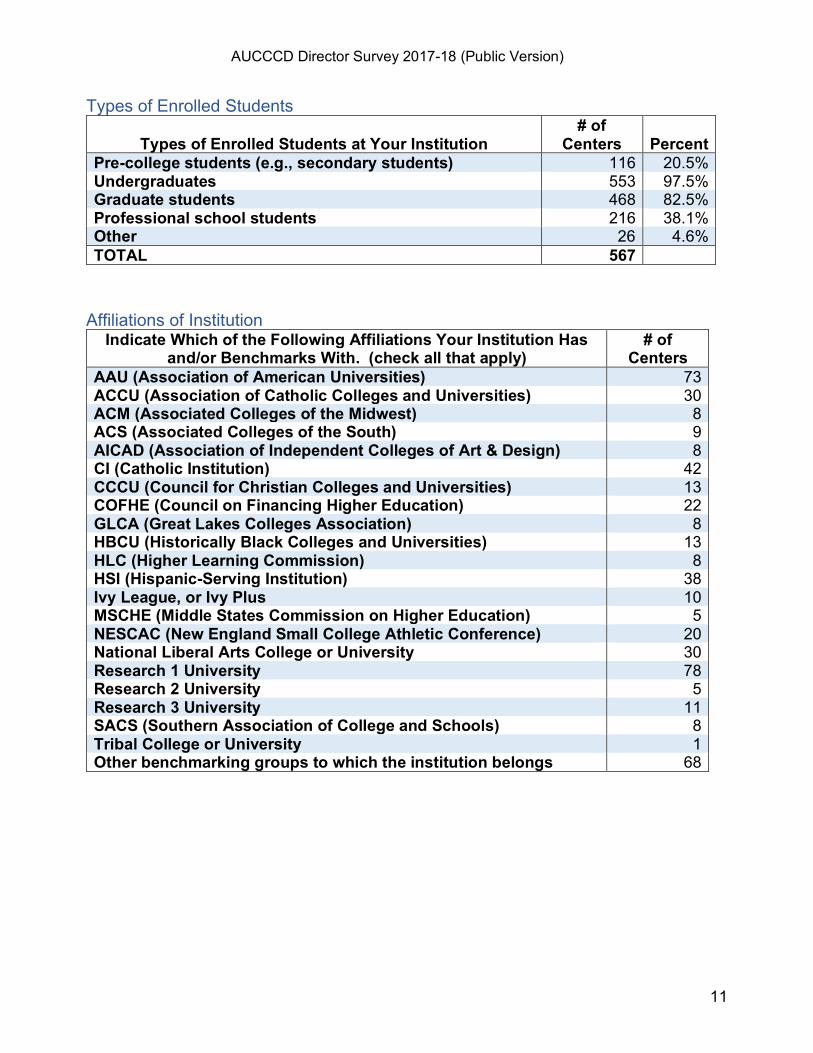
Types of Enrolled Students
Types of Enrolled Students at Your Institution # of
Centers
Percent Pre-college students (e.g., secondary students) 116 20.5% Undergraduates 553 97.5% Graduate students 468 82.5% Professional school students 216 38.1% Other 26 4.6% TOTAL 567
Affiliations of Institution
Indicate Which of the Following Affiliations Your Institution Has and/or Benchmarks With. (check all that apply)
# of Centers
AAU (Association of American Universities) 73 ACCU (Association of Catholic Colleges and Universities) 30 ACM (Associated Colleges of the Midwest) 8 ACS (Associated Colleges of the South) 9 AICAD (Association of Independent Colleges of Art & Design) 8 CI (Catholic Institution) 42 CCCU (Council for Christian Colleges and Universities) 13 COFHE (Council on Financing Higher Education) 22 GLCA (Great Lakes Colleges Association) 8 HBCU (Historically Black Colleges and Universities) 13 HLC (Higher Learning Commission) 8 HSI (Hispanic-Serving Institution) 38 Ivy League, or Ivy Plus 10 MSCHE (Middle States Commission on Higher Education) 5 NESCAC (New England Small College Athletic Conference) 20 National Liberal Arts College or University 30 Research 1 University 78 Research 2 University 5 Research 3 University 11 SACS (Southern Association of College and Schools) 8 Tribal College or University 1 Other benchmarking groups to which the institution belongs 68
AUCCCD Director Survey 2017-18 (Public Version)
12
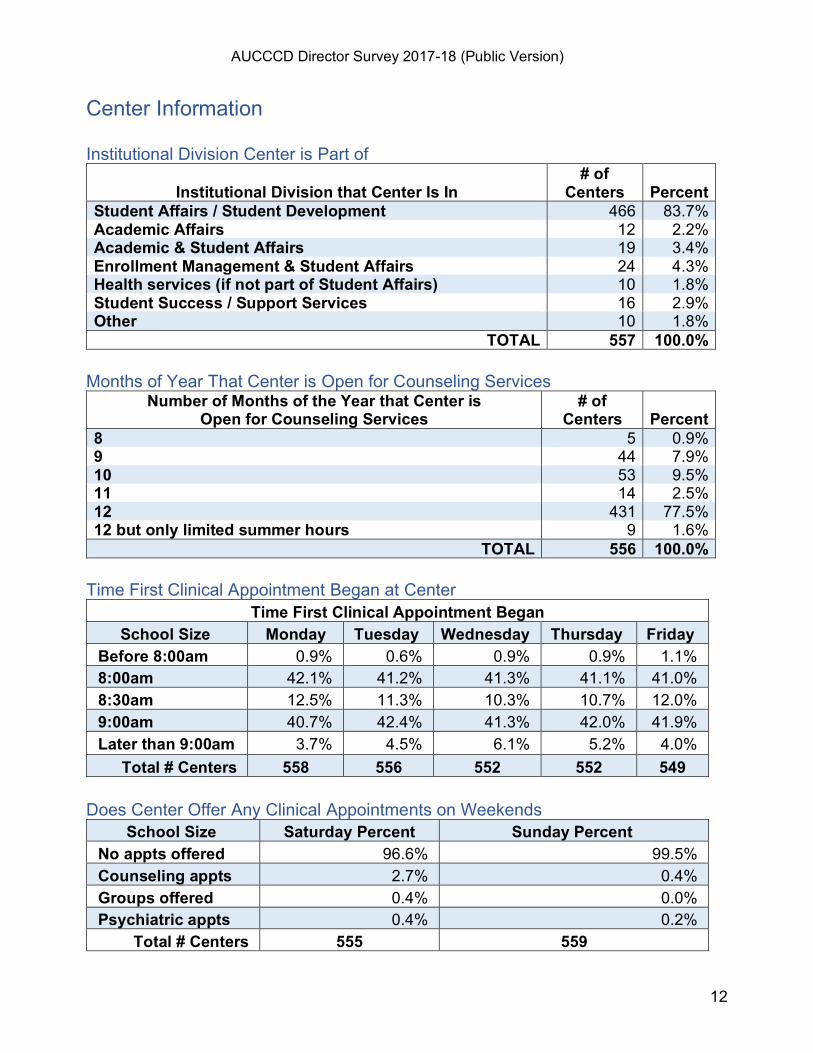
Center Information Institutional Division Center is Part of
Institutional Division that Center Is In
# of Centers
Percent
Student Affairs / Student Development 466 83.7% Academic Affairs 12 2.2% Academic & Student Affairs 19 3.4% Enrollment Management & Student Affairs 24 4.3% Health services (if not part of Student Affairs) 10 1.8% Student Success / Support Services 16 2.9% Other 10 1.8%
TOTAL 557 100.0% Months of Year That Center is Open for Counseling Services
Number of Months of the Year that Center is Open for Counseling Services
# of Centers
Percent
8 5 0.9% 9 44 7.9% 10 53 9.5% 11 14 2.5% 12 431 77.5% 12 but only limited summer hours 9 1.6%
TOTAL 556 100.0% Time First Clinical Appointment Began at Center
Time First Clinical Appointment Began School Size Monday Tuesday Wednesday Thursday Friday
Before 8:00am 0.9% 0.6% 0.9% 0.9% 1.1% 8:00am 42.1% 41.2% 41.3% 41.1% 41.0% 8:30am 12.5% 11.3% 10.3% 10.7% 12.0% 9:00am 40.7% 42.4% 41.3% 42.0% 41.9% Later than 9:00am 3.7% 4.5% 6.1% 5.2% 4.0%
Total # Centers 558 556 552 552 549 Does Center Offer Any Clinical Appointments on Weekends
School Size Saturday Percent Sunday Percent No appts offered 96.6% 99.5% Counseling appts 2.7% 0.4% Groups offered 0.4% 0.0% Psychiatric appts 0.4% 0.2%
Total # Centers 555 559
AUCCCD Director Survey 2017-18 (Public Version)
13
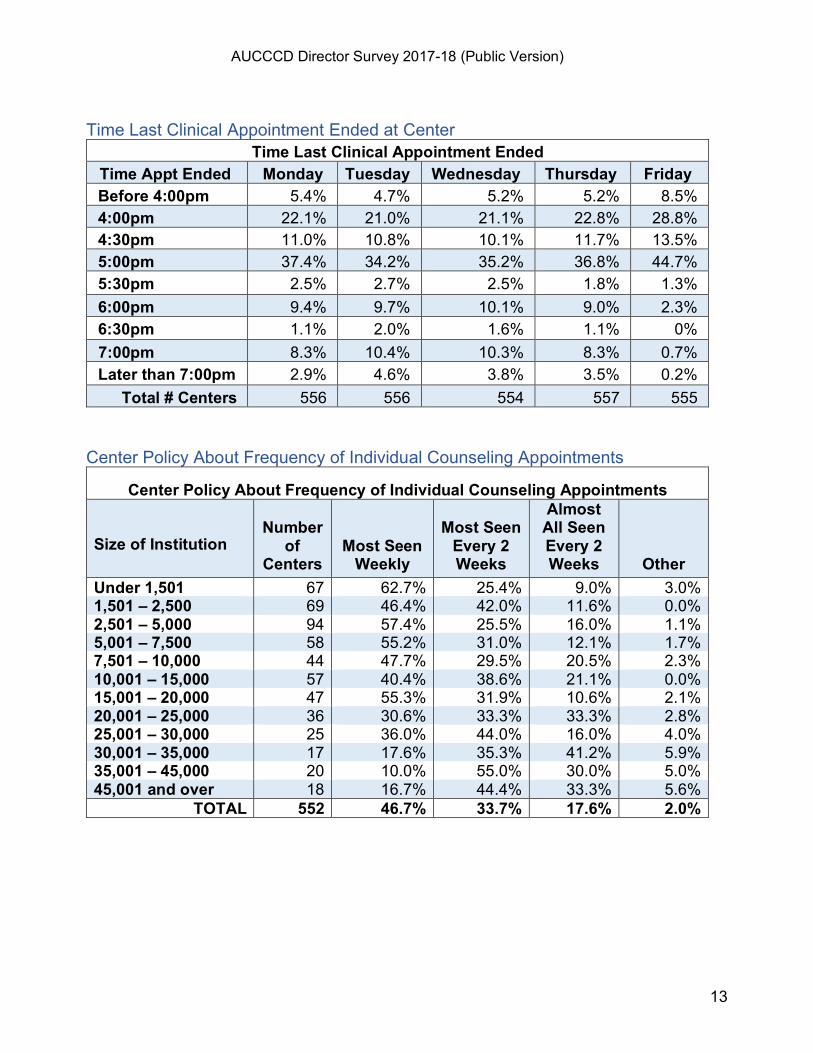
Time Last Clinical Appointment Ended at Center
Time Last Clinical Appointment Ended Time Appt Ended Monday Tuesday Wednesday Thursday Friday Before 4:00pm 5.4% 4.7% 5.2% 5.2% 8.5% 4:00pm 22.1% 21.0% 21.1% 22.8% 28.8% 4:30pm 11.0% 10.8% 10.1% 11.7% 13.5% 5:00pm 37.4% 34.2% 35.2% 36.8% 44.7% 5:30pm 2.5% 2.7% 2.5% 1.8% 1.3% 6:00pm 9.4% 9.7% 10.1% 9.0% 2.3% 6:30pm 1.1% 2.0% 1.6% 1.1% 0% 7:00pm 8.3% 10.4% 10.3% 8.3% 0.7% Later than 7:00pm 2.9% 4.6% 3.8% 3.5% 0.2%
Total # Centers 556 556 554 557 555 Center Policy About Frequency of Individual Counseling Appointments
Center Policy About Frequency of Individual Counseling Appointments
Size of Institution
Number
of Centers
Most Seen Weekly
Most Seen
Every 2 Weeks
Almost All Seen Every 2 Weeks
Other Under 1,501 67 62.7% 25.4% 9.0% 3.0% 1,501 – 2,500 69 46.4% 42.0% 11.6% 0.0% 2,501 – 5,000 94 57.4% 25.5% 16.0% 1.1% 5,001 – 7,500 58 55.2% 31.0% 12.1% 1.7% 7,501 – 10,000 44 47.7% 29.5% 20.5% 2.3% 10,001 – 15,000 57 40.4% 38.6% 21.1% 0.0% 15,001 – 20,000 47 55.3% 31.9% 10.6% 2.1% 20,001 – 25,000 36 30.6% 33.3% 33.3% 2.8% 25,001 – 30,000 25 36.0% 44.0% 16.0% 4.0% 30,001 – 35,000 17 17.6% 35.3% 41.2% 5.9% 35,001 – 45,000 20 10.0% 55.0% 30.0% 5.0% 45,001 and over 18 16.7% 44.4% 33.3% 5.6%
TOTAL 552 46.7% 33.7% 17.6% 2.0%
AUCCCD Director Survey 2017-18 (Public Version)
14
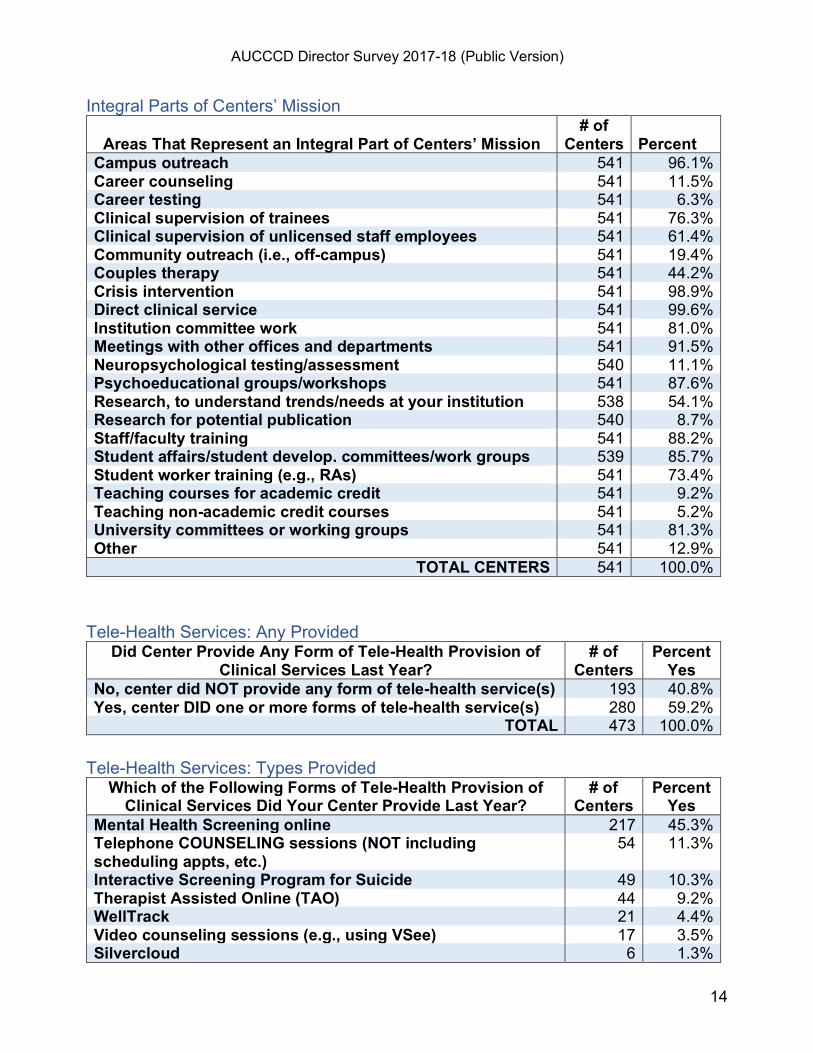
Integral Parts of Centers’ Mission
Areas That Represent an Integral Part of Centers’ Mission # of
Centers Percent
Campus outreach 541 96.1% Career counseling 541 11.5% Career testing 541 6.3% Clinical supervision of trainees 541 76.3% Clinical supervision of unlicensed staff employees 541 61.4% Community outreach (i.e., off-campus) 541 19.4% Couples therapy 541 44.2% Crisis intervention 541 98.9% Direct clinical service 541 99.6% Institution committee work 541 81.0% Meetings with other offices and departments 541 91.5% Neuropsychological testing/assessment 540 11.1% Psychoeducational groups/workshops 541 87.6% Research, to understand trends/needs at your institution 538 54.1% Research for potential publication 540 8.7% Staff/faculty training 541 88.2% Student affairs/student develop. committees/work groups 539 85.7% Student worker training (e.g., RAs) 541 73.4% Teaching courses for academic credit 541 9.2% Teaching non-academic credit courses 541 5.2% University committees or working groups 541 81.3% Other 541 12.9%
TOTAL CENTERS 541 100.0% Tele-Health Services: Any Provided
Did Center Provide Any Form of Tele-Health Provision of Clinical Services Last Year?
# of Centers
Percent Yes
No, center did NOT provide any form of tele-health service(s) 193 40.8% Yes, center DID one or more forms of tele-health service(s) 280 59.2%
TOTAL 473 100.0% Tele-Health Services: Types Provided
Which of the Following Forms of Tele-Health Provision of Clinical Services Did Your Center Provide Last Year?
# of Centers
Percent Yes
Mental Health Screening online 217 45.3% Telephone COUNSELING sessions (NOT including scheduling appts, etc.)
54 11.3%
Interactive Screening Program for Suicide 49 10.3% Therapist Assisted Online (TAO) 44 9.2% WellTrack 21 4.4% Video counseling sessions (e.g., using VSee) 17 3.5% Silvercloud 6 1.3%
AUCCCD Director Survey 2017-18 (Public Version)
15
Embedded Counselors: Centers That Have Any Counselors Embedded in
Another Campus Office / Dept. # of Centers That
Responded %
Yes Under 1,501 52 3.8% 1,501 – 2,500 58 1.7% 2,501 – 5,000 80 3.8% 5,001 – 7,500 51 2.0% 7,501 – 10,000 38 13.2% 10,001 – 15,000 52 21.2% 15,001 – 20,000 43 39.5% 20,001 – 25,000 27 40.7% 25,001 – 30,000 22 36.4% 30,001 – 35,000 16 56.3% 35,001 – 45,000 19 52.6% 45,001 and over 16 81.3%
TOTAL 474 19.2% Embedded Counselors: Location
Embedded Counselor Locations (for centers with embedded counselors only)
# of Centers
Mean
Athletic department 29 1.2 Residence hall(s) 23 1.5 School(s) or college(s) within the university 45 2.7 Under-represented student service office(s) 24 2.0 Health services 7 1.4 Other locations 8 1.3
TOTAL 90
AUCCCD Director Survey 2017-18 (Public Version)
16
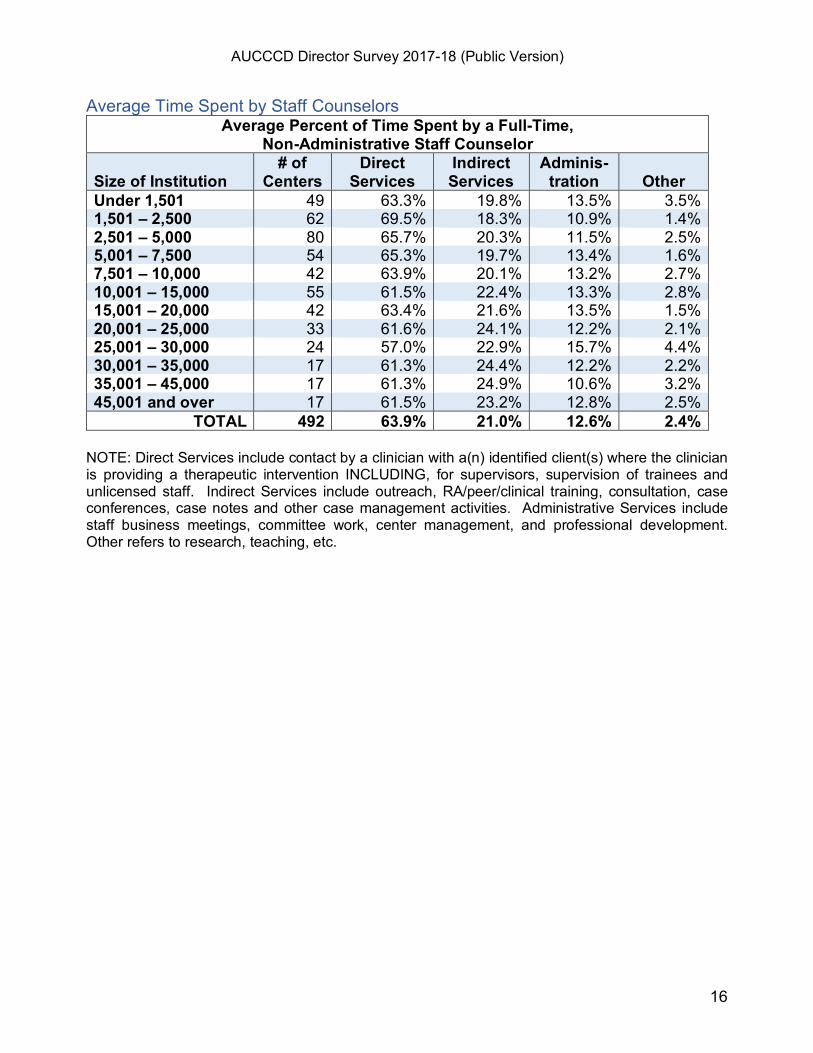
Average Time Spent by Staff Counselors Average Percent of Time Spent by a Full-Time,
Non-Administrative Staff Counselor
Size of Institution # of
Centers Direct
Services Indirect Services
Adminis-tration
Other
Under 1,501 49 63.3% 19.8% 13.5% 3.5% 1,501 – 2,500 62 69.5% 18.3% 10.9% 1.4% 2,501 – 5,000 80 65.7% 20.3% 11.5% 2.5% 5,001 – 7,500 54 65.3% 19.7% 13.4% 1.6% 7,501 – 10,000 42 63.9% 20.1% 13.2% 2.7% 10,001 – 15,000 55 61.5% 22.4% 13.3% 2.8% 15,001 – 20,000 42 63.4% 21.6% 13.5% 1.5% 20,001 – 25,000 33 61.6% 24.1% 12.2% 2.1% 25,001 – 30,000 24 57.0% 22.9% 15.7% 4.4% 30,001 – 35,000 17 61.3% 24.4% 12.2% 2.2% 35,001 – 45,000 17 61.3% 24.9% 10.6% 3.2% 45,001 and over 17 61.5% 23.2% 12.8% 2.5%
TOTAL 492 63.9% 21.0% 12.6% 2.4% NOTE: Direct Services include contact by a clinician with a(n) identified client(s) where the clinician is providing a therapeutic intervention INCLUDING, for supervisors, supervision of trainees and unlicensed staff. Indirect Services include outreach, RA/peer/clinical training, consultation, case conferences, case notes and other case management activities. Administrative Services include staff business meetings, committee work, center management, and professional development. Other refers to research, teaching, etc.
AUCCCD Director Survey 2017-18 (Public Version)
17
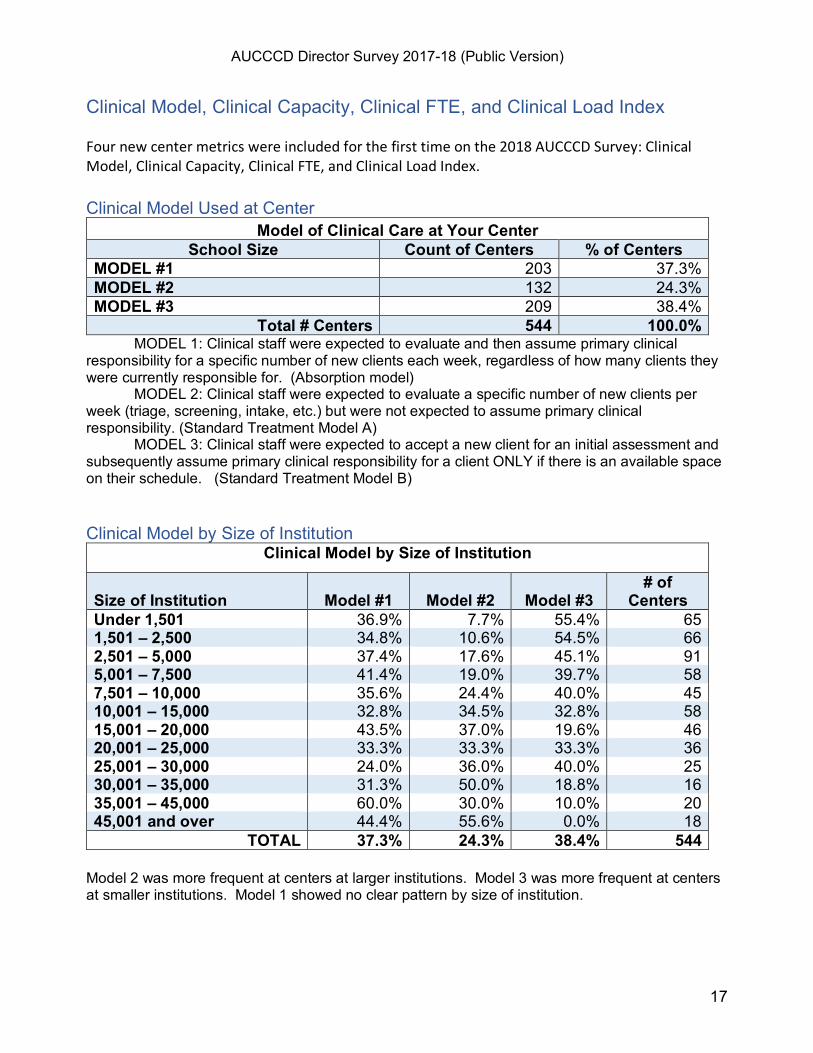
Clinical Model, Clinical Capacity, Clinical FTE, and Clinical Load Index Four new center metrics were included for the first time on the 2018 AUCCCD Survey: Clinical Model, Clinical Capacity, Clinical FTE, and Clinical Load Index. Clinical Model Used at Center
Model of Clinical Care at Your Center School Size Count of Centers % of Centers
MODEL #1 203 37.3% MODEL #2 132 24.3% MODEL #3 209 38.4%
Total # Centers 544 100.0% MODEL 1: Clinical staff were expected to evaluate and then assume primary clinical
responsibility for a specific number of new clients each week, regardless of how many clients they were currently responsible for. (Absorption model)
MODEL 2: Clinical staff were expected to evaluate a specific number of new clients per week (triage, screening, intake, etc.) but were not expected to assume primary clinical responsibility. (Standard Treatment Model A)
MODEL 3: Clinical staff were expected to accept a new client for an initial assessment and subsequently assume primary clinical responsibility for a client ONLY if there is an available space on their schedule. (Standard Treatment Model B) Clinical Model by Size of Institution
Clinical Model by Size of Institution
Size of Institution
Model #1
Model #2
Model #3
# of Centers
Under 1,501 36.9% 7.7% 55.4% 65 1,501 – 2,500 34.8% 10.6% 54.5% 66 2,501 – 5,000 37.4% 17.6% 45.1% 91 5,001 – 7,500 41.4% 19.0% 39.7% 58 7,501 – 10,000 35.6% 24.4% 40.0% 45 10,001 – 15,000 32.8% 34.5% 32.8% 58 15,001 – 20,000 43.5% 37.0% 19.6% 46 20,001 – 25,000 33.3% 33.3% 33.3% 36 25,001 – 30,000 24.0% 36.0% 40.0% 25 30,001 – 35,000 31.3% 50.0% 18.8% 16 35,001 – 45,000 60.0% 30.0% 10.0% 20 45,001 and over 44.4% 55.6% 0.0% 18
TOTAL 37.3% 24.3% 38.4% 544 Model 2 was more frequent at centers at larger institutions. Model 3 was more frequent at centers at smaller institutions. Model 1 showed no clear pattern by size of institution.
AUCCCD Director Survey 2017-18 (Public Version)
18
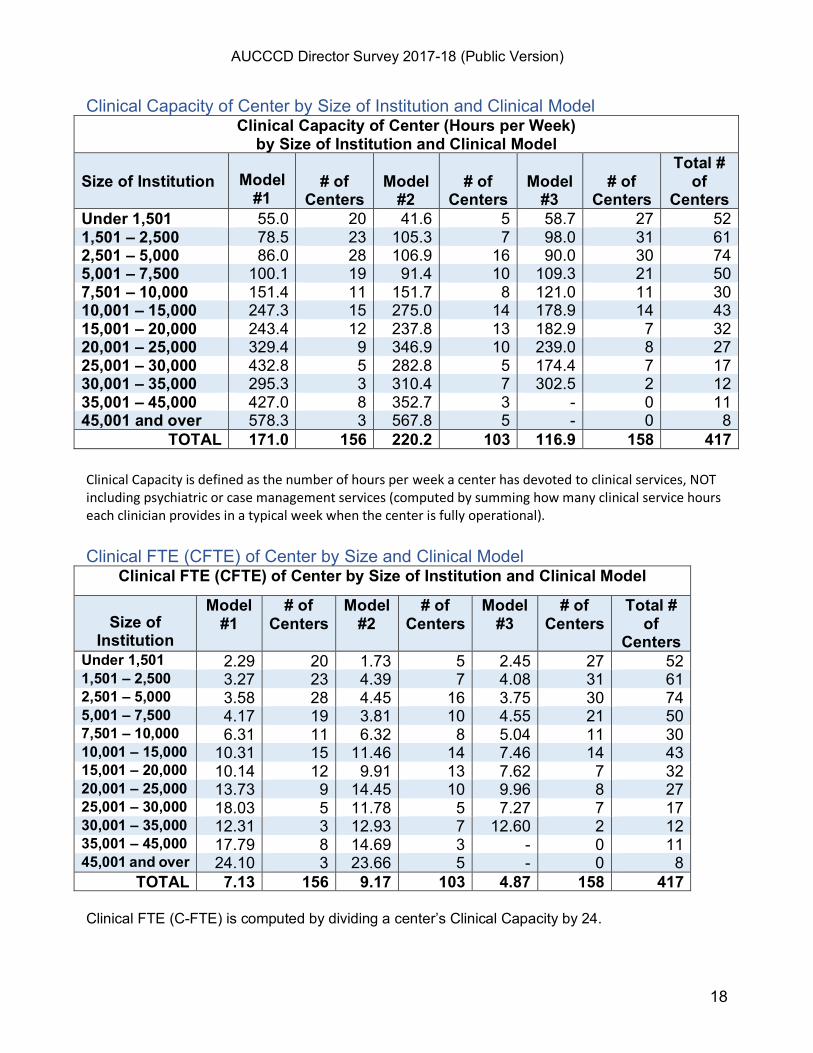
Clinical Capacity of Center by Size of Institution and Clinical Model Clinical Capacity of Center (Hours per Week)
by Size of Institution and Clinical Model Size of Institution
Model
#1
# of
Centers
Model
#2
# of
Centers
Model
#3
# of
Centers
Total # of
Centers Under 1,501 55.0 20 41.6 5 58.7 27 52 1,501 – 2,500 78.5 23 105.3 7 98.0 31 61 2,501 – 5,000 86.0 28 106.9 16 90.0 30 74 5,001 – 7,500 100.1 19 91.4 10 109.3 21 50 7,501 – 10,000 151.4 11 151.7 8 121.0 11 30 10,001 – 15,000 247.3 15 275.0 14 178.9 14 43 15,001 – 20,000 243.4 12 237.8 13 182.9 7 32 20,001 – 25,000 329.4 9 346.9 10 239.0 8 27 25,001 – 30,000 432.8 5 282.8 5 174.4 7 17 30,001 – 35,000 295.3 3 310.4 7 302.5 2 12 35,001 – 45,000 427.0 8 352.7 3 - 0 11 45,001 and over 578.3 3 567.8 5 - 0 8
TOTAL 171.0 156 220.2 103 116.9 158 417 Clinical Capacity is defined as the number of hours per week a center has devoted to clinical services, NOT including psychiatric or case management services (computed by summing how many clinical service hours each clinician provides in a typical week when the center is fully operational). Clinical FTE (CFTE) of Center by Size and Clinical Model
Clinical FTE (CFTE) of Center by Size of Institution and Clinical Model
Size of Institution
Model #1
# of Centers
Model #2
# of Centers
Model #3
# of Centers
Total # of
Centers Under 1,501 2.29 20 1.73 5 2.45 27 52 1,501 – 2,500 3.27 23 4.39 7 4.08 31 61 2,501 – 5,000 3.58 28 4.45 16 3.75 30 74 5,001 – 7,500 4.17 19 3.81 10 4.55 21 50 7,501 – 10,000 6.31 11 6.32 8 5.04 11 30 10,001 – 15,000 10.31 15 11.46 14 7.46 14 43 15,001 – 20,000 10.14 12 9.91 13 7.62 7 32 20,001 – 25,000 13.73 9 14.45 10 9.96 8 27 25,001 – 30,000 18.03 5 11.78 5 7.27 7 17 30,001 – 35,000 12.31 3 12.93 7 12.60 2 12 35,001 – 45,000 17.79 8 14.69 3 - 0 11 45,001 and over 24.10 3 23.66 5 - 0 8
TOTAL 7.13 156 9.17 103 4.87 158 417 Clinical FTE (C-FTE) is computed by dividing a center’s Clinical Capacity by 24.
AUCCCD Director Survey 2017-18 (Public Version)
19
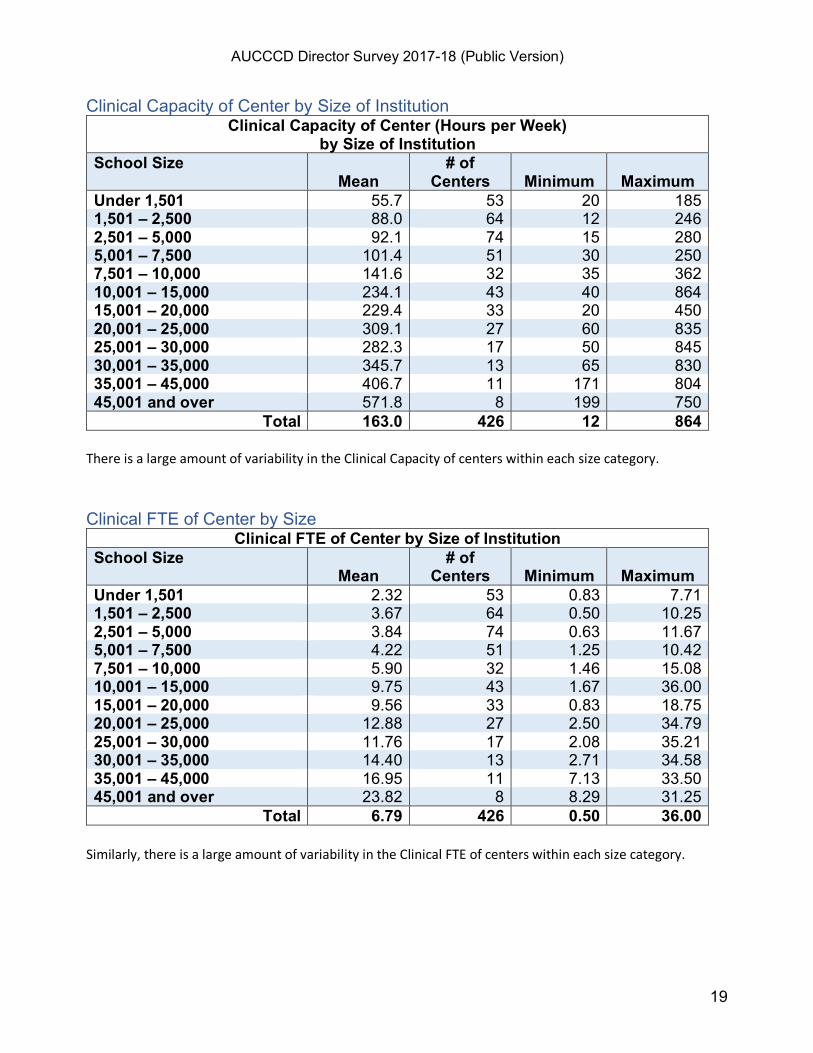
Clinical Capacity of Center by Size of Institution Clinical Capacity of Center (Hours per Week)
by Size of Institution School Size
Mean # of
Centers
Minimum
Maximum Under 1,501 55.7 53 20 185 1,501 – 2,500 88.0 64 12 246 2,501 – 5,000 92.1 74 15 280 5,001 – 7,500 101.4 51 30 250 7,501 – 10,000 141.6 32 35 362 10,001 – 15,000 234.1 43 40 864 15,001 – 20,000 229.4 33 20 450 20,001 – 25,000 309.1 27 60 835 25,001 – 30,000 282.3 17 50 845 30,001 – 35,000 345.7 13 65 830 35,001 – 45,000 406.7 11 171 804 45,001 and over 571.8 8 199 750
Total 163.0 426 12 864 There is a large amount of variability in the Clinical Capacity of centers within each size category. Clinical FTE of Center by Size
Clinical FTE of Center by Size of Institution School Size
Mean # of
Centers
Minimum
Maximum Under 1,501 2.32 53 0.83 7.71 1,501 – 2,500 3.67 64 0.50 10.25 2,501 – 5,000 3.84 74 0.63 11.67 5,001 – 7,500 4.22 51 1.25 10.42 7,501 – 10,000 5.90 32 1.46 15.08 10,001 – 15,000 9.75 43 1.67 36.00 15,001 – 20,000 9.56 33 0.83 18.75 20,001 – 25,000 12.88 27 2.50 34.79 25,001 – 30,000 11.76 17 2.08 35.21 30,001 – 35,000 14.40 13 2.71 34.58 35,001 – 45,000 16.95 11 7.13 33.50 45,001 and over 23.82 8 8.29 31.25
Total 6.79 426 0.50 36.00 Similarly, there is a large amount of variability in the Clinical FTE of centers within each size category.
AUCCCD Director Survey 2017-18 (Public Version)
20
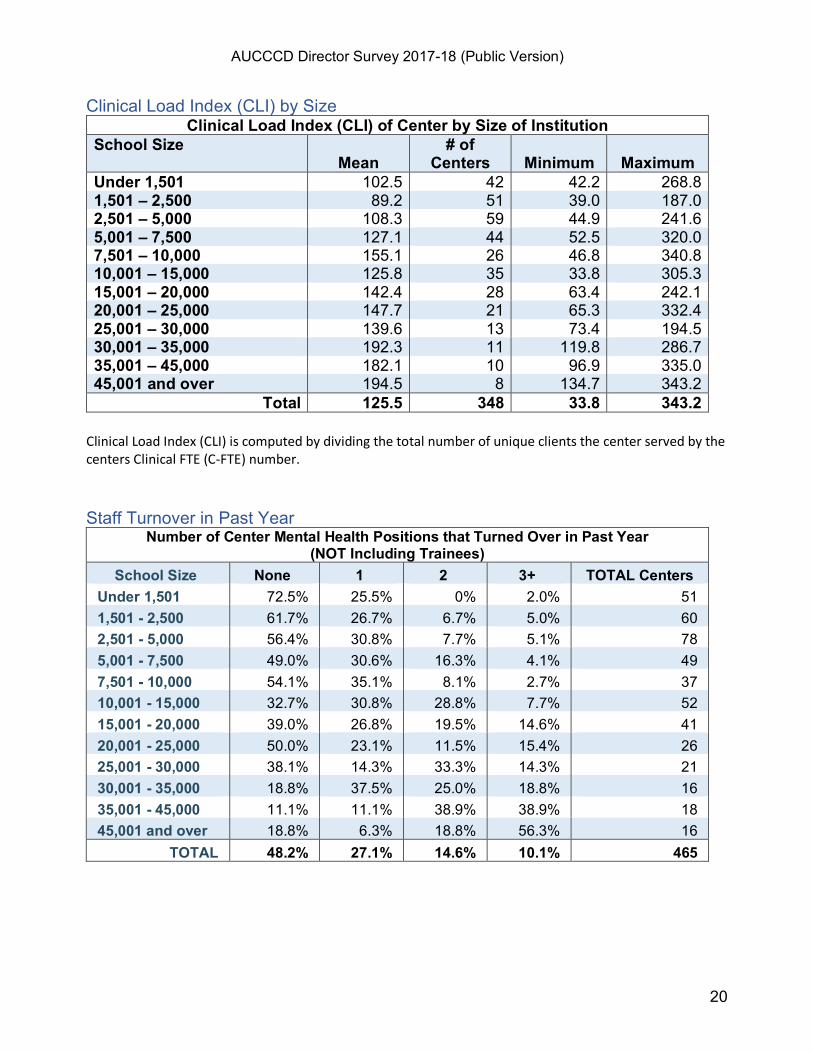
Clinical Load Index (CLI) by Size Clinical Load Index (CLI) of Center by Size of Institution
School Size Mean
# of Centers
Minimum
Maximum
Under 1,501 102.5 42 42.2 268.8 1,501 – 2,500 89.2 51 39.0 187.0 2,501 – 5,000 108.3 59 44.9 241.6 5,001 – 7,500 127.1 44 52.5 320.0 7,501 – 10,000 155.1 26 46.8 340.8 10,001 – 15,000 125.8 35 33.8 305.3 15,001 – 20,000 142.4 28 63.4 242.1 20,001 – 25,000 147.7 21 65.3 332.4 25,001 – 30,000 139.6 13 73.4 194.5 30,001 – 35,000 192.3 11 119.8 286.7 35,001 – 45,000 182.1 10 96.9 335.0 45,001 and over 194.5 8 134.7 343.2
Total 125.5 348 33.8 343.2 Clinical Load Index (CLI) is computed by dividing the total number of unique clients the center served by the centers Clinical FTE (C-FTE) number. Staff Turnover in Past Year
Number of Center Mental Health Positions that Turned Over in Past Year (NOT Including Trainees)
School Size None 1 2 3+ TOTAL Centers Under 1,501 72.5% 25.5% 0% 2.0% 51 1,501 - 2,500 61.7% 26.7% 6.7% 5.0% 60 2,501 - 5,000 56.4% 30.8% 7.7% 5.1% 78 5,001 - 7,500 49.0% 30.6% 16.3% 4.1% 49 7,501 - 10,000 54.1% 35.1% 8.1% 2.7% 37 10,001 - 15,000 32.7% 30.8% 28.8% 7.7% 52 15,001 - 20,000 39.0% 26.8% 19.5% 14.6% 41 20,001 - 25,000 50.0% 23.1% 11.5% 15.4% 26 25,001 - 30,000 38.1% 14.3% 33.3% 14.3% 21 30,001 - 35,000 18.8% 37.5% 25.0% 18.8% 16 35,001 - 45,000 11.1% 11.1% 38.9% 38.9% 18 45,001 and over 18.8% 6.3% 18.8% 56.3% 16
TOTAL 48.2% 27.1% 14.6% 10.1% 465
AUCCCD Director Survey 2017-18 (Public Version)
21
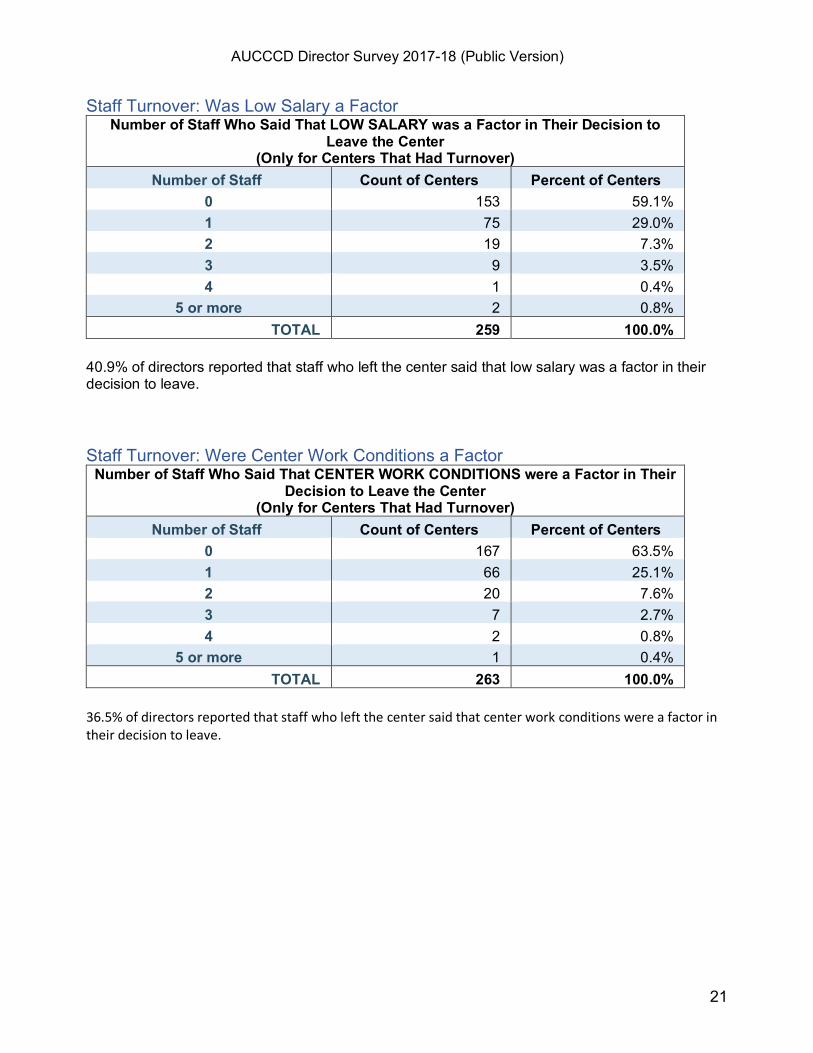
Staff Turnover: Was Low Salary a Factor Number of Staff Who Said That LOW SALARY was a Factor in Their Decision to
Leave the Center (Only for Centers That Had Turnover)
Number of Staff Count of Centers Percent of Centers 0 153 59.1% 1 75 29.0% 2 19 7.3% 3 9 3.5% 4 1 0.4%
5 or more 2 0.8% TOTAL 259 100.0%
40.9% of directors reported that staff who left the center said that low salary was a factor in their decision to leave. Staff Turnover: Were Center Work Conditions a Factor
Number of Staff Who Said That CENTER WORK CONDITIONS were a Factor in Their Decision to Leave the Center
(Only for Centers That Had Turnover) Number of Staff Count of Centers Percent of Centers
0 167 63.5% 1 66 25.1% 2 20 7.6% 3 7 2.7% 4 2 0.8%
5 or more 1 0.4% TOTAL 263 100.0%
36.5% of directors reported that staff who left the center said that center work conditions were a factor in their decision to leave.
AUCCCD Director Survey 2017-18 (Public Version)
22
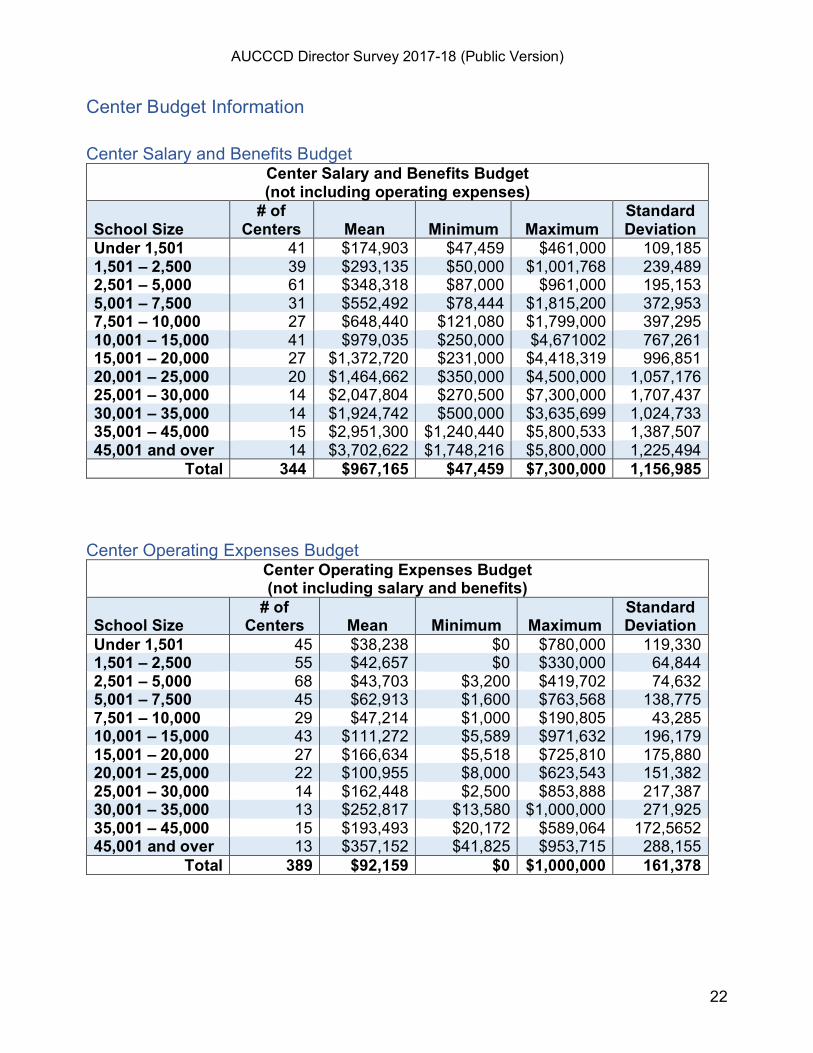
Center Budget Information Center Salary and Benefits Budget
Center Salary and Benefits Budget (not including operating expenses)
School Size
# of Centers
Mean
Minimum
Maximum
Standard Deviation
Under 1,501 41 $174,903 $47,459 $461,000 109,185 1,501 – 2,500 39 $293,135 $50,000 $1,001,768 239,489 2,501 – 5,000 61 $348,318 $87,000 $961,000 195,153 5,001 – 7,500 31 $552,492 $78,444 $1,815,200 372,953 7,501 – 10,000 27 $648,440 $121,080 $1,799,000 397,295 10,001 – 15,000 41 $979,035 $250,000 $4,671002 767,261 15,001 – 20,000 27 $1,372,720 $231,000 $4,418,319 996,851 20,001 – 25,000 20 $1,464,662 $350,000 $4,500,000 1,057,176 25,001 – 30,000 14 $2,047,804 $270,500 $7,300,000 1,707,437 30,001 – 35,000 14 $1,924,742 $500,000 $3,635,699 1,024,733 35,001 – 45,000 15 $2,951,300 $1,240,440 $5,800,533 1,387,507 45,001 and over 14 $3,702,622 $1,748,216 $5,800,000 1,225,494
Total 344 $967,165 $47,459 $7,300,000 1,156,985 Center Operating Expenses Budget
Center Operating Expenses Budget (not including salary and benefits)
School Size
# of Centers
Mean
Minimum
Maximum
Standard Deviation
Under 1,501 45 $38,238 $0 $780,000 119,330 1,501 – 2,500 55 $42,657 $0 $330,000 64,844 2,501 – 5,000 68 $43,703 $3,200 $419,702 74,632 5,001 – 7,500 45 $62,913 $1,600 $763,568 138,775 7,501 – 10,000 29 $47,214 $1,000 $190,805 43,285 10,001 – 15,000 43 $111,272 $5,589 $971,632 196,179 15,001 – 20,000 27 $166,634 $5,518 $725,810 175,880 20,001 – 25,000 22 $100,955 $8,000 $623,543 151,382 25,001 – 30,000 14 $162,448 $2,500 $853,888 217,387 30,001 – 35,000 13 $252,817 $13,580 $1,000,000 271,925 35,001 – 45,000 15 $193,493 $20,172 $589,064 172,5652 45,001 and over 13 $357,152 $41,825 $953,715 288,155
Total 389 $92,159 $0 $1,000,000 161,378
AUCCCD Director Survey 2017-18 (Public Version)
23
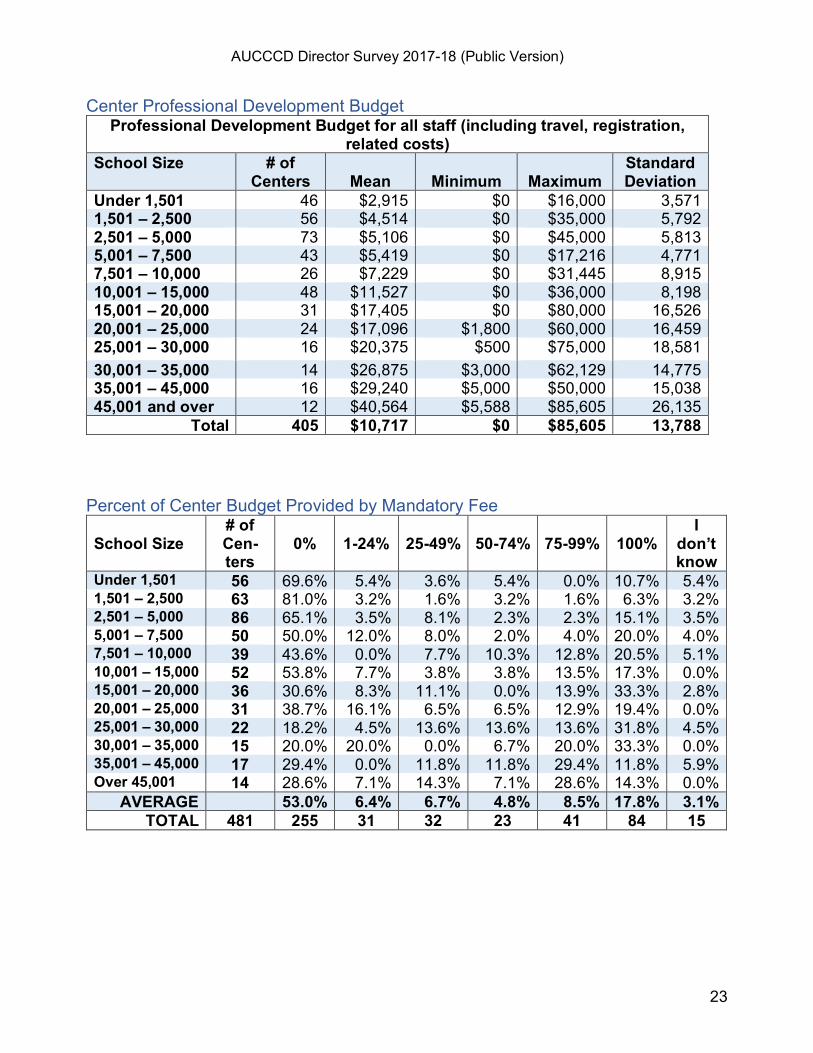
Center Professional Development Budget Professional Development Budget for all staff (including travel, registration,
related costs) School Size # of
Centers
Mean
Minimum
Maximum Standard Deviation
Under 1,501 46 $2,915 $0 $16,000 3,571 1,501 – 2,500 56 $4,514 $0 $35,000 5,792 2,501 – 5,000 73 $5,106 $0 $45,000 5,813 5,001 – 7,500 43 $5,419 $0 $17,216 4,771 7,501 – 10,000 26 $7,229 $0 $31,445 8,915 10,001 – 15,000 48 $11,527 $0 $36,000 8,198 15,001 – 20,000 31 $17,405 $0 $80,000 16,526 20,001 – 25,000 24 $17,096 $1,800 $60,000 16,459 25,001 – 30,000 16 $20,375 $500 $75,000 18,581 30,001 – 35,000 14 $26,875 $3,000 $62,129 14,775 35,001 – 45,000 16 $29,240 $5,000 $50,000 15,038 45,001 and over 12 $40,564 $5,588 $85,605 26,135
Total 405 $10,717 $0 $85,605 13,788 Percent of Center Budget Provided by Mandatory Fee
School Size
# of Cen-ters
0%
1-24%
25-49%
50-74%
75-99%
100%
I don’t know
Under 1,501 56 69.6% 5.4% 3.6% 5.4% 0.0% 10.7% 5.4% 1,501 – 2,500 63 81.0% 3.2% 1.6% 3.2% 1.6% 6.3% 3.2% 2,501 – 5,000 86 65.1% 3.5% 8.1% 2.3% 2.3% 15.1% 3.5% 5,001 – 7,500 50 50.0% 12.0% 8.0% 2.0% 4.0% 20.0% 4.0% 7,501 – 10,000 39 43.6% 0.0% 7.7% 10.3% 12.8% 20.5% 5.1% 10,001 – 15,000 52 53.8% 7.7% 3.8% 3.8% 13.5% 17.3% 0.0% 15,001 – 20,000 36 30.6% 8.3% 11.1% 0.0% 13.9% 33.3% 2.8% 20,001 – 25,000 31 38.7% 16.1% 6.5% 6.5% 12.9% 19.4% 0.0% 25,001 – 30,000 22 18.2% 4.5% 13.6% 13.6% 13.6% 31.8% 4.5% 30,001 – 35,000 15 20.0% 20.0% 0.0% 6.7% 20.0% 33.3% 0.0% 35,001 – 45,000 17 29.4% 0.0% 11.8% 11.8% 29.4% 11.8% 5.9% Over 45,001 14 28.6% 7.1% 14.3% 7.1% 28.6% 14.3% 0.0%
AVERAGE 53.0% 6.4% 6.7% 4.8% 8.5% 17.8% 3.1% TOTAL 481 255 31 32 23 41 84 15
AUCCCD Director Survey 2017-18 (Public Version)
24
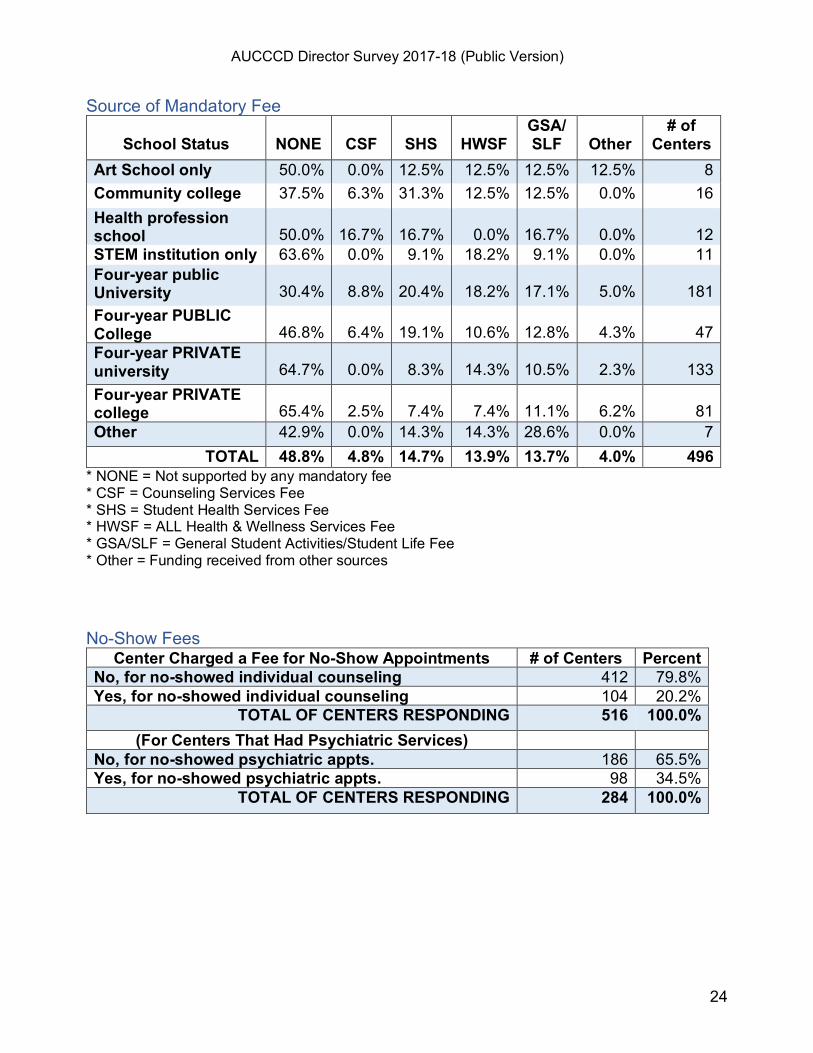
Source of Mandatory Fee
School Status
NONE
CSF
SHS
HWSF GSA/SLF
Other
# of Centers
Art School only 50.0% 0.0% 12.5% 12.5% 12.5% 12.5% 8 Community college 37.5% 6.3% 31.3% 12.5% 12.5% 0.0% 16 Health profession school
50.0%
16.7%
16.7%
0.0%
16.7%
0.0%
12
STEM institution only 63.6% 0.0% 9.1% 18.2% 9.1% 0.0% 11 Four-year public University
30.4%
8.8%
20.4%
18.2%
17.1%
5.0%
181
Four-year PUBLIC College
46.8%
6.4%
19.1%
10.6%
12.8%
4.3%
47
Four-year PRIVATE university
64.7%
0.0%
8.3%
14.3%
10.5%
2.3%
133
Four-year PRIVATE college
65.4%
2.5%
7.4%
7.4%
11.1%
6.2%
81
Other 42.9% 0.0% 14.3% 14.3% 28.6% 0.0% 7 TOTAL 48.8% 4.8% 14.7% 13.9% 13.7% 4.0% 496
* NONE = Not supported by any mandatory fee * CSF = Counseling Services Fee * SHS = Student Health Services Fee * HWSF = ALL Health & Wellness Services Fee * GSA/SLF = General Student Activities/Student Life Fee * Other = Funding received from other sources No-Show Fees
Center Charged a Fee for No-Show Appointments # of Centers Percent No, for no-showed individual counseling 412 79.8% Yes, for no-showed individual counseling 104 20.2%
TOTAL OF CENTERS RESPONDING 516 100.0% (For Centers That Had Psychiatric Services)
No, for no-showed psychiatric appts. 186 65.5% Yes, for no-showed psychiatric appts. 98 34.5%
TOTAL OF CENTERS RESPONDING 284 100.0%
AUCCCD Director Survey 2017-18 (Public Version)
25
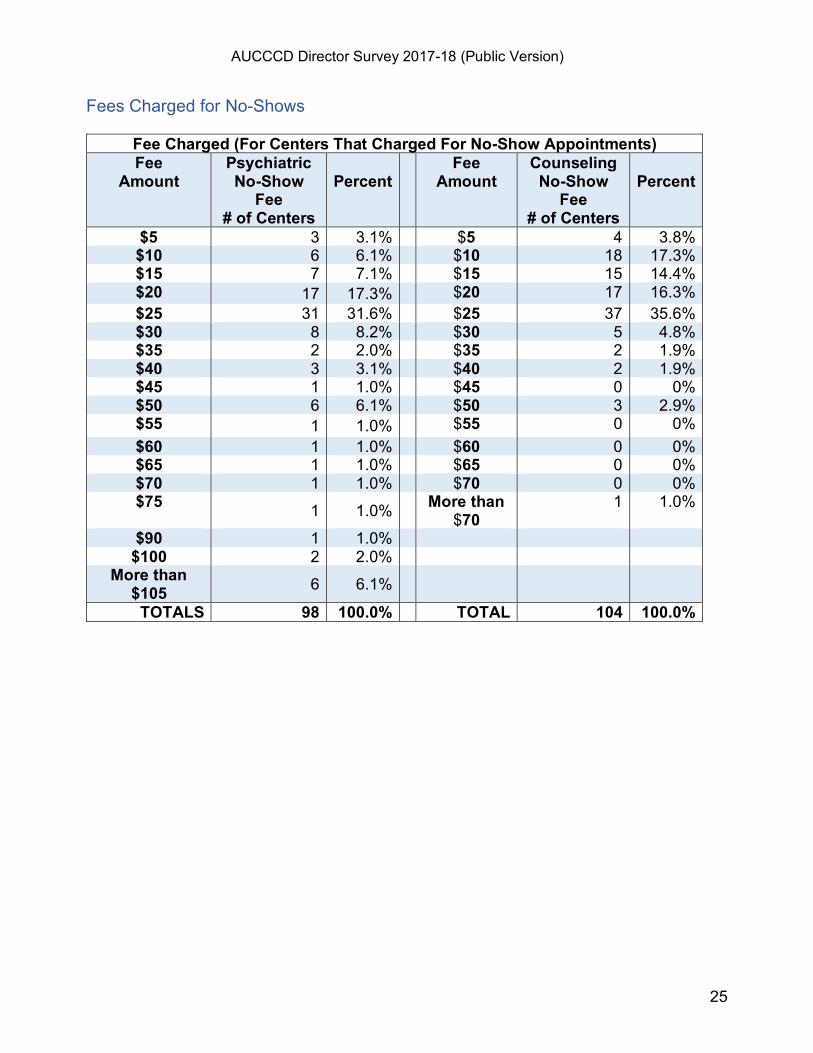
Fees Charged for No-Shows
Fee Charged (For Centers That Charged For No-Show Appointments) Fee
Amount Psychiatric No-Show
Fee # of Centers
Percent
Fee Amount
Counseling No-Show
Fee # of Centers
Percent
$5 3 3.1% $5 4 3.8% $10 6 6.1% $10 18 17.3% $15 7 7.1% $15 15 14.4% $20 17 17.3% $20 17 16.3% $25 31 31.6% $25 37 35.6% $30 8 8.2% $30 5 4.8% $35 2 2.0% $35 2 1.9% $40 3 3.1% $40 2 1.9% $45 1 1.0% $45 0 0% $50 6 6.1% $50 3 2.9% $55 1 1.0% $55 0 0% $60 1 1.0% $60 0 0% $65 1 1.0% $65 0 0% $70 1 1.0% $70 0 0% $75 1 1.0% More than
$70 1 1.0%
$90 1 1.0% $100 2 2.0%
More than $105 6 6.1%
TOTALS 98 100.0% TOTAL 104 100.0%
AUCCCD Director Survey 2017-18 (Public Version)
26
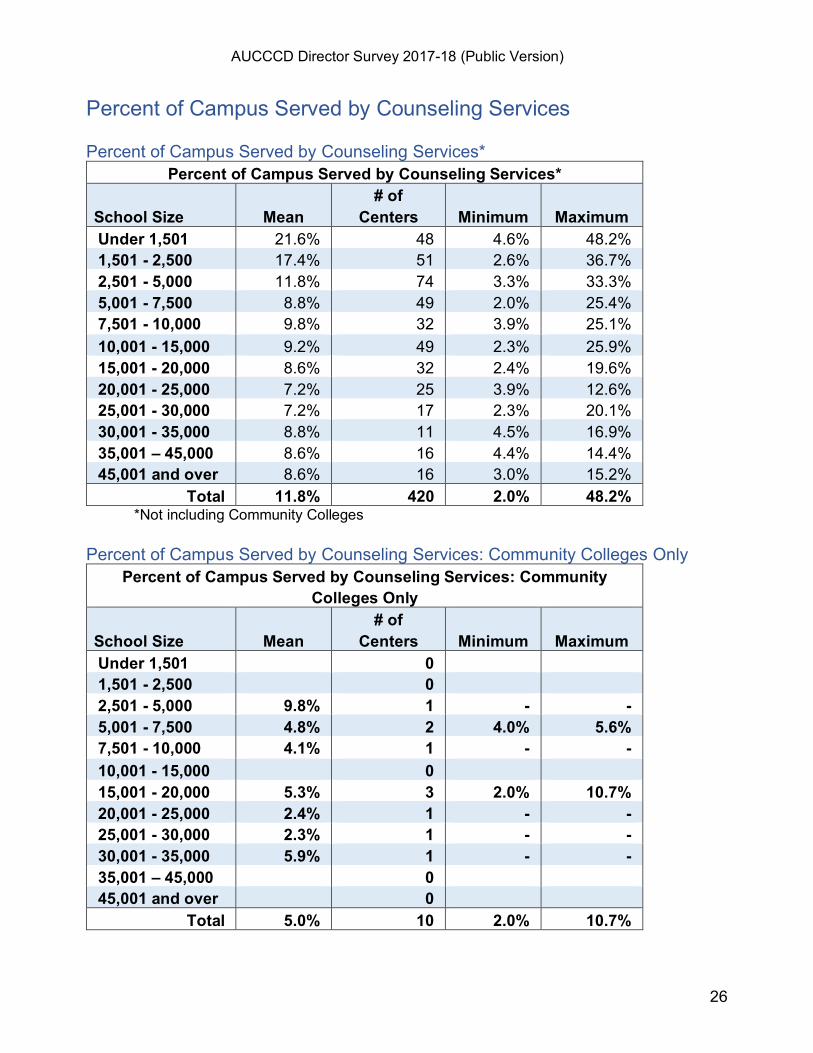
Percent of Campus Served by Counseling Services Percent of Campus Served by Counseling Services*
Percent of Campus Served by Counseling Services* School Size
Mean
# of Centers
Minimum
Maximum
Under 1,501 21.6% 48 4.6% 48.2% 1,501 - 2,500 17.4% 51 2.6% 36.7% 2,501 - 5,000 11.8% 74 3.3% 33.3% 5,001 - 7,500 8.8% 49 2.0% 25.4% 7,501 - 10,000 9.8% 32 3.9% 25.1% 10,001 - 15,000 9.2% 49 2.3% 25.9% 15,001 - 20,000 8.6% 32 2.4% 19.6% 20,001 - 25,000 7.2% 25 3.9% 12.6% 25,001 - 30,000 7.2% 17 2.3% 20.1% 30,001 - 35,000 8.8% 11 4.5% 16.9% 35,001 – 45,000 8.6% 16 4.4% 14.4% 45,001 and over 8.6% 16 3.0% 15.2%
Total 11.8% 420 2.0% 48.2% *Not including Community Colleges Percent of Campus Served by Counseling Services: Community Colleges Only
Percent of Campus Served by Counseling Services: Community Colleges Only
School Size
Mean
# of Centers
Minimum
Maximum
Under 1,501 0 1,501 - 2,500 0 2,501 - 5,000 9.8% 1 - - 5,001 - 7,500 4.8% 2 4.0% 5.6% 7,501 - 10,000 4.1% 1 - - 10,001 - 15,000 0 15,001 - 20,000 5.3% 3 2.0% 10.7% 20,001 - 25,000 2.4% 1 - - 25,001 - 30,000 2.3% 1 - - 30,001 - 35,000 5.9% 1 - - 35,001 – 45,000 0 45,001 and over 0
Total 5.0% 10 2.0% 10.7%
AUCCCD Director Survey 2017-18 (Public Version)
27
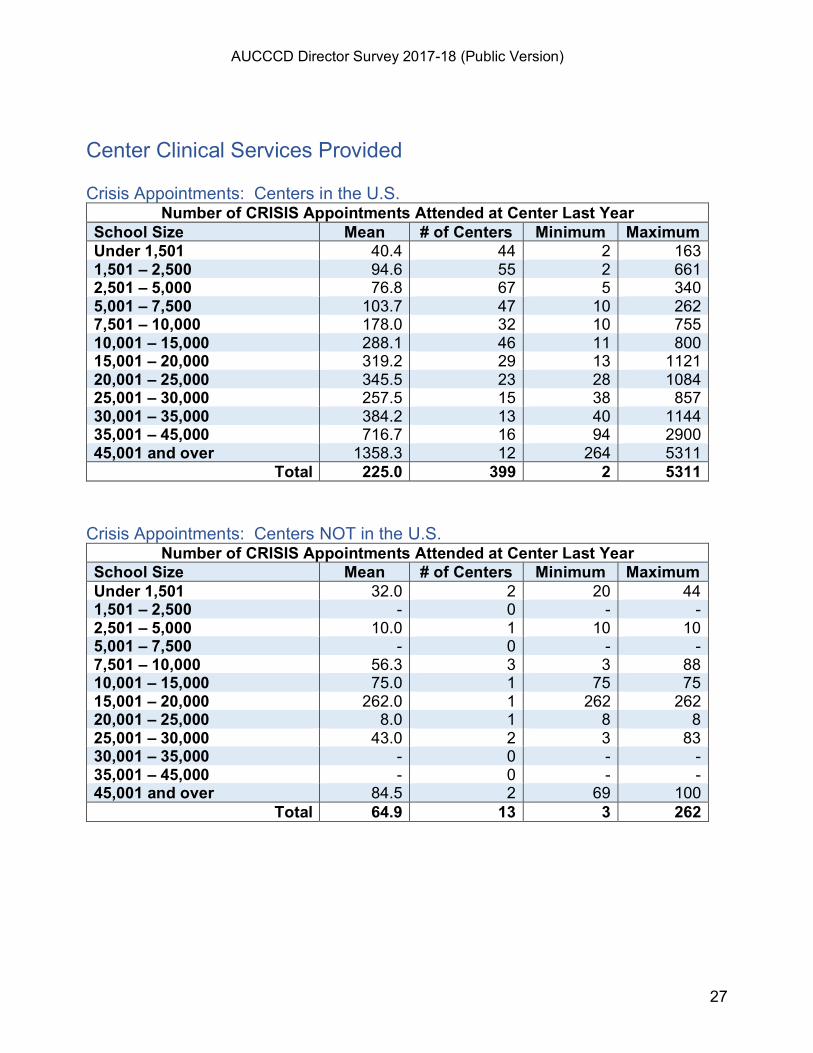
Center Clinical Services Provided Crisis Appointments: Centers in the U.S.
Number of CRISIS Appointments Attended at Center Last Year School Size Mean # of Centers Minimum Maximum Under 1,501 40.4 44 2 163 1,501 – 2,500 94.6 55 2 661 2,501 – 5,000 76.8 67 5 340 5,001 – 7,500 103.7 47 10 262 7,501 – 10,000 178.0 32 10 755 10,001 – 15,000 288.1 46 11 800 15,001 – 20,000 319.2 29 13 1121 20,001 – 25,000 345.5 23 28 1084 25,001 – 30,000 257.5 15 38 857 30,001 – 35,000 384.2 13 40 1144 35,001 – 45,000 716.7 16 94 2900 45,001 and over 1358.3 12 264 5311
Total 225.0 399 2 5311 Crisis Appointments: Centers NOT in the U.S.
Number of CRISIS Appointments Attended at Center Last Year School Size Mean # of Centers Minimum Maximum Under 1,501 32.0 2 20 44 1,501 – 2,500 - 0 - - 2,501 – 5,000 10.0 1 10 10 5,001 – 7,500 - 0 - - 7,501 – 10,000 56.3 3 3 88 10,001 – 15,000 75.0 1 75 75 15,001 – 20,000 262.0 1 262 262 20,001 – 25,000 8.0 1 8 8 25,001 – 30,000 43.0 2 3 83 30,001 – 35,000 - 0 - - 35,001 – 45,000 - 0 - - 45,001 and over 84.5 2 69 100
Total 64.9 13 3 262
AUCCCD Director Survey 2017-18 (Public Version)
28
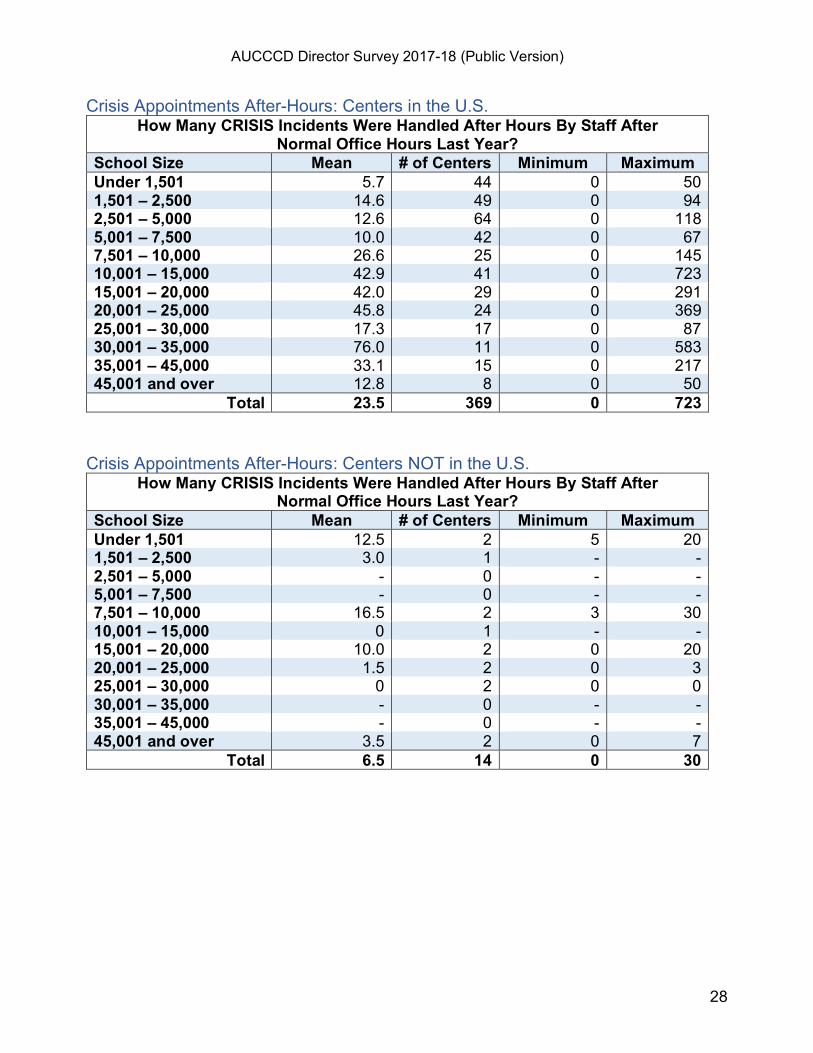
Crisis Appointments After-Hours: Centers in the U.S. How Many CRISIS Incidents Were Handled After Hours By Staff After
Normal Office Hours Last Year? School Size Mean # of Centers Minimum Maximum Under 1,501 5.7 44 0 50 1,501 – 2,500 14.6 49 0 94 2,501 – 5,000 12.6 64 0 118 5,001 – 7,500 10.0 42 0 67 7,501 – 10,000 26.6 25 0 145 10,001 – 15,000 42.9 41 0 723 15,001 – 20,000 42.0 29 0 291 20,001 – 25,000 45.8 24 0 369 25,001 – 30,000 17.3 17 0 87 30,001 – 35,000 76.0 11 0 583 35,001 – 45,000 33.1 15 0 217 45,001 and over 12.8 8 0 50
Total 23.5 369 0 723 Crisis Appointments After-Hours: Centers NOT in the U.S.
How Many CRISIS Incidents Were Handled After Hours By Staff After Normal Office Hours Last Year?
School Size Mean # of Centers Minimum Maximum Under 1,501 12.5 2 5 20 1,501 – 2,500 3.0 1 - - 2,501 – 5,000 - 0 - - 5,001 – 7,500 - 0 - - 7,501 – 10,000 16.5 2 3 30 10,001 – 15,000 0 1 - - 15,001 – 20,000 10.0 2 0 20 20,001 – 25,000 1.5 2 0 3 25,001 – 30,000 0 2 0 0 30,001 – 35,000 - 0 - - 35,001 – 45,000 - 0 - - 45,001 and over 3.5 2 0 7
Total 6.5 14 0 30
AUCCCD Director Survey 2017-18 (Public Version)
29
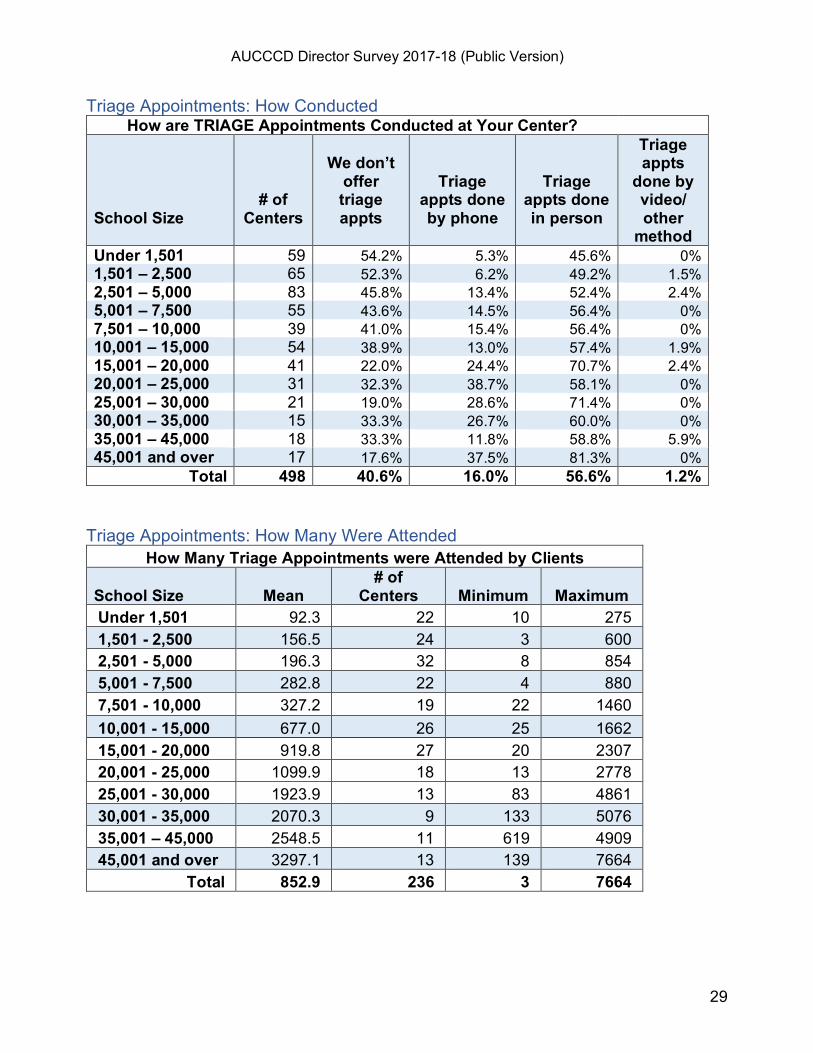
Triage Appointments: How Conducted How are TRIAGE Appointments Conducted at Your Center?
School Size
# of Centers
We don’t
offer triage appts
Triage appts done by phone
Triage appts done in person
Triage appts
done by video/ other
method Under 1,501 59 54.2% 5.3% 45.6% 0% 1,501 – 2,500 65 52.3% 6.2% 49.2% 1.5% 2,501 – 5,000 83 45.8% 13.4% 52.4% 2.4% 5,001 – 7,500 55 43.6% 14.5% 56.4% 0% 7,501 – 10,000 39 41.0% 15.4% 56.4% 0% 10,001 – 15,000 54 38.9% 13.0% 57.4% 1.9% 15,001 – 20,000 41 22.0% 24.4% 70.7% 2.4% 20,001 – 25,000 31 32.3% 38.7% 58.1% 0% 25,001 – 30,000 21 19.0% 28.6% 71.4% 0% 30,001 – 35,000 15 33.3% 26.7% 60.0% 0% 35,001 – 45,000 18 33.3% 11.8% 58.8% 5.9% 45,001 and over 17 17.6% 37.5% 81.3% 0%
Total 498 40.6% 16.0% 56.6% 1.2% Triage Appointments: How Many Were Attended
How Many Triage Appointments were Attended by Clients School Size
Mean
# of Centers
Minimum
Maximum
Under 1,501 92.3 22 10 275 1,501 - 2,500 156.5 24 3 600 2,501 - 5,000 196.3 32 8 854 5,001 - 7,500 282.8 22 4 880 7,501 - 10,000 327.2 19 22 1460 10,001 - 15,000 677.0 26 25 1662 15,001 - 20,000 919.8 27 20 2307 20,001 - 25,000 1099.9 18 13 2778 25,001 - 30,000 1923.9 13 83 4861 30,001 - 35,000 2070.3 9 133 5076 35,001 – 45,000 2548.5 11 619 4909 45,001 and over 3297.1 13 139 7664
Total 852.9 236 3 7664
AUCCCD Director Survey 2017-18 (Public Version)
30
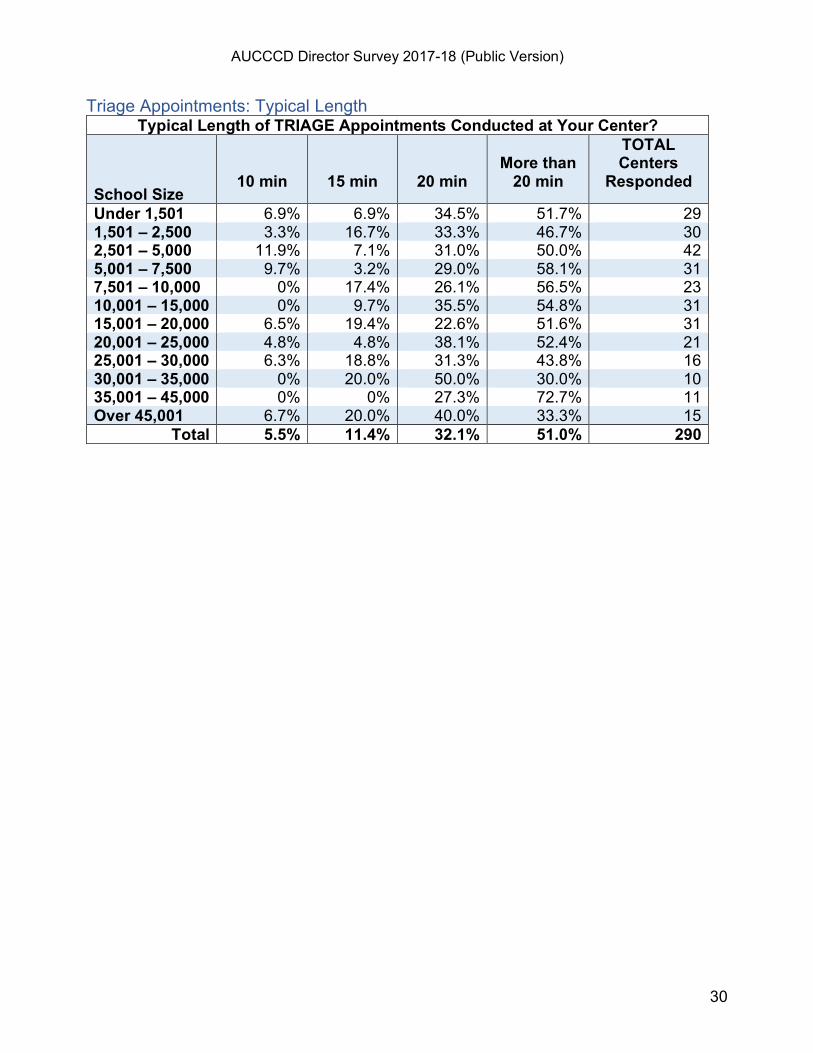
Triage Appointments: Typical Length Typical Length of TRIAGE Appointments Conducted at Your Center?
School Size
10 min
15 min
20 min
More than
20 min
TOTAL Centers
Responded
Under 1,501 6.9% 6.9% 34.5% 51.7% 29 1,501 – 2,500 3.3% 16.7% 33.3% 46.7% 30 2,501 – 5,000 11.9% 7.1% 31.0% 50.0% 42 5,001 – 7,500 9.7% 3.2% 29.0% 58.1% 31 7,501 – 10,000 0% 17.4% 26.1% 56.5% 23 10,001 – 15,000 0% 9.7% 35.5% 54.8% 31 15,001 – 20,000 6.5% 19.4% 22.6% 51.6% 31 20,001 – 25,000 4.8% 4.8% 38.1% 52.4% 21 25,001 – 30,000 6.3% 18.8% 31.3% 43.8% 16 30,001 – 35,000 0% 20.0% 50.0% 30.0% 10 35,001 – 45,000 0% 0% 27.3% 72.7% 11 Over 45,001 6.7% 20.0% 40.0% 33.3% 15
Total 5.5% 11.4% 32.1% 51.0% 290
AUCCCD Director Survey 2017-18 (Public Version)
31
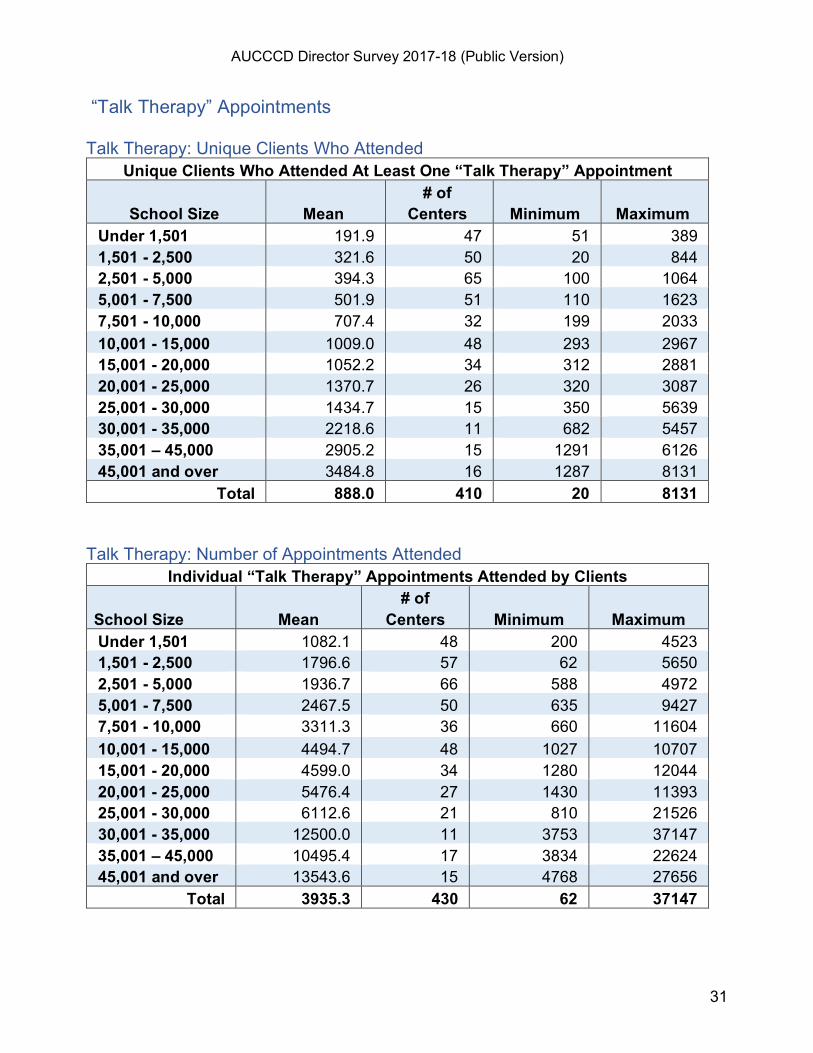
“Talk Therapy” Appointments Talk Therapy: Unique Clients Who Attended
Unique Clients Who Attended At Least One “Talk Therapy” Appointment
School Size
Mean # of
Centers
Minimum
Maximum Under 1,501 191.9 47 51 389 1,501 - 2,500 321.6 50 20 844 2,501 - 5,000 394.3 65 100 1064 5,001 - 7,500 501.9 51 110 1623 7,501 - 10,000 707.4 32 199 2033 10,001 - 15,000 1009.0 48 293 2967 15,001 - 20,000 1052.2 34 312 2881 20,001 - 25,000 1370.7 26 320 3087 25,001 - 30,000 1434.7 15 350 5639 30,001 - 35,000 2218.6 11 682 5457 35,001 – 45,000 2905.2 15 1291 6126 45,001 and over 3484.8 16 1287 8131
Total 888.0 410 20 8131 Talk Therapy: Number of Appointments Attended
Individual “Talk Therapy” Appointments Attended by Clients School Size
Mean
# of Centers
Minimum
Maximum
Under 1,501 1082.1 48 200 4523 1,501 - 2,500 1796.6 57 62 5650 2,501 - 5,000 1936.7 66 588 4972 5,001 - 7,500 2467.5 50 635 9427 7,501 - 10,000 3311.3 36 660 11604 10,001 - 15,000 4494.7 48 1027 10707 15,001 - 20,000 4599.0 34 1280 12044 20,001 - 25,000 5476.4 27 1430 11393 25,001 - 30,000 6112.6 21 810 21526 30,001 - 35,000 12500.0 11 3753 37147 35,001 – 45,000 10495.4 17 3834 22624 45,001 and over 13543.6 15 4768 27656
Total 3935.3 430 62 37147
AUCCCD Director Survey 2017-18 (Public Version)
32
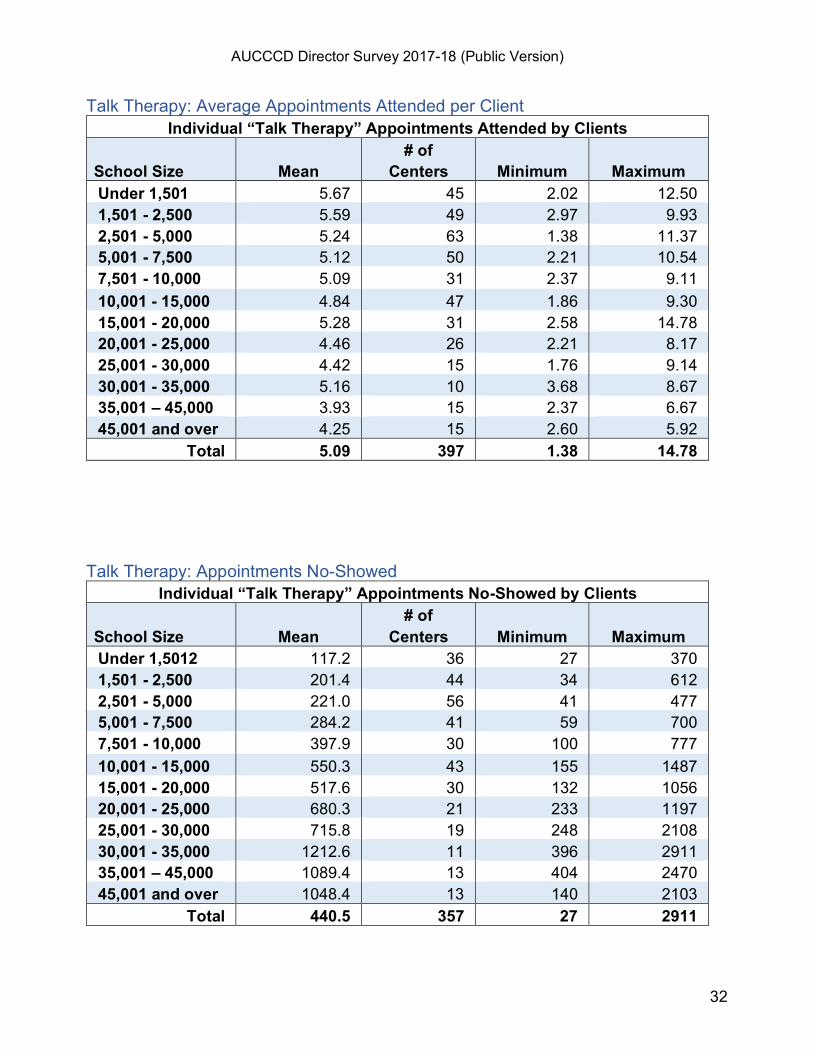
Talk Therapy: Average Appointments Attended per Client Individual “Talk Therapy” Appointments Attended by Clients
School Size
Mean
# of Centers
Minimum
Maximum
Under 1,501 5.67 45 2.02 12.50 1,501 - 2,500 5.59 49 2.97 9.93 2,501 - 5,000 5.24 63 1.38 11.37 5,001 - 7,500 5.12 50 2.21 10.54 7,501 - 10,000 5.09 31 2.37 9.11 10,001 - 15,000 4.84 47 1.86 9.30 15,001 - 20,000 5.28 31 2.58 14.78 20,001 - 25,000 4.46 26 2.21 8.17 25,001 - 30,000 4.42 15 1.76 9.14 30,001 - 35,000 5.16 10 3.68 8.67 35,001 – 45,000 3.93 15 2.37 6.67 45,001 and over 4.25 15 2.60 5.92
Total 5.09 397 1.38 14.78 Talk Therapy: Appointments No-Showed
Individual “Talk Therapy” Appointments No-Showed by Clients School Size
Mean
# of Centers
Minimum
Maximum
Under 1,5012 117.2 36 27 370 1,501 - 2,500 201.4 44 34 612 2,501 - 5,000 221.0 56 41 477 5,001 - 7,500 284.2 41 59 700 7,501 - 10,000 397.9 30 100 777 10,001 - 15,000 550.3 43 155 1487 15,001 - 20,000 517.6 30 132 1056 20,001 - 25,000 680.3 21 233 1197 25,001 - 30,000 715.8 19 248 2108 30,001 - 35,000 1212.6 11 396 2911 35,001 – 45,000 1089.4 13 404 2470 45,001 and over 1048.4 13 140 2103
Total 440.5 357 27 2911
AUCCCD Director Survey 2017-18 (Public Version)
33
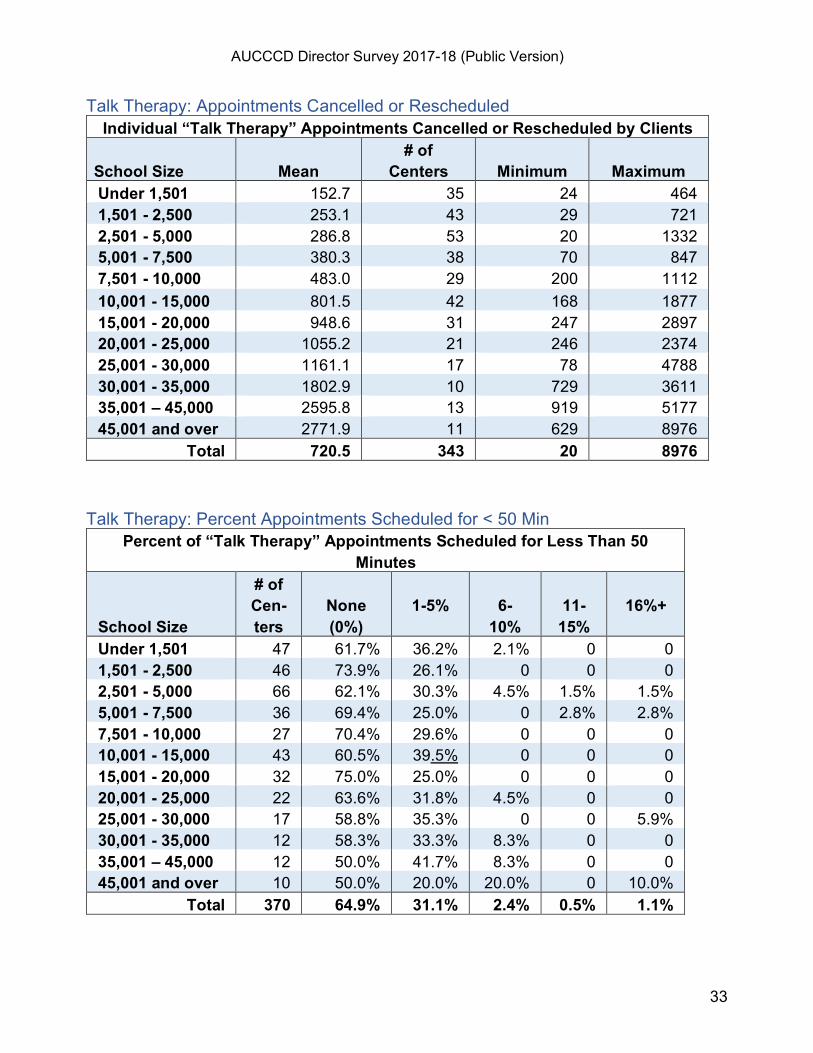
Talk Therapy: Appointments Cancelled or Rescheduled Individual “Talk Therapy” Appointments Cancelled or Rescheduled by Clients
School Size
Mean
# of Centers
Minimum
Maximum
Under 1,501 152.7 35 24 464 1,501 - 2,500 253.1 43 29 721 2,501 - 5,000 286.8 53 20 1332 5,001 - 7,500 380.3 38 70 847 7,501 - 10,000 483.0 29 200 1112 10,001 - 15,000 801.5 42 168 1877 15,001 - 20,000 948.6 31 247 2897 20,001 - 25,000 1055.2 21 246 2374 25,001 - 30,000 1161.1 17 78 4788 30,001 - 35,000 1802.9 10 729 3611 35,001 – 45,000 2595.8 13 919 5177 45,001 and over 2771.9 11 629 8976
Total 720.5 343 20 8976 Talk Therapy: Percent Appointments Scheduled for < 50 Min
Percent of “Talk Therapy” Appointments Scheduled for Less Than 50 Minutes
School Size
# of Cen-ters
None (0%)
1-5%
6-
10%
11-
15%
16%+
Under 1,501 47 61.7% 36.2% 2.1% 0 0 1,501 - 2,500 46 73.9% 26.1% 0 0 0 2,501 - 5,000 66 62.1% 30.3% 4.5% 1.5% 1.5% 5,001 - 7,500 36 69.4% 25.0% 0 2.8% 2.8% 7,501 - 10,000 27 70.4% 29.6% 0 0 0 10,001 - 15,000 43 60.5% 39.5% 0 0 0 15,001 - 20,000 32 75.0% 25.0% 0 0 0 20,001 - 25,000 22 63.6% 31.8% 4.5% 0 0 25,001 - 30,000 17 58.8% 35.3% 0 0 5.9% 30,001 - 35,000 12 58.3% 33.3% 8.3% 0 0 35,001 – 45,000 12 50.0% 41.7% 8.3% 0 0 45,001 and over 10 50.0% 20.0% 20.0% 0 10.0%
Total 370 64.9% 31.1% 2.4% 0.5% 1.1%
AUCCCD Director Survey 2017-18 (Public Version)
34
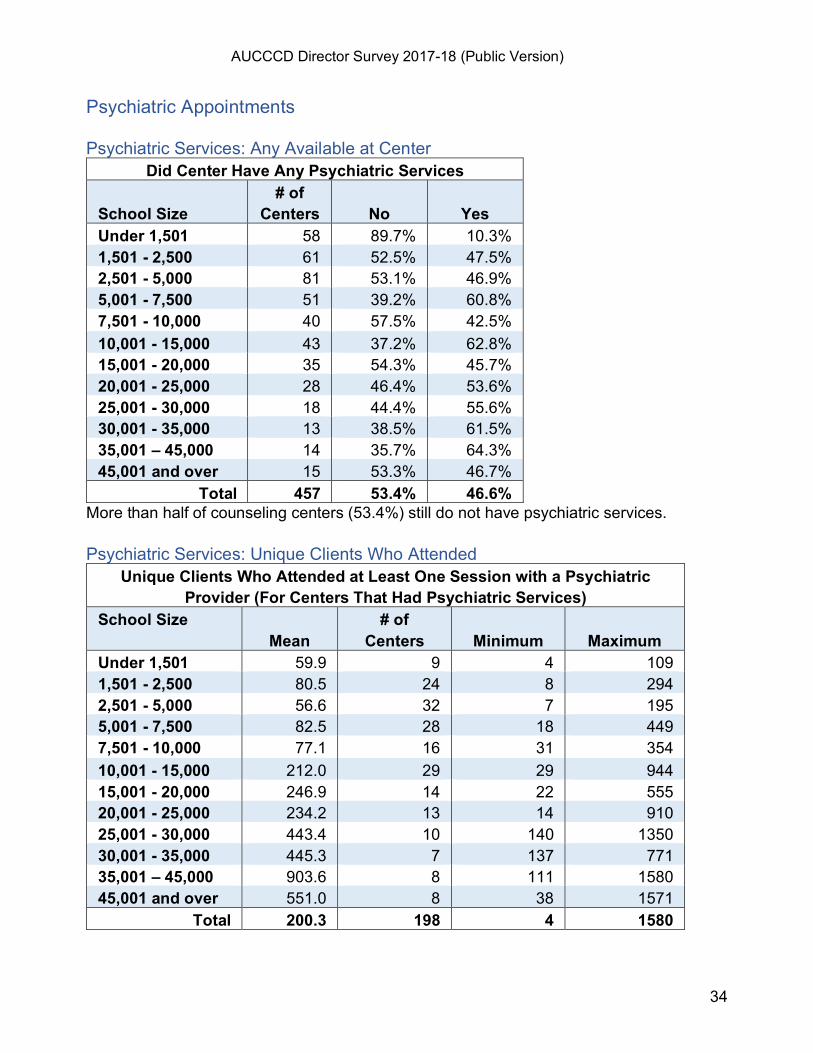
Psychiatric Appointments Psychiatric Services: Any Available at Center
Did Center Have Any Psychiatric Services School Size
# of Centers
No
Yes
Under 1,501 58 89.7% 10.3% 1,501 - 2,500 61 52.5% 47.5% 2,501 - 5,000 81 53.1% 46.9% 5,001 - 7,500 51 39.2% 60.8% 7,501 - 10,000 40 57.5% 42.5% 10,001 - 15,000 43 37.2% 62.8% 15,001 - 20,000 35 54.3% 45.7% 20,001 - 25,000 28 46.4% 53.6% 25,001 - 30,000 18 44.4% 55.6% 30,001 - 35,000 13 38.5% 61.5% 35,001 – 45,000 14 35.7% 64.3% 45,001 and over 15 53.3% 46.7%
Total 457 53.4% 46.6% More than half of counseling centers (53.4%) still do not have psychiatric services. Psychiatric Services: Unique Clients Who Attended
Unique Clients Who Attended at Least One Session with a Psychiatric Provider (For Centers That Had Psychiatric Services)
School Size Mean
# of Centers
Minimum
Maximum
Under 1,501 59.9 9 4 109 1,501 - 2,500 80.5 24 8 294 2,501 - 5,000 56.6 32 7 195 5,001 - 7,500 82.5 28 18 449 7,501 - 10,000 77.1 16 31 354 10,001 - 15,000 212.0 29 29 944 15,001 - 20,000 246.9 14 22 555 20,001 - 25,000 234.2 13 14 910 25,001 - 30,000 443.4 10 140 1350 30,001 - 35,000 445.3 7 137 771 35,001 – 45,000 903.6 8 111 1580 45,001 and over 551.0 8 38 1571
Total 200.3 198 4 1580
AUCCCD Director Survey 2017-18 (Public Version)
35
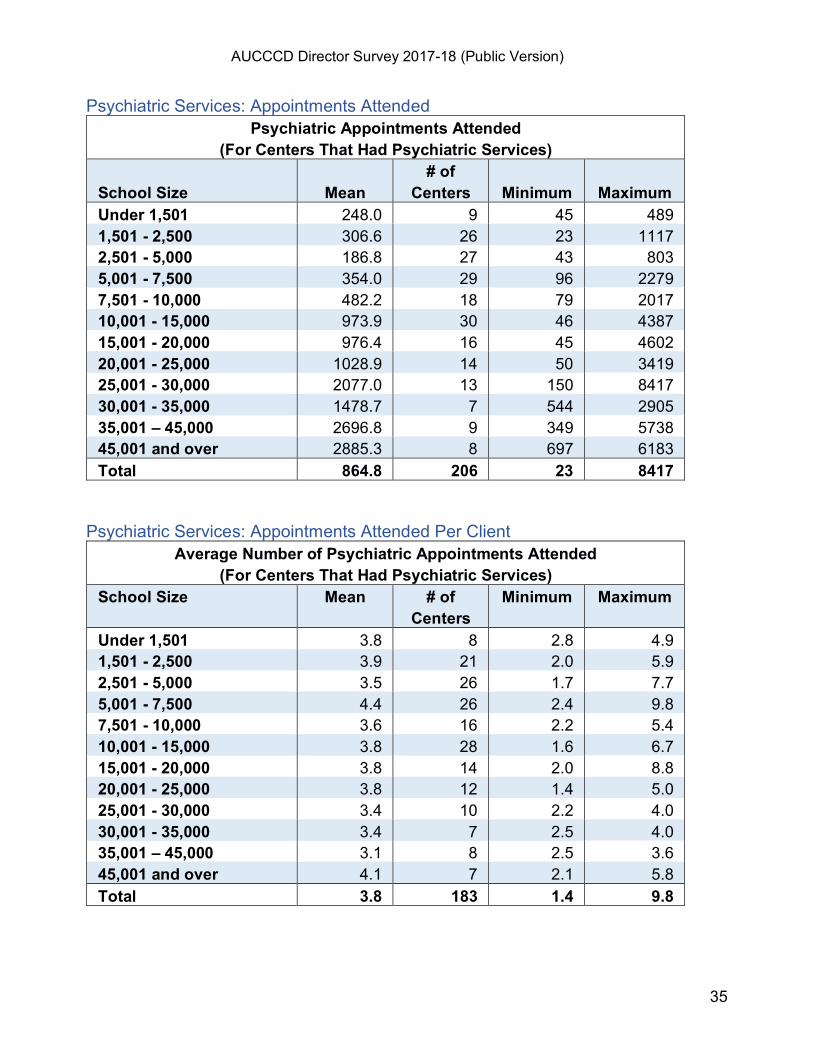
Psychiatric Services: Appointments Attended Psychiatric Appointments Attended
(For Centers That Had Psychiatric Services) School Size
Mean
# of Centers
Minimum
Maximum
Under 1,501 248.0 9 45 489 1,501 - 2,500 306.6 26 23 1117 2,501 - 5,000 186.8 27 43 803 5,001 - 7,500 354.0 29 96 2279 7,501 - 10,000 482.2 18 79 2017 10,001 - 15,000 973.9 30 46 4387 15,001 - 20,000 976.4 16 45 4602 20,001 - 25,000 1028.9 14 50 3419 25,001 - 30,000 2077.0 13 150 8417 30,001 - 35,000 1478.7 7 544 2905 35,001 – 45,000 2696.8 9 349 5738 45,001 and over 2885.3 8 697 6183 Total 864.8 206 23 8417
Psychiatric Services: Appointments Attended Per Client
Average Number of Psychiatric Appointments Attended (For Centers That Had Psychiatric Services)
School Size Mean # of Centers
Minimum Maximum
Under 1,501 3.8 8 2.8 4.9 1,501 - 2,500 3.9 21 2.0 5.9 2,501 - 5,000 3.5 26 1.7 7.7 5,001 - 7,500 4.4 26 2.4 9.8 7,501 - 10,000 3.6 16 2.2 5.4 10,001 - 15,000 3.8 28 1.6 6.7 15,001 - 20,000 3.8 14 2.0 8.8 20,001 - 25,000 3.8 12 1.4 5.0 25,001 - 30,000 3.4 10 2.2 4.0 30,001 - 35,000 3.4 7 2.5 4.0 35,001 – 45,000 3.1 8 2.5 3.6 45,001 and over 4.1 7 2.1 5.8 Total 3.8 183 1.4 9.8
AUCCCD Director Survey 2017-18 (Public Version)
36
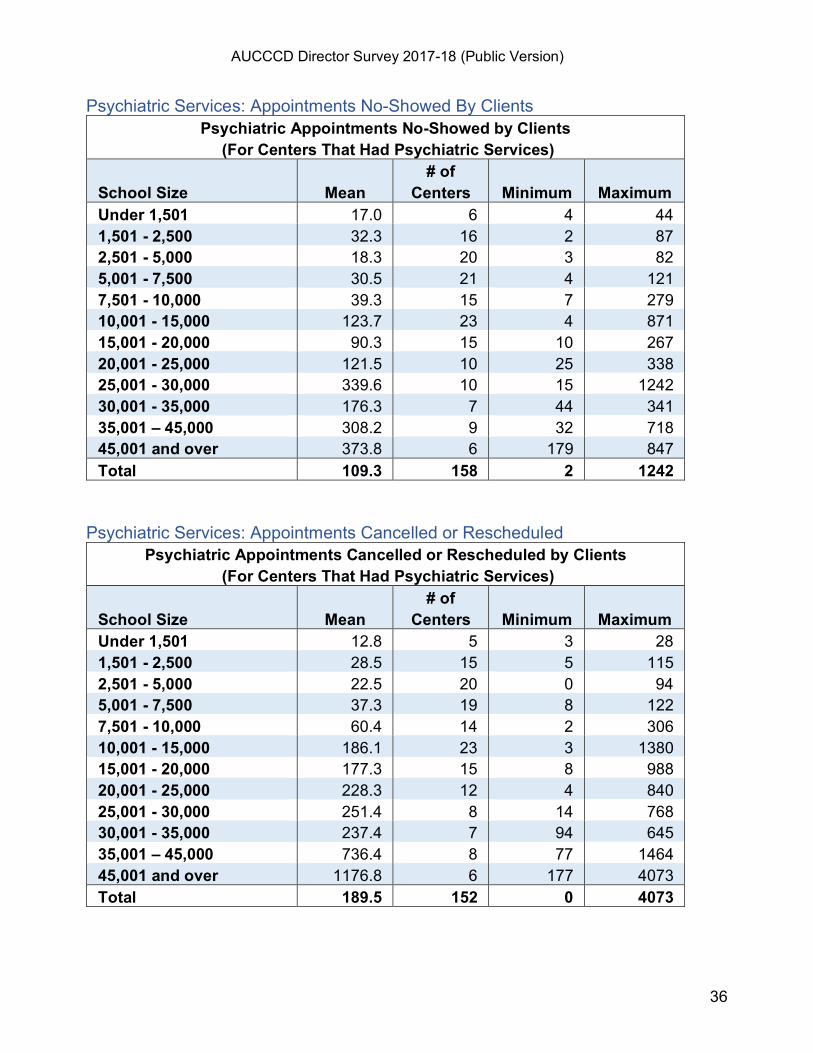
Psychiatric Services: Appointments No-Showed By Clients Psychiatric Appointments No-Showed by Clients
(For Centers That Had Psychiatric Services) School Size
Mean
# of Centers
Minimum
Maximum
Under 1,501 17.0 6 4 44 1,501 - 2,500 32.3 16 2 87 2,501 - 5,000 18.3 20 3 82 5,001 - 7,500 30.5 21 4 121 7,501 - 10,000 39.3 15 7 279 10,001 - 15,000 123.7 23 4 871 15,001 - 20,000 90.3 15 10 267 20,001 - 25,000 121.5 10 25 338 25,001 - 30,000 339.6 10 15 1242 30,001 - 35,000 176.3 7 44 341 35,001 – 45,000 308.2 9 32 718 45,001 and over 373.8 6 179 847 Total 109.3 158 2 1242
Psychiatric Services: Appointments Cancelled or Rescheduled
Psychiatric Appointments Cancelled or Rescheduled by Clients (For Centers That Had Psychiatric Services)
School Size
Mean
# of Centers
Minimum
Maximum
Under 1,501 12.8 5 3 28 1,501 - 2,500 28.5 15 5 115 2,501 - 5,000 22.5 20 0 94 5,001 - 7,500 37.3 19 8 122 7,501 - 10,000 60.4 14 2 306 10,001 - 15,000 186.1 23 3 1380 15,001 - 20,000 177.3 15 8 988 20,001 - 25,000 228.3 12 4 840 25,001 - 30,000 251.4 8 14 768 30,001 - 35,000 237.4 7 94 645 35,001 – 45,000 736.4 8 77 1464 45,001 and over 1176.8 6 177 4073 Total 189.5 152 0 4073
AUCCCD Director Survey 2017-18 (Public Version)
37
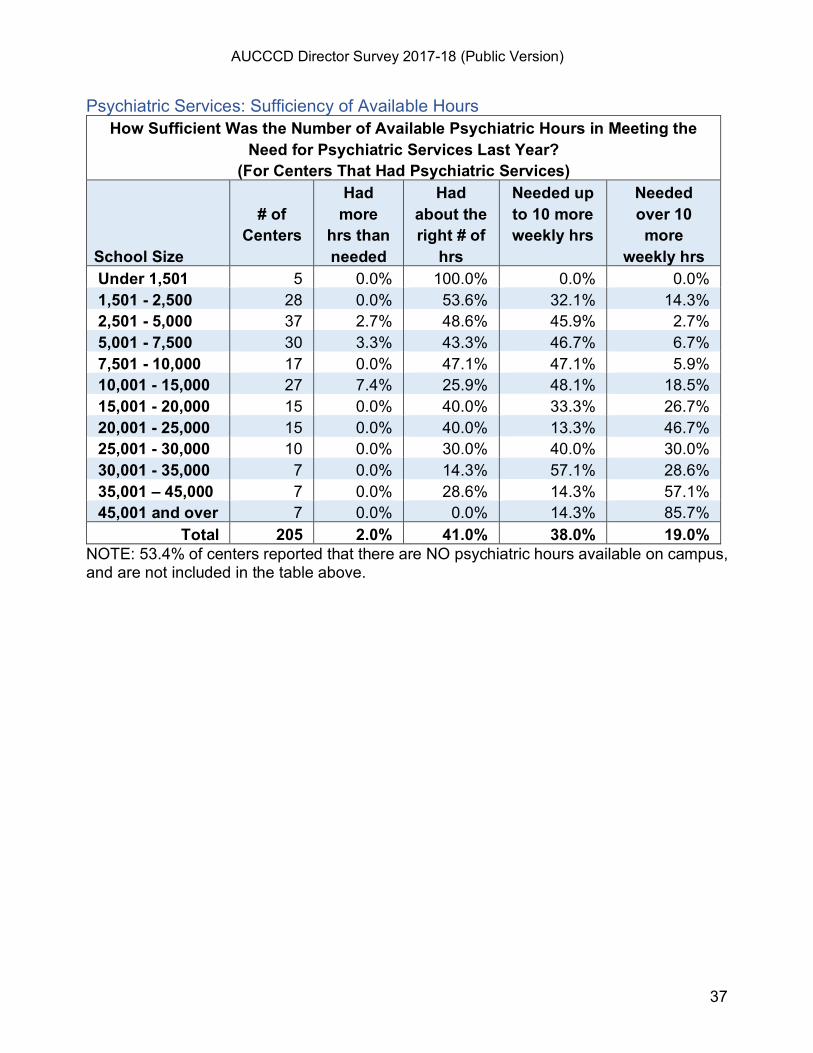
Psychiatric Services: Sufficiency of Available Hours How Sufficient Was the Number of Available Psychiatric Hours in Meeting the
Need for Psychiatric Services Last Year? (For Centers That Had Psychiatric Services)
School Size
# of
Centers
Had more
hrs than needed
Had about the right # of
hrs
Needed up to 10 more weekly hrs
Needed over 10 more
weekly hrs Under 1,501 5 0.0% 100.0% 0.0% 0.0% 1,501 - 2,500 28 0.0% 53.6% 32.1% 14.3% 2,501 - 5,000 37 2.7% 48.6% 45.9% 2.7% 5,001 - 7,500 30 3.3% 43.3% 46.7% 6.7% 7,501 - 10,000 17 0.0% 47.1% 47.1% 5.9% 10,001 - 15,000 27 7.4% 25.9% 48.1% 18.5% 15,001 - 20,000 15 0.0% 40.0% 33.3% 26.7% 20,001 - 25,000 15 0.0% 40.0% 13.3% 46.7% 25,001 - 30,000 10 0.0% 30.0% 40.0% 30.0% 30,001 - 35,000 7 0.0% 14.3% 57.1% 28.6% 35,001 – 45,000 7 0.0% 28.6% 14.3% 57.1% 45,001 and over 7 0.0% 0.0% 14.3% 85.7%
Total 205 2.0% 41.0% 38.0% 19.0% NOTE: 53.4% of centers reported that there are NO psychiatric hours available on campus, and are not included in the table above.
AUCCCD Director Survey 2017-18 (Public Version)
38
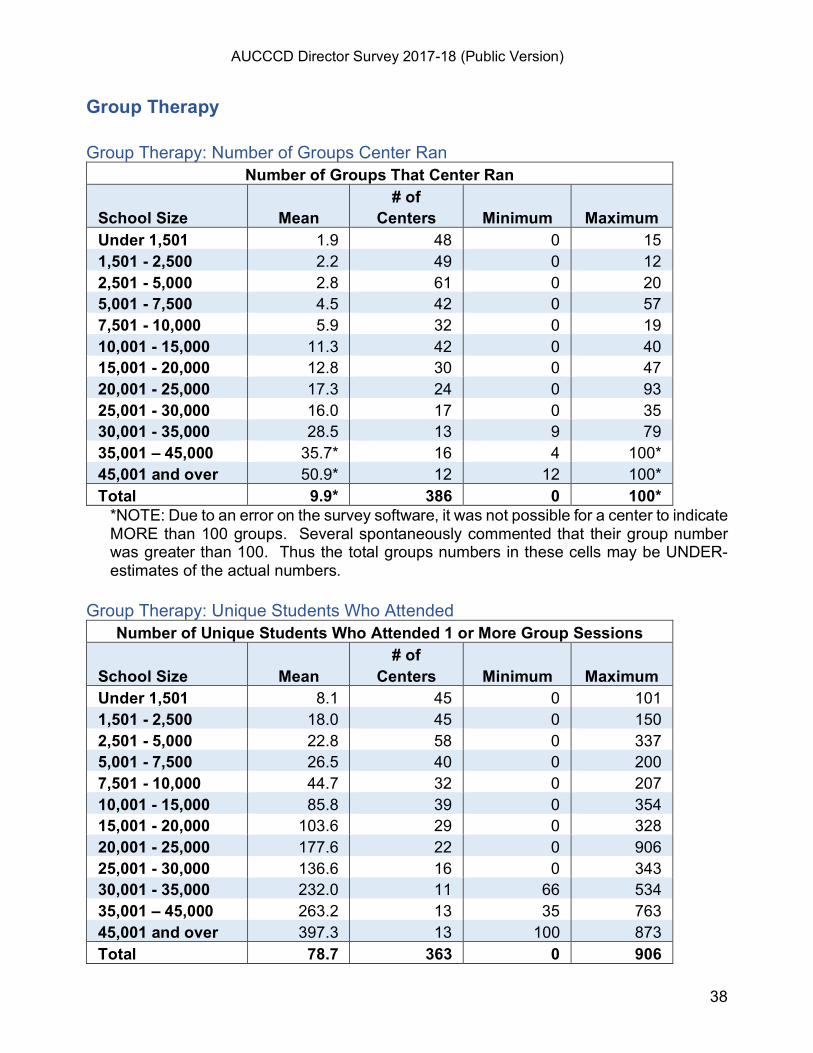
Group Therapy Group Therapy: Number of Groups Center Ran
Number of Groups That Center Ran School Size
Mean
# of Centers
Minimum
Maximum
Under 1,501 1.9 48 0 15 1,501 - 2,500 2.2 49 0 12 2,501 - 5,000 2.8 61 0 20 5,001 - 7,500 4.5 42 0 57 7,501 - 10,000 5.9 32 0 19 10,001 - 15,000 11.3 42 0 40 15,001 - 20,000 12.8 30 0 47 20,001 - 25,000 17.3 24 0 93 25,001 - 30,000 16.0 17 0 35 30,001 - 35,000 28.5 13 9 79 35,001 – 45,000 35.7* 16 4 100* 45,001 and over 50.9* 12 12 100* Total 9.9* 386 0 100*
*NOTE: Due to an error on the survey software, it was not possible for a center to indicate MORE than 100 groups. Several spontaneously commented that their group number was greater than 100. Thus the total groups numbers in these cells may be UNDER-estimates of the actual numbers.
Group Therapy: Unique Students Who Attended
Number of Unique Students Who Attended 1 or More Group Sessions School Size
Mean
# of Centers
Minimum
Maximum
Under 1,501 8.1 45 0 101 1,501 - 2,500 18.0 45 0 150 2,501 - 5,000 22.8 58 0 337 5,001 - 7,500 26.5 40 0 200 7,501 - 10,000 44.7 32 0 207 10,001 - 15,000 85.8 39 0 354 15,001 - 20,000 103.6 29 0 328 20,001 - 25,000 177.6 22 0 906 25,001 - 30,000 136.6 16 0 343 30,001 - 35,000 232.0 11 66 534 35,001 – 45,000 263.2 13 35 763 45,001 and over 397.3 13 100 873 Total 78.7 363 0 906
AUCCCD Director Survey 2017-18 (Public Version)
39
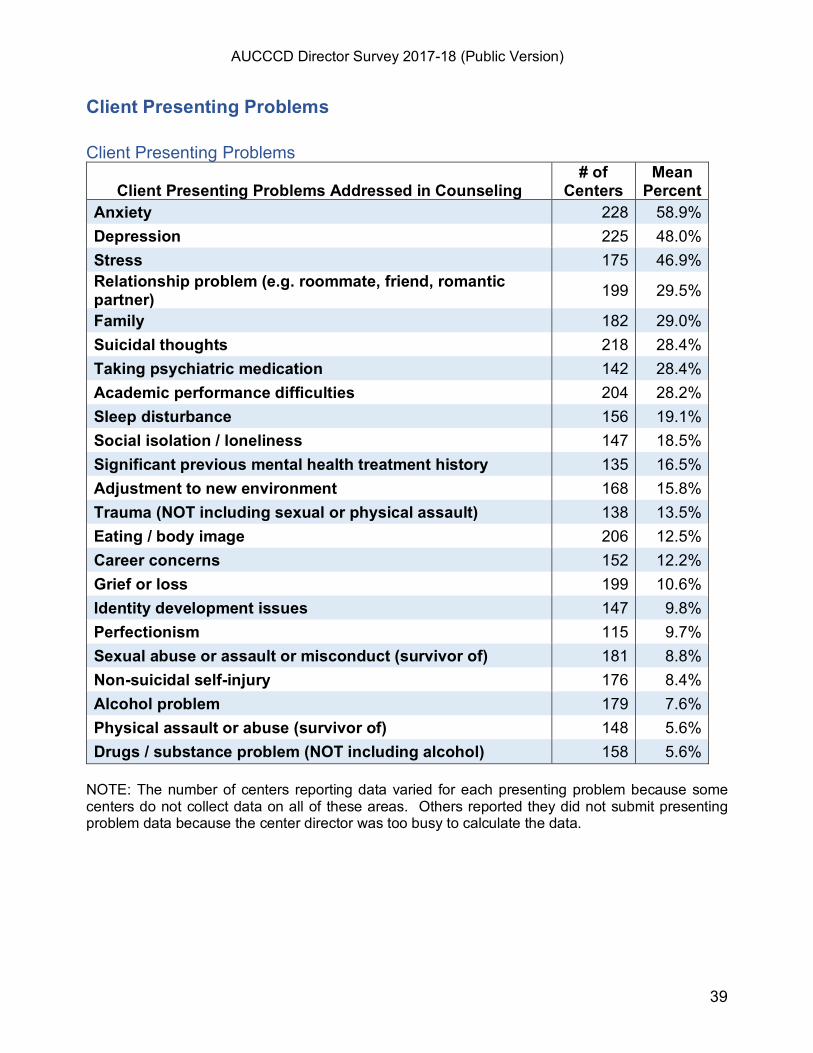
Client Presenting Problems Client Presenting Problems
Client Presenting Problems Addressed in Counseling
# of Centers
Mean Percent
Anxiety 228 58.9% Depression 225 48.0% Stress 175 46.9% Relationship problem (e.g. roommate, friend, romantic partner) 199 29.5%
Family 182 29.0% Suicidal thoughts 218 28.4% Taking psychiatric medication 142 28.4% Academic performance difficulties 204 28.2% Sleep disturbance 156 19.1% Social isolation / loneliness 147 18.5% Significant previous mental health treatment history 135 16.5% Adjustment to new environment 168 15.8% Trauma (NOT including sexual or physical assault) 138 13.5% Eating / body image 206 12.5% Career concerns 152 12.2% Grief or loss 199 10.6% Identity development issues 147 9.8% Perfectionism 115 9.7% Sexual abuse or assault or misconduct (survivor of) 181 8.8% Non-suicidal self-injury 176 8.4% Alcohol problem 179 7.6% Physical assault or abuse (survivor of) 148 5.6% Drugs / substance problem (NOT including alcohol) 158 5.6%
NOTE: The number of centers reporting data varied for each presenting problem because some centers do not collect data on all of these areas. Others reported they did not submit presenting problem data because the center director was too busy to calculate the data.
AUCCCD Director Survey 2017-18 (Public Version)
40
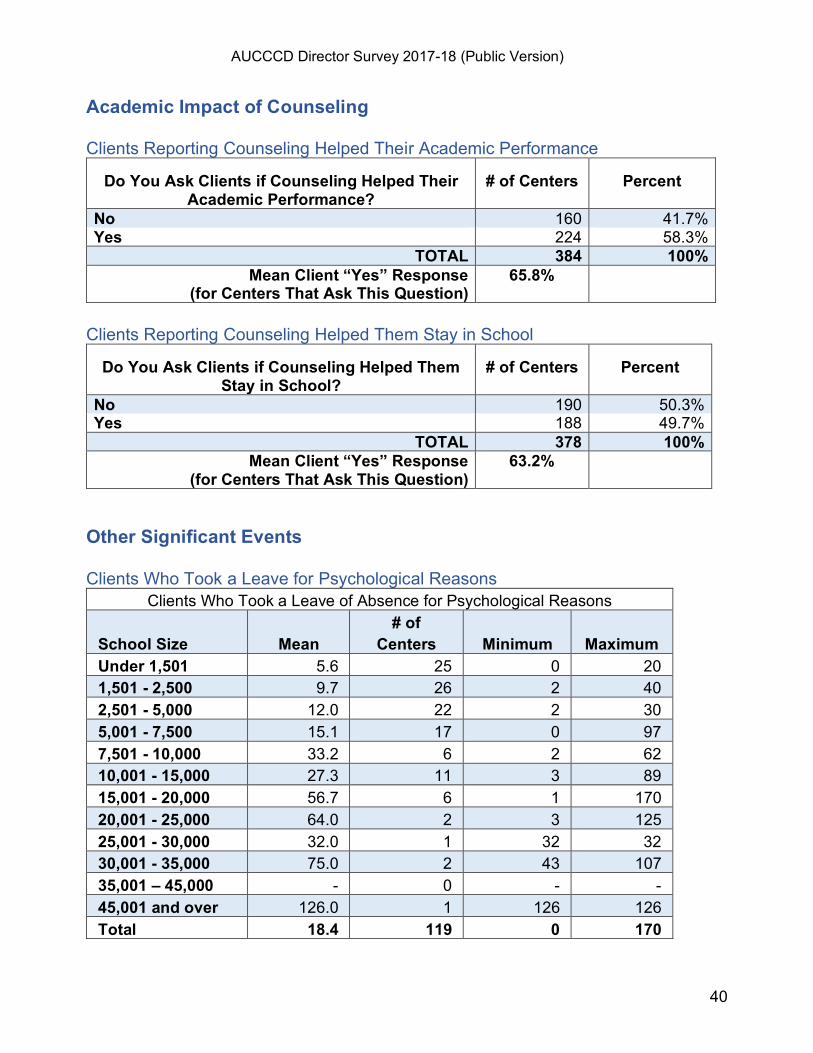
Academic Impact of Counseling Clients Reporting Counseling Helped Their Academic Performance
Do You Ask Clients if Counseling Helped Their Academic Performance?
# of Centers Percent
No 160 41.7% Yes 224 58.3%
TOTAL 384 100% Mean Client “Yes” Response
(for Centers That Ask This Question) 65.8%
Clients Reporting Counseling Helped Them Stay in School
Do You Ask Clients if Counseling Helped Them Stay in School?
# of Centers Percent
No 190 50.3% Yes 188 49.7%
TOTAL 378 100% Mean Client “Yes” Response
(for Centers That Ask This Question) 63.2%
Other Significant Events Clients Who Took a Leave for Psychological Reasons
Clients Who Took a Leave of Absence for Psychological Reasons School Size
Mean
# of Centers
Minimum
Maximum
Under 1,501 5.6 25 0 20 1,501 - 2,500 9.7 26 2 40 2,501 - 5,000 12.0 22 2 30 5,001 - 7,500 15.1 17 0 97 7,501 - 10,000 33.2 6 2 62 10,001 - 15,000 27.3 11 3 89 15,001 - 20,000 56.7 6 1 170 20,001 - 25,000 64.0 2 3 125 25,001 - 30,000 32.0 1 32 32 30,001 - 35,000 75.0 2 43 107 35,001 – 45,000 - 0 - - 45,001 and over 126.0 1 126 126 Total 18.4 119 0 170
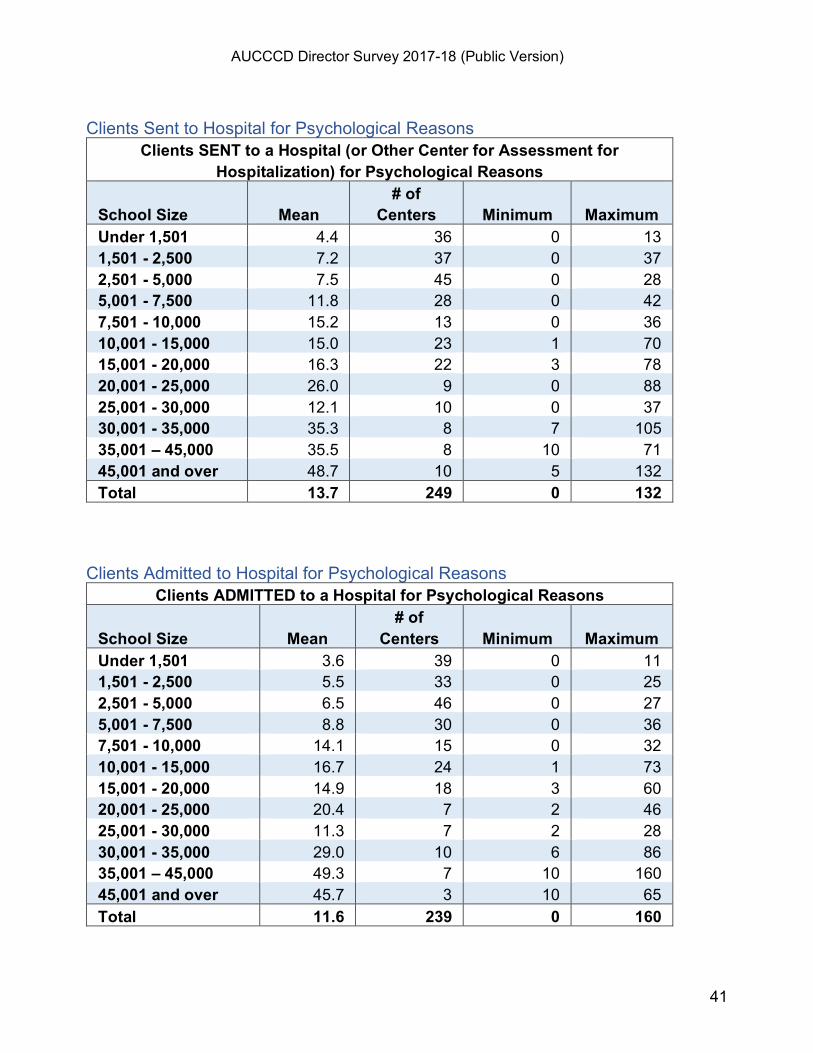
AUCCCD Director Survey 2017-18 (Public Version)
41
Clients Sent to Hospital for Psychological Reasons
Clients SENT to a Hospital (or Other Center for Assessment for Hospitalization) for Psychological Reasons
School Size
Mean
# of Centers
Minimum
Maximum
Under 1,501 4.4 36 0 13 1,501 - 2,500 7.2 37 0 37 2,501 - 5,000 7.5 45 0 28 5,001 - 7,500 11.8 28 0 42 7,501 - 10,000 15.2 13 0 36 10,001 - 15,000 15.0 23 1 70 15,001 - 20,000 16.3 22 3 78 20,001 - 25,000 26.0 9 0 88 25,001 - 30,000 12.1 10 0 37 30,001 - 35,000 35.3 8 7 105 35,001 – 45,000 35.5 8 10 71 45,001 and over 48.7 10 5 132 Total 13.7 249 0 132
Clients Admitted to Hospital for Psychological Reasons
Clients ADMITTED to a Hospital for Psychological Reasons School Size
Mean
# of Centers
Minimum
Maximum
Under 1,501 3.6 39 0 11 1,501 - 2,500 5.5 33 0 25 2,501 - 5,000 6.5 46 0 27 5,001 - 7,500 8.8 30 0 36 7,501 - 10,000 14.1 15 0 32 10,001 - 15,000 16.7 24 1 73 15,001 - 20,000 14.9 18 3 60 20,001 - 25,000 20.4 7 2 46 25,001 - 30,000 11.3 7 2 28 30,001 - 35,000 29.0 10 6 86 35,001 – 45,000 49.3 7 10 160 45,001 and over 45.7 3 10 65 Total 11.6 239 0 160
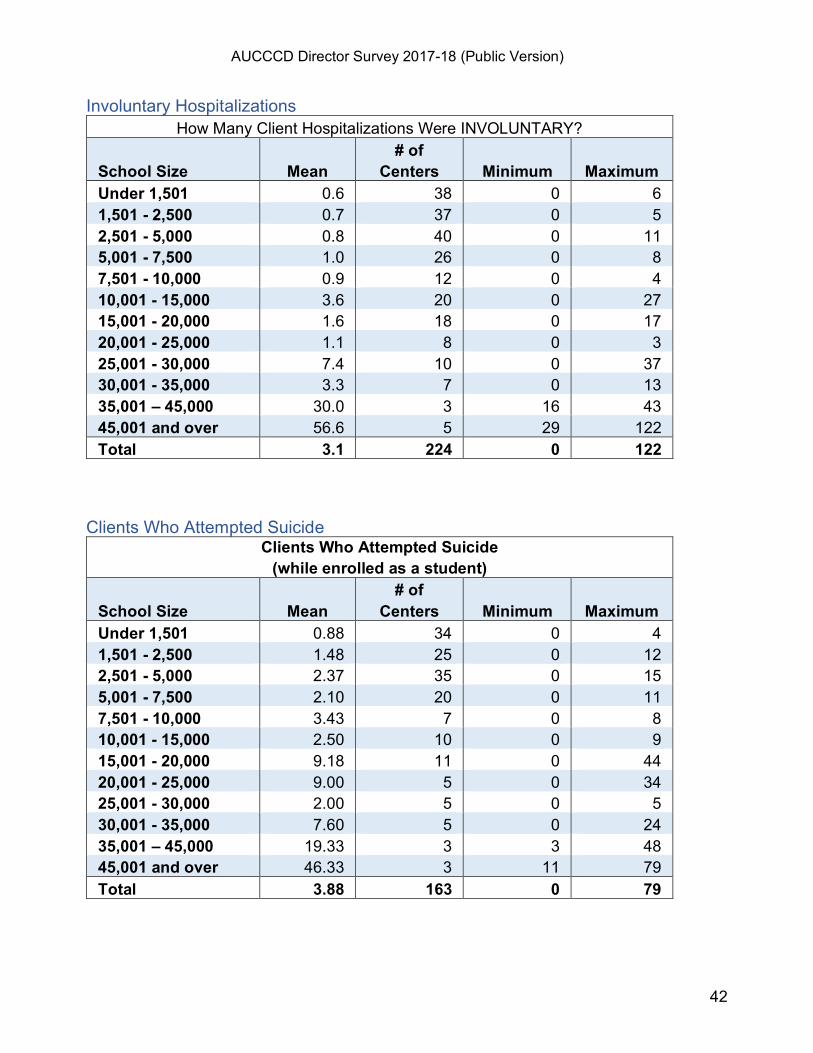
AUCCCD Director Survey 2017-18 (Public Version)
42
Involuntary Hospitalizations How Many Client Hospitalizations Were INVOLUNTARY?
School Size
Mean
# of Centers
Minimum
Maximum
Under 1,501 0.6 38 0 6 1,501 - 2,500 0.7 37 0 5 2,501 - 5,000 0.8 40 0 11 5,001 - 7,500 1.0 26 0 8 7,501 - 10,000 0.9 12 0 4 10,001 - 15,000 3.6 20 0 27 15,001 - 20,000 1.6 18 0 17 20,001 - 25,000 1.1 8 0 3 25,001 - 30,000 7.4 10 0 37 30,001 - 35,000 3.3 7 0 13 35,001 – 45,000 30.0 3 16 43 45,001 and over 56.6 5 29 122 Total 3.1 224 0 122
Clients Who Attempted Suicide
Clients Who Attempted Suicide (while enrolled as a student)
School Size
Mean
# of Centers
Minimum
Maximum
Under 1,501 0.88 34 0 4 1,501 - 2,500 1.48 25 0 12 2,501 - 5,000 2.37 35 0 15 5,001 - 7,500 2.10 20 0 11 7,501 - 10,000 3.43 7 0 8 10,001 - 15,000 2.50 10 0 9 15,001 - 20,000 9.18 11 0 44 20,001 - 25,000 9.00 5 0 34 25,001 - 30,000 2.00 5 0 5 30,001 - 35,000 7.60 5 0 24 35,001 – 45,000 19.33 3 3 48 45,001 and over 46.33 3 11 79 Total 3.88 163 0 79
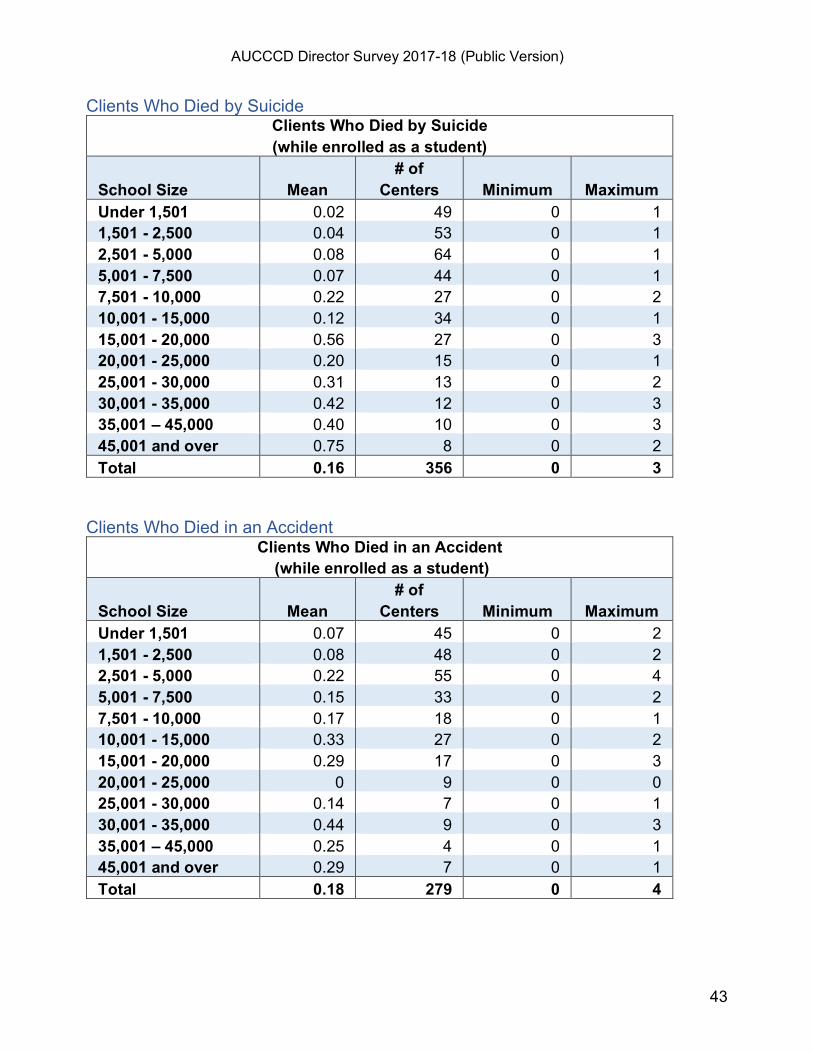
AUCCCD Director Survey 2017-18 (Public Version)
43
Clients Who Died by Suicide Clients Who Died by Suicide (while enrolled as a student)
School Size
Mean
# of Centers
Minimum
Maximum
Under 1,501 0.02 49 0 1 1,501 - 2,500 0.04 53 0 1 2,501 - 5,000 0.08 64 0 1 5,001 - 7,500 0.07 44 0 1 7,501 - 10,000 0.22 27 0 2 10,001 - 15,000 0.12 34 0 1 15,001 - 20,000 0.56 27 0 3 20,001 - 25,000 0.20 15 0 1 25,001 - 30,000 0.31 13 0 2 30,001 - 35,000 0.42 12 0 3 35,001 – 45,000 0.40 10 0 3 45,001 and over 0.75 8 0 2 Total 0.16 356 0 3
Clients Who Died in an Accident
Clients Who Died in an Accident (while enrolled as a student)
School Size
Mean
# of Centers
Minimum
Maximum
Under 1,501 0.07 45 0 2 1,501 - 2,500 0.08 48 0 2 2,501 - 5,000 0.22 55 0 4 5,001 - 7,500 0.15 33 0 2 7,501 - 10,000 0.17 18 0 1 10,001 - 15,000 0.33 27 0 2 15,001 - 20,000 0.29 17 0 3 20,001 - 25,000 0 9 0 0 25,001 - 30,000 0.14 7 0 1 30,001 - 35,000 0.44 9 0 3 35,001 – 45,000 0.25 4 0 1 45,001 and over 0.29 7 0 1 Total 0.18 279 0 4
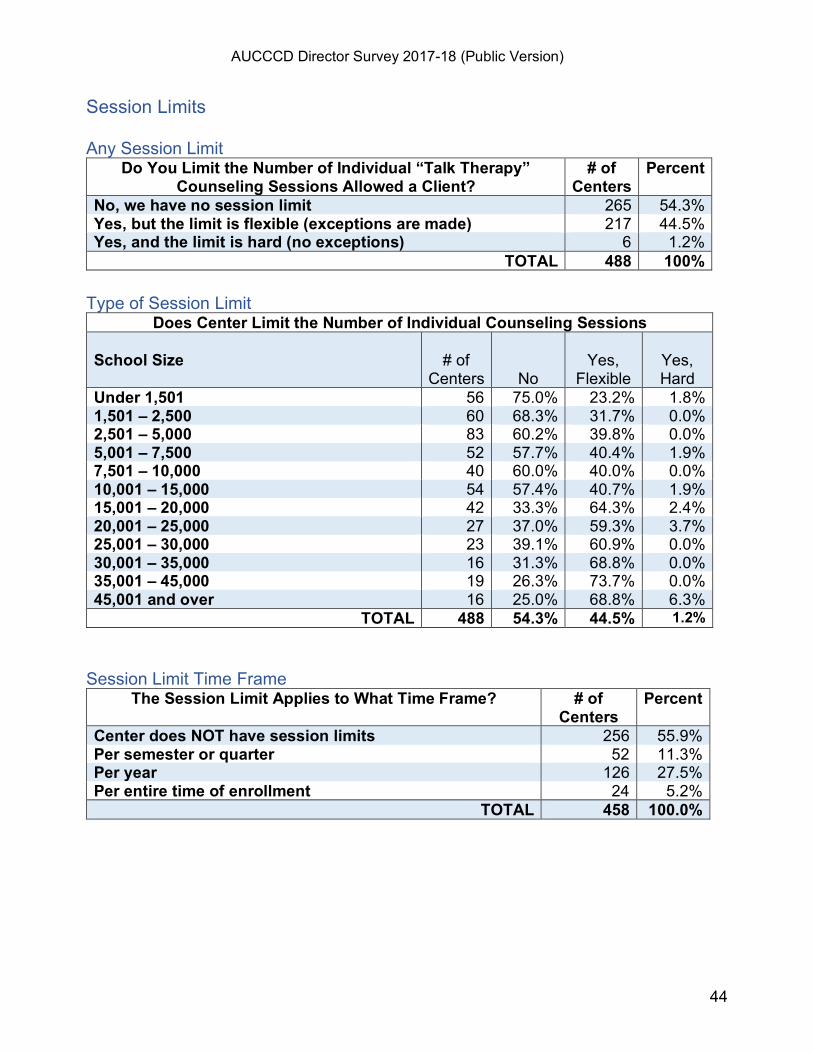
AUCCCD Director Survey 2017-18 (Public Version)
44
Session Limits Any Session Limit
Do You Limit the Number of Individual “Talk Therapy” Counseling Sessions Allowed a Client?
# of Centers
Percent
No, we have no session limit 265 54.3% Yes, but the limit is flexible (exceptions are made) 217 44.5% Yes, and the limit is hard (no exceptions) 6 1.2%
TOTAL 488 100% Type of Session Limit
Does Center Limit the Number of Individual Counseling Sessions School Size
# of
Centers
No
Yes,
Flexible
Yes, Hard
Under 1,501 56 75.0% 23.2% 1.8% 1,501 – 2,500 60 68.3% 31.7% 0.0% 2,501 – 5,000 83 60.2% 39.8% 0.0% 5,001 – 7,500 52 57.7% 40.4% 1.9% 7,501 – 10,000 40 60.0% 40.0% 0.0% 10,001 – 15,000 54 57.4% 40.7% 1.9% 15,001 – 20,000 42 33.3% 64.3% 2.4% 20,001 – 25,000 27 37.0% 59.3% 3.7% 25,001 – 30,000 23 39.1% 60.9% 0.0% 30,001 – 35,000 16 31.3% 68.8% 0.0% 35,001 – 45,000 19 26.3% 73.7% 0.0% 45,001 and over 16 25.0% 68.8% 6.3%
TOTAL 488 54.3% 44.5% 1.2% Session Limit Time Frame
The Session Limit Applies to What Time Frame? # of Centers
Percent
Center does NOT have session limits 256 55.9% Per semester or quarter 52 11.3% Per year 126 27.5% Per entire time of enrollment 24 5.2%
TOTAL 458 100.0%
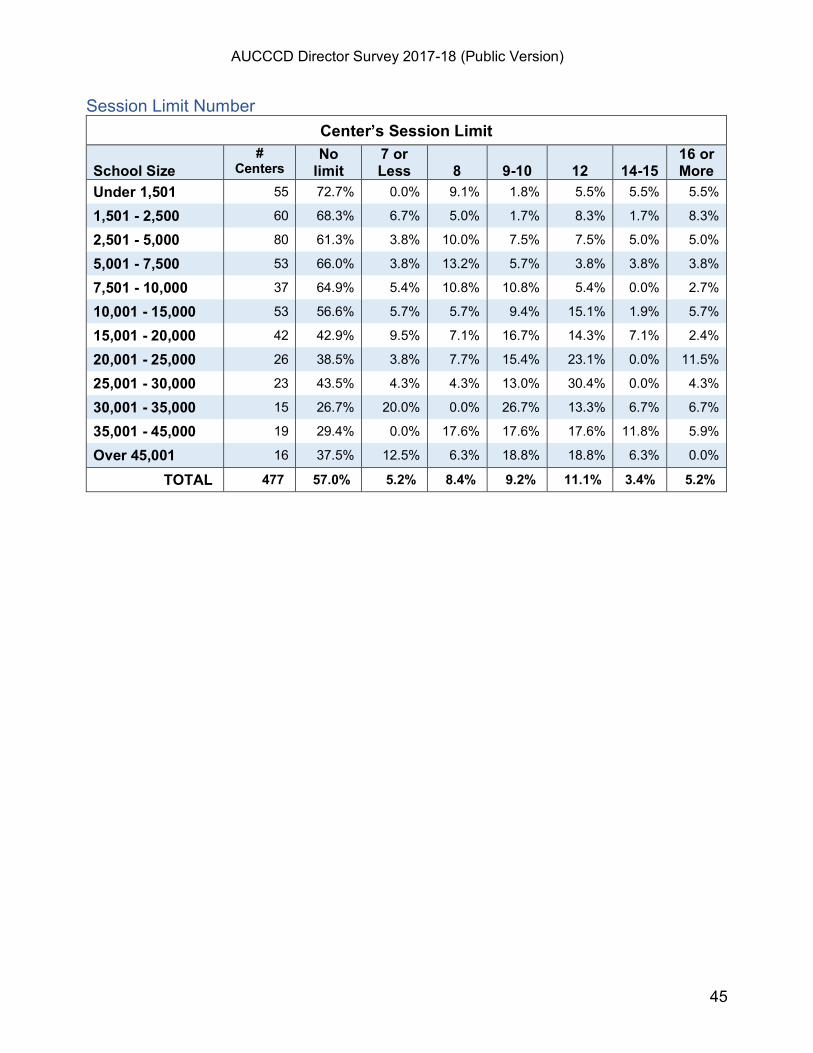
AUCCCD Director Survey 2017-18 (Public Version)
45
Session Limit Number Center’s Session Limit
School Size
# Centers
No limit
7 or Less
8
9-10
12
14-15
16 or More
Under 1,501 55 72.7% 0.0% 9.1% 1.8% 5.5% 5.5% 5.5%
1,501 - 2,500 60 68.3% 6.7% 5.0% 1.7% 8.3% 1.7% 8.3%
2,501 - 5,000 80 61.3% 3.8% 10.0% 7.5% 7.5% 5.0% 5.0%
5,001 - 7,500 53 66.0% 3.8% 13.2% 5.7% 3.8% 3.8% 3.8%
7,501 - 10,000 37 64.9% 5.4% 10.8% 10.8% 5.4% 0.0% 2.7%
10,001 - 15,000 53 56.6% 5.7% 5.7% 9.4% 15.1% 1.9% 5.7%
15,001 - 20,000 42 42.9% 9.5% 7.1% 16.7% 14.3% 7.1% 2.4%
20,001 - 25,000 26 38.5% 3.8% 7.7% 15.4% 23.1% 0.0% 11.5%
25,001 - 30,000 23 43.5% 4.3% 4.3% 13.0% 30.4% 0.0% 4.3%
30,001 - 35,000 15 26.7% 20.0% 0.0% 26.7% 13.3% 6.7% 6.7%
35,001 - 45,000 19 29.4% 0.0% 17.6% 17.6% 17.6% 11.8% 5.9%
Over 45,001 16 37.5% 12.5% 6.3% 18.8% 18.8% 6.3% 0.0%
TOTAL 477 57.0% 5.2% 8.4% 9.2% 11.1% 3.4% 5.2%
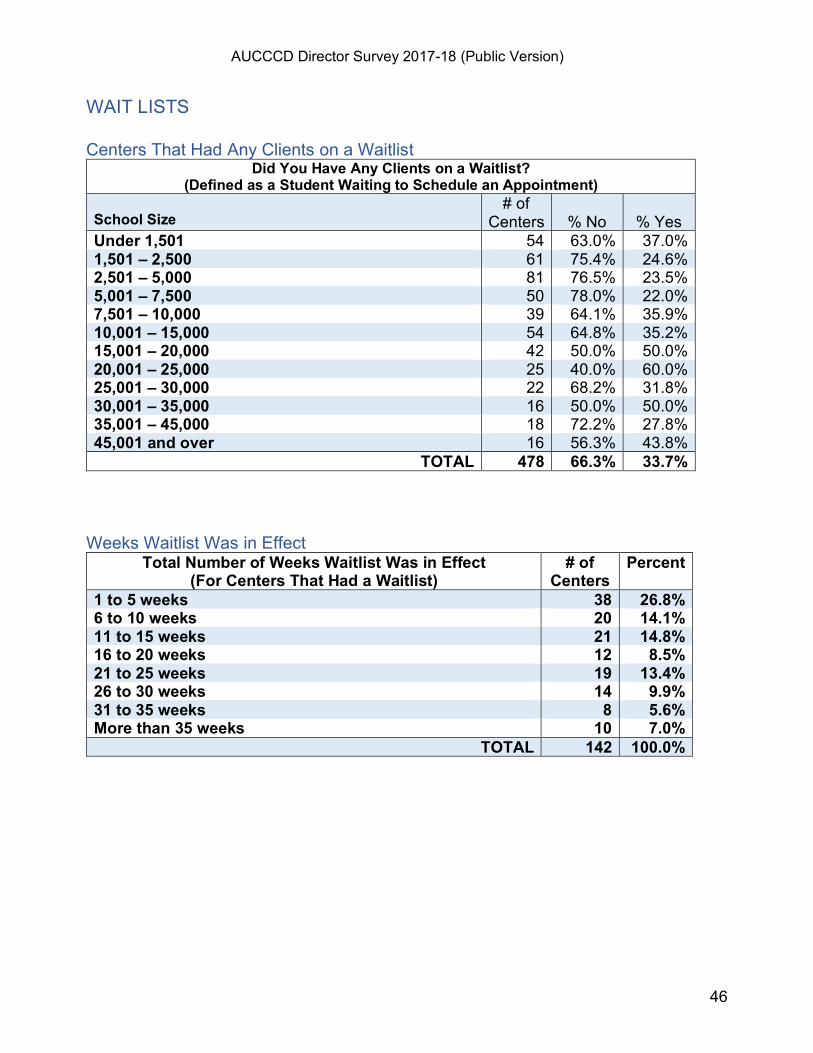
AUCCCD Director Survey 2017-18 (Public Version)
46
WAIT LISTS Centers That Had Any Clients on a Waitlist
Did You Have Any Clients on a Waitlist? (Defined as a Student Waiting to Schedule an Appointment)
School Size
# of Centers
% No
% Yes
Under 1,501 54 63.0% 37.0% 1,501 – 2,500 61 75.4% 24.6% 2,501 – 5,000 81 76.5% 23.5% 5,001 – 7,500 50 78.0% 22.0% 7,501 – 10,000 39 64.1% 35.9% 10,001 – 15,000 54 64.8% 35.2% 15,001 – 20,000 42 50.0% 50.0% 20,001 – 25,000 25 40.0% 60.0% 25,001 – 30,000 22 68.2% 31.8% 30,001 – 35,000 16 50.0% 50.0% 35,001 – 45,000 18 72.2% 27.8% 45,001 and over 16 56.3% 43.8%
TOTAL 478 66.3% 33.7% Weeks Waitlist Was in Effect
Total Number of Weeks Waitlist Was in Effect (For Centers That Had a Waitlist)
# of Centers
Percent
1 to 5 weeks 38 26.8% 6 to 10 weeks 20 14.1% 11 to 15 weeks 21 14.8% 16 to 20 weeks 12 8.5% 21 to 25 weeks 19 13.4% 26 to 30 weeks 14 9.9% 31 to 35 weeks 8 5.6% More than 35 weeks 10 7.0%
TOTAL 142 100.0%
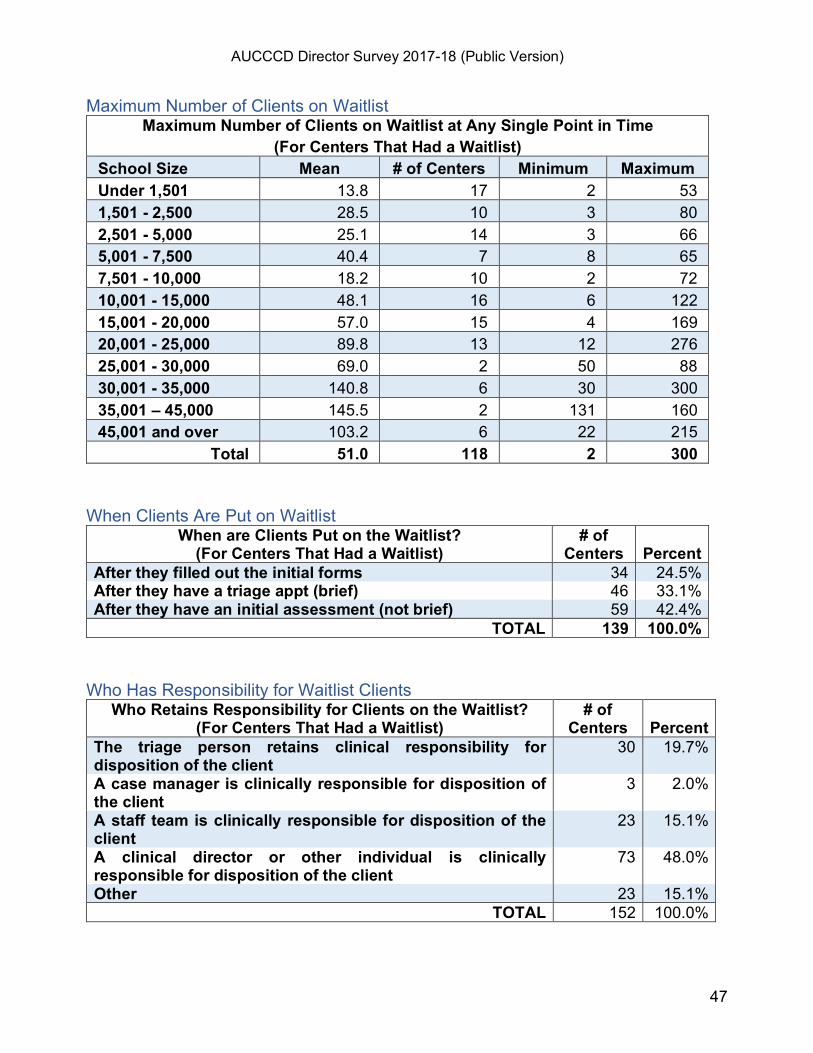
AUCCCD Director Survey 2017-18 (Public Version)
47
Maximum Number of Clients on Waitlist Maximum Number of Clients on Waitlist at Any Single Point in Time
(For Centers That Had a Waitlist) School Size Mean # of Centers Minimum Maximum Under 1,501 13.8 17 2 53 1,501 - 2,500 28.5 10 3 80 2,501 - 5,000 25.1 14 3 66 5,001 - 7,500 40.4 7 8 65 7,501 - 10,000 18.2 10 2 72 10,001 - 15,000 48.1 16 6 122 15,001 - 20,000 57.0 15 4 169 20,001 - 25,000 89.8 13 12 276 25,001 - 30,000 69.0 2 50 88 30,001 - 35,000 140.8 6 30 300 35,001 – 45,000 145.5 2 131 160 45,001 and over 103.2 6 22 215
Total 51.0 118 2 300 When Clients Are Put on Waitlist
When are Clients Put on the Waitlist? (For Centers That Had a Waitlist)
# of Centers
Percent
After they filled out the initial forms 34 24.5% After they have a triage appt (brief) 46 33.1% After they have an initial assessment (not brief) 59 42.4%
TOTAL 139 100.0% Who Has Responsibility for Waitlist Clients
Who Retains Responsibility for Clients on the Waitlist? (For Centers That Had a Waitlist)
# of Centers
Percent
The triage person retains clinical responsibility for disposition of the client
30 19.7%
A case manager is clinically responsible for disposition of the client
3 2.0%
A staff team is clinically responsible for disposition of the client
23 15.1%
A clinical director or other individual is clinically responsible for disposition of the client
73 48.0%
Other 23 15.1% TOTAL 152 100.0%
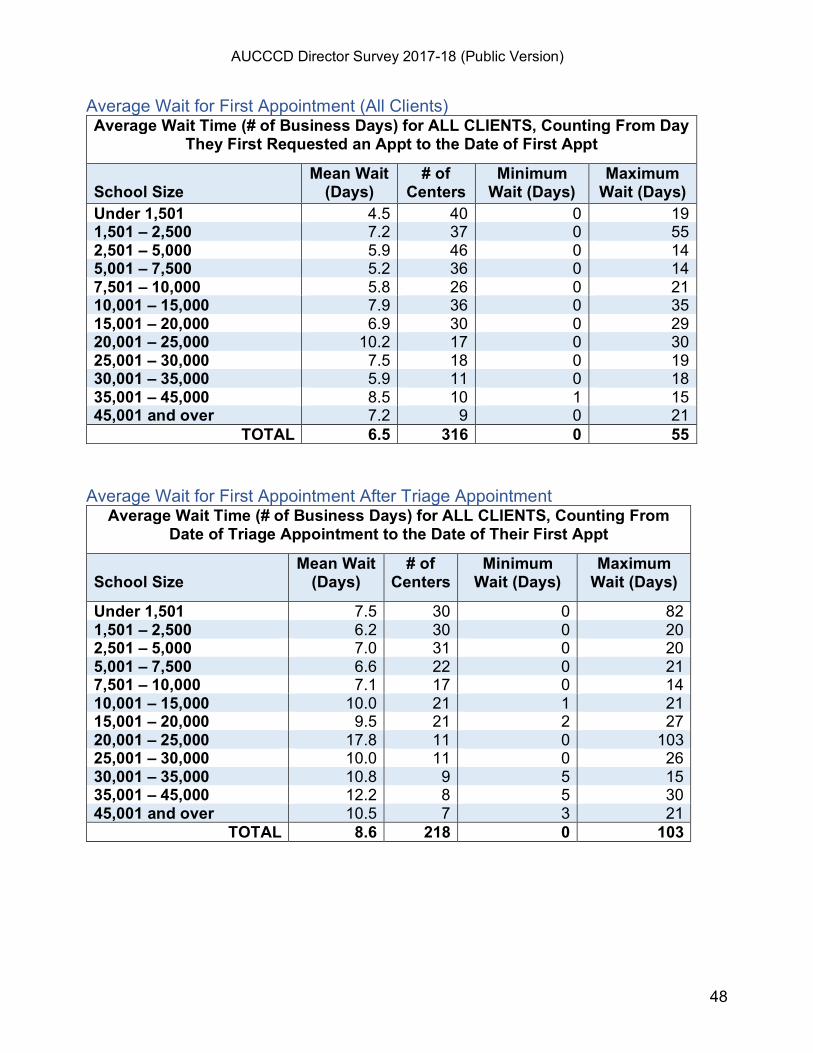
AUCCCD Director Survey 2017-18 (Public Version)
48
Average Wait for First Appointment (All Clients) Average Wait Time (# of Business Days) for ALL CLIENTS, Counting From Day
They First Requested an Appt to the Date of First Appt
School Size
Mean Wait (Days)
# of Centers
Minimum Wait (Days)
Maximum Wait (Days)
Under 1,501 4.5 40 0 19 1,501 – 2,500 7.2 37 0 55 2,501 – 5,000 5.9 46 0 14 5,001 – 7,500 5.2 36 0 14 7,501 – 10,000 5.8 26 0 21 10,001 – 15,000 7.9 36 0 35 15,001 – 20,000 6.9 30 0 29 20,001 – 25,000 10.2 17 0 30 25,001 – 30,000 7.5 18 0 19 30,001 – 35,000 5.9 11 0 18 35,001 – 45,000 8.5 10 1 15 45,001 and over 7.2 9 0 21
TOTAL 6.5 316 0 55 Average Wait for First Appointment After Triage Appointment
Average Wait Time (# of Business Days) for ALL CLIENTS, Counting From Date of Triage Appointment to the Date of Their First Appt
School Size
Mean Wait (Days)
# of Centers
Minimum Wait (Days)
Maximum Wait (Days)
Under 1,501 7.5 30 0 82 1,501 – 2,500 6.2 30 0 20 2,501 – 5,000 7.0 31 0 20 5,001 – 7,500 6.6 22 0 21 7,501 – 10,000 7.1 17 0 14 10,001 – 15,000 10.0 21 1 21 15,001 – 20,000 9.5 21 2 27 20,001 – 25,000 17.8 11 0 103 25,001 – 30,000 10.0 11 0 26 30,001 – 35,000 10.8 9 5 15 35,001 – 45,000 12.2 8 5 30 45,001 and over 10.5 7 3 21
TOTAL 8.6 218 0 103
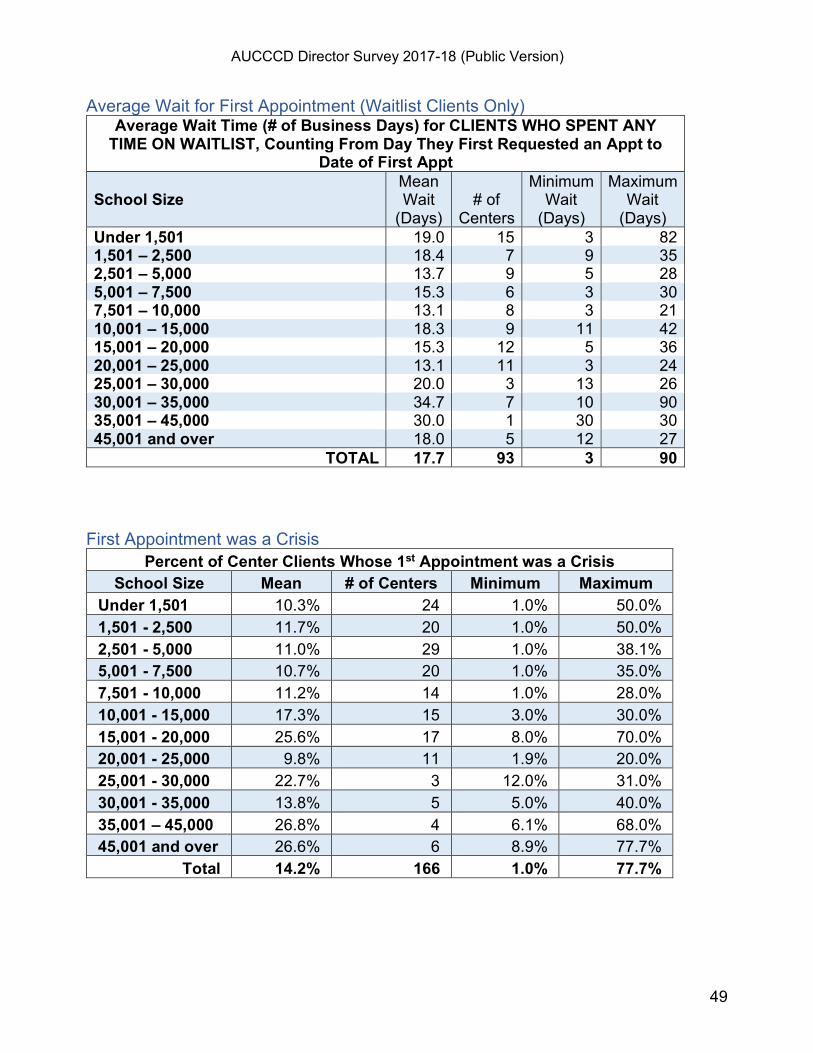
AUCCCD Director Survey 2017-18 (Public Version)
49
Average Wait for First Appointment (Waitlist Clients Only) Average Wait Time (# of Business Days) for CLIENTS WHO SPENT ANY
TIME ON WAITLIST, Counting From Day They First Requested an Appt to Date of First Appt
School Size
Mean Wait
(Days)
# of
Centers
Minimum Wait
(Days)
Maximum Wait
(Days) Under 1,501 19.0 15 3 82 1,501 – 2,500 18.4 7 9 35 2,501 – 5,000 13.7 9 5 28 5,001 – 7,500 15.3 6 3 30 7,501 – 10,000 13.1 8 3 21 10,001 – 15,000 18.3 9 11 42 15,001 – 20,000 15.3 12 5 36 20,001 – 25,000 13.1 11 3 24 25,001 – 30,000 20.0 3 13 26 30,001 – 35,000 34.7 7 10 90 35,001 – 45,000 30.0 1 30 30 45,001 and over 18.0 5 12 27
TOTAL 17.7 93 3 90 First Appointment was a Crisis
Percent of Center Clients Whose 1st Appointment was a Crisis School Size Mean # of Centers Minimum Maximum
Under 1,501 10.3% 24 1.0% 50.0% 1,501 - 2,500 11.7% 20 1.0% 50.0% 2,501 - 5,000 11.0% 29 1.0% 38.1% 5,001 - 7,500 10.7% 20 1.0% 35.0% 7,501 - 10,000 11.2% 14 1.0% 28.0% 10,001 - 15,000 17.3% 15 3.0% 30.0% 15,001 - 20,000 25.6% 17 8.0% 70.0% 20,001 - 25,000 9.8% 11 1.9% 20.0% 25,001 - 30,000 22.7% 3 12.0% 31.0% 30,001 - 35,000 13.8% 5 5.0% 40.0% 35,001 – 45,000 26.8% 4 6.1% 68.0% 45,001 and over 26.6% 6 8.9% 77.7%
Total 14.2% 166 1.0% 77.7%
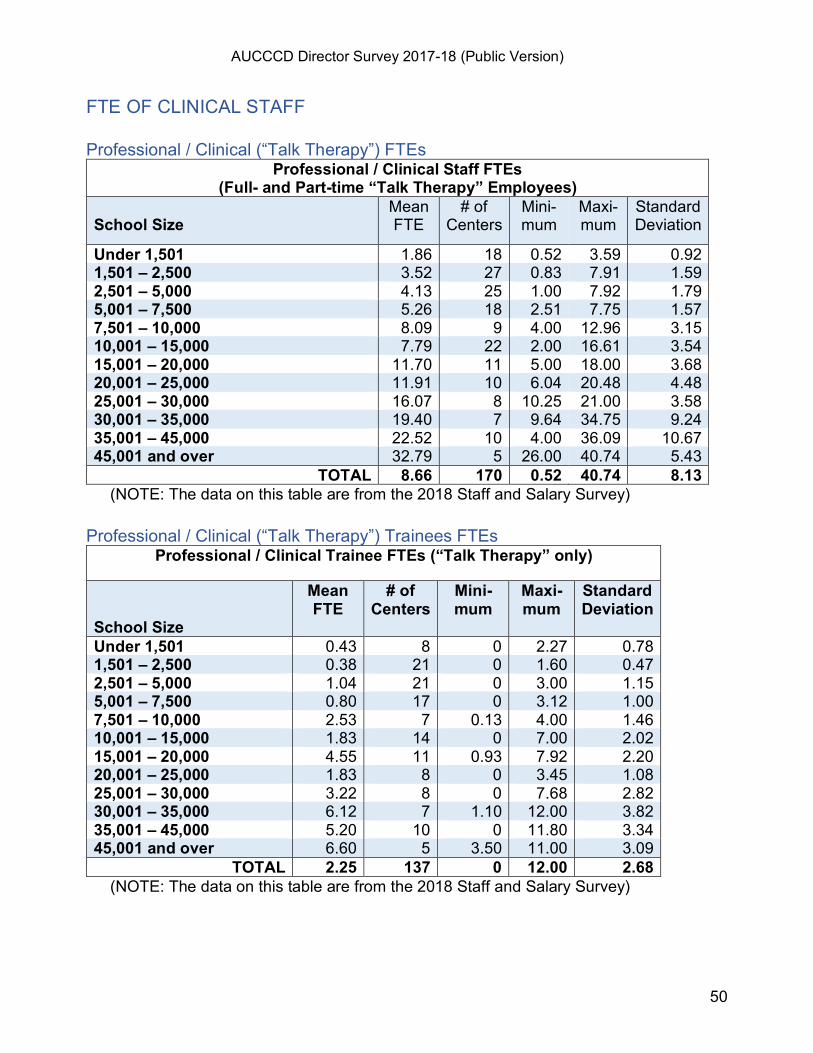
AUCCCD Director Survey 2017-18 (Public Version)
50
FTE OF CLINICAL STAFF Professional / Clinical (“Talk Therapy”) FTEs
Professional / Clinical Staff FTEs (Full- and Part-time “Talk Therapy” Employees)
School Size
Mean FTE
# of Centers
Mini-mum
Maxi-mum
Standard Deviation
Under 1,501 1.86 18 0.52 3.59 0.92 1,501 – 2,500 3.52 27 0.83 7.91 1.59 2,501 – 5,000 4.13 25 1.00 7.92 1.79 5,001 – 7,500 5.26 18 2.51 7.75 1.57 7,501 – 10,000 8.09 9 4.00 12.96 3.15 10,001 – 15,000 7.79 22 2.00 16.61 3.54 15,001 – 20,000 11.70 11 5.00 18.00 3.68 20,001 – 25,000 11.91 10 6.04 20.48 4.48 25,001 – 30,000 16.07 8 10.25 21.00 3.58 30,001 – 35,000 19.40 7 9.64 34.75 9.24 35,001 – 45,000 22.52 10 4.00 36.09 10.67 45,001 and over 32.79 5 26.00 40.74 5.43
TOTAL 8.66 170 0.52 40.74 8.13 (NOTE: The data on this table are from the 2018 Staff and Salary Survey)
Professional / Clinical (“Talk Therapy”) Trainees FTEs
Professional / Clinical Trainee FTEs (“Talk Therapy” only)
School Size
Mean FTE
# of Centers
Mini-mum
Maxi-mum
Standard Deviation
Under 1,501 0.43 8 0 2.27 0.78 1,501 – 2,500 0.38 21 0 1.60 0.47 2,501 – 5,000 1.04 21 0 3.00 1.15 5,001 – 7,500 0.80 17 0 3.12 1.00 7,501 – 10,000 2.53 7 0.13 4.00 1.46 10,001 – 15,000 1.83 14 0 7.00 2.02 15,001 – 20,000 4.55 11 0.93 7.92 2.20 20,001 – 25,000 1.83 8 0 3.45 1.08 25,001 – 30,000 3.22 8 0 7.68 2.82 30,001 – 35,000 6.12 7 1.10 12.00 3.82 35,001 – 45,000 5.20 10 0 11.80 3.34 45,001 and over 6.60 5 3.50 11.00 3.09
TOTAL 2.25 137 0 12.00 2.68 (NOTE: The data on this table are from the 2018 Staff and Salary Survey)
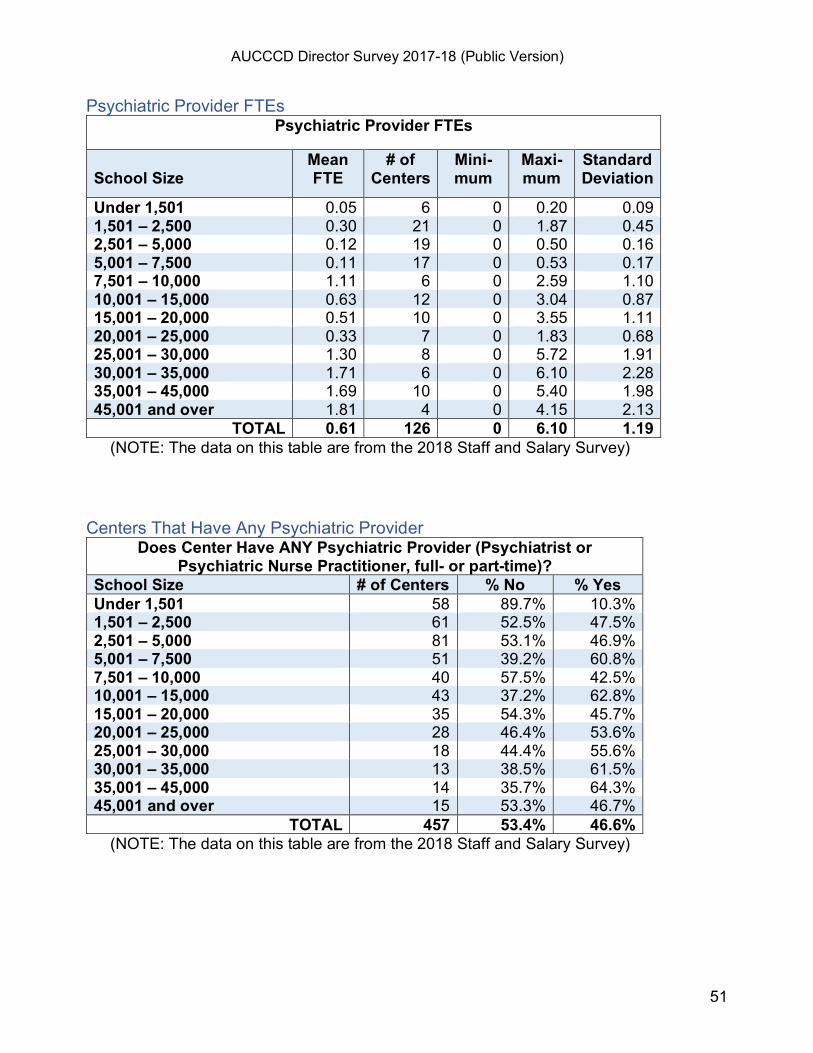
AUCCCD Director Survey 2017-18 (Public Version)
51
Psychiatric Provider FTEs Psychiatric Provider FTEs
School Size
Mean FTE
# of Centers
Mini-mum
Maxi-mum
Standard Deviation
Under 1,501 0.05 6 0 0.20 0.09 1,501 – 2,500 0.30 21 0 1.87 0.45 2,501 – 5,000 0.12 19 0 0.50 0.16 5,001 – 7,500 0.11 17 0 0.53 0.17 7,501 – 10,000 1.11 6 0 2.59 1.10 10,001 – 15,000 0.63 12 0 3.04 0.87 15,001 – 20,000 0.51 10 0 3.55 1.11 20,001 – 25,000 0.33 7 0 1.83 0.68 25,001 – 30,000 1.30 8 0 5.72 1.91 30,001 – 35,000 1.71 6 0 6.10 2.28 35,001 – 45,000 1.69 10 0 5.40 1.98 45,001 and over 1.81 4 0 4.15 2.13
TOTAL 0.61 126 0 6.10 1.19 (NOTE: The data on this table are from the 2018 Staff and Salary Survey)
Centers That Have Any Psychiatric Provider
Does Center Have ANY Psychiatric Provider (Psychiatrist or Psychiatric Nurse Practitioner, full- or part-time)?
School Size # of Centers % No % Yes Under 1,501 58 89.7% 10.3% 1,501 – 2,500 61 52.5% 47.5% 2,501 – 5,000 81 53.1% 46.9% 5,001 – 7,500 51 39.2% 60.8% 7,501 – 10,000 40 57.5% 42.5% 10,001 – 15,000 43 37.2% 62.8% 15,001 – 20,000 35 54.3% 45.7% 20,001 – 25,000 28 46.4% 53.6% 25,001 – 30,000 18 44.4% 55.6% 30,001 – 35,000 13 38.5% 61.5% 35,001 – 45,000 14 35.7% 64.3% 45,001 and over 15 53.3% 46.7%
TOTAL 457 53.4% 46.6% (NOTE: The data on this table are from the 2018 Staff and Salary Survey)
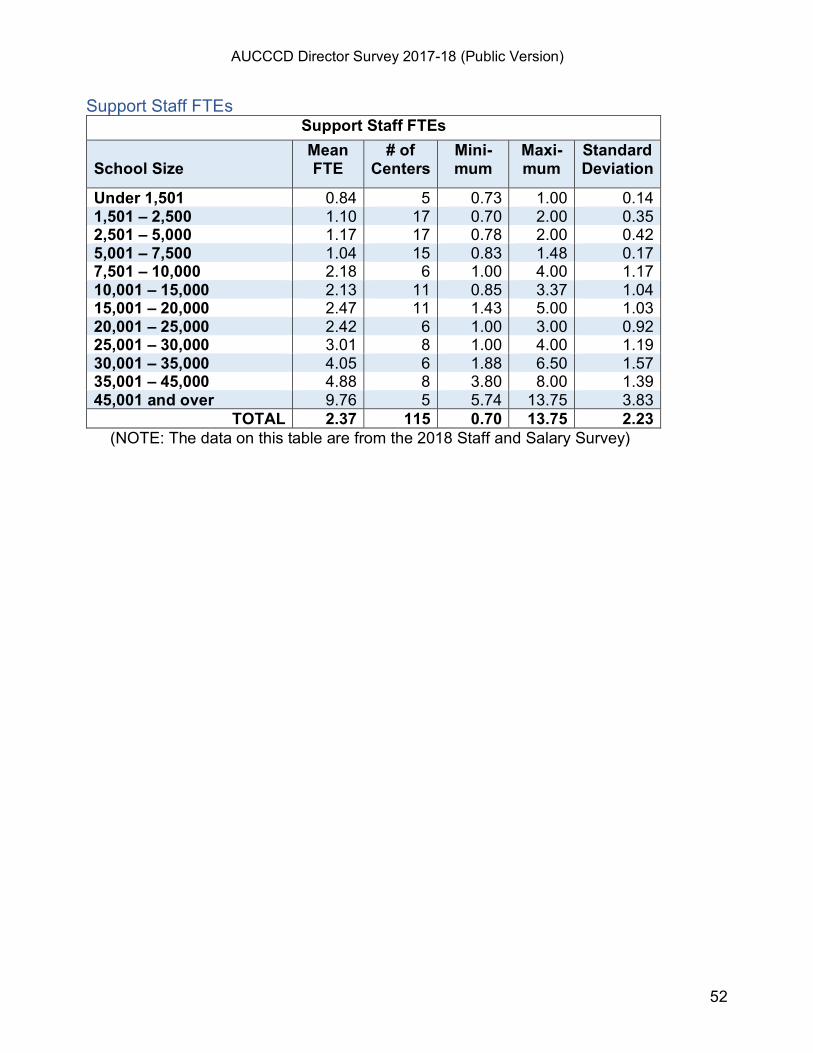
AUCCCD Director Survey 2017-18 (Public Version)
52
Support Staff FTEs Support Staff FTEs
School Size
Mean FTE
# of Centers
Mini-mum
Maxi-mum
Standard Deviation
Under 1,501 0.84 5 0.73 1.00 0.14 1,501 – 2,500 1.10 17 0.70 2.00 0.35 2,501 – 5,000 1.17 17 0.78 2.00 0.42 5,001 – 7,500 1.04 15 0.83 1.48 0.17 7,501 – 10,000 2.18 6 1.00 4.00 1.17 10,001 – 15,000 2.13 11 0.85 3.37 1.04 15,001 – 20,000 2.47 11 1.43 5.00 1.03 20,001 – 25,000 2.42 6 1.00 3.00 0.92 25,001 – 30,000 3.01 8 1.00 4.00 1.19 30,001 – 35,000 4.05 6 1.88 6.50 1.57 35,001 – 45,000 4.88 8 3.80 8.00 1.39 45,001 and over 9.76 5 5.74 13.75 3.83
TOTAL 2.37 115 0.70 13.75 2.23 (NOTE: The data on this table are from the 2018 Staff and Salary Survey)
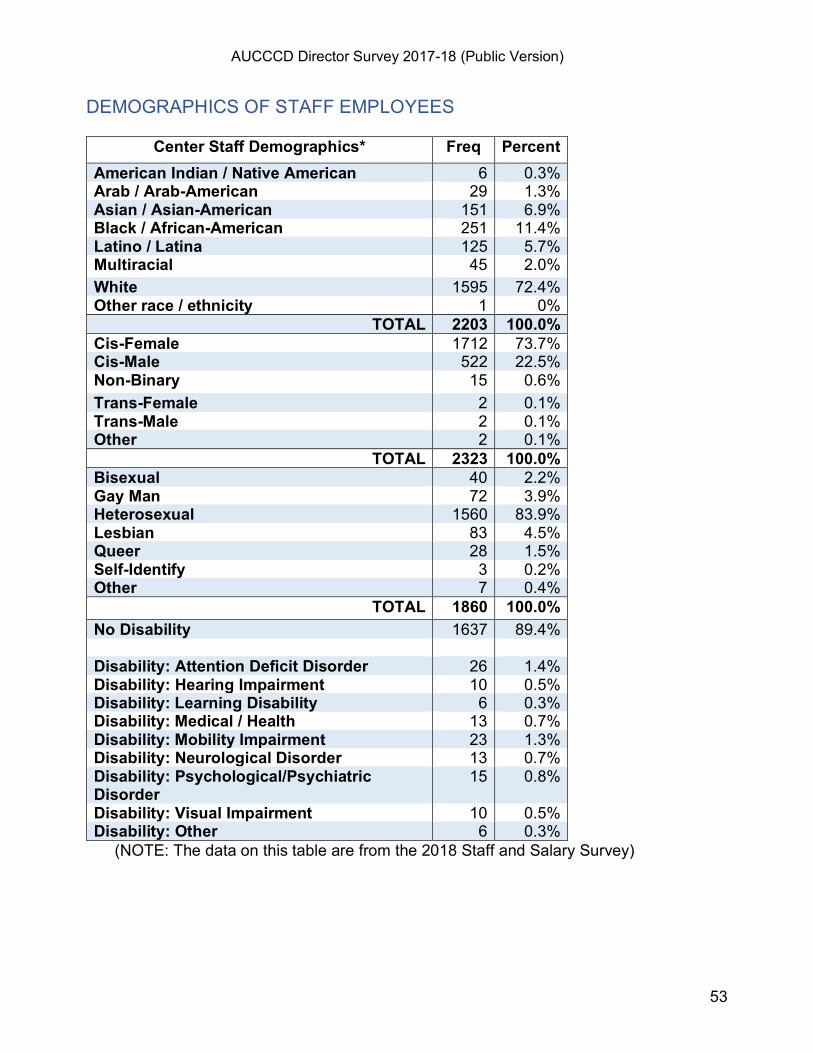
AUCCCD Director Survey 2017-18 (Public Version)
53
DEMOGRAPHICS OF STAFF EMPLOYEES
Center Staff Demographics* Freq Percent American Indian / Native American 6 0.3% Arab / Arab-American 29 1.3% Asian / Asian-American 151 6.9% Black / African-American 251 11.4% Latino / Latina 125 5.7% Multiracial 45 2.0% White 1595 72.4% Other race / ethnicity 1 0%
TOTAL 2203 100.0% Cis-Female 1712 73.7% Cis-Male 522 22.5% Non-Binary 15 0.6% Trans-Female 2 0.1% Trans-Male 2 0.1% Other 2 0.1%
TOTAL 2323 100.0% Bisexual 40 2.2% Gay Man 72 3.9% Heterosexual 1560 83.9% Lesbian 83 4.5% Queer 28 1.5% Self-Identify 3 0.2% Other 7 0.4%
TOTAL 1860 100.0% No Disability 1637 89.4% Disability: Attention Deficit Disorder 26 1.4% Disability: Hearing Impairment 10 0.5% Disability: Learning Disability 6 0.3% Disability: Medical / Health 13 0.7% Disability: Mobility Impairment 23 1.3% Disability: Neurological Disorder 13 0.7% Disability: Psychological/Psychiatric Disorder
15 0.8%
Disability: Visual Impairment 10 0.5% Disability: Other 6 0.3%
(NOTE: The data on this table are from the 2018 Staff and Salary Survey)
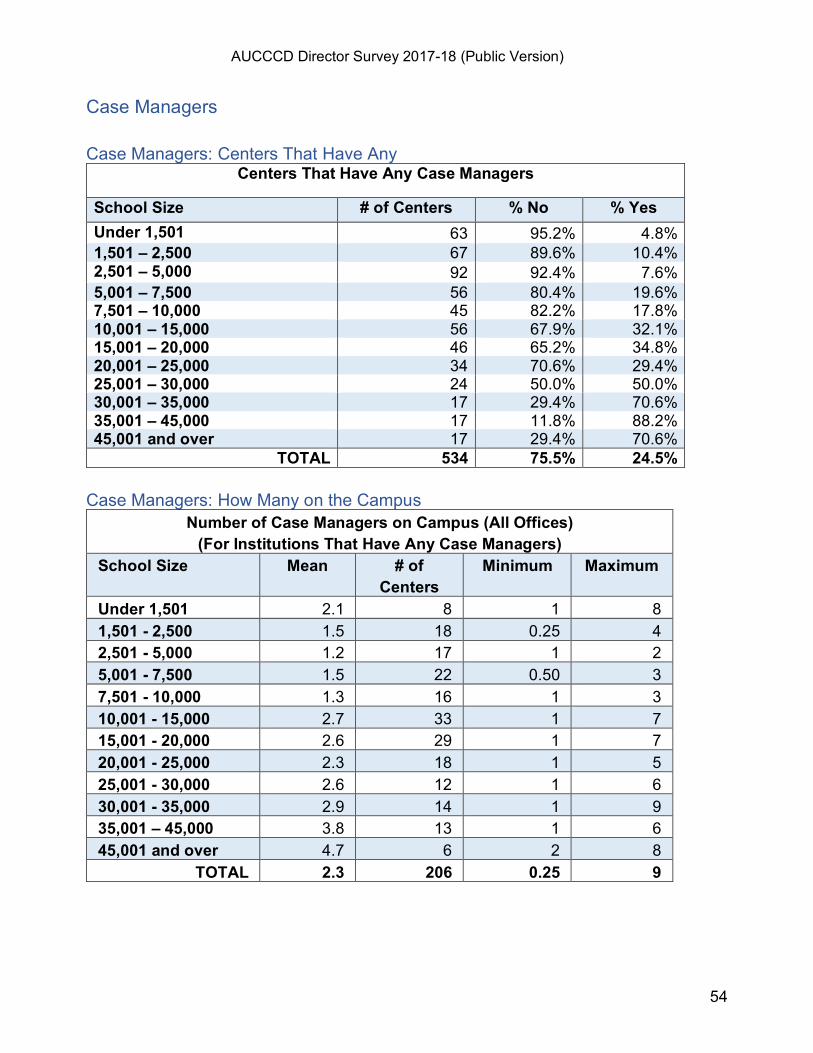
AUCCCD Director Survey 2017-18 (Public Version)
54
Case Managers Case Managers: Centers That Have Any
Centers That Have Any Case Managers
School Size # of Centers % No % Yes Under 1,501 63 95.2% 4.8% 1,501 – 2,500 67 89.6% 10.4% 2,501 – 5,000 92 92.4% 7.6% 5,001 – 7,500 56 80.4% 19.6% 7,501 – 10,000 45 82.2% 17.8% 10,001 – 15,000 56 67.9% 32.1% 15,001 – 20,000 46 65.2% 34.8% 20,001 – 25,000 34 70.6% 29.4% 25,001 – 30,000 24 50.0% 50.0% 30,001 – 35,000 17 29.4% 70.6% 35,001 – 45,000 17 11.8% 88.2% 45,001 and over 17 29.4% 70.6%
TOTAL 534 75.5% 24.5% Case Managers: How Many on the Campus
Number of Case Managers on Campus (All Offices) (For Institutions That Have Any Case Managers)
School Size Mean # of Centers
Minimum Maximum
Under 1,501 2.1 8 1 8 1,501 - 2,500 1.5 18 0.25 4 2,501 - 5,000 1.2 17 1 2 5,001 - 7,500 1.5 22 0.50 3 7,501 - 10,000 1.3 16 1 3 10,001 - 15,000 2.7 33 1 7 15,001 - 20,000 2.6 29 1 7 20,001 - 25,000 2.3 18 1 5 25,001 - 30,000 2.6 12 1 6 30,001 - 35,000 2.9 14 1 9 35,001 – 45,000 3.8 13 1 6 45,001 and over 4.7 6 2 8
TOTAL 2.3 206 0.25 9
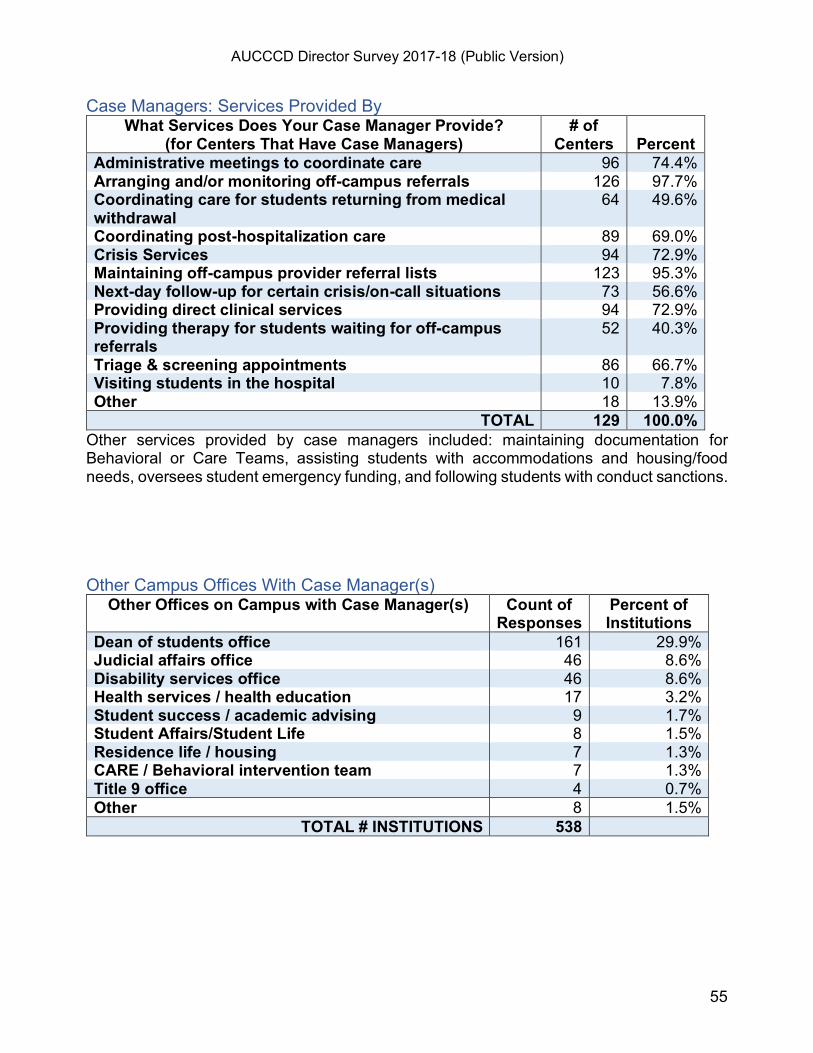
AUCCCD Director Survey 2017-18 (Public Version)
55
Case Managers: Services Provided By What Services Does Your Case Manager Provide?
(for Centers That Have Case Managers) # of
Centers
Percent Administrative meetings to coordinate care 96 74.4% Arranging and/or monitoring off-campus referrals 126 97.7% Coordinating care for students returning from medical withdrawal
64 49.6%
Coordinating post-hospitalization care 89 69.0% Crisis Services 94 72.9% Maintaining off-campus provider referral lists 123 95.3% Next-day follow-up for certain crisis/on-call situations 73 56.6% Providing direct clinical services 94 72.9% Providing therapy for students waiting for off-campus referrals
52 40.3%
Triage & screening appointments 86 66.7% Visiting students in the hospital 10 7.8% Other 18 13.9%
TOTAL 129 100.0% Other services provided by case managers included: maintaining documentation for Behavioral or Care Teams, assisting students with accommodations and housing/food needs, oversees student emergency funding, and following students with conduct sanctions. Other Campus Offices With Case Manager(s)
Other Offices on Campus with Case Manager(s)
Count of Responses
Percent of Institutions
Dean of students office 161 29.9% Judicial affairs office 46 8.6% Disability services office 46 8.6% Health services / health education 17 3.2% Student success / academic advising 9 1.7% Student Affairs/Student Life 8 1.5% Residence life / housing 7 1.3% CARE / Behavioral intervention team 7 1.3% Title 9 office 4 0.7% Other 8 1.5%
TOTAL # INSTITUTIONS 538
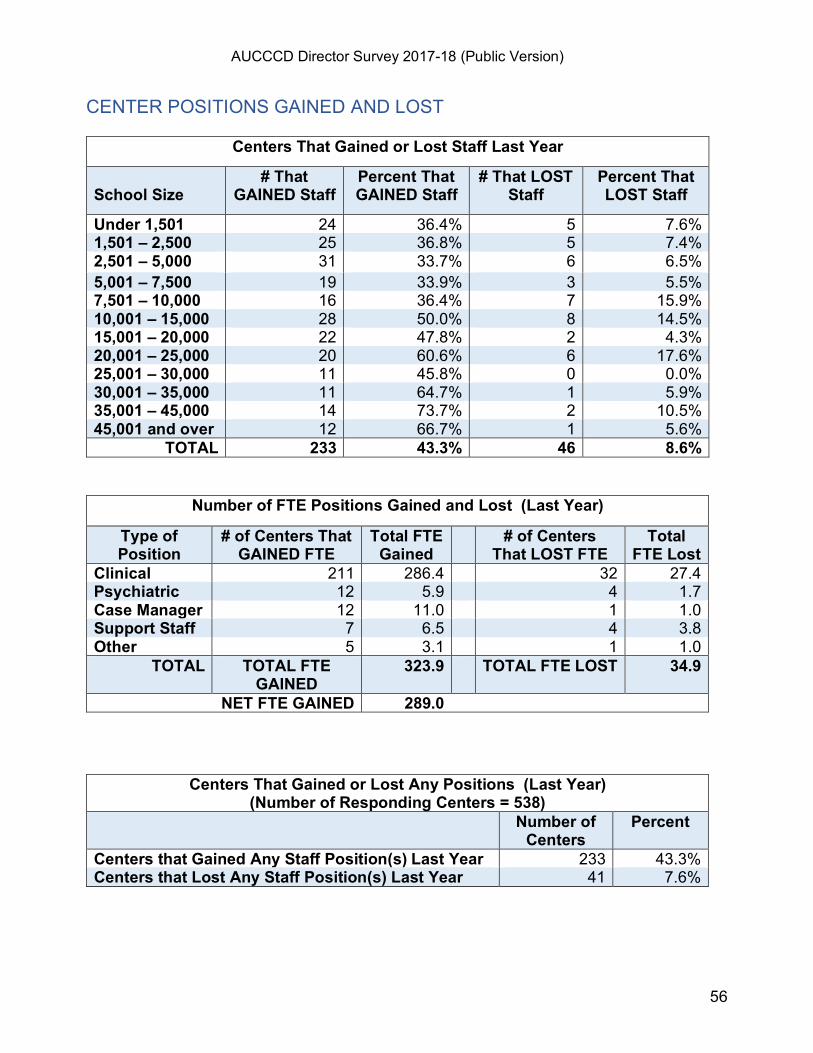
AUCCCD Director Survey 2017-18 (Public Version)
56
CENTER POSITIONS GAINED AND LOST
Centers That Gained or Lost Staff Last Year
School Size
# That GAINED Staff
Percent That GAINED Staff
# That LOST Staff
Percent That LOST Staff
Under 1,501 24 36.4% 5 7.6% 1,501 – 2,500 25 36.8% 5 7.4% 2,501 – 5,000 31 33.7% 6 6.5% 5,001 – 7,500 19 33.9% 3 5.5% 7,501 – 10,000 16 36.4% 7 15.9% 10,001 – 15,000 28 50.0% 8 14.5% 15,001 – 20,000 22 47.8% 2 4.3% 20,001 – 25,000 20 60.6% 6 17.6% 25,001 – 30,000 11 45.8% 0 0.0% 30,001 – 35,000 11 64.7% 1 5.9% 35,001 – 45,000 14 73.7% 2 10.5% 45,001 and over 12 66.7% 1 5.6%
TOTAL 233 43.3% 46 8.6%
Number of FTE Positions Gained and Lost (Last Year)
Type of Position
# of Centers That GAINED FTE
Total FTE Gained
# of Centers That LOST FTE
Total FTE Lost
Clinical 211 286.4 32 27.4 Psychiatric 12 5.9 4 1.7 Case Manager 12 11.0 1 1.0 Support Staff 7 6.5 4 3.8 Other 5 3.1 1 1.0
TOTAL TOTAL FTE GAINED
323.9 TOTAL FTE LOST 34.9
NET FTE GAINED 289.0
Centers That Gained or Lost Any Positions (Last Year) (Number of Responding Centers = 538)
Number of Centers
Percent
Centers that Gained Any Staff Position(s) Last Year 233 43.3% Centers that Lost Any Staff Position(s) Last Year 41 7.6%
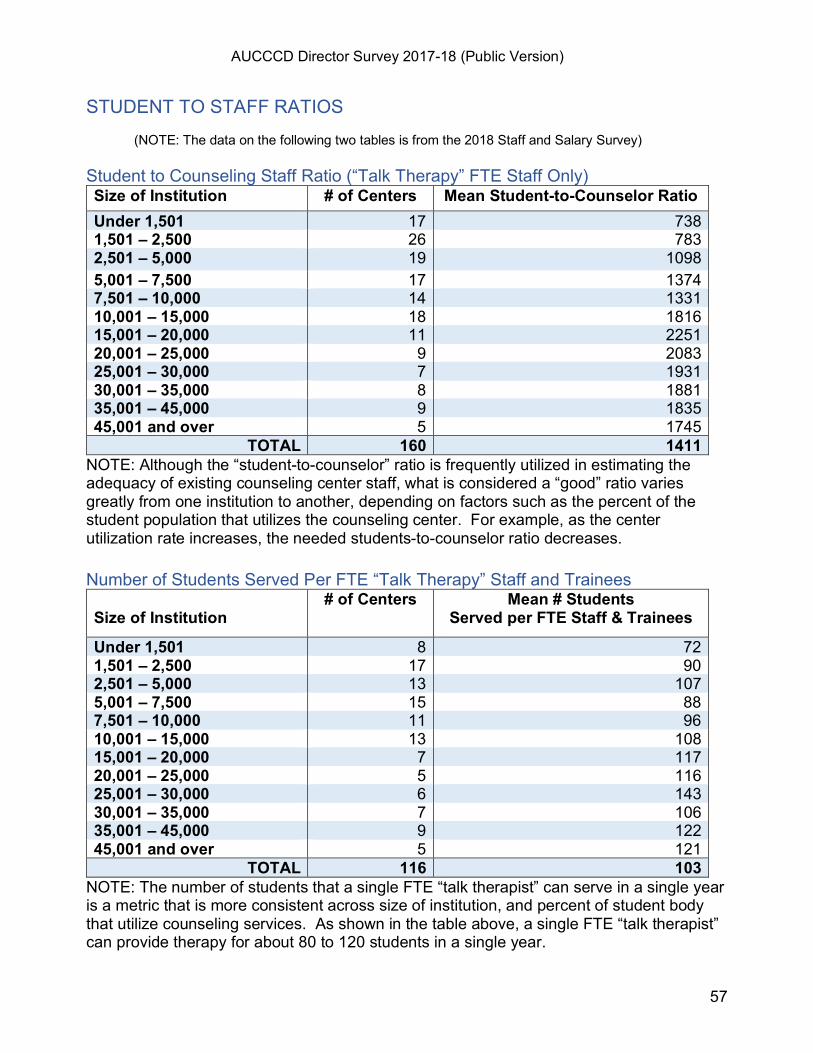
AUCCCD Director Survey 2017-18 (Public Version)
57
STUDENT TO STAFF RATIOS (NOTE: The data on the following two tables is from the 2018 Staff and Salary Survey) Student to Counseling Staff Ratio (“Talk Therapy” FTE Staff Only) Size of Institution # of Centers Mean Student-to-Counselor Ratio Under 1,501 17 738 1,501 – 2,500 26 783 2,501 – 5,000 19 1098 5,001 – 7,500 17 1374 7,501 – 10,000 14 1331 10,001 – 15,000 18 1816 15,001 – 20,000 11 2251 20,001 – 25,000 9 2083 25,001 – 30,000 7 1931 30,001 – 35,000 8 1881 35,001 – 45,000 9 1835 45,001 and over 5 1745
TOTAL 160 1411 NOTE: Although the “student-to-counselor” ratio is frequently utilized in estimating the adequacy of existing counseling center staff, what is considered a “good” ratio varies greatly from one institution to another, depending on factors such as the percent of the student population that utilizes the counseling center. For example, as the center utilization rate increases, the needed students-to-counselor ratio decreases. Number of Students Served Per FTE “Talk Therapy” Staff and Trainees Size of Institution
# of Centers Mean # Students Served per FTE Staff & Trainees
Under 1,501 8 72 1,501 – 2,500 17 90 2,501 – 5,000 13 107 5,001 – 7,500 15 88 7,501 – 10,000 11 96 10,001 – 15,000 13 108 15,001 – 20,000 7 117 20,001 – 25,000 5 116 25,001 – 30,000 6 143 30,001 – 35,000 7 106 35,001 – 45,000 9 122 45,001 and over 5 121
TOTAL 116 103 NOTE: The number of students that a single FTE “talk therapist” can serve in a single year is a metric that is more consistent across size of institution, and percent of student body that utilize counseling services. As shown in the table above, a single FTE “talk therapist” can provide therapy for about 80 to 120 students in a single year.
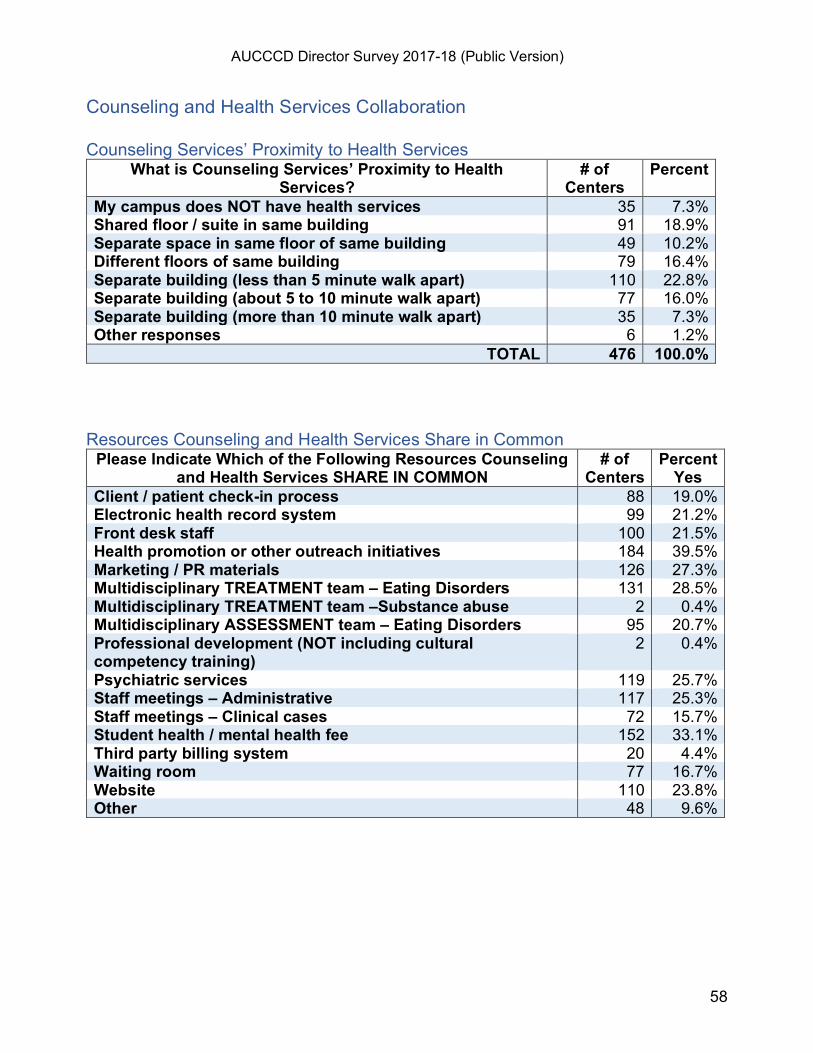
AUCCCD Director Survey 2017-18 (Public Version)
58
Counseling and Health Services Collaboration Counseling Services’ Proximity to Health Services
What is Counseling Services’ Proximity to Health Services?
# of Centers
Percent
My campus does NOT have health services 35 7.3% Shared floor / suite in same building 91 18.9% Separate space in same floor of same building 49 10.2% Different floors of same building 79 16.4% Separate building (less than 5 minute walk apart) 110 22.8% Separate building (about 5 to 10 minute walk apart) 77 16.0% Separate building (more than 10 minute walk apart) 35 7.3% Other responses 6 1.2%
TOTAL 476 100.0% Resources Counseling and Health Services Share in Common
Please Indicate Which of the Following Resources Counseling and Health Services SHARE IN COMMON
# of Centers
Percent Yes
Client / patient check-in process 88 19.0% Electronic health record system 99 21.2% Front desk staff 100 21.5% Health promotion or other outreach initiatives 184 39.5% Marketing / PR materials 126 27.3% Multidisciplinary TREATMENT team – Eating Disorders 131 28.5% Multidisciplinary TREATMENT team –Substance abuse 2 0.4% Multidisciplinary ASSESSMENT team – Eating Disorders 95 20.7% Professional development (NOT including cultural competency training)
2 0.4%
Psychiatric services 119 25.7% Staff meetings – Administrative 117 25.3% Staff meetings – Clinical cases 72 15.7% Student health / mental health fee 152 33.1% Third party billing system 20 4.4% Waiting room 77 16.7% Website 110 23.8% Other 48 9.6%
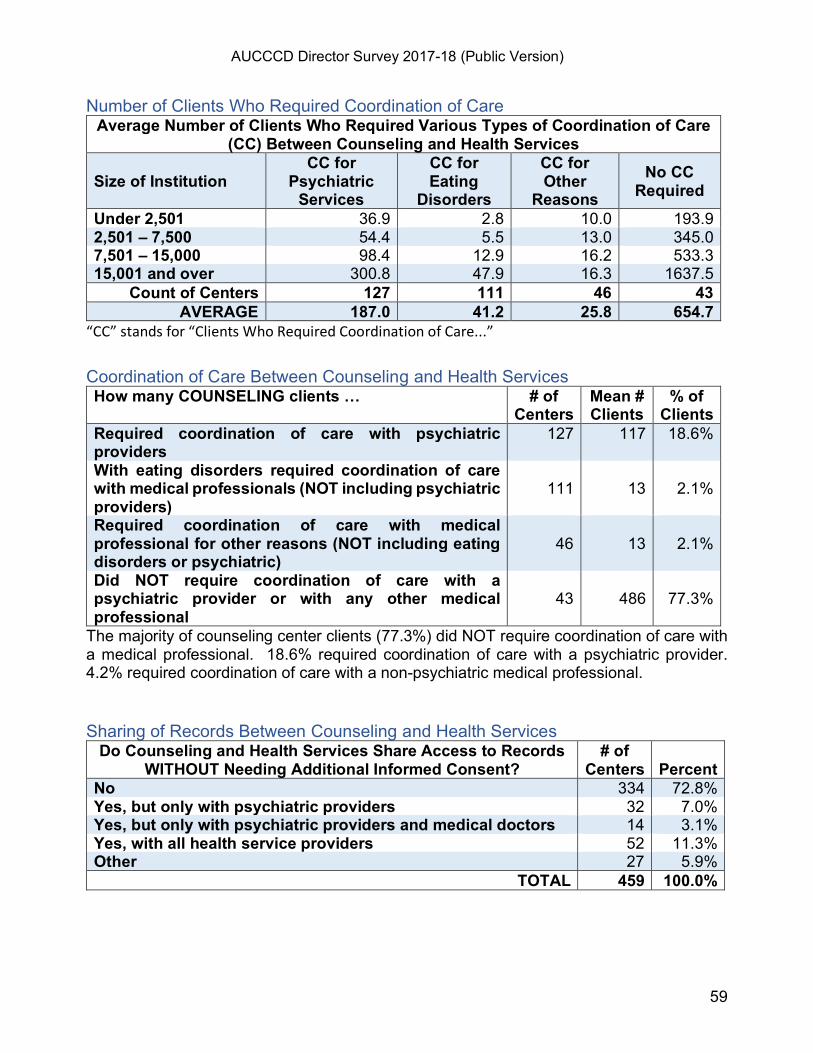
AUCCCD Director Survey 2017-18 (Public Version)
59
Number of Clients Who Required Coordination of Care Average Number of Clients Who Required Various Types of Coordination of Care
(CC) Between Counseling and Health Services Size of Institution
CC for Psychiatric
Services
CC for Eating
Disorders
CC for Other
Reasons No CC
Required Under 2,501 36.9 2.8 10.0 193.9 2,501 – 7,500 54.4 5.5 13.0 345.0 7,501 – 15,000 98.4 12.9 16.2 533.3 15,001 and over 300.8 47.9 16.3 1637.5
Count of Centers 127 111 46 43 AVERAGE 187.0 41.2 25.8 654.7
“CC” stands for “Clients Who Required Coordination of Care...” Coordination of Care Between Counseling and Health Services How many COUNSELING clients … # of
Centers Mean # Clients
% of Clients
Required coordination of care with psychiatric providers
127 117 18.6%
With eating disorders required coordination of care with medical professionals (NOT including psychiatric providers)
111
13
2.1%
Required coordination of care with medical professional for other reasons (NOT including eating disorders or psychiatric)
46
13
2.1%
Did NOT require coordination of care with a psychiatric provider or with any other medical professional
43
486
77.3%
The majority of counseling center clients (77.3%) did NOT require coordination of care with a medical professional. 18.6% required coordination of care with a psychiatric provider. 4.2% required coordination of care with a non-psychiatric medical professional. Sharing of Records Between Counseling and Health Services
Do Counseling and Health Services Share Access to Records WITHOUT Needing Additional Informed Consent?
# of Centers
Percent
No 334 72.8% Yes, but only with psychiatric providers 32 7.0% Yes, but only with psychiatric providers and medical doctors 14 3.1% Yes, with all health service providers 52 11.3% Other 27 5.9%
TOTAL 459 100.0%
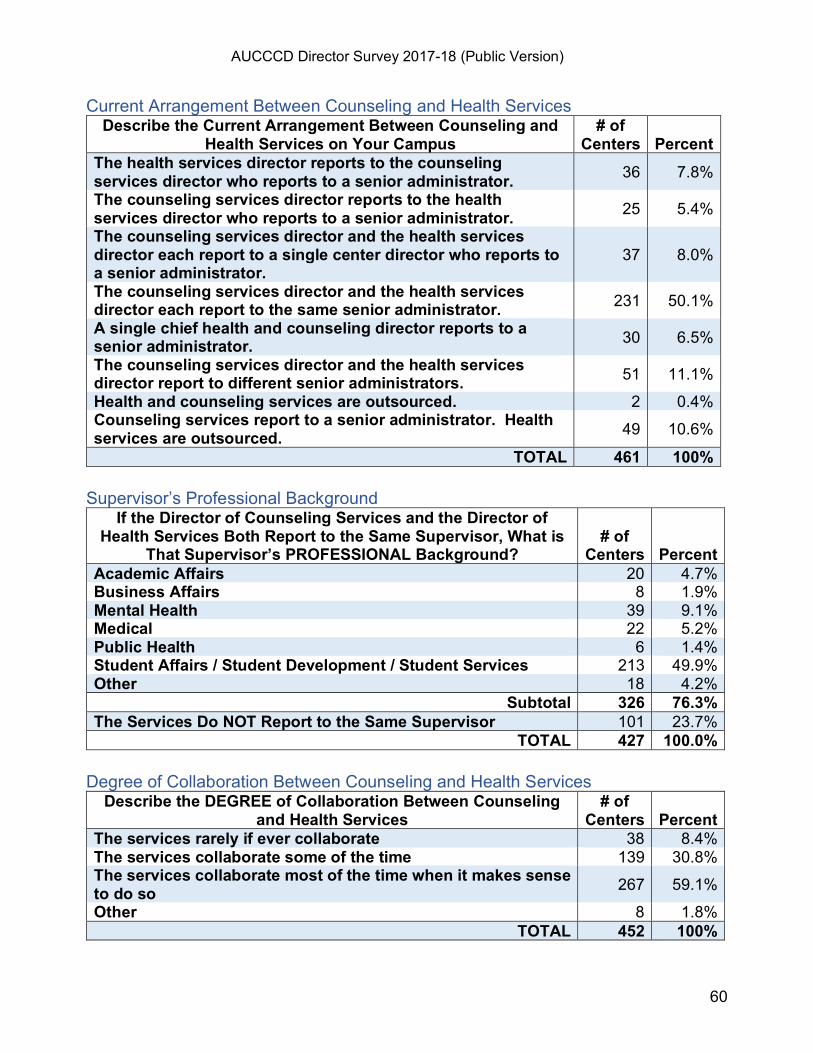
AUCCCD Director Survey 2017-18 (Public Version)
60
Current Arrangement Between Counseling and Health Services Describe the Current Arrangement Between Counseling and
Health Services on Your Campus # of
Centers
Percent The health services director reports to the counseling services director who reports to a senior administrator. 36 7.8%
The counseling services director reports to the health services director who reports to a senior administrator. 25 5.4%
The counseling services director and the health services director each report to a single center director who reports to a senior administrator.
37 8.0%
The counseling services director and the health services director each report to the same senior administrator. 231 50.1%
A single chief health and counseling director reports to a senior administrator. 30 6.5%
The counseling services director and the health services director report to different senior administrators. 51 11.1%
Health and counseling services are outsourced. 2 0.4% Counseling services report to a senior administrator. Health services are outsourced. 49 10.6%
TOTAL 461 100% Supervisor’s Professional Background
If the Director of Counseling Services and the Director of Health Services Both Report to the Same Supervisor, What is
That Supervisor’s PROFESSIONAL Background?
# of
Centers
Percent Academic Affairs 20 4.7% Business Affairs 8 1.9% Mental Health 39 9.1% Medical 22 5.2% Public Health 6 1.4% Student Affairs / Student Development / Student Services 213 49.9% Other 18 4.2%
Subtotal 326 76.3% The Services Do NOT Report to the Same Supervisor 101 23.7%
TOTAL 427 100.0% Degree of Collaboration Between Counseling and Health Services
Describe the DEGREE of Collaboration Between Counseling and Health Services
# of Centers
Percent
The services rarely if ever collaborate 38 8.4% The services collaborate some of the time 139 30.8% The services collaborate most of the time when it makes sense to do so 267 59.1%
Other 8 1.8% TOTAL 452 100%
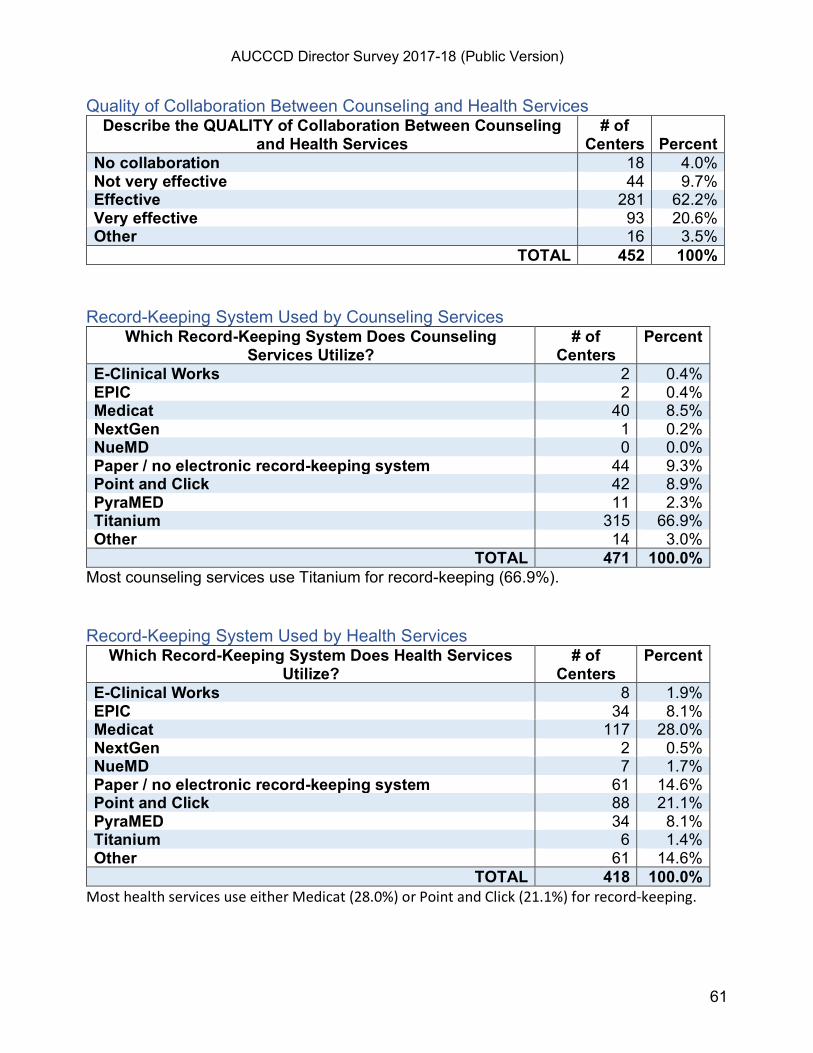
AUCCCD Director Survey 2017-18 (Public Version)
61
Quality of Collaboration Between Counseling and Health Services Describe the QUALITY of Collaboration Between Counseling
and Health Services # of
Centers
Percent No collaboration 18 4.0% Not very effective 44 9.7% Effective 281 62.2% Very effective 93 20.6% Other 16 3.5%
TOTAL 452 100% Record-Keeping System Used by Counseling Services
Which Record-Keeping System Does Counseling Services Utilize?
# of Centers
Percent
E-Clinical Works 2 0.4% EPIC 2 0.4% Medicat 40 8.5% NextGen 1 0.2% NueMD 0 0.0% Paper / no electronic record-keeping system 44 9.3% Point and Click 42 8.9% PyraMED 11 2.3% Titanium 315 66.9% Other 14 3.0%
TOTAL 471 100.0% Most counseling services use Titanium for record-keeping (66.9%). Record-Keeping System Used by Health Services
Which Record-Keeping System Does Health Services Utilize?
# of Centers
Percent
E-Clinical Works 8 1.9% EPIC 34 8.1% Medicat 117 28.0% NextGen 2 0.5% NueMD 7 1.7% Paper / no electronic record-keeping system 61 14.6% Point and Click 88 21.1% PyraMED 34 8.1% Titanium 6 1.4% Other 61 14.6%
TOTAL 418 100.0% Most health services use either Medicat (28.0%) or Point and Click (21.1%) for record-keeping.
AUCCCD Director Survey 2017-18 (Public Version)
62
Participating Colleges and Universities
Institutions That Participated in the 2018 AUCCCD Director Survey
Adelphi University Agnes Scott College Albany College of Pharmacy and Health Sciences Allegheny College American International College American University Amherst College Andrews University Angelo State University Appalachian State University Arcadia University Argosy University-Chicago Arizona State University Ashland University Atlanta Metropolitan State College Auburn University Augusta University Babson College Baldwin Wallace University Ball State University Bard College Barnard College Barry University Baruch College Bates College Bay Path University Baylor University Bentley University Berkeley City College Berry College Binghamton University Birmingham-Southern College Bloomfield College Boise State University Boston College Bow Valley College (CAN) Bowdoin College Bowling Green State University Bradley University Bridgewater College Brigham Young University Brigham Young University-Idaho Brock University (CAN) Brown University Butler University Cabrini University Caldwell University California Institute of Technology California State Polytechnic University-Pomona California State Polytechnic University-San Luis Obispo California State University-Fresno California State University-Fullerton California State University-Long Beach
California State University-Maritime Academy California State University-Monterey Bay California State University-Northridge California State University-San Bernardino California State University-San Marcos California State University-Stanislaus Calvin College Campbell University Canisius College Carleton College Carnegie Mellon University Carthage College Case Western Reserve University Catholic University of America Centenary University Central College Central Michigan University Central Washington University Centre College Chicago State University Christopher Newport University Clark University Clarkson University Clayton State University Clemson University Coastal Carolina University Colgate University College of Charleston College of New Jersey College of Saint Benedict/Saint John's University College of Saint Elizabeth College of the Holy Cross College of the Ozark Colorado Christian University Colorado Sate University Colorado School of Mines Columbia College-Missouri Columbia University in the City of New York Columbia University Irving Medical Center Columbus College of Art & Design Columbus State University Concordia College Concordia University (CAN) Concordia University-Chicago Concordia University-Portland Connecticut College Converse College Cornell College
Cornell University Cornish College of the Arts Culver Stockton College CUNY-Brooklyn College CUNY-College of Staten Island CUNY-Queens College CUNY-York College Curry College Curtin University (AUS) Daemen College Dalhousie University (CAN) Dalton State College Dartmouth College Davidson College Defiance College Delaware State University Delaware Valley University DePaul University Des Moines University Dickinson College Dixie State University Drew University Drexel University Duke University Dutchess Community College East Carolina University East Central University East Stroudsburg University of Pennsylvania Eastern Connecticut State University Eastern Michigan University Eastern Washington University Edgewood College Elizabethtown College Elmhurst College Elon University Embry-Riddle Aeronautical University Emerson College Emmanuel College Emory and Henry College Emory University-Atlanta Endicott College Fairmont State University Felician University Ferrum College Flagler College Florida Agricultural and Mechanical University Florida Gulf Coast University Florida Polytechnic University Florida State University Florida State University-Panama City Foothill College Fordham University Fort Lewis College
AUCCCD Director Survey 2017-18 (Public Version)
63
Framingham State University George Mason University George Washington University Georgetown in Qatar Georgetown University Georgia Institute of Technology Georgia Southern University Georgia Southern University-Armstrong Campus Georgian Court University Gettysburg College Gordon State College Goucher College Governors State University Green Mountain College Gustavus Adolphus College Hamilton College Hamline University Hampden-Sydney College Harrisburg University of Science and Technology Harvard University Haverford College Hollins University Hope College Houghton College Howard Community College Husson University Idaho State University Illinois State University Illinois Wesleyan University Indiana State University Indiana University-Bloomington Indiana University-Kokomo Indiana University-Northwest Indiana University-Purdue University Indianapolis Iona College Iowa State University James Madison University Jarvis Christian College Jefferson Community College John Carroll University Johnson & Wales University-Providence Campus Johnson & Wales University-North Miami Kansas City Kansas Community College Kansas State University Kennesaw State University Kent State University Kenyon College Kettering University Knox College Konan University (Japan) La Salle University Lafayette College Lake Forest College Lake Superior State University Lasell College LDS Business College
LeMoyne College Lenoir-Rhyne University Lewis University Lewis-Clark State College LIM College Longwood University Loyola Marymount University Loyola University-Chicago Loyola University-Maryland Luther College Maine College of Art Manhattanville College Marian University Marquette University Marshall University Mary Baldwin University Maryland Institute College of Art Marymount California University Marymount Manhattan College Marymount University Marywood University Massachusetts Institute of Technology Massachusetts Maritime Academy McMaster University (CAN) Medaille College Medical University of South Carolina Mercer University-Atlanta Mercer University-Macon Merrimack College Metropolitan State University of Denver Miami University-Ohio Michigan State University Michigan Technological University Millersville University of Pennsylvania Minneapolis College of Art and Design MiraCosta College Misericordia University Mississippi State University Missouri Southern State University Missouri State University Missouri University of Science and Technology Mohawk College (CAN) Molloy College Monmouth College Monmouth University Montana State University-Bozeman Montclair State University Moody Bible Institute Morgan State University Mount Carmel College of Nursing Mount Holyoke College Mount Royal University (CAN) Mount St. Joseph University MSU Texas (formerly Midwestern State University) Murray State University Naropa University
Nebraska Wesleyan University New College of Florida New Jersey City University New Mexico Institute of Mining and Technology New York Chiropractic College New York Film Academy Niagara University Nicholls State University Norfolk State University North Carolina Agricultural and Technical State University North Carolina Central University North Carolina State University North Dakota State University Northeast Community College Northeast Ohio Medical University Northeastern Illinois University Northern Alberta Institute of Technology (CAN) Northern Arizona University Northern Illinois University Northern Michigan University Northwest Missouri State University Northwestern University Notre Dame de Namur University Notre Dame of Maryland University Oakland University Oberlin College Oglethorpe University Ohio State University Ohio University Old Dominion University Oregon Institute of Technology Oregon State University Otis College of Art and Design Otterbein University Owens State Community College Oxford College of Emory University Pace University-NYC Pace University-Westchester Parker University Pasadena City College Penn State College of Medicine Penn State University Penn State-Harrisburg Pennsylvania College of Technology Pepperdine University Philadelphia College of Osteopathic Medicine-Philadelphia Point Park University Portland State University PrattMWP Princeton University Purdue University Queens’s University (CAN) Ramapo College of New Jersey Randolph College Randolph-Macon College Red River College (CAN) Regis University Rhodes College
AUCCCD Director Survey 2017-18 (Public Version)
64
Richland College Rikkyo University (Japan) Ringling College of Art and Design Roanoke College Robert Morris University-Pittsburgh Roberts Wesleyan College Rochester Institute of Technology Roger Williams University Ross University School of Veterinary Medicine (St.Kitts) Rush University Rutgers University-Camden Rutgers University-New Brunswick Rutgers University-Newark Sacred Heart University Saint Francis University, Pennsylvania Saint Joseph's University Saint Mary's University (CAN) Saint Mary's University of Minnesota Saint Xavier University Salem College Salisbury University Samford University San Diego State University San Jose State University Santa Monica College Santa Rosa Junior College Sapporo Gakuin University (Japan) School of the Art Institute of Chicago Scripps Research Institute Seton Hall University Sewanee: The University of the South Shenandoah University Sheridan College (CAN) Siena College Simmons University Skidmore College Snow College Sonoma State University Southeast Missouri State University Southern Illinois University-Edwardsville Southern Methodist University Southern University and A&M College Southern Utah University Southern Virginia University Southwestern University Spalding University Springfield College St George's University (Grenada) St. Ambrose University St. Cloud State University St. John's University St. Joseph's College-Long Island Campus St. Mary's College of Maryland St. Norbert College St. Olaf College
State Center Community College District Stetson University Stevens Institute of Technology Stevenson University Stonehill College Stony Brook University Suffolk County Community College Suffolk University-Boston SUNY-College at Old Westbury SUNY-Cortland SUNY-Fredonia SUNY-New Paltz SUNY-Oneonta SUNY-Oswego SUNY-Potsdam SUNY-College at Brockport Susquehanna University Swarthmore College Syracuse University Texas A&M International University Texas A&M University Texas A&M University-Commerce Texas A&M University-Kingsville Texas Christian University Texas Lutheran University Texas Southern University Texas State University Texas Woman's University Thomas College Thomas Jefferson University Touro University Nevada Transylvania University Trent University (CAN) Trinity University Truman State University Tufts University Tulane University UCLA Union College Universities at Shady Grove University at Buffalo University of Akron University of Alabama-Birmingham University of Alabama-Tuscaloosa University of Arkansas University of California-Berkeley University of California-Davis University of California-Irvine University of California-Santa Barbara University of California-Santa Cruz University of Central Arkansas University of Central Florida University of Central Missouri University of Central Oklahoma University of Cincinnati University of Colorado-Boulder University of Colorado-Colorado Springs University of Colorado-Denver University of Delaware
University of Denver University of Findlay University of Florida University of Georgia University of Houston-Clear Lake University of Houston-Main University of Idaho University of Illinois-Chicago University of Illinois-Urbana-Champaign University of Indianapolis University of Iowa University of Kansas Medical Center University of Kentucky University of La Verne University of Louisville University of Lynchburg University of Maine University of Maine-Augusta University of Manitoba (CAN) University of Mary Washington University of Maryland-Baltimore University of Maryland-Baltimore County University of Maryland-College Park University of Maryland-Eastern Shore University of Massachusetts-Amherst University of Massachusetts-Boston University of Massachusetts-Dartmouth University of Massachusetts-Lowell University of Melbourne (AUS) University of Memphis University of Miami University of Michigan-Ann Arbor University of Michigan-Flint University of Minnesota University of Minnesota-Duluth University of Missouri-Kansas City University of Missouri-St. Louis University of Montana University of Nebraska-Omaha University of New Hampshire University of New Mexico University of New Orleans University of North Alabama University of North Carolina-Asheville University of North Carolina-Chapel Hill University of North Carolina-Charlotte University of North Carolina-Pembroke University of North Carolina-School of the Arts University of North Carolina-Wilmington University of North Florida University of North Texas
AUCCCD Director Survey 2017-18 (Public Version)
65
University of Northern Colorado University of Notre Dame University of Oregon University of Puerto Rico-Rio Piedras University of Redlands University of Rhode Island University of Richmond University of Rochester University of San Francisco University of Saskatchewan (CAN) University of South Alabama University of South Carolina-Upstate University of South Florida-Sarasota Manatee University of South Florida-St Petersburg University of South Florida-Tampa University of Tennessee-Knoxville University of Texas-Austin University of Texas-Dallas University of Texas-El Paso University of Texas-San Antonio University of Texas-Tyler University of the Sciences in Philadelphia University of Tokyo (Japan) University of Tulsa University of Utah University of Utah School of Medicine University of Vermont
University of Victoria (CAN) University of Virginia University of Washington-Seattle University of West Florida University of West Georgia University of Windsor (CAN) University of Wisconsin-Eau Claire University of Wisconsin-La Crosse University of Wisconsin-Madison University of Wisconsin-Milwaukee University of Wisconsin-River Falls University of Wisconsin-Stout University of Wisconsin-Whitewater Upper Iowa University Utah State University Utica College Valdosta State University Valparaiso University Vanderbilt University Vassar College Villanova University Vincennes University Virginia Commonwealth University Virginia Military Institute Virginia State University Virginia Wesleyan University Wake Forest School of Medicine Wake Forest University Walsh University Washburn University Washington & Jefferson College
Washington State University-Vancouver Washington University in Saint Louis Waukesha County Technical College Weber State University Wellesley College Wesleyan University West Chester University of Pennsylvania West Virginia University West Virginia University Institute of Technology Western Carolina University Western Connecticut State University Western Illinois University Western Washington University Western Wyoming Community College Westfield State University Westmont College Wheaton College, MA Whitman College Wichita State University Widener University William Jewell College Wittenberg University Worcester Polytechnic Institute Youngstown State University
AUCCCD Director Survey 2017-18 (Public Version)
66