Embed Size (px)
Citation preview
The Atmospheric Transport and Depositionof Mercury to the Great Lakes
Dr. Mark CohenNOAA Air Resources Laboratory
Silver Spring, Maryland
Collection of Graphics forIJC Air Quality Advisory Board
April 16, 2004
Methodology• Modeling methodology outlined in Cohen et al., 2004;
• The same 1996 meteorology was used in this new analysis, with updated emissions inventory data
• Only inventoried anthropogenic sources in the U.S. and Canada are considered
• U.S. point and area source emissions from EPA 1999 National Emissions Inventory
• Top contributing sources checked and updated using Great Lakes Regional Toxics Inventory and other sources
• Mobile source emissions estimates from 1996 NEI (no 1999 data available)
• Canadian point and area source emissions from 1995 Environment Canada inventory
• Top contributing sources updated using 2000 NPRI
MercuryEmissionsInventory
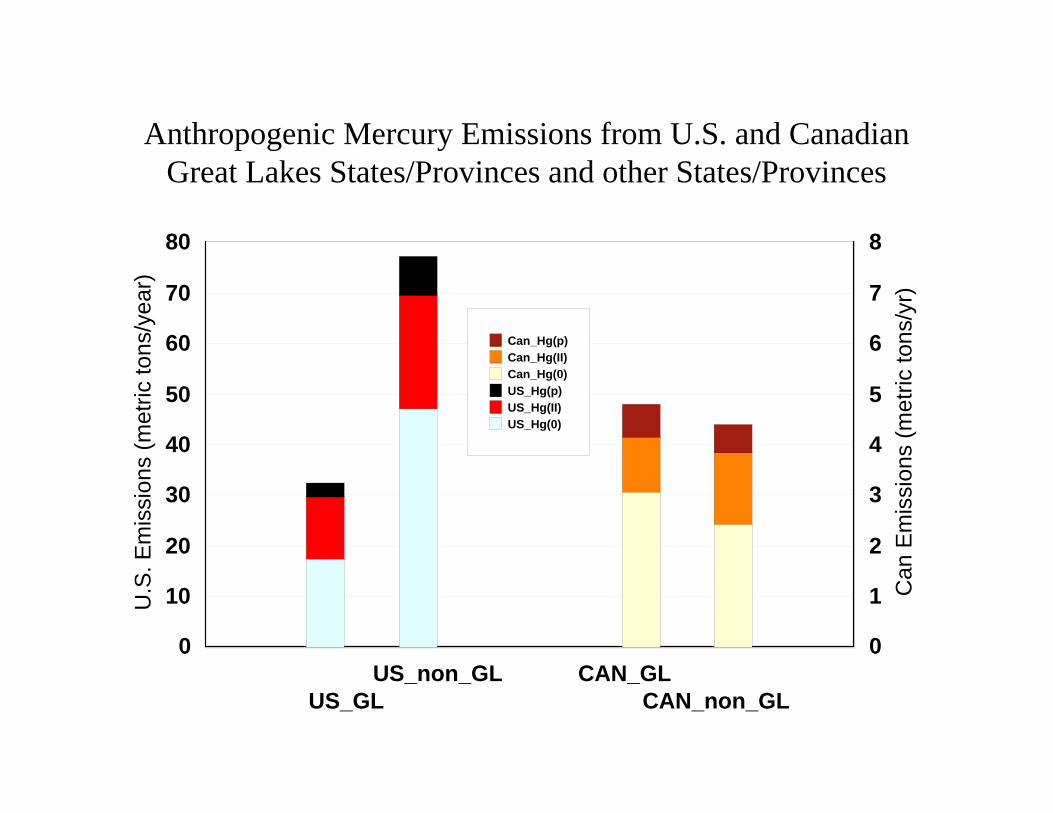
Anthropogenic Mercury Emissions from U.S. and Canadian Great Lakes States/Provinces and other States/Provinces
US_GLUS_non_GL CAN_GL
CAN_non_GL
0
10
20
30
40
50
60
70
80
U.S
. Em
issi
ons
(met
ric to
ns/y
ear)
0
1
2
3
4
5
6
7
8
Can
Em
issi
ons
(met
ric to
ns/y
r)
Can_Hg(p)Can_Hg(II)Can_Hg(0)US_Hg(p)US_Hg(II)US_Hg(0)
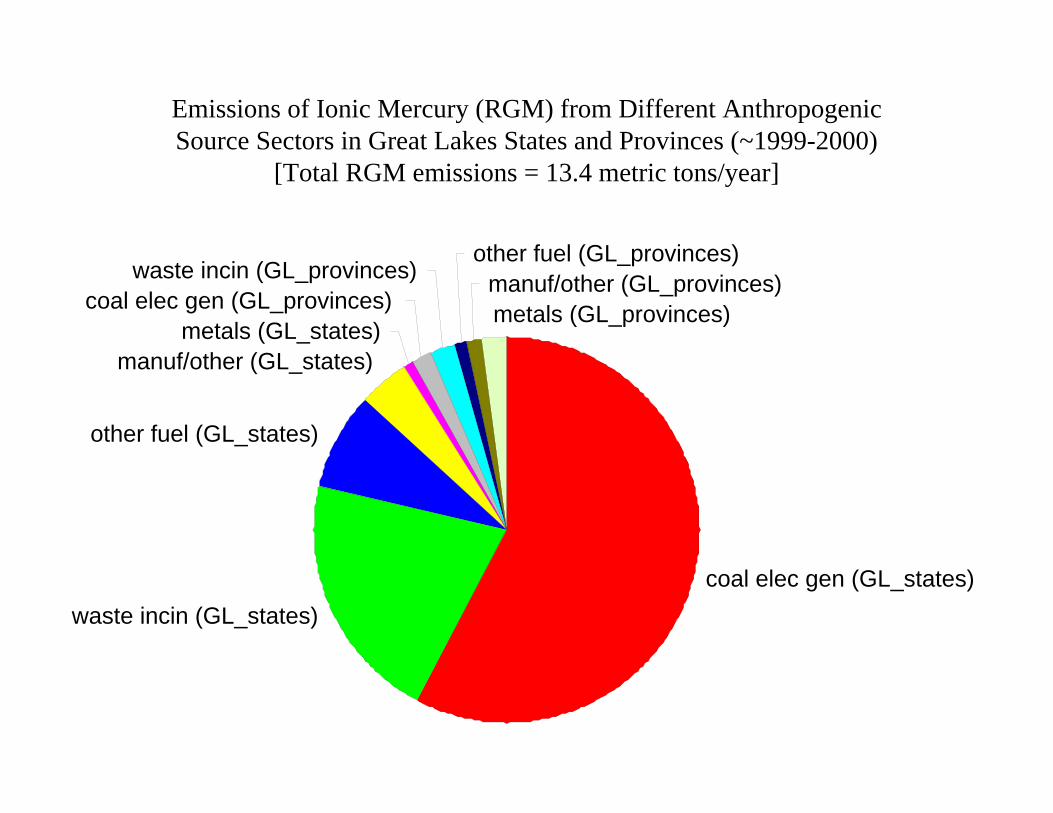
coal elec gen (GL_states)waste incin (GL_states)
other fuel (GL_states)
manuf/other (GL_states)metals (GL_states)
coal elec gen (GL_provinces)waste incin (GL_provinces)
other fuel (GL_provinces)manuf/other (GL_provinces)metals (GL_provinces)
Emissions of Ionic Mercury (RGM) from Different AnthropogenicSource Sectors in Great Lakes States and Provinces (~1999-2000)
[Total RGM emissions = 13.4 metric tons/year]
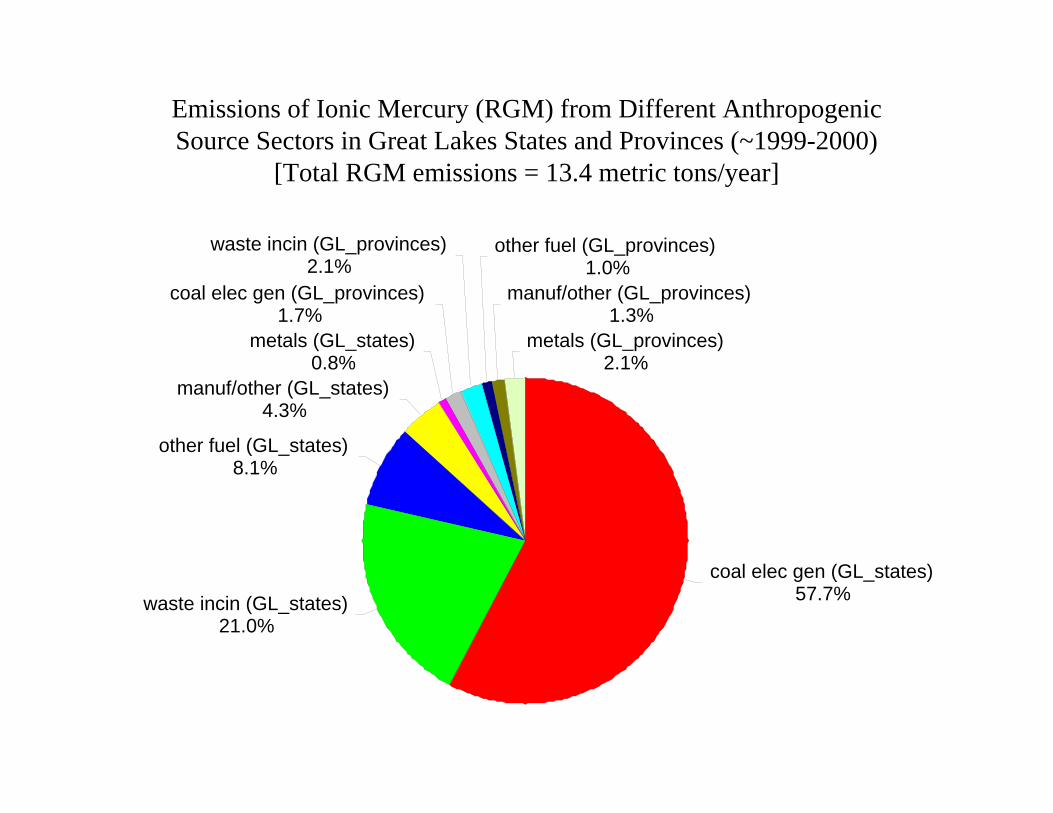
coal elec gen (GL_states)57.7%waste incin (GL_states)
21.0%
other fuel (GL_states)8.1%
manuf/other (GL_states)4.3%
metals (GL_states)0.8%
coal elec gen (GL_provinces)1.7%
waste incin (GL_provinces)2.1%
other fuel (GL_provinces)1.0%
manuf/other (GL_provinces)1.3%
metals (GL_provinces)2.1%
Emissions of Ionic Mercury (RGM) from Different AnthropogenicSource Sectors in Great Lakes States and Provinces (~1999-2000)
[Total RGM emissions = 13.4 metric tons/year]
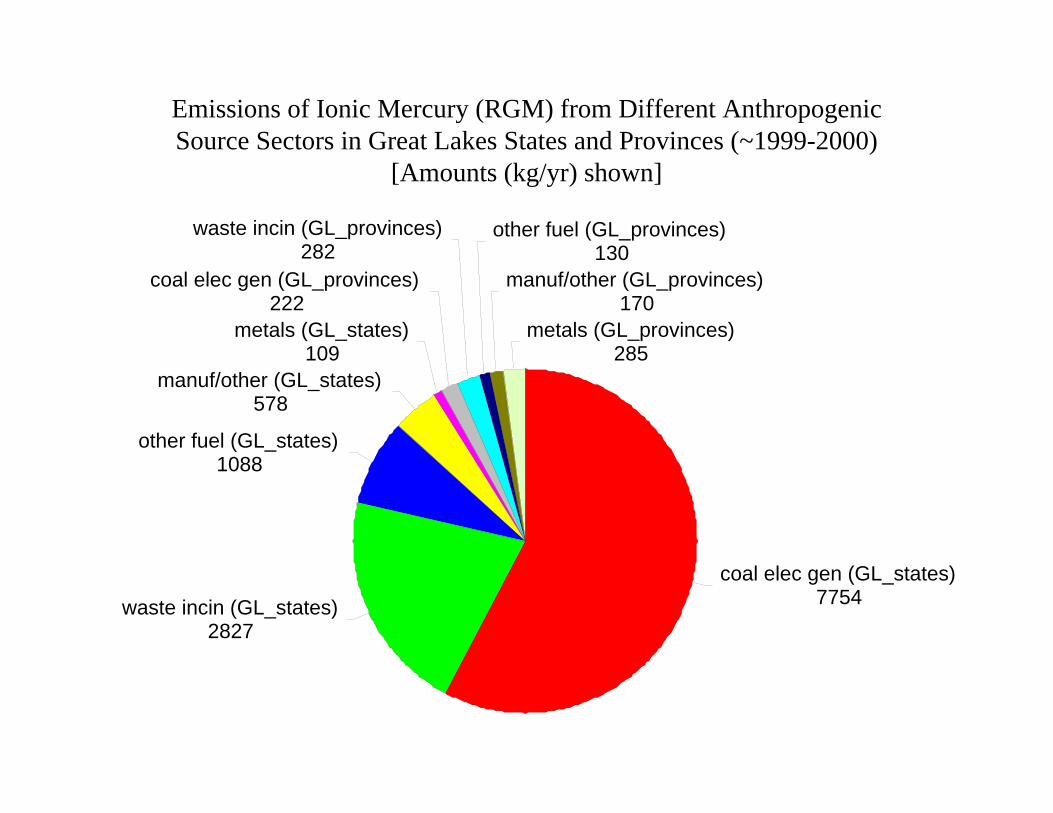
coal elec gen (GL_states)7754waste incin (GL_states)
2827
other fuel (GL_states)1088
manuf/other (GL_states)578
metals (GL_states)109
coal elec gen (GL_provinces)222
waste incin (GL_provinces)282
other fuel (GL_provinces)130
manuf/other (GL_provinces)170
metals (GL_provinces)285
Emissions of Ionic Mercury (RGM) from Different AnthropogenicSource Sectors in Great Lakes States and Provinces (~1999-2000)
[Amounts (kg/yr) shown]
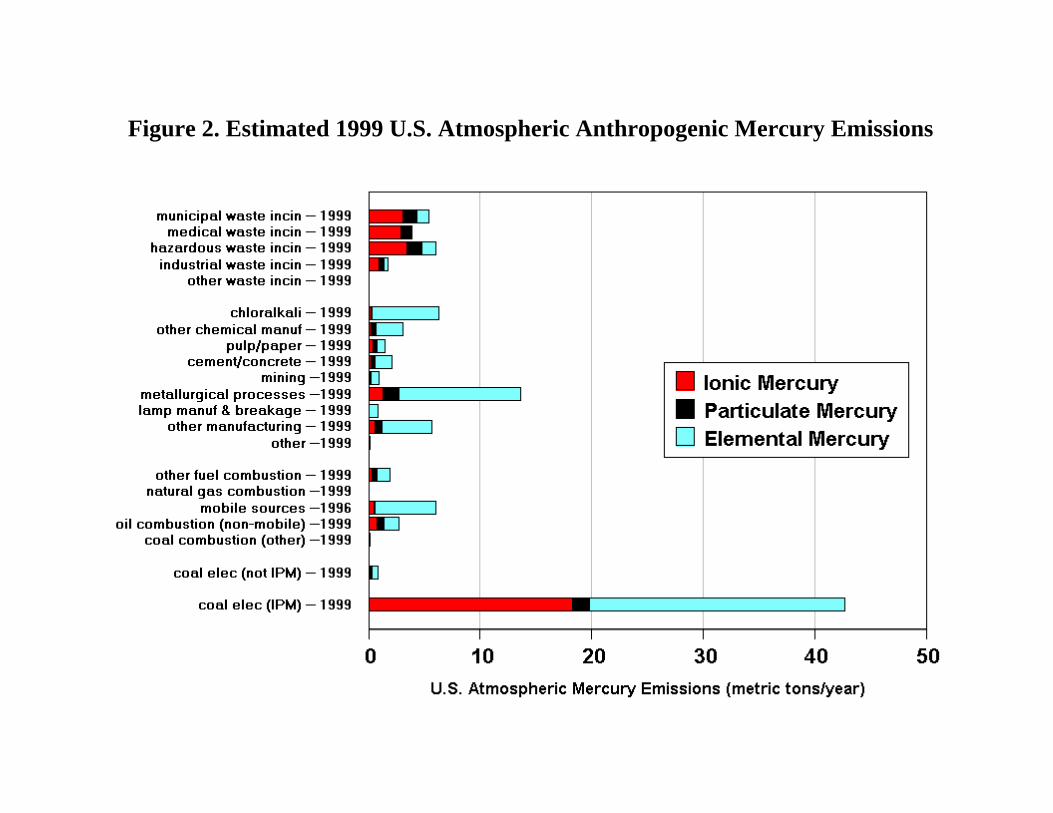
Figure 2. Estimated 1999 U.S. Atmospheric Anthropogenic Mercury Emissions
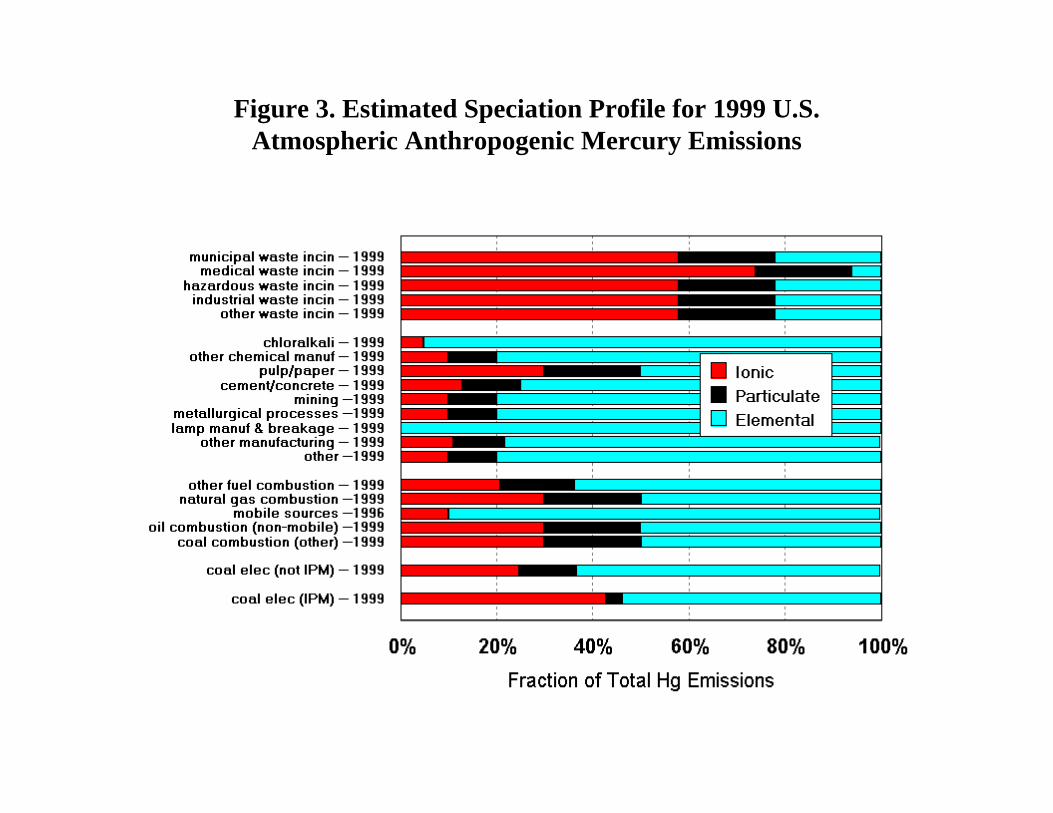
Figure 3. Estimated Speciation Profile for 1999 U.S.Atmospheric Anthropogenic Mercury Emissions
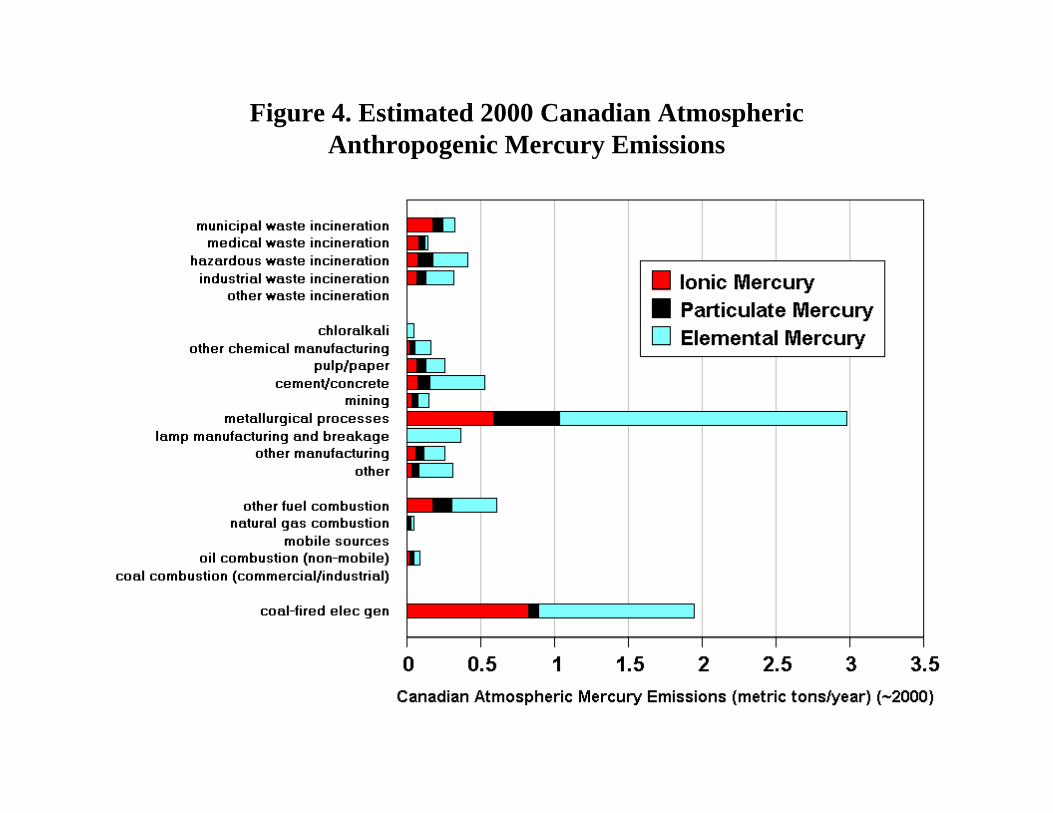
Figure 4. Estimated 2000 Canadian AtmosphericAnthropogenic Mercury Emissions
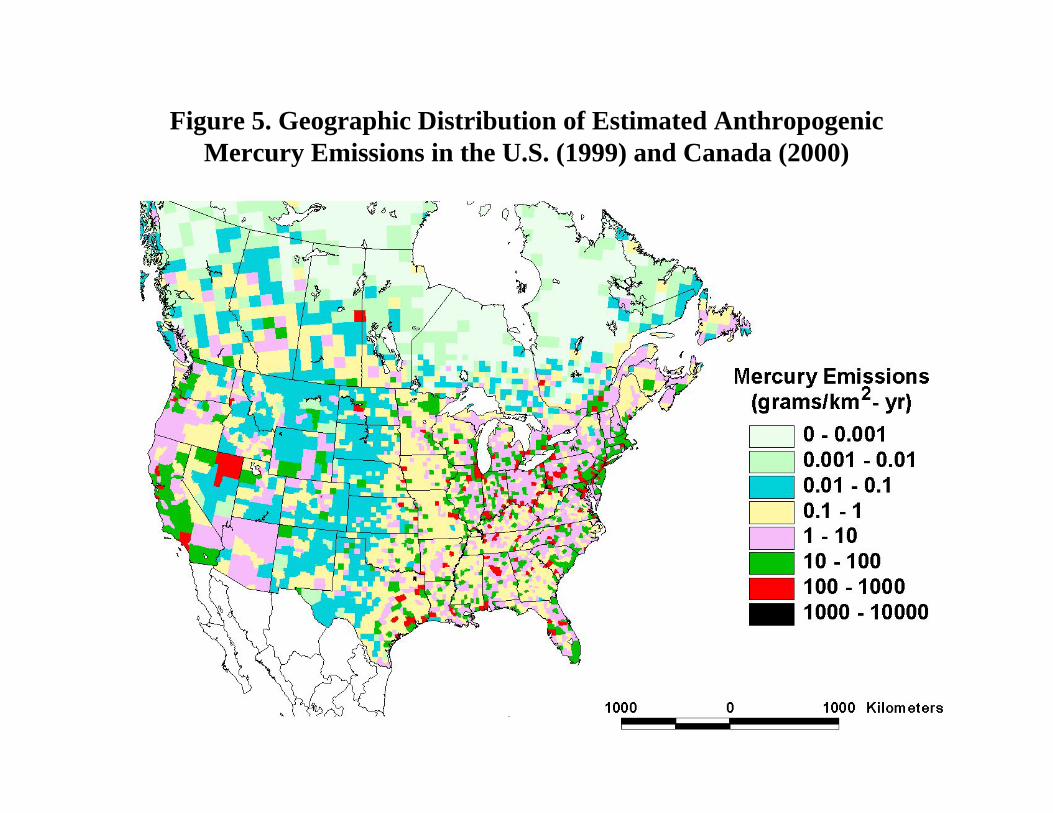
Figure 5. Geographic Distribution of Estimated Anthropogenic Mercury Emissions in the U.S. (1999) and Canada (2000)
OverallSummary of
ResultsObtainedto Date
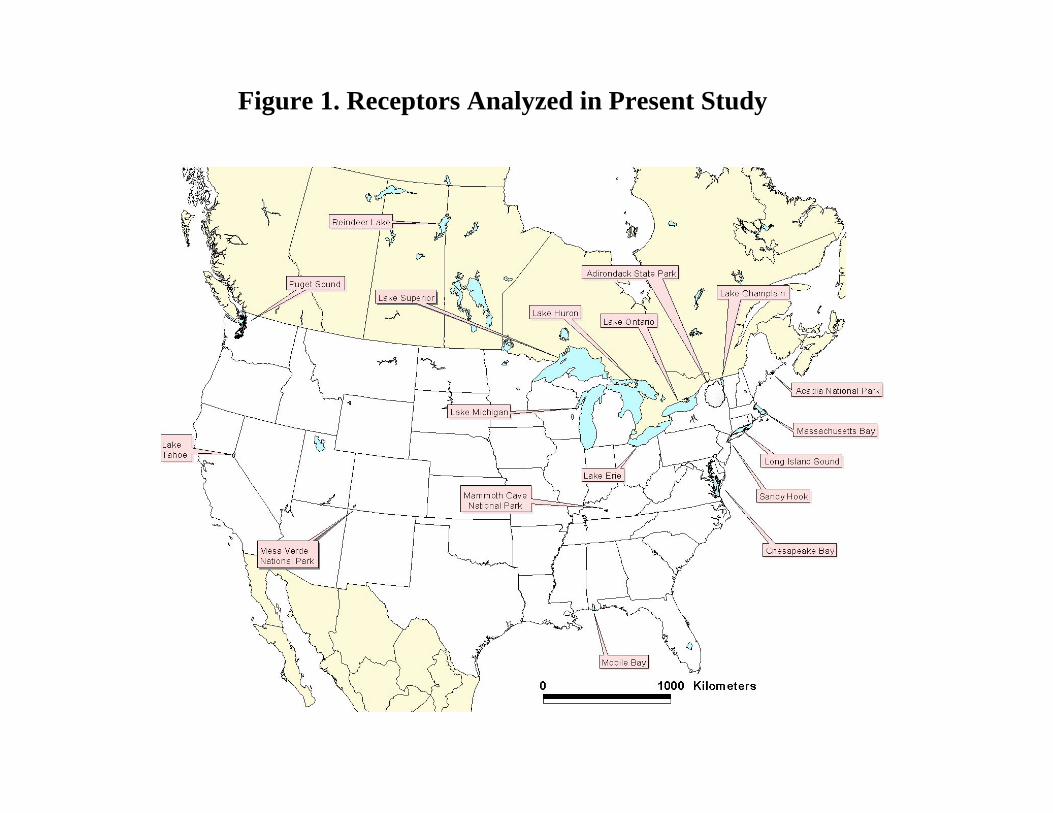
Figure 1. Receptors Analyzed in Present Study
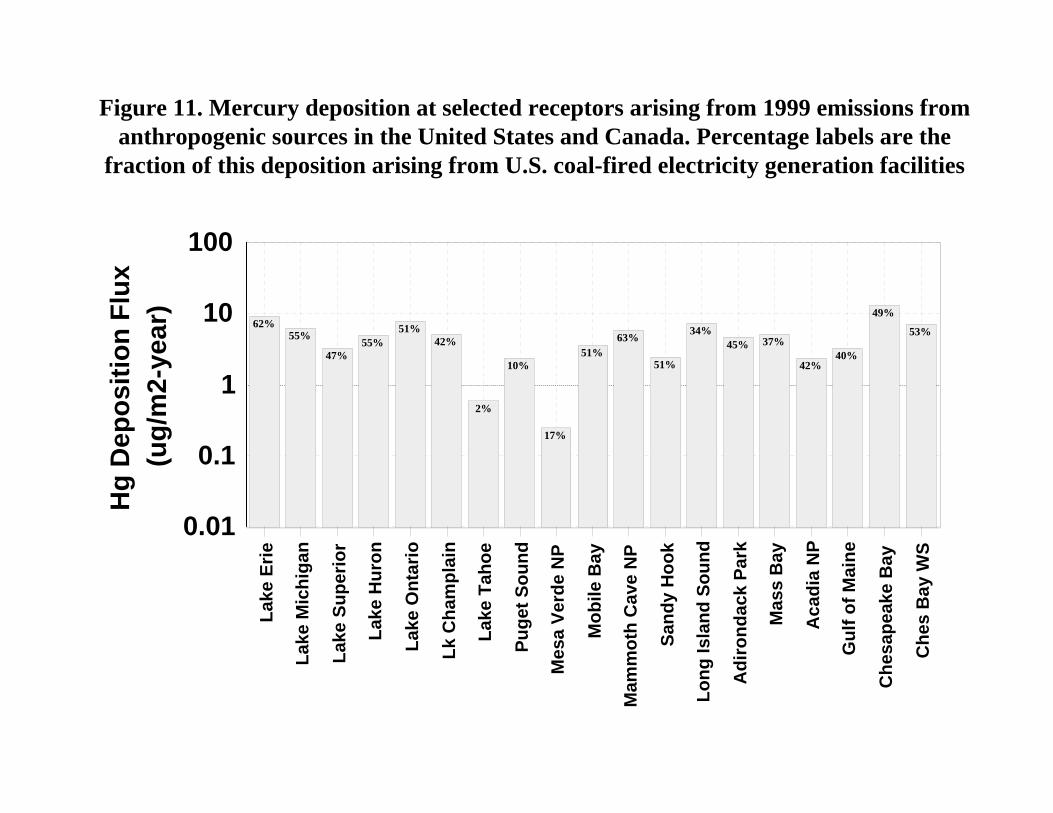
Figure 11. Mercury deposition at selected receptors arising from 1999 emissions from anthropogenic sources in the United States and Canada. Percentage labels are the
fraction of this deposition arising from U.S. coal-fired electricity generation facilities
62%55%
47%55%
51%42%
2%
10%
17%
51%63%
51%
34%45% 37%
42%40%
49%
53%
Lake
Erie
Lake
Mic
higa
n
Lake
Sup
erio
r
Lake
Hur
on
Lake
Ont
ario
Lk C
ham
plai
n
Lake
Tah
oe
Puge
t Sou
nd
Mes
a Ve
rde
NP
Mob
ile B
ay
Mam
mot
h C
ave
NP
Sand
y H
ook
Long
Isla
nd S
ound
Adi
rond
ack
Park
Mas
s B
ay
Aca
dia
NP
Gul
f of M
aine
Che
sape
ake
Bay
Che
s B
ay W
S
0.01
0.1
1
10
100
(ug/
m2-
year
)H
g D
epos
ition
Flu
x
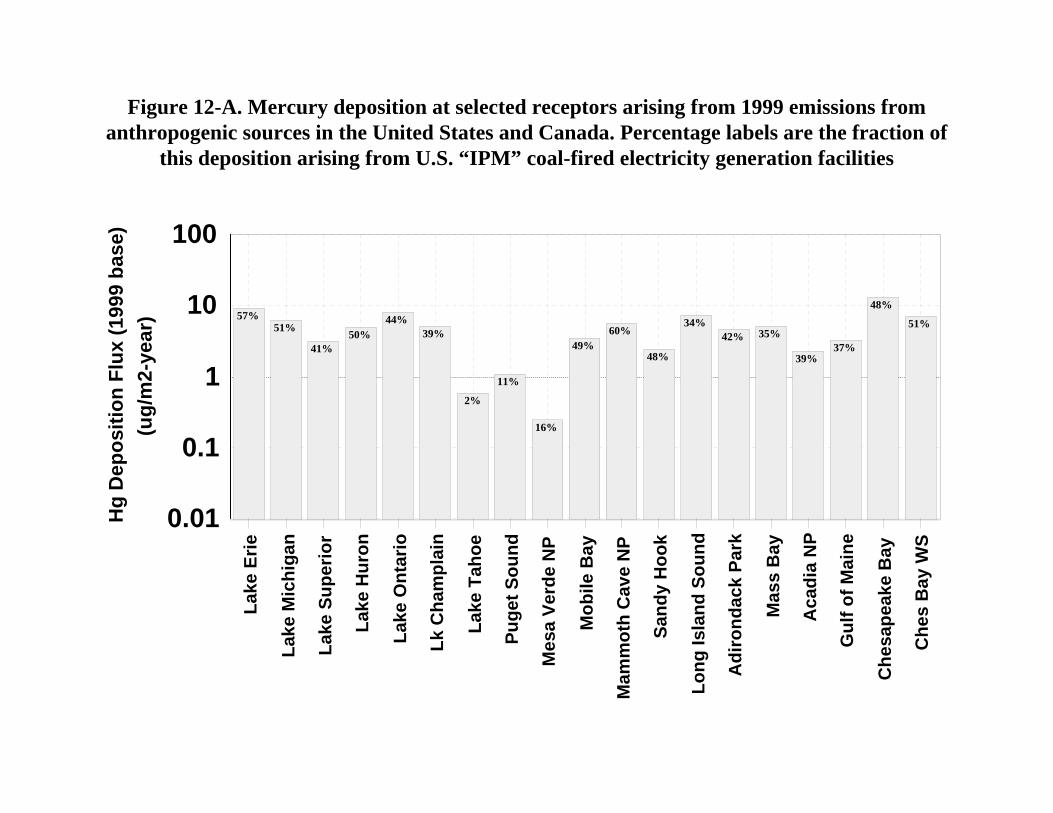
Figure 12-A. Mercury deposition at selected receptors arising from 1999 emissions from anthropogenic sources in the United States and Canada. Percentage labels are the fraction of
this deposition arising from U.S. “IPM” coal-fired electricity generation facilities
57%51%
41%50%
44%39%
2%
11%
16%
49%60%
48%
34%42% 35%
39%37%
48%
51%
Lake
Erie
Lake
Mic
higa
n
Lake
Sup
erio
r
Lake
Hur
on
Lake
Ont
ario
Lk C
ham
plai
n
Lake
Tah
oe
Puge
t Sou
nd
Mes
a Ve
rde
NP
Mob
ile B
ay
Mam
mot
h C
ave
NP
Sand
y H
ook
Long
Isla
nd S
ound
Adi
rond
ack
Park
Mas
s B
ay
Aca
dia
NP
Gul
f of M
aine
Che
sape
ake
Bay
Che
s B
ay W
S
0.01
0.1
1
10
100
(ug/
m2-
year
)H
g D
epos
ition
Flu
x (1
999
base
)
Lake
Erie
Lake
Mic
higa
n
Lake
Sup
erio
r
Lake
Hur
on
Lake
Ont
ario
Lk C
ham
plai
n
Lake
Tah
oe
Puge
t Sou
nd
Mes
a Ve
rde
NP
Mob
ile B
ay
Mam
mot
h C
ave
NP
Sand
y H
ook
Long
Isla
nd S
ound
Adi
rond
ack
Park
Mas
s B
ay
Aca
dia
NP
Gul
f of M
aine
Che
sape
ake
Bay
Che
s B
ay W
S
0
5
10
15
(ug/
m2-
year
)H
g D
epos
ition
Flu
x (1
999
base
)
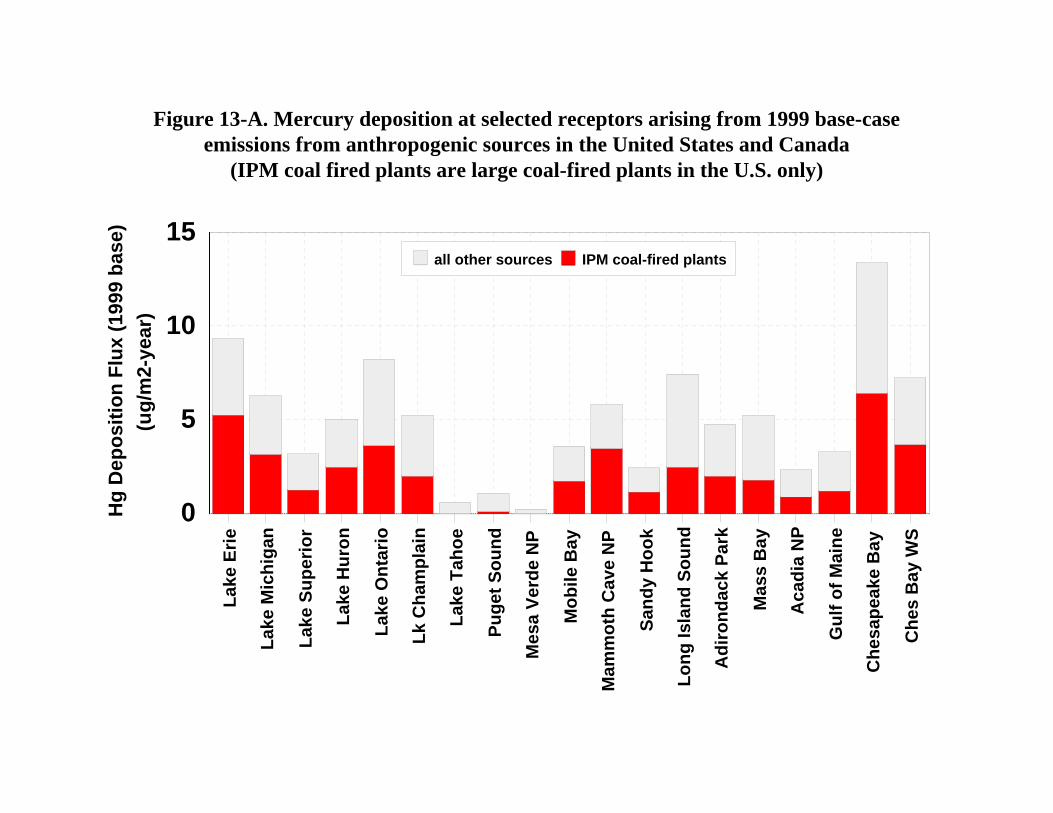
all other sources IPM coal-fired plants
Figure 13-A. Mercury deposition at selected receptors arising from 1999 base-case emissions from anthropogenic sources in the United States and Canada
(IPM coal fired plants are large coal-fired plants in the U.S. only)
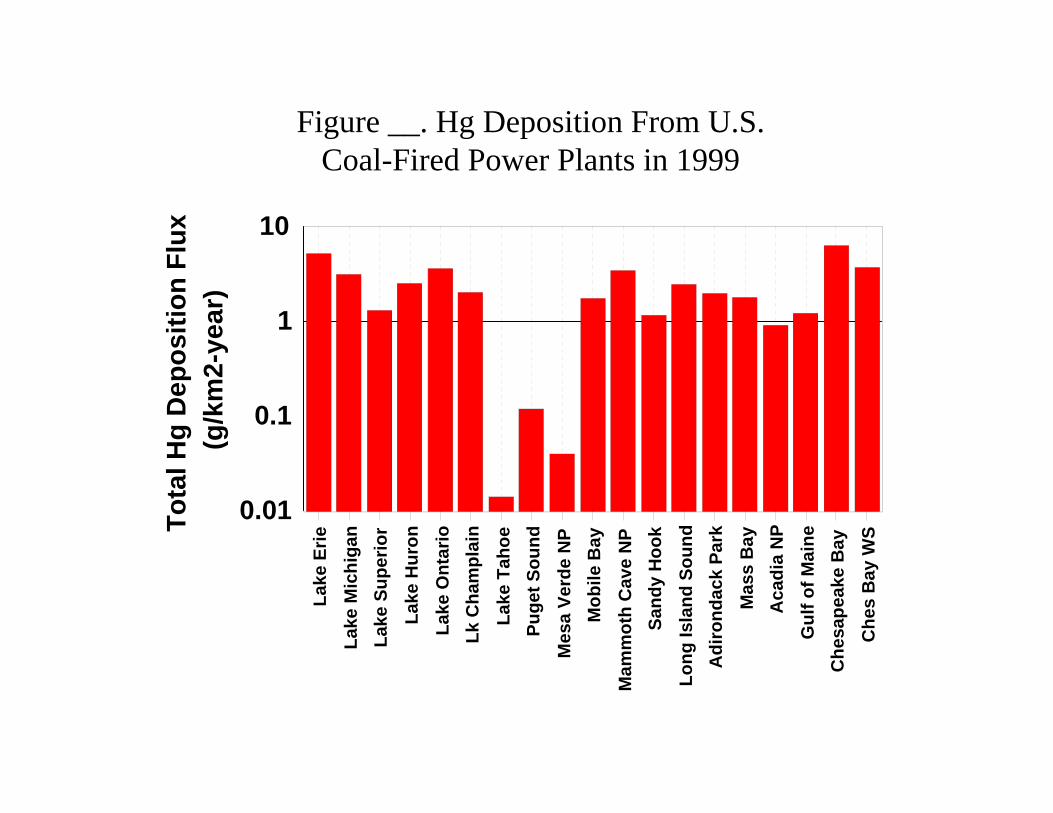
Figure __. Hg Deposition From U.S.Coal-Fired Power Plants in 1999
Lake
Erie
Lake
Mic
higa
nLa
ke S
uper
ior
Lake
Hur
onLa
ke O
ntar
ioLk
Cha
mpl
ain
Lake
Tah
oePu
get S
ound
Mes
a Ve
rde
NP
Mob
ile B
ayM
amm
oth
Cav
e N
PSa
ndy
Hoo
kLo
ng Is
land
Sou
ndA
diro
ndac
k Pa
rkM
ass
Bay
Aca
dia
NP
Gul
f of M
aine
Che
sape
ake
Bay
Che
s B
ay W
S
0.01
0.1
1
10(g
/km
2-ye
ar)
Tota
l Hg
Dep
ositi
on F
lux
OverallSummary ofGreat Lakes
Results
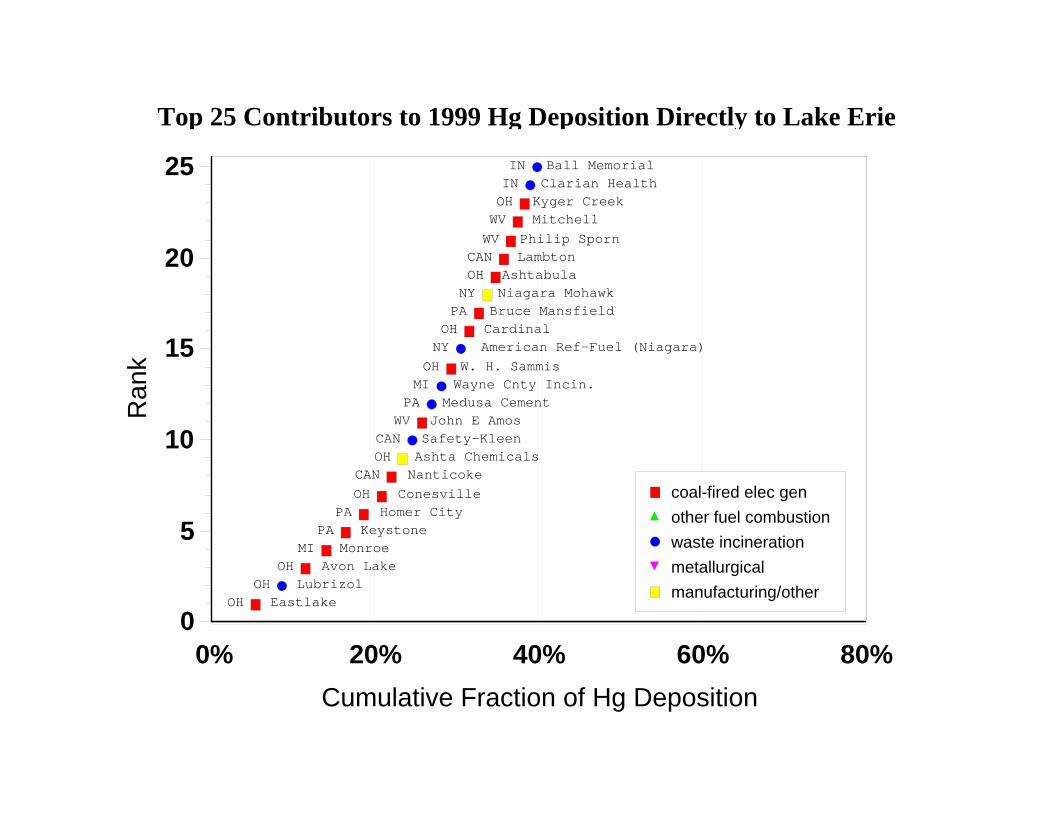
Top 25 Contributors to 1999 Hg Deposition Directly to Lake Erie
Eastlake Lubrizol
Avon Lake Monroe
Keystone Homer City
Conesville NanticokeAshta ChemicalsSafety-KleenJohn E AmosMedusa CementWayne Cnty Incin.W. H. Sammis
American Ref-Fuel (Niagara) CardinalBruce MansfieldNiagara MohawkAshtabula LambtonPhilip Sporn MitchellKyger CreekClarian HealthBall Memorial
OH OH
OH MI
PA PA
OH CAN
OH CAN
WV PA MI OH NY OH PA NY OH CAN WV WV OH IN IN
0% 20% 40% 60% 80%Cumulative Fraction of Hg Deposition
0
5
10
15
20
25R
ank
coal-fired elec genother fuel combustionwaste incinerationmetallurgicalmanufacturing/other
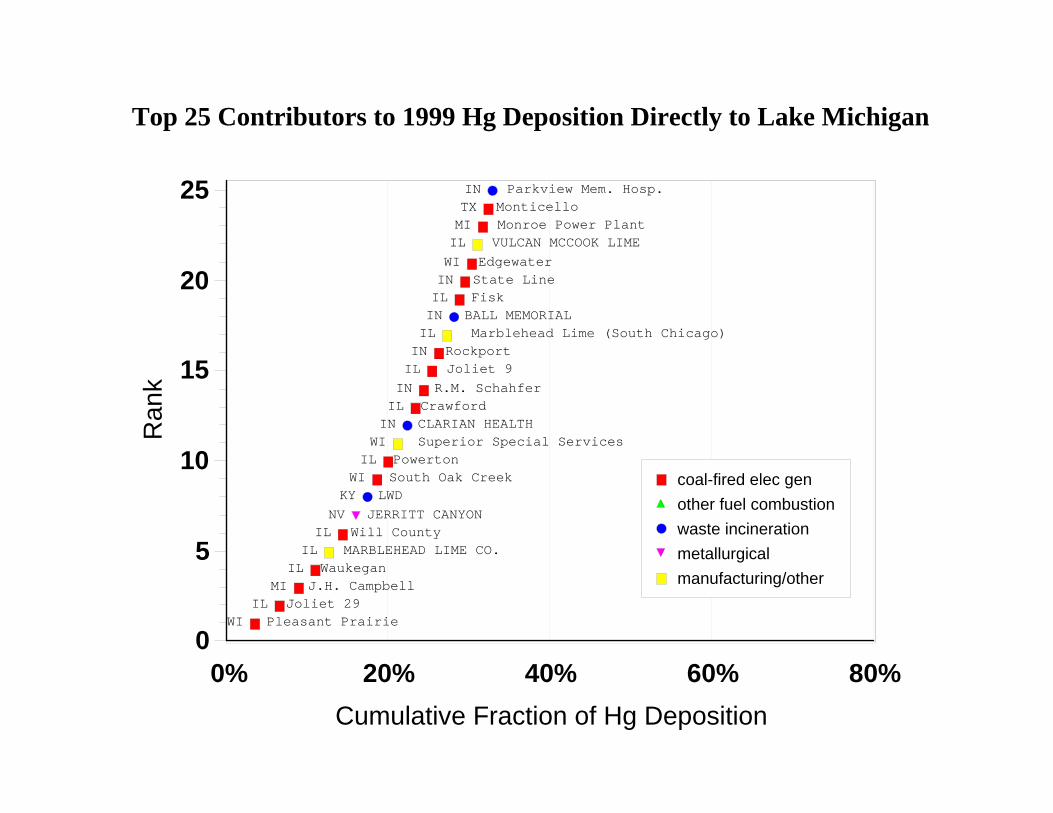
Top 25 Contributors to 1999 Hg Deposition Directly to Lake Michigan
Pleasant PrairieJoliet 29
J.H. CampbellWaukegan
MARBLEHEAD LIME CO.Will CountyJERRITT CANYON LWD
South Oak CreekPowerton
Superior Special ServicesCLARIAN HEALTHCrawfordR.M. Schahfer Joliet 9Rockport
Marblehead Lime (South Chicago)BALL MEMORIAL FiskState LineEdgewaterVULCAN MCCOOK LIMEMonroe Power PlantMonticelloParkview Mem. Hosp.
WI IL
MI IL IL IL NV KY WI IL WI IN IL IN IL IN IL IN IL IN WI IL MI TX IN
0% 20% 40% 60% 80%Cumulative Fraction of Hg Deposition
0
5
10
15
20
25R
ank
coal-fired elec genother fuel combustionwaste incinerationmetallurgicalmanufacturing/other
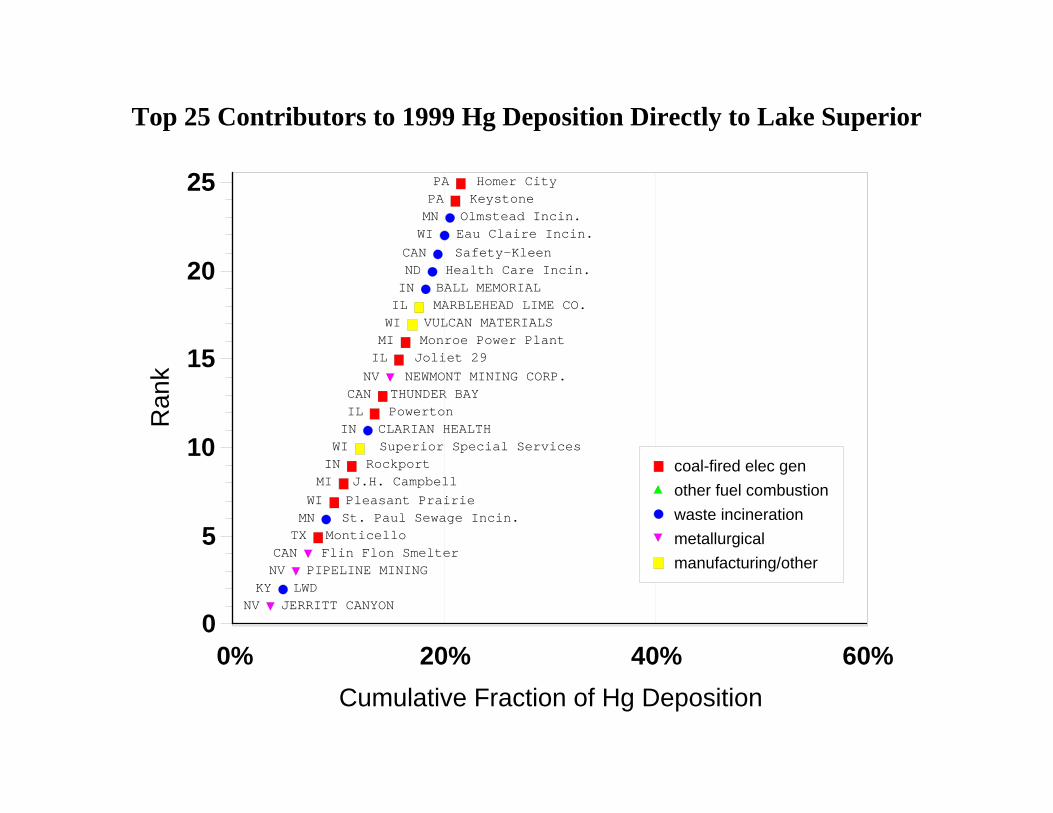
Top 25 Contributors to 1999 Hg Deposition Directly to Lake Superior
JERRITT CANYON LWD
PIPELINE MININGFlin Flon SmelterMonticelloSt. Paul Sewage Incin.Pleasant PrairieJ.H. Campbell Rockport
Superior Special ServicesCLARIAN HEALTH PowertonTHUNDER BAYNEWMONT MINING CORP. Joliet 29Monroe Power PlantVULCAN MATERIALSMARBLEHEAD LIME CO.BALL MEMORIALHealth Care Incin. Safety-KleenEau Claire Incin.Olmstead Incin. Keystone Homer City
NV KY NV CAN
TX MN WI MI IN WI IN IL CAN
NV IL MI WI IL IN ND CAN WI MN PA PA
0% 20% 40% 60%Cumulative Fraction of Hg Deposition
0
5
10
15
20
25R
ank
coal-fired elec genother fuel combustionwaste incinerationmetallurgicalmanufacturing/other
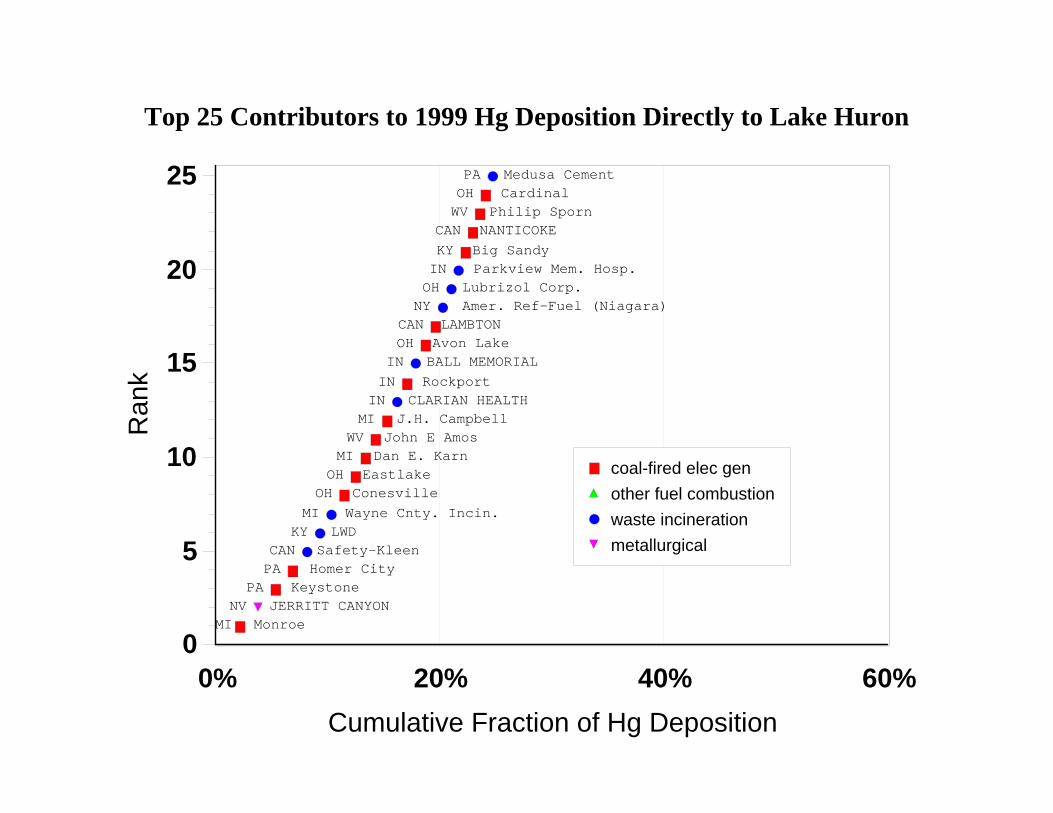
Top 25 Contributors to 1999 Hg Deposition Directly to Lake Huron
MonroeJERRITT CANYON Keystone
Homer CitySafety-Kleen LWD
Wayne Cnty. Incin.ConesvilleEastlakeDan E. KarnJohn E AmosJ.H. CampbellCLARIAN HEALTH RockportBALL MEMORIALAvon LakeLAMBTON
Amer. Ref-Fuel (Niagara)Lubrizol Corp.Parkview Mem. Hosp.Big SandyNANTICOKEPhilip Sporn CardinalMedusa Cement
MI NV
PA PA CAN
KY MI OH OH MI WV MI IN IN IN OH CAN NY OH IN KY CAN WV OH PA
0% 20% 40% 60%Cumulative Fraction of Hg Deposition
0
5
10
15
20
25R
ank
coal-fired elec genother fuel combustionwaste incinerationmetallurgical
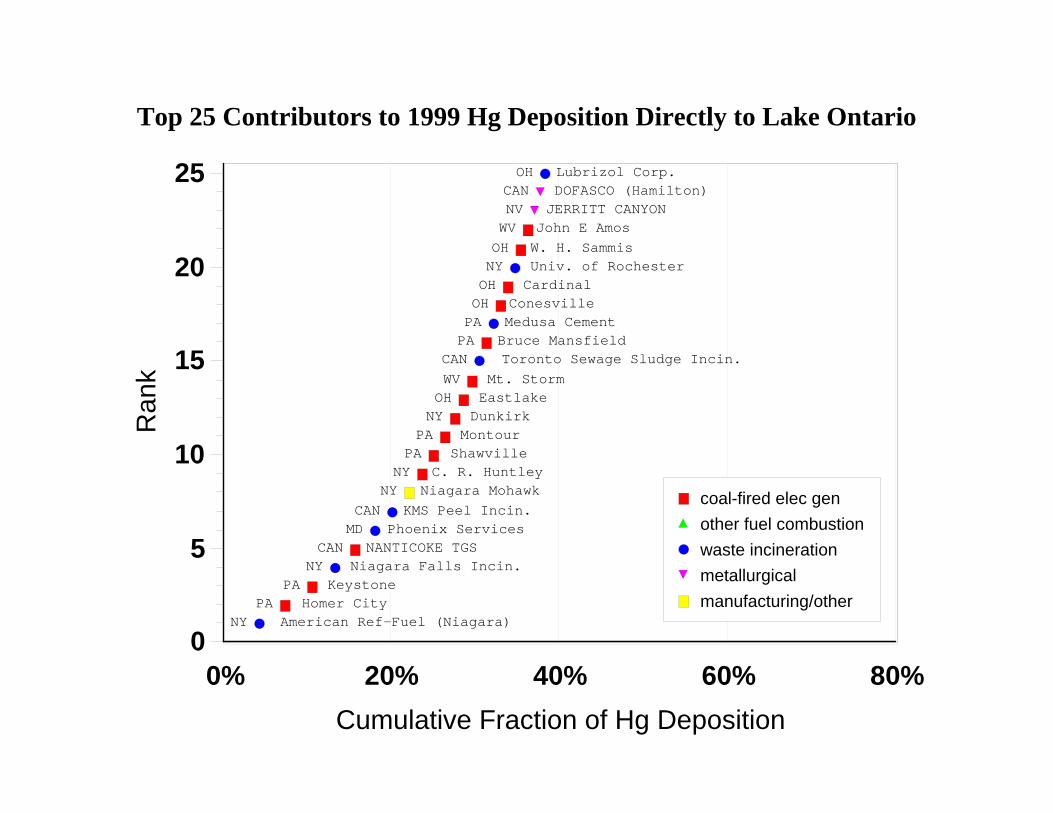
Top 25 Contributors to 1999 Hg Deposition Directly to Lake Ontario
American Ref-Fuel (Niagara) Homer City
KeystoneNiagara Falls Incin.NANTICOKE TGS
Phoenix ServicesKMS Peel Incin.Niagara MohawkC. R. Huntley Shawville Montour Dunkirk Eastlake Mt. Storm
Toronto Sewage Sludge Incin.Bruce MansfieldMedusa CementConesville CardinalUniv. of RochesterW. H. SammisJohn E AmosJERRITT CANYONDOFASCO (Hamilton)Lubrizol Corp.
NY PA
PA NY CAN
MD CAN
NY NY PA PA NY OH WV CAN PA PA OH OH NY OH WV NV CAN OH
0% 20% 40% 60% 80%Cumulative Fraction of Hg Deposition
0
5
10
15
20
25R
ank
coal-fired elec genother fuel combustionwaste incinerationmetallurgicalmanufacturing/other
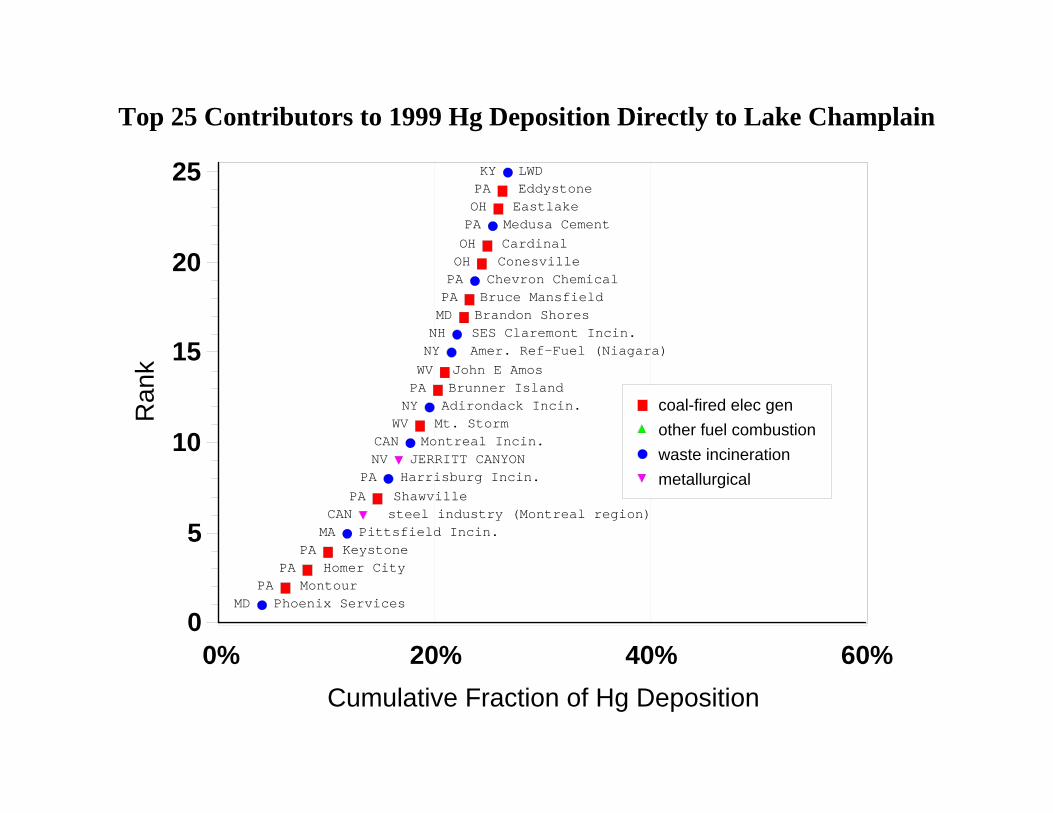
Top 25 Contributors to 1999 Hg Deposition Directly to Lake Champlain
Phoenix Services Montour
Homer City Keystone
Pittsfield Incin.steel industry (Montreal region) ShawvilleHarrisburg Incin.JERRITT CANYONMontreal Incin. Mt. StormAdirondack Incin.Brunner IslandJohn E Amos
Amer. Ref-Fuel (Niagara)SES Claremont Incin.Brandon ShoresBruce MansfieldChevron Chemical Conesville CardinalMedusa Cement Eastlake Eddystone LWD
MD PA
PA PA
MA CAN
PA PA NV CAN
WV NY PA WV NY NH MD PA PA OH OH PA OH PA KY
0% 20% 40% 60%Cumulative Fraction of Hg Deposition
0
5
10
15
20
25R
ank
coal-fired elec genother fuel combustionwaste incinerationmetallurgical
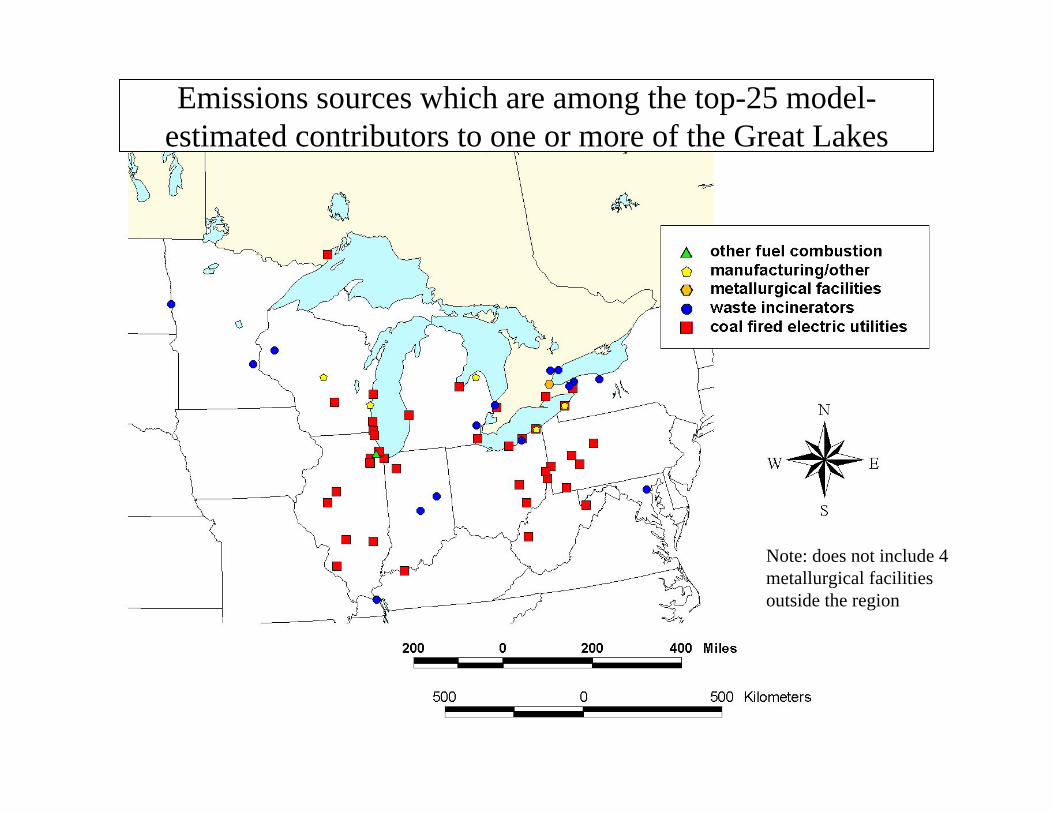
Emissions sources which are among the top-25 model-estimated contributors to one or more of the Great Lakes
Note: does not include 4 metallurgical facilities outside the region
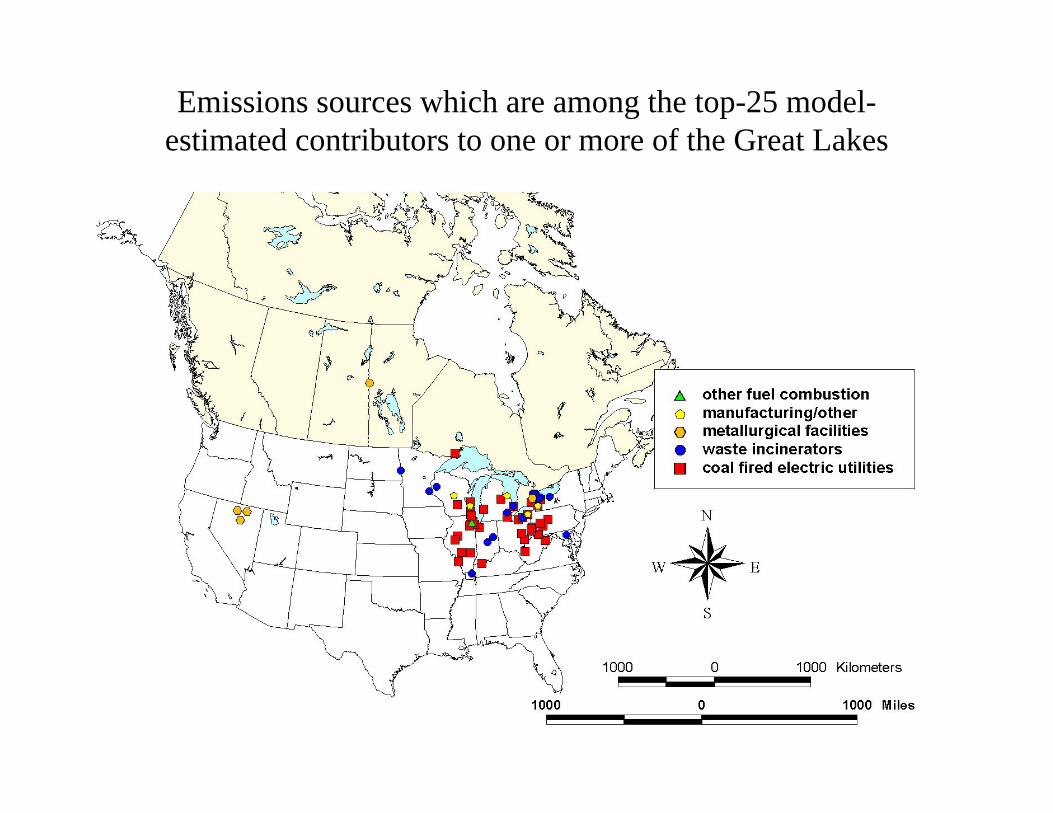
Emissions sources which are among the top-25 model-estimated contributors to one or more of the Great Lakes
US_GL
US_non
_GL
CAN_GL
CAN_non
_GL
0
100
200
300
400
500
600
700
800
900
U.S
. Sou
rces
(kg/
yr)
Dep
ositi
on fr
om
0
10
20
30
40
50
60
70
80
90
Can
adia
n S
ourc
es (k
g/yr
)D
epos
ition
from
OntarioHuronSuperiorMichiganErie
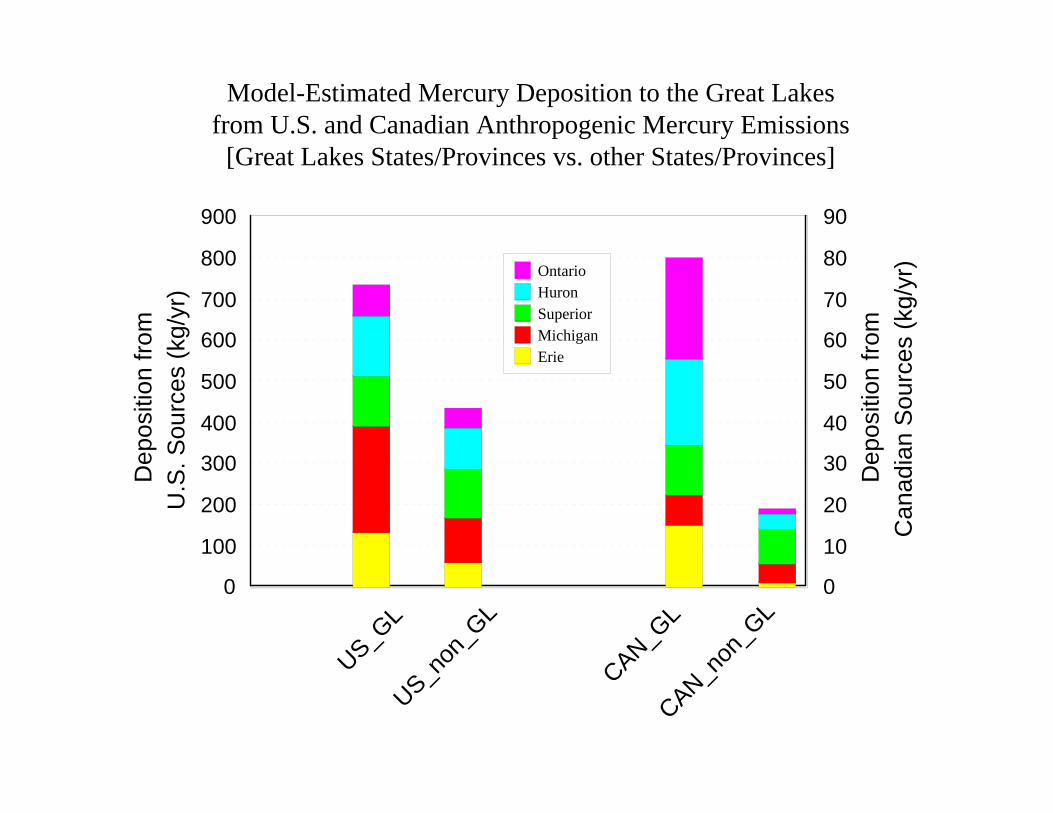
Model-Estimated Mercury Deposition to the Great Lakesfrom U.S. and Canadian Anthropogenic Mercury Emissions
[Great Lakes States/Provinces vs. other States/Provinces]
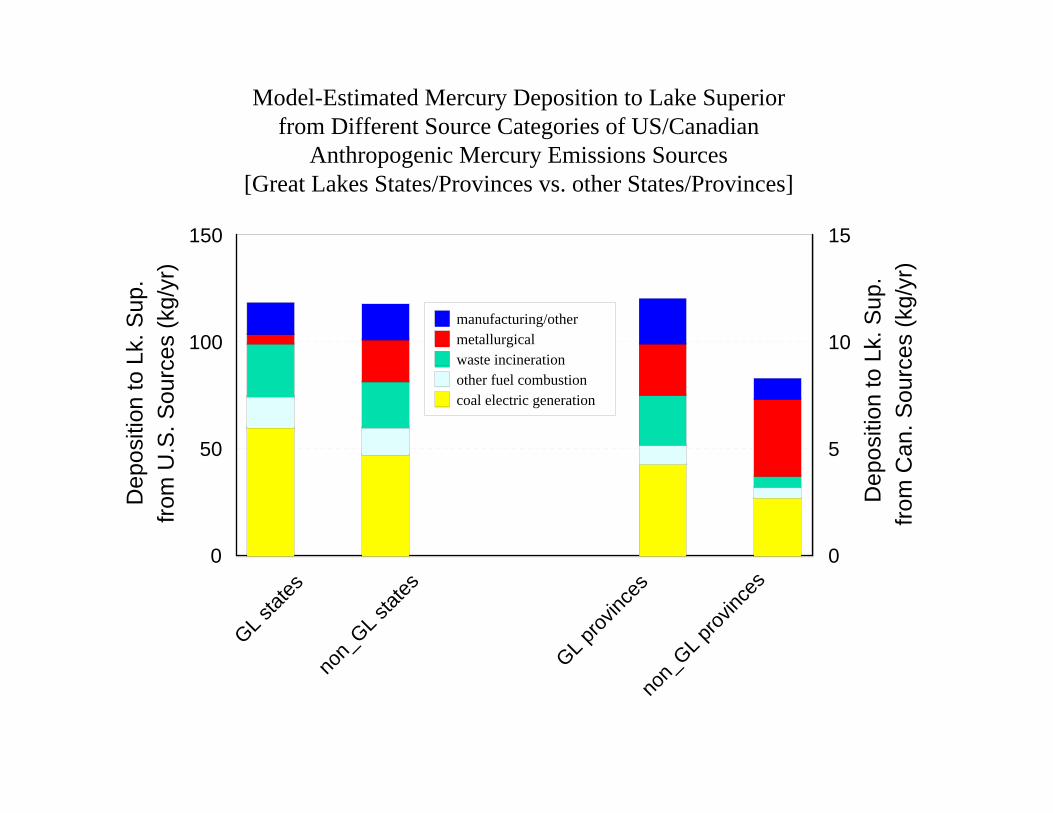
Model-Estimated Mercury Deposition to Lake Superiorfrom Different Source Categories of US/Canadian
Anthropogenic Mercury Emissions Sources[Great Lakes States/Provinces vs. other States/Provinces]
GL stat
esno
n_GL s
tates
GL prov
inces
non_
GL prov
inces
0
50
100
150
from
U.S
. Sou
rces
(kg/
yr)
Dep
ositi
on to
Lk.
Sup
.
0
5
10
15
from
Can
. Sou
rces
(kg/
yr)
Dep
ositi
on to
Lk.
Sup
.
manufacturing/othermetallurgicalwaste incinerationother fuel combustioncoal electric generation
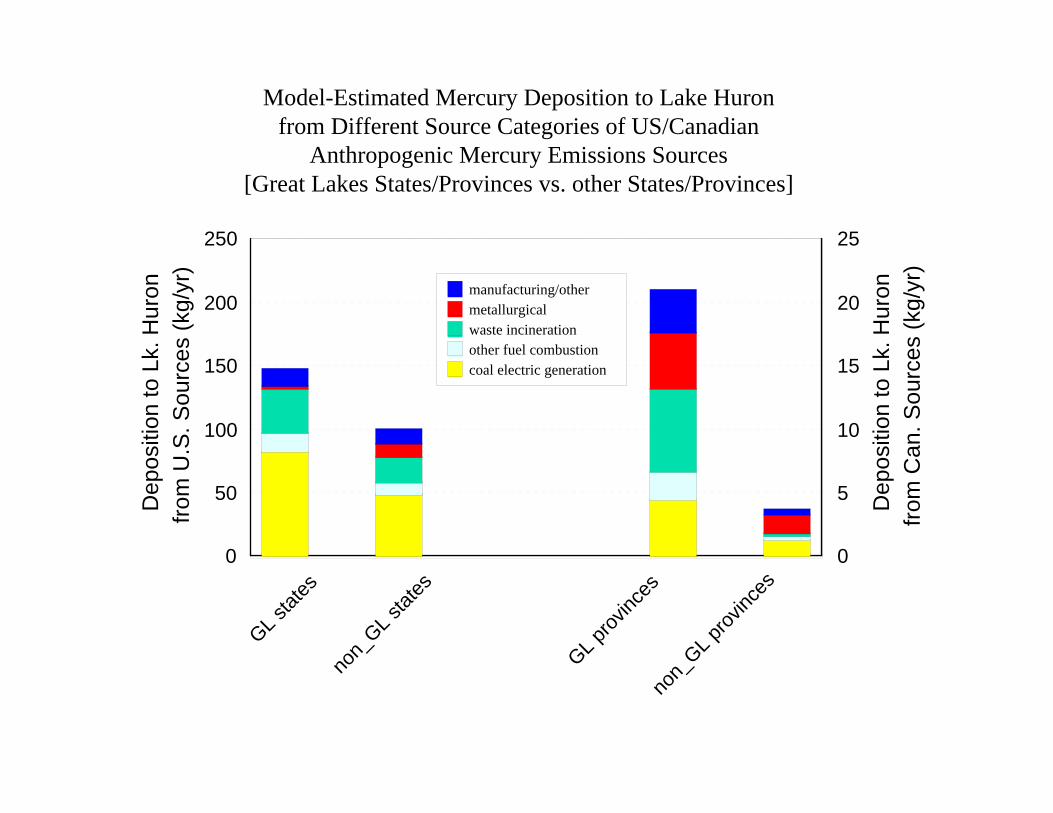
Model-Estimated Mercury Deposition to Lake Huronfrom Different Source Categories of US/Canadian
Anthropogenic Mercury Emissions Sources[Great Lakes States/Provinces vs. other States/Provinces]
GL stat
esno
n_GL s
tates
GL prov
inces
non_
GL prov
inces
0
50
100
150
200
250
from
U.S
. Sou
rces
(kg/
yr)
Dep
ositi
on to
Lk.
Hur
on
0
5
10
15
20
25
from
Can
. Sou
rces
(kg/
yr)
Dep
ositi
on to
Lk.
Hur
onmanufacturing/othermetallurgicalwaste incinerationother fuel combustioncoal electric generation
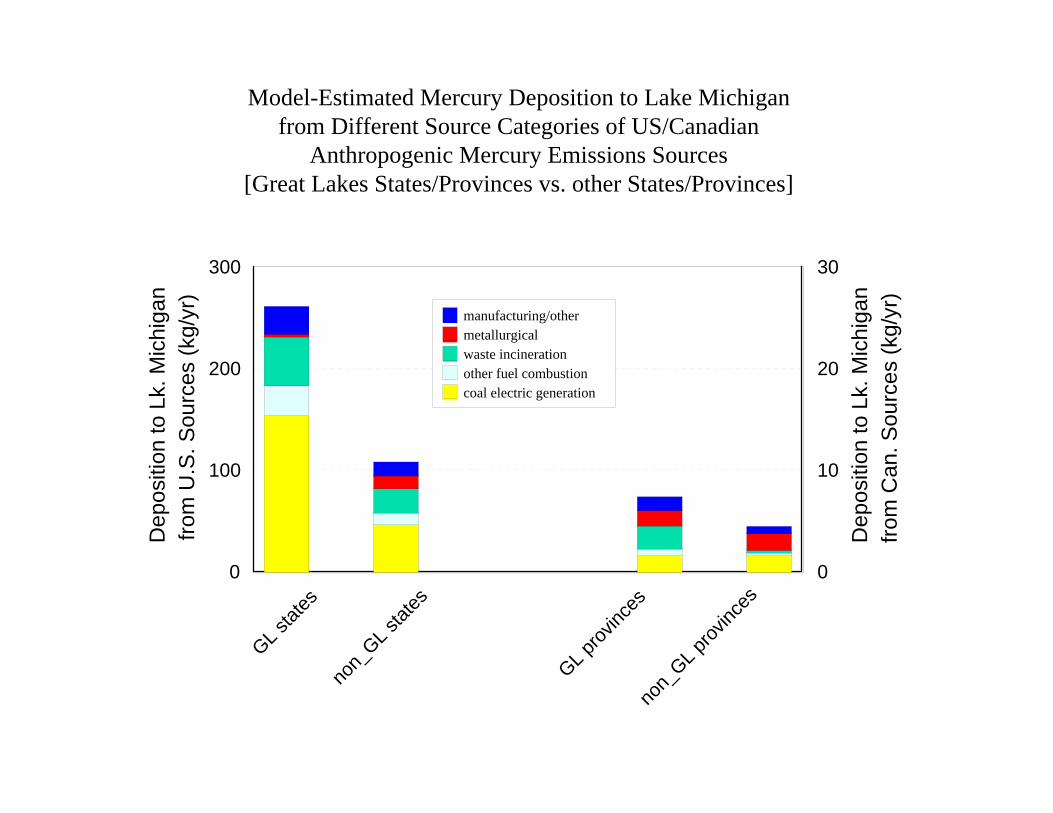
Model-Estimated Mercury Deposition to Lake Michiganfrom Different Source Categories of US/Canadian
Anthropogenic Mercury Emissions Sources[Great Lakes States/Provinces vs. other States/Provinces]
GL stat
esno
n_GL s
tates
GL prov
inces
non_
GL prov
inces
0
100
200
300
from
U.S
. Sou
rces
(kg/
yr)
Dep
ositi
on to
Lk.
Mic
higa
n
0
10
20
30
from
Can
. Sou
rces
(kg/
yr)
Dep
ositi
on to
Lk.
Mic
higa
n
manufacturing/othermetallurgicalwaste incinerationother fuel combustioncoal electric generation
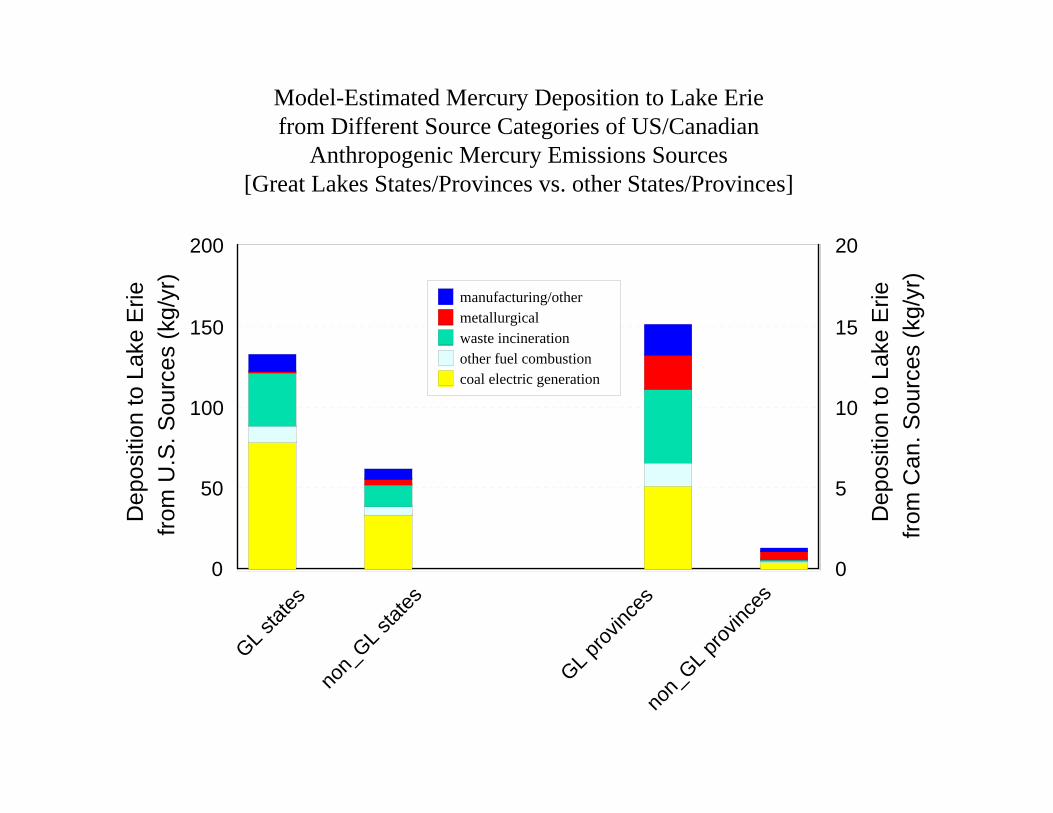
Model-Estimated Mercury Deposition to Lake Eriefrom Different Source Categories of US/Canadian
Anthropogenic Mercury Emissions Sources[Great Lakes States/Provinces vs. other States/Provinces]
GL stat
esno
n_GL s
tates
GL prov
inces
non_
GL prov
inces
0
50
100
150
200
from
U.S
. Sou
rces
(kg/
yr)
Dep
ositi
on to
Lak
e E
rie
0
5
10
15
20
from
Can
. Sou
rces
(kg/
yr)
Dep
ositi
on to
Lak
e E
riemanufacturing/othermetallurgicalwaste incinerationother fuel combustioncoal electric generation
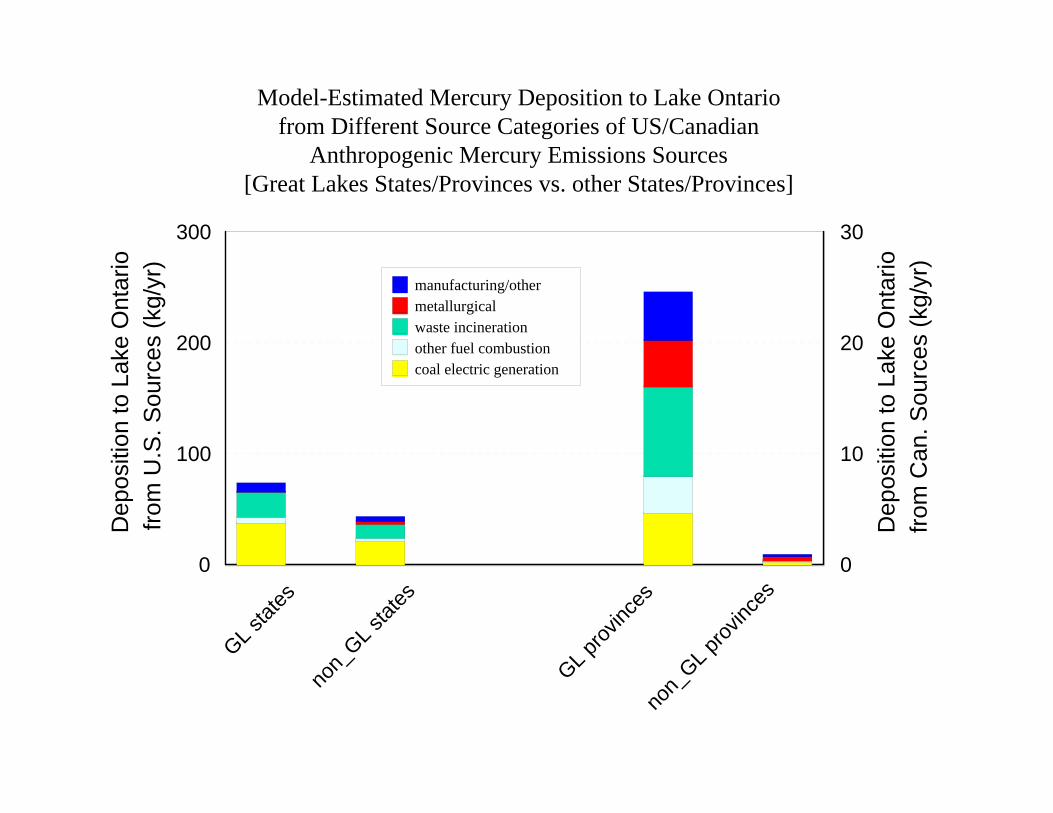
Model-Estimated Mercury Deposition to Lake Ontariofrom Different Source Categories of US/Canadian
Anthropogenic Mercury Emissions Sources[Great Lakes States/Provinces vs. other States/Provinces]
GL stat
esno
n_GL s
tates
GL prov
inces
non_
GL prov
inces
0
100
200
300
from
U.S
. Sou
rces
(kg/
yr)
Dep
ositi
on to
Lak
e O
ntar
io
0
10
20
30
from
Can
. Sou
rces
(kg/
yr)
Dep
ositi
on to
Lak
e O
ntar
io
manufacturing/othermetallurgicalwaste incinerationother fuel combustioncoal electric generation
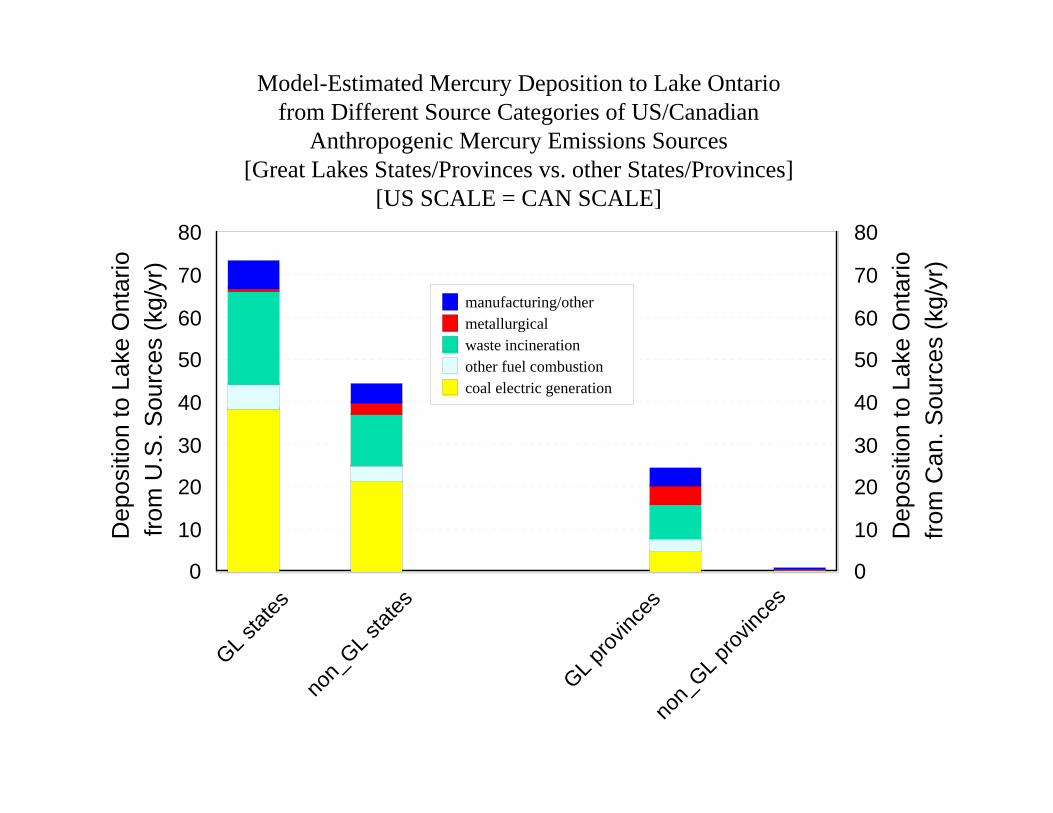
Model-Estimated Mercury Deposition to Lake Ontariofrom Different Source Categories of US/Canadian
Anthropogenic Mercury Emissions Sources[Great Lakes States/Provinces vs. other States/Provinces]
[US SCALE = CAN SCALE]
GL stat
esno
n_GL s
tates
GL prov
inces
non_
GL prov
inces
0
10
20
30
40
50
60
70
80
from
U.S
. Sou
rces
(kg/
yr)
Dep
ositi
on to
Lak
e O
ntar
io
0
10
20
30
40
50
60
70
80
from
Can
. Sou
rces
(kg/
yr)
Dep
ositi
on to
Lak
e O
ntar
io
manufacturing/othermetallurgicalwaste incinerationother fuel combustioncoal electric generation

Additional Detailed
Results forLake Erie
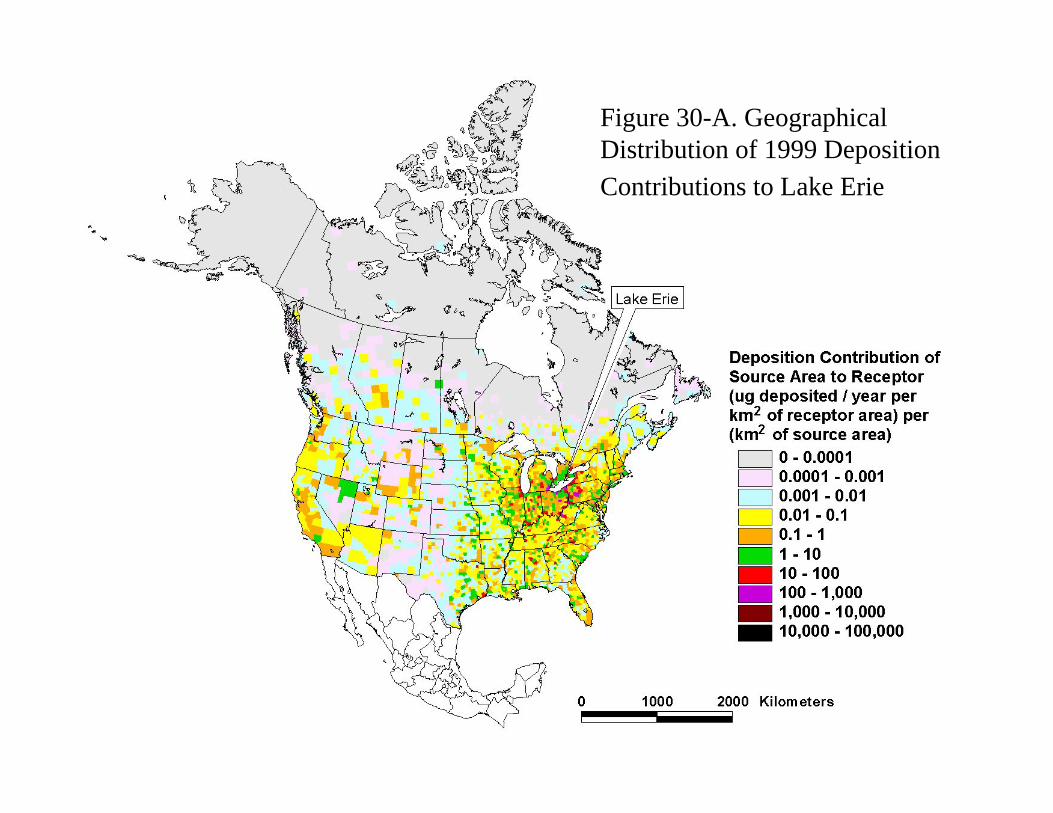
Figure 30-A. Geographical Distribution of 1999 Deposition Contributions to Lake Erie
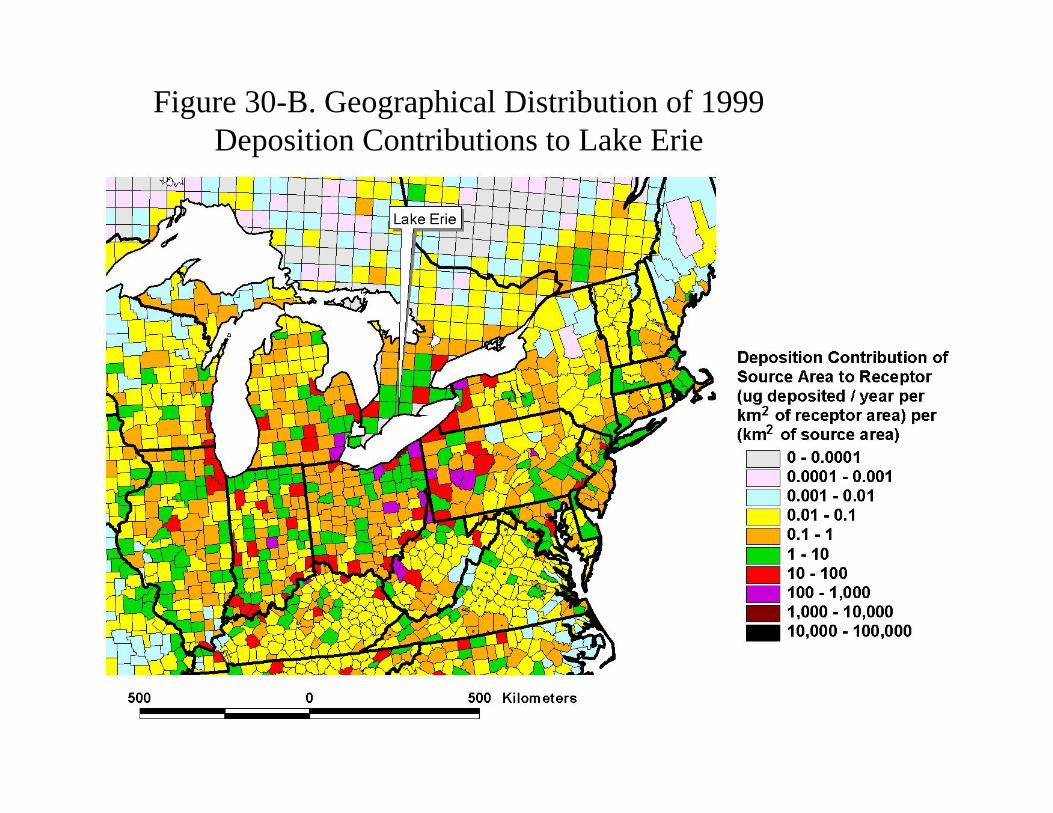
Figure 30-B. Geographical Distribution of 1999 Deposition Contributions to Lake Erie
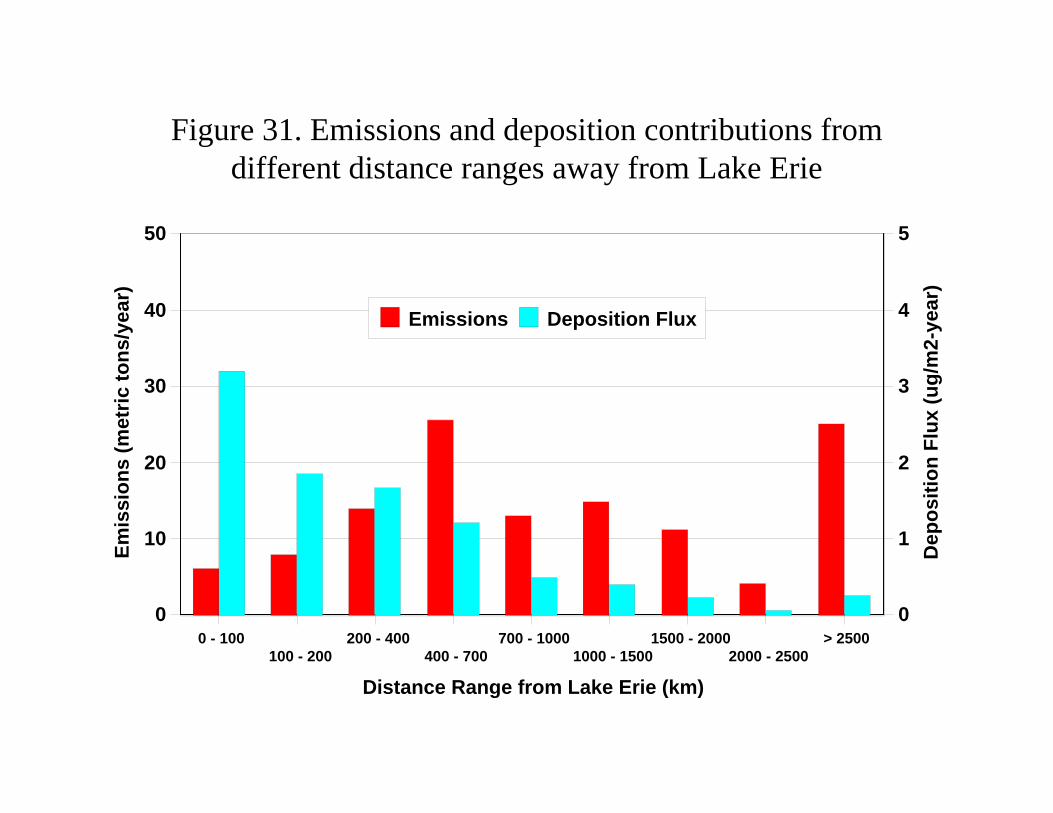
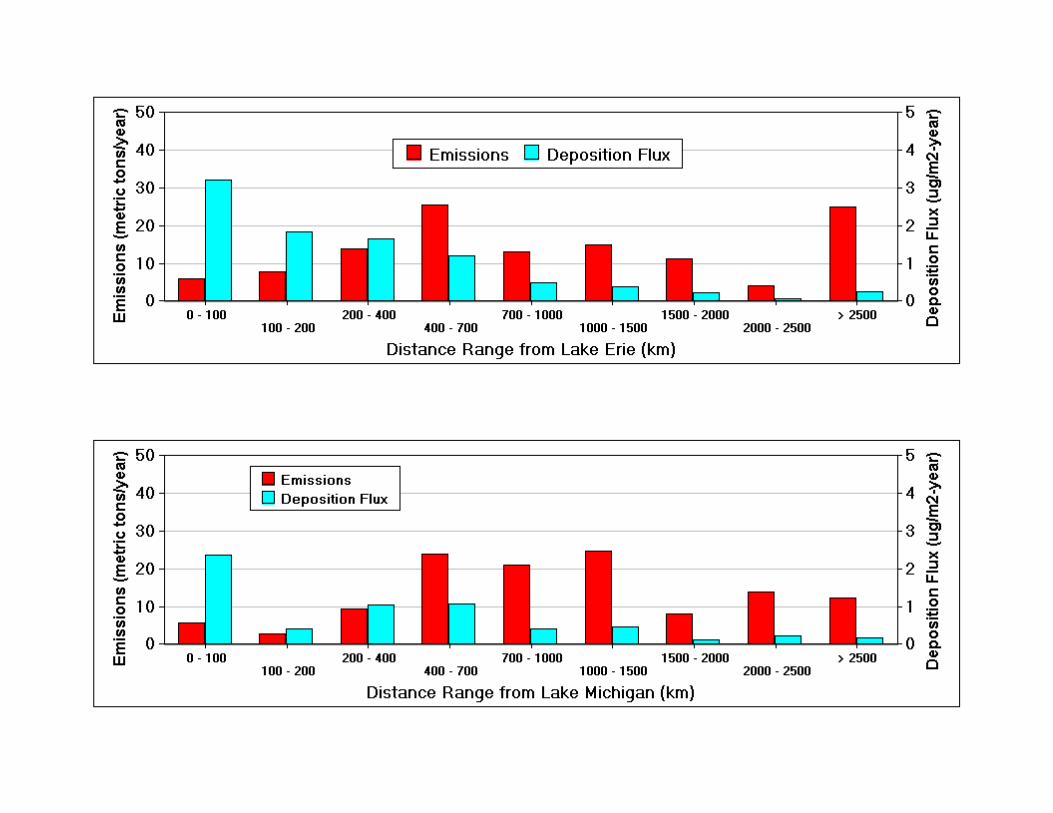
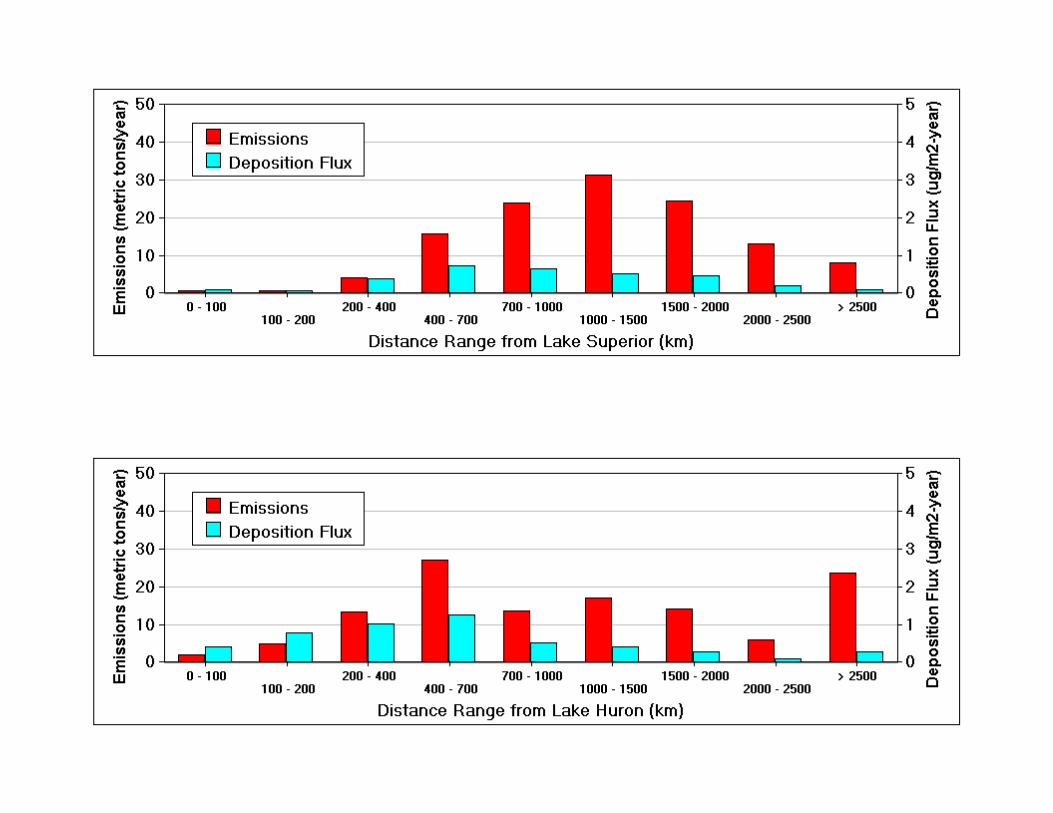
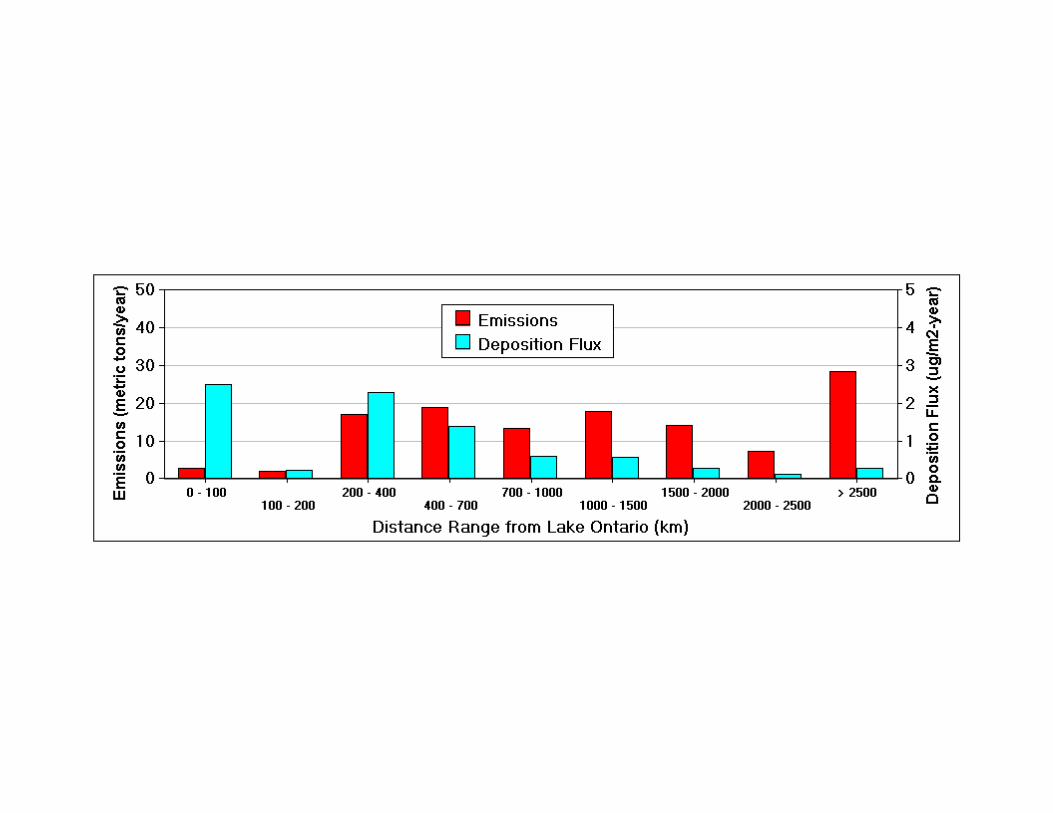
Figure 31. Emissions and deposition contributions from different distance ranges away from Lake Erie
0 - 100100 - 200
200 - 400400 - 700
700 - 10001000 - 1500
1500 - 20002000 - 2500
> 2500
Distance Range from Lake Erie (km)
0
10
20
30
40
50
Emis
sion
s (m
etric
tons
/yea
r)
0
1
2
3
4
5
Dep
ositi
on F
lux
(ug/
m2-
year
)
Emissions Deposition Flux

AdditionalDetailed
Results forLake
Michigan
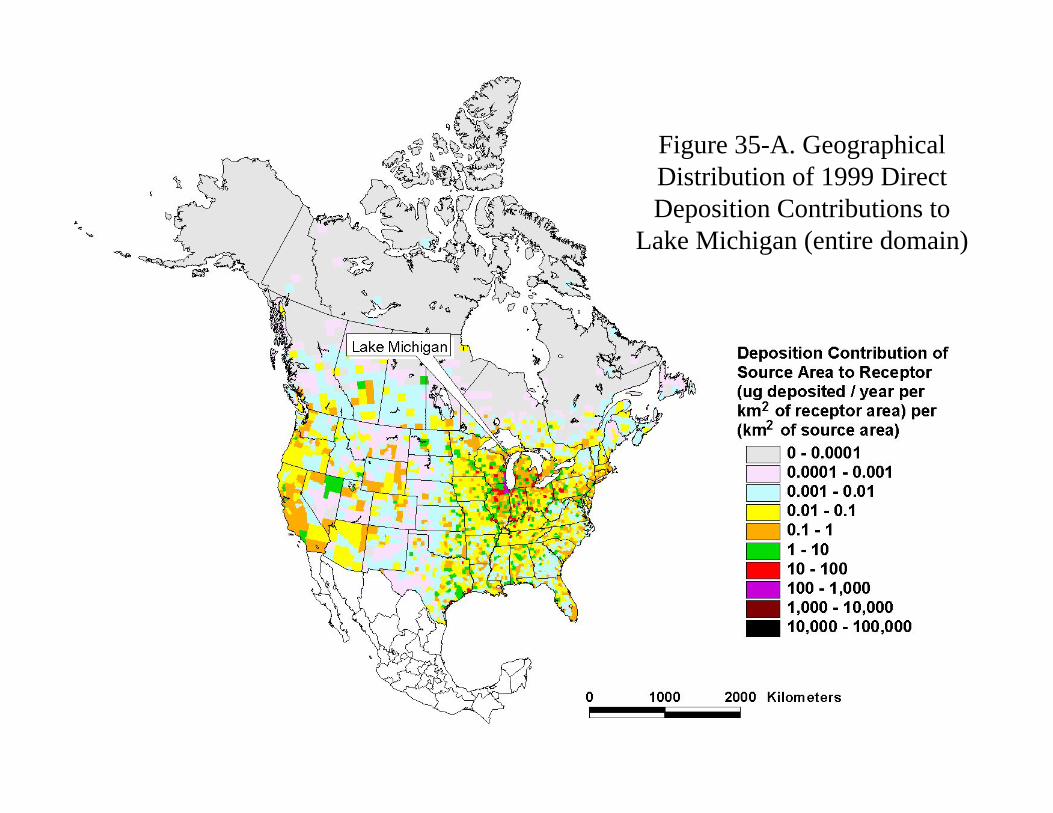
Figure 35-A. Geographical Distribution of 1999 Direct Deposition Contributions to
Lake Michigan (entire domain)
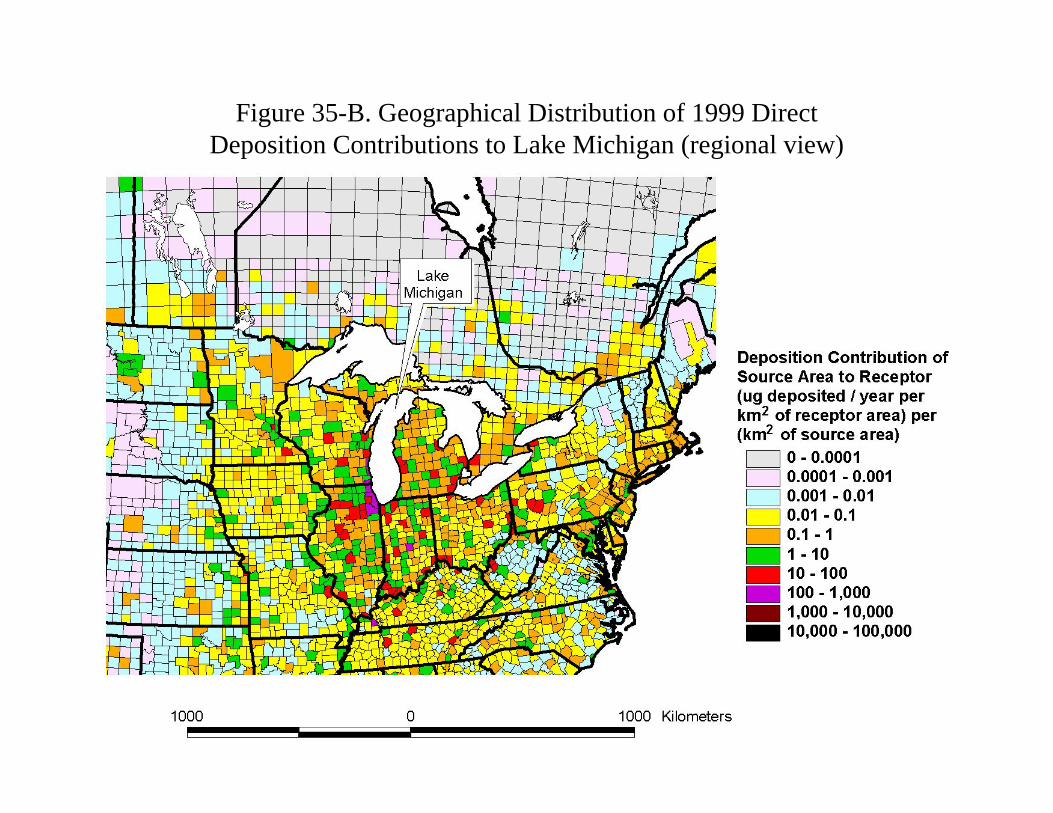
Figure 35-B. Geographical Distribution of 1999 DirectDeposition Contributions to Lake Michigan (regional view)
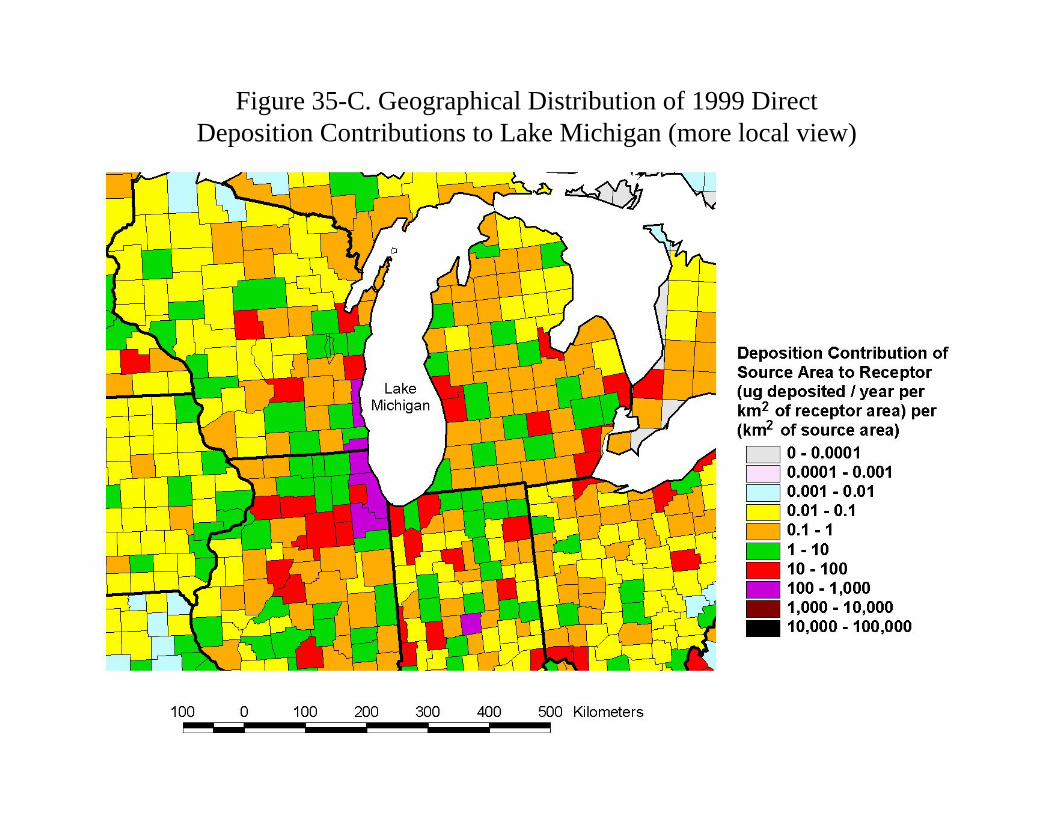
Figure 35-C. Geographical Distribution of 1999 DirectDeposition Contributions to Lake Michigan (more local view)
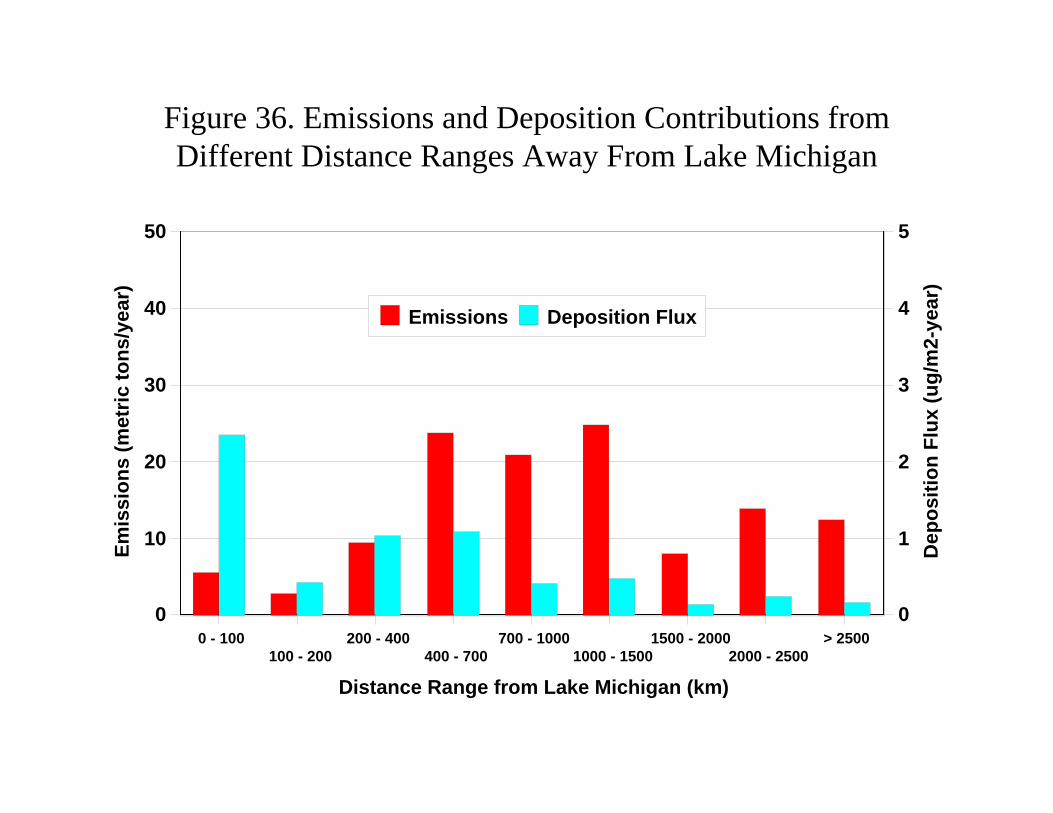
0 - 100100 - 200
200 - 400400 - 700
700 - 10001000 - 1500
1500 - 20002000 - 2500
> 2500
Distance Range from Lake Michigan (km)
0
10
20
30
40
50
Emis
sion
s (m
etric
tons
/yea
r)
0
1
2
3
4
5
Dep
ositi
on F
lux
(ug/
m2-
year
)
Emissions Deposition Flux
Figure 36. Emissions and Deposition Contributions from Different Distance Ranges Away From Lake Michigan