Embed Size (px)
Citation preview
. . . 7
Chapter 2
The Australian Financial System
Introduction
2.1 This chapter provides an overview of the main institutions, marketsand products which constitute the Australian financial system.
2.2 It begins with a brief summary of how the system and its regulatoryframework have evolved. This is followed by a description of the maininstitutions and markets of the system.
2.3 The purpose of this chapter is to introduce the industries andproducts which are the subject of the Inquiry. A full analysis of the forceswhich have shaped the existing arrangements, including financial systemderegulation, is not provided here. This analysis, which is required by theInquiry’s Terms of Reference, will be provided in the Final Report.
2.4 The financial system is undergoing rapid change. A ‘snapshot’ ofthe system at any moment in time reflects the influence both of pastdevelopments and of the forces for change now acting upon the system.In Chapter 3, these forces for change are identified and their likely futureimpact is discussed as a way of introducing the major task facing theInquiry recommending an appropriate regulatory framework for theAustralian financial system.
Financial System Inquiry
8 . . .
Fifty Years in a ‘Nutshell ’ the Evolution ofAustralia’s Financial System
2.5 Following the Great Depression of the 1930s and the Second WorldWar (1939-45), a comprehensive regulatory structure was imposed on theAustralian banking system. During the ensuing 40 or so years to theearly 1980s, the evolution of financial institutions was driven, at least in part,by their efforts to minimise or avoid the constraints imposed by regulation.
2.6 In this period, the focus of regulation was on the tight control ofbanks, which dominated the financial system. The larger private banksestablished savings bank subsidiaries in the second half of the 1950s partly inan attempt to avoid regulatory constraints. However, these subsidiaries werealso licensed and required to hold specified proportions of reserves andgovernment securities. Another development was the establishment andgrowth of finance companies (often bank subsidiaries), again driven in partby the regulatory advantages applying to these companies compared withbanks. Similarly, non-bank deposit-taking institutions such as buildingsocieties and credit unions increased their market share as a result of theirregulatory advantages.
2.7 Throughout this period, life offices and superannuation fundstogether held assets equal to about one third of those of the banks. Both ofthese longer-term savings vehicles benefited from considerable taxationadvantages. In 1961, the Government introduced a requirement that lifeinsurance and superannuation funds hold 30 per cent of their assets in theform of government securities, at least two thirds of which had to beCommonwealth Government securities. This so-called ‘30/20 rule’ wasdriven by a perceived need to ensure a market for government debt.
2.8 Life offices, finance companies and building societies were allinvolved in the provision of mortgage lending to satisfy demand not met bybanks, the latter being constrained by lending guidelines.
2.9 The sectors with regulatory advantages tended to increase theirshare of financial system assets. This reduced the effectiveness of regulation
Chapter 2: The Australian Financial System
. . . 9
both for prudential purposes and for the conduct of monetary policy, both ofwhich were focused primarily on banks.
2.10 In the late 1960s and early 1970s, it was increasingly recognised thatdirect regulation of institutions was not achieving its objectives. An initialattempt at modest deregulation in the 1970s was largely reversed towardsthe end of that decade when credit restrictions were reapplied.
2.11 The Campbell Inquiry was announced in 1979, with a mission toexamine the growing distortions and inefficiencies created by regulation,particularly of banks. The recommendations of the Inquiry published in 1981included floating the exchange rate, removing quantitative controls on banklending, lowering bank reserve requirements and increasing competitionthrough foreign bank participation.
2.12 The key recommendations of the Campbell Committee wereendorsed by the Australian Financial System Review Group (the MartinCommittee) in December 1983. The overwhelming majority of therecommendations have since been introduced, albeit over a prolongedperiod. As a result, the financial sector over the past decade has experienced:
¾�new entry to the banking industry, by both local and foreigninstitutions;
¾�globalisation of Australia’s capital markets, with a floating dollarand removal of virtually all exchange controls, resulting in the closerintegration of Australian and foreign financial markets; and
¾�some increase in the market share of banks in the deposit-takingsector, at the expense of other financial institutions.
2.13 The same period has also seen other regulatory changes introduced,largely unrelated to the Campbell Committee recommendations. Amongthose which have influenced the development of the financial system are:
¾�major reform and expansion of the occupational superannuationarrangements, in response to increasing government andcommunity concern at the retirement income needs of an ageingpopulation;
Financial System Inquiry
10 . . .
¾�introduction of new prudential imposts in response to financialsector difficulties occasioned by major swings in asset prices in thelate 1980s and early 1990s;
¾�introduction of full dividend imputation and privatisation of somemajor government businesses, which have helped to invigorate thedomestic equities markets;
¾�substantial exit from banking and insurance of government-ownedenterprises; and
¾�introduction of new consumer protection regulations.
2.14 Regulatory changes have been accompanied by major changes inmarket structure, technology, distribution arrangements and financialproducts. In particular, derivatives markets have seen rapid growth asmarket participants have embraced the capacity they provide to managefinancial risks. Regulatory and other changes have combined in a complexinterplay to bring the financial system to its present position.
2.15 Nothing is more certain than further evolution, both from thecontinued playing out of the changes already under way and from newdevelopments yet to be established. These directions and forces for changeare reviewed in Chapter 3. The remainder of this chapter considers in moredetail the institutions and markets which constitute the Australian financialsystem.
2.16 As noted in Chapter 1, the financial system performs a variety offunctions which are conducted either through financial intermediaries orthrough financial markets.
¾�Financial intermediaries are institutions standing between saversand borrowers (or more generally between those with financialsurpluses and those with deficits) and include banks, non-bankdeposit-taking institutions, life offices, general insurance companies,superannuation funds, other collective investment funds and severalother types of entities.
¾�Financial markets include exchanges and over the counter (OTC)markets, in which financial assets are directly traded betweenparticipants (either financial intermediaries or ultimate borrowersand lenders).
Chapter 2: The Australian Financial System
. . . 11
Financial Intermediaries
Overview
2.17 The largest part of the system comprises financial intermediaries,broadly defined to include not only banks and insurance companies but alsomanaged funds such as superannuation and collective investment schemes.The level of assets held by financial intermediaries is indicative of the depthof the financial system and its ability efficiently to allocate available financialresources. By this measure, the Australian financial system is deeper nowthan ever before in the past 35 years. The total value of assets held by suchintermediaries, excluding those held by the Reserve Bank of Australia (RBA),was estimated to be approximately $931 billion1 in 1995. These assets hadgrown from around 78 per cent of gross domestic product (GDP) in 1960 toabout 204 per cent of GDP in 1995.2
2.18 The volume of financial assets as a proportion of GDP has increasedin virtually all major countries over the past twenty years or so.3
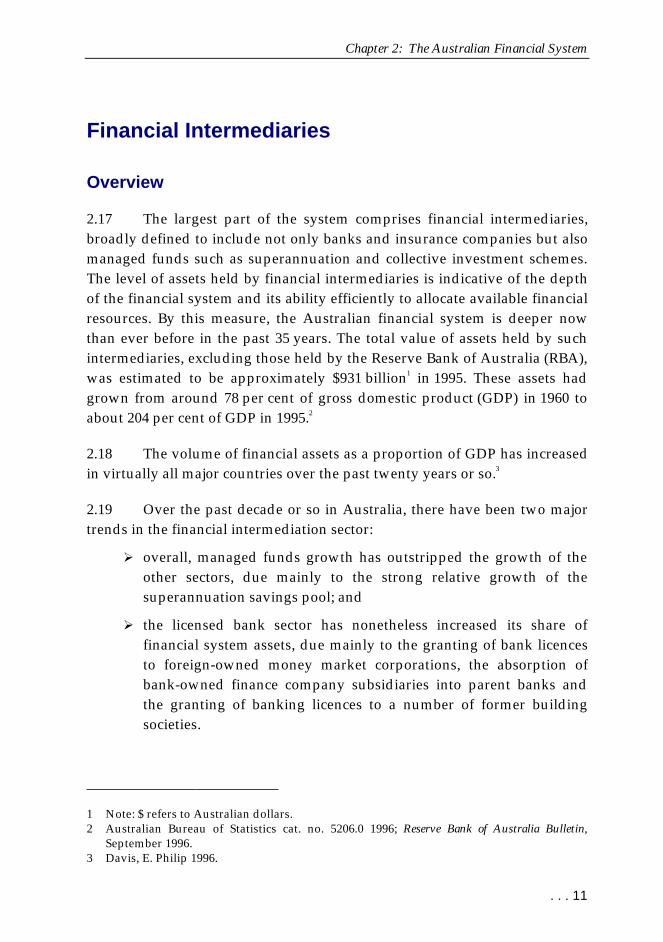
2.19 Over the past decade or so in Australia, there have been two majortrends in the financial intermediation sector:
¾�overall, managed funds growth has outstripped the growth of theother sectors, due mainly to the strong relative growth of thesuperannuation savings pool; and
¾�the licensed bank sector has nonetheless increased its share offinancial system assets, due mainly to the granting of bank licencesto foreign-owned money market corporations, the absorption ofbank-owned finance company subsidiaries into parent banks andthe granting of banking licences to a number of former buildingsocieties.
1 Note: $ refers to Australian dollars.2 Australian Bureau of Statistics cat. no. 5206.0 1996; Reserve Bank of Australia Bulletin,
September 1996.3 Davis, E. Philip 1996.
Financial System Inquiry
12 . . .
The net effects of these trends are illustrated in Figure 2.1.
Change in the FinancialInstitutions Landscape . . .
Figure 2.1: Assets of Banks, Non-Bank Financial Institutions and ManagedFunds as a Proportion of Total Assets of Financial Institutions4
0
5
10
15
20
25
30
35
40
45
1980 1990 1995
Per cent
Banks (exc. RBA) NBFIs Managed Funds
Source: Reserve Bank of Australia Bulletin, September 1996.
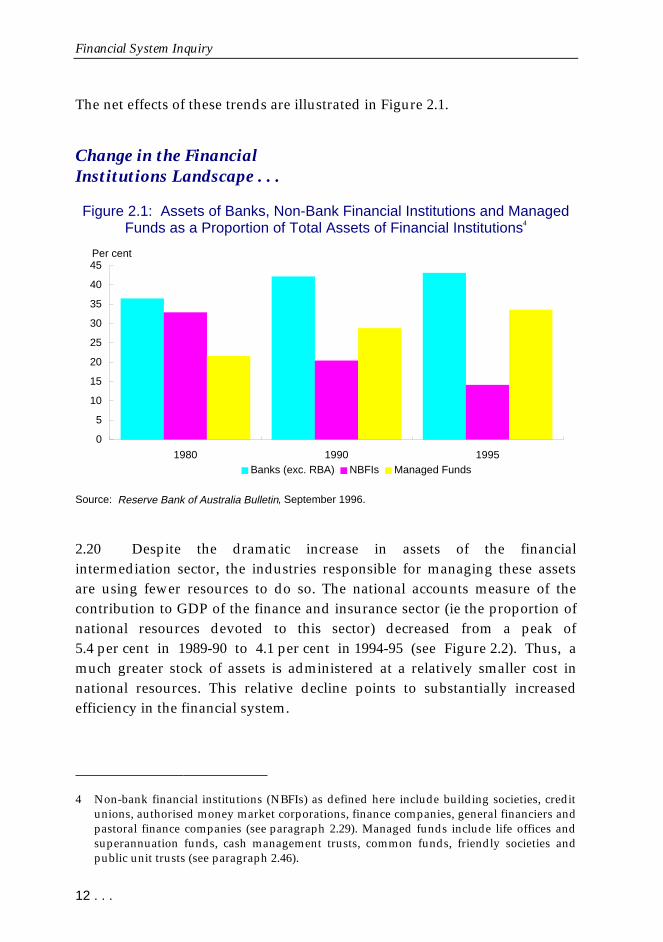
2.20 Despite the dramatic increase in assets of the financialintermediation sector, the industries responsible for managing these assetsare using fewer resources to do so. The national accounts measure of thecontribution to GDP of the finance and insurance sector (ie the proportion ofnational resources devoted to this sector) decreased from a peak of5.4 per cent in 1989-90 to 4.1 per cent in 1994-95 (see Figure 2.2). Thus, amuch greater stock of assets is administered at a relatively smaller cost innational resources. This relative decline points to substantially increasedefficiency in the financial system.
4 Non-bank financial institutions (NBFIs) as defined here include building societies, creditunions, authorised money market corporations, finance companies, general financiers andpastoral finance companies (see paragraph 2.29). Managed funds include life offices andsuperannuation funds, cash management trusts, common funds, friendly societies andpublic unit trusts (see paragraph 2.46).
Chapter 2: The Australian Financial System
. . . 13
Assets are Increasing, butResources used to Managethose Assets are Falling . . .
Figure 2.2: Assets of the Australian Financial System as a Percentage ofGDP, and Banking and Insurance Sector Contribution to GDP, 1984-1995
0
50
100
150
200
250
1984-85 1987-88 1990-91 1993-94
Per cent of GDP
0
1
2
3
4
5
6Per cent
Assets (LHS) Contribution to GDP (RHS)
Source: Australian Bureau of Statistics cat. no. 5206.0 1996; Reserve Bank of Australia Bulletin,September 1996.
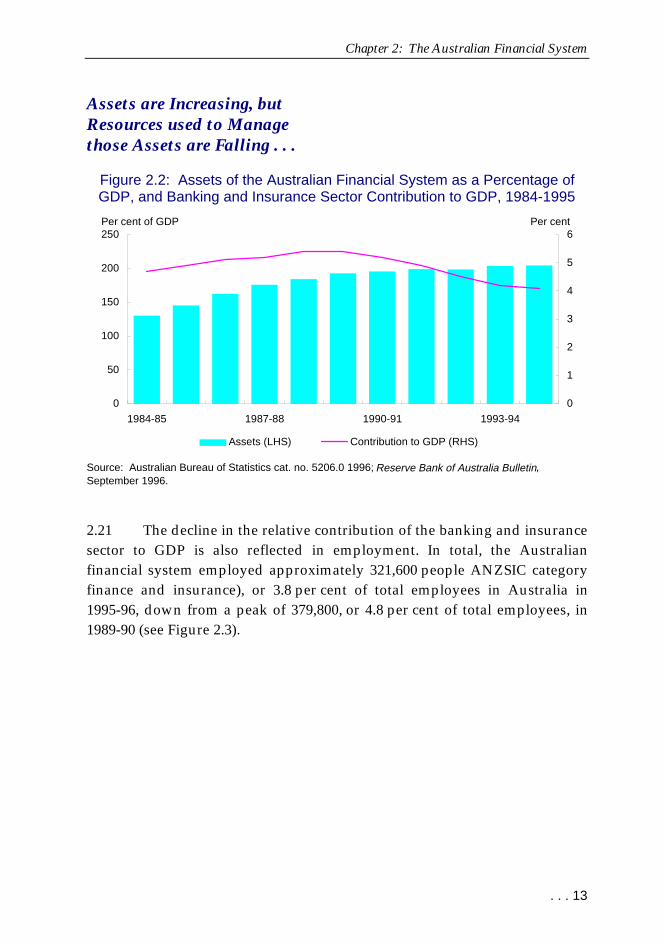
2.21 The decline in the relative contribution of the banking and insurancesector to GDP is also reflected in employment. In total, the Australianfinancial system employed approximately 321,600 people ANZSIC categoryfinance and insurance), or 3.8 per cent of total employees in Australia in1995-96, down from a peak of 379,800, or 4.8 per cent of total employees, in1989-90 (see Figure 2.3).
Financial System Inquiry
14 . . .
Falling Employmentduring the 1990s . . .
Figure 2.3: Finance and Insurance Sector Employment
0
50,000
100,000
150,000
200,000
250,000
300,000
350,000
400,000
1984-85 1986-87 1988-89 1990-91 1992-93 1994-95
Number employed
0.0
0.5
1.0
1.5
2.0
2.5
3.0
3.5
4.0
4.5
5.0
Per cent
Finance and Insurance sector employment (LHS) Per cent of total employment (RHS)
Source: Australian Bureau of Statistics cat. no. 6203.0-D 1996.
2.22 The remainder of this section provides detail on the major financialintermediaries which make up the greater part of the Australian financialsystem and on the products and services they provide. For the purposes ofthis discussion, a distinction has been drawn between deposit-takingfinancial intermediaries (which act primarily as deposit-taking and lendinginstitutions) and insurance, superannuation and managed fundsintermediaries (which act primarily as insurers or investment vehicles).In addition to summarising the structure of each sector, this section makessome limited observations on major changes, including productdevelopments, now under way in each sector.
2.23 The discussion of products and services is not comprehensive,omitting several financial services such as the provision of financial advice.The focus is on the instruments used for payments, savings, borrowings, riskmanagement and investment. These instruments are increasingly beingoffered by a wide range of intermediaries in competition with traditional andnew providers. For example, banks and insurance companies are offeringtheir customers insurance and banking products, respectively. Nevertheless,for presentational purposes, the products are discussed in the section dealing
Chapter 2: The Australian Financial System
. . . 15
with the sector which, for the time being at least, commands the largermarket share.
2.24 This discussion is restricted to retail products, which are definedbroadly as the products and services used by individual consumers andsmall businesses. It is recognised that virtually all ‘retail’ products have atleast some wholesale elements (wholesale products being defined as thoseused by larger corporations and government), and vice versa. Some detailson wholesale products are provided in the discussion of financial marketslater in this chapter.
Deposit-Taking Sector
2.25 The main institutions in the deposit-taking sector are banks andNBFIs, such as building societies and credit unions. The primary productsand services of this sector are payments and transaction services, credit anddeposit products.
Institutions
Banks
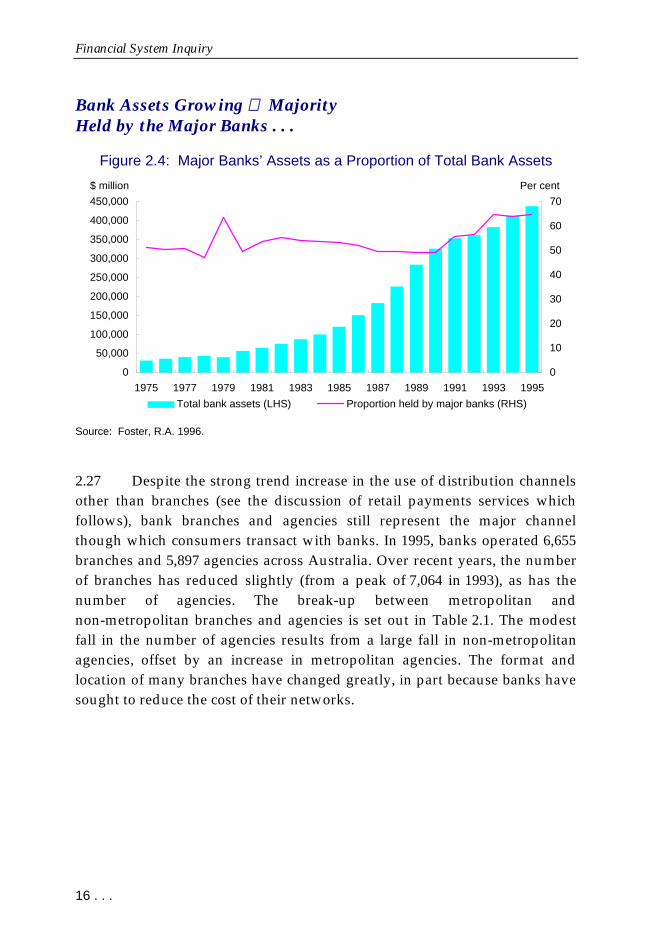
2.26 In 1995, there were 50 banks operating in Australia, including thoseentities licensed as banks under the Banking Act 1959, and the RBA. Theassets of these banks (excluding the RBA) totalled $438 billion in 1995,65 per cent of which were held by the 4 largest banks5 (see Figure 2.4).Twenty-five of the 50 organisations were foreign-owned entities,representing 13 per cent of the banking sector’s total assets.
5 From 1989 the major banks comprise the Commonwealth Bank of Australia, ANZ BankingGroup, National Australia Bank and Westpac Banking Corporation and their mainsavings bank subsidiaries. Prior to 1989 this series refers to the group known as the majortrading banks. From 1975 until 1980 there were 7 major trading banks. Between 1980 and1982 3 mergers took place, effectively leaving the 4 current major banks.
Financial System Inquiry
16 . . .
Bank Assets Growing MajorityHeld by the Major Banks . . .
Figure 2.4: Major Banks’ Assets as a Proportion of Total Bank Assets
0
50,000
100,000
150,000
200,000
250,000
300,000
350,000
400,000
450,000
1975 1977 1979 1981 1983 1985 1987 1989 1991 1993 1995
$ million
0
10
20
30
40
50
60
70
Per cent
Total bank assets (LHS) Proportion held by major banks (RHS)
Source: Foster, R.A. 1996.
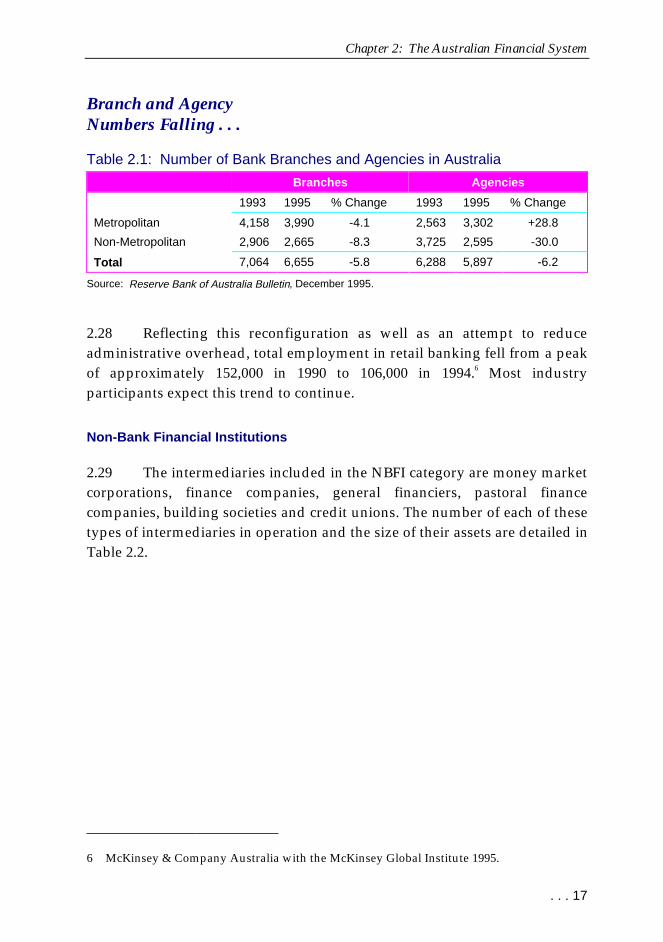
2.27 Despite the strong trend increase in the use of distribution channelsother than branches (see the discussion of retail payments services whichfollows), bank branches and agencies still represent the major channelthough which consumers transact with banks. In 1995, banks operated 6,655branches and 5,897 agencies across Australia. Over recent years, the numberof branches has reduced slightly (from a peak of 7,064 in 1993), as has thenumber of agencies. The break-up between metropolitan andnon-metropolitan branches and agencies is set out in Table 2.1. The modestfall in the number of agencies results from a large fall in non-metropolitanagencies, offset by an increase in metropolitan agencies. The format andlocation of many branches have changed greatly, in part because banks havesought to reduce the cost of their networks.
Chapter 2: The Australian Financial System
. . . 17
Branch and AgencyNumbers Falling . . .
Table 2.1: Number of Bank Branches and Agencies in Australia
Branches Agencies
1993 1995 % Change 1993 1995 % Change
Metropolitan 4,158 3,990 -4.1 2,563 3,302 +28.8
Non-Metropolitan 2,906 2,665 -8.3 3,725 2,595 -30.0
Total 7,064 6,655 -5.8 6,288 5,897 -6.2
Source: Reserve Bank of Australia Bulletin, December 1995.
2.28 Reflecting this reconfiguration as well as an attempt to reduceadministrative overhead, total employment in retail banking fell from a peakof approximately 152,000 in 1990 to 106,000 in 1994.6 Most industryparticipants expect this trend to continue.
Non-Bank Financial Institutions
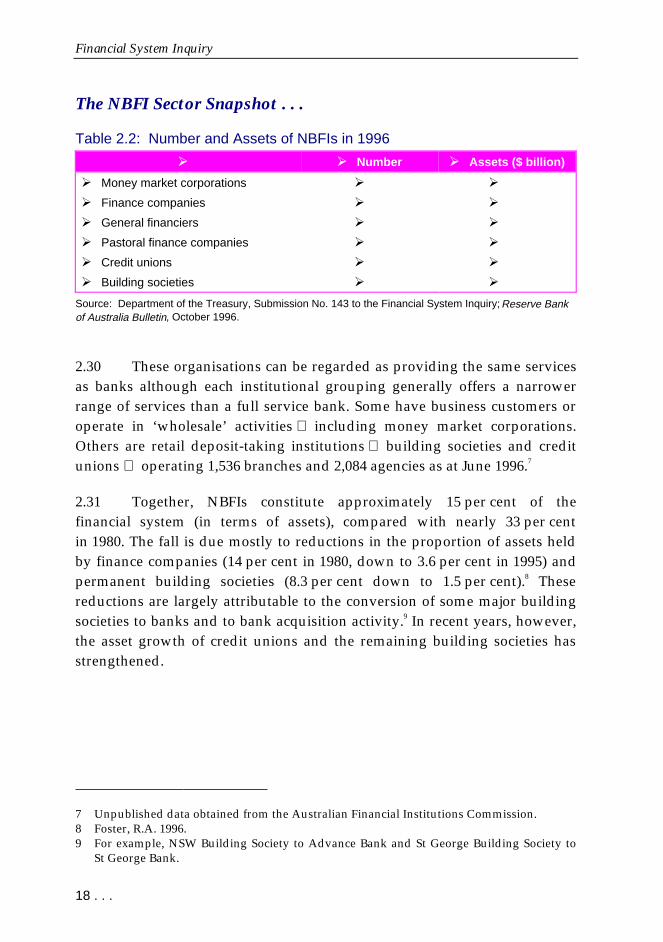
2.29 The intermediaries included in the NBFI category are money marketcorporations, finance companies, general financiers, pastoral financecompanies, building societies and credit unions. The number of each of thesetypes of intermediaries in operation and the size of their assets are detailed inTable 2.2.
6 McKinsey & Company Australia with the McKinsey Global Institute 1995.
Financial System Inquiry
18 . . .
The NBFI Sector Snapshot . . .
Table 2.2: Number and Assets of NBFIs in 1996
¾�¾� ¾�¾�Number ¾�¾�Assets ($ billion)
¾�Money market corporations ¾� ¾�
¾�Finance companies ¾� ¾�
¾�General financiers ¾� ¾�
¾�Pastoral finance companies ¾� ¾�
¾�Credit unions ¾� ¾�
¾�Building societies ¾� ¾�
Source: Department of the Treasury, Submission No. 143 to the Financial System Inquiry; Reserve Bankof Australia Bulletin, October 1996.
2.30 These organisations can be regarded as providing the same servicesas banks although each institutional grouping generally offers a narrowerrange of services than a full service bank. Some have business customers oroperate in ‘wholesale’ activities including money market corporations.Others are retail deposit-taking institutions building societies and creditunions operating 1,536 branches and 2,084 agencies as at June 1996.7
2.31 Together, NBFIs constitute approximately 15 per cent of thefinancial system (in terms of assets), compared with nearly 33 per centin 1980. The fall is due mostly to reductions in the proportion of assets heldby finance companies (14 per cent in 1980, down to 3.6 per cent in 1995) andpermanent building societies (8.3 per cent down to 1.5 per cent).8 Thesereductions are largely attributable to the conversion of some major buildingsocieties to banks and to bank acquisition activity.9 In recent years, however,the asset growth of credit unions and the remaining building societies hasstrengthened.
7 Unpublished data obtained from the Australian Financial Institutions Commission.8 Foster, R.A. 1996.9 For example, NSW Building Society to Advance Bank and St George Building Society to
St George Bank.

Chapter 2: The Australian Financial System
. . . 19
Products
2.32 Payments and settlement services, credit and deposits are the mainproducts and services provided by the deposit-taking sector. Each of these isexamined in turn below, from a retail perspective.
Payments
2.33 The deposit-taking sector provides a range of mechanisms formaking retail payments. At the retail level, payments are made by a varietyof mechanisms, most commonly cash, cheques and electronic methods, bothdirectly and by use of cards (see Table 2.3). Overwhelmingly, the greatestnumber of consumer payments are made using cash.
The Broad Shape of RetailPayments Activity . . .
Table 2.3: Number and Value of Different Payment Mechanisms
Type of Transaction No. per annum Value per annum
Cash transactions 18.0 billion (not available)
Cheque transactions 1.0 billion $7,000 billion
Direct entry transactions 0.5 billion $250 billion
Credit/debit card - cash withdrawal
- other transactions
0.5 billion
0.4 billion
$40 billion
$55 billion
Source: Mair, Peter 1995; Australian Payments Clearing Association, Submission No. 33 to the FinancialSystem Inquiry; Reserve Bank of Australia Bulletin, October 1996.
2.34 Cheques continue to play an important role as a consumer paymentsmedium. However, most of the growth in non-cash payments is in electronicmethods. These include transaction cards, both credit and debit cards, withdebit cards overtaking credit cards in usage. There has also been stronggrowth in direct entry electronic transfers, including OTC and telephone bill
Financial System Inquiry
20 . . .
payment services. As these electronic services develop further, it is possiblethat the volume and total value of cheques will fall.10
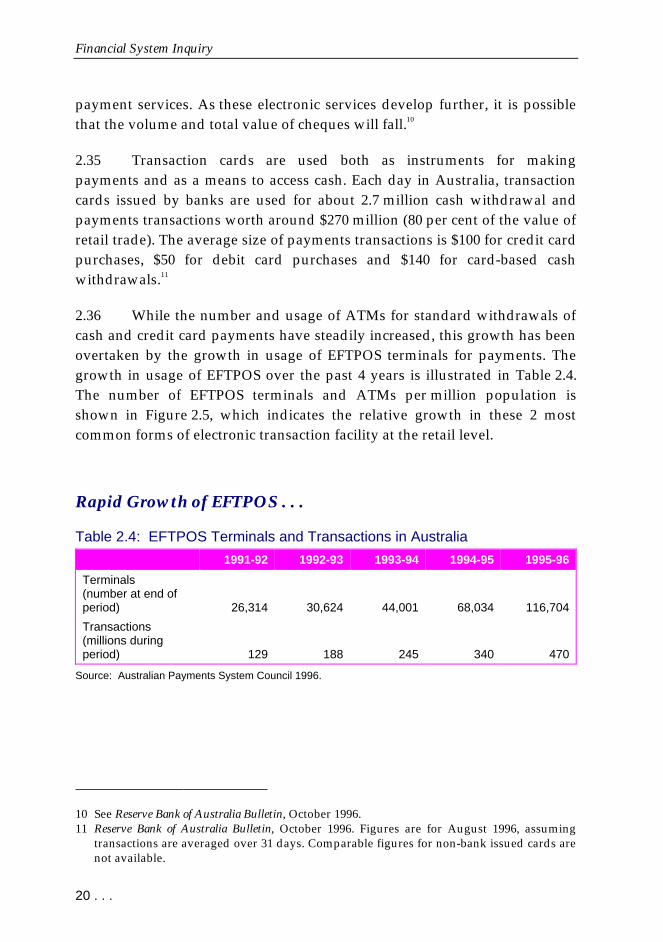
2.35 Transaction cards are used both as instruments for makingpayments and as a means to access cash. Each day in Australia, transactioncards issued by banks are used for about 2.7 million cash withdrawal andpayments transactions worth around $270 million (80 per cent of the value ofretail trade). The average size of payments transactions is $100 for credit cardpurchases, $50 for debit card purchases and $140 for card-based cashwithdrawals.11
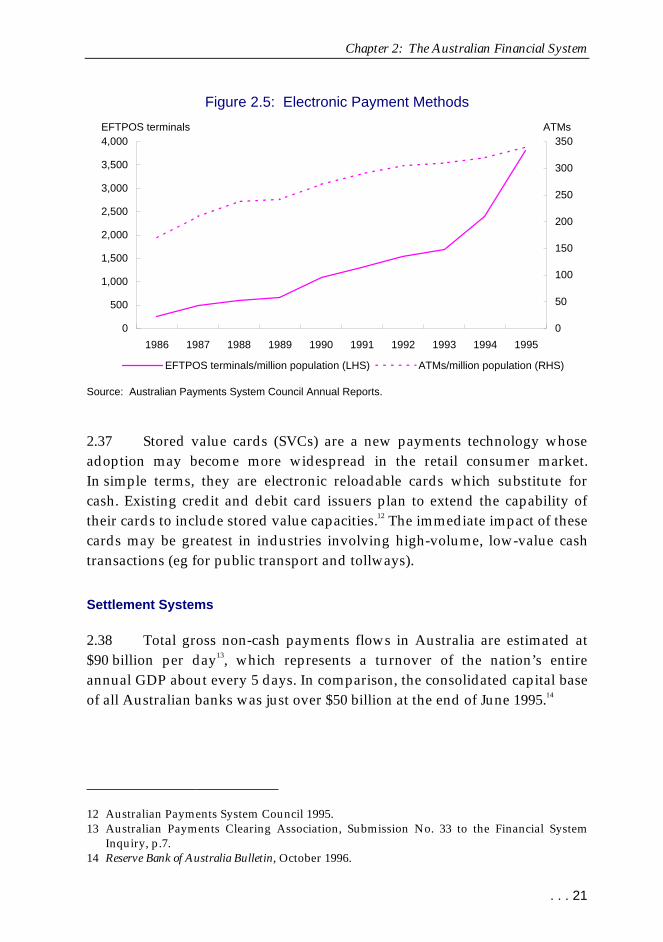
2.36 While the number and usage of ATMs for standard withdrawals ofcash and credit card payments have steadily increased, this growth has beenovertaken by the growth in usage of EFTPOS terminals for payments. Thegrowth in usage of EFTPOS over the past 4 years is illustrated in Table 2.4.The number of EFTPOS terminals and ATMs per million population isshown in Figure 2.5, which indicates the relative growth in these 2 mostcommon forms of electronic transaction facility at the retail level.
Rapid Growth of EFTPOS . . .
Table 2.4: EFTPOS Terminals and Transactions in Australia
1991-92 1992-93 1993-94 1994-95 1995-96
Terminals(number at end ofperiod) 26,314 30,624 44,001 68,034 116,704
Transactions(millions duringperiod) 129 188 245 340 470
Source: Australian Payments System Council 1996.
10 See Reserve Bank of Australia Bulletin, October 1996.11 Reserve Bank of Australia Bulletin, October 1996. Figures are for August 1996, assuming
transactions are averaged over 31 days. Comparable figures for non-bank issued cards arenot available.
Chapter 2: The Australian Financial System
. . . 21
Figure 2.5: Electronic Payment Methods
0
500
1,000
1,500
2,000
2,500
3,000
3,500
4,000
1986 1987 1988 1989 1990 1991 1992 1993 1994 1995
EFTPOS terminals
0
50
100
150
200
250
300
350ATMs
EFTPOS terminals/million population (LHS) ATMs/million population (RHS)
Source: Australian Payments System Council Annual Reports.
2.37 Stored value cards (SVCs) are a new payments technology whoseadoption may become more widespread in the retail consumer market.In simple terms, they are electronic reloadable cards which substitute forcash. Existing credit and debit card issuers plan to extend the capability oftheir cards to include stored value capacities.12 The immediate impact of thesecards may be greatest in industries involving high-volume, low-value cashtransactions (eg for public transport and tollways).
Settlement Systems
2.38 Total gross non-cash payments flows in Australia are estimated at$90 billion per day13, which represents a turnover of the nation’s entireannual GDP about every 5 days. In comparison, the consolidated capital baseof all Australian banks was just over $50 billion at the end of June 1995.14
12 Australian Payments System Council 1995.13 Australian Payments Clearing Association, Submission No. 33 to the Financial System
Inquiry, p.7.14 Reserve Bank of Australia Bulletin, October 1996.
Financial System Inquiry
22 . . .
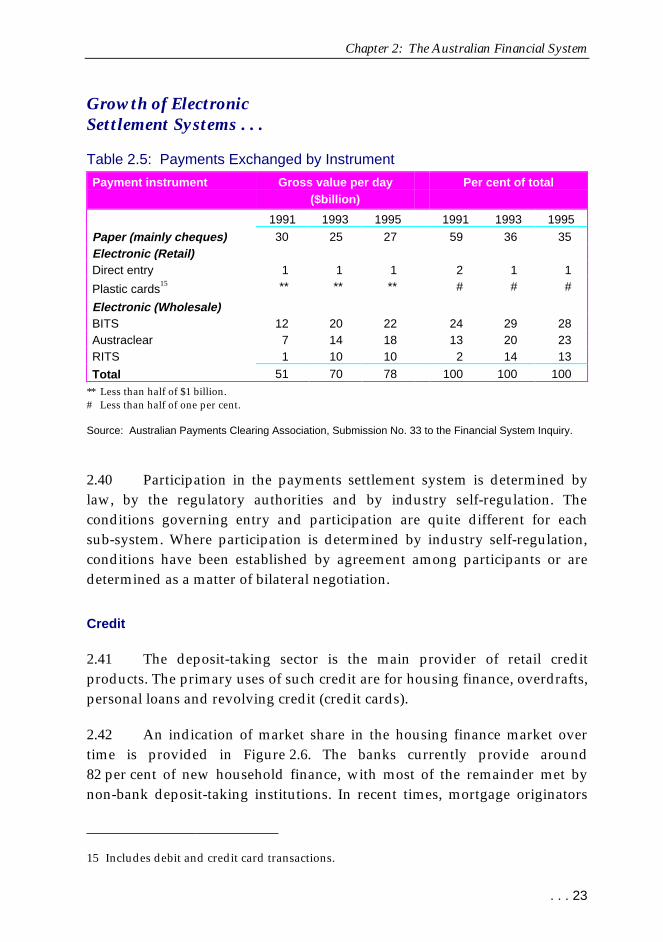
2.39 Non-cash payments (summarised in Table 2.5) are made up of thefollowing distinct sub-systems.
¾�Cheques and other paper payment instructions.
¾�Direct entry systems.
¾�Credit cards (Bankcard, Visa, MasterCard) and debit cards in use atATMs and in EFTPOS.
¾�Bank Interchange and Transfer System (BITS) a real-time,high-value electronic system which provides, by agreement,irrevocable payment for amounts of $10,000 or more. It carries alarge proportion of the Australian dollar transfer of foreignexchange settlements. BITS is jointly owned by the 4 major banksand the Colonial State Bank.
¾�Reserve Bank Information and Transfer System (RITS) whichprovides registry, depository and trading facilities forCommonwealth Government securities and incorporates a deliveryversus payment settlement facility for transfers of securitiesregistered in the system. Members of RITS include all the banks andother major traders of Commonwealth Government securities.Non-bank members (other than credit unions and building societies)must have a member bank take responsibility for their payments.
¾�Austraclear which provides registry, depository and tradingfacilities for private sector and semi-government securities.Austraclear is a public company formed in 1984 by leadingparticipants in the Australian money market. It now has 500participants.
Both RITS and Austraclear allow cash transfers unrelated tosecurity trades.
Chapter 2: The Australian Financial System
. . . 23
Growth of ElectronicSettlement Systems . . .
Table 2.5: Payments Exchanged by Instrument
Payment instrument Gross value per day($billion)
Per cent of total
1991 1993 1995 1991 1993 1995
Paper (mainly cheques) 30 25 27 59 36 35Electronic (Retail)Direct entry 1 1 1 2 1 1
Plastic cards15 ** ** ** # # #
Electronic (Wholesale)BITS 12 20 22 24 29 28Austraclear 7 14 18 13 20 23RITS 1 10 10 2 14 13
Total 51 70 78 100 100 100** Less than half of $1 billion.# Less than half of one per cent.
Source: Australian Payments Clearing Association, Submission No. 33 to the Financial System Inquiry.
2.40 Participation in the payments settlement system is determined bylaw, by the regulatory authorities and by industry self-regulation. Theconditions governing entry and participation are quite different for eachsub-system. Where participation is determined by industry self-regulation,conditions have been established by agreement among participants or aredetermined as a matter of bilateral negotiation.
Credit
2.41 The deposit-taking sector is the main provider of retail creditproducts. The primary uses of such credit are for housing finance, overdrafts,personal loans and revolving credit (credit cards).
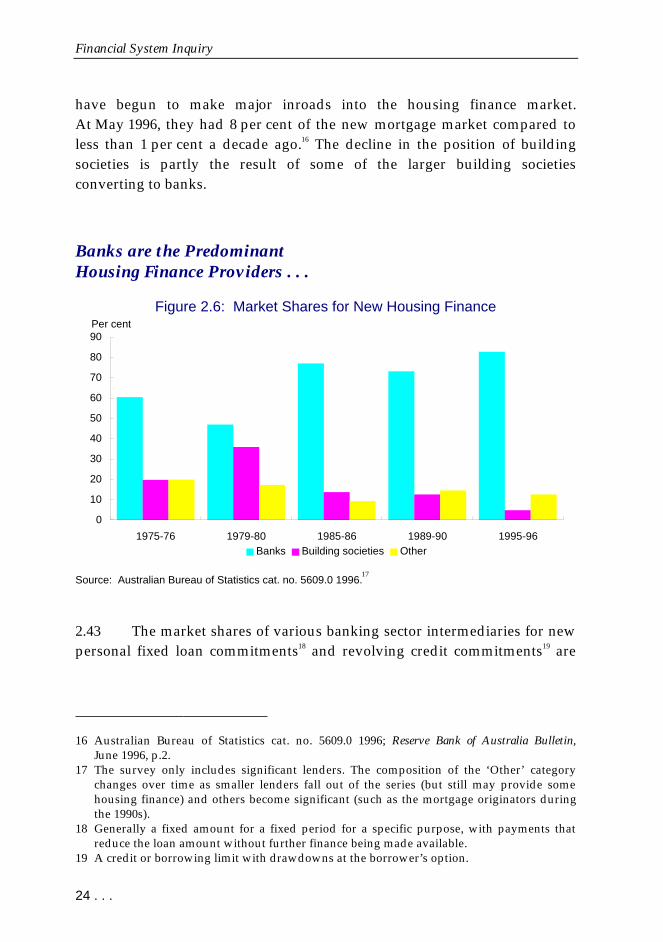
2.42 An indication of market share in the housing finance market overtime is provided in Figure 2.6. The banks currently provide around82 per cent of new household finance, with most of the remainder met bynon-bank deposit-taking institutions. In recent times, mortgage originators
15 Includes debit and credit card transactions.
Financial System Inquiry
24 . . .
have begun to make major inroads into the housing finance market.At May 1996, they had 8 per cent of the new mortgage market compared toless than 1 per cent a decade ago.16 The decline in the position of buildingsocieties is partly the result of some of the larger building societiesconverting to banks.
Banks are the PredominantHousing Finance Providers . . .
Figure 2.6: Market Shares for New Housing Finance
0
10
20
30
40
50
60
70
80
90
1975-76 1979-80 1985-86 1989-90 1995-96Banks Building societies Other
Per cent
Source: Australian Bureau of Statistics cat. no. 5609.0 1996.17
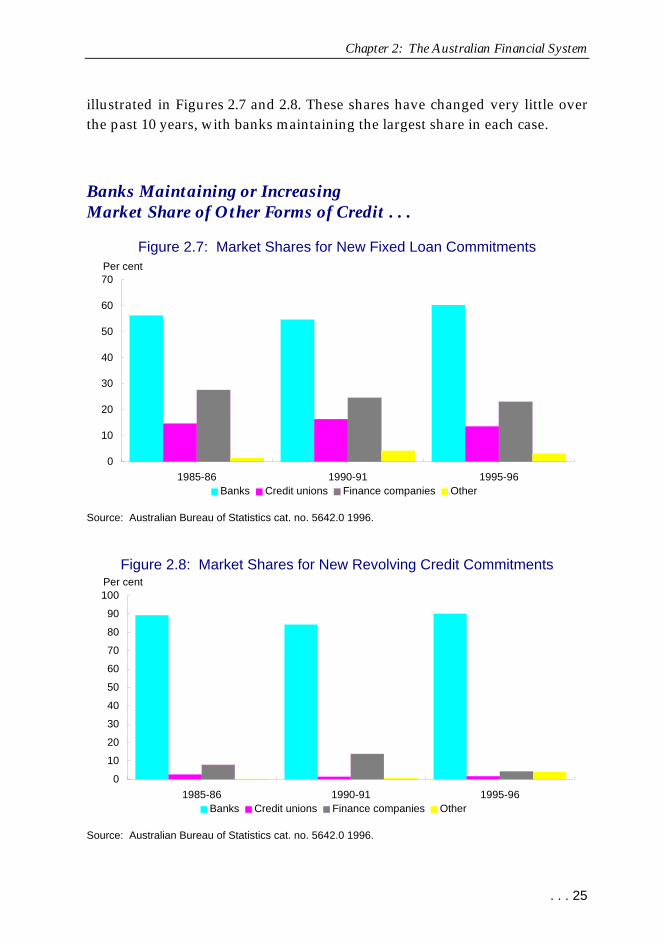
2.43 The market shares of various banking sector intermediaries for newpersonal fixed loan commitments18 and revolving credit commitments19 are
16 Australian Bureau of Statistics cat. no. 5609.0 1996; Reserve Bank of Australia Bulletin,June 1996, p.2.
17 The survey only includes significant lenders. The composition of the ‘Other’ categorychanges over time as smaller lenders fall out of the series (but still may provide somehousing finance) and others become significant (such as the mortgage originators duringthe 1990s).
18 Generally a fixed amount for a fixed period for a specific purpose, with payments thatreduce the loan amount without further finance being made available.
19 A credit or borrowing limit with drawdowns at the borrower’s option.
Chapter 2: The Australian Financial System
. . . 25
illustrated in Figures 2.7 and 2.8. These shares have changed very little overthe past 10 years, with banks maintaining the largest share in each case.
Banks Maintaining or IncreasingMarket Share of Other Forms of Credit . . .
Figure 2.7: Market Shares for New Fixed Loan Commitments
0
10
20
30
40
50
60
70
1985-86 1990-91 1995-96Banks Credit unions Finance companies Other
Per cent
Source: Australian Bureau of Statistics cat. no. 5642.0 1996.
Figure 2.8: Market Shares for New Revolving Credit Commitments
0
10
20
30
40
50
60
70
80
90
100
1985-86 1990-91 1995-96Banks Credit unions Finance companies Other
Per cent
Source: Australian Bureau of Statistics cat. no. 5642.0 1996.
Financial System Inquiry
26 . . .
Deposits
2.44 As with personal loans and revolving credit, the supply of depositproducts has been dominated traditionally by banks (see Table 2.6). Thedecline in the share of building societies over the period 1981 to 1995 islargely attributable to the conversion of building societies to banks in thepost-deregulation era.
Banks Hold the Majorityof Deposits . . .
Table 2.6: Percentage Share of Deposits: June 1981 and February 1995
June 1981 February 1995
Banks 74.0 79.6
Building societies 22.7 8.4
Credit unions 3.3 8.2
Cash management trusts -- 3.8
Source: Prices Surveillance Authority 1995.
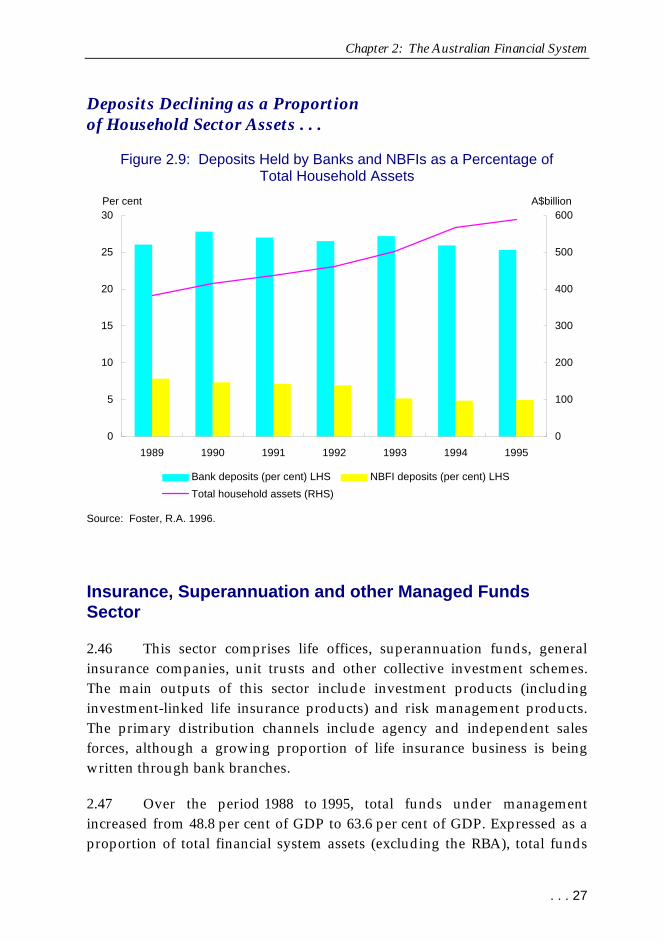
2.45 Deposits remain a large but declining proportion of total financialassets of the household sector (see Figure 2.9). Over the period 1989 to 1995,while total household financial assets increased from $382 billion to$590 billion, deposits fell from 33.9 per cent to 30.3 per cent of totalhousehold assets.
Chapter 2: The Australian Financial System
. . . 27
Deposits Declining as a Proportionof Household Sector Assets . . .
Figure 2.9: Deposits Held by Banks and NBFIs as a Percentage ofTotal Household Assets
0
5
10
15
20
25
30
1989 1990 1991 1992 1993 1994 1995
Per cent
0
100
200
300
400
500
600A$billion
Bank deposits (per cent) LHS NBFI deposits (per cent) LHS
Total household assets (RHS)
Source: Foster, R.A. 1996.
Insurance, Superannuation and other Managed FundsSector
2.46 This sector comprises life offices, superannuation funds, generalinsurance companies, unit trusts and other collective investment schemes.The main outputs of this sector include investment products (includinginvestment-linked life insurance products) and risk management products.The primary distribution channels include agency and independent salesforces, although a growing proportion of life insurance business is beingwritten through bank branches.
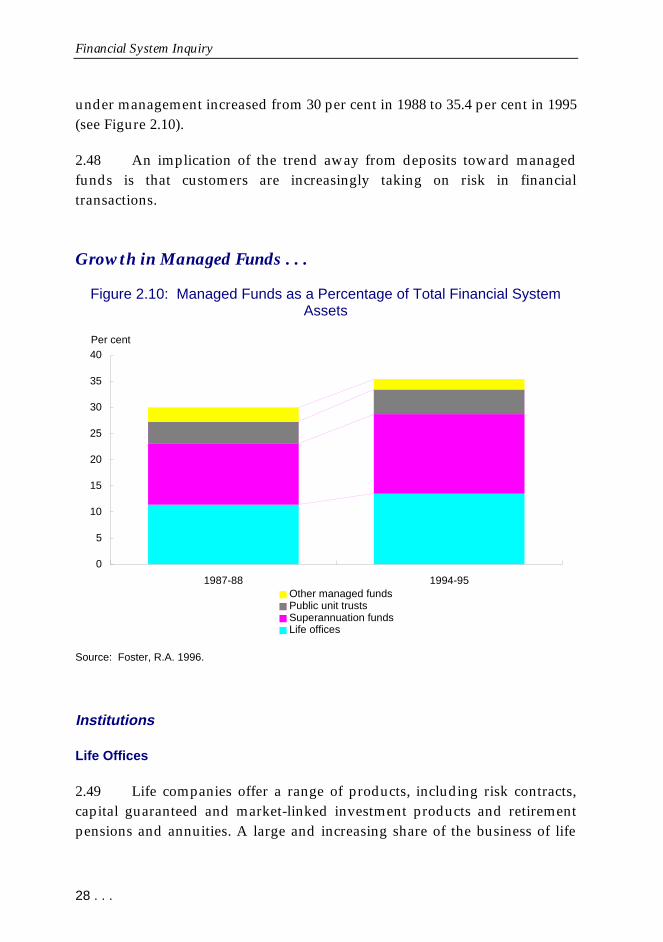
2.47 Over the period 1988 to 1995, total funds under managementincreased from 48.8 per cent of GDP to 63.6 per cent of GDP. Expressed as aproportion of total financial system assets (excluding the RBA), total funds
Financial System Inquiry
28 . . .
under management increased from 30 per cent in 1988 to 35.4 per cent in 1995(see Figure 2.10).
2.48 An implication of the trend away from deposits toward managedfunds is that customers are increasingly taking on risk in financialtransactions.
Growth in Managed Funds . . .
Figure 2.10: Managed Funds as a Percentage of Total Financial SystemAssets
0
5
10
15
20
25
30
35
40
1987-88 1994-95
Per cent
Other managed fundsPublic unit trustsSuperannuation fundsLife offices
Source: Foster, R.A. 1996.
Institutions
Life Offices
2.49 Life companies offer a range of products, including risk contracts,capital guaranteed and market-linked investment products and retirementpensions and annuities. A large and increasing share of the business of life
Chapter 2: The Australian Financial System
. . . 29
offices comprises superannuation business, which is conducted at bothwholesale and retail levels.
2.50 Until the early 1970s, mortgage loans (generally fixed interest) werealso part of the product range of life offices. Their involvement in this marketreflected (among other things) the inability of banks to satisfy marketdemand and also the relatively early stage of development of alternativemortgage providers. Life offices were able to link their loans withwhole-of-life policies which benefited from generous tax treatment. Totaldirect lending by life offices has declined steadily from around 40 per cent ofassets in the late 1950s to around 7 per cent at present.20
2.51 Until recently, large mutual life insurance companies held morethan half of the industry’s market share, but some of these have nowdemutualised or announced plans to do so. At December 1995, the 3 largestlife insurance groups accounted for 52 per cent of the industry’s Australianassets. The top 10 groups of companies account for about 80 per cent ofindustry assets.
2.52 In all, there were 51 registered life insurance companies in Australiaas at 30 December 1995, with $124 billion or around 14 per cent of totalfinancial sector assets. Superannuation business accounted for $91 billion inassets held in statutory funds (or about 70 per cent), while $33 billion wasordinary life insurance business.21
2.53 Bank-owned life offices have increased market share greatly in thepast five years. Total life premiums sold through bank-owned life officesincreased from 9 per cent in March 1991 to 24 per cent in March 1996.Bank-owned life offices now account for 37 per cent of all single-premiumlife business (eg term insurance) but only 4 per cent of annual-premiumbusiness.22 Banks have been able to obtain this share by utilising their existingbranch networks as the major distribution mechanism.
20 Edey, Malcolm & Gray, Brian 1996.21 Insurance and Superannuation Commission, Submission No. 53 to the Financial System
Inquiry, p.33.22 Unpublished data obtained fron the Insurance and Superannuation Commission, sourced
from the Quarterly Statistical Bulletin.
Financial System Inquiry
30 . . .
Superannuation Funds
2.54 In June 1996, there were around 140,000 superannuation fundsregistered in Australia. Most of these (130,000) are very small self-managedor ‘do-it-yourself’ funds with fewer than 5 beneficiaries. The largest1 per cent of funds represent 85 per cent of the superannuation industry’stotal assets. These funds are larger employer-sponsored, public sector,industry or public offer funds.23
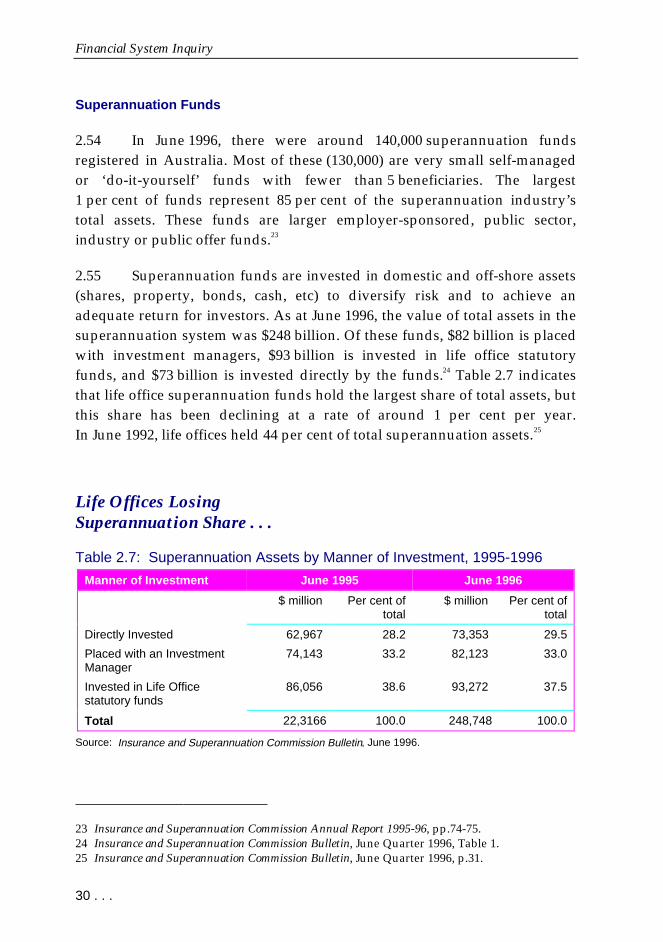
2.55 Superannuation funds are invested in domestic and off-shore assets(shares, property, bonds, cash, etc) to diversify risk and to achieve anadequate return for investors. As at June 1996, the value of total assets in thesuperannuation system was $248 billion. Of these funds, $82 billion is placedwith investment managers, $93 billion is invested in life office statutoryfunds, and $73 billion is invested directly by the funds.24 Table 2.7 indicatesthat life office superannuation funds hold the largest share of total assets, butthis share has been declining at a rate of around 1 per cent per year.In June 1992, life offices held 44 per cent of total superannuation assets.25
Life Offices LosingSuperannuation Share . . .
Table 2.7: Superannuation Assets by Manner of Investment, 1995-1996
Manner of Investment June 1995 June 1996
$ million Per cent oftotal
$ million Per cent oftotal
Directly Invested 62,967 28.2 73,353 29.5
Placed with an InvestmentManager
74,143 33.2 82,123 33.0
Invested in Life Officestatutory funds
86,056 38.6 93,272 37.5
Total 22,3166 100.0 248,748 100.0
Source: Insurance and Superannuation Commission Bulletin, June 1996.
23 Insurance and Superannuation Commission Annual Report 1995-96, pp.74-75.24 Insurance and Superannuation Commission Bulletin, June Quarter 1996, Table 1.25 Insurance and Superannuation Commission Bulletin, June Quarter 1996, p.31.
Chapter 2: The Australian Financial System
. . . 31
General Insurance
2.56 The term general insurance encompasses both direct underwritersand reinsurers writing risks such as property, injury, compulsory third-partyinsurance and workers' compensation, but does not include health insurance.Some remain in public ownership. In total, there are 177 general insurancecompanies, with total assets of about $55 billion. The longer-term trendevident since the 1970s is for fewer institutions, as low returns on capitalhave encouraged mergers and rationalisations within the industry.26 In recenttimes, most of the State Government-owned insurance companies have beenprivatised.
Other Managed Funds (excluding Insurance and Superannuation)
2.57 As at June 1995, approximately $63 billion of managed funds existedoutside the insurance and superannuation sectors. This sector comprises over420 public unit trusts ($41 billion assets), over 200 friendly societies($9 billion assets), 14 common funds ($4 billion assets) and 20 cashmanagement trusts ($6 billion assets).27
2.58 Public unit trusts have experienced major growth during the 1990s.Between June 1990, when the assets of public unit trusts stood at$27.7 billion, and June 1995, the assets of this segment increased bysome 49 per cent. This compares favourably with increases of 6 per cent byfriendly societies and 20 per cent by cash management trusts. 28
Products
Retail Investment and Retirement Products
2.59 Several trends have emerged in markets for retail investment andretirement products, generally driven by taxation and regulatory changes.One notable trend, and one which is likely to continue, is the huge growth in
26 Insurance and Superannuation Commission Annual Report 1994-95, p.31.27 Insurance and Superannuation Commission, Submission No. 53 to the Financial System
Inquiry, Appendix A; and Foster, R.A. 1996.28 Foster, R.A. 1996.

Financial System Inquiry
32 . . .
superannuation, driven largely by a Government social objective to increaseprivate saving through various measures, including tax concessions. Thestock of superannuation assets is growing at twice the rate of growth in theeconomy. Superannuation assets are expected to grow from $240 billion nowto around $500 billion (in real terms) by the year 2005.29
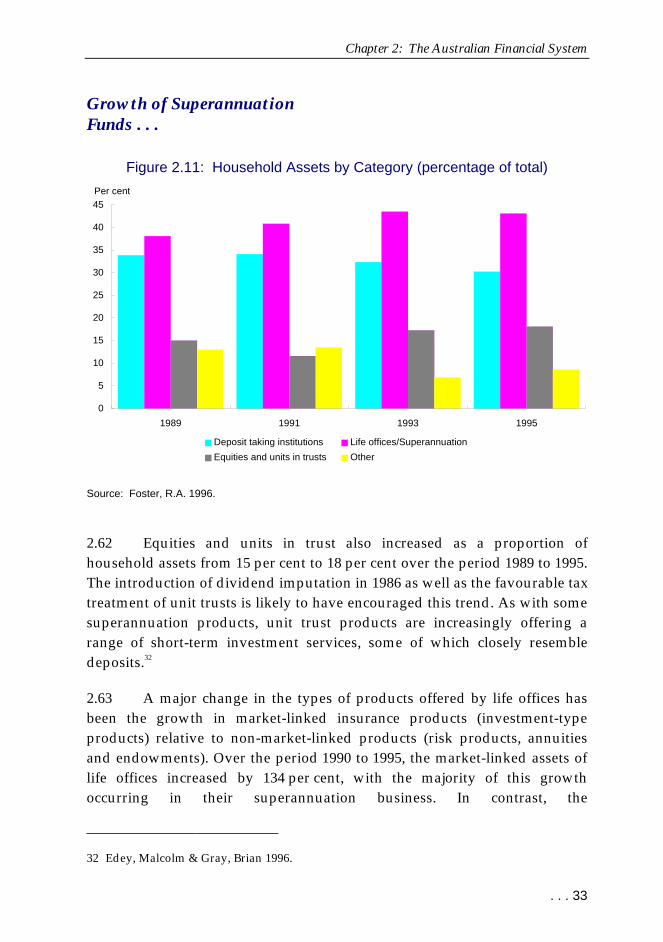
2.60 This trend is reflected in changes in the composition of householdassets over the period 1989 to 1995 (see Figure 2.11). Life office andsuperannuation products rose from 38.1 per cent in 1989 to 43.1 per cent oftotal household sector assets in 1995, primarily because of the growth in thesuperannuation segment, while holdings of deposit-taking institutions fellfrom 33.9 per cent to 30.3 per cent over the same period. Most of the growthin superannuation assets is attributable to variations in the earnings andcapital gains of superannuation assets rather than to increasedcontributions.30
2.61 In addition, there is some substitution of superannuation productsfor the short-term saving products of deposit-taking institutions, as thesuperannuation sector has become a major holder of the short-term savingsof retirees. Increasing rates of early retirement, the wide availability oflump-sum retirement benefits and the advent of rollover funds haveencouraged this. 31
29 Allen Consulting Group 1996, p.38.30 Edey, Malcolm & Gray, Brian 1996.31 Edey, Malcolm & Gray, Brian 1996.
Chapter 2: The Australian Financial System
. . . 33
Growth of SuperannuationFunds . . .
Figure 2.11: Household Assets by Category (percentage of total)
0
5
10
15
20
25
30
35
40
45
1989 1991 1993 1995
Per cent
Deposit taking institutions Life offices/Superannuation
Equities and units in trusts Other
Source: Foster, R.A. 1996.
2.62 Equities and units in trust also increased as a proportion ofhousehold assets from 15 per cent to 18 per cent over the period 1989 to 1995.The introduction of dividend imputation in 1986 as well as the favourable taxtreatment of unit trusts is likely to have encouraged this trend. As with somesuperannuation products, unit trust products are increasingly offering arange of short-term investment services, some of which closely resembledeposits.32
2.63 A major change in the types of products offered by life offices hasbeen the growth in market-linked insurance products (investment-typeproducts) relative to non-market-linked products (risk products, annuitiesand endowments). Over the period 1990 to 1995, the market-linked assets oflife offices increased by 134 per cent, with the majority of this growthoccurring in their superannuation business. In contrast, the
32 Edey, Malcolm & Gray, Brian 1996.
Financial System Inquiry
34 . . .
non-market-linked assets of life offices increased by only 4 per cent over thesame period, with those assets relating to the ordinary business falling byabout 6 per cent.
Risk-Related Products
2.64 At the retail level, the primary suppliers of risk-related products arelife and general insurance companies.
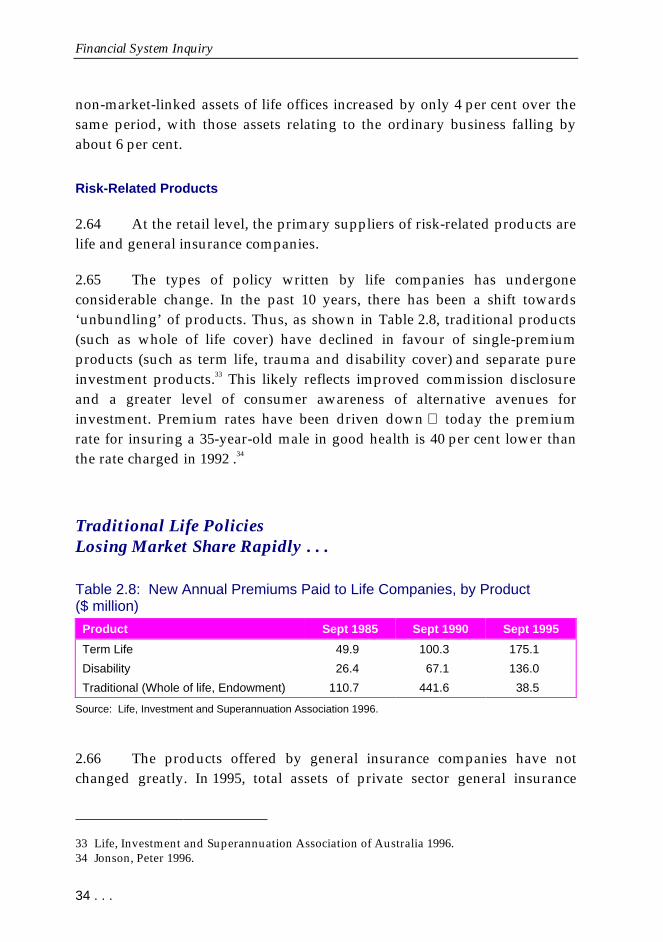
2.65 The types of policy written by life companies has undergoneconsiderable change. In the past 10 years, there has been a shift towards‘unbundling’ of products. Thus, as shown in Table 2.8, traditional products(such as whole of life cover) have declined in favour of single-premiumproducts (such as term life, trauma and disability cover) and separate pureinvestment products.33 This likely reflects improved commission disclosureand a greater level of consumer awareness of alternative avenues forinvestment. Premium rates have been driven down today the premiumrate for insuring a 35-year-old male in good health is 40 per cent lower thanthe rate charged in 1992 .34
Traditional Life PoliciesLosing Market Share Rapidly . . .
Table 2.8: New Annual Premiums Paid to Life Companies, by Product($ million)
Product Sept 1985 Sept 1990 Sept 1995
Term Life 49.9 100.3 175.1
Disability 26.4 67.1 136.0
Traditional (Whole of life, Endowment) 110.7 441.6 38.5
Source: Life, Investment and Superannuation Association 1996.
2.66 The products offered by general insurance companies have notchanged greatly. In 1995, total assets of private sector general insurance
33 Life, Investment and Superannuation Association of Australia 1996.34 Jonson, Peter 1996.
Chapter 2: The Australian Financial System
. . . 35
companies stood at $34.1 billion, with another $19.2 billion in public sectorinsurers (compared to $21.4 billion in 1992).35 Premium income stood at$12.2 billion ($7.8 billion in 1992) for private sector insurers, the bulk (nearly40 per cent) provided by motor vehicle and domestic household insurance.
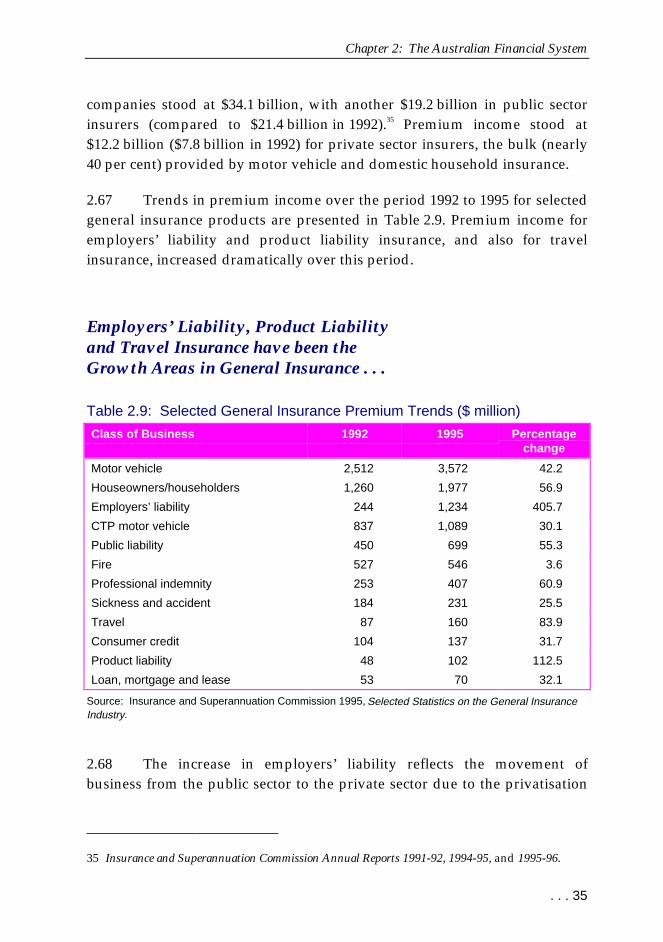
2.67 Trends in premium income over the period 1992 to 1995 for selectedgeneral insurance products are presented in Table 2.9. Premium income foremployers’ liability and product liability insurance, and also for travelinsurance, increased dramatically over this period.
Employers’ Liability, Product Liabilityand Travel Insurance have been theGrowth Areas in General Insurance . . .
Table 2.9: Selected General Insurance Premium Trends ($ million)
Class of Business 1992 1995 Percentagechange
Motor vehicle 2,512 3,572 42.2
Houseowners/householders 1,260 1,977 56.9
Employers’ liability 244 1,234 405.7
CTP motor vehicle 837 1,089 30.1
Public liability 450 699 55.3
Fire 527 546 3.6
Professional indemnity 253 407 60.9
Sickness and accident 184 231 25.5
Travel 87 160 83.9
Consumer credit 104 137 31.7
Product liability 48 102 112.5
Loan, mortgage and lease 53 70 32.1
Source: Insurance and Superannuation Commission 1995, Selected Statistics on the General InsuranceIndustry.
2.68 The increase in employers’ liability reflects the movement ofbusiness from the public sector to the private sector due to the privatisation
35 Insurance and Superannuation Commission Annual Reports 1991-92, 1994-95, and 1995-96.
Financial System Inquiry
36 . . .
of Government Insurance Offices (GIOs) New South Wales and Victorianemployers’ liability arrangements in 1992.36 The observed growth in productliability insurance coincided with the introduction in 1992 of a more stringentproduct liability regime under the Trade Practices Act 1974. Travel insurancehas traditionally generated relatively large premium income for generalinsurance companies.
Distribution
2.69 Until recently, the primary distribution channel for life offices hasbeen the ‘ tied’ agency sales force. However, in recent years, the number ofagents has decreased, as insurers have sought to consolidate their agencyrelationships and seek alternative distribution methods. The Life InsuranceMarketing and Research Association estimates that the number of agentsdeclined from 20,000 in 1988 to around 5,000 by 1995. Around half of newbusiness written by life offices is now distributed through investmentadvisers and securities dealers, multi-agents (ie agents for more than onecompany) and bank branches (which operate as distribution channels for thebanks’ subsidiary life offices).37 In many cases, new life business is beinggenerated through packaging with superannuation products.
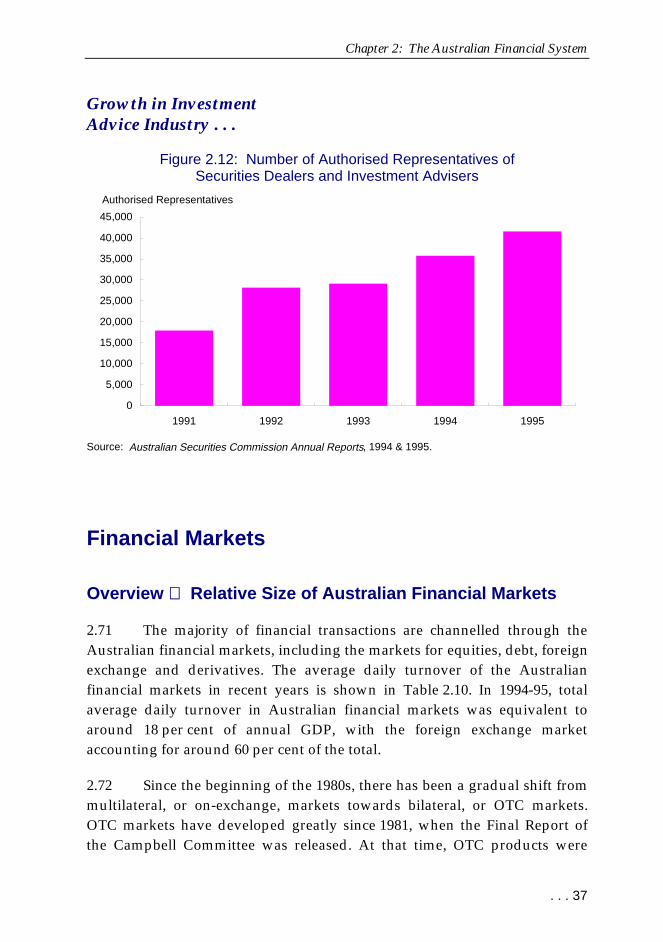
2.70 While the number of life agents has been declining, the number ofauthorised representatives of securities dealers and of investment advisershas increased. The number of authorised representatives increasedfrom 17,914 at 30 June 1991 to 41,471 at 30 June 1995 (see Figure 2.12).Conversely, the number of licensed securities dealers and investmentadvisers fell marginally over the same period, from 1,803 to 1,640.
36 Insurance and Superannuation Commission Annual Reports 1991-92, 1994-95, and 1995-96.37 Insurance and Superannuation Commission, Submission No. 53 to the Financial System
Inquiry, p.35.
Chapter 2: The Australian Financial System
. . . 37
Growth in InvestmentAdvice Industry . . .
Figure 2.12: Number of Authorised Representatives ofSecurities Dealers and Investment Advisers
0
5,000
10,000
15,000
20,000
25,000
30,000
35,000
40,000
45,000
1991 1992 1993 1994 1995
Authorised Representatives
Source: Australian Securities Commission Annual Reports, 1994 & 1995.
Financial Markets
Overview Relative Size of Australian Financial Markets
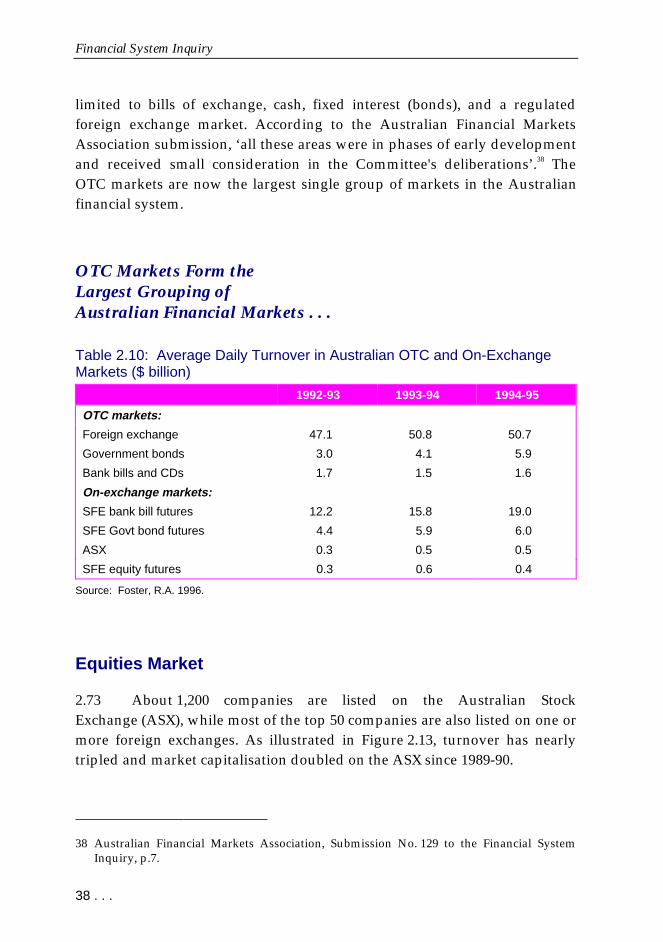
2.71 The majority of financial transactions are channelled through theAustralian financial markets, including the markets for equities, debt, foreignexchange and derivatives. The average daily turnover of the Australianfinancial markets in recent years is shown in Table 2.10. In 1994-95, totalaverage daily turnover in Australian financial markets was equivalent toaround 18 per cent of annual GDP, with the foreign exchange marketaccounting for around 60 per cent of the total.
2.72 Since the beginning of the 1980s, there has been a gradual shift frommultilateral, or on-exchange, markets towards bilateral, or OTC markets.OTC markets have developed greatly since 1981, when the Final Report ofthe Campbell Committee was released. At that time, OTC products were
Financial System Inquiry
38 . . .
limited to bills of exchange, cash, fixed interest (bonds), and a regulatedforeign exchange market. According to the Australian Financial MarketsAssociation submission, ‘all these areas were in phases of early developmentand received small consideration in the Committee's deliberations’ .38 TheOTC markets are now the largest single group of markets in the Australianfinancial system.
OTC Markets Form theLargest Grouping ofAustralian Financial Markets . . .
Table 2.10: Average Daily Turnover in Australian OTC and On-ExchangeMarkets ($ billion)
1992-93 1993-94 1994-95
OTC markets:
Foreign exchange 47.1 50.8 50.7
Government bonds 3.0 4.1 5.9
Bank bills and CDs 1.7 1.5 1.6
On-exchange markets:
SFE bank bill futures 12.2 15.8 19.0
SFE Govt bond futures 4.4 5.9 6.0
ASX 0.3 0.5 0.5
SFE equity futures 0.3 0.6 0.4
Source: Foster, R.A. 1996.
Equities Market
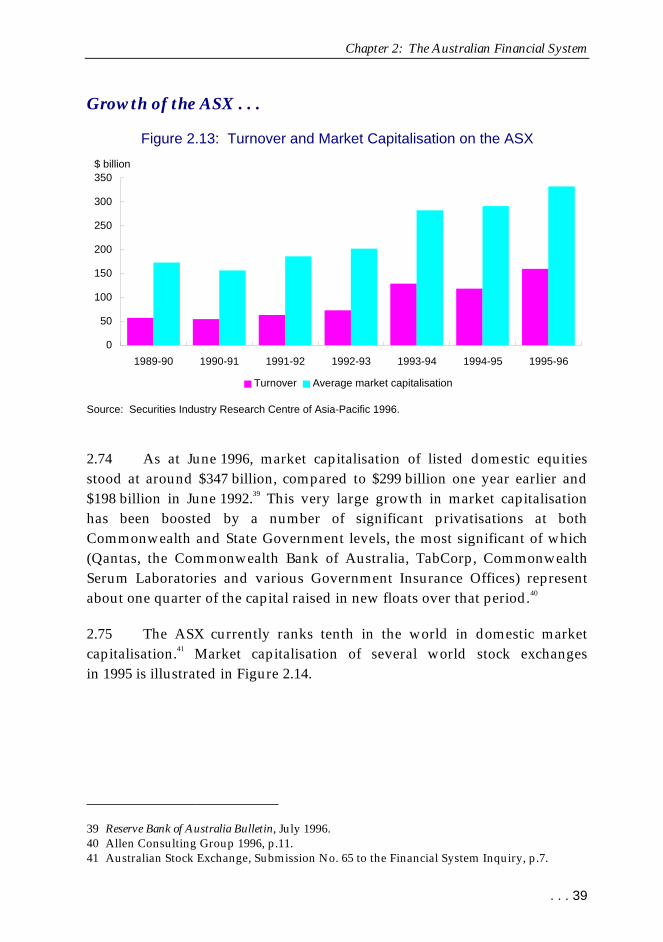
2.73 About 1,200 companies are listed on the Australian StockExchange (ASX), while most of the top 50 companies are also listed on one ormore foreign exchanges. As illustrated in Figure 2.13, turnover has nearlytripled and market capitalisation doubled on the ASX since 1989-90.
38 Australian Financial Markets Association, Submission No. 129 to the Financial SystemInquiry, p.7.
Chapter 2: The Australian Financial System
. . . 39
Growth of the ASX . . .
Figure 2.13: Turnover and Market Capitalisation on the ASX
0
50
100
150
200
250
300
350
1989-90 1990-91 1991-92 1992-93 1993-94 1994-95 1995-96
$ billion
Turnover Average market capitalisation
Source: Securities Industry Research Centre of Asia-Pacific 1996.
2.74 As at June 1996, market capitalisation of listed domestic equitiesstood at around $347 billion, compared to $299 billion one year earlier and$198 billion in June 1992.39 This very large growth in market capitalisationhas been boosted by a number of significant privatisations at bothCommonwealth and State Government levels, the most significant of which(Qantas, the Commonwealth Bank of Australia, TabCorp, CommonwealthSerum Laboratories and various Government Insurance Offices) representabout one quarter of the capital raised in new floats over that period.40
2.75 The ASX currently ranks tenth in the world in domestic marketcapitalisation.41 Market capitalisation of several world stock exchangesin 1995 is illustrated in Figure 2.14.
39 Reserve Bank of Australia Bulletin, July 1996.40 Allen Consulting Group 1996, p.11.41 Australian Stock Exchange, Submission No. 65 to the Financial System Inquiry, p.7.

Financial System Inquiry
40 . . .
ASX is Small in Global Terms . . .
Figure 2.14: Market Capitalisation of Selected Stock Exchanges 1995
0
1,000
2,000
3,000
4,000
5,000
6,000
New York Tokyo London Toronto Germany HongKong
Australia KualaLumpur
Taiwan Korea
US$ billion
Source: Securities Industry Research Centre of Asia-Pacific 1996.
Debt or ‘Bond ’ Markets
2.76 The debt or bond markets include the markets for short-term banksecurities (such as bank bills), Treasury notes, and State Government andprivate commercial paper. The markets for long-term securities tend to bedominated by government bonds, but also include mortgage-backedsecurities and corporate bonds. The size of the Australian bond marketin 1994 was estimated at US$88 billion (around $120 billion).42
42 Allen Consulting Group & Arthur Andersen 1996, p.56. The Australian dollar equivalentwas calculated using the end June 1994 exchange rate.
Chapter 2: The Australian Financial System
. . . 41
2.77 As in all major bond markets, government debt securities form thelargest and most liquid segment of the Australian bond market. As atDecember 1995, Commonwealth Government securities on issue had anoutstanding value of $113.2 billion, and State and local government debt anoutstanding value of $93.5 billion.43 Consistent with changes in the homelending market, securitised mortgages appear to be an emerging segment ofthe debt markets.
2.78 The corporate debt market, on the other hand, is relativelyundeveloped. The Allen Consulting Group has observed that ‘ it is not atpresent worthwhile for a corporate to undertake a major public debt issue inAustralia, and the overheads involved, and the need to establish significantdepth and liquidity quickly, present formidable challenges to thedevelopment of a major corporate debt market here’ .44
2.79 The major holders of debt securities are financial institutions such asbanks, insurance companies and the funds management industry. The majortraders of debt securities in Australia are commercial banks, authorised bonddealers and money market corporations.
Derivatives Markets
2.80 Derivatives trading in Australia includes trading on OTC markets oron-exchange.
¾�OTC derivatives are flexible and can be customised to meet eachparty’s specific needs, though at the cost of higher counterparty andoperational risks and lower liquidity. Legal risks on OTC marketsare usually reduced by the use of International Swaps andDerivatives Association or similar standardised documentation.
¾�Exchange traded derivatives provide standardised terms,guaranteed settlement, and novation. These characteristics helpgenerate market liquidity. The markets in Australia comprise the
43 Australian Bureau of Statistics cat. no. 5232.0 1996.44 Allen Consulting Group 1996, p.6.
Financial System Inquiry
42 . . .
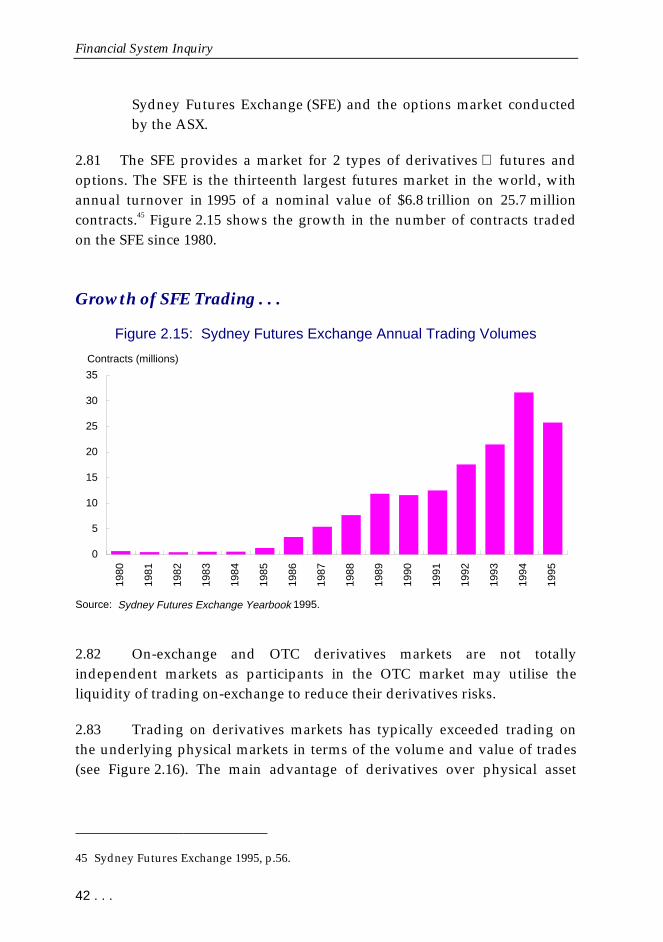
Sydney Futures Exchange (SFE) and the options market conductedby the ASX.
2.81 The SFE provides a market for 2 types of derivatives futures andoptions. The SFE is the thirteenth largest futures market in the world, withannual turnover in 1995 of a nominal value of $6.8 trillion on 25.7 millioncontracts.45 Figure 2.15 shows the growth in the number of contracts tradedon the SFE since 1980.
Growth of SFE Trading . . .
Figure 2.15: Sydney Futures Exchange Annual Trading Volumes
0
5
10
15
20
25
30
35
1980
1981
1982
1983
1984
1985
1986
1987
1988
1989
1990
1991
1992
1993
1994
1995
Contracts (millions)
Source: Sydney Futures Exchange Yearbook 1995.
2.82 On-exchange and OTC derivatives markets are not totallyindependent markets as participants in the OTC market may utilise theliquidity of trading on-exchange to reduce their derivatives risks.
2.83 Trading on derivatives markets has typically exceeded trading onthe underlying physical markets in terms of the volume and value of trades(see Figure 2.16). The main advantage of derivatives over physical asset
45 Sydney Futures Exchange 1995, p.56.

Chapter 2: The Australian Financial System
. . . 43
trading is that derivatives can be traded at lower cost and with a smallerinitial outlay.46
Derivatives Trading ExceedsUnderlying Physical Trading . . .
Figure 2.16: 1994 Annual Turnover in Derivatives and Underlying PhysicalMarkets as a Multiple of GDP
0
2
4
6
8
10
12
Money Market Govt Bonds Equity
Multiples of GDP
Physical Derivatives
Source: International Banks and Securities Association of Australia, Submission No.146 to the Financial
System Inquiry.47
2.84 This chapter has presented a snapshot of the Australian financialsystem, from an institutional and market perspective. The system isundergoing significant change, in both the nature of the business ofinstitutions and the products delivered. Chapter 3 discusses the forcesdriving further change and their implications.
46 Department of the Treasury, Submission No. 143 to the Financial System Inquiry, p.31.47 Note: Data cover both exchange traded and OTC derivatives, except for equities (futures
only), and the underlying physical market. Money market physical turnover is estimated(see Lynch, D. 1995).