Embed Size (px)
Citation preview

University of Rhode Island University of Rhode Island
DigitalCommons@URI DigitalCommons@URI
Open Access Master's Theses
1980
The Balance Between Economic Development and Environmental The Balance Between Economic Development and Environmental
Protection: A Case Study of the Rhode Island Jewelry Industry Protection: A Case Study of the Rhode Island Jewelry Industry
Steven Paul Walton University of Rhode Island
Follow this and additional works at: https://digitalcommons.uri.edu/theses
Recommended Citation Recommended Citation Walton, Steven Paul, "The Balance Between Economic Development and Environmental Protection: A Case Study of the Rhode Island Jewelry Industry" (1980). Open Access Master's Theses. Paper 498. https://digitalcommons.uri.edu/theses/498
This Thesis is brought to you for free and open access by DigitalCommons@URI. It has been accepted for inclusion in Open Access Master's Theses by an authorized administrator of DigitalCommons@URI. For more information, please contact [email protected].

THE BALANCE BETWEEN ECONOMIC DEVELOPMENT
AND
ENVIRONMENTAL PROTECTION
A case study of the Rhode Island Jewelry Industry
by
Steven Paul Walton
A Thesis Project Submitted in Partial Fulfillment of the Requirements for the Degree of Master of Community Planning
UNIVERSITY OF RHODE ISLAND
1980
MASTER OF COMMUNITY PLANNING
THESIS PROJECT
OF
STEVEN PAUL WALTON
Approved: / I _ ~ Major Advisor ' j 1~ ,6~ ~,4/ _,,,
~,+-~i~~~~---,..-..r-~~~~~~~~-
~ (
UNIVERSITY OF RHODE I~LAND
1980

ACKNOWLEDGEMENTS
The completion of this project signifies the passing of 27 years formal education and the end of a major phase in my life. I am relieved, elated, hopeful, and somewhat saddened. It is significant that I acknowledge those persons who have provided assistance in this latest milestone. My sincere thanks and appreciation go to:
Dr. Riad Mahayni for his inspiration, support and friendship.
Mr. Douglas Johnson for his patience and understanding.
Dr. Howard Foster for his assistance in helping me finish this work.
And of course, Ellen, for herself.

TABLE OF CONTENTS
Introduction , . . .
Chapter I-Industrial Location Theory . Transportation . . Agglomera tions . , . . . . Labor .. . . . . .
Chapter II-The Jewelry Industry and its Location . . . . . . . . .
Historical Development . . . . Location of the Rhode Island
Jewelry Industry . . . . . . Agglomerations of Activities
Producing Related Goods . Agglomeration of Labor Survey Technique . . . . . Survey Response . . . .
Chapter III-The Jewelry Industry and the Rhode Island Economy .
Jewelry as an export Industry Demand . . . . . . . . Linkages . . . . . . . Regional Multiplier .. .
Chapter IV-Water Pollution Control Act Amendments of 1972 . . .
The Expanding Federal Role
Page
. i
. . . . . 1 .. 4
I t t I I 6 . 8
.. 14 . . .. 15
.. 20
. . 21
.. 24 . ... 27
. 27
.. 41 . .. .. 42
.45 . . . 46
. 47
1972 Water Pollution Control Act State Water Quality Control ...
.. 54
. ,54
.. 56 . 60
Chapter V-Jewelry Manufacturing and Industrial Pretreatment . . . . . . . . . .
Electroplating and Metal Finishing , Federal Pretreatment Standards . . . .
Chapter VI-Economic Impact of Water Regulations
.. 65 . 65
.. 67
on the Jewelry Industry . . ... , 74 Costs , Employment , Closures . . ... 74 Competitive Advantage ..... . .... 78 Impact on State Economy ......... 81
Chapter VII-Conclusion and Recommendations ..... 89 Appreciation of the Problem .... . . 89 Or ganizational Development . 91 Fi nancial Assistance . . . . . . . 92

Works Cited
Appendix A
,95
,99

Table
I
II
III
IV
v
LIST OF TABLES
1972 Geographic Distribution of Jewelry Manufacturers . . . . . . . . . . . .
Historical Distribution of Jewelry Manufacturing in Rhode Island and New York
Jewelry Employment by Firm . . . .
Stratified Random Sample Method
Employment by Category .
Page
. 16
. 18
. 20
• 28
. 29
VI Major Materials and Location Purchased . . . . . JO
VII
VIII
IX
x
Market Range of Surveyed Firms . .
The Most Important Advantage Rhode Island offers as a Location . . . . . . . . .
Advantages by Firm Size
Growth of U. S. Jewelry Industry for Selected Years . . . . . . . . .
. . 31
. 32
. 34
.. 46
XI Related activities to Jewelry Manufacturing .. 48
XII Metal Finishing and Electroplating Pollutant Concentrations . . . . . . . . . . . . . . . 67
XIII
XIV
xv XVI
XVII
XVIII
Industries Considered for Numeric Pretreat-ment Standards . . . . . . . . . . . . . . . 70
Pollutants that Might Interfere with POTW 'S .. 71
Pollutants That Might Pass Through POTW'S ... 71
Projected Mean Capital Investment of BAT Requirements . . . . . . . 76
Projected Business Closures .. 77
Growth and Decline of RI Jewelry and Textile Industries . . . . . . . . 84
INTRODUCTION
Widespread concern for the unrestrained degradation of
our natural environment was spawned during the social unrest
of the 1960's. Vietnam, social inequalities, and environmental
pollution were the issues of the decade . The 1960's were also
a period of low unemployment and unprecedented increases in
purchasing power and personal income. To many, the choice
between an increased percentage in industrial productivity and
growth and continued degradation of nature's delicate ecological
balance was clear.
In the 1970's, however, the trade-offs between economic
growth and environmental protection have become increasingly
difficult to make. Today the issues of greatest concern in
volve high unemployment , continued inflation, and decreased buy
ing power. The possibility of further disruption to an already
staggering economy has placed severe impediments upon the pro
ductive implementation of federal legislation dealing with
pollution control standards. The potential impact of the Federal
Water Pollution Control Act Amendments of 1972 on the Jewelry
Industry in Rhode Island provides a case in point.
During the 20th Century, Rhode Island has developed a
competitive advantage in the production of jewelry and silverware
products. Since the turn of the century, conditions have evolved
in the State which enable this industry to manufacture and dis
tribute its products more efficiently and cheaply than competing

regions in the country. Historically, regional growth and develop-
ment have been sustained by a region's ability to export locally
1 produced goods and services at a competitive advantage. This
ability to export creates a flow of money into the area which
contributes to internal development. Some of these internal
developments are related directly to the export industry. Others
manifest themselves in the expansion of local markets for all
sorts of goods and services which tends to encourage unrelated
development.
Today Rhode Island is the nations largest manufacturer and
t f b d d t . 1 2 expor er o o y an cos ume Jewe ry. At present, however, the
ability of this industry to remain competitive from Rhode Island
is being threatened. Recent developments have eroded the local
jewelry industry's competitive advantage in the production and
distribution of its products. Foremost among these occurrences
is the passage of the Federal Water Pollution Control Act Amend-
ments of 1972. This act is designed to achieve two national
goals: the elimination of discharge pollution into the nation's
waters by 1985 and the interim attainment of water quality which
provides for the protection and propagation of fish and wildlife.J
While the intent of the federal legislation is of the
most laudable nature, the requirements of providing effluent
control facilities demanding large capital investment may be
beyond the fiscal capabilities of many jewelry firms. This
industry is characterized by hundreds of small businesses usually
employing less than 25 people. 4 Although there are large com-
panies in the industry, the great majority of enterprises lack
the financial base, management capabilities, and technical ex-
ii

pertise to effectively satisfy federal environmental and health
regulations. It is possible that enforcement of the federal
legislation which fails to consider its impact on many of these
individual businesses may result in their forced closings.
Since the competitive advantage a region has vis a' vis
other regions in the production of certain products is relative,
changes in Rhode Island's industrial structure may result in
substantial shifts in the relative advantage which the State en
joys in the manufacturing of jewelry products. The potential
costs to the Rhode Island economy caused by a large reduction in
jewelry manufacturing may be more severe than the loss of direct
employment and income. Both related and unrelated activities
which depend upon the money generated by this industry would
be affected.
The motivation for this study is a perceived need to find
a common course of action for these two opposing forces of
economic growth and environmental protection. On the one hand,
there are the environmentalists who believe that protection of
our natural resources is essential to the survival of our planet
and its life forms. On the other hand, there are those groups
to whom the imperatives of expanded employment opportunities and
increased economic standards of living provide the essential
ingredients for individual fulfillment. A basic theme of this
paper is that both points of view have validity. The focus of
this study is on ways in which programs can be developed which
facilitate compliance with the federal act while encouraging the
economic vitality of the jewelry industry and the economy of the
State.
iii

The success of a region's export base is a determining
factor in the rate of internal growth and development. There
fore, in order to understand this growth, we must examine the
locational factors which have enabled these staples to develop.
The first section of this paper presents a general theory of
industrial location. It surveys existing definitions of
"optimum location" and presents a conceptual framework of the
most influential determinants of the location of activities.
The second chapter looks at the Rhode Island Jewelry
Industry's production process, performance requirements, and
historical development to uncover those factors which are most
influential as causes of location. Included in this discussion
is an investigation of the particular elements of the State's
competitive advantage as perceived by selected jewelry firms
in the state.
The third part examines the importance of the jewelry in
dustry to the state economy. It reviews the Export-Base Theory
of economic development and compares the industry's employment,
total wages and value added to other industrial sectors to
illustrate the significant position of jewelry manufacturing
within the local economy.
The fourth chapter presents the Water Pollution Control Act
Amendments of 1972 with a discussion of the legislative require
ments, intent, and enforcement procedures. It examines both the
state and federal roles, in:::luding a look at the Act's specific
programs and policies to achieve its goal of eliminating dis
charge pollutants into the nation's navigable waters by 1985.
This discussion is continued in the following section which
analyzes the relationship of the federal legislation to jewelry
iv

manufacturing. This chapter focuses primarily on the federal
industrial pretreatment requirements relating to electroplating
and metal finishing operations.
Though the activities covered by the federal regulations
are found throughout the United States, they are of particular
importance to the concentration of jewelry frims in Rhode Island.
Chapter six brings together the major elements of the Rhode
Island jewelry industry's locational development and the federal
water pollution standards to illustrate the potential economic
disruption to both the industry and the state.
The final chapter of this study proposes recommendations
designed to help eliminate polluting effluents as required by
the federal legislation while preserving the vitality of the
jewelry industry. It presents specific proposals which both
private and public agencies can adopt to meet these ends .
v

FOOTNOTES-INTRODUCTION
1Harvey Perloff and Lowdon Wingo, Jr., "National Resource Endowment and Economic Growth", in Regional Policy-Readings in Theory and Applications, ed. John Friedmann and William Alonso (Massachusetts: The MIT Press, 1975), p. 316.
2 U.S. Department of Commerce, Bureau of the Census, 1972 Census of Manufacturers, Vol II, Industry Statistics, pt. 3.
3u. s ., Congress, Senate, an Act to Amend the Federal Water Pollution Control Act, Pub. L. 92-500, 92 HD/Cong., 2d sess., 1972, S. 2770, p. 1.
4Rhode Island Department of Economic Development, Rhode Island Basic Economic Statistics - The Economy, Summary, and Trends 1977-1978, (1977), p. 104.

CHAPTER ONE:
INDUSTRIAL LOCATION THEORY
Industrial location theory attempts to identify and ana
lyze the principal factors responsible for the spatial organ
ization of activities in our society. In locational analysis
a distinction is often made between the approach emphasizing
the theory of the firm and that which views location as a
regional problem. 1 The first approach examines the decisions
which an individual firm or an entrepreneur makes regarding
the relevant production coefficients available at a partic
ular site. The second method views location at an aggregate
level, emphasizing patterns of land use and market interaction
which result in competition and linkages between a host of
different activities.
At the macro level, each business is seen to function in
a system of spatial relations. The size of a region, its
economic structure including raw materials, industrial mix,
amenities, prices, tax rates, labor supply, ... , its location
relative to other regions, and the quality of its transporta
tion system provide certain advantages for the production of
various goods and services. Firms operating in these areas
utilize the existing advantages to more profitably and com
petitively manufacture and distribute their products. The

relationship between competing regions constantly shifts due
to population movements, technological innovations, and
changes in demand and consumer preference. 2 These changes
in regional comparative advantage result in the uneven
distribution of economic activities.
On the micro level, traditional analysis of industrial
location has been concerned with the "optimum" spatial
distribution of individual firms. All businesses require, to
differing degrees, land, labor, public investments and ser..,
vices, and to an increasing extent a desirable environment.
Assuming economic rationality, complete information, and a
static situation, a firm selects that site at which the
proper combination of these production factors results in
profit maximization.J The theory proposes a series of
techniques which can be utilized under certain conditions
to determine the site where the balance between costs and
revenues results in the optimum location. 4 In actual
practice, however, we may not be dealing with the "optimum"
location. As August Losch perceptively recognized:
"The location of an industrial enterprise is selected by an entrepreneur. His choice rests upon subjective considerations. He will, of course, bear objective facts in his mind, but these alone cannot dictate location. Thus it is conceivable that under exactly the same external conditions, two entrepreneurs m3y choose entirely different locations."
Firm location occurs at those sites which, when viewed
by an individual entrepreneur, offer the most in terms of
the factors of production for his particular manufacturing
-2-

process. By the same token, production does not always
take place at those locations which seem best purely from
an economic point of view. A number of noneconomic factors
must also be considered and the decision of an entrepreneur
may be swayed by these noneconomic influences.
The assumptions of economic rationality, complete in-
formation, and a static situation fail to accurately repre-
sent the dynamics of industrial location as practiced in
our economy. Also, the distinction between the individual
firm approach and the more aggregate analysis in reality is
not as clear cut as the theoretical framework indicates.
There is no dividing line which distinguishes the impact
of these approaches on firm location. Depending upon the
type of industry and the character of the decision-maker,
the selection of a production site in actual practice is
influenced collectively by:
1 ) The locational preferences of consumers and producers.
2) The requirements of the production process.
J) The interdependence of locations.
In seeking to locate, an individual entrepreneur ex-
amines the relationship of a particular region's compara-
tive advantage to his manufacturing process and personal
needs. He analyzes the area's transportation system, its
supply of labor, the existence of related and supporting
activities, potential market areas, local suppliers, and
the general environment.
-3-

TRANSPORTATION
Transportation considerations are of fundamental impor-
tance to the spatial organization of regions as well as with-
in them. The denser the transportation network the less
roundabout transfer required and the cheaper the cost of
shipping. The cost required for transporting goods over
distances is a maj·or determinant in the interchange of
various items between regions. 6 If such costs are high,
each area may develop its own products to be consumed
locally. If these costs are low, a great deal of trade may
occur.
The first element to emerge in examining the structure
of transport costs is the large variety of transfer mediums;
ship, truck, air, rail, and so on. The shipper chooses the
carrier with the lowest cost for the distance intended.?
Figure I shows the relation of cost to distance when alter-
native carriers are considered.
FIGURE I
,-- Truck
$ / __ -Train
/-- -----~ - - - - --.Ship //
// /
I 0
Dis ance SOURCE: William Alonso, "Location Theory," in Regional Policy -
Readings in Theory and Applications, ed. John Friedman and William Alonso, (Massachusetts: The MIT Press, 197 5), p. 40.
-4-

Although in all cases the costs of transporting goods
increases with distance, they do not increase in direct
proportion. 8 This is because there are terminal and pack-
aging costs resulting in lower rates for longer hauls.
It is cheaper to make one 1000 mile trip than to make two
500 mile trips. In addition to distance and mode, rates
differ by commodity, direction shipped, region of the country,
size, and weight. Just as it is cheaper to rent by the
month than by the week, transfer costs per pound decrease
as the weight of the shipment increases. Bulky items,
however, cost more per ton than easily stored items. Goods
which require additional handling such perishable, fragile,
and dangerous commodities also command higher rates. Dif-
ferences in rates often depend on the direction of travel.
It may be cheaper to ship in the direction of lighter
traffic since the fixed costs to the transfer agency remain
the same regardless of load.
Transportation considerations have traditionally been
a principal factor in industrial location analysis. The
procurement of production inputs and the distribution of
outputs depend directly upon a means of transporting goods
and services from one point to another.
All firms, however, are not equally dependent on lo-
eating at the point where total frei ght costs are lowest.
Transport-oriented industries are those which find trans-
portation costs of paramount importance in selecting a
location.9 Such firms generally tend to produce high bulk-
to-value ratio products.
-5-

Industries which are primary product-oriented (weight
losing) tend to locate nearest the source of dominant ma
terial . This is the result of the savings in shipment costs
which accrue from transporting lighter and less bulky items.
If the production process requires multiple weight-losing
materials, than a firm selects a site where total transport
costs are at a minimum.
A similiar situation exists for industries which pro-
duce weight-gaining products. Such firms tend to be market
oriented . Locating close to the product's final destination
will save the higher costs of shipping heavier items .
While generally true, this brief explanation simplifies
the relationship of transportation to producing enterprises .
First, there is no one point where transport costs for all
modes are lowest . Second , for all activities the costs of
transporting materials must be balanced with other inputs
into the production process. Therefore, in actual practice
an enterprise must consider the cost of shipping by available
mediums with the cost and supply of the other factors of
production at a particular location .
AGGLOIVIERATIONS
Agglomerations refer to a clustering of activities and
people which result in external economies that are avail-
bl t f . . th . t t . 10 a e o irms in e1r ransac ions. Those industries
which operate in agglomerations enjoy savings in costs which
arise from close proximity to these activities. These
-6-

savings may be the direct result of the price and delivery
reliability of production materials and finished products,
quick and easy communication with business relations, ability
to reach wider market areas and draw on a larger number of
suppliers, and so on.
In discussing agglomerations it is useful to distinguish
between internal and external agglomerations for producBrs
of similiar goods and services and those for producers of
different goods and services. Alfred Weber has delineated
three categories of agglomerations:
1) Simple enlargement of a firm, bringing into existence economies of large scale production.
2) Local association of several firms presumably of the same industry, which encourages the development of technical equipment and facilitates the sale of the finished product.
J) Aggregation of activities of unrelated as well as related types which leads to conditions which are more favorable to any single firm or group t£tn they could develop for themselves.
Agglomerations for similiar goods and services are
both horizontal and vertical. Horizontal factors are ad-
vantages which accrue through such activities as advertising
and the ability to exchange technical and product innova
tions. Vertical agglomerations deal with the inputs into
the production process and the distribution of the final
goods. Often firms of the same industry locate in close
proximity to each other to share the benefits of special-
ization. Such external economies manifest themselves in
the linkages between firms manufacturing similiar or re-
-7-

lated products. 12
Agglomeration economies for industries producing differ
ent goods and services occur from both inside and outside
the private sector. The principal advantages, often called
urbanization economies, are such things as the availability
of financing and the cost of borrowing, communication
facilities, rents, housing, size of market areas, educational
and recreational facilities, power costs, taxes, police and
fire services, and local governmental regulations.
Generally speaking, decreases in the scale of production
implies a reduction in self-sufficiency and an increasing
reliance on external activities. Therefore, smaller estab
lishments appear to have stronger connections with local
agglomeration economies. This suggests in turn that as the
size of the establishment increases,external economies exert
a weakening locational pull. Those industries which are
highly dependent upon the benefits of agglomeration economies
will have a stronger incentive to locate at sites where
these advantages are most prevalent.
LABOR
The productive capacity of an economy in a given period
in time is largely influenced by the available supply and
quality of land, labor, and capital. With a fixed quantity
of capital and land and a given state of technology (none
of which vary in the short-run), the level of production will
be determined by the size and quality of the labor force and
how fully it is utilized.
-8-
In examining the operation of the labor market, emphasis
is generally placed on market supply and demand. 13 The labor
requirements of all employers in a region and the wages they
pay constitute the demand side of the labor market. An
area's level of economic development, industrial mix, and
state of technology are t he principal determinants of demand.
The level of economic development and industrial mix dictate
the composition of that demand. The existing technology
determines the types of skills and education required by
the local industry. As the technology becomes more complex
and productive, labor requirements and work patterns change,
job contents shift, and therefore the skills demanded by
the economy must adjust.
The major determinants of labor supply are population
size and composition and the labor force participation rate.
The greater the size of the population the larger the pool
of labor from which to draw workers. The composition of
the population dictates the types of skills available for
prospective employers. The labor force participation rate
is defined as the proportion of individuals sixteen years
or older that are active in the labor force, either as
workers or as job seekers. The greater the percentage of
the population in this category the greater the supply of
labor.
The extent to which labor enters into the production
process of an individual firm depends on the type of pro
duct that is being produced, the technology that is being
used, and the relative prices of labor compared with the
-9-

other factors of production. In certain activities the
need for and the existence of an adequate supply of pro-
fessional, skilled, unskilled, or dependent labor may be
the dominant element influencing plant location. 14 Con-
centrations of certain industries may foster the development
of a labor force particularly productive in those jobs which
that industry requires. Thus workers skilled in particular
tasks may be found in large numbers where that industry
is well established.
The major factors of location which have just been
reviewed do not operate in isolation. The value of a par-
ticular site to any firm may depend upon the quality and
accessibility of existing transportation facilities, which
in turn are a factor of the forces of agglomeration economies,
which may be the result of the resource endowment which
has been influenced by changes in technology and tastes.
In addition, it is rare that industrial location is de-
termined by any one single element. Just as these forces
are highly interrelated, their influence in determining
spatial organization is cumulative . That is to say it
is all these forces working together, though with varying
degrees of importance for different firms, that mold the
spatial distribution of activities .
With this in mind we can now examine the jewelry in-
dustry and analyze how these factors have collectively
influenced its spatial distribution. Chapter Two looks
at the industry's historical development, performance re-
-10-

quirements, and production process in order to uncover
those forces which are most important as causes of location .
-11-

FOOTNOTES--CHAPTER I
1see August Losch, Economics of Location, trans. William H. Woglam and Wolfang Stapler (New Haven: Yale University Press, 1954).: Edgar M. Hoover, Location of Economic Activity, (New York : McGraw-Hill Book Company, 1948).: Walter Isard, Location and Space Economy, (New York: John Wiley & Sons , 1956).: Alfred Weber , Theory of the Location of Industries, trans. Carl J. Fredrich , (Chicago : University of Chicago Press, 1929).: F. E. Ian Hamilton , ed., Spatial Perspectives on Industrial Organization and Decision-Making, (London: John Wiley & Sons, 1974) .
2Harvey Perloff and Lowdon Wingo , Jr., "National Resource Endowment and Economic Growth", in Regional Policy - Readings in Theory and Applications, ed. John Friedmann and William Alonso, (Massachusetts: The MIT Press , 1975), p . 315.
3william Alonso, "Location Theory", in Regional Policy-Readings in Theory and Applications, ed. John Friedmann and William Alonso, (Massachusetts: The MIT Press, 1975), p. 54.
4The major simplifying conditions are 1) that there is a single county, 2) we are dealing with a single product, J) the sources of raw materials are known, 4) the locations and size of markets are known, 5) labor is geographically fixed, and 6) transportation costs are a function of weight and distance.
5Losch, op. cit., p. 4
6walter Isard , Location and Space Economy, (New York: John Wiley & Sons , 1956), p. 27.
7Alonso, op. cit ., p. 40
Bibid., p. 41
9Ibid., p. 57
-12-

lOEdgar Hoover, Location of Economic Activity, (New York: McGraw-Hill Book Company, 1948), p. 23.
11Alfred Weber, Theory of the Location of Industries, trans. Carl J. Fredrich, ~Chicago: University of Chicago Press, 1929), p. 101.
12H "t oover, op. ci . , p. 25.
l3The discussion is a simplified explanation of the actual market operation. In actuality there are various labor matkets and different levels of demand for labor. For further reading see: C. Glyn Williams, Labor Economics, (New York: John Wiley & Sons, 1970).: Juaneta M. Kreps, Gerald G. Sumers, and Richard Perlman, Contemporary Labor Economics: Issues, Analysis, and Policies, (California: Wadsworth Publishing Company, 1974).: Peter B. Doeringer and Michael J. Peare, Internal Labor Markets and Manpower Analysis, (Massachusetts: D.C. Heath & Company, 1971).: Sor A. Leviton, Garth L. Mangum, and Ray Marshall, Human Resources and Labor Markets, (New York: Harper & Row Publishers, 1976).
14Dependent labor is defined as those workers who are not the primary breadwinners and who often work to supplement the family income. These persons often do not regard attachment to a job as their primary responsibility. From time to time they may remove themselves from the labor force to satisfy other more demanding needs.
-13-

CHAPTER TWO:
THE JEWELRY INDUSTRY AND ITS LOCATION
In 1805 the embryonic jewelry industry in Rhode Island
employed thirty people. 1 By 1975 this industry had matured
to include 1,055 firms employing in excess of 27,000 workers
making it the single largest manufacturing activity in the
State. 2 Today the smallest state in the union is the nation's
largest producer of Body or Costume jewelry. The major
segments of the local industry are divided into the following
Standard Industrial Classifications:J
1. Costume Jewelry: This is the low and the medium
priced sector of the jewelry industry. This activity util
izes precious metals in combination with base metals, often
adorned with imitation stones and pearls. The seat of the
Costume Jewelry Industry is the Greater Providence Area,
Rhode Island. Substantial segments are also located in the
New York-New Jersey Area and more recently a smaller con
centration has developed in the Los Angeles Region.
2. Jewelr;y__and Precious Metal: The Jewelry and Precious
Metal industry utilizes alloys of precious metals, usually
platinum and gold, often adorned with precious stones and
pearls. The development of this activity has centered in
-14-

the Mid-Atlantic Region, most predominately in New York which
in 1972 supported nearly one-third of the nation's 1,524 firms. 4
3, Jeweler's Materials and Lapidary Work: The manu
facturers of finished products, in both the Precious Metal and
Costume Jewelry segments, often buy semi-finished parts from
specialized jobber shops. This group of suppliers includes
findings manufacturers, assemblers, castors, electroplaters,
polishers, solderers, stone cutters, faceters, and engravers.
As the United States has grown and prospered over the
past three and one-half centuries, the jewelry industry has
developed and expanded with it. In 1972 the industry employed
74,500 people in 3,163 firms across the country.5 The
distribution of this growth is concentrated in a relatively
small geographic area as shown in Table I. Collectively the
Northeast supports 73 percent of the nation's jewelry firms
and 80 percent of its employment. More specifically, Rhode
Island and New York dominate with 1,877 of the country's
3,163 businesses, or 60 percent.
HISTORICAL DEVELOPMENT
Jewelry manufacturing in the United States dates back
centuries before the discovery of America in 1492. In-
digenous Indians used bits of ivory, bone, and metal for
body ornamentation and for insignias indicating standing in
the tribe.
The modern jewelry industry traces its roots back to
the 1600's. The early Dutch settlers to the New World imported
-15-

AREA
TABLE I: 1972 GEOGRAPHIC DISTRIBUTION OF JEWELRY MANUFACTURERS
TOTAL FIRMS TOTAL EMPLOYMENT
~EW ENGLAND 836 35,000
Rhode Island 655
136
21,000
Massachusetts 9,500
IUD-ATLANTIC 1471 24,200
New York 1240 17,800
4,200 New J ersey 123
3ALANCE OF NA TI ON 856 15,300
rGTAL 3,163 74,500
SOURCE: U. S., Department of Commerce, Bureau of the Census, 1972 Census of Manufacturers , vol. II , Industry Statistics, pt. 3.
their customs and lifestyles, including the affinity for
jewelry adornment. Broaches, buckles, and rings were an
integral part of the popular attire. Gold and silversmithing
grew into established activities. These craftsmen became the
jewelers, watchmakers, silversmiths, and coppersmiths all
rolled into one.
During the next 250 years the industry continued to grow,
though sporadically. By 1859 there were nationally 684 firms
employing 7,388 workers. 6 By the end of World War I these
numbers had multiplied to 2,569 firms with total employment
-16-
approaching 47,000.7 New York became the natural center for
the production and distribution of jewelry items. Before
the Decade of the Depression, New York was the world's largest
market for gems and precious stones. 8 Maiden Lane was the
center for the production of Jewelry and Precious Metals in
the United States.
By the end of World War II, New York was firmly established
as the undisputed King of Jewelry. In 1947 the State supported
1,362 jewelry firms, or 55 percent of the nation's total. 9
Today, New York remains the largest manufacturer of jewelry
products in the country. Its dominance, however, no longer
is unchallenged.
In the 25 year period between 1947 and 1972 the number
of firms in the United States producing Costume Jewelry,
Jewelry and Precious Metals, and Jeweler's Materials and Lap
idary Work increased from 2,655 to 2,858. 10 During the same
period, New York's share of the total declined from 1,362 to
1,232. 11 The year 1939 marked the beginning of an era which
was to see Rhode Island's jewelry industry boom to become
the nation's largest producer of Costume Jewelry. In 1972
the smallest state had 35 percent of the country's costume
jewelry firms and 40 percent of its employment. 12
The first jewelers appeared in Rhode Island in the mid-
1700' s before banking had become established in the State.
Successful merchants invested their profits in easily identi
fiable objects which served to deter theft. 13 As local trade
prospered, the demand for silversmiths increased accordingly.
Costume Jewelry, by far the most important sector of the
-17-

TABLE II: HISTORICAL DISTRIBUTION OF JEWELRY MANUFACTURING IN RHODE ISLAND AND NEW YORK
RHODE ISLAND NEW YORK
1947 1963 1972 1947 1963 1972 COSTUME 232 300 269 429 400 254 JEWELRY JEWELRY AND 128 120 193 693 780 729 PRECI OUS ME TAL JEWELER' S lVIA TERIALS 135* 160* 165 240 265 249 AND LAPIDARY WORK
TOTA L 495 580 627 1,362 1,445 1,232
*Estimates
SOURCES: U.S., Department of Commerce , Bureau of the Census, Census of Manufacturers, 1947, 1963, 1972.
local industry, began with the manufacturing of silver and gold
shoe buckles. Such items were very costly and appealed only
to the few extremely wealthy who could afford such luxuries.
Efforts to expand the market were rewarded in 1794 when
Nehemiah Dodge discovered a technique of gold plating copper
and brass. 14 This created a product which attracted large
numbers of buyers and the industry began to rapidly expand.
Within 80 years, 133 firms were in operation in the State
employing 2,667 people. 15 Most of the industry's early growth
centered in Providence as demonstrated by the fact that 129
of the 133 enterprises in 1875 were located in the capito1. 16
Aided by the supply of inexpensive labor provided during
the late 1800's to the early 1920's by immigrants arriving
from Europe, the Rhode Island industry continued to grow. 17
An event which heralded the State's burgeoning strength as
a center for jewelry manufacturing was the founding of the
-1 8-

Manufacturing Jewelers and Silversmiths of America (MJ & SA )
in Providence in 1903. This agency is a trade association
providing a number of services to the industry.
By 1921 Rhode Island supported 268 jewelry firms employ
ing 6,885 workers. 18 Throughout the remainder of this
century Rhode Island's industry has continued to expand. Be
tween 1950 and 1976 the State's manufacturing employment
declined from 148,000 to 122,400. 19 During the same period
employment in the jewelry industry grew from 19,900 to
26,900. 20 In the years 1970 to 1976 total civilian employment
in Rhode Island increased 5.4 percent compared to 35.2 percent
for the jewelry industry. 21
Although Costume Jewelry is classified by the Bureau
of the Census as "Miscellaneous Manufacturing," it is any-
thing but miscellaneous in its importance to Rhode Island.
The next section of this chapter examines the industry's
production process and requirements to uncover those factors
which result in Rhode Island's competitive advantage in the
manufacture and distribution of jewelry products.
-19-

LOCATION OF THE RHODE ISLAND JEWELRY INDUSTRY
In 1875, 98 percent of Rhode Island's burgeoning jewelry
industry was located in Providence. Today this pattern of con
centration remains essentially unchanged. Almost 80 percent
of the State's firms listed in the 1977-1978 Buyers' Guide are
located in Providence or adjoining cities. The clustering of
these plants in one geographic area appears to stem from the
industry's dependence on the existence and development of ag-
TABLE III: JEWELRY EMPLOYMENT BY FIRlVI
1935 (April) AND 1975 (First Quarter)
1935 1975 Establishments N % Establishments N Employing Employing
%
2- 20 workers 84 49.7 0- 49 workers 325 77.6 21- 50 II 43 25.4 50- 99 II 46 11.0 51- 100 II 22 13.0 100-249 II 36 8.6
101- 200 II 13 7.7 250-499 II 5 1.2 201- 300 II 2 1. 2 500 & over 6 1.4 301- 500 II 3 1. 8 501-1000 II 2 1. 2
Total Establishments 169 419
Source:
Note:
The Providence Community Center, Preliminary Report on the Jewelry Manufacturing and Silverware Industries in Rhode Island. Quoted from, "Rhode Island Jewelry Industry -Perspectives on Development and Reform," Mimeograph by Douglas Johnson, 1976, p. 11.
Statistics in table are for City of Providence only.
-20-

glomeration economies. Jewelry manufacturing is traditionally
comprised of small and medium sized firms. In 1975, as shown
in Table III, 88.6 percent of all plants located in Providence
had under 99 employees. The Rhode Island industry average for
1973 was under 25 employees per firm. 22
Agglomeration economies exert a strong influence on firms
of small scale production. Such economies appear to manifest
themselves for the jewelry industry in horizontal and vertical
linkages between firms and activities producing similiar and
related goods and services, and an adequate supply of labor.
AGGLOMERATIONS OF ACTIVITIES PRODUCING RELATED GOODS
Jewelry production entails a number of specific tasks
leading to the construction of the finished good. Today there
are two basic methods of jewelry manufacturing. Parts are
"Stamped" with a press from flat stock, wire, and tubing or
they are "Cast" by pouring liquid metal or some other base
material into molds made of bronze, rubber or plastic.
Once the basic ornaments or findings that comprise the
body to the jewelry piece are made, the next series of opera
tions assembles these pieces into the finished stem. This may
be done in one of two ways. Mechanized assembly uses rivets,
screws, and springs to attach the pieces together. Soldering
requires the use of a hand torch or iron to weld one piece to
another.
-21-

Depending on the metals used and the final effect desired,
finishing operations vary. Precious metals such as gold and
platinum require only a polishing. Bimetal products, gold
filled and gold plated, go through a two stage finishing pro
cess. After polishing, the piece is given a quick electropla
ting both to color it as desired and to hide any raw edges.
In less expensive jewelry made of brass, tin, or other
base metal it is customary after the part has been polished
to place electroplated coatings of different types on the sur
face. The final coat is generally a precious metal.
In very inexpensive jewelry and novelty items, finishing
may be a light electroplating, polishing followed by a coating
of clear lacquer, or vacuum plating which consists of covering
the piece with colored aluminum.
The jewelry industry is supported by a large network · of
firms which specialize in one or more of these inputs into the
production process. Well over one-half of the 1,500 firms listed
nationally in the Manufacturing Jewelers and Silversmiths of
America's 1977-1978 Buyers' Guide specialize in such specific
tasks as assembling, casting, electroplating, polishing, sol
dering, findings manufacturing, enameling, and engraving. Sub
contracting out several of these tasks is a prevalent practice.
These vertical linkages between firms producing similiar and
related goods is perhaps the most distinguishing feature of
the jewelry industry. Their existence is a major factor con-
tributing to an area's competitive advantage for the jewelry
-22-

industry, thus encouraging the spatial clustering of these ac
tivities in a few select geographic areas.
Horizontal agglomerations for the jewelry industry consist
predominately of advertising and the ability to exchange product
and technical information. Jewelry manufacturing is sensitive
to rapid changes in styles and production processes. To remain
competitive in this volatile industry, firms must be able to
quickly change production in response to shifts in demand.
The establishment of the Manufacturing Jewelers and Silver
smiths of America in Providence in 1903 contributed to Rhode
Island's growth and development to a position of prominence
in the industry by providing services available to all firms.
Every two years this organization publishes a Buyers' Guide
which lists all the members across the nation (currently it
has 1,507 registered members) and identifies them by location,
types of merchandise manufactured, distribution methods, product
quality, and approximate retail selling price. In addition,
they provide insurance programs at prices well under what in
dividual firms could obtain elsewhere; they publish a monthly
magazine, America Jewelry Manufacturer, which supplies readers
with the latest information on manufacturing techniques and
processes, translations of the most recent governmental rulings
and regulations, and general news of the industry; they provide
vocational and educational training programs; they furnish a
lobbying service in Washington D.C.; and they sponsor such
large, industry-wide undertakings as the Manufacturing Jewelers'
-23-

Suppliers and Equipment Exhibition in New York, the Providence
Convention and Industrial Exposition, and the United Jewelry
Show in Providence and New York.
One of the MJ & SA's most successful projects has been
the founding of the Jewelers Shipping Association (JSA). This
non-profit organization insures transported valuables at their
full cost and is able to ship at 15 percent lower than Inter-
state Commerce Commission common carrier rates. It is current-
ly estimated that 90 percent of the jewelry products and mate-
rials transported in the Rhode Island-Massachusetts region are
handled by the JSA. 23
AGGLOMERATION OF LABOR
Because jewelry is actually a federation of industries
producing hundreds of items from many materials, the different
skills required are numerous. The adequate supply of labor
is a major factor in the growth and development of this industry.
Jewelry manufacturing is a labor intensive activity re-
quiring an abundance of unskilled and semi-skilled workers.
According to James P. O'Donnell, Director of Education and
Training of the Manufacturing Jewelers and Silversmiths of
America, approximately 80 percent of the present work force
is unskilled and semi-skilled. 24 Generally these occupations
require little or no training and special knowledge. The
principal requisites for the unskilled tasks are finger dex-
-24-

terity and good hand and foot coordination. Typical jobs in
this category include press operators, linkers, and carders.
Semi-skilled occupations such as polisher, solderer, tool
setter, and annealer require a superficial knowledge of metals
and use of hand tools and lathes.
During the late 1800's to the early 1920's this supply
of labor was provided by the immigrants who had recently ar
rived from Europe. As the number of foreigners entering the
country began to decline, the industry turned to women, who
currently comprise 60 percent of all employees. 25
The existence of a large home work industry in Rhode
Island (both legal and illegal) has enabled many manufacturers
to minimize their production costs by eliminating certain over
head and other operating expenses. This is accomplished by
distributing specific jobs to people who agree to work at their
homes at reduced rates. The subcontractor avoids the costs
associated with providing a work environment and fringe benefits
while the laborers collect tax free wages.
Cheap labor, however, is only one side of the labor coin.
Skilled jobs in jewelry plants consist of a high degree of hand
craftsmanship (i.e. jeweler, ring-maker, stone and diamond set
ter, engraver), or require a high degree of technical informa
tion (i.e. toolmaker, electroplater, assayer, mechanical and
chemical engineers). This is in addition to the artistic and
managerial occupations.
Skilled jobs in jewelry industry consist of two principal
-25-

types; first the modern counterpart of the gold and silver
craftsman of old; and second, the highly skilled jobs that
have been adapted to jewelry production . Most of these jobs
demand years of training and development. Concentrations of
the jewelry industry have fostered the evolution of a labor
force which is particularly productive in these tasks .
Collectively, it appears that agglomerations of related
and supporting activities plus a g ood supply of unskilled and
highly skilled labor go a long way in explaining the Rhode
Island jewelry industry's present location and development
to a position of national prominence. However, to return to
an earlier quotation by August Losch, "The location of an in-
26 dustrial enterprise is selected by an entrepreneur." In
actual practice, therefore, the question must be asked whether
businessmen do, in fact, utilize the rationale and techniques
presented by the traditional theory . Many, of course, do not .
The choice of a production site is influenced by an infinite
number of variables, many of which remain outside the formal
theory and are unquantifiable . For example, how much is it
worth to have access to a good tax lawyer, or to be able to
spend free time with family, or to do business with school
friends? It is not only difficult to quantify these advantages,
it is often difficult to identify them.
The next step in this investigation examines the local
competitive advantage as seen by the individual entrepreneur .
-26-

This stage focuses on a mail survey of 148 of Rhode Island's
jewelry firms.
SURVEY TECHNI QUE
The type of sample utilized in this study is a Strati-
fied Random Sample. This method involves the drawing of samples
separately from subgroups of the total population. Table IV
illustrates this technique. The number of firms listed in the
Buyer's Guide in each category is tallied, and their percen
tage of the total number is then computed. This proportion
determines the number of samples each subgroup experiences.
For example, Manufacturing Jewelers comprise 50.7 percent of
the 602 Rhode Island firms listed. This category would there
fore consist of 50.7 percent of the sample size 150, or a total
of 75.
SURVEY RESPONSES
During the summer of 1977, 148 questionnaires were mailed
to local jewelry firms. By September, 38, or 27 percent of
those surveyed, returned the completed forms. In terms of
size of operation, the responses corresponded generally with
the data on Table III. Over 76 percent of the surveyed firms
employ less than 99 people, compared with 88.6 percent for the
City of Providence. This difference may be attributed to the
tendency of larger firms to locate outside of Providence more
-27-

TABLE IV : STRATIFIED RANDOM SAMPLE METHOD
CATEGORY FIRMS SAMPLE SIZE TOTAL # % OF TOTAL
Manufacturing Jewelers J05 50.7% 75
Table Ware 16 2.7% 4
Electroplaters 80 1J.J% 20
Enamelers 18 J.0% 4
Engravers 4 o.6% 1
Findings Manufacturers 108 17.9% 27
Polishers 27 4.5% 6
Refiners 10 1.7% J
Solderers 16 2.7% 4
Stone Dealers 18 J.0% 5
TOTAL 602 100.0% 148**
** 148 total due to rounding off.
frequently than small businesses.
Questions J, 4, and 5 of the questionnaire (which is re-
-28-

produced in Appendix A) serve principally to test data which
maintains that a high percentage of the labor force is un-
skilled, the basic raw materials are purchased locally, and
the range of the industry's markets extends throughout the
United States and the world.
As shown on Table V, 62 percent of the work force are
laborers and operatives. These are predominately unskilled
and semiskilled occupations which require a limited amount of
training. Craft & Kindred and Management & Administration
comprise 20 percent of the labor force of the surveyed firms.
These categories generally demand extended training and de-
velopment, often including up to a five-year apprenticeship.
TABLE V: EMPLOYMENT BY CATEGORY
CATEGORY NUMBER PERCENTAGE
Management & Administration 1...2_8 ~
Clerical 19_2_ ~
Service 118 ~
Sales 1 O_'l_ ~
Craft & Kindred 2 8__2_ l~
Oj:l_era ti ve J.2.2. l_l!
Laborer 101_2_ 4~
TOTAL 228_2_ 100~
-29-
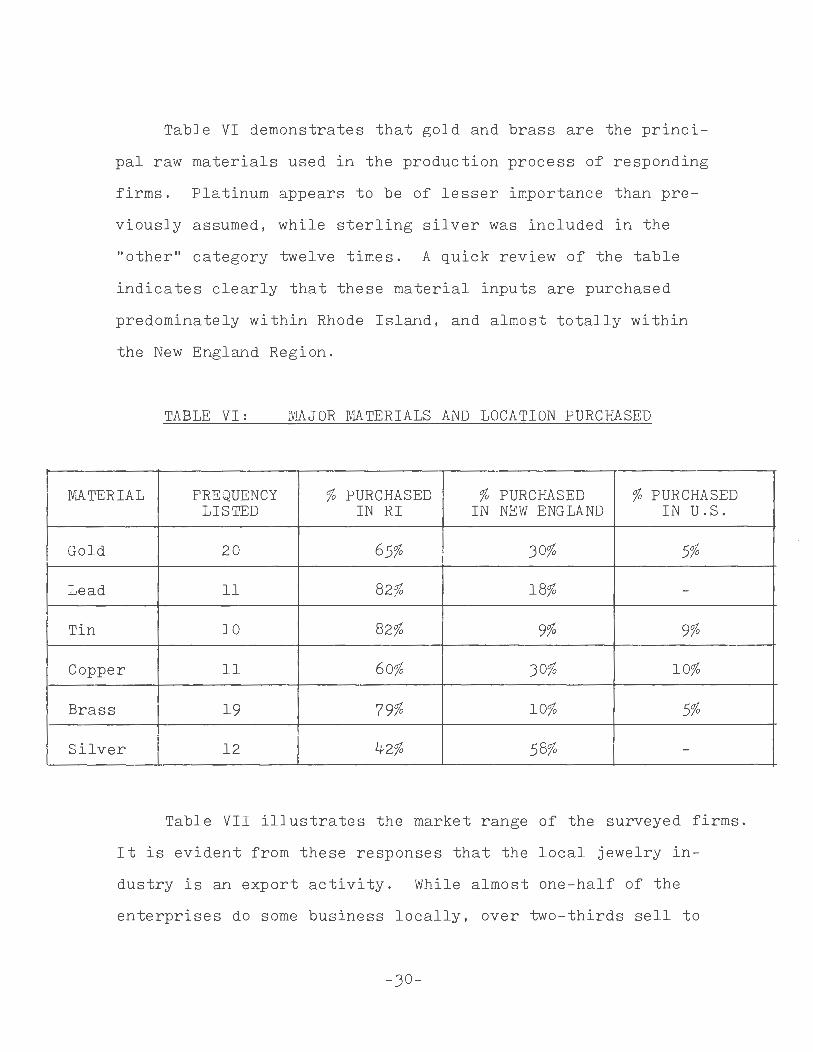
Table VI demonstrates that gold and brass are the princi-
pal raw materials used in the production process of responding
firms. Platinum appears to be of lesser importance than pre-
viously assumed, while sterling silver was included in the
"other" category twelve times. A quick review of the table
indicates clearly that these material inputs are purchased
predominately within Rhode Island, and almost totally within
the New England Region.
TABLE VI: MAJOR MATERIALS AND LOCATION PURCHASED
MATERIAL FREQUENCY % PURCHASED % PURCHASED % PURCHASED LISTED IN RI IN NEW ENGLAND IN U.S.
Gold 20 65% 30% 5%
Lead 11 82% 18% -
Tin 10 82% 9% 9%
Copper 11 60% 30% 10%
Brass 19 79% 10% 5%
Silver 12 42% 58% -
Table VII illustrates the market range of the surveyed firms.
It is evident from these responses that the local jewelry in-
dustry is an export activity. While almost one-half of the
enterprises do some business locally, over two-thirds sell to
-30-
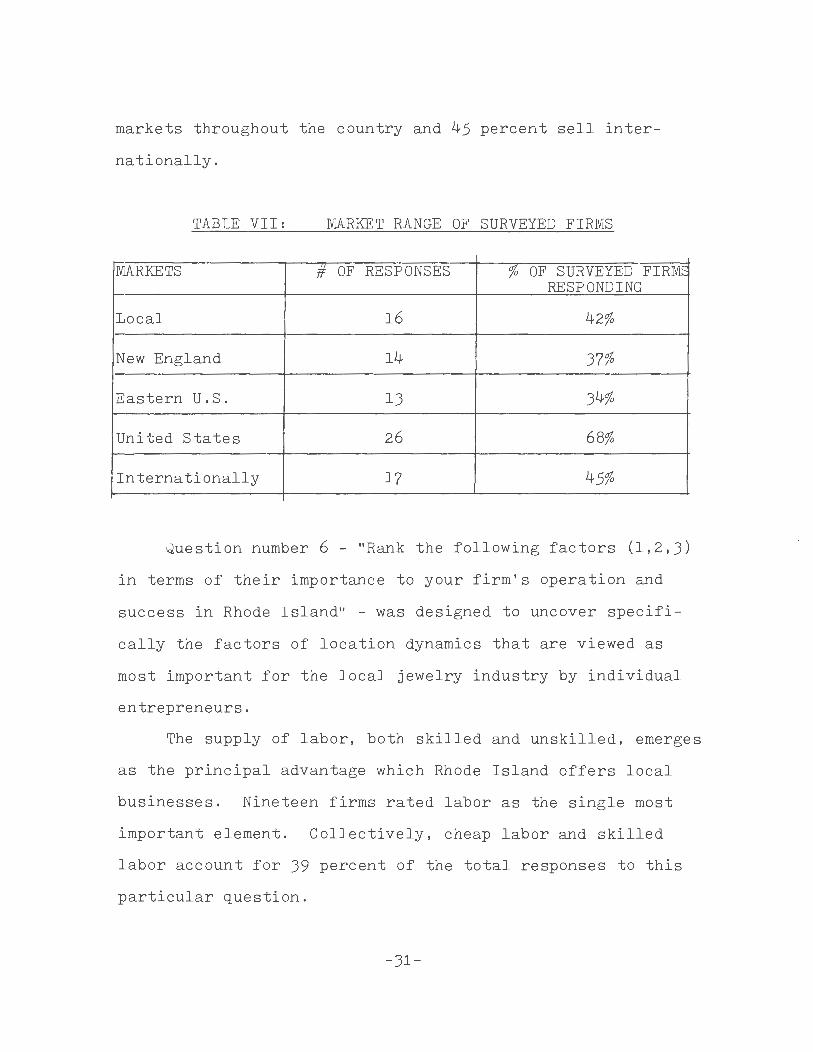
markets throughout the country and 45 percent sell inter-
nationally.
TABLE VII: MARKET RANGE OF SURVEYED FIRMS
MARKETS 1f OF RESP ONSES % OF SURVEYED F IRM~ RESPONDING
Local 16 42%
New England 14 37%
Eastern U.S. 13 34%
United States 26 68%
Internationally 17 45%
Question number 6 - "Rank the following factors (1,2,3)
in terms of their importance to your firm's operation and
success in Rhode Island" - was designed to uncover specif i-
cally the factors of location dynamics that are viewed as
most important for the local jewelry industry by individual
entrepreneurs.
The supply of labor, both skilled and unskilled, emerges
as the principal advantage which Rhode Island offers local
businesses. Nineteen firms rated labor as the single most
important element. Collectively, cheap labor and skilled
labor account for 39 percent of the total responses to this
particular question.
-31-

TABLE VIII: THE MOST IMPORTANT ADVANTAGE RHODE
ISLAND OFFERS AS A LOCATION FOR SURVEYED FIRWS
PERCEIVED ADVANTAGE RANK TOTAL 1 2 ]_
Supply of Inexpensive Labor 9 9 7 25
Supply of Highly Skilled Labor 10 3 2 15
Proximity of Markets 6 3 2 11
Proximity of Materials 2 8 9 19
Proximity to Related Firms and Activities 8 7 5 20
Existence of a Good Transportation System 1 5 5 11
Other 1 0 0 1
A distant second to labor is the proximity to related jewelry
firms and activities. This category includes the supportive
shops which specialize in various activities of the manufacturing
process. The linkages between these firms manufacturing similiar
or related products is supported by the high percentage of busi-
ness which occurs locally as shown in Table V. The existence
of these agglomerations was listed twenty times as one of the
top three advantages which Rhode Island offers.
A third factor which emerges as being significant is the
proximity to raw materials . As previously noted, the large
-32-

majority of important material inputs are purchased within
the State . Though only two firms consider the proximity to
these inputs of primary importance, a number perceive it as
a strong secondary factor . This may be due to the fact that
the jewelry industry is very sensitive to rapid changes in
styles and tastes . The close proximity to these materials
allows firms to maintain small inventories which enables them
to quickly accomodate changes in demand .
The existence of a good transportation system and the
proximity to markets are seen by local firms as less critical
elements in their production process . This may be explained
in part by the fact that finished products in jewelry manu
facturing contain a high value-to-bulk ratio. The acquisition
and the distribution of these factors represent a small por
tion of the total production costs . Therefore these elements
are not perceived as major determinants of location .
Table IX illustrates the relationship of these factors
just examined to the size of the firm . All firms responding
to the survey, regardless of size, view the local supply of
unskilled and therefore cheap labor as a major local competi
tive advantage. The term cheap in this instance is relative.
Unskilled labor in other regions of the country may be pro
vided at rates lower than those historically offered in New
England . The difference, however, lies in the availability
of unskilled labor combined with other local advantages, and
labor ' s price relative to the capital investments of machinery .
-33-

TABLE IX: ADVANTAGES BY FIRM SIZE
PERCEIVED SMALL MEDIUM LARGE TOTAL ADVANTAGE 0-49 Emp. 50-99 Emp. 100+ Emp .
I % #
.,. % # ~· % # % # I I I
I I I l .i
Supply of Inexpensive I I I I
13 I 25% 5 I 22% 7 I 26% 25 I 25% Labor I I I I
I I I I L
Supply of Highly I I I I
5 I 10% 6 I 26% 4 I 15% 15 I 14% Skilled Labor I I I I
I I I I .i. _J_
Proximity to I I I I
8 I 15% 1 I 4% 2 I 7% 11 I 11% Markets I I I I
I I I I _J_
Proximity to I I
17% 4 I 17% 6 22% 19 I 19% Materials 9 I I
I I .i l
Proximity to Related I I I I
Jewelry Firms and 9 17% 4 I 17% 7 26% 20 I 20% I I
Activities I I I I
T T I Existence of a Good I
7 13% 3 I 13% 1 4% 11 I 11% Transportation System I I
I I
1 T 2% 0 0 0 I 0 1 I I% Other I I I I I I
L .1. I
I I I T
TOTAL I 99%
I 99%
I 100% 102
I 101% 52 I 23 I 27 I I
: I I I I I I

Jewelry is a labor intensive activity . During the in
dustry's formative years, the labor participation rate among
dependent laborers in the region was sufficiently high to
provide an adequate supply of workers . Though the production
processes have improved over the past generations, the industry
remains characterized by a large number of tasks requiring simple
hand skills. The ability to substitute low labor costs for
capital investments has been critical to the local industry's
competitive position . The high degree of interdependence of
firms within the industry has enabled this condition to develop .
Firms of large scale production have the capacity to purchase
the necessary machinery required for many operations . These
same firms are very dependent on the many smaller jobber shops
to provide specialized inputs . The smaller jobber shops can
operate successfully without buying much machinery by hiring
a group of unskilled workers to produce items to sell to the
larger businesses . Thus, though unskilled labor may be rela
tively cheaper in other regions, the industrial infrastructure
that has developed in Rhode Island is not available . This ana
lysis seems to be supported by the fact that as the size of
the firm increases, the importance of the other local factors
examined in reducing overall operational costs appear to weaken.
As the scale of production expands, businesses tend to emphasize
increases in production and output rather than simply reduction
of costs .
Firms employing less than 50 people exhibit the greatest
-35-

dependency on outside activities which aid in reducing pro
duction costs . The existence of a reliable and inexpensive
transport facility (JSA), the proximity to markets, close and
easy access to related firms, and the proximity to materials
all serve to reduce the acquisition and distribution costs
for these specialty shops . Rhode Island offers the oppor
tunity for small shops to enter the market with a minimum of
initial capital investment and operating expenses. Highly
skilled and highly paid labor is the weakest local advantage
perceived by these smaller firms primarily due to its expensive
nature .
Medium size firms, those employing 50-100 people, demon
strate similiar responses to the small firms in the catego-
ries of unskilled labor, proximity to material and related ac
tivities, and the existence of a good transportation system .
The differences occur in the importance placed on the supply
of highly skilled labor and the proximity to markets . As a
business increases in size , it tends to expand and diversify
its product line. This creates a greater demand for highly
skilled artisans and technicians which incur greater operational
costs. The emphasis begins to change from the strict concern
for reducing expenses to that of increasing output. The de
velopment and supply of a labor force particularly productive
in the required tasks is seen as the primary local competitive
advantage by medium size firms. The four percent response rate
to proximity of markets illustrates these enterprises' minor
-36-

concern for the distribution costs of their product . Trans
portation remains relatively important partly due to cheaper
costs, but also because of the local system's efficiency and
speed in delivering products anywhere in the country . It is
not clear at this stage whether the proximity to materials
and related firms is a result of the tendency to maintain lower
costs or due to the desire to increase productivity . This
trend, however, becomes fully exposed by the responses genera
ted from firms employing over 100 people .
Distribution costs, as represented by the proximity to
markets and the existence of a g ood transportation system, are
clearly of minor importance for larger firms . Skilled labor
remains a vital concern, but is secondary to the two most in
fluential local advantages; the proximity to materials and
the proximity to related jewelry firms and activities .
As previously discussed, jewelry manufacturing is very
sensitive to changes in tastes. It is critical for firms of
large scale operation to be able to quickly chang e production
in response to shifts in demand . The proximity to the material
inputs provides the opportunity to quickly effectuate these
changes.
One of the prevalent practices of the local jewelry industry
is the subcontracting out several of the specific tasks leading
to the final product . A very large percentage of the local
business occurring within the state and the New England region
(See Table V) is precisely this type of activity. According
to the results in Table VII, larger firms are highly dependent
-37-

on these developments. In fact, the existence of these smaller
shops providing specialized inputs is considered the single
most important advantage which Rhode Island offers firms of
large scale operation.
In summary, this survey indicates that smaller firms rely
on the existence of external activities in order to keep pro
duction costs at a minimum . As the scale of production in
creases, savings from these external economies exert a weaken
ing locational pull. Larger firms are more concerned with
maximizing output with the aid of local subcontractors and the
proximity to materials.
Rhode Island provides an opportunity and competitive ad
vantage for small firms to enter the market and continue opera
tion . These specialized shops require little capital invest
ment to initiate production. Locally there exists a supply
of cheap labor, proximity to required materials, a means to
quickly and cheaply transport their goods, and the existence
of a local market in the clustering of related jewelry ac
tivities to sell the processed product. Larger firms are aided
in their production by the large number of small subcontractors,
the development of a highly skilled labor force to draw upon ,
the proximity to materials and the supply of unskilled labor .
Let us now turn to the next chapter which discusses the
jewelry industry's importance as an exporting activity and its
relationship to the Rhode Island Economy .
-38-

FOOTNOTES-CHAPTER II
1Douglas Johnson, "The Rhode Island Jewelry Industry-Perspectives on Development and Reform ," (Mimeographed, 1976). p. 37.
2Rhode Island Department of Economic Development, Rhode Island Basic Economic Statistics-The Econom , Summary , and Trends 1977-1978, (1977), p. 10 .
3costume Jewelry SIC Code 3961; Jewelry and Precious Metal SIC Code 3911; Jeweler's Materials and Lapidary Work SIC Code 3915. The Rhode Island Jewelry and related industry also includes manufacturers of Silverware and Plated Ware, Watch Part Suppliers , Stone Dealers, and Metal Suppliers .
4u.s., Department of Commerce, Bureau of the Census, 1972 Census of Manufacturers , vol. II, Industry Statistics , pt. 3,
5Ibid., pt. 3.
6u.s ., Department of Commerce, Bureau of the Census, Biennial Census of Manufacturers, 1921.
7u.s., Department of Commerce, Bureau of the Census, 1947 Census of Manufacturers, vol. II, Statistics by Industry.
8George R. Frankovich , The Jewelry Industry, (Providence: Manufacturing Jewelers and Silversmiths of America, n.d.) , p. 10.
91947 Census of Manufacturers , op. cit.
10 U.S. , Department of Commerce , op. cit. 1947, 1963, and 1972.
11Ibid.
121972 Census of Manufacturers, op. cit.
-39-

lJJohnson, op.cit., p. 10
14Frankovich, op. cit., p. 9.
l5 h •t 12 Jo nson, op. c1 . , p. .
16Ibid., p. 12.
17Ibid., p. 16.
18Biennial Census of Manufacturers, 1921, op cit.
l9Rhode Island Department of Economic Development, op. cit., p. 104.
20Ibid., p. 104
21Interview with James P. O'Donnel, Director of Education and Training, Manufacturing Jewelers and Silversmiths of America, Providence, Rhode Island, 22 April 1977.
22 Ibid.
23Frankovich, op. cit., p. 20.
24August Losch, Economics H. Waglam and Wolfang Stapler. versity Press, 1954), p. 4.
of Location, trans. William (New Haven: Yale Uni-
25Rhode Island Department of Economic Development, op. cit., p. 105.
26Ibid., p. 105.
27Ibid., p. 106.
-40-

CHAPTER THREE:
THE JEWELRY INDUSTRY AND THE RHODE ISLAND ECONOMY
Economic development occurs across the nation in an un
even fashion. That is to say, certain regions in the country
develop faster and/or differently from other regions. The
Export-Base Theory of economic growth proposes that this un
balanced spatial concentration of economic activities is the
result of competition between regions and their abilities to
export locally produced goods at a competitive advantage. 1
This concept maintains that the major factor stimulating local
economic development is the expansion of an area's export base.
According to the theory, the structure of the economy
is divided into two essential activities - the 'Basic' which
produces goods and services for export to customers outside
of the region, and the 'Non-Basic' production of goods and
services for internal consumption. The basic industries are
considered as the key to an area's economic vitality. The
ability to export generates a flow of money into the region
which stimulates internal development. Some of these internal
developments are related directly to the export activity.
Others manifest themselves in the expansion of local markets
for other goods and services. Thus, for example, the growth
of the automobile industry in Detroit has resulted in the pro-
-41-

liferation of supporting activities which supply direct in-
puts into the industry. The increased spendable income from
expanded employment stimulates demand for new housing, food,
recreation, clothing, and other goods and services.
The basic and non-basic elements of regional economic
growth are brought together in the concept of competitive
advantage . Regions tend to differ by what happens to the
income generated from export sales and by the type of develop-
ment associated with the export sector. Any advantage which I
a particular region may have vis a vis other regions is, of
course, relative. 2 Improved methods of transfer, labor uti-
lization, material use, changes in production costs, shifts
in taste, and so on exert changes in the competitive advantage
among regions.
JEWELRY AS AN EXPORT INDUSTRY
The concentration of the jewelry industry in a few select
geographic locations clearly indicates its nature as an ex-
porting activity. The survey responses in Chapter Two delin
eating the market range of the sampled Rhode Island firms
further supports this contention . The magnitude to which the
industry produces for external consumption, however, may not
be fully appreciated . Therefore, to more clearly illustrate
the degree to which the industry exports its products, the
following section measures the Rhode Island jewelry industry ' s
capacity as an export activity.
-42-
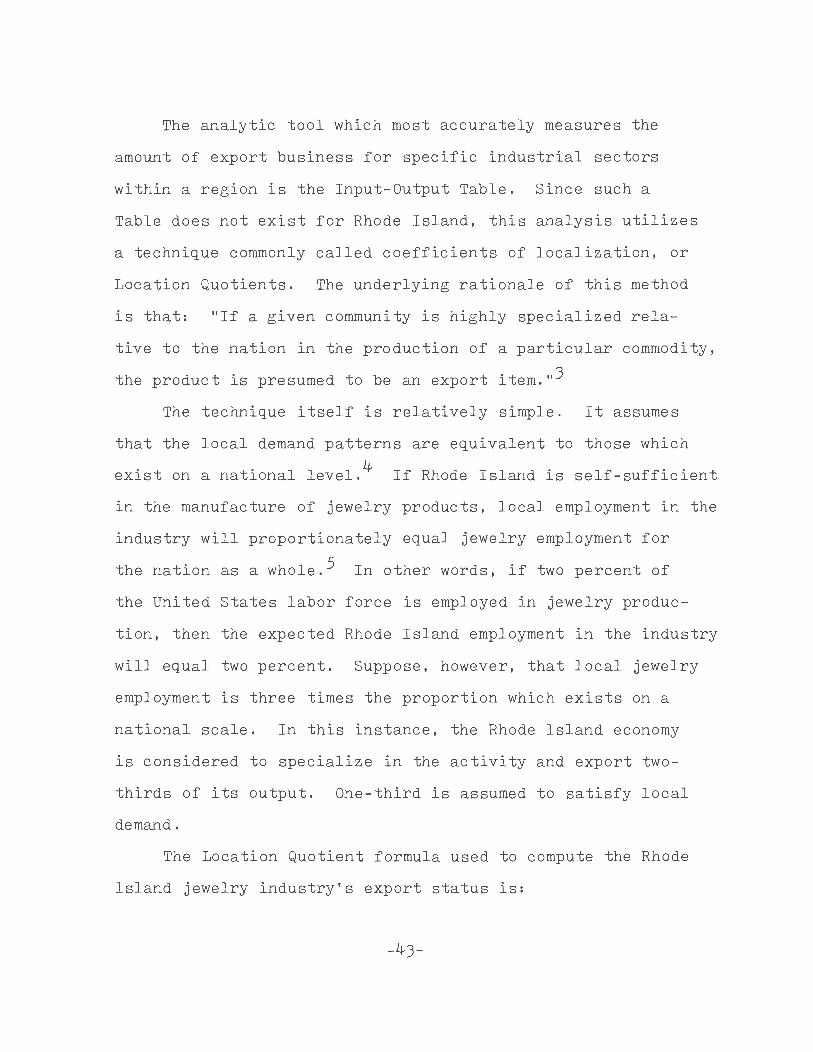
The analytic tool which most accurately measures the
amount of export business for specific industrial sectors
within a region is the Input-Output Table . Since such a
Table does not exist for Rhode Island, this analysis utilizes
a technique commonly called coefficients of localization, or
Location Quotients . The underlying rationale of this method
is that : "If a given community is highly specialized rela-
tive to the nation in the production of a particular commodity,
the product is presumed to be an export item. "J
The technique itself is relatively simple. It assumes
that the local demand patterns are equivalent to those which
exist on a national level .4 If Rhode Island is self-sufficient
in the manufacture of jewelry products, local employment in the
industry will proportionately equal jewelry employment for
the nation as a whole . 5 In other words, if two percent of
the United States labor force is employed in jewelry produc-
tion, then the expected Rhode Island employment in the industry
will equal two percent . Suppose, however, that local jewelry
employment is three times the proportion which exists on a
national scale . In this instance , the Rhode Island economy
is considered to specialize in the activity and export two-
thirds of its output . One-third is assumed to satisfy local
demand .
The Location Quotient formula used to compute the Rhode
Island jewelry industry's export status is :
-43-

x
Total R.I. Manufacturing Employment
= National Employment in
the Jewelry Industry Total National Manufacturing
Employment
Solving for X determines the number of workers which
would be employed in the Rhode Island jewelry industry if
it produced sufficient amounts to supply its own needs.
The base year for our analysis is 1972. National manu
facturing employment for that year reached 18,841,000, while
Rhode Island supported 115,900 workers in manufacturing in
dustries.6 For the same period, the jewelry industry listed
62,000 employees across the United States.? Assuming Rhode
Island is self-sufficient in the production of jewelry goods,
expected state employment would equal .0032 of the local labor
force, or 381 workers.
x 62,000 = x = 381
115,900 18,841,000
According to the 1972 Census of Manufacturers, 18,100
people were employed in the State's jewelry industry. There-
fore, the Location Quotient method indicates that 17,719
(18,100 - 381) of the local industry's 18,100 workers, or
98 percent, are engaged in exporting.
Having established the approximate magnitude of the
jewelry industry's export nature, we must now turn to evaluate
its influence of the State economy. The fact that a parti-
cular industry is engaged in exporting activities does not
-44-

automatically indicate positive local impact . Exports may
be described as 'good' or 'bad' for reg ional economic ex-
pansion depending upon t heir capacity to provide stimulating
economic linkages with the local economy . A predominately
export industry which is capital intensive and which exhibits
weak linkages with the regional economy in itself does little
to encourage economic growth . A regional exporter can be
described as good based on the degree to which it meets the
following criteria :
1) Manufactures a product of growing national demand .
2) Is characteri zed by extensive regional for ward and backward linkages .
3) Has a high regional multiplier .
DEMAND
Over the past forty years , the Rhode Island jewelry in-
dustry has grown by leaps and bounds . The most recent avail
able data on the industry shows a yearly high employment for
1977 exceeding 31,000. 8 This is an i ncrease of 17,200 jobs ,
or 125 percent , since 1939 . 9 More recently , the industry has
expanded by approximately 5 , 000 j obs in the past thirty months . 10
The industry growth is not limited to the local area .
On the national level jewelry manufacturing has continued to
expand its markets, though at a somewhat slower pace . In
the nine years between 1963 and 1972 , the country's jewelry
employment increased 15,259, or 33 percent . 11 More signi-
-45-

ficantly, however, has been the growth of value added by manu-
facturing and the total value of industry shipments.
TABLE X: GROWTH OF THE U.S. JEWELRY INDUSTRY FOR SELECTED
YEARS 1947, 1963, AND 1972
YEAR VALUE ADDED BY MANUFACTURE
VALUE OF INDUSTRY SHIPMENTS
TOTAL EMPLOYMENT
1947
1963
1972
($ MIL) ($ MIL)
258.5 448.8 52,736
402.1 827.5 46,741
1,921 . 8 62,000
SOURCE : U. S. Department of Commerce, Bureau of the Census Census of Manufacturers, 1947, 1963, 1972.
The large increases in value added compared to employment
in the years 1947-1972 indicate the improved productivity of
the industry since World War II. Combined with a quadrupaling
in the total of merchandise shipped, the above figures illus-
trate the continued growth and expansion of the demand for
jewelry items. The importance to the State economy of jewelry
manufacturing 's continued vitality manifests itself in the
linkages which the industry has established locally.
LINKAGES
The second criteria for determining a good export activity
-46-

is the forward and backward linkages which the industry main
tains with the local economy. Perhaps the most distinguishing
feature of jewelry manufacturing is its dependence upon and its
support of a host of related enterprises which supply specific
inputs into the production process. For analytic purposes, this
paper has defined the jewelry industry as specifically comprised
of three Standard Industrial Classifications: SIC 3961, Costume
Jewelry; SIC 3915, Jeweler's Materials and Lapidary Work; and
SIC 3911, Jewelry and Precious Metals. Within Rhode Island, how
ever, there are a series of related activities which comprise the
jewelry manufacturing infrastructure and contribute greatly to
Rhode Island's competitive advantage.
REGIONAL MULTIPLIER
The 216 firms in Table XI on the following page represent
development which is directly related to jewelry manufacturing.
They do not indicate the indirect linkages which the industry
creates. These indirect linkages determine the level of the in
dustry's regional multiplier. Multipliers may be defined as that
proportion of the return from the export sector which finds its
way into active demand for regional goods and services. 12
A rigorous analysis which traces the specific linkages and
multipliers of the jewelry industry within the Rhode Island eco-
nomy is available in Input-Output analysis. As previously men
tioned, this data does not exist for the Rhode Island economy.
However, the labor intensive nature of jewelry manufacturing may
provide an indirect measurement of the industry's regional multiplier.
-47-

TABLE XI: RELATED ACTIVITIES TO JEWELRY MANUFACTURING IN RH ODE ISLAND 1977-1978
ACTIVITY TYPE NUMBER OF FIRMS
Boxes, Cases, Cards & Displays
Brazing Alloys, Flux & Mill Products 9
Casting Equipment & Suppliers 58
Electroplating Equipment & Suppliers 21
Stone Dealers & Misc. Suppliers 46
Watch Part Suppliers 26
TOTAL 216
SOURCE: Manufacturing Jewelers and Silversmiths of America, 1977-1978 Buyers' Guide, (Providence: 1976).
The Rhode Island jewelry industry reported total wages
of $234,142,269 for the year ending December, 1976. 13 Let us
suppose that 50 percent of this income is spent locally on
goods and services. 14 This is called the "propensity to
consume locally." (The remaining 50 percent of the income
may be divided among savings, taxes, and goods purchased out-
side of the region.) Now, the total propensity to consume
locally does not necessarily become local income. A portion
of the money may bring in merchandise from outside of the
-48-

State, may go as wages to non-residents, or may support other
non-local sources. Suppose that 40 percent remains as local
income. Therefore, out of every dollar of local income, 50
cents will be spent locally on consumer goods and services,
and 40 percent of this 50 cents, or 20 cents, remains local
income.
This, however, does not complete the process of income
multipliers. The 20 cents additional local income will again
be spent locally by consumers, creating increased local in-
come; and so on and so on. A multiplier formula which can
compute the successive rounds of income generated by the
original export dollar is:
TOTAL INCOME
= EXPORT INCOME
x 1
1- (propensity to consume locally X income created per dollar of local consumption sales).
The application of this equation is much less complicated
than at first may appear. As discussed earlier, 98 percent of
Rhode Island jewelry production involves exporting. Therefore,
98 percent of the industry's total wages, $2J4,142,269, equals
export income; $229,459,410.
Utilizing the figures on local income discussed above,
the second term on the right hand side equals:
= = 1.25. 1 1
1 - (.5 x .4) 1 - .2
Therefore:
Total income= $229,459,410 X 1.25 - $286,823,750.
-49-

Forgetting for a moment the direct benefits and other
indirect linkages which the Rhode Island jewelry industry
maintains with the State economy, employment in this activity
generates $286,823,750 of local income . The bulk of this
money is from external sources, injecting new dollars into
the local economy. While this analysis was not intended to
represent a rigorous examination of the jewelry industry's
relationship to the State economy, it clearly indicates its
influential position . The industry's income flow combined
with the expanding demand for jewelry products contains
important implications for the future economic development
of Rhode Island.
This study thus far has concentrated on the economics
of the Rhode Island jewelry industry. We have studied its
historical development, examined the State's competitive ad
vantage for jewelry production, and analyzed the industry's
relationship to the local economy.
Assuming that external forces cause the forced closing
of electroplating firms in the State, the impact on the
economy will far exceed the first round losses of employment.
Second round effects may be felt most severely by related
jewelry enterprises which depend upon these jobber shops for
specialized inputs. As this process continues, the local
competitive advantage will slowly erode, as more and more
small shops are forced to close . The ultimate loser will,
-50-

of course, be the Rhode Island economy. The loss of a grow
ing industry which brings in million of dollars of related
business would prove a very severe blow to the state's future
development.
The external force of which we are speaking is the
Water Pollution Control Act Amendments of 1972. The follow
ing two chapters of this study examine the Federal Act, in
cluding a discussion of legislative requirements, intent, en
forcement procedures, and relationship to the jewelry industry.
These sections attempt to bridge the gap of understanding be
tween the economists and the environmentalists. Once the
problem has been properly defined, only then can proper steps
be taken to eradicate it.
-51-

FOOTNOTES-CHAPTER III
1Harvey Perloff and Lowden Wingo, Jr., "National Resource Endowment and Economic Growth," in Regional Policy-Readings in Theory and Applications, ed. John Friedmann and William Alonso (Massachusetts: The MIT Press, 1975), p. 316.
2Ibid., p. 317.
3charles M. Tiebout, The Community Economic Base Study, (New York: Committee for Economic Development, 1962), p. 47.
4The principal assumption underlying the Location Quotient technique is that local residents have the same demand patterns which prevail on the national level. The nature of demand for jewelry products appears to be consistent with this statement. A second common criticism directed towards this method arises from the possibility that the study area may be more or less productive than the national average in output per employee. This problem, however, is easily solved by examining data on value added. According to the 1972 Census of Manufacturers, the industry value added average per employee for 1972 was $14,982, compared to $14,104 for New England and $15,349 for the Mid-Atlantic region. This difference may be attributable to the concentration of precious jewelry production in New York compared to costume jewelry manufacturing in Rhode Island. Adjusting for the deviation would indicate that our analysis of Rhode Island's exporting nature may be overstated by as much as six percent; an insufficient degree to invalidate our analysis.
5For purposes of measurement and definition, jewelry employment will be limited to the following Standard Industrial Classifications: SIC 3961, Costume Jewelry; SIC 3915, Jeweler's Materials and Lapidary Work; and SIC 3911, Jewelry and Precious Metals.
6Federal Reserve Bank of Boston, ''New England Economic Indicators," (Boston: Federal Reserve Bank, December, 1972), p. 5.
7u.s. ,Department of Commerce, Bureau of the Census, 1972 Census of Manufacturers, vol. II, Industry Statistics, pt. 3,
-52-

8Interview with Jerome Lessuch, Economist, Rhode Island Department of Economic Development, Providence, Rhode Island, 1 June 1978.
9Rhode Island Department of Economic Development, Rhode Island Basic Economic Statistics-The Economy, Summary, and Trends 1977-1978, (1977) p.
10Interview with Jerome Lessuck, op. cit.
111972 Census of Manufacturers, op. cit.
12 Perloff and Wingo, op. cit., p. 318.
l3Rhode Island Department of Employment Security, "Employment Covered by the Employment Security Act - 1976."
14Tiebout, op. cit., p. 59,
-53-

CHAPTER FOUR:
WATER POLLUTION CONTROL ACT AMENDMENTS OF 1972
In early February, 1971, a Congressional Subcommittee
on Air and Water Pollution published the results of a two
year study which concluded that" ... the national effort to
abate and control water pollution had been inadequate in
every vital aspect." 1 Existing federal legislation had
failed to effectively enforce standards which substantially
reduced the amount of pollution entering the country's water
systems. These findings encouraged Congress on October 18,
1972 to enact the Federal Water Pollution Control Act
Amendments of 1972. This Act represents the most signifi
cant federal commitment to date for the protection and res
toration of the nation's deteriorating water quality.
Chapter Four is designed to introduce the reader to the
intent and operation of the present water quality control
legislation. It examines both the state and federal roles,
focusing upon the Act's specific programs and policies to
achieve its goal of eliminating discharge pollutants into
the nation's navigable waters by 1985. 2
THE EXPANDING FEDERAL ROLE
Prior to 1965, federal legislation in the arena of water
-54-

quality control delegated prime responsibility to the states
" ... to prevent, control and abate water pollution. ,,J Federal
participation consisted primarily of financing research pro-
jects demonstrating new technologies and providing loans for
the construction of improved facilities.
The first major piece of legislation which recognized
the increasing severity of water pollution and the need for
increased federal involvement was the Water Quality Control
Act of 1965. This act represented a significant break with
previous efforts by authorizing a greater degree of federal
participation and calling for the promulgation of a national
policy regarding the continued pollution of the nation's
water systems.
A significant feature included in the new legislation
was the requirement that each state develop standards for
water quality for all interstate waters flowing within their
boundaries. These guidelines were to be submitted to the
newly organized Federal Water Pollution Control Administra
tion for approval by July 1, 1967. Once adopted, these per-
formance criteria were intended to serve as:
1) measures of performance establishing the maximum levels of pollution allowable in interstate waters.
2) avenues for legal action against offending polluters. 4
By 1971, only 27 of the 54 jurisdictions covered by the
program had adopted approved water quality standards.5 In
only one instance was an illegal discharger of pollutants
taken to court for remedial action. 6 By the early 1970's it
-55-

had become clear that existing federal water quality control
programs were unable to effectively curtail the dumping of
wastes into water systems and thus failed to alleviate
pollution and the rapid degradation of the nation's rivers,
streams, lakes , and oceans. The growing need for improved
mechanisms to restore the" ... natural chemical, physical, and
biological integrity of the Nation's waters"? prompted the
Congressional Subcommittee on Air and Water Pollution to re-
commend the adoption of a national policy for water quality
control which included:
1) The elimination of polluting discharges into navigable rivers by 1985;
2) The achievement of an interim goal of water quality by 1983 providing for the protection and propagation of fish, shellfish, and wildlife;
J) The prohibition of toxic discharges in toxic amounts;
4) The initiation of a major research and demonstration effort to find the technological methods necessary to eliminate waste discharges . 8
These recommendations eventually became incorporated as
the principal goals of the most recent Congressional water
quality control legislation, the Federal Water Pollution Con-
trol Amendments of 1972.
1972 WATER POLLUTION CONTROL ACT
Public Law 92-500, the Federal Water Pollution Control
Act Amendments of 1972, is the most comprehensive and expen
sive legislation attacking the problem of continued degrada-
tion of the nation's water quality. In order to achieve the
-56-

goal of eliminating discharge pollutants into the nation's
navigable waters by 1985, the Act provides for expanded
federal involvement; increased funding for planning and
the construction of new facilities; improved regulatory
controls; and, perhaps most significantly, changes in the en
forcement mechanism and procedure.
Under the 1965 Water Quality Control Act, water quality
standards were to be established by each state as the water
quality control mechanism. States were given prime respon
sibility to determine the kinds and amounts of pollutants to
be permitted, the degree of pollution abatement required,
and the time allowed for abatement control.9
This program met with limited success. In addition to
the failure of most states to publish approved standards,
difficulty arose in translating water quality standards into
effluent limitations which would be upheld in a court of law.
The 1972 Act establishes that effluent limitations, not water
quality, will form the basis for the prevention and elimina
tion of pollution. "Except as in compliance with this sec
tion ... the discharge of any pollutant by any person shall be
unlawful. 1110
Thus, water quality has become a measure of program ef
fectiveness and performance, not a means of elimination and
enforcement. In order to achieve this goal, the legislation
requires that pretreatment guidelines and standards be deve
loped which provide a mechanism for the control of industrial
-57-

pollutants introduced into publicly owned treatment works
(POTW's). Under Title III of the Act, "Standards and En
forcement," Section 304 (f):
" ... the Administrator shall publish ... guidelines for pretreatment of pollutants which he determines are not susceptible to treatment by publicly owned treatment works. Guidelines under this subsection shall be established to control and prevent the discharge into navigable waters, the contiguous zone, or the ocean of any pollutant which interferes with, passes through, or otherwise is incompatible with such works. 11 11
These guidelines are intended to establish an approach
for a uniform national pretreatment policy. In addition,
the Environmental Protection Agency is required to establish
standards of performance for specific categories of discharge
sources and types of pollutants. These performance require-
ments set forth rules and regulations designed to protect
POTW's from possible harmful effects of industrial waste-
waters introduced into the systems. These standards must
reflect the maximum reduction of pollution possible through
12 the use of the "Best Available" control technology.
Twenty-four industrial categories and forty-two specific
pollutants are listed by the Act to be covered by these
standards. 13
The enforcement of these performance criteria is designed
to be accomplished through the use of an expanded permit pro
gram. This system establishes a direct link between the
federal government and each industrial source of discharge
-58-

into navigable waters. According to Section 402 (a):
" ... the Administrator may, after the opportunity for public hearing, issue a permit for the discharge of any pollutant, or combination of pollutants ... upon condition that such discharge will meet all applic~ble requirements ... of this Act. 11 14
Civil and criminal penalties are provided the adminis-
trator to enforce permit violations.
"Any person who willfully or negligently violates any permit condition or limitation ... shall be punished by a fine of not less than $2,500 nor more than $25,000 per day of violation, or by imprisonment for not more than one year, or both."15
In addition to these functions, the bill provides for
increased federal involvement in planning, research and
development, and construction of new facilities. For ex-
ample, to assist the states and localities, the Act pro-
poses a four year program of federal grants for the con-
struction of sewage treatment plants. The federal match,
totaling $14 billion through fiscal year 1975, can equal up
to 75 percent of the project's cost. Additional monies are
allocated for the development and preparation of comprehen-
sive plans and for the purpose of demonstrating new and
improved methods of preventing, reducing, and eliminating
polluting discharges.
In each case where the bill authorizes the Environmental
Protection Agency Administrator to regulate and enforce the
performance criteria, states have the option to develop
-59-

superior programs of local control. However, to insure the
active involvement of each state in the program, the legis-
lation mandates that the Governors develop plans for area-
wide waste treatment management within their boundaries.
Section 208 requires that regional water quality management
plans be developed and implemented to assure adequate control
of all sources of pollution in each state . 16 This section
provides for the development of an areawide plan to inven-
tory , evaluate, and manage all activities associated with
the generation of point and non-point sources of pollution .
In response to these requirements, the Rhode Island
Governor Philip Noel designated thirty-eight Rhode Island
municipalities and the neighboring Massachusetts communities
of Blackstone and Millville as one planning area . He named
the Rhode Island Statewide Planning Program as the agency
charged with the preparation of the '208' Plan . On June 25,
1975 the Environmental Protection Agency approved the program
and awarded $2 . J million in federal funds to carry out clean
water planning in t he State .
STATE WATER QUALITY CONTROL
The main objective of the Rhode Island '208' Planning
Program is to develop a water quality management plan which
is capable of attaining the Act's goal of eliminating dis
charge pollutants by 1985. 17 To achieve this objective, the
Rhode Island Statewide Planning Program has established a
-60-

four point strategy.
1) Identification and Recommendations For All Point Source Pollution Sites.
This includes industrial and municipal discharges; sewage discharges and overflows; sludge from wastewater treatment plants; and an analysis of anticipated municipal and industrial treatment facilities and construction over a 20 year period.
2) Identification and Recommendations For All Point Pollution Sites.
Nonpoint pollution is defined as a generalized discharge of waste into a water body which cannot be located as to a specific source. It includes runoff water from sand and gravel operations, construction sites, roads, farms, and landfill sites.
J) Provisions For Proper Land Use as a Means of Controlling Water Pollution.
This involves the identification of physical constraints to development; the effects of existing plans on water quality, and the preparation of a land use plan that addresses water quality issues.
4) Recommendations For the Proper Legal, Institutional and Financial Arrangements of Water Planning and Management.
The fourth stage concerns the selection of management agencies to implement the plan with an examination of the expected costs and the economic, social, and environmental impacts. It includes the establishment of a regulatory process which provides for the evaluation and control of all point and nonpoint pollution sources; the regulation of location and construction of waste discharging facilities; and enforcement of satisfactory pretreatment requirements for commercial and industrial waste discharges into publicly owned treatment facilities.18
Currently, 21 of the 40 communities covered by the '208'
Program have publicly owned wastewater treatment and collec-
tion facilities available through either local or regional
systems. Within five years it is estimated that a total of
19 publicly owned treatment works will be in operation ser-
-61-

vicing domestic and industrial waste water from 28 cornrnuni
ties .19 To effectively manage the waste discharges into these
systems, the State of Rhode Island has adopted policies which
require that;
1) Industrial development causing other than domestic waste discharges occur only in areas served by public sewer systems.
2) Recycling of industrial wastes be undertaken whenever possible to conserve resources and reduce treatment problems.
J) Pretreatment of industrial waste be accomplished before discharge to a public sewer system wherever necessary.20
These policies in conjunction with the requirements of
PL 92-500 comprise the state of current water quality control
programs. Though expanded planning and demonstration activi-
ties are called for, the key to both the Rhode Island and the
Federal efforts is the establishment and enforcement of effec-
tive industrial discharge limitations. Chapter Five examines
these limitations in greater detail with a focus upon their
relationship to the jewelry industry.
-62-

FOOTNOTES-CHAPTER IV
1united States Congressional Code and Administrative News, p. 3674.
2The Federal Water Pollution Control Act Amendments of 1972, P.L. 92-500, 33 u.s.c. Section 101 (a) (1).
3united States Statutes at Large, P .L. 80-846. 80th Congress, 2nd Session, 1948.
4 op. Cit., U. S. Congressional Code, p. 3671.
5The 54 jurisdictions covered by the Act include the 50 States, the District of Columbia, Guam, Puerto Rico, and the Virgin Islands.
6In that case, involving a MidWestern City, after four years of litigation the city constructed a sewage treatment plant. Within two years, the plant was treating only half of the city's sewage. Five million tons of raw sewage were being dumped into the river each day.
?Public Law 92-500, Section 101 (a).
8op. Cit., U. S. Congressional Code, p. 3674.
9P.L. 89-234, U. S. Statutes at Large, 89th Congress, 1st Session, 1965.
lOOp. Cit., P.L. 92-500, Section 301 (a)
11Ibid., Section 301 (b) (1) (A) 12Ibid., Section 301 (b) (2) (A)
l3Included in these categories are Electroplating and non-ferrous metals manufacturing.
14op. Cit., P.L. 92-500, Section 401 (a) (1)
l5Ibid., Section 309 (c) (1)
16I bid.
l?Rhode Island Statewide Planning Program, Areawide Quality Management Plan. (Providence: November 197?). pviii.
-63-

18Rhode Island Statewide Planning Program, Project Control Plan Outline. Mimeograph.
19op. Cit., Areawide Quality Management Plan, p. 2.
20 rbid., p. 2.
-64-

CHAPTER FIVE:
JEWELRY MANUFACTURING AND INDUSTRIAL PRETREATMENT
The 1972 Water Pollution Control Act's primary emphasis
for achieving the total elimination of discharge pollutants
into the nation's waters by 1985 has been placed on the pro
mulgation of procedures for controlling the introduction of
wastes into publicly owned treatment works (POTW's). Accor-
ding to Section JO? (b) of the Act:
"The administrator shall. .. publish proposed regulations establishing pretreatment standards for introduction of pollutants into treatment works ... which are determined not to be susceptible to treatment ... or which would interfere with the operation of such treatment works."1
In response, the Rhode Island '208' Program has developed
policies which require that industrial development occur in
areas served by sewer and, most important, that pretreat-
ment of industrial waste be accomplished whenever necessary.
Chapter Five discusses the federal industrial pretreatment
program and its relationship to jewelry manufacturing.
ELECTROPLATING AND METAL FINISHING
Jewelry manufacturing, as previously discussed in Chap-
ter Two, is characterized by a series of operations involved in
the production of a finished item. The electroplating and
-65-

metal finishing steps are designed to improve both the surface
appearance and structural qualities of the metals. This is
achieved through a variety of electro-chemical procedures
such as electroless-plating, electrodeposition, anodyzing,
and chemical conversion. Stated more simply, these processes
involve the immersion of the metal in a bath of different
chemical and acid solutions which provide a decorative finish,
corrosion protection, special electrical and engineering pro-
perties, or an adhering base for painting and coating.
Following each process, the item is rinsed in a water
solution to remove the films of the processing baths from
the surfaces of the newly plated materials. In rinsing the
metal, the water becomes contaminated with concentrations of
the material being finished as well as the elements contained
in the processing solution. The major pollutants emitted in
this process along with average concentrations are listed
below in Table XII. While most of these materials are present
at low levels in normal domestic wastewater, the high concen-
trations emitted from metal finishing and electroplating ac-
tivities create significant adverse effects on secondary treat-
t f ·1•t• 2 men aci l ies.
According to the Water Pollution Control Act's perfor
mance standards (see Chapter Four p. 58) designed to protect
POTW's from harmful effects of industrial wastewater:
"Not later than July 1, 1983, effluent limitations for categories and classes of point sources shall require application of the Best Available technology economically available."3 (Emphasis added).
-66-

TABLE XII: METAL FINISHING AND ELECTROPLATING POLLUTANT CONCENTRATIONS
**
POLLUTANT AVERAGE C ONCENTRA TI ON, mg/1**
Zinc 10 - 100
Cadium 10 - 100
Nickle 10 - 100
Copper 10 - 100
Lead 10 - 100
Sodium 500
Aluminum 50 - 100
Chromium 10 - 50
Cyanide 20 - 100
Fluoride 5 - 500
Phosphate 5 - 500
These estimates are based upon 10,000-500,000 gallons of continuous and intermittent water flow.
SOURCE: U.S. Environmental Protection Agency, Office of Water Program Operations, Federal Guidelines - State and Local Pretreatment Programs, Vol. III, Appendix 8, p.8-9-9.
In the case of metal finishing and electroplating, the
"Best Available" technology determined by both the Environmental
Protection Agency and the Rhode Island '208' Program is onsight
wastewater pretreatment. 4
FEDERAL PRETREATMENT STANDARDS
Pretreatment is defined as "any operation or series of
-67-

operations which remove the incompatible pollutants from in
dustrial waste water to make it acceptable for discharge into
publicly owned collection and treatment facilities designed
to receive primarily municipal waste water."5
Generally, publicly owned treatment works are designed
to handle wastewaters that are amenable to treatment by settling
and biological decomposition. This process is biologically
dependent and sensitive to fluctuations in flow and the physical
and chemical characteristics of the waste water. Domestic
wastes usually present minimal problems to POTW's. Industrial
wastes, on the other hand, contain various amounts of hazardous
and toxic pollutants which may pass through the treatment faci
lity unaffected into the receiving waters or which may prevent
the POTW from operating effectively.
Interference with the operation of a POTW is caused by
a wide variety of chemical, biological, and physical phenomena.
Generally, interference consists not only of materials which in
hibit biological sewage treatment processes, but also substances
which cause problems in sewage collection systems, sludge dis
posal or utilization methods, water reuse, land application of
wastewater and other operations. Collection system problems
include fire and explosion potential, corrosion, and the clog
ging of screens with solids.
Whether a substance is inhibitory depends on a large
number of factors, including its concentration and synergistic
and antagonistic effects.
Synergism is defined as an increase in the inhibitory
-68-

effect of a particular substance caused by the presence of
another substance. 6
Antagonism is the opposite of synergism in that it is
defined as a decrease in the inhibitory effect of a substance
caused by the presence of another.?
Given the severity and complexity of the problems re-
lated to industrial pollutants, the Environmental Protection
Agency has established a national pretreatment program to
prevent problems caused by industrial contaminants discharged
into POTW's. The program is designed specifically to:
1) prevent the introduction of pollutants into POTW's which interfere with the operation of those POTW's; and
2) prevent the introduction of pollutants into POTW's which will pass through the treatment works or otherwise be incompatible with such works.8
In order to accomplish this mission, the Agency has es
tablished two sets of pretreatment standards designed specifi-
cally to prohibit the discharge of pollutants by any user of
a POTW which substantially interfere with the operation of the
facility.
The first set of standards are directed towards speci-
fie industrial categories which are believed to be discharging
pollutants of the greatest environmental concern. These standards
contain numeric limitations for pollutants emitted from the
classes of activities listed in Table XIII.
The second set, "prohibitive discharge" standards, have
been established for specific types of pollutants which are known
-69-

TABLE XIII: INDUSTRIES CONSIDERED FOR NUMERIC PRETREATMENT STANDARDS
S.I.C. TYPE OF INDUSTRY/PRODUCTS 22 Textile Mill Products
23 Apparel and Other Finished Products
24 Lumber and Wood Products (except furniture)
26 Paper and Allied Products
27 Printing, Publishing and Allied Industries
28 Chemical and Allied Products
29 Products of Petroleum and Coal
JO Rubber and Plastic Products
Jl Leather and Leather Products
J2 Stone, Clay and Glass Products
JJ Primary Metal Industries
J4 Fabricated Metal Products
35 Machinery (except Electrical)
J6 Electrical Machinery, Electronics and Allied Industries
37 Transportation Equipment
J8 Professional, Scientific and Controlling Instruments; Photographic and Optical Goods; Watches and Clocks
39 Jewelry, Jewelry Findings, Silverware and Related Items
49 Electric, Gas and Sanitary Services
72 Personal Services (Laundries , Photo Studios, Beauty and Barber Shops , etc . )
SOURCE : Areawide Water Quality Management Planning Project , Technical Memorandum : Control of Industrial Wastes Discharged to Publicly Owned Treatment Works, p . 14 .
to substantially interfere with or pass through POTW ' s with
secondary treatment , as shown in Tables XIV and XV .
Both sets of regulations have a very definite influence
on the jewelry industry. First, Standard Industrial Classifi-
-70-

TABLE XIV: POLLUTANTS THAT MIGHT INTERFERE WITH POTW'S
Inorganic Substances
Acidity, alkalinity Ammonia Alkali and alkaline
earth metals Arsenic Borate Cadmium Chloride Chlorine
Organic Substances
Alcohols Phenols Chlorinated hydro-
carbons Chloroform Carbon tetrachloride Methylene Agricultural chemicals Organic nitrogen
compounds Surfactants Misc. organic
chemicals Oils and grease
Other Substances
Corrosive materials Materials that cause
sewer blockages Explosive and flam
mable materials High temperature
wastes
TABLE XV: POLLUTANTS THAT MIGHT PASS THROUGH POTW'S
Cadmium Chloride Chromium Cyanides Lead Mercury Copper Nickle Zinc
Iron Manganese Phosphorus Nitrogen Phenolics Oils and grease Organic carbon Suspended solids Radioactive wastes
SOURCE: Areawide Water Quality Management Planning Project, Technical Memorandum: Control of Industrial Wastes Discha:rged to Publicly Owned Treatment Works, pp. 6-7,
cation 34 - Fabricated Metal Products, and 39 - Jewelry, Jewelry
Findings, Silverware and Related Items, are included in the En-
vironmental Protection Agency's list of industries considered for
-71-

numeric limitations. Second, jewelry manufacturing involves
the concentrated discharge of contaminants considered "pro
hibitive" under the Agency's second set of regulations.
It has been estimated by the Environmental Protection
Agency that enforcement of these standards could prevent ap
proximately 40 million pounds per year of toxic pollutants in
volved in jewelry manufacturing from entering the nation's
waters or concentrating in the sludge from municipal treatment
systems.9 However, it is also noted that this environmental
improvement cannot be attained without significant economic
impact. "Economic analysis by the Agency indicates that many
firms whose primary business is metal finishing or printed board
manufacturing are vulnerable to adverse economic impact. 1110
Though the activities covered by the federal regulations
are found throughout the United States, they are of particular
importance to the concentration of jewelry firms in Rhode Island.
Chapter Six examines the potential magnitude of the problem and
its impact on the jewelry economy and therefore the state economy.
-72-

FO OTNOTES-CHAPTER V
1The Federal Water Pollution Control Act Amendments of 1972, P . L . 92-500 , 33 . U.S . C. Section 307 (b) .
2u . s . Environmental Protection Agency, Federal Guidelines: State and Local Pretreatment Pro rams,
Washington , D.C.; Office of Water Program Operations) January, 1977, Volume 1, pp. E1 - E51.
3op. Cit . P . L. 92-500, Section 301 (b) .
4Rhode Island Statewide Planning Program, "Potential Management Approaches," Areawide Water Quality Management Plan, (Providence : ) May, 1978 , p . 34 .
5Rhode Island Statewide Planning Program, "Control of Industrial Wastes Discharged to Publicly Owned Treatment Facilities," Areawide Water Quality Management Plan . (Providence) November, 1977, p . 1 .
6op . Cit . U. S . Environmental Protection Agency, p . E2 .
?Ibid. , p . E3.
8u . S . Environmental Protection Agency, "Pretreatment Standards for Existing and New Sources of Pollution , " Federal Register, (Washington, D. C. ), February , 1977, pp . 6477-6478 .
9u . S . Environmental Protection Agency, "Electroplating Point Sources Category - Propo s ed Pretreatment Standards for Existing Sources," Federal Re gister, (Washington, D. C. ) , Tuesday, February 14, 1978, p . 656 .
lOibid . , p . 656 .
-73-

CHAPTER SIX:
ECONOMIC IMPACT OF WATER REGULATIONS ON THE JEWELRY INDUSTRY
Industrial pretreatment, mandated by federal legislation and
supported by state planning, will directly affect 1,659 jewelry
firms in Rhode Island. 1 These businesses are required by
July 1, 1983 to install the Best Available Technology (BAT) to
eliminate the discharge of harmful pollutants into the nation's
waters. 2 In all cases, the required application of abatement
techniques will result in higher operating costs, loss of sales,
and a reduction in employment. Many firms unable to meet the sub
stantial capital investments and financial committments will be
forced to close.
Chapter Six analyzes the potential economic impacts of
the water pollution control legislation on the Rhode Island
jewelry industry. It begins with an examination of first round
consequences measured by the cost of abatement technology, loss
of employment, and plant closures . . The discussion then brings
together the industry's economics with the pretreatment stan
dards to uncover second and third round losses to Rhode Island's
economic base.
COSTS, EMPLOYMENT, CLOSURES3
The Best Available Technology (BAT) for pretreatment of
-74-

jewelry manufacturing waste products is defined by the En-
vironmental Protection Agency as:
- Reduction of hexavalent chromium to the trivalent form.
- Destruction (oxidation) of cyanide.
- Precepitation and clarification of metals. 4
This technology is to be applied to all firms discharging
to a Publicly Owned Treatment Works performing one or more of
the processes re gulated under the Environmental Protection
Agency's two sets of pretreatment standards (See Chapter Five).
According to Rhode Island's 208 Management Plan, there are
4017 industrial firms located in 28 municipalities "that will
have publicly owned sewers in the next five years that may dis
charge incompatible toxic, hazardous, and other harmful wastes."5
Over 41 percent, or 1,659 of these businesses are directly re-
lated to jewelry manufacturing. To calculate the potential
capital investments needed by these firms to meet the BAT re-
quirements, the Environmental Protection Agency suveyed 2221 of
the nation's metal finishing job shops and captive operations
against the following scenario:
The treatment technology for pretreatment consists of the destruction of cyanide amenable to chlorination by single stage alkaline chlorination and the reduction to hexavalent chromium to the trivalent state for plants whose total daily metal finishing process flow is less than 10,000 gallons per day. The technology for plants with higher daily flows consists of the oxidation of cyanide in two stage alkaline chlorination, reduction of hexavalent chromium to the trivalent form, and precipitation and clarification of metals. All plants, regardless of flow, were required to remove lead and cadmium if they were present."6
-75-

The findings of the Agency's analysis for Rhode Island
electroplating activities are shown in Table XVI.7 Recog
nizing that the application of the BAT requirements will vary
depending upon the individual production processes of each firm,
the "Mean Capital Investment" projections have been disaggre
gated according to business employment. Based on 1977 dollars,
firms employing under 50 people will require an average financial
committment of $76,929, while larger enterprises will be forced
to invest almost double this amount.
TABLE XVI: PROJECTED MEAN CAPITAL INVESTMENT OF BAT REQUIREMENTS FOR THE RHODE ISLAND JEWELRY INDUSTRY
EMPLOYMENT NUMBER OF MEAN CAPITAL INVESTMENT SIZE OF FIRM RI CASES (1977 Dollars)
1- 49 1,287 $76,929 50- 99 182 $149, 295
100-249 142 $146,153
SOURCE: U. S. Environmental Protection Agency, Office of Planning and Evaluation, Economic Analysis of Proposed Pretreatment Standards for Existing Sources of the Electroplating Point Source Category, p. 88.
These projected costs will be felt throughout the jewelry
industry regardless of firm size. According to Table XVII, the
Environmental Protection Agency estimates that due to these in-
vestments, one-quarter of Rhode Island's metal finishing operations
will be forced to close. This analysis is based on the following
model:
Full BAT for everyone.
-76-

A five year repayment at 10 percent cost of capital.
A rise in prices by each firm by exactly that amount corresponding to the incremental annualized cost of the investment.
A forced closure if equity infusion fails a 1.5 coverage ratio criterion.8
Translated into sales and employment, the Agency expects
these closures to result in a 26 percent loss of sales and a
29 percent reduction in employment. 9 By themselves, however,
these figures tell only a partial story. They illustrate the
first round impacts on Rhode Island's jewelry industry which may
result from the federal pretreatment standards. Of equal impor-
tance to this study are the subsequent second round consequences
which relate to the State's Competitive Advantage for jewelry
manufacturing.
TABLE XVII: PROJECTED BUSINESS CLOSURES
EMPLOYMENT SIZE OF FIRM
0- 49
50- 99
100-249
NUMBER OF RI CASES
1,287
182
142
PROJECTED CLOSURES
360
50
38
SOURCE: U. S. Environmental Protection Agency, Office of Planning and Evaluation, Economic Analysis of Proposed Pretreatment Standards for Existin Sources of the Electro latin Point Source Category, p. 11 .
-77-

COMPETITIVE ADVANTAGE
Rhode Island's development into the nation's center for
the production of Body and Costume Jewelry, discussed in
Chapter Two, is based on the growth of agglomeration economies.
Such economies manifest themselves in horizontal and vertical
linkages between firms and activities producing similiar and
related goods and services. Jewelry manufacturing is tradition
ally comprised of small and medium sized firms. Historically,
these shops have required little capital investment to initiate
production. Larger firms depend on these small subcontractors
to provide specialized inputs into their production process.
This relationship, and thus Rhode Island's Competitive Advantage,
is being threatened by the federal legislation's BAT requirements.
The supply of inexpensive labor is cited as the single most
important advantage Rhode Island offers as a location to the
firms surveyed in Chapter Two. Historically, this resource has
been provided by new immigrants arriving to this country, and
more recently by the secondary labor market.
The cost of water pollution control technology does not
directly impact the cost of labor and initially would appear not
to affect this major location advantage. It should be noted that
inexpensive labor by itself does not provide Rhode Island with
a unique resource. The New England economy discovered this
during the middle of the 20th century when the textile industry
left for new opportunities and equally cheap labor. In addition,
the jewelry industry today faces stiff competition from foreign
-78-

suppliers whose labor costs continue to run below United
States' figures. Inexpensive labor's importance, however, to
Rhode Island jewelry lies in what it says about the State's
Competitive Advantage. Small and medium sized firms employing
under 50 people exhibit the greatest dependency on outside ac
tivities which aid in reducing production costs. Rhode Island
presently offers the opportunity for small shops to enter the
market with a minimum initial capital investment and operating
expense. Highly skilled and highly paid labor is the weakest
local advantage perceived by these smaller firms primarily due
to its expensive nature. A mean capital investment of $76,929
for BAT requirements will effectively eradicate the opportunity
for small electroplaters and metal finishers to enter the market.
The production costs of existing firms will no longer be mini
mized. Any savings which might accrue from the supply of cheap
labor and other agglomeration economies will be more than offset
by the high costs of technology. Larger firms employing over
50 people will also feel the crunch of these costs.
Unlike the smaller enterprises, the bigger shops' greatest
locational advantage stems not only from inexpensive labor, but
also from the proximity to related jewelry firms and activities.
Jewelry production involves a number of specific tasks leading
to the manufacture of the finished good. The Rhode Island in
dustry is supported by a large network of firms which specialize
in one or more of these inputs into the production process. Well
-79-

over one-half of the 1,500 firms listed nationally in the Manu
facturing Jewelers and Silversmiths of America's 1977-1978 Buyer's
Guide specialize in such specific tasks as assembling, casting,
electroplating, polishing, soldering, findings manufacturing,
enameling, and engraving. Subcontracting out several of these
tasks is a prevalent practice. These vertical linkages between
firms producing similiar and related goods is perhaps the most
distinguishing feature of the jewelry industry. Their existence
is cited by the surveyed rims as the second most important ad
vantage Rhode Island offers as a location. Yet according to the
Environmental Protection Agency over one-quarter of these firms
will be forced to close by the 1983 deadline thus severely damag-
ing Rhode Island's second most vital locational advantage.
This analysis has recognized throughout that Competitive
Advantage is not based on any single element. To quote Chapter
One:
"The major factors of location ... do not operate in isolation. The value of a particular site to any firm may depend upon the quality and accessibility of existing transportation facilities, which in turn are a factor of the forces of agglomeration economies, which may be the result to the resource endowment, which has been influenced by changes in technology and taste. In addition, it is rare that industrial location is determined by any single element. Just as these forces are highly interrelated, their influence in determining spatial organization is cumulative. That is to say, it is all of these factors working together, though with varying degrees of importance for different firms, that mold the spatial distribution of activities."
This examination of the impacts on Rhode Island's Com-
petitive Advantage for jewelry production resulting from BAT
-80-

requirements does not deal directly with each locational ad-
vantage discussed in Chapter One. However, neither do the
Environmental Protection Agency's projections go beyond the
immediate impacts resulting from cost factors. Competitive
Advantage is cumulative and all regions offer specific combina-
tions from which they compete for development. The costs of
BAT will significantly affect Rhode Island's two greatest bene
fits for the jewelry industry:
1) Low capital investment required to initiate production.
2) The existence of related and supporting activities.
This in turn will exert an as yet unquantifiable impact on
the supply of highly skilled labor, a good transportation sys-
tern, and proximity to materials. The cumulative impact goes
far beyond the Agency's 28 percent closure predictions, be-
yond the erosion of an industry's development, to affect the
entire Rhode Island economy.
IMPACT ON THE STATE ECONOMY
The concentration of jewelry firms in a few select geo-
graphic locations clearly indicate its nature as an exporting
industry. According to the Location Quotient Analysis in Chap
ter Three, 98 percent of jewelry production is export activity.
Exports are considered a key to an area's economic vitality
based on the degree to which they meet the following criteria:
(1) Is characterized by extensive forward and backward linkages with the regional economy.
-81-

2)
J)
Manufactures a product of growing national demand.
Has a high regional multiplier. (See Chapter Three).
Jewelry's high rating in these important areas suggests
that a serious decline in its productivity will go beyond the
first round losses of employment and wages, and will also im
pact internal development both related and unrelated to the
industry.
Local activities directly related to jewelry manufacturing
are manifest in the industry's linkages with a variety of re
lated enterprises. The 1977-1978 Buyer's Guide lists 216
Rhode Island firms which are not included in the Environmental
Protection Agency's analysis, but which comprise an integral part
of the industry's production process. These businesses comprise
10 percent of Rhode Island's durable goods manufacturing base
which will experience a loss of jewelry suppliers and markets. 10
Developments unrelated to the jewelry industry's produc
tion process are not as readily apparent as the direct impacts
discussed above, but are more critical to Rhode Island's growth
and development. It is these unrelated activities which are most
affected by jewe l ry's position as an industry of growing national
demand wi t h a high regional multiplier. Unfortunately, it is
these third round considerations which the Environmental Protec-
tion Agency ignores.
In the 40 years since 1939, jewelry manufacturing has ex
hibited strong and steady growth in employment, value added by
manufacture, and value of industry shipments (See Chapter Three).
-82-

Any industry with expansion potential is more valuable to the
future economic growth of a region than an activity which through
changes in demand, production techniques, or other factors is ex
periencing a sustained decline. In Rhode Island, however, the
importance of the jewelry industry's development goes beyond
this rather obvious conclusion.
Historically, Rhode Island's economy has been closely asso
ciated with labor intensive industries which have provided abun
dant employment opportunities for new immigrants. Jobs which
demand little skill and training have been plentiful in the State.
Foremost among these were textile and related occupations.
The origin of the American textile industry can be traced
to a small cotton spinning mill built in 1790 at Pawtucket
Falls. 11 In the ensuing 150 years, this industry was to boom
to become the mainstay of Rhode Island's manufacturing economy
with 45 percent of all manufacturing employment in textile pro
ducts as late as 1947. 12 However, beginning in the period fol
lowing World War II, an exodus of the State's textile industry
industry began which by 1970 had taken over 50,000 jobs. 13 This
mass industrial migration is a well known story throughout New
England. Many of the scars remain in the blighted urban mill
centers which dot the countryside. Yet, it was during this same
period that the local jewelry industry experienced its greatest
growth. An examination of Table XVIII illustrates that as the
textile industry declined from 42 percent of the State's manu
facturing employment in 1950 to less than 10 percent in 1977,
-83-

the jewelry industry rose from 13.4 percent to over 25 percent
of Rhode Island's manufacturing employment during that same
period.
TABLE XVIII: COMPARATIVE GROWTH AND DECLINE OF RHODE ISLAND JEWELRY AND TEXTILE INDUSTRIES
TEXTILE EIVIP. AS A % OF RI'S MANUFACTURING EIVIP.
JEWELRY EIVIP. AS A % OF RI'S MANUFACTURING ElVIP.
42%
1J,4%
23% 12.6%
17% 17. 8%
SOURCE: Rhode Island Department of Economic Development, Basic Economic Statistics - The Economy, Summary, and Trends, 1971-2, 1973-5, 1977-8.
Many vacated structures abandoned by textiles were occupied
by jewelry firms which took advantage of both the low rents and
the abundant supply of unskilled and semi-skilled workers left
behind. Today, Rhode Island's economy remains structurally very
similiar to the pre-World War II period. Manufacturing is pre
dominant, employing well over one-third of the labor force. 14
However, unlike JO years ago, there is no industry waiting in
the wings to provide employment opportunities to the many low
and semi-skilled, manually dextrous workers. Large numbers of
the Environmental Protection Agency's first round job loss pre-
dictions will be unable to quickly and easily find new employment.
-84-
The structural unemployment will impact other unrelated activi
ties in the State .
According to the Export-Base Theory of Economic Growth,
spendable income derived from export activities provides new
money into a region which stimulate demand in local markets for
a variety of unrelated goods and services (See Chapter Three).
The Environmental Protection Agency has projected a 29 percent
reduction in jewelry employment as a result of the BAT require
ments . This translates into a direct loss of 75 million dollars
in wages which are presently available for local housing, food ,
clothing, and other items . However, this 75 million dollars also
represents income to local businesses which in turn is spent on
similiar goods and services . Based on the analysis of jewelry's
regional multiplier in Chapter Three, for every dollar of direct
export income last to the State, there will occur a cumulative
reduction of $1.25 of new money spent in the local economy from
external sources . This computes into a total loss of 100 million
dollars which no longer will be circulated in the State's econo
my . For many unrelated activities this loss of business will
result in similiar first, second, and third round consequences
which this chapter has analyzed for j ewelry production.
In November, 1977, the Rhode Island jewelry industry em
ployed 34,690 workers with a yearly payroll exceeding 258 million
dollars . 15 The second largest manufacturing employer in the State
-85-

for this year was textiles, which employed less than 12,500. 16
No other employer in Rhode Island, with the exception of sales
and clerical, approaches jewelry's figures. Based on the En
vironmental Protection Agency's analysis discussed in this
chapter, the Federal water pollution control BAT requirements
will result in a first round loss of 10,060 jobs and approxi
mately 75 million dollars in wages. Second round impacts are
apparent in the erosion of the State's Competitive Advantage
for jewelry manufacturing. Rhode Island will no longer offer
firms the special combination of resources which historically
have led to the State's growth into the Body and Costume Jewelry
Capital of the world. By any standards, these two potential
developments present serious implications regarding the local
economy. However, it is the third round consequences, linkages
with local internal developments, which are of greatest concern
to Rhode Island's future economic growth. The next and final
chapter in this study presents a series of recommendations
which can help the State to meet the goals of the Federal Water
Pollution Control Act Amendments of 1972 and maintain the jewelry
industry as a viable and productive component of the economy.
-86-

FOOTNOTES-CHAPTER SIX
1Rhode Island Statewide Planning Program, Technical Memorandum : Control of Industrial Water Discharged to Publicly Owned Treatment Works. (Providence: November, 1977), p. 10.
2The Federal Water Pollution Control Act Amendments of 1972, P.L. 92-500, 33 U.S.C. Section 101 (a)(l).
3In developing these projections, the Environmental Protection Agency recognizes that the specific technology will vary based on the different production characteristics of each firm. The projections therefore contain limitations inherent in averaging and consistent with the assumptions.
4u.s. Environmental Protection Agency, Economic Anal sis of Pro osed Pretreatment Standards for Existin Sources of Electroplating Point Source Category, Washington, D.C.: 1977), p. 72.
5Rhode Island Statewide Planning, op.cit., p. 14.
6u.s . Environmental Protection Agency, op.cit., p. 73,
7These figures are computed based on the Environmental Protection Agency's analysis of firms throughout the country. Percentages and costs are then applied to the Rhode Island experience.
8u.s. Environmental Protection Agency, op.cit., p. 99.
9Ibid. I p. 114.
10Rhode Island Department of Economic Development, Rhode Island Basic Economic Statistics - The Econom , Summar , and Trends, Providence: 1977-1978 , p. 10 .
11Rhode Island Development Council, Rhode Island Basic Economic Statistics, (Providence: 1970), p. 86.
12Ibid. I p. 88.
l3Rhode Island Department of Economic Development , QJ2· cit., p. 104.
14Ibid. I PP· 104-106.
-87-

15Ibid., p. 67 ·
16Ibid., p. 67.
-88-

CHAPTER SEVEN:
CONCLUSION AND RECOMMENDATIONS
The motivation for this study is the perceived need to find
a common course of action between the two opposing forces of
economic growth and environmental protection . The focus is on
ways in which programs can be developed which facilitate com
pliance with the Federal Water Pollution Control Act Amendments
of 1972 while encouraging the economic viability of the Rhode
Island j ewelry industry . Chapter Seven presents specific pro
posals which both private and public agencies can adopt to eli
minate the polluting effluents as required by the Federal
legislation while maintaining and assisting the jewelry indus
try's contribution to Rhode Island ' s economic growth and develop
ment . The recommendations involve three major areas:
Appreciation of the Problem
Organizational Development
Financial Assistance
APPRECIATION OF THE PROBLEM
The large majority of current economic development acti
vities at both the state and local levels involves one of two
alternatives :
1) Suburban industrial park development .
-89-

2) Downtown commercial revitalization .
Industrial land in such communities as North Kingstown,
Warwick, Cranston and Lincoln is being assembled and promoted
with the g oal of attracting new, high paying, nonpolluting
business . These high prestige industries are seen as the
answer to local tax difficulties and state employment concerns .
Downtown re j uvenation projects currently ongoing in the
State's urbanized centers are designed to maintain the health
and viability of these principal activity centers .
In contrast to these two efforts , the jewelry industry
employs a predominance of low-skilled laborers at low pay and
is located in areas removed from the public eye . However, it
was demonstrated in Chapter Six that jewelry is an integral
and vital component of Rhode Island ' s economic base . This first
recommendation emphasizes the need for a redirection of public
economic development programs which recognize the difficulties
facing the State ' s jewelry industry and its importance to the
local economy . A major first step in this direction should be
a study which :
1) Identifies where the jewelry/metal finishing firms are specifically located in the State .
2) Identifies the types of processes used at each location .
J) Identifies which firms discharge directly to surface waters and which discharge into waste treatment systems .
4) Identifies priority pollutants and flow rates for each firm .
5) Identifies which firms already have appropriate treat-
-90-

ment technology.
6) Determines which subpart of EPA regulations are applicable to each firm.
7) Determines whether state or local requirements will be more stringent than federal requirements.
8 ) Determines what treatment technology is available, its space and cost requirements for each firm.
9) Identifies the public sectors' role and ability in helping solve the jewelry industry's environmental and economic problems.
ORGANIZATIONAL DEVELOPMENT
The Rhode Island jewe lry industry is characterized by a
large number of small, fiercely independent shops scattered
throughout the State's urbanized centers. By themselves, these
businesses will be unable to meet the capital investments re-
quired by the Federal legislation. However, by joining together
to share treatment technology expenses, these firms may be able
to meet the new costs. This proposal would require a reorgani-
zation of the industry's development patterns. It would not
eliminate the important role of small subcontractors in the
industry's infrastructure.
Rhode Island's urbanized centers contain millions of square
feet of industrial space, almost all of which is housed in two
three story delapidated mill buildings. A large percentage of
this space currently is vacant or is used for storage and
other nonproductive activities. In the past five years Provi-
dence, Pawtucket and Central Falls have turned to Section 8
Housing in order t o return these structures to more productive
-91-

use. Another alternate use of these buildings would be the
development of industrial condominiums. These complexes would
house several independent jewelry firms under one roof, all con
tributing to a shared pollution control facility. In addition
to meeting federal leg islative requirements, this approach
would assist local community development efforts, provide jewelry
with a needed opportunity to continue productive operation, and
add to the state's economic streng th.
FINANCIAL ASSISTANCE
In 1978, Congressman Harley Staggers introduced bill HR13178
entitled "Environmental Technical Assistance Act of 1978", to
establish an Office of Small Community and Small Business Concerns
within the Environmental Protection Ag ency. This office would
provide information and technical assistance on the requirements
of environmental laws, the least costly methods of complying with
legal requirements, and available sources of Federal aid to assist
in compliance with environmental requirements. To date no approval
is expected on the proposal. This study recommends passage of
this or an alternate bill in the near future. Public and private
cooperation is essential if both environmental protection and econo
mic development are to be achieved . Other existing federal assis
tance which can be used to implement the recommendations in this
report include:
Urban Development Action Grant
All cities in Rhode Island where jewelry manufacturing is
concentrated - Central Falls, Cranston, Pawtucket, Providence
-92-

and Woonsocket - are eligible for UDAG's. This HUD economic
development initiative provides federal money to help leverage
private investment in communities meeting specific distress
criteria. This program would be ideal to help develop an in
dustrial condominium for jewelry concerns.
Small Business Administration Loans
Section 8 of the Federal Water Pollution Control Act
Amendments of 1972 authorizes the Small Business Administration
to assist small business concerns to add to or alter their
equipment, facilities or methods of operation in order to meet
the water pollution control requirements established under the
Federal act. The loans are to provide relief to eligible small
businesses which might otherwise incur substantial economic in
jury without some financial assistance.
EPA Industrial Participation Grants
Under Section 105 of the Federal Water Pollution Control
Act Amendments of 1972, industry may participate in various
grant programs for the construction of permanent wastewater
treatment facilities on industry property to develop and demon
strate new or improved methods of treating industrial wastewaters
or otherwise preventing pollution.
Economic Development Administration Loans
The Economic Development Administration is charged with
-93-

the responsibility of stimulating the industrial growth and
economic development of economically depressed areas of the Country .
EDA business development loans are available to firms in an
attempt to upgrade an area throug h the creation of new jobs
for local residents .
Combined with industrial revenue bonds and tax incentives,
these federal assistance programs provide a required link in
balancing economic development with environmental protection.
What is needed is a full effort supported by both private and
public concerns , working together in the 1980's , to bring
these two important, though often opposing forces , into a pro
ductive balance .
-94-

WORKS CITED
BOOKS
Conkling, Edgar C., and Yeates, Maurice . Man 's Economic Environment. New York: McGraw-Hill Book Company, 1976.
Doeringer, Peter B., and Fiore, Michael J. Internal Labor Markets and Manpower Analysis. Massachusetts: D.C. Heath & Company, 1971.
Frankovich, George R. The Jewelry Industry. Providence: Manufacturing Jewelers and Silversmiths of America, 1976.
Gilmour, James M. "External Economic of Scale, Industrial Linkages and Decision - Making in Manufacturing ," in edited by F. E. Ian Hamilton, Spatial Perspectives on Industrial Or anization and Decision - Makin . London: John Wiley & Sons, 197 , pp. 335-3 3.
Hamilton, F. E. Ian, editor. Spatial Perspectives on Industrial Organization and Decision - Making . London: John Wiley & Sons, 1974.
Hoover , Edgar M. Location of Economic Activity. New York: McGraw- Hill Book Company, 1948.
Isard, Walter . Location and Space Economy. New York: John Wiley & Sons, 1956.
Johnson, Douglas. "Rhode Island Jewelry Industry - Perspectives on Development and Reform." Mimeograph , 1976.
Kreps, Juanita M., Sumers, Gerland G., and Perlman, Richard. Contemporary Labor Economics: Issues, Analysis, and Policies. California: Wadsworth Publishing Company, 1974.
Krueckeberg, Donald A., and Silvers, Arthur L . Urban Planning Analysis: Methods and Models . New York: John Wiley & Sons, 1974.
Levitan, Sar. A., Mangum , Garth L., and Marshall , Ray. Human Resources and Labor Markets. New York: Harper & Row Publishers, 1976.
~6sch, August . Economics of Location . Translated by William H. Waglam and Wolfgang Stolper. New Haven: Yale University Press, 1954.
-95-

Manufacturing Jewelers and Silversmiths of America. The 1977-1978 Buyers' Guide . Providence: 1978.
Perloff, Harvey, and Wingo, Lowdon , Jr. "National Resource Endowment and Economic Growth" in edited by John Friedman and William Alonso. Regional Policy - Readings in Theory and Applications. Massachusetts : The MIT Press, 1975, pp. J07-JJ1.
Smith, Robert H. T., Taafe, Edward J., and King, Leslie J. ed. Readings in Economic Geography - The Location of Economic Activity. Chicago: Rand McNally & Company, 1968.
Soderman, Sten. Industrial Location Planning. New York: John Wiley & Sons, 1975.
Tiebout, Charles M. The Community Economic Base Study. New York: Committee for Economic Development, 1962.
Weber , Alfred. Theory of the Location of Industries. Translated by Carl J. Friedrick. Chicago: University of Chicago Press, 1929.
Weiss, Carol H. and Hatry, Harry P. An Introduction to Sample Surveys for Government Managers. Washington, D. C.: The Urban Institute, 1971.
Williams , Glyn C. Labor Economics. New York: John Wiley & Sons, 1970.
GOVERNMENT PUBLICATIONS
Areawide Water Quality Plan. Inventory of Existing Federal, State, and Local Legislation Dealing with Waste Treatment Management . Providence: Rhode Island Statewide Planning Program, 1977,
Areawide Water Quality Plan. bilities. Providence: ning Program, 1978.
Inventory of Financial CapaRhode Island Statewide Plan-
Areawide Water Quality Plan. Potential Management Approaches. Providence: Rhode Island Statewide Planning Program, 1978.
Areawide Water Quality Plan. Preliminary Evaluation of Publicly Owned Wastewater Treatment and Collection Systems. Providence: Rhode Island Statewide Planning Program, 1978.
-96-
Areawide Water Quality Plan . Technical Memorandum : Control of Industrial Wastes Discharged to Publicly Owned Treatment Works. Providence: Rhode Island Statewide Planning Program, 1977.
Bureau of the Census . 1972 Census of Manufacturers . Washington, D.C.: United States Department of Commerce, 1972.
Bureau of the Census . 1963 Census of Manufacturers. Washington, D. C. : United States Department of Commerce, 1963 .
Bureau of the Census . 1947 Census of Manufacturers . Washington, D. C. : United States Department of Commerce , 1947.
Bureau of the Census . Washington, D. C. : rnerce, 1921.
Biennial Census of Manufacturers . United States Department of Corn-
Federal Reserve Bank of Boston . "New England Economic Indicators . " Boston: Federal Reserve Bank, 1972 .
Office of Water Program Operations . Industrial Cost Recovery Systems . Washington, D. C. : Environmental Protection Agency , 1976 .
Office of Water Program Operations . Federal Guidelines: State and Local Pretreatment Programs . Volumes I, II, III . Washington, D. C.: Environmental Protection Agency, 1977 .
Office of Planning and Evaluation . Economic Analysis of Proposed Pretreatment Standards for Existing Sources of the Electroplating Point Source Category. Washing t on, D.C.: Environmental Protection Agency, 1977 .
Rhode Island Department of Economic Development. Rhode Isla nd Basic Economic Statistics - The Economy, Summary, and Trends, 1977-1978 . Providence, 1977 .
Rhode Island Department of Economic Development. Rhode Island Basic Economic Statistics - The Economy , Summary, and Trends, 1974-1975 . Providence , 1976.
Rhode Island Development Council. Rhode Island Basic Economic Statistics - The Economy , Summary, and Trends, ~· Providence, 1972.
Rhode Island Development Council . Rhode I sland Basic Eco-
-97-

nomic Statistics - The Economy, Summary , and Trends , 1970 . Providence, 1970 .
Rhode Island Department of Employment Security . "Employment Covered by the Employment Security Act - 1976 . " Providence : 1976.
U. S . Congress, Senate, "An Act to Amend the Federal Water Pollution Control Act." Public Law 92-500 . 2d Session, 1972, s . 2770 .
U. S . Environmental Protection Agency . "Electroplating Point Source Category - Proposed Pretreatment Standards for Existing Sources . " Federal Register . Washington, D.C . : February 14, 1978 .
U. S . Environmental Protection Agency . "Hazardous Waste -Proposed Guidelines and Regulations and Proposal on Identification and List i ng ." Federal Register . Washington , D. C. : December 18, 1978 .
U. S . Environmental Protection Agency . "Effluent Guidelines and Standards ; Electroplating Point Source Category." Federal Register . Washington , D. C. : September 7 , 1979.
U. S . Environmental Protection Agency . "National Pollutant Discharge Elimination System . " Federal Register . Washington, D.C .: June 15 , 1979.
-98-

APPENDIX A

QUESTIONNAIRE
The following brief questionnaire is part of a research paper dealing with the importance of the Jewelry Industry in the State of Rhode Island. Under no conditions will individual returns be published. Your cooperation in completing this form is greatly appreciated.
1) In what year was your firm established?
2) What is the current number of paid employees?
J) What is the approximate number and/or percentage of employees in the following categories?
Management & Administration Clerical Service
Sales Craft & Kindred
Operative Laborers
4) Rank the following materials (1,2,J) used in your production process in order of their importance and indicate where they are purchased; A) Within Rhode Island B) Within New England C) Within the U.S. D) Outside the U.S.
Gold Lead
Copper Tin
Brass Platinum
Other (Please Specify)
Rank
5) In what market areas do you sell your product?
Local New England
Eastern U.S. United States
Internationally
Where Purchased
6) Rank the following factors (1,2,J) in terms of their importance to your firm's operation and success in Rhode Island.
Supply of Inexpensive Labor Supply of Highly Skilled Labor
Proximity of Markets
-99-

Proximity to Materials Proximity of Related
Jewelry Firms and Activities Existence of Good
Transportation System Other (Please Specify)
7) Is it important or particularly advantageous for your firm to be located in or near Providence rather than in an outlying area of Rhode Island? YES ( ) NO ( ) WHY?
~~~~~~~~~~~~~~~~~~~~~~~~~~~~~~
-100-